fortune always favors the prepared mind - danamon...fortune always favors the prepared mind (louis...
TRANSCRIPT

PT Bank Danamon Indonesia, Tbk. 2016 Annual Report92
Danamon’s Highlights
Management Reports
Company Profile
Fortune always favors the prepared mind (Louis Pasteur)
PT Bank Danamon Indonesia, Tbk. 2016 Annual Report 93
Operational Review
Management Discussion & Analysis
Corporate Governance
Corporate Social Responsibility
Corporate Data
Financial Report
Management Discussion & Analysis
Sub Contents94 2016 Economic and Banking Industry Review 97 Business Segment Review98 Wholesale Banking and Financial Institution
100 Treasury and Capital Market102 Transaction Banking
(Cash Management, Trade Finance & Financial Supply Chain)
104 Small Medium Enterprise Banking (SME)106 Consumer Banking110 Marketing Strategy and Market Share112 Syariah Banking114 Micro Banking116 Subsidiary Business Review116 Adira Finance119 Adira Insurance122 Adira Kredit124 Financial Review124 Comprehensive Income124 Profit/Loss126 Income127 Expenses130 Dupont Analysis130 Balance Sheet130 Assets131 Current Assets137 Liabilities 139 Cash Flows139 Financial Ratios139 Long Term Loan Payment Ability Solvency &
Collectibles 141 Capitalization 145 Material Ties For Investment of
Capital Goods 145 Impact of Interest Rate Changes, Foreign
Currency Rate Changes & Regulators Change against Danamon Performance
146 Information On Rising or Declinning of Sales/Net Income
146 Target Achievement 2016147 Information and Important Matters
Subsequent to the Date of Accountant’s Report
147 Significant Events After the Date of the Financial Statements
147 Dividend Policy and Use of Net Income148 Appropriation of Net Income148 Employee Share Ownership Program (ESOP/
MSOP)148 Information On the Result of the Use of
Public Offering149 Material Information Regarding Investment,
Expansion, Divestment, Merger/of Business, Acquisition or Debt/Capital Restructuring
149 Information on Material Transactions That Conflict of Interest And/or Related Party Transactions
151 Changes that the Regulations/Legislations With Significantly Affect Company
154 Changes in Tax Regulations 2016
155 Ratified Accounting Standards that has yet to be made Effective
155 Description of The Basel III
PT Bank Danamon Indonesia, Tbk. 2016 Annual Report94
Danamon’s Highlights
Management Reports
Company Profile
2016 Economic and Banking Industry Review
The Indonesian economy grew by 5.0% in 2016, a slight rebound from what appears to be the bottom in 2015. With the global environment set to pick up and international commodity prices on the rise, it is expected that the Indonesian economy will continue to grow above 5.0% level in 2017. Risks remain in that global or domestic economic performance might fall outside the range of expectations.
The subdued growth of the Indonesian economy in the last few years is largely a reflection of weak demand for primary commodities stemming from the weak global economy. While the global economy did not significantly worsen in 2016, it still faced considerable challenges. Growth softened in the G3 economies (US, EU, and Japan), while China underwent a rebalancing towards domestic and service sector consumption, as the desired engine of growth. Only India and Philippines managed to post solid GDP growth in 2016.
On the external front, Indonesia’s 2016 trade surplus amounted to USD 8.8bn, which surpassed the 2015 result of USD 7.7bn. To shed light regarding the trade connection between Indonesia and US, the US is Indonesia’s 2nd largest export destination with market share reaching 10.8% of total exports, and ranked 7 for imports by country of origin with 5.3% market share. The US is also the only partner that recorded a significant widening surplus since 2012. This trend may continue in 2017. Exports of manufactured apparels and furniture to the US may benefit amid the revival of consumer purchasing power.
There was a sharp uptick in global financial volatility in the 4th quarter of 2016, brought about by uncertainty surrounding the US election and rising apprehension over the magnitude of US Fed interest rate “normalization” policies. Market players responded within days by reallocating funds towards a more defensive stance. This uncertainty impacted emerging markets, especially commodity exporting countries such as Indonesia through pressure from capital outflows and significant depreciation of their currencies.
Nevertheless, throughout 2016, Indonesia experienced significant net-purchasing by non-residents in the capital market, estimated at around USD 9.6 bn, while Jakarta Stock Market Index gained 15.3% during the year to 5,297 at end 2016. The Rupiah exchange rate against the USD apreciated by 2.6% from Rp13,795 at the beginning of 2016 to Rp13,436 at the end of 2016.
Banking IndustryThe impact of a shrinking trade volume on the domestic economy can be seen through less trading activities (export and import) that led to less demand for FCY loan. It also partially explains why there has been lack of credit demand in the banking sector, with LCY loans still growing at the modest pace of 9.2%. All of this changed at the fourth quarter when prices of primary commodities jumped, which pushed demand for FCY loan out of negative territory.
PT Bank Danamon Indonesia, Tbk. 2016 Annual Report 95
Operational Review
Management Discussion & Analysis
Corporate Governance
Corporate Social Responsibility
Corporate Data
Financial Report
As an effort to create momentum, the central bank opted to cut its policy rates by 150bps in hopes of untangling weak demand and propels banks’ ability to overturn NPL issues. Also worth mentioning is that starting from 19 August 2016, Bank Indonesia had shifted its benchmark rate from “BI rate” to “BI 7-day (Reverse) Repo Rate”. Aside from being transactional in nature (implying a direct effect to money market rates with a faster pace of transmission), the new benchmark instrument is also expected to influence the interbank market and reduce the cost of being illiquid.
Up until December 2016, overall banking loans grew 7.9% yoy to Rp 4,377 tn, slowing down from last year’s 10.4% growth. On the other hand, third party funds grew by 9.6% to Rp 4,837 tn, partly supported by the repatriated fund from the government’s Tax Amnesty program. Liquidity has somewhat loosened with Loan to Deposit ratio edging down to 90.5% compared to 92.0% in 2015, but cost to income ratio has risen by 73pps to 82.2%. Nevertheless, banks were able to improve net interest margin (“NIM”). In 2016, NIM reached 5.6% compared to 5.4% in 2015.
The NPL ratio at end 2016 was 2.9%, a 44 pps increase from the end of last year, which is mostly on productive loans. Based on bank classifications, BUKU 3 banks experienced the least accelerated NPLs. Meanwhile from a breakdown by segment, NPLs were coming from wholesale. From targeted industry perspective, the highest contributors to growing NPL were from mining and logistics.

PT Bank Danamon Indonesia, Tbk. 2016 Annual Report96
Danamon’s Highlights
Management Reports
Company Profile
PT Bank Danamon Indonesia, Tbk. 2016 Annual Report 97
Operational Review
Management Discussion & Analysis
Corporate Governance
Corporate Social Responsibility
Corporate Data
Financial Report
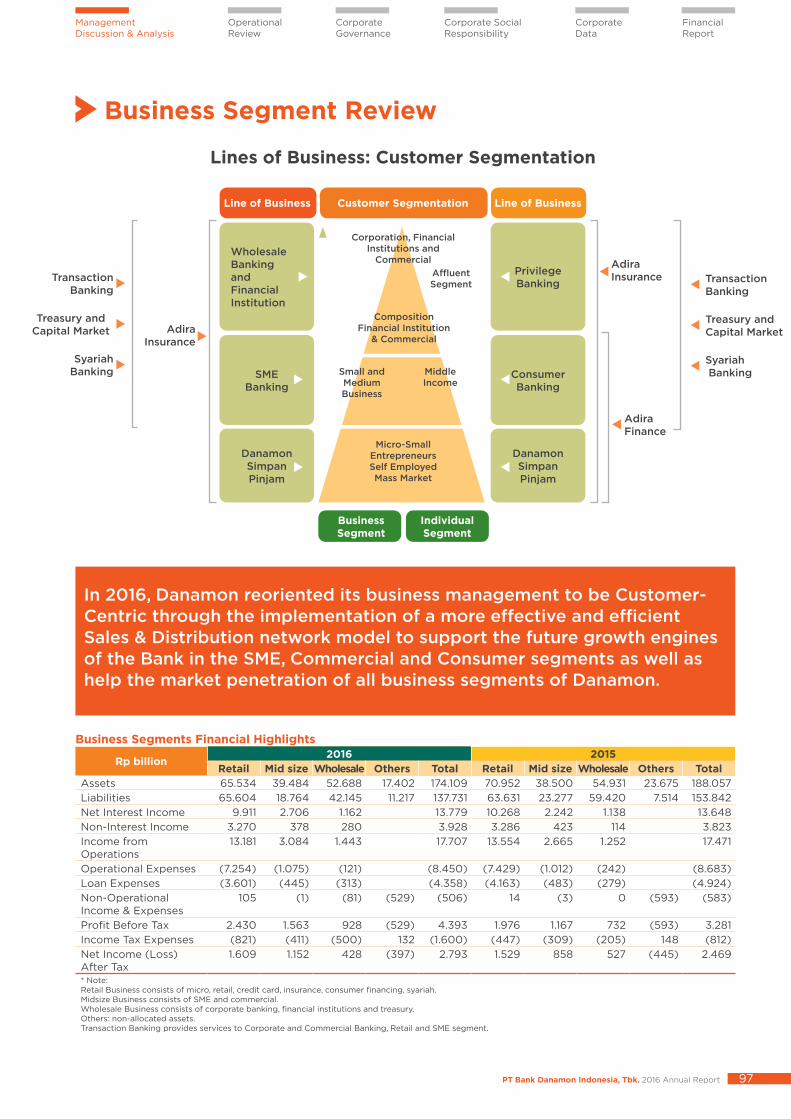
Business Segment Review
In 2016, Danamon reoriented its business management to be Customer-Centric through the implementation of a more effective and efficient Sales & Distribution network model to support the future growth engines of the Bank in the SME, Commercial and Consumer segments as well as help the market penetration of all business segments of Danamon.
Business Segments Financial Highlights
Rp billion2016 2015
Retail Mid size Wholesale Others Total Retail Mid size Wholesale Others TotalAssets 65.534 39.484 52.688 17.402 174.109 70.952 38.500 54.931 23.675 188.057 Liabilities 65.604 18.764 42.145 11.217 137.731 63.631 23.277 59.420 7.514 153.842 Net Interest Income 9.911 2.706 1.162 13.779 10.268 2.242 1.138 13.648 Non-Interest Income 3.270 378 280 3.928 3.286 423 114 3.823 Income from Operations
13.181 3.084 1.443 17.707 13.554 2.665 1.252 17.471
Operational Expenses (7.254) (1.075) (121) (8.450) (7.429) (1.012) (242) (8.683)Loan Expenses (3.601) (445) (313) (4.358) (4.163) (483) (279) (4.924)Non-Operational Income & Expenses
105 (1) (81) (529) (506) 14 (3) 0 (593) (583)
Profit Before Tax 2.430 1.563 928 (529) 4.393 1.976 1.167 732 (593) 3.281 Income Tax Expenses (821) (411) (500) 132 (1.600) (447) (309) (205) 148 (812)Net Income (Loss)After Tax
1.609 1.152 428 (397) 2.793 1.529 858 527 (445) 2.469
* Note:Retail Business consists of micro, retail, credit card, insurance, consumer financing, syariah. Midsize Business consists of SME and commercial.Wholesale Business consists of corporate banking, financial institutions and treasury. Others: non-allocated assets.Transaction Banking provides services to Corporate and Commercial Banking, Retail and SME segment.
Lines of Business: Customer Segmentation
Adira Insurance
Adira Finance
Line of BusinessLine of Business Customer Segmentation
PrivilegeBanking
ConsumerBanking
SMEBanking
DanamonSimpanPinjam
DanamonSimpanPinjam
Business Segment
Individual Segment
Corporation, Financial Institutions and
Commercial
Micro-Small EntrepreneursSelf Employed Mass Market
Composition Financial Institution
& Commercial
Small and Medium Business
Middle Income
Affluent Segment
Transaction Banking
Treasury andCapital Market
Syariah Banking
Transaction Banking
Treasury andCapital Market
Syariah Banking
AdiraInsurance
Wholesale Banking and Financial Institution
PT Bank Danamon Indonesia, Tbk. 2016 Annual Report98
Danamon’s Highlights
Management Reports
Company Profile
Wholesale Banking and Financial Institution
Danamon’s Wholesale Banking focuses on Corporate, Commercial and Financial Institutions (“FI”) segments, providing its customers with integrated and comprehensive financial solutions based on clients’ needs, from cash management, working capital requirement, investment loan, Trade Finance, Financial Supply Chain, FX and Treasury. These financial solutions are integrated with other products
and services offered through cross-selling with other business units or with Danamon subsidiaries. Offering these integrated financial solutions are the main reason for Danamon to be the transaction bank of choice for its Wholesale Banking customers.
In line with Danamon’s Bank Business Plan, Wholesale Banking has set the following strategies and major work programs:
- Focus on excellent loan quality. Members of the lending team are responsible for the proper initial selection of potential debtors, the determination of a suitable loan structure for debtor needs, and regular monitoring and review of debtors’ activities and business. This is balanced with efforts to grow customer deposits and especially to increase the granular CASA portion.
• Improve efficiency and productivity through various initiatives that include selection of industry focus, streamline process, realignment of support functions which aim to improve turn around time.
In 2016, Wholesale Banking focus their efforts to improve work efficiency and productivity, maintain loan portfolio quality and generate supply chain financing and cross sell opportunities with other business lines and Danamon subsidiaries.
PT Bank Danamon Indonesia, Tbk. 2016 Annual Report 99
Operational Review
Management Discussion & Analysis
Corporate Governance
Corporate Social Responsibility
Corporate Data
Financial Report
• Continue to focus on Supply Chain Financing and Cross Selling with the other business lines and Danamon subsidiaries.
• Consistently upskilling our human capital through comprehensive training program and the implementation of transparent performance and productivity measurement.
2016 Financial PerformanceWholesale Banking loan portfolio increased by 11% to Rp37.4 trillion supported by a strong growth in Trade Finance portfolio. In line with the Bank’s strategy to reduce expensive funding, Wholesale Banking third party fund declined by 5% year-on-year or amounting to Rp29.5 billion.
2017 Plans and StrategiesWholesale Banking will continue to focus on deepening relationships with our existing customers through cross-sell and continue with acquisition of new customers along with the industry focus targets, working together with our product partners. Wholesale Banking will also continue our organization alignment and transformation initiatives aiming to improve turn-around time, reduce inefficiency and improve productivity.
Wholesale Banking recognizes that attracting and retaining talents are one of the most important focus to sustain the business growth. Danamon will continue to develop the existing talent pools through trainings, special project assignments and promote people mobility within the Bank.
PT Bank Danamon Indonesia, Tbk. 2016 Annual Report100
Danamon’s Highlights
Management Reports
Company Profile
The Treasury and Capital Market (“TCM) business unit is tasked by ALCO with the management of the Bank’s liquidity risk. TCM is responsible to provide liquidity to meet business growth and prudential standards and to manage the interest rate risk on the Bank’s balance sheet.
TCM provides a variety of treasury products and services to individual and corporate customers and manages its trading activities in a prudent manner. TCM also offer various hedging products against exchange rate or interest rate risks to customers from all segments.
Its activities include trading in government bonds (“T-bills and Government Sukuk) as well as corporate bonds in the primary and secondary markets. Danamon is currently one of several Primary Dealers designated by the Ministry of Finance.
Treasury products and services available for customers include Investment Gallery, Retail Treasury Services, Plain Vanilla FX Tod/Tom/Spot, FX Forward, FX Swap, Interest Rate Swap, Cross Currency Swap, conventional Government bonds and Government Sukuk.
2016 Initiatives and PerformanceThe Loan to Funding Ratio (LFR) is one of the criteria for the performance of TCM. In 2016, TCM collaborated closely with other units to secure funding, both onshore and offshore deposits to remain within LFR calculation requirements.
TCM also maintained adequate liquidity by diversification of money market instruments, including through inter-bank borrowings and transactions with repurchase agreement (repo) supported with swap transactions.
Treasury and Capital Market
Treasury and Capital Market (“TCM”) is responsible to maintain the Bank’s liquidity and offer customers with solution-oriented Treasury products and services.
PT Bank Danamon Indonesia, Tbk. 2016 Annual Report 101
Operational Review
Management Discussion & Analysis
Corporate Governance
Corporate Social Responsibility
Corporate Data
Financial Report
In 2016, the treasury system currently in use (called Summit) was updated, to be followed by further enhancements to increase the capacity of the system in anticipation of growing business volumes.
Plans for 2017In 2017, TCM will continue to focus on increasing activities on FX and securities transactions. In support of these objectives, TCM will implement a number of strategic initiatives including the expansion of its customer base as well as widening the distribution channels for FX and securities transactions.
TCM also plans to launch new products to complement its existing offerings as well as to satisfy the needs of retail and corporate customers. New products for retail customers will emphasize yield enhancement, while those for the corporate clients are directed more at hedging purposes.
In support of the new products, TCM will continue to enhance the capability and capacity of the Summit treasury system in order to minimize operational risks while more accurately assessing market risks.
With regard to alternative funding sources, TCM will continue to look for opportunities for bonds/marketable securities/NCDs issuance to secure sustainable long-term funding.
With these initiatives, TCM seeks to optimize its contribution to the Bank while adhering to the prudent principles and compliance with applicable regulations.
PT Bank Danamon Indonesia, Tbk. 2016 Annual Report102
Danamon’s Highlights
Management Reports
Company Profile
Transaction Banking serves as solution integrator within the Bank, providing cross-division solutions to fulfill customer needs for Wholesale Banking and SME Banking segments.
By leveraging on our Cash Management, Trade Finance and Financial Supply Chain capabilities, we tailor our offerings to provide customers with the right working capital solutions that are competitive and efficient.
Transaction Banking also focuses on continuous development to keep up with market through technology-driven initiative such as revamping internet banking platform for the benefits of our customers. Our new internet banking platform -
Transaction Banking(Cash Management, Trade Finance & Financial Supply Chain)
Transaction Banking will continue its focus to be the solution integrator across different divisions and lead the Bank’s digital strategy for Wholesale Banking and SME Banking
Danamon Connect - aims to offer better customer’s experience by integrating Cash Management, Trade Finance and Financial Supply Chain platforms and at the same time increases the efficiency in business process.
2016 StrategyTransaction Banking implemented several strategies and initiatives for Cash Management, Trade Finance and Financial Supply Chain.
In Cash Management, Danamon continued with its focus on the sourcing of low-cost funding, expanding granular deposit portfolio by providing end-to-end cash management solutions suited to the needs of the customers.
Specific initiatives have been developed to support Cash Management focus, i.e. launching of RMB-currency CASA, Time Deposit and Remittance products. In addition, Virtual Account was revitalized by enhancing its many capabilities to improve our collection services. Danamon Connect was soft-launched to replace the existing cash@work, to provide higher flexibility and more features to enhance customer’s experience.
PT Bank Danamon Indonesia, Tbk. 2016 Annual Report 103
Operational Review
Management Discussion & Analysis
Corporate Governance
Corporate Social Responsibility
Corporate Data
Financial Report
In Trade Finance, Danamon continued to improve our capabilities to serve our customer’s working capital requirements. New product was introduced, such as Trade Supplier Finance which helps customers in managing their balance sheet and cash flow. Another variety of short term trade product, Open Account Financing Wesel, was also introduced to help customers manage their tight cash flow and allows them to further their business.
In Financial Supply Chain, Danamon targeted to be the bank of choice for customers. Danamon has expanded and continued to expand its market share organically by adding new principals/anchors and their related distributors/ spokes to the already growing portfolio. We leverage on the flexible internet banking platform to support principle/ distributor payment behavior. To further enhance Financial
Supply Chain experience with Danamon, our team provides various in-house reports that assist principle and/ or spoke in managing their business, allowing them to organize their cash flow more accurately.
The new internet banking platform was soft-launched in August 2016, to be fully implemented in 2017.
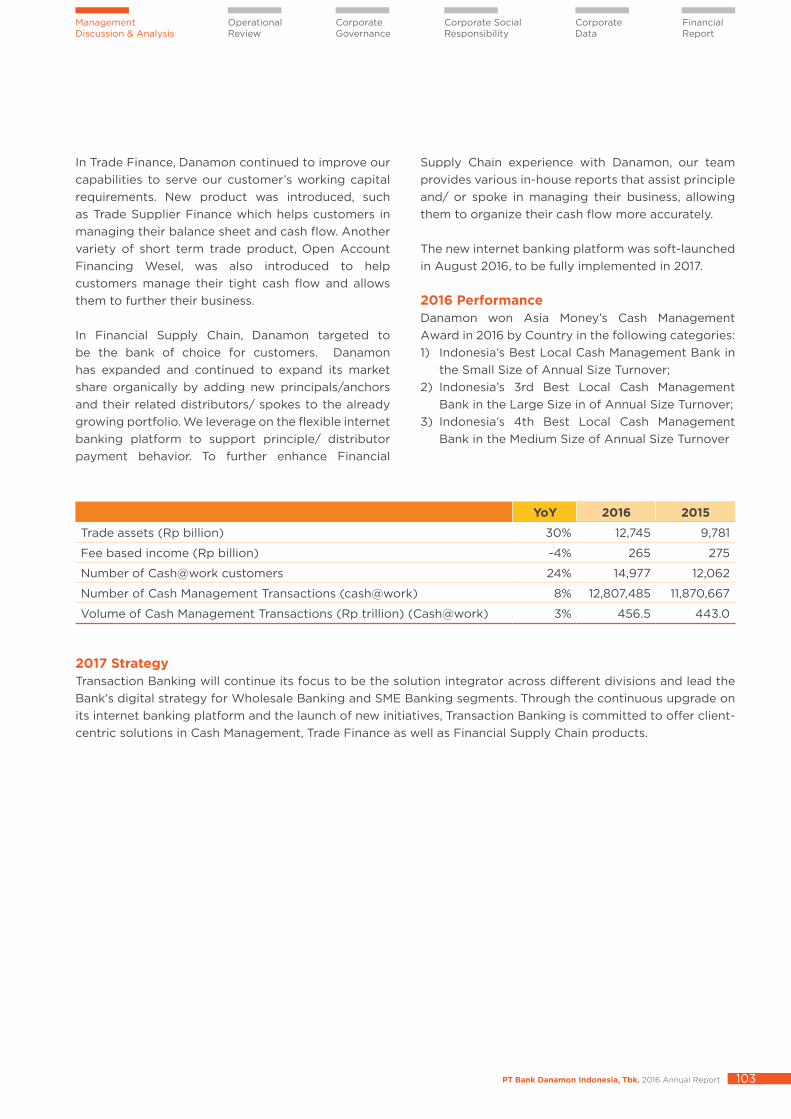
2016 Performance Danamon won Asia Money’s Cash Management Award in 2016 by Country in the following categories:1) Indonesia’s Best Local Cash Management Bank in
the Small Size of Annual Size Turnover;2) Indonesia’s 3rd Best Local Cash Management
Bank in the Large Size in of Annual Size Turnover;3) Indonesia’s 4th Best Local Cash Management
Bank in the Medium Size of Annual Size Turnover
YoY 2016 2015
Trade assets (Rp billion) 30% 12,745 9,781
Fee based income (Rp billion) -4% 265 275
Number of Cash@work customers 24% 14,977 12,062
Number of Cash Management Transactions (cash@work) 8% 12,807,485 11,870,667
Volume of Cash Management Transactions (Rp trillion) (Cash@work) 3% 456.5 443.0
2017 Strategy Transaction Banking will continue its focus to be the solution integrator across different divisions and lead the Bank’s digital strategy for Wholesale Banking and SME Banking segments. Through the continuous upgrade on its internet banking platform and the launch of new initiatives, Transaction Banking is committed to offer client-centric solutions in Cash Management, Trade Finance as well as Financial Supply Chain products.
PT Bank Danamon Indonesia, Tbk. 2016 Annual Report104
Danamon’s Highlights
Management Reports
Company Profile
Small Medium Enterprise Banking (SME)
Danamon’s SME Banking unit offers solutions in banking products and services suited to the needs of businesses in the small and medium enterprise sector. SME Banking customers is businesses with total annual sales between Rp1 billion and Rp50 billion, with total loan facility up to Rp20 billion.
Products and Services SME Banking offers a variety of loan products, including Overdraft Facility, a short-term loan facility for working capital purposes with option for annual renewal. This product offers high flexibility, allowing debtors to withdraw cash at any time up to the
prescribed loan limit via the debtor’s current account.
Another product is the Demand Loan, a short-term loan for working capital purposes of a cyclical nature. Loan withdrawals can be done at any time and repetiously using a Promissory Note, which also contains the terms of payment.
SME Banking also offers a number of Installment Loan (“KAB”) facilities, such as KAB - Business Premises Loan (“KAB-KTU”). KAB-KTU is a long-term investment loan facility for the purchase or refinancing of business premises, either a shop-house, small-office home-office, warehouses, workshops, strata-titled commercial stalls, or similar other facilities. Loan tenor can be up to 20 years for several business premises, and the product can also be bundled with Danamon’s CASA and e-channel products. Similar products includes KAB-Buyer Financing Program and KAB-Asset Backed Financing facilities.
Other loan products available to SME Banking customers include the BPR Loan, Employee Cooperative Loan, Community Financing, the Dana Oto (Auto Financing) in cooperation with Adira Finance, as well as trade finance facilities.
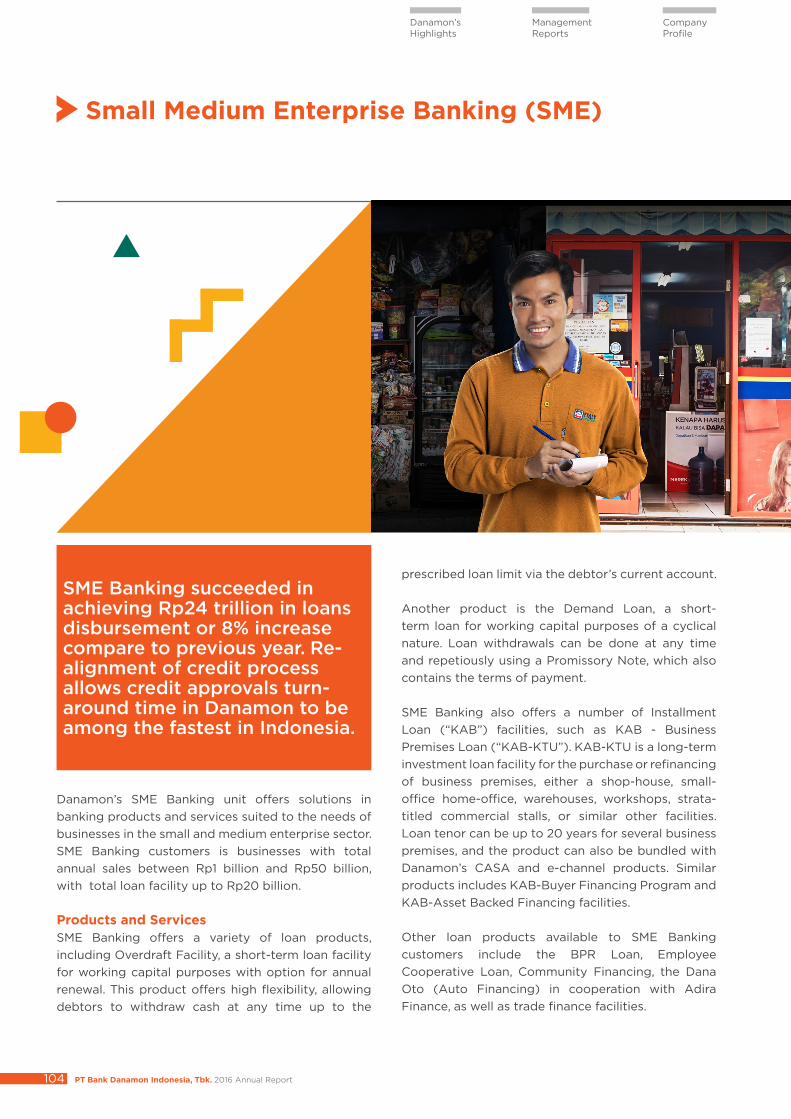
SME Banking succeeded in achieving Rp24 trillion in loans disbursement or 8% increase compare to previous year. Re-alignment of credit process allows credit approvals turn-around time in Danamon to be among the fastest in Indonesia.
PT Bank Danamon Indonesia, Tbk. 2016 Annual Report 105
Operational Review
Management Discussion & Analysis
Corporate Governance
Corporate Social Responsibility
Corporate Data
Financial Report
2016 Strategy and Initiatives In 2016, SME Banking engaged in a transformation program involving the implementation of S&D structure, the establishment of a special team to focus on penetration of the so-called ‘emerging market SMEs’ and improvement of credit underwriting processes.
The implementation of the S&D program has, among other gains, resulted in a more efficient credit cost structure at SME Banking as well as at Danamon as a whole. The re-alignment of credit processes at the SME Banking unit has resulted in a significantly faster credit approval process of a maximum five days, compared to up to 15 days previously. This makes Danamon SME Banking one of the banks with the fastest loan approval turn-around time in Indonesia.
The S&D program also resulted in better cross-selling opportunities, with sales personnel now able to offer other Danamon banking products to SME customers. For instance, SME customers who already had an SME credit account were offered other products such as a savings account, time deposit, cash management services or a bancassurance product. Upon having a multi-product relation with Danamon, these customers are more likely to remain loyal long-term customers at Danamon. The cross-sell of certain products such as cash management or bancassurance also serves to benefit Danamon’s fee-based income.
In 2016, SME Banking also continued with its strategy of the previous year towards sustainable growth of loans and customer deposits, while allocating a greater portion of loan disbursements to the trading sector. SME Banking also prioritized the disbursements of smaller-sized, high-quality loans so as to better manage the credit risk while supporting sustainable overall loan growth. In terms of credit risk, SME Banking remained prudent especially in loan disbursements to sectors such as mining and minerals and their supporting industries, which are still vulnerable to changes in the global economy. The allocation of loans considers such factors as market condition, availability of collateral and other factors.
In addition, SME Banking developed financing products for the ‘emerging market SME’ segment, including the commercial mortgage program KAB-KTU product. These products are designed to cater to the needs of small SME customer to help them grow businesses.
SME Banking also consistently pursued cooperation with a variety of business communities through the Distributor Financing (“DF”) and Financial Supply Chain (“FSC”) programs, offering attractive banking products and services to businesses as distributors of customers of Danamon. Existing cooperation with other business lines such as Wholesale Banking, DSP and Adira Group was also enhanced.
2016 PerformanceAmid challenging economic conditions through 2016, SME Banking succeeded in achieving Rp24 trillion in loans disbursement or 8% increase compared to previous year. There was a 7% decline in SME customer third-party funds to Rp9.8 trillion. However, this decline was in line with the Bank’s strategy to reduce its cost of fund through portfolio diversification to a greater number of smaller-sized accounts. At the end of 2016, the number of accounts showed an increase of 2.3% to 79,824 accounts in 2016.
2017 Strategies and Initiatives
In 2017, SME Banking will largely continue with those various initiatives begun in 2016. These include the optimization of S&D network expansion to cities with business potential, aiming for selective loan growth with a priority on the trading sector. The KAB-KTU Commercial Mortgage product will be further enhanced with new features in line with the growing needs of potential customers.
SME Banking will seek to function as a one-stop banking solution providing integrated financing and funding solutions to small and medium-size businesses through the provision of comprehensive product bundling solutions. SME Banking will also continue with the cross-sell strategy as a means to improve customer loyalty.
PT Bank Danamon Indonesia, Tbk. 2016 Annual Report106
Danamon’s Highlights
Management Reports
Company Profile
Consumer Banking
Granular funding strategy has contributed to a more efficient cost of funds.
Danamon’s Consumer Banking business unit provides holistic banking services to individual customers, both self-employed and salaried employees. Consumer Banking offers variety of banking services and products, such as unique savings and current account products, time deposits, as well as financing products ranging from mortgages, credit cards, to unsecured personal loans.
For investment and bancassurance products, Consumer Banking provides its customers with a wealth of options through partnerships with some of the biggest and most reputable providers in the country. Whilst for its affluent customer segment, Consumer Banking also provides personalized service through its Privilege Banking offer.
Consumer Banking contributed around 8% to the total financing portfolio of Danamon and accounted for approximately 59% of total customer deposits. The unit also contributed significantly to Danamon’s fee based income.
PT Bank Danamon Indonesia, Tbk. 2016 Annual Report 107
Operational Review
Management Discussion & Analysis
Corporate Governance
Corporate Social Responsibility
Corporate Data
Financial Report
2016 Strategy In the face of tighter competition and opportunity to provide customers with more integrated products and services, Danamon has implemented Sales & Distribution (S&D) strategy, allowing a more holistic approach of serving the customers.
With the new S&D structure, customers will receive better services through implementation of the ‘single captain’ approach at branches, whereby a Branch Manager is directly responsible for the performance of all business lines at the branch. Each frontliner (sales personnel) at branches has the capability to provide customers with holistic service, such as SME financing and other products to meet the needs of the customers. This capability is supported by the re-alignment of front and back office functions resulting in a faster and more efficient process. Customers thus benefit from a faster process and more consistent service quality, resulting in improved customer loyalty.
In 2016, Danamon also implemented a granular funding strategy by focusing on smaller sized deposits. This led to lower cost of funds and also a better deposit profile for the Bank. To support the granular funding strategy, Danamon implemented programs to entice new account opening by existing as well as new customers.
The S&D strategy has also contributed to the increase of Danamon’s fee based income, in line with more cross-sell activities as well as the availability of more attractive product bundling tailored for specific customer segments. In 2016, fee based income from cash management services and bancassurance accounted for a significantly larger portion of the Bank’s fee based income.
To improve customer access and increase the number of transactions, Danamon continued to develop its e-channel platform by adding more capabilities and features, including the launch of the DCard Mobile application for its credit card holders.
Danamon offers Classic, Gold and Platinum credit cards that allow customers to enjoy the conveniences of modern lifestyle. In 2016, Danamon implemented a promotional strategy for its flagship product, AMEX Platinum Card, a prestigious charge card product that comes with exclusive and upscale features, such as special fast-lane immigration access in airports, airport lounges, special offers of dining and accommodation at luxurious hotels, access to the most beautiful golf courses in Indonesia dan many other.
Danamon’s credit card business also implemented promotional strategies in collaboration with various e-commerce portals to increase card usage and transaction volume, through attractive offers, such as cash back, discounts, and interest-free installments.
PT Bank Danamon Indonesia, Tbk. 2016 Annual Report108
Danamon’s Highlights
Management Reports
Company Profile
In the mortgage business, Danamon continued to develop partnership with strategic partners such as property developers and brokers, and leasing companies to promote and market mortgage products. Danamon also implemented a competitive pricing strategy to secure a larger market share while maintaining the quality of the portfolio.
In the bancassurance business, Danamon’s strategy in 2016 was directed at new market penetration outside Java, such as Kalimantan and Sulawesi. Cross-sell activities were also conducted through product bundling initiatives to the Bank’s customer segments.
2016 Performance
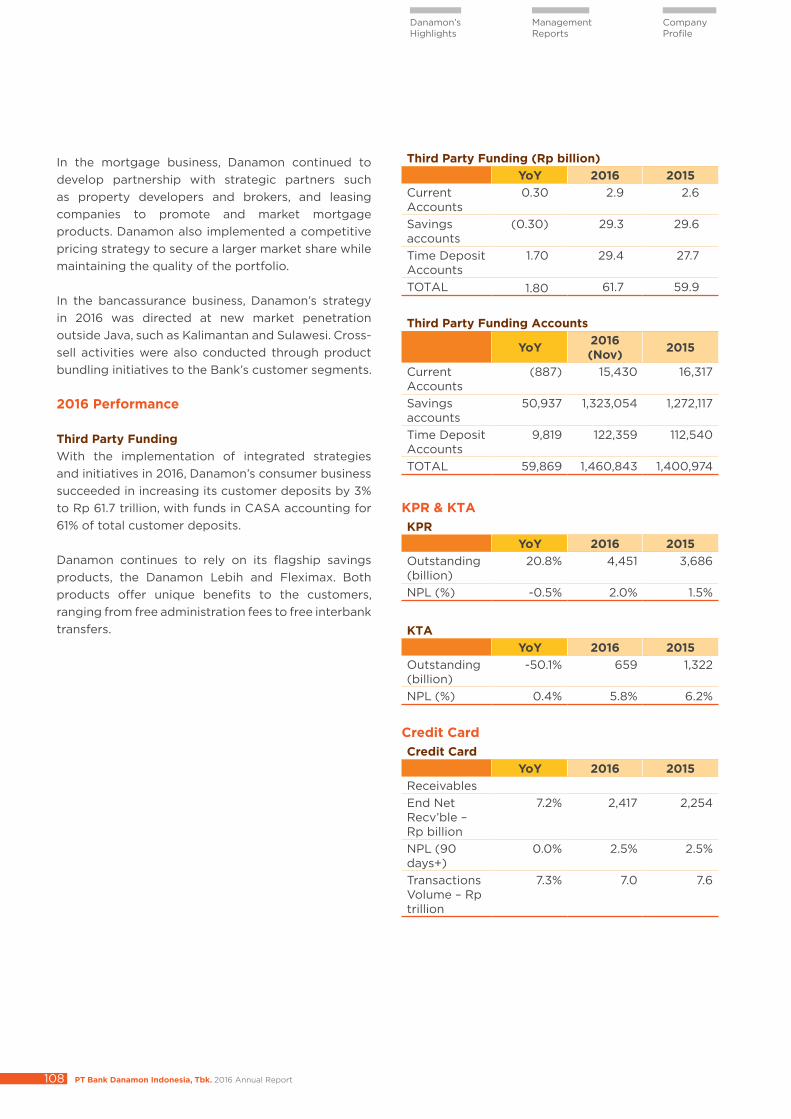
Third Party Funding With the implementation of integrated strategies and initiatives in 2016, Danamon’s consumer business succeeded in increasing its customer deposits by 3% to Rp 61.7 trillion, with funds in CASA accounting for 61% of total customer deposits.
Danamon continues to rely on its flagship savings products, the Danamon Lebih and Fleximax. Both products offer unique benefits to the customers, ranging from free administration fees to free interbank transfers.
Third Party Funding (Rp billion)YoY 2016 2015
Current Accounts
0.30 2.9 2.6
Savings accounts
(0.30) 29.3 29.6
Time Deposit Accounts
1.70 29.4 27.7
TOTAL 1.80 61.7 59.9
Third Party Funding Accounts
YoY 2016 (Nov) 2015
Current Accounts
(887) 15,430 16,317
Savings accounts
50,937 1,323,054 1,272,117
Time Deposit Accounts
9,819 122,359 112,540
TOTAL 59,869 1,460,843 1,400,974
KPR & KTAKPR
YoY 2016 2015Outstanding (billion)
20.8% 4,451 3,686
NPL (%) -0.5% 2.0% 1.5%
KTAYoY 2016 2015
Outstanding (billion)
-50.1% 659 1,322
NPL (%) 0.4% 5.8% 6.2%
Credit CardCredit Card
YoY 2016 2015ReceivablesEnd Net Recv’ble – Rp billion
7.2% 2,417 2,254
NPL (90 days+)
0.0% 2.5% 2.5%
Transactions Volume – Rp trillion
7.3% 7.0 7.6
PT Bank Danamon Indonesia, Tbk. 2016 Annual Report 109
Operational Review
Management Discussion & Analysis
Corporate Governance
Corporate Social Responsibility
Corporate Data
Financial Report
Electronic ChannelIn 2016, 44% of Danamon’s customers conduct their banking transactions through the Bank’s e-channel. The number of e-channel transactions accounted for 55% of all transactions at the Bank, with D-Mobile transactions growing 105% year on year. These transactions contributed significantly to the Bank’s fee based income.
Danamon also launched the DCard Mobile, a smatphone application targeted at its credit card customers. This application allows customers to easily manage their credit card accounts, enabling them to engage in activities ranging from converting their purchases into monthly installments to registration of bill payments.
The security of the customers’ transactions is paramount. In order to provide customers’ peace of mind, the Bank is continuously upgrading its security system as well as educating the customers.
Strategy and Plans for 2017 In 2017, Danamon seeks to better serve the customers through its revamped S&D network. Initiatives such as products bundling, centralized marketing, and e-channel improvements (e-commerce, online savings account, and others) will be rolled out to improve the customers’ experience.
Plans are also in hand for the launch of an integrated loyalty program that allows the customers to accumulate reward points from their transactions as well as product purchases.
Danamon will revitalize the credit card business, through initiatives such as deepening relationship with existing card holders, and building synergies with branch offices.
In the mortgage business, aside from strengthening its collaboration with traditional strategic partners, Danamon will also pursue non conventional partners to widen the marketing of its products.
With regards to bancassurance, Danamon will continue to serve the needs of its various customer segments by providing them with unique products. To meet the changing behavior of the customers, online insurance products will be offered. Collaboration with Adira Insurance and Adira Finance will be pursued to increase cross-sell opportunities.
PT Bank Danamon Indonesia, Tbk. 2016 Annual Report110
Danamon’s Highlights
Management Reports
Company Profile
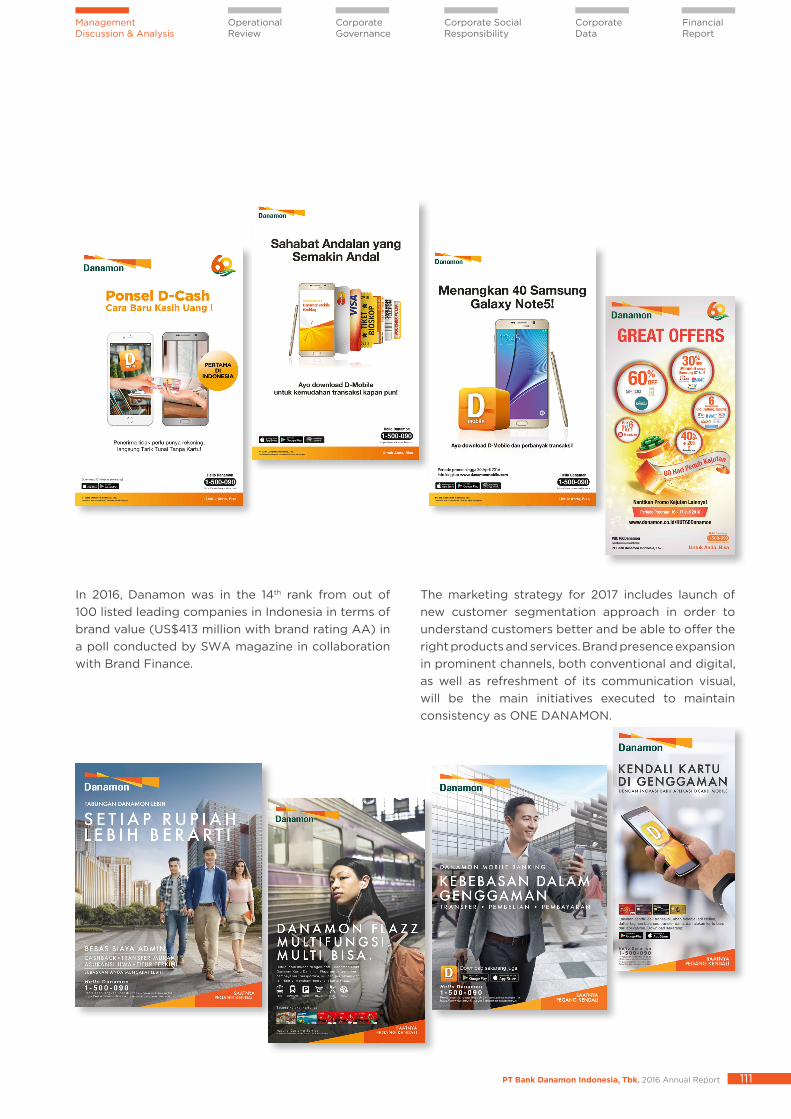
The overall marketing strategy in 2016 was directed at improving Danamon’s brand equity through brand recognition, customer acquisition and customer loyalty initiatives, reinforcing the brand positioning of Danamon as a leading bank. A centralized marketing strategy promoted consistent messages of product and service innovations. Marketing focus highlighted meeting customers’ needs from three identified segments: young professionals, families and SME owners. Danamon underscored an internal marketing campaign, using the momentum of Danamon’s 60th anniversary with the theme of ‘Mantap Melaju’ to instil core values and motivation among Danamon employees.
Integrated marketing communication programs were carried out in 2016, from above the line to below the line. Above the line media, such as television, radio, print advertisement, and digital were effectively integrated with below the line promotions, which include outdoor media placement, event and activation at customer touch points at branch, ATM gallery, and selected merchants.
Danamon also engaged in marketing communication programs at banking-related events, as well as in direct-to-customer interactions and prospective-customer promotional events within relevant marketing communities across the regions. Danamon intensively engaged in digital marketing from the website and via the emerging effective platforms of social media.
Marketing programs discovered ways to improve employee awareness and preference for Danamon’s products and services. These various programs were held at Head Office and at branches as conducted in association with the 60th Anniversary of Danamon in 2016.
Danamon regularly employs the services of independent research companies to track brand performance, brand awareness and advertising awareness so as to ensure the effectiveness of its marketing strategies. Two such marketing research projects were conducted this year.
Marketing Strategy and Market Share
Danamon’s 2016 marketing strategy focused on meeting customer needs from young professionals, families and SME owners
PT Bank Danamon Indonesia, Tbk. 2016 Annual Report 111
Operational Review
Management Discussion & Analysis
Corporate Governance
Corporate Social Responsibility
Corporate Data
Financial Report
In 2016, Danamon was in the 14th rank from out of 100 listed leading companies in Indonesia in terms of brand value (US$413 million with brand rating AA) in a poll conducted by SWA magazine in collaboration with Brand Finance.
The marketing strategy for 2017 includes launch of new customer segmentation approach in order to understand customers better and be able to offer the right products and services. Brand presence expansion in prominent channels, both conventional and digital, as well as refreshment of its communication visual, will be the main initiatives executed to maintain consistency as ONE DANAMON.
PT Bank Danamon Indonesia, Tbk. 2016 Annual Report112
Danamon’s Highlights
Management Reports
Company Profile
Indonesia's Syariah banking sector possesses a tremendous growth potential, given that while some 80% of the population are Moslems, the market share of Syariah banking is still relatively small, at around 5%. Therefore, Danamon Syariah is striving to develop a robust customer-oriented Syariah banking service as a solution for small and medium businesses as well as the retail segment, supported by reliable infrastructure and technology.
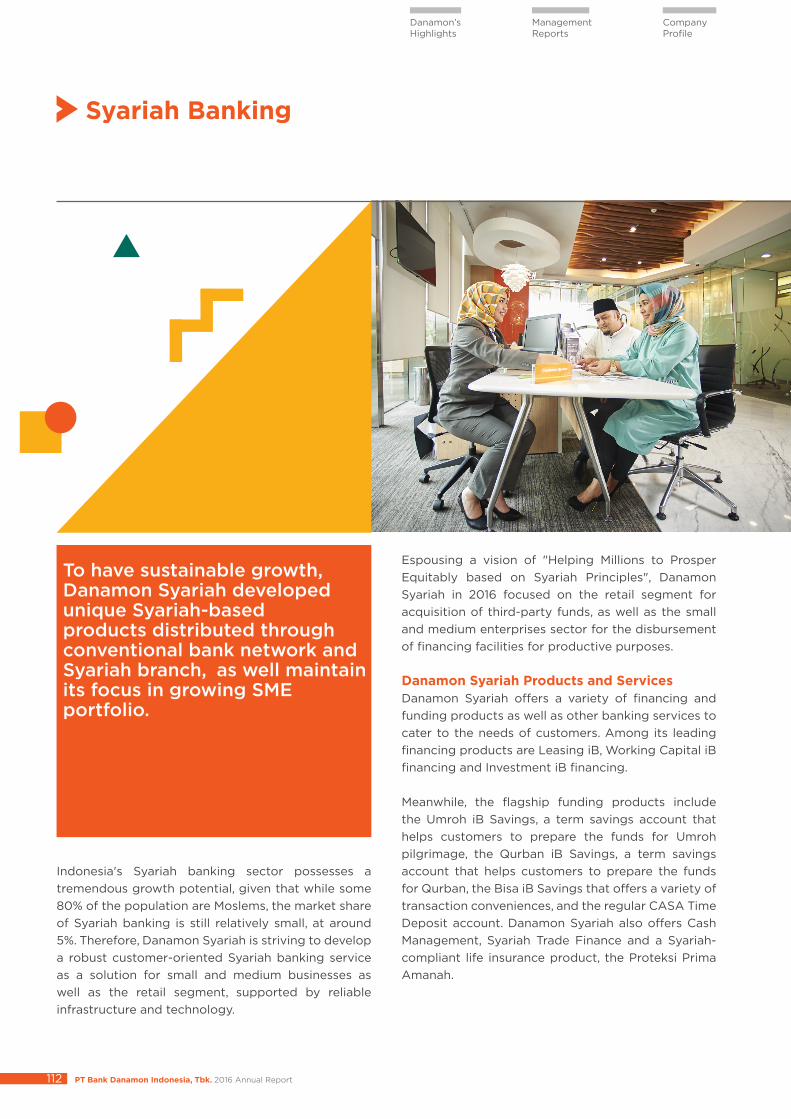
Syariah Banking
To have sustainable growth, Danamon Syariah developed unique Syariah-based products distributed through conventional bank network and Syariah branch, as well maintain its focus in growing SME portfolio.
Espousing a vision of "Helping Millions to Prosper Equitably based on Syariah Principles", Danamon Syariah in 2016 focused on the retail segment for acquisition of third-party funds, as well as the small and medium enterprises sector for the disbursement of financing facilities for productive purposes.
Danamon Syariah Products and Services Danamon Syariah offers a variety of financing and funding products as well as other banking services to cater to the needs of customers. Among its leading financing products are Leasing iB, Working Capital iB financing and Investment iB financing.
Meanwhile, the flagship funding products include the Umroh iB Savings, a term savings account that helps customers to prepare the funds for Umroh pilgrimage, the Qurban iB Savings, a term savings account that helps customers to prepare the funds for Qurban, the Bisa iB Savings that offers a variety of transaction conveniences, and the regular CASA Time Deposit account. Danamon Syariah also offers Cash Management, Syariah Trade Finance and a Syariah-compliant life insurance product, the Proteksi Prima Amanah.
PT Bank Danamon Indonesia, Tbk. 2016 Annual Report 113
Operational Review
Management Discussion & Analysis
Corporate Governance
Corporate Social Responsibility
Corporate Data
Financial Report
2016 Strategy and Initiatives As part of its business transformation strategy, Danamon Syariah implemented a number of work programs in 2016 in developing and optimizing its Syariah product distribution networks through both the Syariah branches as well as the conventional branches via office channeling. While Syariah branches consolidation continued, Danamon also developed unique Syariah-based products that can also be distributed via the conventional branch network, including cash management services to optimize the cash flow from financing activities.
In 2016, Danamon Syariah focused on growing its small and medium enterprise portfolio as well as its commercial segment through the Syariah leasing facilities. Additionally, Danamon Syariah focused on improving the competencies and productivity of its human resources.
2016 Performance With the implementation of the above strategy and work programs, Danamon Syariah succeeded in amassing Rp3,693 billion of third-party funds in 2016, a growth of 22% compared to the previous year. This was achieved on the strength of distribution network expansion through the office channeling strategy.
Despite less than ideal macro-economic factors, Danamon Syariah posted Rp3,321 billion in financing, increasing by 5% from the previous year. Asset quality was well maintained with NPF of around 1.8%.
In 2016, Danamon Syariah added a couple of new products to its growing range of product suite, which were the Syariah leasing refinancing (“IMBT”) facility and the Proteksi Prima Amanah product, available at all conventional branches through office channeling.
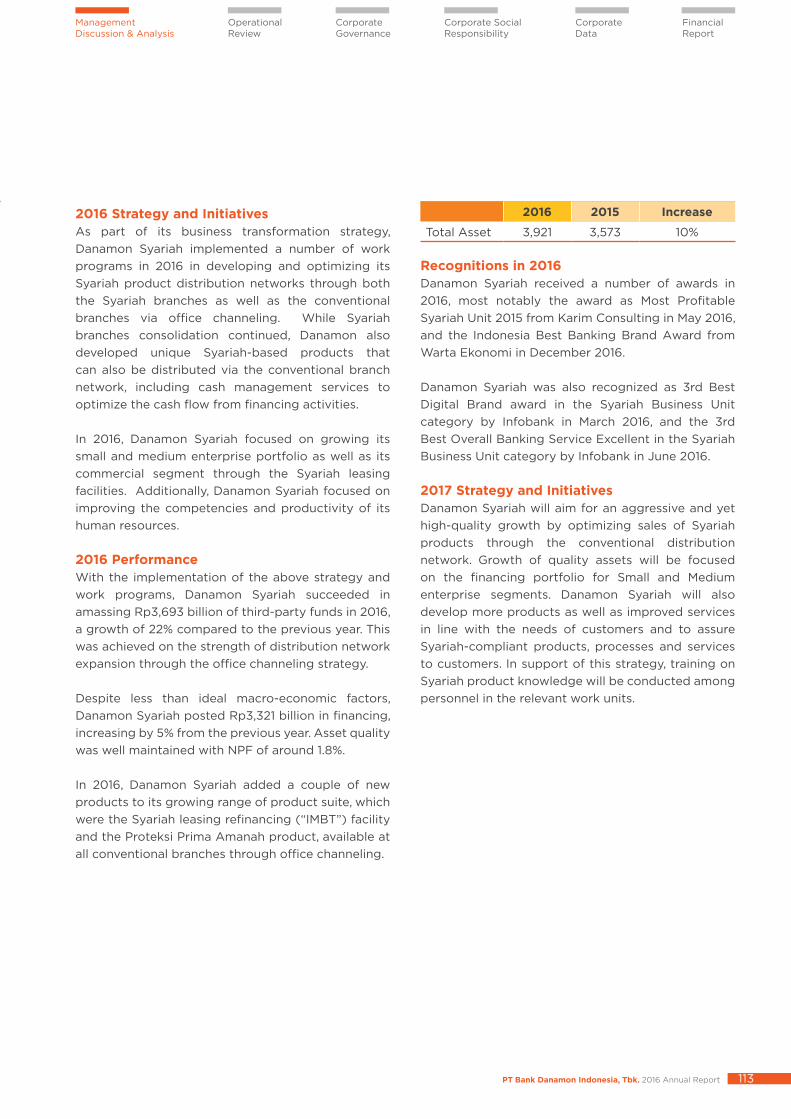
2016 2015 Increase
Total Asset 3,921 3,573 10%
Recognitions in 2016Danamon Syariah received a number of awards in 2016, most notably the award as Most Profitable Syariah Unit 2015 from Karim Consulting in May 2016, and the Indonesia Best Banking Brand Award from Warta Ekonomi in December 2016.
Danamon Syariah was also recognized as 3rd Best Digital Brand award in the Syariah Business Unit category by Infobank in March 2016, and the 3rd Best Overall Banking Service Excellent in the Syariah Business Unit category by Infobank in June 2016.
2017 Strategy and Initiatives Danamon Syariah will aim for an aggressive and yet high-quality growth by optimizing sales of Syariah products through the conventional distribution network. Growth of quality assets will be focused on the financing portfolio for Small and Medium enterprise segments. Danamon Syariah will also develop more products as well as improved services in line with the needs of customers and to assure Syariah-compliant products, processes and services to customers. In support of this strategy, training on Syariah product knowledge will be conducted among personnel in the relevant work units.
PT Bank Danamon Indonesia, Tbk. 2016 Annual Report114
Danamon’s Highlights
Management Reports
Company Profile
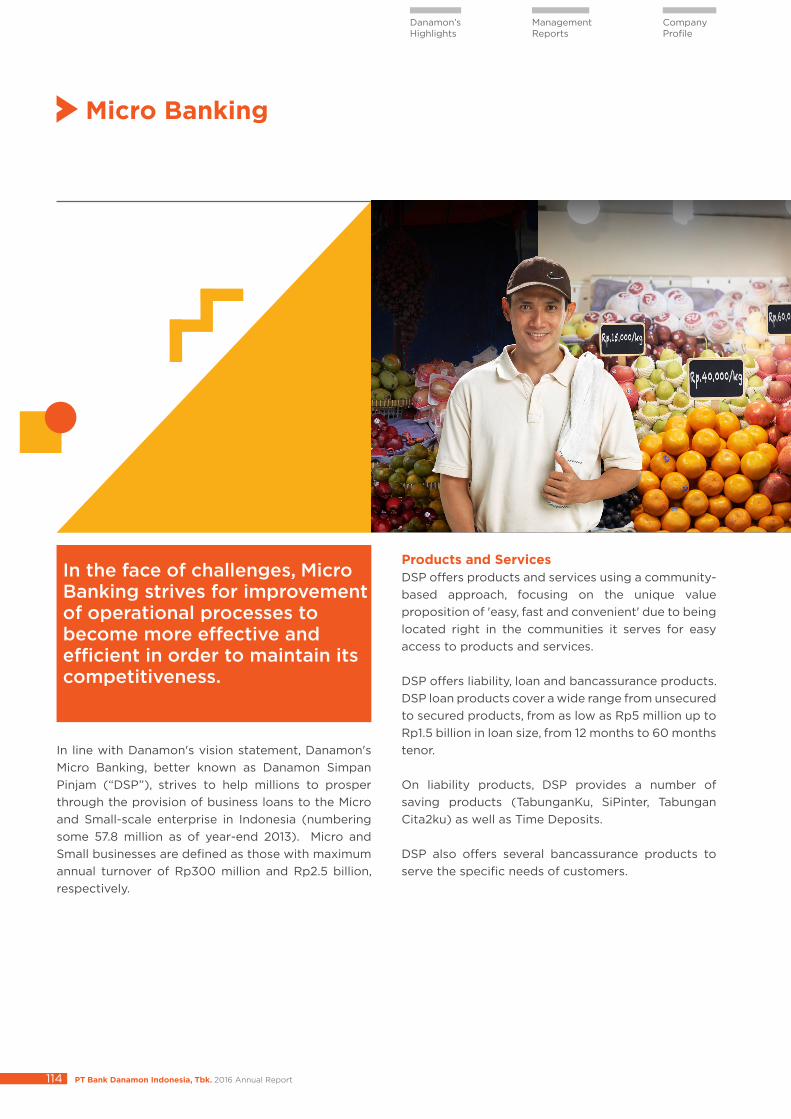
In line with Danamon's vision statement, Danamon's Micro Banking, better known as Danamon Simpan Pinjam (“DSP”), strives to help millions to prosper through the provision of business loans to the Micro and Small-scale enterprise in Indonesia (numbering some 57.8 million as of year-end 2013). Micro and Small businesses are defined as those with maximum annual turnover of Rp300 million and Rp2.5 billion, respectively.
In the face of challenges, Micro Banking strives for improvement of operational processes to become more effective and efficient in order to maintain its competitiveness.
Products and ServicesDSP offers products and services using a community-based approach, focusing on the unique value proposition of 'easy, fast and convenient' due to being located right in the communities it serves for easy access to products and services.
DSP offers liability, loan and bancassurance products. DSP loan products cover a wide range from unsecured to secured products, from as low as Rp5 million up to Rp1.5 billion in loan size, from 12 months to 60 months tenor.
On liability products, DSP provides a number of saving products (TabunganKu, SiPinter, Tabungan Cita2ku) as well as Time Deposits.
DSP also offers several bancassurance products to serve the specific needs of customers.
Micro Banking
PT Bank Danamon Indonesia, Tbk. 2016 Annual Report 115
Operational Review
Management Discussion & Analysis
Corporate Governance
Corporate Social Responsibility
Corporate Data
Financial Report
2016 Strategy and Initiatives In accordance with Danamon's 2016 Bank Business Plan, DSP implemented a business transformation strategy towards sound and sustainable growth through distribution network alignment, development of alternative distribution network, better cooperation with strategic partners, and enhanced relations with loyal customers and communities. DSP also focused on internal digitization towards more effective and efficient operational processes for faster customer transaction time, organizational and process alignment, optimization of shared services, and the development of alternative payment networks.
Significant automation was aimed at enabling faster, more efficient and better-controlled loan application and collection processes, including building of a rule-based engine.
Another important area was fraud management and prevention through process improvement, human resources quality improvement, and the implementation of a merit-based and accountability minded work culture.
Human resources quality was enhanced by strengthening corporate values and culture, increasing inter-divisional synergy, and improving employee competencies through e-learning programs.
2016 PerformanceIn 2016, DSP faced increasing business competition. Market penetration was challenged due to macroeconomic conditions and external competitions, eventually impacting the DSP portfolio. Internally, DSP also had to deal with declining outlet performance as well as with the need for more efficient and controlled loan processing.
The DSP loan portfolio declined by 30% to Rp10,188 billion in 2016, from Rp14,604 billion the previous year. In the same period, DSP customer deposits declined by 26% from Rp828 billion in 2015 to Rp611 billion in 2016.
2017 Strategy and Work ProgramsIn 2017, DSP will still face internal and external challenges. Internal challenges include efforts to improve outlet performance and strategic partnerships, to implement better operational, credit and collection processes, and to enhance the quality of our human resources. Challenges from external factors will still mainly come from macro-economic conditions as well as the continuing external competition.
To overcome all those challenges, DSP has formulated a number of strategies for 2017, based on repositioning and refocusing of its business and strategic partnerships. More effective and efficient processes will be pursued through automation, organization structure alignment for better services, and the development of alternative payment networks and new business models. Faster, more efficient and controlled credit and collection processes will be pursued through automation, including the implementation of a rule-based engine, human resources quality improvement, and enhancement to the supervision function. To improve management of fraud prevention, DSP will enhance the various processes for the early-warning of fraud, the application of the know-your-customer principle among employees, the imposition of clear and strict sanctions and punishment, and the strengthening of the internal control function. In 2017, DSP plans to continue rationalize its network. Outlet closure will be based on studies that consider factors such as market potential, availability of human resources, financial performance, and loan quality of the respective outlet. This will be the main task of the Special Asset (“SA”) division. Any outlet closure will be done in full compliance to the relevant regulations/laws, paired with an effective two-way communication channel between management and employees.
PT Bank Danamon Indonesia, Tbk. 2016 Annual Report116
Danamon’s Highlights
Management Reports
Company Profile
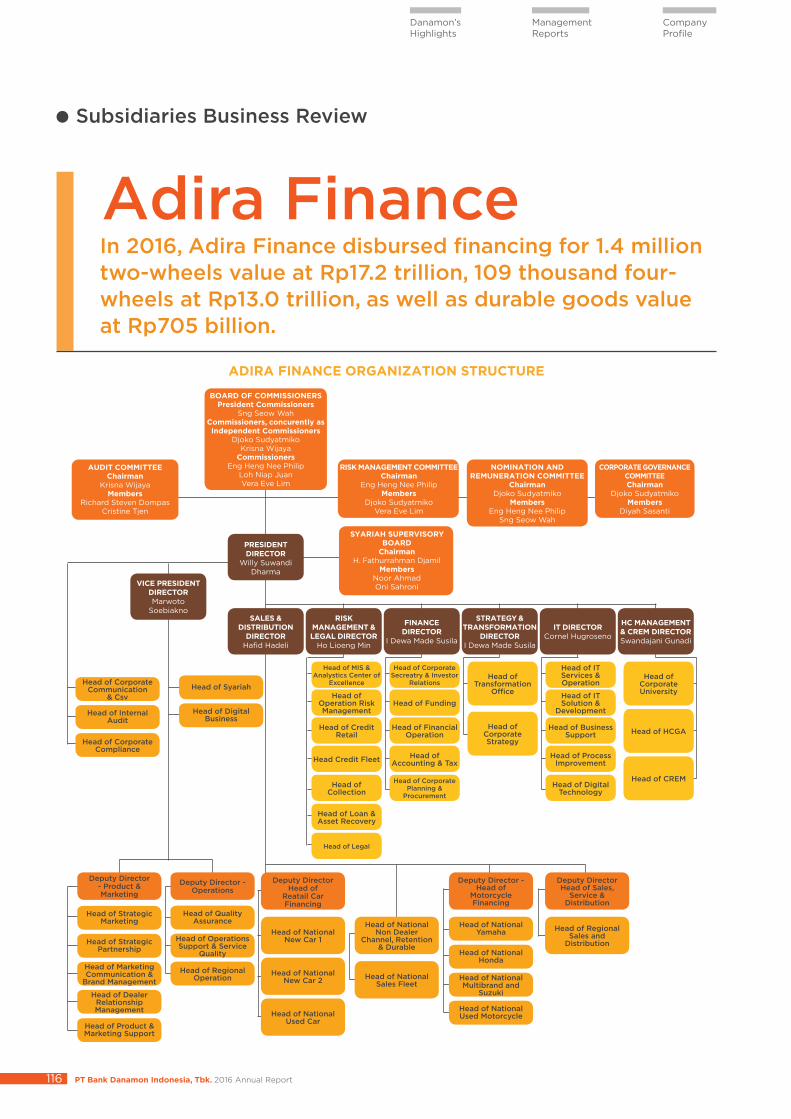
In 2016, Adira Finance disbursed financing for 1.4 million two-wheels value at Rp17.2 trillion, 109 thousand four-wheels at Rp13.0 trillion, as well as durable goods value at Rp705 billion.
Adira Finance
Subsidiaries Business Review
ADIRA FINANCE ORGANIZATION STRUCTURE
SALES & DISTRIBUTION
DIRECTORHafid Hadeli
PRESIDENT DIRECTOR
Willy Suwandi Dharma
VICE PRESIDENT DIRECTORMarwoto
SoebiaknoRISK
MANAGEMENT & LEGAL DIRECTOR
Ho Lioeng Min
FINANCE DIRECTOR
I Dewa Made Susila
STRATEGY & TRANSFORMATION
DIRECTORI Dewa Made Susila
IT DIRECTORCornel Hugroseno
HC MANAGEMENT & CREM DIRECTORSwandajani Gunadi
Head of Corporate University
Head of Transformation
Office
Head of Corporate Strategy
Head of IT Services & Operation
Head of IT Solution &
Development
Head of Business Support
Head of Process Improvement
Head of Digital Technology
Head of MIS & Analystics Center of
Excellence
Head of Operation Risk Management
Head of Credit Retail
Head Credit Fleet
Head of Loan & Asset Recovery
Head of Collection
Head of Legal
Head of Corporate Secreatry & Investor
Relations
Head of Funding
Head of Financial Operation
Head of Accounting & Tax
Head of Corporate Planning &
Procurement
Head of HCGA
Head of CREM
Deputy DirectorHead of
Reatail Car Financing
Deputy Director - Product & Marketing
Deputy Director - Operations
Head of National New Car 1
Head of National New Car 2
Head of National Used Car
Deputy Director Head of Sales,
Service & Distribution
Head of Regional Sales and
Distribution
Deputy Director - Head of
Motorcycle Financing
Head of National Yamaha
Head of Quality Assurance
Head of SyariahHead of Corporate
Communication & Csv
Head of National Honda
Head of Operations Support & Service
Quality
Head of Digital Business
Head of Internal Audit
Head of National Multibrand and
Suzuki
Head of Regional Operation
Head of Corporate Compliance
Head of National Used Motorcycle
Head of Strategic Marketing
Head of Strategic Partnership
Head of Marketing Communication &
Brand Management
Head of Dealer Relationship Management
Head of Product & Marketing Support
Head of National Non Dealer
Channel, Retention & Durable
Head of National Sales Fleet
BOARD OF COMMISSIONERSPresident Commissioners
Sng Seow WahCommissioners, concurently as Independent Commissioners
Djoko SudyatmikoKrisna Wijaya
CommissionersEng Heng Nee Philip
Loh Niap JuanVera Eve Lim
AUDIT COMMITTEEChairman
Krisna WijayaMembers
Richard Steven DompasCristine Tjen
RISK MANAGEMENT COMMITTEEChairman
Eng Heng Nee PhilipMembers
Djoko SudyatmikoVera Eve Lim
NOMINATION AND REMUNERATION COMMITTEE
ChairmanDjoko Sudyatmiko
MembersEng Heng Nee Philip
Sng Seow Wah
CORPORATE GOVERNANCE COMMITTEEChairman
Djoko SudyatmikoMembers
Diyah Sasanti
SYARIAH SUPERVISORY BOARD
ChairmanH. Fathurrahman Djamil
MembersNoor AhmadOni Sahroni
PT Bank Danamon Indonesia, Tbk. 2016 Annual Report 117
Operational Review
Management Discussion & Analysis
Corporate Governance
Corporate Social Responsibility
Corporate Data
Financial Report
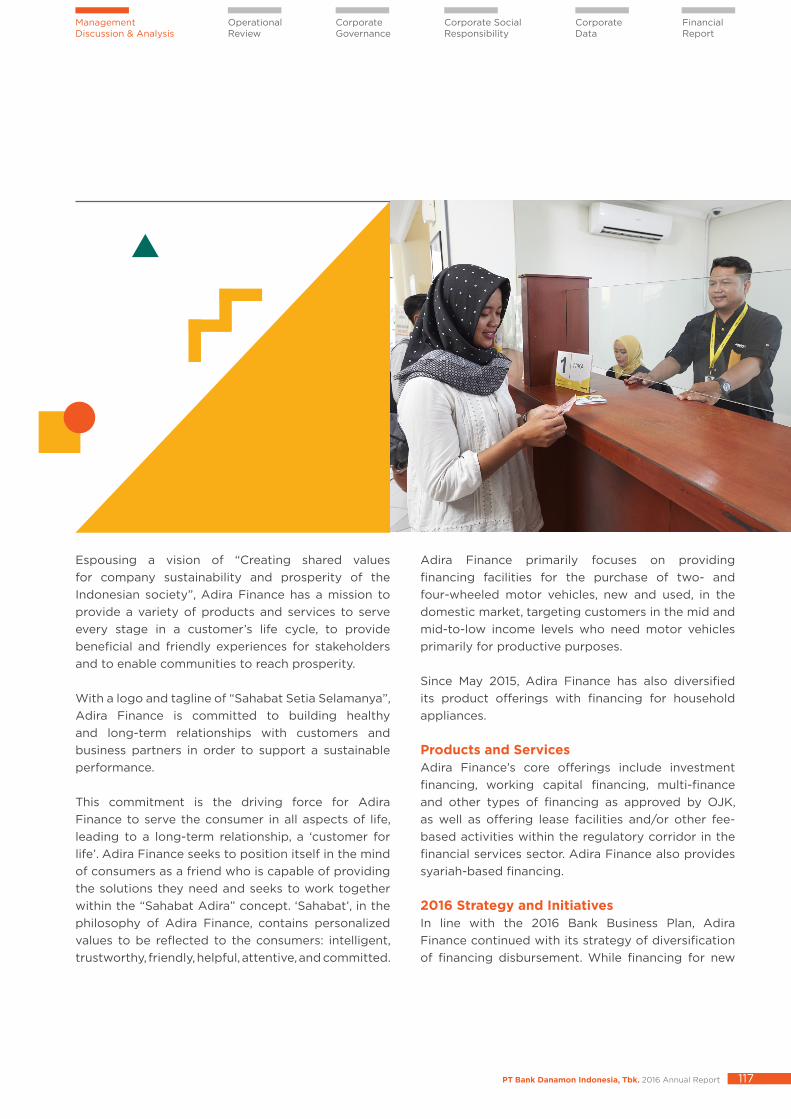
Espousing a vision of “Creating shared values for company sustainability and prosperity of the Indonesian society”, Adira Finance has a mission to provide a variety of products and services to serve every stage in a customer’s life cycle, to provide beneficial and friendly experiences for stakeholders and to enable communities to reach prosperity.
With a logo and tagline of “Sahabat Setia Selamanya”, Adira Finance is committed to building healthy and long-term relationships with customers and business partners in order to support a sustainable performance.
This commitment is the driving force for Adira Finance to serve the consumer in all aspects of life, leading to a long-term relationship, a ‘customer for life’. Adira Finance seeks to position itself in the mind of consumers as a friend who is capable of providing the solutions they need and seeks to work together within the “Sahabat Adira” concept. ‘Sahabat’, in the philosophy of Adira Finance, contains personalized values to be reflected to the consumers: intelligent, trustworthy, friendly, helpful, attentive, and committed.
Adira Finance primarily focuses on providing financing facilities for the purchase of two- and four-wheeled motor vehicles, new and used, in the domestic market, targeting customers in the mid and mid-to-low income levels who need motor vehicles primarily for productive purposes.
Since May 2015, Adira Finance has also diversified its product offerings with financing for household appliances.
Products and ServicesAdira Finance’s core offerings include investment financing, working capital financing, multi-finance and other types of financing as approved by OJK, as well as offering lease facilities and/or other fee-based activities within the regulatory corridor in the financial services sector. Adira Finance also provides syariah-based financing.
2016 Strategy and InitiativesIn line with the 2016 Bank Business Plan, Adira Finance continued with its strategy of diversification of financing disbursement. While financing for new
PT Bank Danamon Indonesia, Tbk. 2016 Annual Report118
Danamon’s Highlights
Management Reports
Company Profile
motor vehicles remains its core business, Adira Finance at the same time has diversified into other financing products, such as financing for used cars or used motorcycles in cooperation with partner automotive dealers. Adira Finance also strives to offer competitive, value-for-money financing by combining financing products with insurance products and financing for household appliances (durables), all while implementing a relatively fast application approval process and enhancing cooperation with principals and distributors.
This diversification of financing strategy is supported with an optimum funding strategy and adequate level of liquidity at all times, ensuring the availability of funds for financing and for operations, as well as for the settlement of maturing bank loans and debt notes.
In addition, Adira Finance strives to maintain a gearing ratio within limits as prescribed by the regulator OJK Regulation No. 29/2014 at a maximum of 10 times equity. Further, Adira Finance also diversified its funding sources, combining joint-financing, bank loans (from domestic as well as overseas banks) and the issuance of bonds and mudharabah bonds in order to secure an optimum funding base.
Adira Finance strives to improve productivity and to manage its operating costs at a healthy level in line with the needs for business growth. Efforts in these areas include the simplification of work processes at various functions within the company, the updating of company policies to reflect developments in the business environment and the utilization of information technology for process automation.
2016 Performance Amidst the slowdown in the domestic market for new automobiles and motorcycles, Adira Finance implemented the above strategies and succeeded in maintaining its performance in 2016 compared
with the previous year. New financing disbursement amounted to Rp30.9 trillion this year, compared with Rp30.5 trillion in 2015. Non-performing financing (including off-balance sheet portion) went down from 1.7% last year to 1.6% in 2016.
Amid heavy competition, Adira Finance managed to maintain its market share for motorcycle financing at 12.3% in 2016, compared to 12.0% in the previous year. For automobile financing, Adira Finance’s market share also remains manageable at 4.5% for the year, compared with 4.9% in 2015.
2017 Strategy Danamon believes that Adira Finance’s current strategies are still relevant to the challenges in 2017. Overall, Adira Finance’s strategy is to improve productivity and efficiency. Adira Finance will continue with initiatives to improve operational efficiency, including through process simplification and investments in Information Technology in line with the current digital era. These efforts are expected to lead to higher productivity levels, better support for financial activities and increased efficiency, ultimately leading to an improved customer experience.
Adira Finance will also continue with financing product diversification. In response to the domestic market slowdown for new automobiles and motorcycles, Adira Finance is creating new opportunities by enlarging the portion of financing for used motor vehicles while assessing new opportunities in financing for durables and multi-purpose products.
To provide optimum services to customers, Adira Finance will also continue with its strategy of building partnerships with third parties. This includes the long-standing cooperation with the Post Office, bank and retail shops such as Alfamart to act as payment points, providing convenient access for around three million active customers to make their installment payments.
PT Bank Danamon Indonesia, Tbk. 2016 Annual Report 119
Operational Review
Management Discussion & Analysis
Corporate Governance
Corporate Social Responsibility
Corporate Data
Financial Report
Increase 10% productivity through technology advantages.
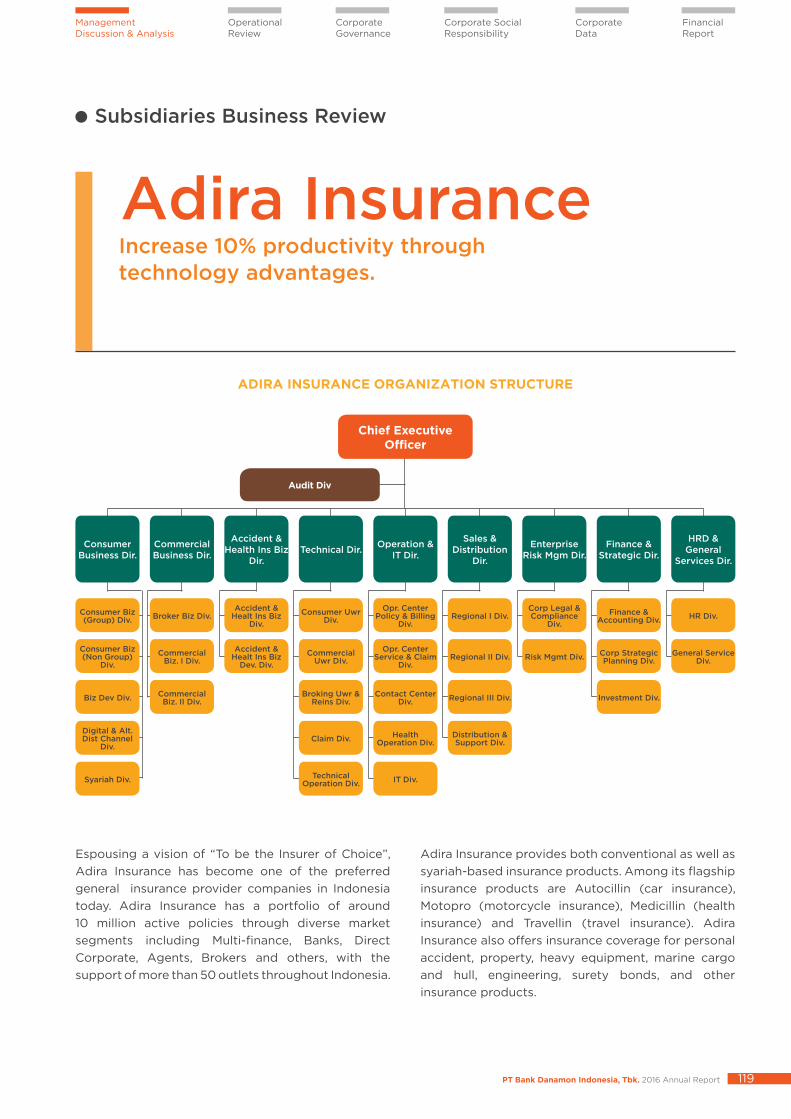
Adira Insurance
Espousing a vision of “To be the Insurer of Choice”, Adira Insurance has become one of the preferred general insurance provider companies in Indonesia today. Adira Insurance has a portfolio of around 10 million active policies through diverse market segments including Multi-finance, Banks, Direct Corporate, Agents, Brokers and others, with the support of more than 50 outlets throughout Indonesia.
Adira Insurance provides both conventional as well as syariah-based insurance products. Among its flagship insurance products are Autocillin (car insurance), Motopro (motorcycle insurance), Medicillin (health insurance) and Travellin (travel insurance). Adira Insurance also offers insurance coverage for personal accident, property, heavy equipment, marine cargo and hull, engineering, surety bonds, and other insurance products.
Subsidiaries Business Review
ADIRA INSURANCE ORGANIZATION STRUCTURE
Audit Div
Chief Executive Officer
ConsumerBusiness Dir.
HRD & General
Services Dir.
Finance & Strategic Dir.
Enterprise Risk Mgm Dir.
Sales & Distribution
Dir.
Operation & IT Dir.Technical Dir.
Accident & Health Ins Biz
Dir.
Commercial Business Dir.
Consumer Biz (Group) Div. Broker Biz Div.
Accident & Healt Ins Biz
Div.Consumer Uwr
Div.Opr. Center
Policy & Billing Div.
Regional I Div.Corp Legal & Compliance
Div.Finance &
Accounting Div. HR Div.
Consumer Biz (Non Group)
Div.Commercial
Biz. I Div.Accident &
Healt Ins Biz Dev. Div.
Commercial Uwr DIv.
Opr. Center Service & Claim
Div.Regional II Div. Risk Mgmt Div. Corp Strategic
Planning Div.General Service
Div.
Biz Dev Div. Commercial Biz. II Div.
Broking Uwr & Reins Div.
Contact Center Div. Regional III Div. Investment Div.
Digital & Alt. Dist Channel
Div.Claim Div. Health
Operation Div.Distribution & Support Div.
Syariah Div. Technical Operation Div. IT Div.
PT Bank Danamon Indonesia, Tbk. 2016 Annual Report120
Danamon’s Highlights
Management Reports
Company Profile
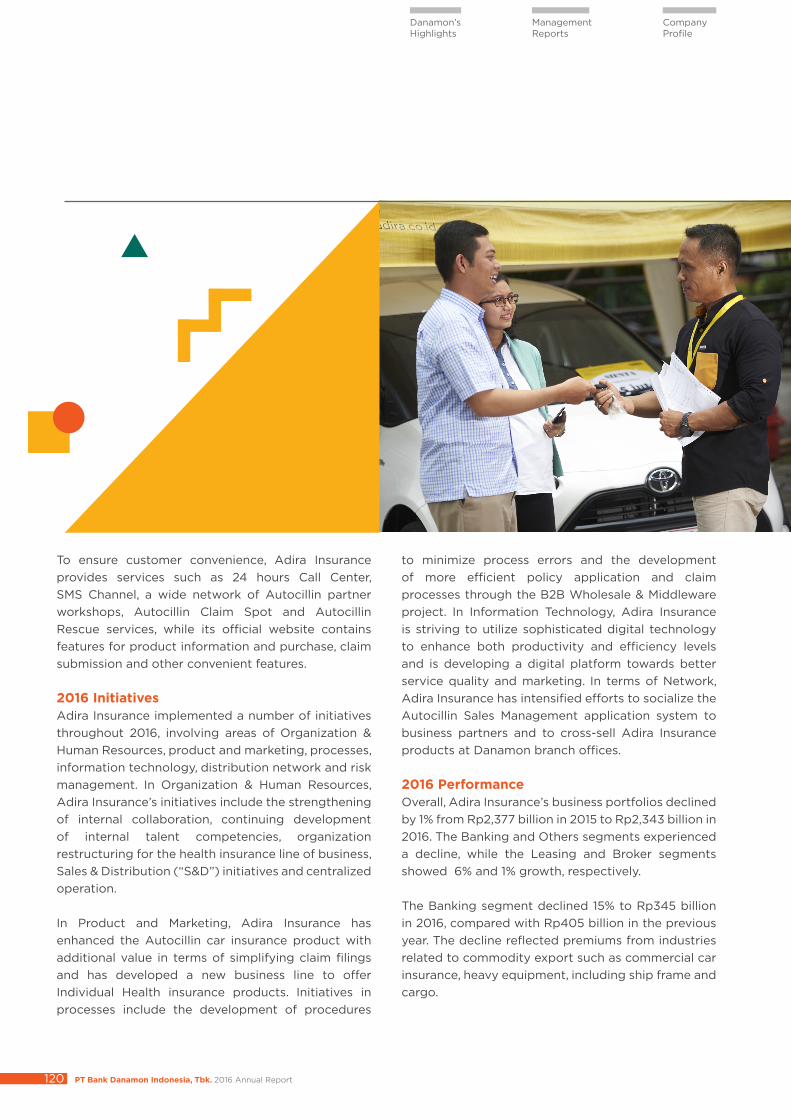
To ensure customer convenience, Adira Insurance provides services such as 24 hours Call Center, SMS Channel, a wide network of Autocillin partner workshops, Autocillin Claim Spot and Autocillin Rescue services, while its official website contains features for product information and purchase, claim submission and other convenient features.
2016 InitiativesAdira Insurance implemented a number of initiatives throughout 2016, involving areas of Organization & Human Resources, product and marketing, processes, information technology, distribution network and risk management. In Organization & Human Resources, Adira Insurance’s initiatives include the strengthening of internal collaboration, continuing development of internal talent competencies, organization restructuring for the health insurance line of business, Sales & Distribution (“S&D”) initiatives and centralized operation.
In Product and Marketing, Adira Insurance has enhanced the Autocillin car insurance product with additional value in terms of simplifying claim filings and has developed a new business line to offer Individual Health insurance products. Initiatives in processes include the development of procedures
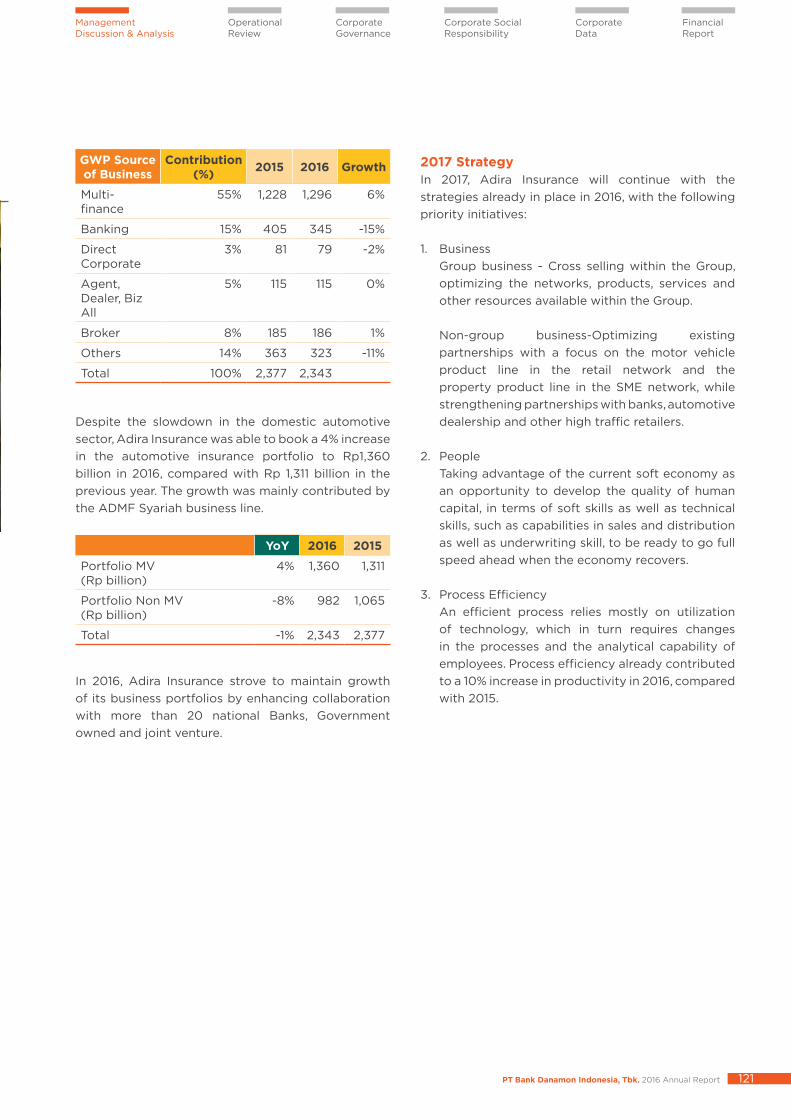
to minimize process errors and the development of more efficient policy application and claim processes through the B2B Wholesale & Middleware project. In Information Technology, Adira Insurance is striving to utilize sophisticated digital technology to enhance both productivity and efficiency levels and is developing a digital platform towards better service quality and marketing. In terms of Network, Adira Insurance has intensified efforts to socialize the Autocillin Sales Management application system to business partners and to cross-sell Adira Insurance products at Danamon branch offices. 2016 PerformanceOverall, Adira Insurance’s business portfolios declined by 1% from Rp2,377 billion in 2015 to Rp2,343 billion in 2016. The Banking and Others segments experienced a decline, while the Leasing and Broker segments showed 6% and 1% growth, respectively.
The Banking segment declined 15% to Rp345 billion in 2016, compared with Rp405 billion in the previous year. The decline reflected premiums from industries related to commodity export such as commercial car insurance, heavy equipment, including ship frame and cargo.
PT Bank Danamon Indonesia, Tbk. 2016 Annual Report 121
Operational Review
Management Discussion & Analysis
Corporate Governance
Corporate Social Responsibility
Corporate Data
Financial Report
GWP Source of Business
Contribution (%) 2015 2016 Growth
Multi-finance
55% 1,228 1,296 6%
Banking 15% 405 345 -15%
Direct Corporate
3% 81 79 -2%
Agent, Dealer, Biz All
5% 115 115 0%
Broker 8% 185 186 1%
Others 14% 363 323 -11%
Total 100% 2,377 2,343
Despite the slowdown in the domestic automotive sector, Adira Insurance was able to book a 4% increase in the automotive insurance portfolio to Rp1,360 billion in 2016, compared with Rp 1,311 billion in the previous year. The growth was mainly contributed by the ADMF Syariah business line.
YoY 2016 2015
Portfolio MV (Rp billion)
4% 1,360 1,311
Portfolio Non MV (Rp billion)
-8% 982 1,065
Total -1% 2,343 2,377
In 2016, Adira Insurance strove to maintain growth of its business portfolios by enhancing collaboration with more than 20 national Banks, Government owned and joint venture.
2017 StrategyIn 2017, Adira Insurance will continue with the strategies already in place in 2016, with the following priority initiatives: 1. Business Group business - Cross selling within the Group,
optimizing the networks, products, services and other resources available within the Group.
Non-group business-Optimizing existing
partnerships with a focus on the motor vehicle product line in the retail network and the property product line in the SME network, while strengthening partnerships with banks, automotive dealership and other high traffic retailers.
2. People Taking advantage of the current soft economy as
an opportunity to develop the quality of human capital, in terms of soft skills as well as technical skills, such as capabilities in sales and distribution as well as underwriting skill, to be ready to go full speed ahead when the economy recovers.
3. Process Efficiency An efficient process relies mostly on utilization
of technology, which in turn requires changes in the processes and the analytical capability of employees. Process efficiency already contributed to a 10% increase in productivity in 2016, compared with 2015.
PT Bank Danamon Indonesia, Tbk. 2016 Annual Report122
Danamon’s Highlights
Management Reports
Company Profile
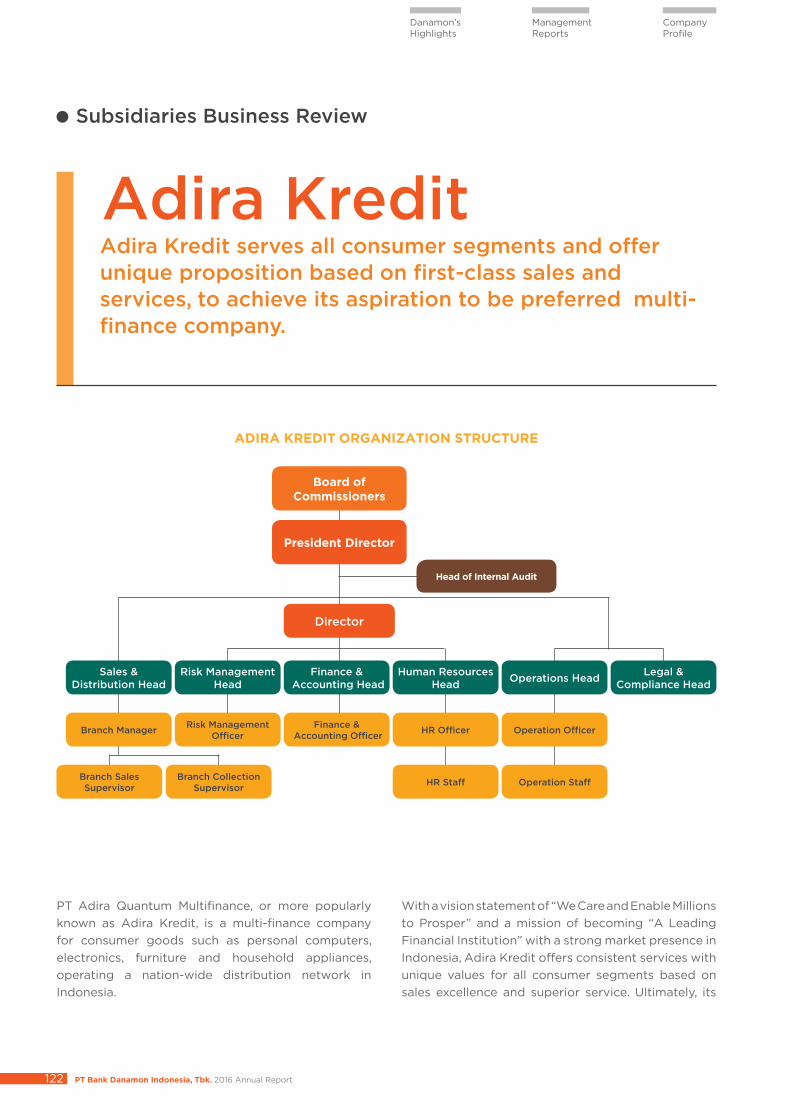
Adira Kredit serves all consumer segments and offer unique proposition based on first-class sales and services, to achieve its aspiration to be preferred multi-finance company.
Adira Kredit
PT Adira Quantum Multifinance, or more popularly known as Adira Kredit, is a multi-finance company for consumer goods such as personal computers, electronics, furniture and household appliances, operating a nation-wide distribution network in Indonesia.
With a vision statement of “We Care and Enable Millions to Prosper” and a mission of becoming “A Leading Financial Institution” with a strong market presence in Indonesia, Adira Kredit offers consistent services with unique values for all consumer segments based on sales excellence and superior service. Ultimately, its
Subsidiaries Business Review
ADIRA KREDIT ORGANIZATION STRUCTURE
Human Resources Head
Legal & Compliance Head
Head of Internal Audit
Board of Commissioners
President Director
Director
Risk Management Head
Risk Management Officer
Finance & Accounting Head
Finance & Accounting Officer
Sales & Distribution Head
Branch Manager
Branch Sales Supervisor
Branch Collection Supervisor
Operations Head
Operation OfficerHR Officer
Operation StaffHR Staff
PT Bank Danamon Indonesia, Tbk. 2016 Annual Report 123
Operational Review
Management Discussion & Analysis
Corporate Governance
Corporate Social Responsibility
Corporate Data
Financial Report
aspiration is to become a leading financial institution and the preferred employer, winning the respect of borrowers, employees, shareholders, regulators and the various communities that Adira Kredit operates. In operation since March 23, 2003, Adira Kredit has a commitment to provide quality services to customers, improving financial performance and generating added value for all stakeholders.
Products and ServicesAdira Kredit offers financing for the purchase of consumer goods such as electronics, PCs and tablet PCs, furniture, smartphones and other household appliances. Adira Kredit provides the alternative solution to purchase products on installment, so that the consumer may immediately enjoy the benefits of the product while having a flexible payment scheme.
2016 Strategy and InitiativesIn line with the Bank Business Plan, Adira Kredit’s strategy in 2016 included initiatives such as continuing with a limited operations strategy, development of joint-financing schemes with Adira Finance, efficiency measures in terms of workforce and physical assets,
implementation of collection and payment receipt activities through Adira Kredit outlets and existing payment points, as well as implementation of customer service activities including the handling of customer complaints and request for information on the amounts and due dates of installment payments.
The strategy for consumer financing expansion uses a merchant-based approach with specially-tailored marketing programs for a number of key merchants, while also focusing on communities of consumers and existing customers. 2016 PerformanceWith a prudent financing strategy, new financing disbursements through the joint-financing scheme amounted to Rp232 billion in 2016, while the NPL ratio was around 4.0% in this year.
2017 StrategyIn 2017, Adira Kredit will continue with its limited operational strategy through efficiency measures to achieve optimal financial performance.
PT Bank Danamon Indonesia, Tbk. 2016 Annual Report124
Danamon’s Highlights
Management Reports
Company Profile
Financial Review
Danamon was able to improve net profit after taxes due to improvements in cost of funds, lower operating expenses and cost of credit.
COMPREHENSIVE INCOME
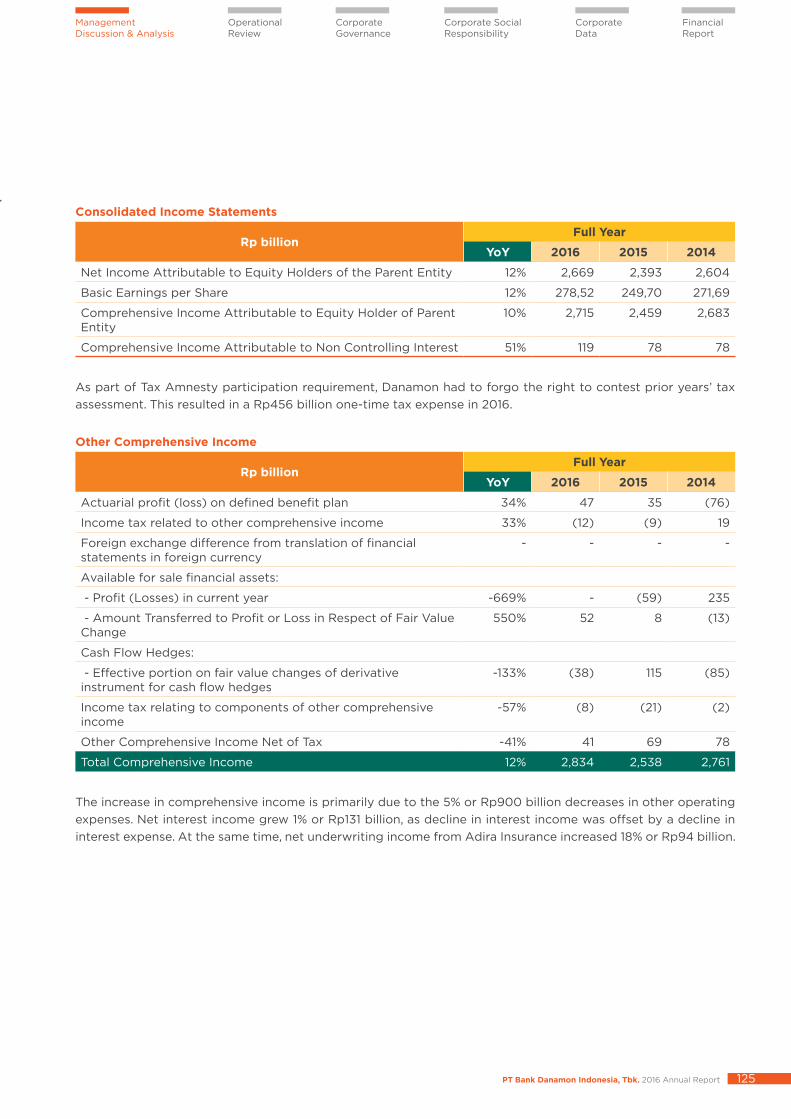
Profit and Loss In 2016, comprehensive income was recorded at Rp2.83 trillion, an increase compared to the comprehensive income of the last two years, which were Rp2.54 trillion and Rp2.76 trillion for 2015 and 2014, respectively. Likewise, the 2016 net profit increased to Rp2.67 trillion compared to the net profit of the last two years of Rp2.39 trillion and Rp2.60 trillion in 2015 and 2014, respectively.
Consolidated Income Statements
Rp billionFull Year
YoY 2016 2015 2014
Net Interest Income 1% 13,779 13,648 13,680
Net Underwriting Income 18% 621 527 427
Net Interest Income and Net Underwriting Income 2% 14,400 14,175 14,107
Other Operating Income 0% 4,071 4,081 4,336
Other Operating Expense -5% 13,537 14,437 14,380
Net Operating Income 25% 4,934 3,819 4,063
Non Operational Expense – Net -18% 541 662 510
Income Before Tax 34% 4,393 3,281 3,553
Income Tax Expenses 97% 1,600 812 870
Income After Income Tax Expense 13% 2,793 2,469 2,683
Net Income Attributable to Non-Controlling Interest 63% 123 76 79
PT Bank Danamon Indonesia, Tbk. 2016 Annual Report 125
Operational Review
Management Discussion & Analysis
Corporate Governance
Corporate Social Responsibility
Corporate Data
Financial Report
Consolidated Income Statements
Rp billionFull Year
YoY 2016 2015 2014
Net Income Attributable to Equity Holders of the Parent Entity 12% 2,669 2,393 2,604
Basic Earnings per Share 12% 278,52 249,70 271,69
Comprehensive Income Attributable to Equity Holder of Parent Entity
10% 2,715 2,459 2,683
Comprehensive Income Attributable to Non Controlling Interest 51% 119 78 78
As part of Tax Amnesty participation requirement, Danamon had to forgo the right to contest prior years’ tax assessment. This resulted in a Rp456 billion one-time tax expense in 2016.
Other Comprehensive Income
Rp billionFull Year
YoY 2016 2015 2014
Actuarial profit (loss) on defined benefit plan 34% 47 35 (76)
Income tax related to other comprehensive income 33% (12) (9) 19
Foreign exchange difference from translation of financial statements in foreign currency
- - - -
Available for sale financial assets:
- Profit (Losses) in current year -669% - (59) 235
- Amount Transferred to Profit or Loss in Respect of Fair Value Change
550% 52 8 (13)
Cash Flow Hedges:
- Effective portion on fair value changes of derivative instrument for cash flow hedges
-133% (38) 115 (85)
Income tax relating to components of other comprehensive income
-57% (8) (21) (2)
Other Comprehensive Income Net of Tax -41% 41 69 78
Total Comprehensive Income 12% 2,834 2,538 2,761
The increase in comprehensive income is primarily due to the 5% or Rp900 billion decreases in other operating expenses. Net interest income grew 1% or Rp131 billion, as decline in interest income was offset by a decline in interest expense. At the same time, net underwriting income from Adira Insurance increased 18% or Rp94 billion.
PT Bank Danamon Indonesia, Tbk. 2016 Annual Report126
Danamon’s Highlights
Management Reports
Company Profile
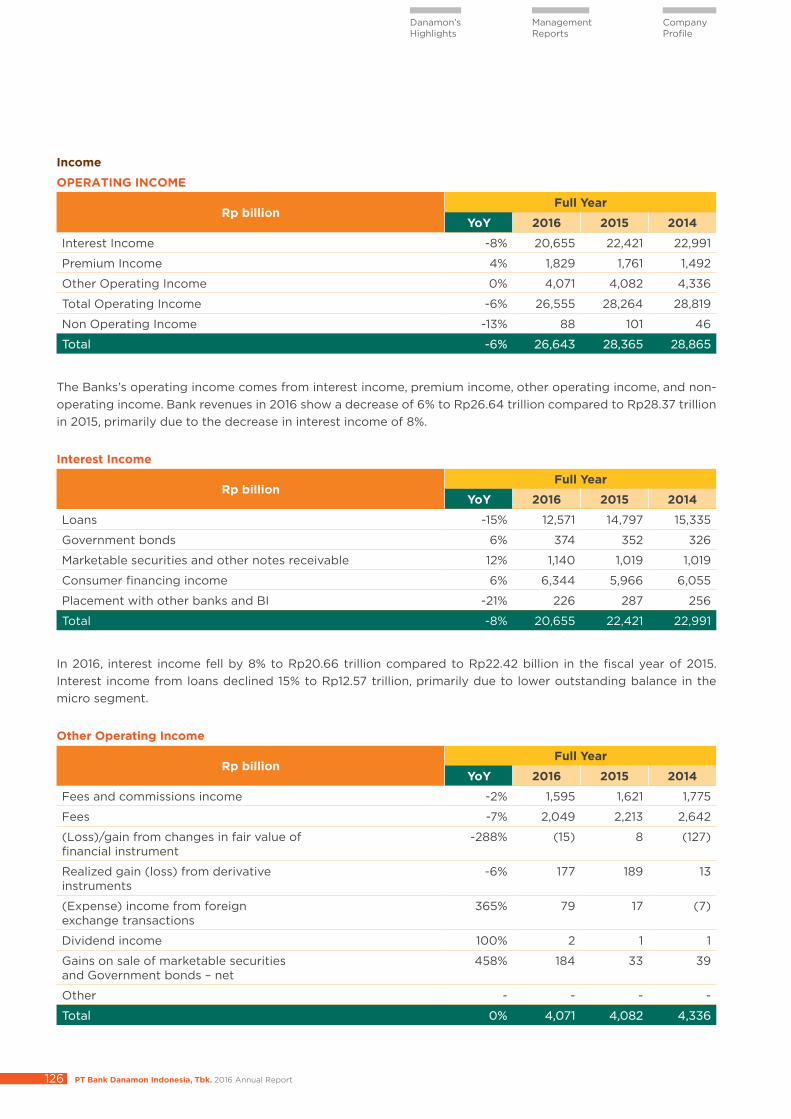
Income
OPERATING INCOME
Rp billionFull Year
YoY 2016 2015 2014
Interest Income -8% 20,655 22,421 22,991
Premium Income 4% 1,829 1,761 1,492
Other Operating Income 0% 4,071 4,082 4,336
Total Operating Income -6% 26,555 28,264 28,819
Non Operating Income -13% 88 101 46
Total -6% 26,643 28,365 28,865
The Banks’s operating income comes from interest income, premium income, other operating income, and non-operating income. Bank revenues in 2016 show a decrease of 6% to Rp26.64 trillion compared to Rp28.37 trillion in 2015, primarily due to the decrease in interest income of 8%.
Interest Income
Rp billionFull Year
YoY 2016 2015 2014
Loans -15% 12,571 14,797 15,335
Government bonds 6% 374 352 326
Marketable securities and other notes receivable 12% 1,140 1,019 1,019
Consumer financing income 6% 6,344 5,966 6,055
Placement with other banks and BI -21% 226 287 256
Total -8% 20,655 22,421 22,991
In 2016, interest income fell by 8% to Rp20.66 trillion compared to Rp22.42 billion in the fiscal year of 2015. Interest income from loans declined 15% to Rp12.57 trillion, primarily due to lower outstanding balance in the micro segment.
Other Operating Income
Rp billionFull Year
YoY 2016 2015 2014
Fees and commissions income -2% 1,595 1,621 1,775
Fees -7% 2,049 2,213 2,642
(Loss)/gain from changes in fair value offinancial instrument
-288% (15) 8 (127)
Realized gain (loss) from derivativeinstruments
-6% 177 189 13
(Expense) income from foreignexchange transactions
365% 79 17 (7)
Dividend income 100% 2 1 1
Gains on sale of marketable securitiesand Government bonds – net
458% 184 33 39
Other - - - -
Total 0% 4,071 4,082 4,336
PT Bank Danamon Indonesia, Tbk. 2016 Annual Report 127
Operational Review
Management Discussion & Analysis
Corporate Governance
Corporate Social Responsibility
Corporate Data
Financial Report
Other operating income was relatively stable at Rp4.07 trillion in 2016 compared to Rp4.08 trillion in 2015. Service fee components experienced a decrease of 7%, or Rp164 billion, compared to the previous year, but was compensated by the increase in gain on sale of securities and net government bonds of Rp151 billion.
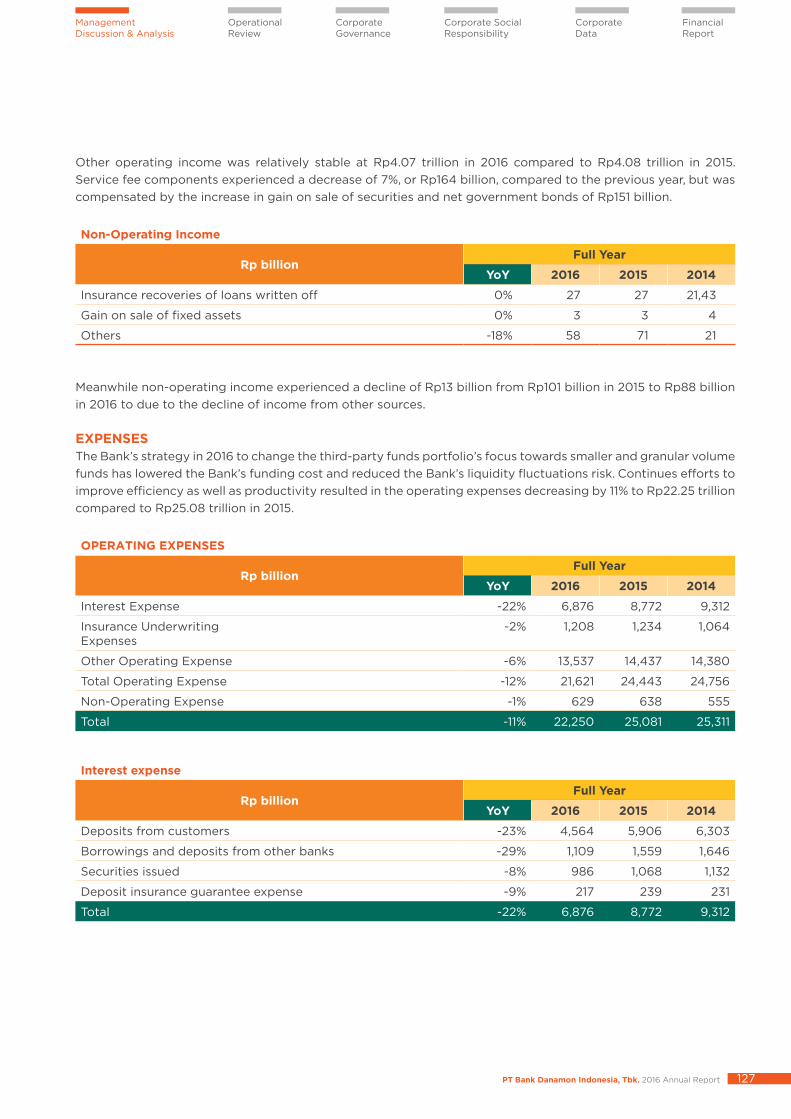
Non-Operating Income
Rp billionFull Year
YoY 2016 2015 2014
Insurance recoveries of loans written off 0% 27 27 21,43
Gain on sale of fixed assets 0% 3 3 4
Others -18% 58 71 21
Meanwhile non-operating income experienced a decline of Rp13 billion from Rp101 billion in 2015 to Rp88 billion in 2016 to due to the decline of income from other sources.
EXPENSESThe Bank’s strategy in 2016 to change the third-party funds portfolio’s focus towards smaller and granular volume funds has lowered the Bank’s funding cost and reduced the Bank’s liquidity fluctuations risk. Continues efforts to improve efficiency as well as productivity resulted in the operating expenses decreasing by 11% to Rp22.25 trillion compared to Rp25.08 trillion in 2015.
OPERATING EXPENSES
Rp billionFull Year
YoY 2016 2015 2014
Interest Expense -22% 6,876 8,772 9,312
Insurance UnderwritingExpenses
-2% 1,208 1,234 1,064
Other Operating Expense -6% 13,537 14,437 14,380
Total Operating Expense -12% 21,621 24,443 24,756
Non-Operating Expense -1% 629 638 555
Total -11% 22,250 25,081 25,311
Interest expense
Rp billionFull Year
YoY 2016 2015 2014
Deposits from customers -23% 4,564 5,906 6,303
Borrowings and deposits from other banks -29% 1,109 1,559 1,646
Securities issued -8% 986 1,068 1,132
Deposit insurance guarantee expense -9% 217 239 231
Total -22% 6,876 8,772 9,312
PT Bank Danamon Indonesia, Tbk. 2016 Annual Report128
Danamon’s Highlights
Management Reports
Company Profile
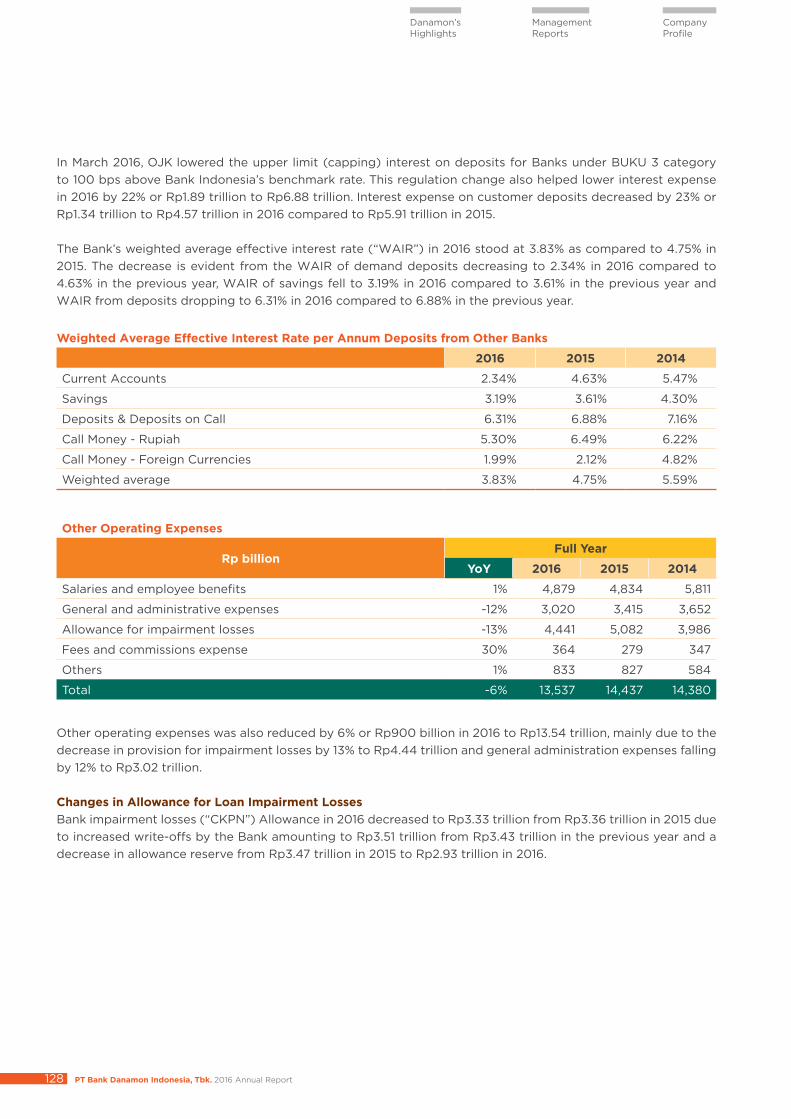
In March 2016, OJK lowered the upper limit (capping) interest on deposits for Banks under BUKU 3 category to 100 bps above Bank Indonesia’s benchmark rate. This regulation change also helped lower interest expense in 2016 by 22% or Rp1.89 trillion to Rp6.88 trillion. Interest expense on customer deposits decreased by 23% or Rp1.34 trillion to Rp4.57 trillion in 2016 compared to Rp5.91 trillion in 2015.
The Bank’s weighted average effective interest rate (“WAIR”) in 2016 stood at 3.83% as compared to 4.75% in 2015. The decrease is evident from the WAIR of demand deposits decreasing to 2.34% in 2016 compared to 4.63% in the previous year, WAIR of savings fell to 3.19% in 2016 compared to 3.61% in the previous year and WAIR from deposits dropping to 6.31% in 2016 compared to 6.88% in the previous year.
Weighted Average Effective Interest Rate per Annum Deposits from Other Banks
2016 2015 2014
Current Accounts 2.34% 4.63% 5.47%
Savings 3.19% 3.61% 4.30%
Deposits & Deposits on Call 6.31% 6.88% 7.16%
Call Money - Rupiah 5.30% 6.49% 6.22%
Call Money - Foreign Currencies 1.99% 2.12% 4.82%
Weighted average 3.83% 4.75% 5.59%
Other Operating Expenses
Rp billionFull Year
YoY 2016 2015 2014
Salaries and employee benefits 1% 4,879 4,834 5,811
General and administrative expenses -12% 3,020 3,415 3,652
Allowance for impairment losses -13% 4,441 5,082 3,986
Fees and commissions expense 30% 364 279 347
Others 1% 833 827 584
Total -6% 13,537 14,437 14,380
Other operating expenses was also reduced by 6% or Rp900 billion in 2016 to Rp13.54 trillion, mainly due to the decrease in provision for impairment losses by 13% to Rp4.44 trillion and general administration expenses falling by 12% to Rp3.02 trillion.
Changes in Allowance for Loan Impairment Losses Bank impairment losses (“CKPN”) Allowance in 2016 decreased to Rp3.33 trillion from Rp3.36 trillion in 2015 due to increased write-offs by the Bank amounting to Rp3.51 trillion from Rp3.43 trillion in the previous year and a decrease in allowance reserve from Rp3.47 trillion in 2015 to Rp2.93 trillion in 2016.
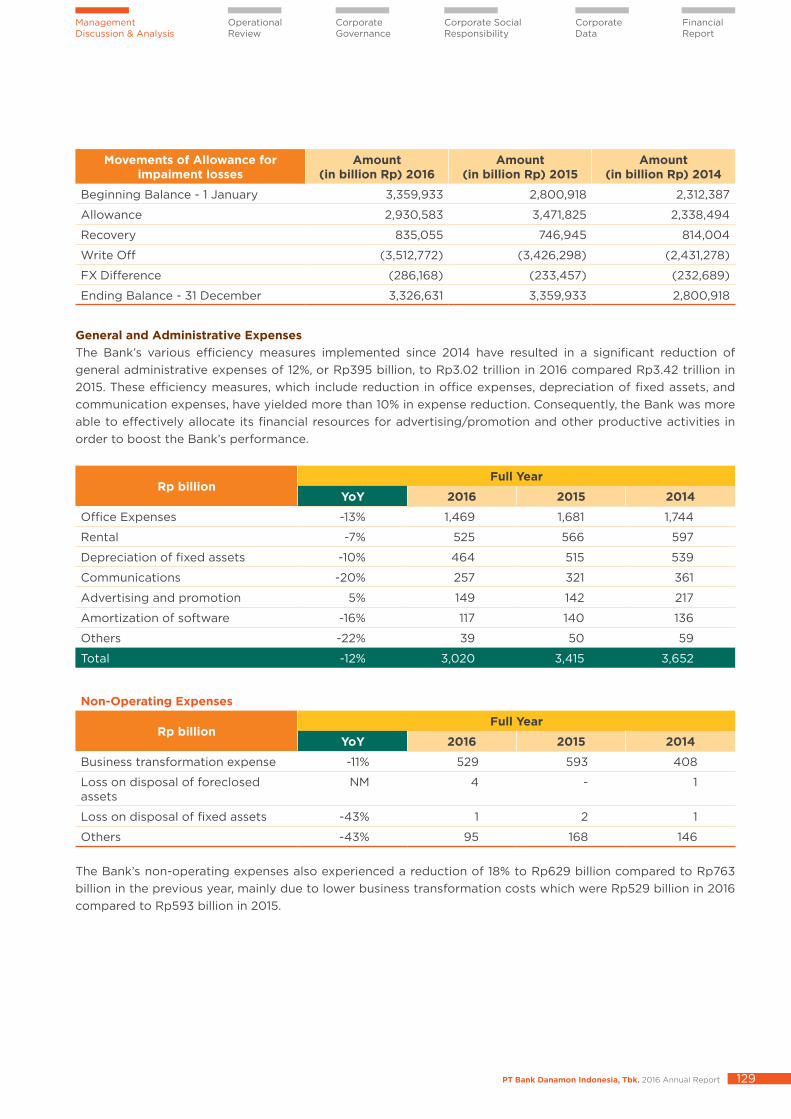
PT Bank Danamon Indonesia, Tbk. 2016 Annual Report 129
Operational Review
Management Discussion & Analysis
Corporate Governance
Corporate Social Responsibility
Corporate Data
Financial Report
Movements of Allowance for impaiment losses
Amount (in billion Rp) 2016
Amount (in billion Rp) 2015
Amount (in billion Rp) 2014
Beginning Balance - 1 January 3,359,933 2,800,918 2,312,387
Allowance 2,930,583 3,471,825 2,338,494
Recovery 835,055 746,945 814,004
Write Off (3,512,772) (3,426,298) (2,431,278)
FX Difference (286,168) (233,457) (232,689)
Ending Balance - 31 December 3,326,631 3,359,933 2,800,918
General and Administrative Expenses The Bank’s various efficiency measures implemented since 2014 have resulted in a significant reduction of general administrative expenses of 12%, or Rp395 billion, to Rp3.02 trillion in 2016 compared Rp3.42 trillion in 2015. These efficiency measures, which include reduction in office expenses, depreciation of fixed assets, and communication expenses, have yielded more than 10% in expense reduction. Consequently, the Bank was more able to effectively allocate its financial resources for advertising/promotion and other productive activities in order to boost the Bank’s performance.
Rp billionFull Year
YoY 2016 2015 2014
Office Expenses -13% 1,469 1,681 1,744
Rental -7% 525 566 597
Depreciation of fixed assets -10% 464 515 539
Communications -20% 257 321 361
Advertising and promotion 5% 149 142 217
Amortization of software -16% 117 140 136
Others -22% 39 50 59
Total -12% 3,020 3,415 3,652
Non-Operating Expenses
Rp billionFull Year
YoY 2016 2015 2014
Business transformation expense -11% 529 593 408
Loss on disposal of foreclosed assets
NM 4 - 1
Loss on disposal of fixed assets -43% 1 2 1
Others -43% 95 168 146
The Bank’s non-operating expenses also experienced a reduction of 18% to Rp629 billion compared to Rp763 billion in the previous year, mainly due to lower business transformation costs which were Rp529 billion in 2016 compared to Rp593 billion in 2015.
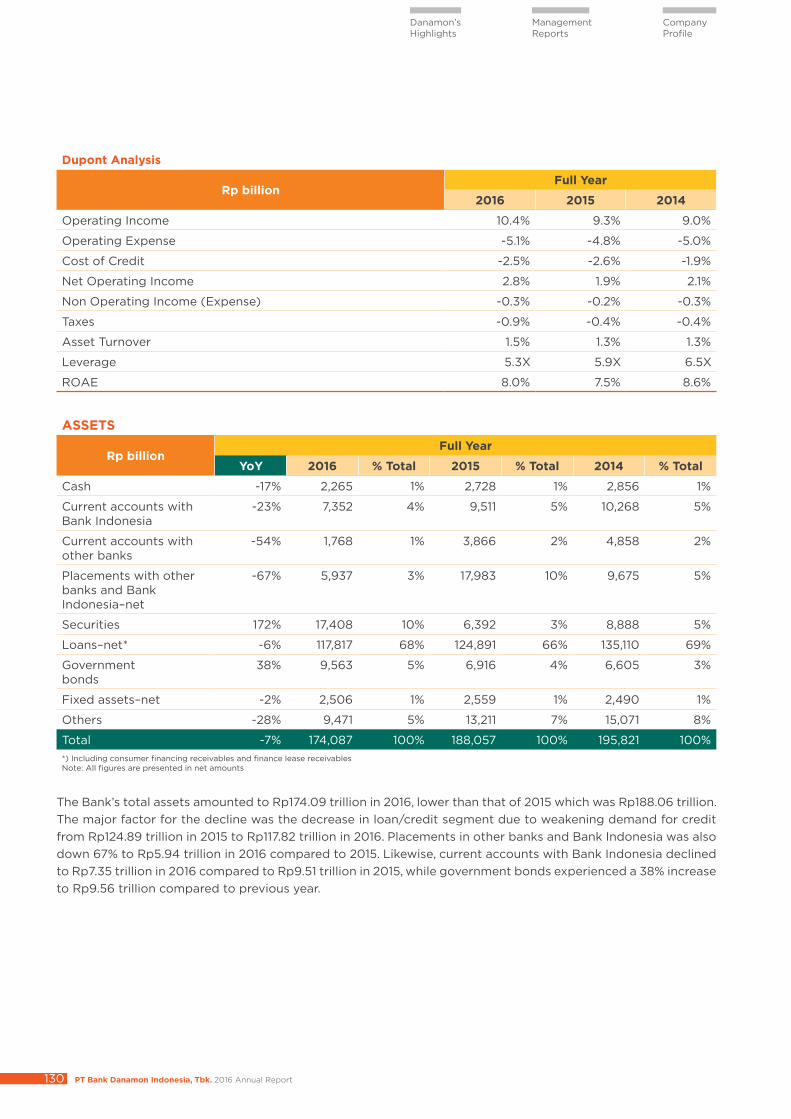
PT Bank Danamon Indonesia, Tbk. 2016 Annual Report130
Danamon’s Highlights
Management Reports
Company Profile
Dupont Analysis
Rp billionFull Year
2016 2015 2014
Operating Income 10.4% 9.3% 9.0%
Operating Expense -5.1% -4.8% -5.0%
Cost of Credit -2.5% -2.6% -1.9%
Net Operating Income 2.8% 1.9% 2.1%
Non Operating Income (Expense) -0.3% -0.2% -0.3%
Taxes -0.9% -0.4% -0.4%
Asset Turnover 1.5% 1.3% 1.3%
Leverage 5.3X 5.9X 6.5X
ROAE 8.0% 7.5% 8.6%
ASSETS
Rp billionFull Year
YoY 2016 % Total 2015 % Total 2014 % Total
Cash -17% 2,265 1% 2,728 1% 2,856 1%
Current accounts withBank Indonesia
-23% 7,352 4% 9,511 5% 10,268 5%
Current accounts withother banks
-54% 1,768 1% 3,866 2% 4,858 2%
Placements with otherbanks and Bank Indonesia–net
-67% 5,937 3% 17,983 10% 9,675 5%
Securities 172% 17,408 10% 6,392 3% 8,888 5%
Loans–net* -6% 117,817 68% 124,891 66% 135,110 69%
Governmentbonds
38% 9,563 5% 6,916 4% 6,605 3%
Fixed assets–net -2% 2,506 1% 2,559 1% 2,490 1%
Others -28% 9,471 5% 13,211 7% 15,071 8%
Total -7% 174,087 100% 188,057 100% 195,821 100%*) Including consumer financing receivables and finance lease receivablesNote: All figures are presented in net amounts
The Bank’s total assets amounted to Rp174.09 trillion in 2016, lower than that of 2015 which was Rp188.06 trillion. The major factor for the decline was the decrease in loan/credit segment due to weakening demand for credit from Rp124.89 trillion in 2015 to Rp117.82 trillion in 2016. Placements in other banks and Bank Indonesia was also down 67% to Rp5.94 trillion in 2016 compared to 2015. Likewise, current accounts with Bank Indonesia declined to Rp7.35 trillion in 2016 compared to Rp9.51 trillion in 2015, while government bonds experienced a 38% increase to Rp9.56 trillion compared to previous year.
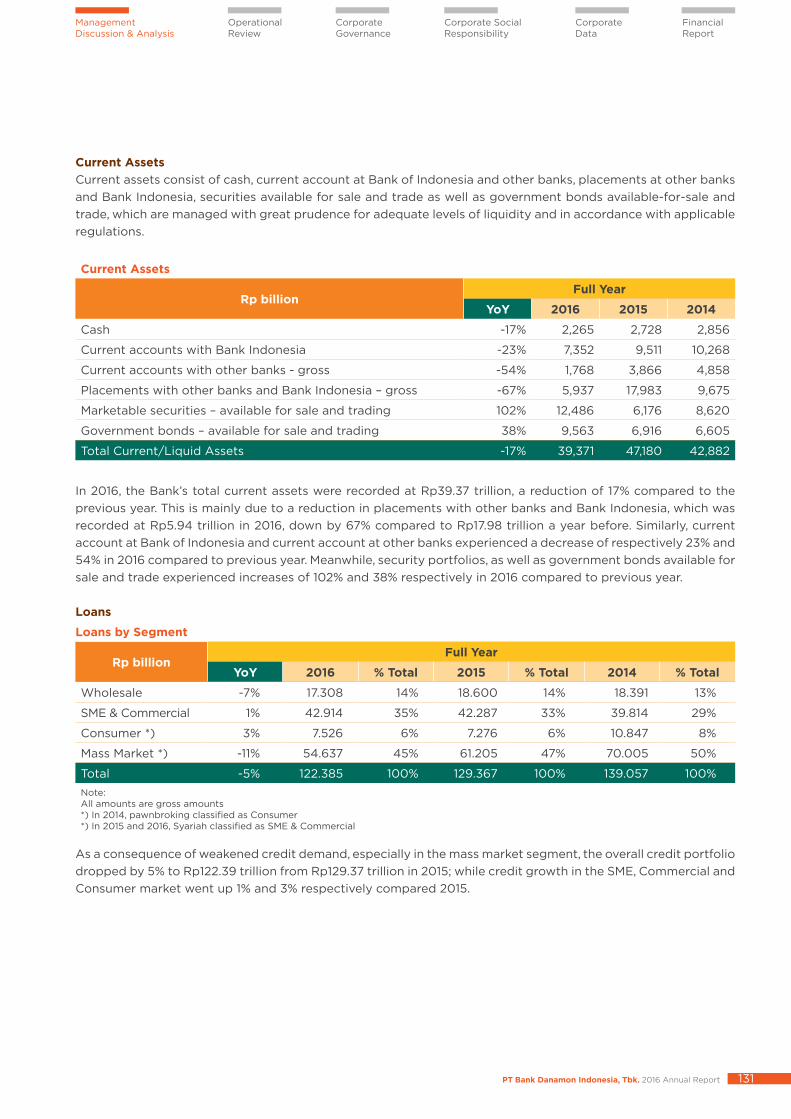
PT Bank Danamon Indonesia, Tbk. 2016 Annual Report 131
Operational Review
Management Discussion & Analysis
Corporate Governance
Corporate Social Responsibility
Corporate Data
Financial Report
Current Assets Current assets consist of cash, current account at Bank of Indonesia and other banks, placements at other banks and Bank Indonesia, securities available for sale and trade as well as government bonds available-for-sale and trade, which are managed with great prudence for adequate levels of liquidity and in accordance with applicable regulations.
Current Assets
Rp billionFull Year
YoY 2016 2015 2014
Cash -17% 2,265 2,728 2,856
Current accounts with Bank Indonesia -23% 7,352 9,511 10,268
Current accounts with other banks - gross -54% 1,768 3,866 4,858
Placements with other banks and Bank Indonesia – gross -67% 5,937 17,983 9,675
Marketable securities – available for sale and trading 102% 12,486 6,176 8,620
Government bonds – available for sale and trading 38% 9,563 6,916 6,605
Total Current/Liquid Assets -17% 39,371 47,180 42,882
In 2016, the Bank’s total current assets were recorded at Rp39.37 trillion, a reduction of 17% compared to the previous year. This is mainly due to a reduction in placements with other banks and Bank Indonesia, which was recorded at Rp5.94 trillion in 2016, down by 67% compared to Rp17.98 trillion a year before. Similarly, current account at Bank of Indonesia and current account at other banks experienced a decrease of respectively 23% and 54% in 2016 compared to previous year. Meanwhile, security portfolios, as well as government bonds available for sale and trade experienced increases of 102% and 38% respectively in 2016 compared to previous year.
Loans
Loans by Segment
Rp billionFull Year
YoY 2016 % Total 2015 % Total 2014 % Total
Wholesale -7% 17.308 14% 18.600 14% 18.391 13%
SME & Commercial 1% 42.914 35% 42.287 33% 39.814 29%
Consumer *) 3% 7.526 6% 7.276 6% 10.847 8%
Mass Market *) -11% 54.637 45% 61.205 47% 70.005 50%
Total -5% 122.385 100% 129.367 100% 139.057 100%Note: All amounts are gross amounts*) In 2014, pawnbroking classified as Consumer*) In 2015 and 2016, Syariah classified as SME & Commercial
As a consequence of weakened credit demand, especially in the mass market segment, the overall credit portfolio dropped by 5% to Rp122.39 trillion from Rp129.37 trillion in 2015; while credit growth in the SME, Commercial and Consumer market went up 1% and 3% respectively compared 2015.
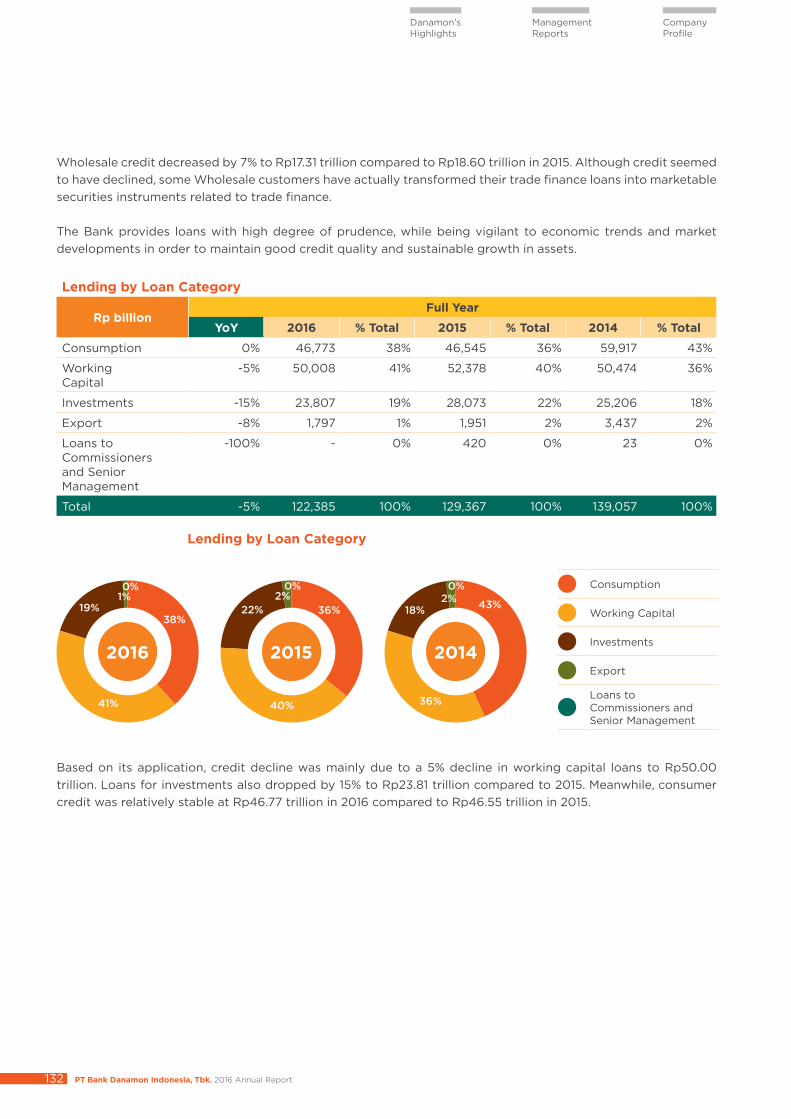
PT Bank Danamon Indonesia, Tbk. 2016 Annual Report132
Danamon’s Highlights
Management Reports
Company Profile
Wholesale credit decreased by 7% to Rp17.31 trillion compared to Rp18.60 trillion in 2015. Although credit seemed to have declined, some Wholesale customers have actually transformed their trade finance loans into marketable securities instruments related to trade finance.
The Bank provides loans with high degree of prudence, while being vigilant to economic trends and market developments in order to maintain good credit quality and sustainable growth in assets.
Lending by Loan Category
Rp billionFull Year
YoY 2016 % Total 2015 % Total 2014 % Total
Consumption 0% 46,773 38% 46,545 36% 59,917 43%
WorkingCapital
-5% 50,008 41% 52,378 40% 50,474 36%
Investments -15% 23,807 19% 28,073 22% 25,206 18%
Export -8% 1,797 1% 1,951 2% 3,437 2%
Loans toCommissionersand SeniorManagement
-100% - 0% 420 0% 23 0%
Total -5% 122,385 100% 129,367 100% 139,057 100%
2016 2015 2014
Lending by Loan Category
Consumption
Working Capital
Investments
Export
Loans to Commissioners and Senior Management
38%
41%
19% 36% 43%
40% 36%
22% 18%1% 2% 2%0% 0% 0%
Based on its application, credit decline was mainly due to a 5% decline in working capital loans to Rp50.00 trillion. Loans for investments also dropped by 15% to Rp23.81 trillion compared to 2015. Meanwhile, consumer credit was relatively stable at Rp46.77 trillion in 2016 compared to Rp46.55 trillion in 2015.
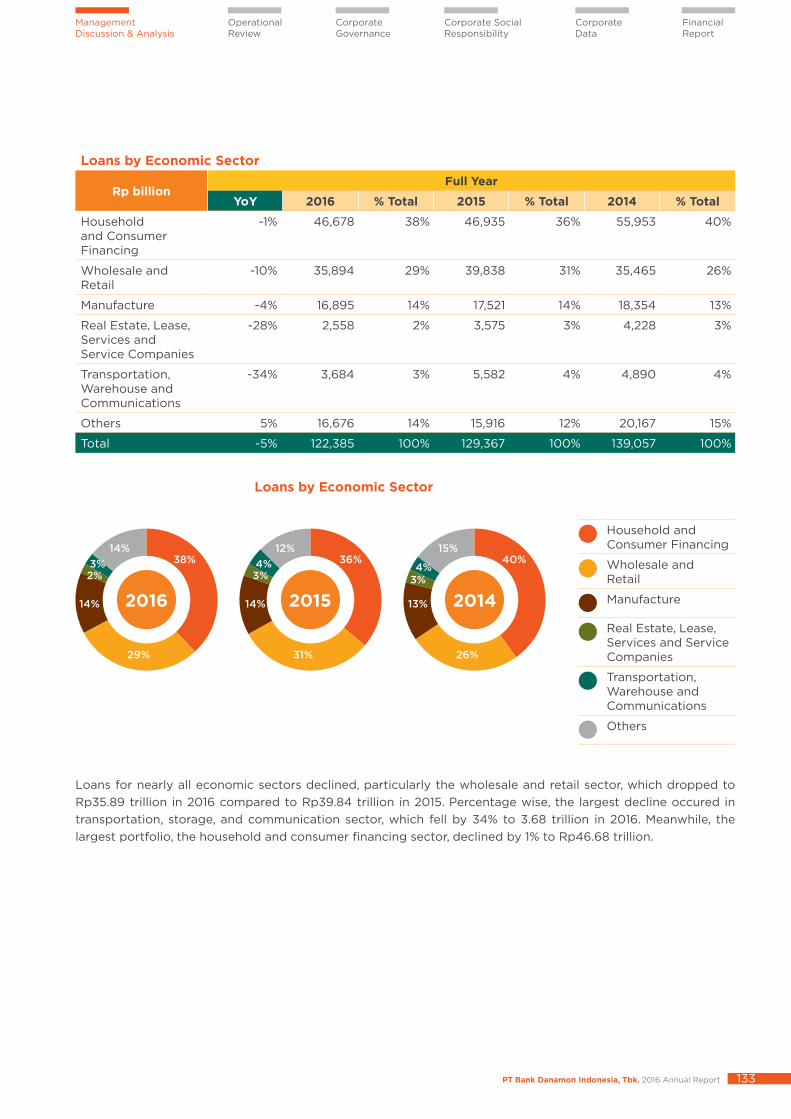
PT Bank Danamon Indonesia, Tbk. 2016 Annual Report 133
Operational Review
Management Discussion & Analysis
Corporate Governance
Corporate Social Responsibility
Corporate Data
Financial Report
Loans by Economic Sector
Rp billionFull Year
YoY 2016 % Total 2015 % Total 2014 % Total
Household and Consumer Financing
-1% 46,678 38% 46,935 36% 55,953 40%
Wholesale and Retail
-10% 35,894 29% 39,838 31% 35,465 26%
Manufacture -4% 16,895 14% 17,521 14% 18,354 13%
Real Estate, Lease, Services and Service Companies
-28% 2,558 2% 3,575 3% 4,228 3%
Transportation,Warehouse andCommunications
-34% 3,684 3% 5,582 4% 4,890 4%
Others 5% 16,676 14% 15,916 12% 20,167 15%
Total -5% 122,385 100% 129,367 100% 139,057 100%
Loans by Economic Sector
Household and Consumer Financing
Wholesale and Retail
Manufacture
Real Estate, Lease, Services and Service Companies
Transportation,Warehouse andCommunications
Others
2016 2015 2014
38% 36% 40%
29% 31% 26%
14% 14% 13%
2% 3% 3%3% 4% 4%
14% 12% 15%
Loans for nearly all economic sectors declined, particularly the wholesale and retail sector, which dropped to Rp35.89 trillion in 2016 compared to Rp39.84 trillion in 2015. Percentage wise, the largest decline occured in transportation, storage, and communication sector, which fell by 34% to 3.68 trillion in 2016. Meanwhile, the largest portfolio, the household and consumer financing sector, declined by 1% to Rp46.68 trillion.
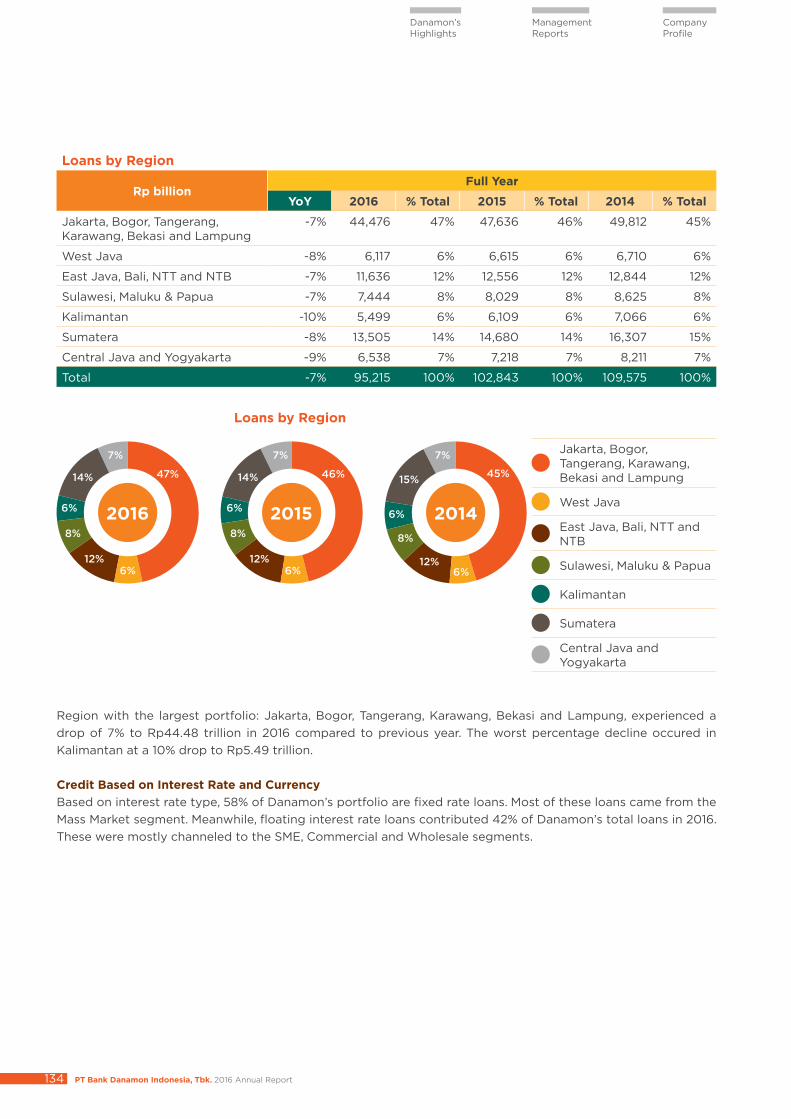
PT Bank Danamon Indonesia, Tbk. 2016 Annual Report134
Danamon’s Highlights
Management Reports
Company Profile
Loans by Region
Rp billionFull Year
YoY 2016 % Total 2015 % Total 2014 % Total
Jakarta, Bogor, Tangerang, Karawang, Bekasi and Lampung
-7% 44,476 47% 47,636 46% 49,812 45%
West Java -8% 6,117 6% 6,615 6% 6,710 6%
East Java, Bali, NTT and NTB -7% 11,636 12% 12,556 12% 12,844 12%
Sulawesi, Maluku & Papua -7% 7,444 8% 8,029 8% 8,625 8%
Kalimantan -10% 5,499 6% 6,109 6% 7,066 6%
Sumatera -8% 13,505 14% 14,680 14% 16,307 15%
Central Java and Yogyakarta -9% 6,538 7% 7,218 7% 8,211 7%
Total -7% 95,215 100% 102,843 100% 109,575 100%
Jakarta, Bogor, Tangerang, Karawang, Bekasi and Lampung
West Java
East Java, Bali, NTT and NTB
Sulawesi, Maluku & Papua
Kalimantan
Sumatera
Central Java and Yogyakarta
Loans by Region
2016 2015 2014
47% 46% 45%
6% 6% 6%12% 12% 12%
8% 8% 8%
6% 6% 6%
14% 14% 15%
7% 7% 7%
Region with the largest portfolio: Jakarta, Bogor, Tangerang, Karawang, Bekasi and Lampung, experienced a drop of 7% to Rp44.48 trillion in 2016 compared to previous year. The worst percentage decline occured in Kalimantan at a 10% drop to Rp5.49 trillion.
Credit Based on Interest Rate and Currency Based on interest rate type, 58% of Danamon’s portfolio are fixed rate loans. Most of these loans came from the Mass Market segment. Meanwhile, floating interest rate loans contributed 42% of Danamon’s total loans in 2016. These were mostly channeled to the SME, Commercial and Wholesale segments.
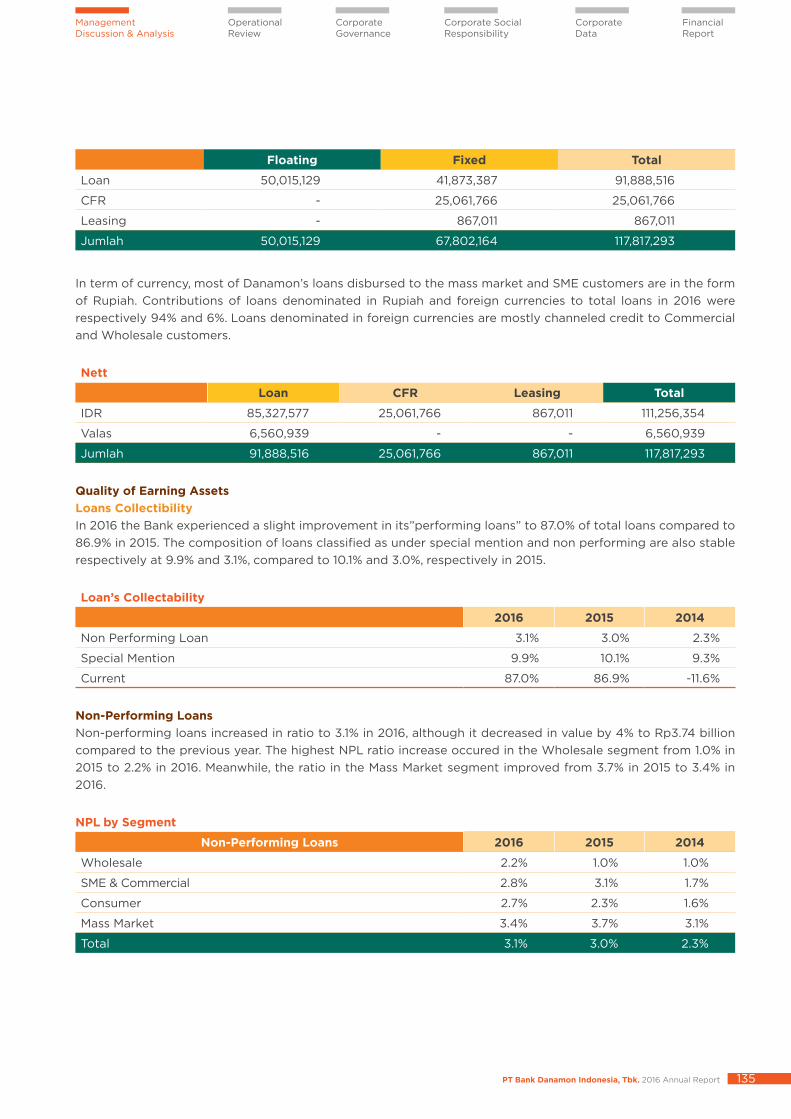
PT Bank Danamon Indonesia, Tbk. 2016 Annual Report 135
Operational Review
Management Discussion & Analysis
Corporate Governance
Corporate Social Responsibility
Corporate Data
Financial Report
Floating Fixed Total
Loan 50,015,129 41,873,387 91,888,516
CFR - 25,061,766 25,061,766
Leasing - 867,011 867,011
Jumlah 50,015,129 67,802,164 117,817,293
In term of currency, most of Danamon’s loans disbursed to the mass market and SME customers are in the form of Rupiah. Contributions of loans denominated in Rupiah and foreign currencies to total loans in 2016 were respectively 94% and 6%. Loans denominated in foreign currencies are mostly channeled credit to Commercial and Wholesale customers.
Nett
Loan CFR Leasing Total
IDR 85,327,577 25,061,766 867,011 111,256,354
Valas 6,560,939 - - 6,560,939
Jumlah 91,888,516 25,061,766 867,011 117,817,293
Quality of Earning Assets Loans Collectibility In 2016 the Bank experienced a slight improvement in its”performing loans” to 87.0% of total loans compared to 86.9% in 2015. The composition of loans classified as under special mention and non performing are also stable respectively at 9.9% and 3.1%, compared to 10.1% and 3.0%, respectively in 2015.
Loan’s Collectability
2016 2015 2014
Non Performing Loan 3.1% 3.0% 2.3%
Special Mention 9.9% 10.1% 9.3%
Current 87.0% 86.9% -11.6%
Non-Performing LoansNon-performing loans increased in ratio to 3.1% in 2016, although it decreased in value by 4% to Rp3.74 billion compared to the previous year. The highest NPL ratio increase occured in the Wholesale segment from 1.0% in 2015 to 2.2% in 2016. Meanwhile, the ratio in the Mass Market segment improved from 3.7% in 2015 to 3.4% in 2016.
NPL by Segment
Non-Performing Loans 2016 2015 2014
Wholesale 2.2% 1.0% 1.0%
SME & Commercial 2.8% 3.1% 1.7%
Consumer 2.7% 2.3% 1.6%
Mass Market 3.4% 3.7% 3.1%
Total 3.1% 3.0% 2.3%
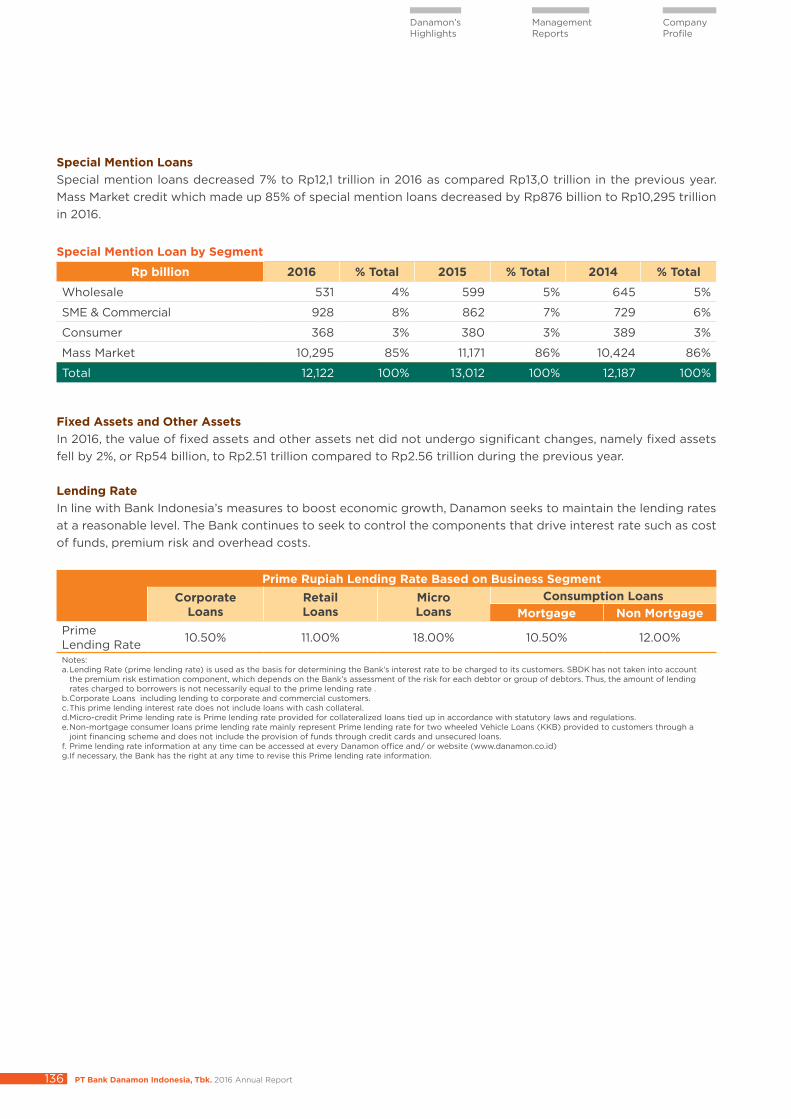
PT Bank Danamon Indonesia, Tbk. 2016 Annual Report136
Danamon’s Highlights
Management Reports
Company Profile
Special Mention LoansSpecial mention loans decreased 7% to Rp12,1 trillion in 2016 as compared Rp13,0 trillion in the previous year. Mass Market credit which made up 85% of special mention loans decreased by Rp876 billion to Rp10,295 trillion in 2016.
Special Mention Loan by Segment
Rp billion 2016 % Total 2015 % Total 2014 % Total
Wholesale 531 4% 599 5% 645 5%
SME & Commercial 928 8% 862 7% 729 6%
Consumer 368 3% 380 3% 389 3%
Mass Market 10,295 85% 11,171 86% 10,424 86%
Total 12,122 100% 13,012 100% 12,187 100%
Fixed Assets and Other Assets In 2016, the value of fixed assets and other assets net did not undergo significant changes, namely fixed assets fell by 2%, or Rp54 billion, to Rp2.51 trillion compared to Rp2.56 trillion during the previous year.
Lending Rate In line with Bank Indonesia’s measures to boost economic growth, Danamon seeks to maintain the lending rates at a reasonable level. The Bank continues to seek to control the components that drive interest rate such as cost of funds, premium risk and overhead costs.
Prime Rupiah Lending Rate Based on Business SegmentCorporate
LoansRetailLoans
MicroLoans
Consumption LoansMortgage Non Mortgage
Prime Lending Rate 10.50% 11.00% 18.00% 10.50% 12.00%
Notes:a. Lending Rate (prime lending rate) is used as the basis for determining the Bank’s interest rate to be charged to its customers. SBDK has not taken into account
the premium risk estimation component, which depends on the Bank’s assessment of the risk for each debtor or group of debtors. Thus, the amount of lending rates charged to borrowers is not necessarily equal to the prime lending rate .
b. Corporate Loans including lending to corporate and commercial customers. c. This prime lending interest rate does not include loans with cash collateral. d. Micro-credit Prime lending rate is Prime lending rate provided for collateralized loans tied up in accordance with statutory laws and regulations. e. Non-mortgage consumer loans prime lending rate mainly represent Prime lending rate for two wheeled Vehicle Loans (KKB) provided to customers through a
joint financing scheme and does not include the provision of funds through credit cards and unsecured loans. f. Prime lending rate information at any time can be accessed at every Danamon office and/ or website (www.danamon.co.id) g. If necessary, the Bank has the right at any time to revise this Prime lending rate information.
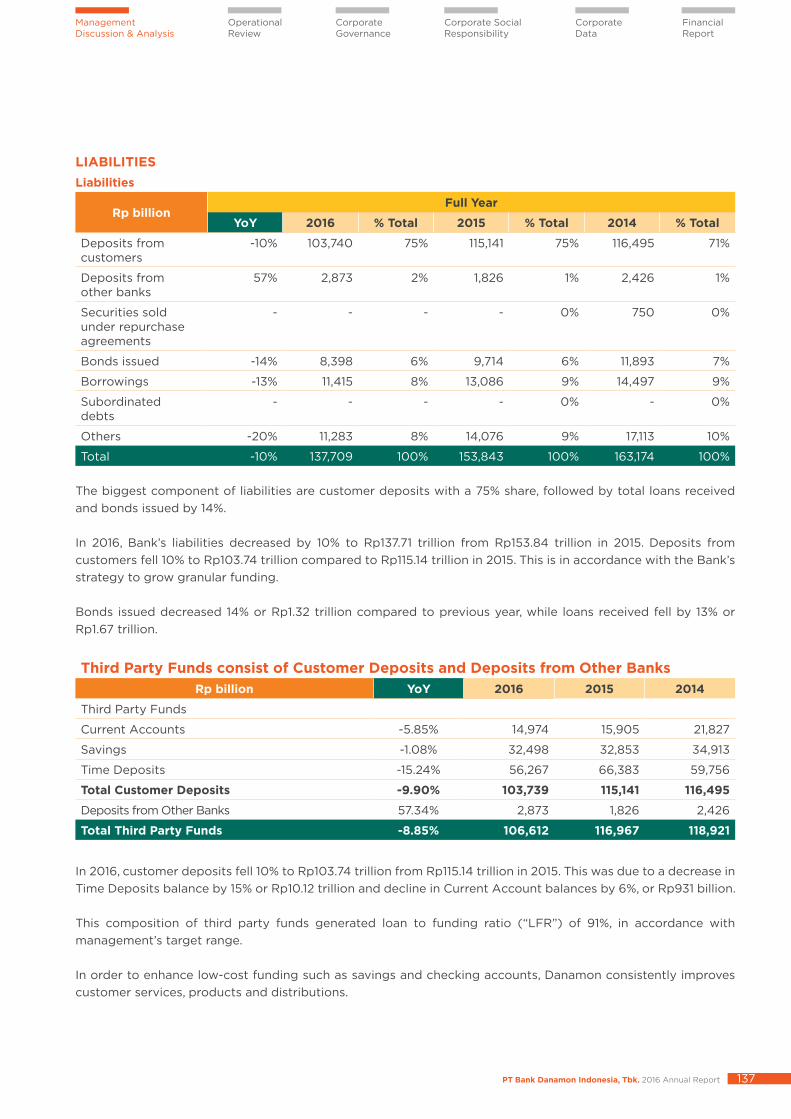
PT Bank Danamon Indonesia, Tbk. 2016 Annual Report 137
Operational Review
Management Discussion & Analysis
Corporate Governance
Corporate Social Responsibility
Corporate Data
Financial Report
LIABILITIESLiabilities
Rp billionFull Year
YoY 2016 % Total 2015 % Total 2014 % Total
Deposits fromcustomers
-10% 103,740 75% 115,141 75% 116,495 71%
Deposits fromother banks
57% 2,873 2% 1,826 1% 2,426 1%
Securities soldunder repurchaseagreements
- - - - 0% 750 0%
Bonds issued -14% 8,398 6% 9,714 6% 11,893 7%
Borrowings -13% 11,415 8% 13,086 9% 14,497 9%
Subordinateddebts
- - - - 0% - 0%
Others -20% 11,283 8% 14,076 9% 17,113 10%
Total -10% 137,709 100% 153,843 100% 163,174 100%
The biggest component of liabilities are customer deposits with a 75% share, followed by total loans received and bonds issued by 14%.
In 2016, Bank’s liabilities decreased by 10% to Rp137.71 trillion from Rp153.84 trillion in 2015. Deposits from customers fell 10% to Rp103.74 trillion compared to Rp115.14 trillion in 2015. This is in accordance with the Bank’s strategy to grow granular funding.
Bonds issued decreased 14% or Rp1.32 trillion compared to previous year, while loans received fell by 13% or Rp1.67 trillion.
Third Party Funds consist of Customer Deposits and Deposits from Other Banks Rp billion YoY 2016 2015 2014
Third Party Funds
Current Accounts -5.85% 14,974 15,905 21,827
Savings -1.08% 32,498 32,853 34,913
Time Deposits -15.24% 56,267 66,383 59,756
Total Customer Deposits -9.90% 103,739 115,141 116,495
Deposits from Other Banks 57.34% 2,873 1,826 2,426
Total Third Party Funds -8.85% 106,612 116,967 118,921
In 2016, customer deposits fell 10% to Rp103.74 trillion from Rp115.14 trillion in 2015. This was due to a decrease in Time Deposits balance by 15% or Rp10.12 trillion and decline in Current Account balances by 6%, or Rp931 billion.
This composition of third party funds generated loan to funding ratio (“LFR”) of 91%, in accordance with management’s target range.
In order to enhance low-cost funding such as savings and checking accounts, Danamon consistently improves customer services, products and distributions.
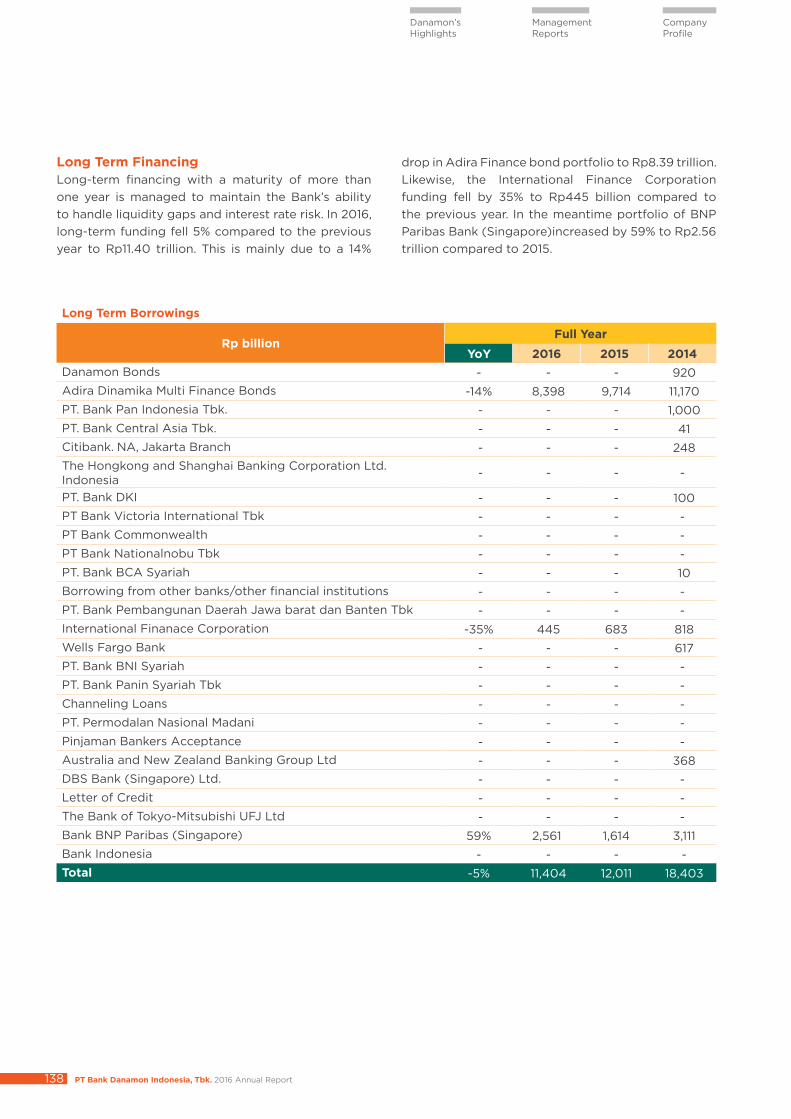
PT Bank Danamon Indonesia, Tbk. 2016 Annual Report138
Danamon’s Highlights
Management Reports
Company Profile
Long Term Financing Long-term financing with a maturity of more than one year is managed to maintain the Bank’s ability to handle liquidity gaps and interest rate risk. In 2016, long-term funding fell 5% compared to the previous year to Rp11.40 trillion. This is mainly due to a 14%
drop in Adira Finance bond portfolio to Rp8.39 trillion. Likewise, the International Finance Corporation funding fell by 35% to Rp445 billion compared to the previous year. In the meantime portfolio of BNP Paribas Bank (Singapore)increased by 59% to Rp2.56 trillion compared to 2015.
Long Term Borrowings
Rp billionFull Year
YoY 2016 2015 2014Danamon Bonds - - - 920 Adira Dinamika Multi Finance Bonds -14% 8,398 9,714 11,170 PT. Bank Pan Indonesia Tbk. - - - 1,000 PT. Bank Central Asia Tbk. - - - 41 Citibank. NA, Jakarta Branch - - - 248 The Hongkong and Shanghai Banking Corporation Ltd. Indonesia - - - -
PT. Bank DKI - - - 100 PT Bank Victoria International Tbk - - - -PT Bank Commonwealth - - - -PT Bank Nationalnobu Tbk - - - -PT. Bank BCA Syariah - - - 10 Borrowing from other banks/other financial institutions - - - -PT. Bank Pembangunan Daerah Jawa barat dan Banten Tbk - - - -International Finanace Corporation -35% 445 683 818 Wells Fargo Bank - - - 617 PT. Bank BNI Syariah - - - -PT. Bank Panin Syariah Tbk - - - -Channeling Loans - - - -PT. Permodalan Nasional Madani - - - -Pinjaman Bankers Acceptance - - - -Australia and New Zealand Banking Group Ltd - - - 368 DBS Bank (Singapore) Ltd. - - - -Letter of Credit - - - -The Bank of Tokyo-Mitsubishi UFJ Ltd - - - -Bank BNP Paribas (Singapore) 59% 2,561 1,614 3,111 Bank Indonesia - - - - Total -5% 11,404 12,011 18,403
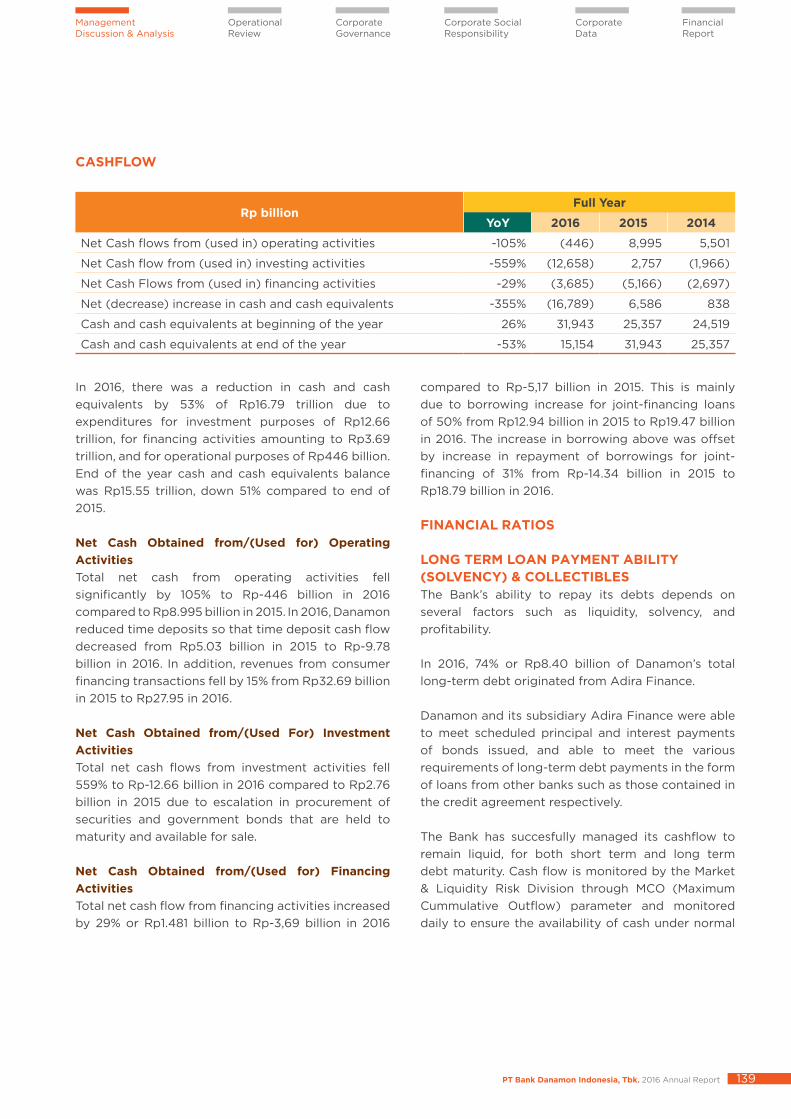
PT Bank Danamon Indonesia, Tbk. 2016 Annual Report 139
Operational Review
Management Discussion & Analysis
Corporate Governance
Corporate Social Responsibility
Corporate Data
Financial Report
CASHFLOW
Rp billionFull Year
YoY 2016 2015 2014
Net Cash flows from (used in) operating activities -105% (446) 8,995 5,501
Net Cash flow from (used in) investing activities -559% (12,658) 2,757 (1,966)
Net Cash Flows from (used in) financing activities -29% (3,685) (5,166) (2,697)
Net (decrease) increase in cash and cash equivalents -355% (16,789) 6,586 838
Cash and cash equivalents at beginning of the year 26% 31,943 25,357 24,519
Cash and cash equivalents at end of the year -53% 15,154 31,943 25,357
In 2016, there was a reduction in cash and cash equivalents by 53% of Rp16.79 trillion due to expenditures for investment purposes of Rp12.66 trillion, for financing activities amounting to Rp3.69 trillion, and for operational purposes of Rp446 billion.End of the year cash and cash equivalents balance was Rp15.55 trillion, down 51% compared to end of 2015.
Net Cash Obtained from/(Used for) Operating ActivitiesTotal net cash from operating activities fell significantly by 105% to Rp-446 billion in 2016 compared to Rp8.995 billion in 2015. In 2016, Danamon reduced time deposits so that time deposit cash flow decreased from Rp5.03 billion in 2015 to Rp-9.78 billion in 2016. In addition, revenues from consumer financing transactions fell by 15% from Rp32.69 billion in 2015 to Rp27.95 in 2016.
Net Cash Obtained from/(Used For) Investment Activities Total net cash flows from investment activities fell 559% to Rp-12.66 billion in 2016 compared to Rp2.76 billion in 2015 due to escalation in procurement of securities and government bonds that are held to maturity and available for sale.
Net Cash Obtained from/(Used for) Financing Activities Total net cash flow from financing activities increased by 29% or Rp1.481 billion to Rp-3,69 billion in 2016
compared to Rp-5,17 billion in 2015. This is mainly due to borrowing increase for joint-financing loans of 50% from Rp12.94 billion in 2015 to Rp19.47 billion in 2016. The increase in borrowing above was offset by increase in repayment of borrowings for joint-financing of 31% from Rp-14.34 billion in 2015 to Rp18.79 billion in 2016. FINANCIAL RATIOS
LONG TERM LOAN PAYMENT ABILITY (SOLVENCY) & COLLECTIBLES The Bank’s ability to repay its debts depends on several factors such as liquidity, solvency, and profitability.
In 2016, 74% or Rp8.40 billion of Danamon’s total long-term debt originated from Adira Finance.
Danamon and its subsidiary Adira Finance were able to meet scheduled principal and interest payments of bonds issued, and able to meet the various requirements of long-term debt payments in the form of loans from other banks such as those contained in the credit agreement respectively.
The Bank has succesfully managed its cashflow to remain liquid, for both short term and long term debt maturity. Cash flow is monitored by the Market & Liquidity Risk Division through MCO (Maximum Cummulative Outflow) parameter and monitored daily to ensure the availability of cash under normal
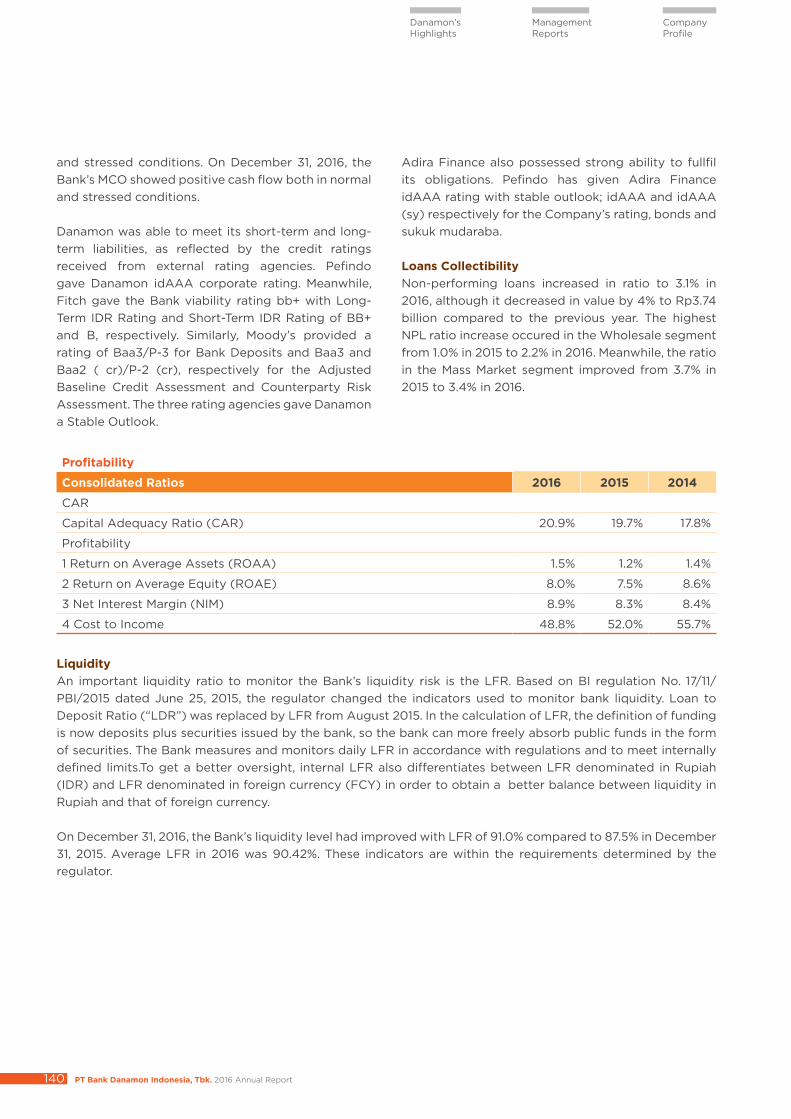
PT Bank Danamon Indonesia, Tbk. 2016 Annual Report140
Danamon’s Highlights
Management Reports
Company Profile
and stressed conditions. On December 31, 2016, the Bank’s MCO showed positive cash flow both in normal and stressed conditions.
Danamon was able to meet its short-term and long-term liabilities, as reflected by the credit ratings received from external rating agencies. Pefindo gave Danamon idAAA corporate rating. Meanwhile, Fitch gave the Bank viability rating bb+ with Long-Term IDR Rating and Short-Term IDR Rating of BB+ and B, respectively. Similarly, Moody’s provided a rating of Baa3/P-3 for Bank Deposits and Baa3 and Baa2 ( cr)/P-2 (cr), respectively for the Adjusted Baseline Credit Assessment and Counterparty Risk Assessment. The three rating agencies gave Danamon a Stable Outlook.
Adira Finance also possessed strong ability to fullfil its obligations. Pefindo has given Adira Finance idAAA rating with stable outlook; idAAA and idAAA (sy) respectively for the Company’s rating, bonds and sukuk mudaraba.
Loans Collectibility Non-performing loans increased in ratio to 3.1% in 2016, although it decreased in value by 4% to Rp3.74 billion compared to the previous year. The highest NPL ratio increase occured in the Wholesale segment from 1.0% in 2015 to 2.2% in 2016. Meanwhile, the ratio in the Mass Market segment improved from 3.7% in 2015 to 3.4% in 2016.
Profitability
Consolidated Ratios 2016 2015 2014
CAR
Capital Adequacy Ratio (CAR) 20.9% 19.7% 17.8%
Profitability
1 Return on Average Assets (ROAA) 1.5% 1.2% 1.4%
2 Return on Average Equity (ROAE) 8.0% 7.5% 8.6%
3 Net Interest Margin (NIM) 8.9% 8.3% 8.4%
4 Cost to Income 48.8% 52.0% 55.7%
Liquidity An important liquidity ratio to monitor the Bank’s liquidity risk is the LFR. Based on BI regulation No. 17/11/PBI/2015 dated June 25, 2015, the regulator changed the indicators used to monitor bank liquidity. Loan to Deposit Ratio (“LDR”) was replaced by LFR from August 2015. In the calculation of LFR, the definition of funding is now deposits plus securities issued by the bank, so the bank can more freely absorb public funds in the form of securities. The Bank measures and monitors daily LFR in accordance with regulations and to meet internally defined limits.To get a better oversight, internal LFR also differentiates between LFR denominated in Rupiah (IDR) and LFR denominated in foreign currency (FCY) in order to obtain a better balance between liquidity in Rupiah and that of foreign currency.
On December 31, 2016, the Bank’s liquidity level had improved with LFR of 91.0% compared to 87.5% in December 31, 2015. Average LFR in 2016 was 90.42%. These indicators are within the requirements determined by the regulator.
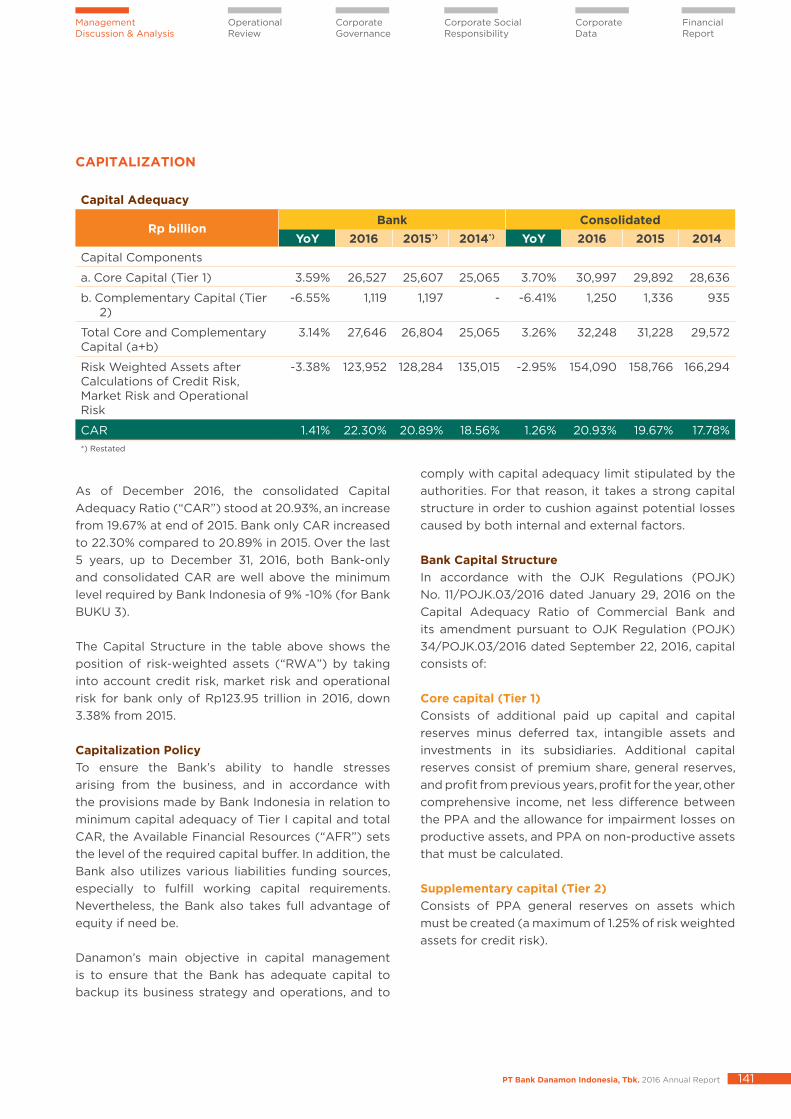
PT Bank Danamon Indonesia, Tbk. 2016 Annual Report 141
Operational Review
Management Discussion & Analysis
Corporate Governance
Corporate Social Responsibility
Corporate Data
Financial Report
CAPITALIZATION
Capital Adequacy
Rp billionBank Consolidated
YoY 2016 2015*) 2014*) YoY 2016 2015 2014Capital Components
a. Core Capital (Tier 1) 3.59% 26,527 25,607 25,065 3.70% 30,997 29,892 28,636
b. Complementary Capital (Tier 2)
-6.55% 1,119 1,197 - -6.41% 1,250 1,336 935
Total Core and Complementary Capital (a+b)
3.14% 27,646 26,804 25,065 3.26% 32,248 31,228 29,572
Risk Weighted Assets after Calculations of Credit Risk, Market Risk and Operational Risk
-3.38% 123,952 128,284 135,015 -2.95% 154,090 158,766 166,294
CAR 1.41% 22.30% 20.89% 18.56% 1.26% 20.93% 19.67% 17.78%*) Restated
As of December 2016, the consolidated Capital Adequacy Ratio (“CAR”) stood at 20.93%, an increase from 19.67% at end of 2015. Bank only CAR increased to 22.30% compared to 20.89% in 2015. Over the last 5 years, up to December 31, 2016, both Bank-only and consolidated CAR are well above the minimum level required by Bank Indonesia of 9% -10% (for Bank BUKU 3).
The Capital Structure in the table above shows the position of risk-weighted assets (“RWA”) by taking into account credit risk, market risk and operational risk for bank only of Rp123.95 trillion in 2016, down 3.38% from 2015.
Capitalization Policy To ensure the Bank’s ability to handle stresses arising from the business, and in accordance with the provisions made by Bank Indonesia in relation to minimum capital adequacy of Tier I capital and total CAR, the Available Financial Resources (“AFR”) sets the level of the required capital buffer. In addition, the Bank also utilizes various liabilities funding sources, especially to fulfill working capital requirements. Nevertheless, the Bank also takes full advantage of equity if need be.
Danamon’s main objective in capital management is to ensure that the Bank has adequate capital to backup its business strategy and operations, and to
comply with capital adequacy limit stipulated by the authorities. For that reason, it takes a strong capital structure in order to cushion against potential losses caused by both internal and external factors.
Bank Capital Structure In accordance with the OJK Regulations (POJK) No. 11/POJK.03/2016 dated January 29, 2016 on the Capital Adequacy Ratio of Commercial Bank and its amendment pursuant to OJK Regulation (POJK) 34/POJK.03/2016 dated September 22, 2016, capital consists of:
Core capital (Tier 1)Consists of additional paid up capital and capital reserves minus deferred tax, intangible assets and investments in its subsidiaries. Additional capital reserves consist of premium share, general reserves, and profit from previous years, profit for the year, other comprehensive income, net less difference between the PPA and the allowance for impairment losses on productive assets, and PPA on non-productive assets that must be calculated.
Supplementary capital (Tier 2)Consists of PPA general reserves on assets which must be created (a maximum of 1.25% of risk weighted assets for credit risk).
PT Bank Danamon Indonesia, Tbk. 2016 Annual Report142
Danamon’s Highlights
Management Reports
Company Profile
Until 2016, the risk profile based CAR that must be fulfilled by Danamon amounted to 9% - <10%. Starting in 2016 the following factors were added to minimum CAR: • Capital Conservation Buffer• Countercyclical Buffer• Domestic SIB
Capital Management Strategies In accordance with the OJK Regulation (POJK) 11/POJK.03/2016 dated January 29, 2016 concerning the Capital Adequacy Ratio of Commercial Banks and its amendment pursuant to OJK Regulation (POJK) 34/POJK.03/2016 dated September 22, 2016 and OJK Circular Letter No.26/SEOJK.03/2016 dated July 14, 2016, concerning appropriate CAR risk profile and Compliance Equivalency Maintained Capital Assets (“CEMA”), the Bank is required to perform a minimum CAR calculation based on the risk profile and conduct the Internal Capital Adequacy Assessment Process (“ICAAP”). The Bank measures capital adequacy based on OJK’s CAR regulations and internal capital requirement to ensure adequate capital to support the ongoing operations of the Bank.
Internal Assessment of Capital Adequacy Process ICAAP is Danamon’s self assessment in accordance to Danamon Pillar 2 of Basel and OJK regulations, which not only consider the capital adequacy of Pillar 1 (Credit Risk, Market & Operations), but also consider other types of risks. In addition to minimum capital adequacy calculation based on Risk Profile Rating in accordance with OJK regulations. The Bank also utilizes its own internal calculation to calculate the risks of:• Credit concentration risk• Interest Rate Risk in Bank book• Liquidity Risk• Impact of Stress Test
In accordance with Bank Indonesia’s regulation, the implementation of ICAAP in Danamon is carried out under active supervision of the Board of Directors and the Board of Commissioners, including the capital adequacy assessment process, the process of monitoring and reporting risk profile, as well as adequate internal control processes. Danamon’s Internal Audit conducts an annual review on ICAAP process independently.
Stress TestDanamon carries out stress tests to estimate the impact of extreme events on income and capital. The results of the stress tests are also integrated into the framework of the ICAAP at the Bank.
Economist teams prepare several scenarios that can set off problems for the Bank at several severity levels. These scenarios will be formulated into parameters and approved by management.
Each line of business (“LOB”) and credit, market and liquidity risks will utilize such scenarios. The stress test results will be analyzed and reported to the Boards of Directors and Commissioners.
Danamon’s Composition of Assets Funding In 2016, 79% of Danamon assets were funded by liabilities. Asset funding from equity was only 21%. This composition remained almost unchanged, where in 2015 the contribution of liabilities to assets was 82%. However, the composition of liabilities were different due to declining customer deposits and other liabilities.
In 2016, the assets and liabilities respectively fell by 7% and 10%, while equity increased 6%. The increase in equity was primarily due to an increase in retained earnings (total retained earnings).
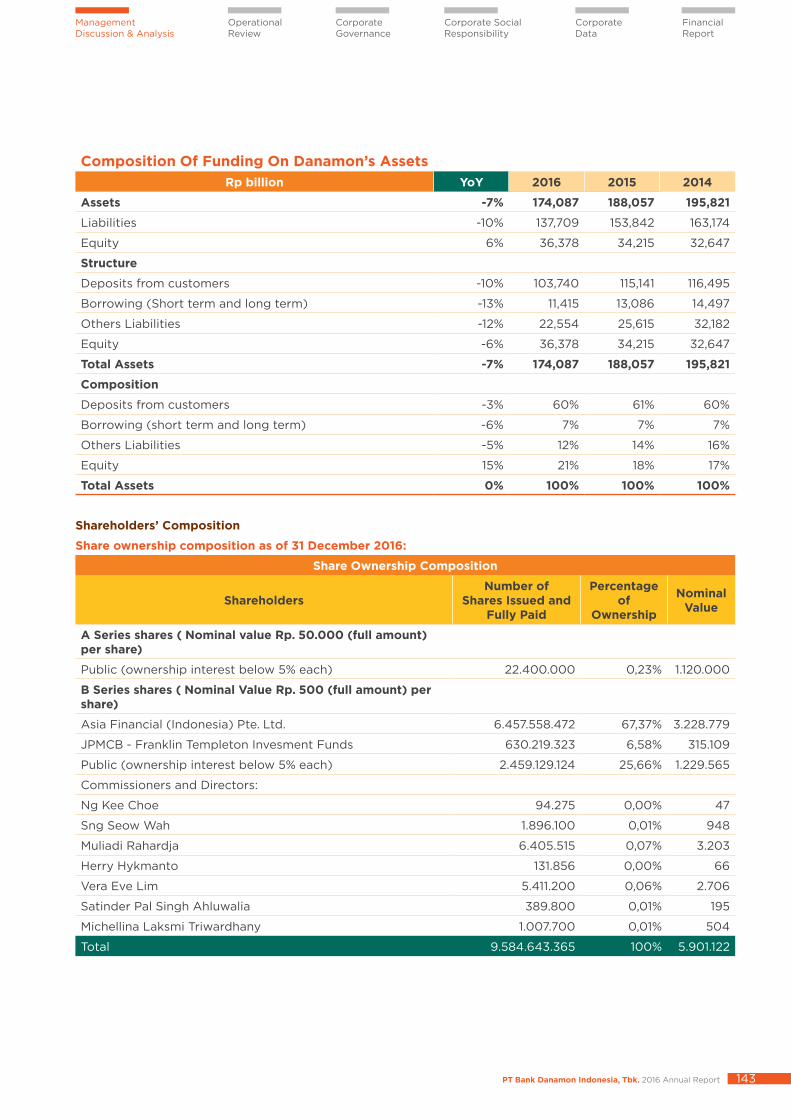
PT Bank Danamon Indonesia, Tbk. 2016 Annual Report 143
Operational Review
Management Discussion & Analysis
Corporate Governance
Corporate Social Responsibility
Corporate Data
Financial Report
Composition Of Funding On Danamon’s AssetsRp billion YoY 2016 2015 2014
Assets -7% 174,087 188,057 195,821
Liabilities -10% 137,709 153,842 163,174
Equity 6% 36,378 34,215 32,647
Structure
Deposits from customers -10% 103,740 115,141 116,495
Borrowing (Short term and long term) -13% 11,415 13,086 14,497
Others Liabilities -12% 22,554 25,615 32,182
Equity -6% 36,378 34,215 32,647
Total Assets -7% 174,087 188,057 195,821
Composition
Deposits from customers -3% 60% 61% 60%
Borrowing (short term and long term) -6% 7% 7% 7%
Others Liabilities -5% 12% 14% 16%
Equity 15% 21% 18% 17%
Total Assets 0% 100% 100% 100%
Shareholders’ Composition
Share ownership composition as of 31 December 2016:
Share Ownership Composition
ShareholdersNumber of
Shares Issued andFully Paid
Percentage of
Ownership
Nominal Value
A Series shares ( Nominal value Rp. 50.000 (full amount) per share)
Public (ownership interest below 5% each) 22.400.000 0,23% 1.120.000
B Series shares ( Nominal Value Rp. 500 (full amount) per share)
Asia Financial (Indonesia) Pte. Ltd. 6.457.558.472 67,37% 3.228.779
JPMCB - Franklin Templeton Invesment Funds 630.219.323 6,58% 315.109
Public (ownership interest below 5% each) 2.459.129.124 25,66% 1.229.565
Commissioners and Directors:
Ng Kee Choe 94.275 0,00% 47
Sng Seow Wah 1.896.100 0,01% 948
Muliadi Rahardja 6.405.515 0,07% 3.203
Herry Hykmanto 131.856 0,00% 66
Vera Eve Lim 5.411.200 0,06% 2.706
Satinder Pal Singh Ahluwalia 389.800 0,01% 195
Michellina Laksmi Triwardhany 1.007.700 0,01% 504
Total 9.584.643.365 100% 5.901.122
PT Bank Danamon Indonesia, Tbk. 2016 Annual Report144
Danamon’s Highlights
Management Reports
Company Profile
Both A Series and B Series have equal voting rights. The capital structure of the Bank and policies related to capital structure is also detailed in the Articles of Association of the Bank, in Notarial Deed No. 134 made before Meester Raden Soedja, SH which has been approved by the Ministry of Justice of the Republic of Indonesia in Letter No.J.A.5/40/8 on April 24, 1957, with the latest changes by Notarial Deed No. 27 on March 30, 2011, made in the presence of P. Sutrisno A. Tampubolon, SH, notary in Jakarta M.Kn and on October 12, 2011, drawn up before Fathiah Helmi SH, notary in Jakarta.
On December 8, 1989, by permission of the Minister of Finance No. SI-066/SHM/MK.10/1989 on October 24, 1989, the Bank held an Initial Public Offering (IPO) of 12,000,000 shares with a par value of Rp1,000 per share ( full value). All shares have been listed on the Jakarta Stock Exchange (now the Indonesia Stock Exchange (IDX) after merging with the Surabaya Stock Exchange) on December 8, 1989. After which, the Bank increased the number of listed shares through bonus shares, the Limited Public Offering Pre-emptive rights (rights Issue) I, II, III, IV and V and also in the context of Employee/Management Stock (E/MSOP).
Here is a summary of Danamon correspondence with Bapepam-LK regarding the statement of the effectiveness of Limited Public Offering with Pre-emptive Rights:
Effective Letter of Bapepam-LK
Rights Issue I No. S-2196/PM/1993 dated 24 December 1993
Rights Issue II No. S-608/PM/1996 dated 29 April 1996
Rights Issue III No. S-429/PM/1999 dated 29 March 1999
Rights Issue IV No. S-2093/BL/2009 dated 20 March 2009
Rights Issue V No. S-9534/BL/2011 dated 24 August 2011
Capital planning Based on the regulation of BI 15/12/PBI/2013 dated December 12, 2013 on the Capital Adequacy Ratio of Banks and Circular Letter No. 14/37/DPNP dated December 27, 2012, regarding the appropriate CAR Risk Profile and CEMA, Danamon is required to perform a minimum CAR calculation based on the risk profile and conduct an ICAAP.
The outcome of the assessment demonstrated that Danamon was able to comply with the minimum CAR according to the risk profile, both for Bank-only and consolidated. Based on the ICAAP, Danamon has the financial resources capability to meet the capital requirements for both Pillar 1 and Pillar 2 for the next three years.
Furthermore, POJK also required banks to increase the minimum Tier 1 Capital from 5% to 6% Effective from 1 January 2014 , and provide additional capital buffers which are imposed in stages from 1 January 2016 to 1 Januari 2019. Buffer requirement is further regulated in BI regulation No. 17/22/PBI/2015 dated 23 December 2015 about Countercyclical Buffer Requirement and OJK Regulation No. 46/POJK.03/2015 dated 23 December 2015 about Stipulation of Systemically Important Bank and Capial Surcharge. Buffer percentage (from RWA) that Danamon should meet at 31 December 2016 are:• Capital Conservation Buffer 0.625%• Countercyclical Buffer 0.000%• Capital Surcharge for D-SIB 0.250%
The assesment result shows that Danamon has met the minimum CAR in accordance to its risk profile, and met additional capital buffer requirement, both on stand alone and consolidated basis.
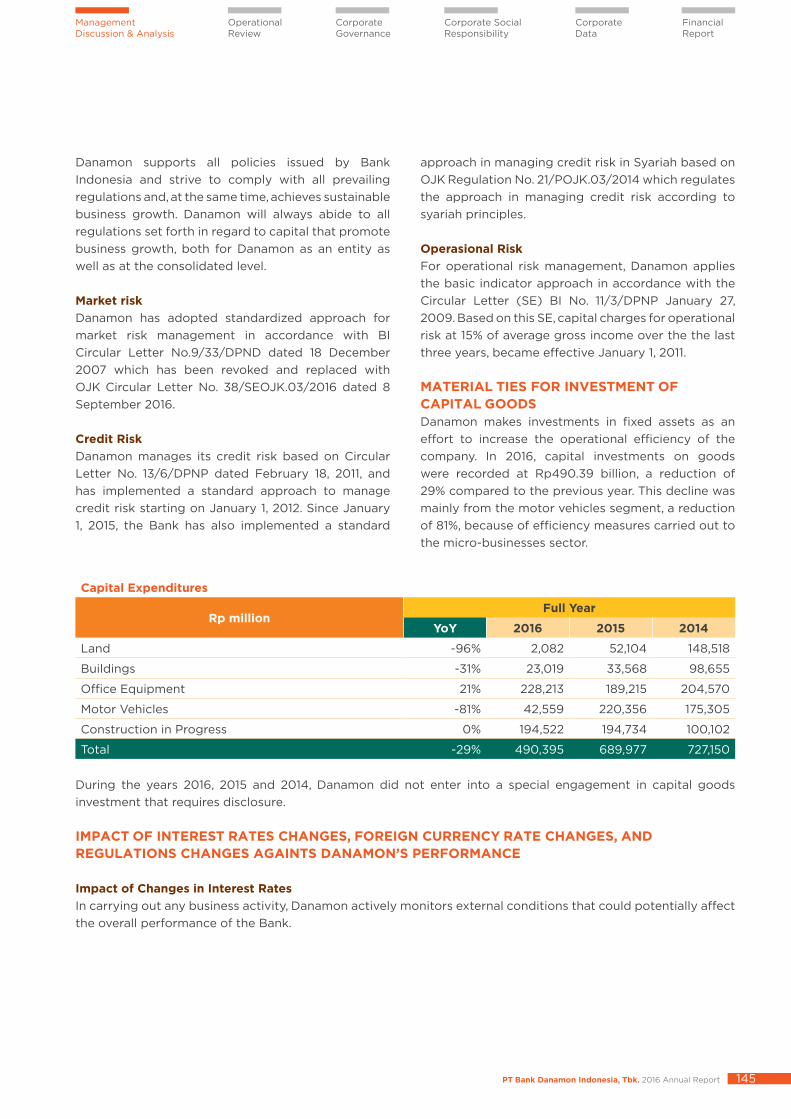
PT Bank Danamon Indonesia, Tbk. 2016 Annual Report 145
Operational Review
Management Discussion & Analysis
Corporate Governance
Corporate Social Responsibility
Corporate Data
Financial Report
Danamon supports all policies issued by Bank Indonesia and strive to comply with all prevailing regulations and, at the same time, achieves sustainable business growth. Danamon will always abide to all regulations set forth in regard to capital that promote business growth, both for Danamon as an entity as well as at the consolidated level.
Market risk Danamon has adopted standardized approach for market risk management in accordance with BI Circular Letter No.9/33/DPND dated 18 December 2007 which has been revoked and replaced with OJK Circular Letter No. 38/SEOJK.03/2016 dated 8 September 2016.
Credit Risk Danamon manages its credit risk based on Circular Letter No. 13/6/DPNP dated February 18, 2011, and has implemented a standard approach to manage credit risk starting on January 1, 2012. Since January 1, 2015, the Bank has also implemented a standard
approach in managing credit risk in Syariah based on OJK Regulation No. 21/POJK.03/2014 which regulates the approach in managing credit risk according to syariah principles.
Operasional Risk For operational risk management, Danamon applies the basic indicator approach in accordance with the Circular Letter (SE) BI No. 11/3/DPNP January 27, 2009. Based on this SE, capital charges for operational risk at 15% of average gross income over the the last three years, became effective January 1, 2011.
MATERIAL TIES FOR INVESTMENT OF CAPITAL GOODS Danamon makes investments in fixed assets as an effort to increase the operational efficiency of the company. In 2016, capital investments on goods were recorded at Rp490.39 billion, a reduction of 29% compared to the previous year. This decline was mainly from the motor vehicles segment, a reduction of 81%, because of efficiency measures carried out to the micro-businesses sector.
Capital Expenditures
Rp millionFull Year
YoY 2016 2015 2014
Land -96% 2,082 52,104 148,518
Buildings -31% 23,019 33,568 98,655
Office Equipment 21% 228,213 189,215 204,570
Motor Vehicles -81% 42,559 220,356 175,305
Construction in Progress 0% 194,522 194,734 100,102
Total -29% 490,395 689,977 727,150 During the years 2016, 2015 and 2014, Danamon did not enter into a special engagement in capital goods investment that requires disclosure.
IMPACT OF INTEREST RATES CHANGES, FOREIGN CURRENCY RATE CHANGES, AND REGULATIONS CHANGES AGAINTS DANAMON’S PERFORMANCE
Impact of Changes in Interest Rates In carrying out any business activity, Danamon actively monitors external conditions that could potentially affect the overall performance of the Bank.
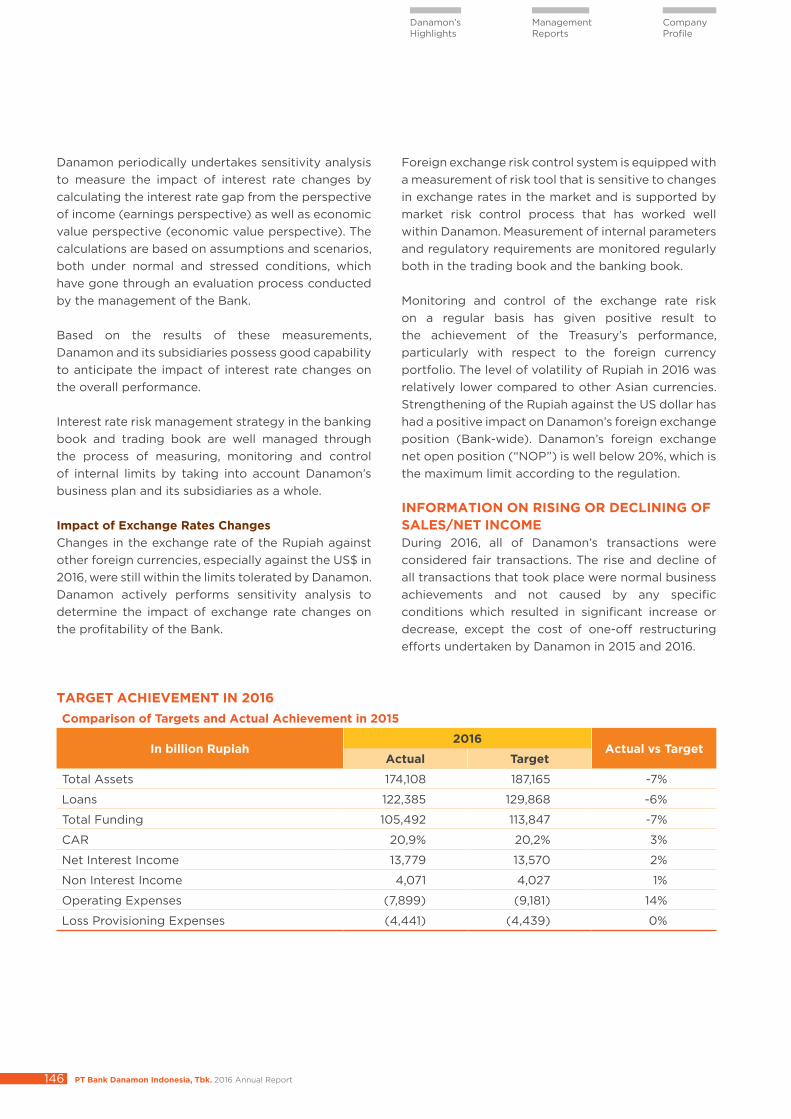
PT Bank Danamon Indonesia, Tbk. 2016 Annual Report146
Danamon’s Highlights
Management Reports
Company Profile
Danamon periodically undertakes sensitivity analysis to measure the impact of interest rate changes by calculating the interest rate gap from the perspective of income (earnings perspective) as well as economic value perspective (economic value perspective). The calculations are based on assumptions and scenarios, both under normal and stressed conditions, which have gone through an evaluation process conducted by the management of the Bank.
Based on the results of these measurements, Danamon and its subsidiaries possess good capability to anticipate the impact of interest rate changes on the overall performance.
Interest rate risk management strategy in the banking book and trading book are well managed through the process of measuring, monitoring and control of internal limits by taking into account Danamon’s business plan and its subsidiaries as a whole.
Impact of Exchange Rates Changes Changes in the exchange rate of the Rupiah against other foreign currencies, especially against the US$ in 2016, were still within the limits tolerated by Danamon. Danamon actively performs sensitivity analysis to determine the impact of exchange rate changes on the profitability of the Bank.
Foreign exchange risk control system is equipped with a measurement of risk tool that is sensitive to changes in exchange rates in the market and is supported by market risk control process that has worked well within Danamon. Measurement of internal parameters and regulatory requirements are monitored regularly both in the trading book and the banking book.
Monitoring and control of the exchange rate risk on a regular basis has given positive result to the achievement of the Treasury’s performance, particularly with respect to the foreign currency portfolio. The level of volatility of Rupiah in 2016 was relatively lower compared to other Asian currencies. Strengthening of the Rupiah against the US dollar has had a positive impact on Danamon’s foreign exchange position (Bank-wide). Danamon’s foreign exchange net open position (“NOP”) is well below 20%, which is the maximum limit according to the regulation.
INFORMATION ON RISING OR DECLINING OF SALES/NET INCOMEDuring 2016, all of Danamon’s transactions were considered fair transactions. The rise and decline of all transactions that took place were normal business achievements and not caused by any specific conditions which resulted in significant increase or decrease, except the cost of one-off restructuring efforts undertaken by Danamon in 2015 and 2016.
TARGET ACHIEVEMENT IN 2016 Comparison of Targets and Actual Achievement in 2015
In billion Rupiah2016
Actual vs TargetActual Target
Total Assets 174,108 187,165 -7%
Loans 122,385 129,868 -6%
Total Funding 105,492 113,847 -7%
CAR 20,9% 20,2% 3%
Net Interest Income 13,779 13,570 2%
Non Interest Income 4,071 4,027 1%
Operating Expenses (7,899) (9,181) 14%
Loss Provisioning Expenses (4,441) (4,439) 0%
PT Bank Danamon Indonesia, Tbk. 2016 Annual Report 147
Operational Review
Management Discussion & Analysis
Corporate Governance
Corporate Social Responsibility
Corporate Data
Financial Report
Loan portfolio achievement in 2016 compared to the set target was 6% or Rp7,483 billion lower. While net interest income in 2016 reached Rp13,779 billion, or 2% higher than the set target of Rp13,570 billion. In 2016, the Bank managed to offset the decline in interest income by reducing interest expense.
Non-interest income of Rp4,071 billion was higher than the set target of Rp4,027 billion. Furthermore, the operational expenses of Rp1,282 billion were 14% below the target of Rp9,181 billion.
The Bank’s Capital Adequacy Ratio in 2016 amounted to 20.9% and is above the minimum requirement set by the regulator.
INFORMATION AND IMPORTANT MATTERS SUBSEQUENT TO THE DATE OF ACCOUNTANT’S REPORT There was no material events subsequent to the date of accountant’ report.
SIGNIFICANT EVENTS AFTER THE DATE OF THE FINANCIAL STATEMENTS There was no material events subsequent to the date of accountant’ report.
DIVIDEND POLICY AND USE OF NET INCOMEDanamon’s dividend policy has been approved by the Board of Commissioners, Board of Directors and shareholders. The procedure for constructing Danamon’s dividend policy is based on organizational structure, in which the Board of Directors submits a dividend distribution proposal to the President Director. The proposal is based on Danamon’s performance during a certain period.
The proposal is then brought to the Annual General Meeting of Shareholders (“AGMS”) to seek approval after considering the adequacy of retained earnings. During the Annual General Meeting of Shareholders, the time and method of payment is agreed in accordance with the regulations of the Indonesian Stock Exchange (“BEI”), including the dates the shareholders are entitled to the dividends and when it authorizes the Board of Directors to do so.
Based on the approval of the Board of Directors Meeting and Annual General Meeting of Shareholders, Danamon may pay interim dividends before the end of the fiscal year.
In addition, the Annual General Meeting of Shareholders also authorized to determine the use of net profit (including dividend distribution and general reserve and mandatory), determination of the remuneration of the Board of Directors and Board of Commissioners (salary and bonus), the appointment of public accountants, as well as the approval of the financial statements. Prior to 2008, the bonus was part of the net profit.
In addition to the Annual General Meeting of Shareholders approval, the dividend policy making takes into account prevailing regulations, such as long-term and short term capital requirements, as well as Danamon’s growth earnings expectations and market conditions.
Danamon has complied with a long-term loan agreement on limitations on the distribution of dividends. Danamon also ensures that policy in accordance with the dividend distribution restrictions as set forth in Danamon’s long-term agreements. The decision also takes into account the management of capital planning, earnings growth expectations and market conditions.
The Annual General Meeting of Shareholders held on 28 April 2016 decided on the distribution of dividends for the fiscal year of 2015 amounting 30% of net income or approximately Rp717,991 million or Rp74.90 (full amount) per share Series A and Series B, and the establishment of common and mandatory reserves amounting to Rp23,933 million.
Based on the Shareholders Register dated May 12, 2016, which is the registration date of shareholders entitled for dividends, the number of shares outstanding on the date of May 12, 2016 was 9,584,643,365 shares, so therefore the dividend per share to be distributed on May 27, 2016 was Rp74.90 (full amount) per share of series A and series B or Rp717,890 million in total.
The Annual General Meeting of Shareholders held on 7 April 2015, had decided to distribute cash dividends for the fiscal year of 2014 at 30% of net income or approximately Rp781,205 million or Rp81.50 (full amount) per shares of Series A and Series B, and the establishment of common and mandatory reserves amounting Rp26,040 million.
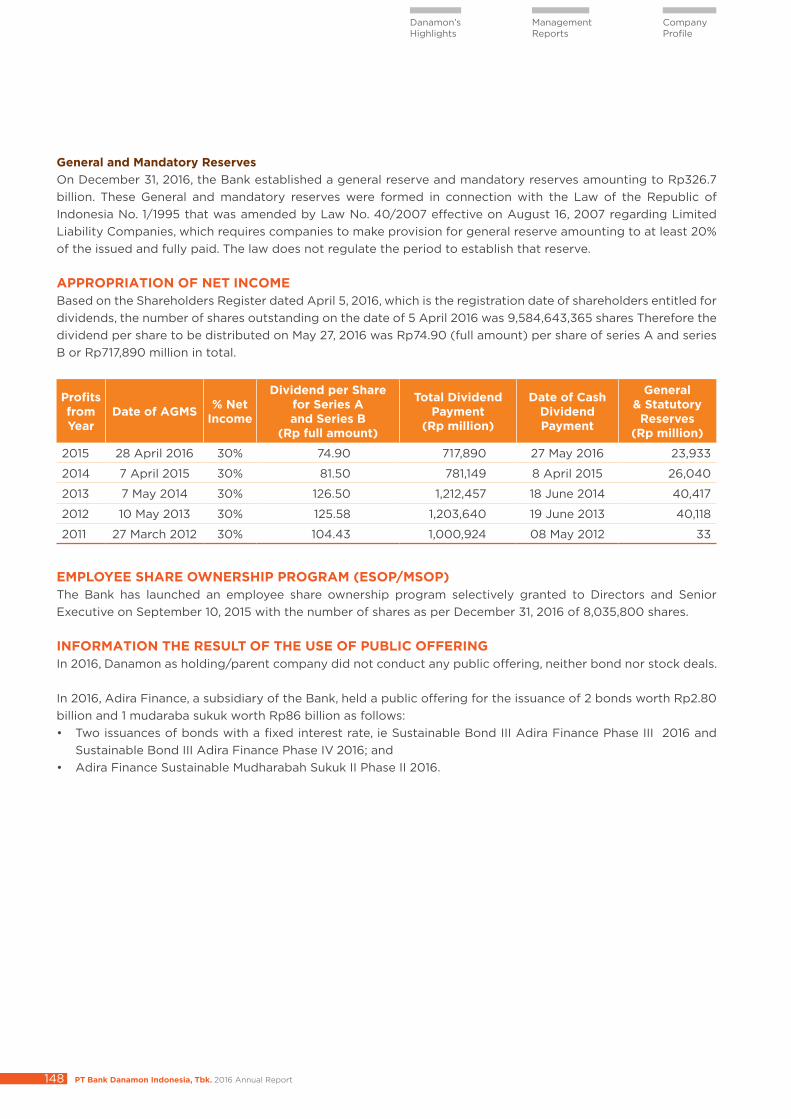
PT Bank Danamon Indonesia, Tbk. 2016 Annual Report148
Danamon’s Highlights
Management Reports
Company Profile
General and Mandatory Reserves On December 31, 2016, the Bank established a general reserve and mandatory reserves amounting to Rp326.7 billion. These General and mandatory reserves were formed in connection with the Law of the Republic of Indonesia No. 1/1995 that was amended by Law No. 40/2007 effective on August 16, 2007 regarding Limited Liability Companies, which requires companies to make provision for general reserve amounting to at least 20% of the issued and fully paid. The law does not regulate the period to establish that reserve.
APPROPRIATION OF NET INCOMEBased on the Shareholders Register dated April 5, 2016, which is the registration date of shareholders entitled for dividends, the number of shares outstanding on the date of 5 April 2016 was 9,584,643,365 shares Therefore the dividend per share to be distributed on May 27, 2016 was Rp74.90 (full amount) per share of series A and series B or Rp717,890 million in total.
Profits fromYear
Date of AGMS % Net Income
Dividend per Share for Series Aand Series B
(Rp full amount)
Total DividendPayment
(Rp million)
Date of Cash Dividend Payment
General& Statutory
Reserves(Rp million)
2015 28 April 2016 30% 74.90 717,890 27 May 2016 23,933
2014 7 April 2015 30% 81.50 781,149 8 April 2015 26,040
2013 7 May 2014 30% 126.50 1,212,457 18 June 2014 40,417
2012 10 May 2013 30% 125.58 1,203,640 19 June 2013 40,118
2011 27 March 2012 30% 104.43 1,000,924 08 May 2012 33
EMPLOYEE SHARE OWNERSHIP PROGRAM (ESOP/MSOP) The Bank has launched an employee share ownership program selectively granted to Directors and Senior Executive on September 10, 2015 with the number of shares as per December 31, 2016 of 8,035,800 shares.
INFORMATION THE RESULT OF THE USE OF PUBLIC OFFERING In 2016, Danamon as holding/parent company did not conduct any public offering, neither bond nor stock deals.
In 2016, Adira Finance, a subsidiary of the Bank, held a public offering for the issuance of 2 bonds worth Rp2.80 billion and 1 mudaraba sukuk worth Rp86 billion as follows:• Two issuances of bonds with a fixed interest rate, ie Sustainable Bond III Adira Finance Phase III 2016 and
Sustainable Bond III Adira Finance Phase IV 2016; and• Adira Finance Sustainable Mudharabah Sukuk II Phase II 2016.
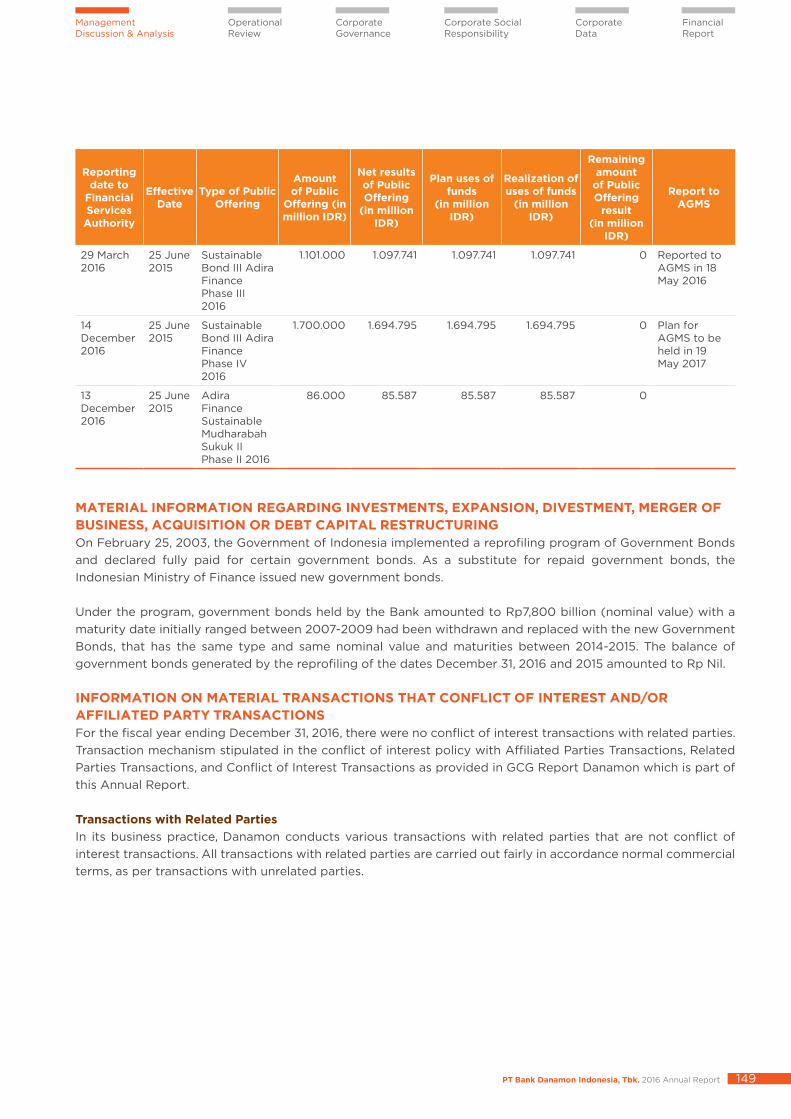
PT Bank Danamon Indonesia, Tbk. 2016 Annual Report 149
Operational Review
Management Discussion & Analysis
Corporate Governance
Corporate Social Responsibility
Corporate Data
Financial Report
Reporting date to
Financial Services
Authority
Effective Date
Type of Public Offering
Amount of Public
Offering (in million IDR)
Net results of Public Offering
(in million IDR)
Plan uses of funds
(in million IDR)
Realization of uses of funds
(in million IDR)
Remaining amount
of Public Offering
result(in million
IDR)
Report to AGMS
29 March 2016
25 June 2015
Sustainable Bond III Adira Finance Phase III 2016
1.101.000 1.097.741 1.097.741 1.097.741 0 Reported to AGMS in 18 May 2016
14 December 2016
25 June 2015
Sustainable Bond III Adira Finance Phase IV 2016
1.700.000 1.694.795 1.694.795 1.694.795 0 Plan for AGMS to be held in 19 May 2017
13 December 2016
25 June 2015
Adira Finance Sustainable Mudharabah Sukuk II Phase II 2016
86.000 85.587 85.587 85.587 0
MATERIAL INFORMATION REGARDING INVESTMENTS, EXPANSION, DIVESTMENT, MERGER OF BUSINESS, ACQUISITION OR DEBT CAPITAL RESTRUCTURINGOn February 25, 2003, the Government of Indonesia implemented a reprofiling program of Government Bonds and declared fully paid for certain government bonds. As a substitute for repaid government bonds, the Indonesian Ministry of Finance issued new government bonds.
Under the program, government bonds held by the Bank amounted to Rp7,800 billion (nominal value) with a maturity date initially ranged between 2007-2009 had been withdrawn and replaced with the new Government Bonds, that has the same type and same nominal value and maturities between 2014-2015. The balance of government bonds generated by the reprofiling of the dates December 31, 2016 and 2015 amounted to Rp Nil.
INFORMATION ON MATERIAL TRANSACTIONS THAT CONFLICT OF INTEREST AND/OR AFFILIATED PARTY TRANSACTIONSFor the fiscal year ending December 31, 2016, there were no conflict of interest transactions with related parties. Transaction mechanism stipulated in the conflict of interest policy with Affiliated Parties Transactions, Related Parties Transactions, and Conflict of Interest Transactions as provided in GCG Report Danamon which is part of this Annual Report.
Transactions with Related PartiesIn its business practice, Danamon conducts various transactions with related parties that are not conflict of interest transactions. All transactions with related parties are carried out fairly in accordance normal commercial terms, as per transactions with unrelated parties.
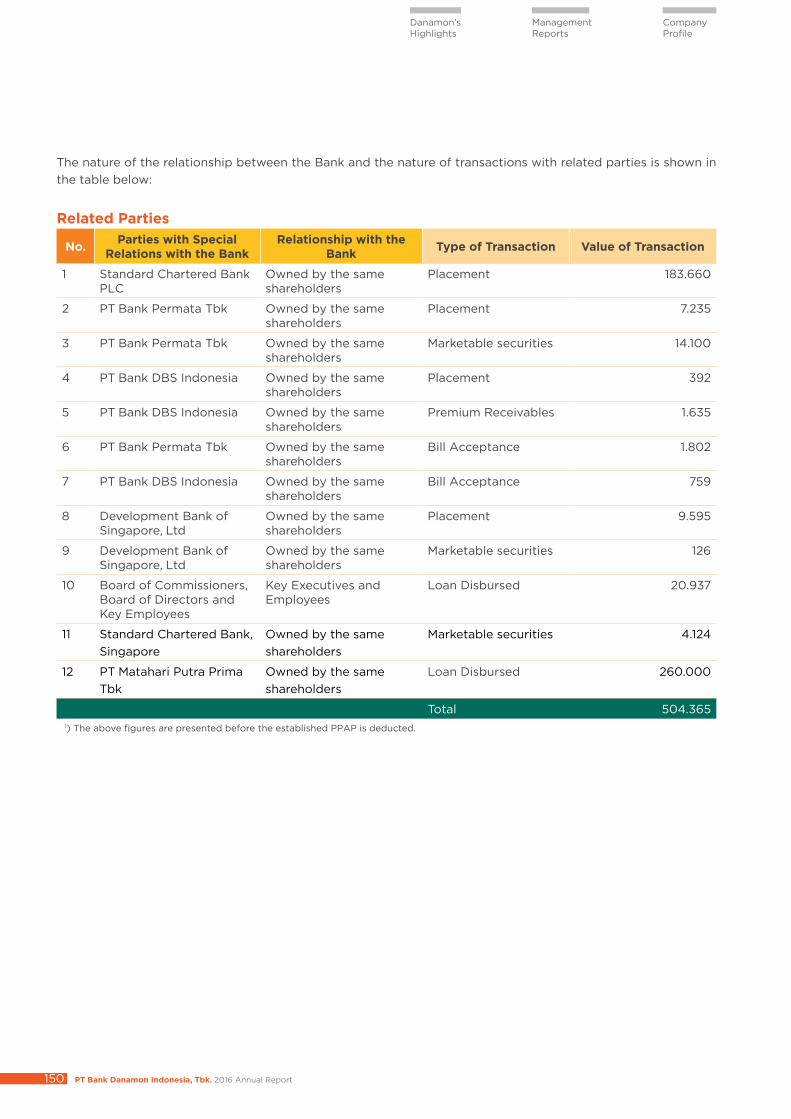
PT Bank Danamon Indonesia, Tbk. 2016 Annual Report150
Danamon’s Highlights
Management Reports
Company Profile
The nature of the relationship between the Bank and the nature of transactions with related parties is shown in the table below:
Related Parties
No. Parties with Special Relations with the Bank
Relationship with the Bank Type of Transaction Value of Transaction
1 Standard Chartered Bank PLC
Owned by the same shareholders
Placement 183.660
2 PT Bank Permata Tbk Owned by the same shareholders
Placement 7.235
3 PT Bank Permata Tbk Owned by the same shareholders
Marketable securities 14.100
4 PT Bank DBS Indonesia Owned by the same shareholders
Placement 392
5 PT Bank DBS Indonesia Owned by the same shareholders
Premium Receivables 1.635
6 PT Bank Permata Tbk Owned by the same shareholders
Bill Acceptance 1.802
7 PT Bank DBS Indonesia Owned by the same shareholders
Bill Acceptance 759
8 Development Bank of Singapore, Ltd
Owned by the same shareholders
Placement 9.595
9 Development Bank of Singapore, Ltd
Owned by the same shareholders
Marketable securities 126
10 Board of Commissioners, Board of Directors and Key Employees
Key Executives and Employees
Loan Disbursed 20.937
11 Standard Chartered Bank, Singapore
Owned by the same shareholders
Marketable securities 4.124
12 PT Matahari Putra Prima Tbk
Owned by the same shareholders
Loan Disbursed 260.000
Total 504.365 1) The above figures are presented before the established PPAP is deducted.
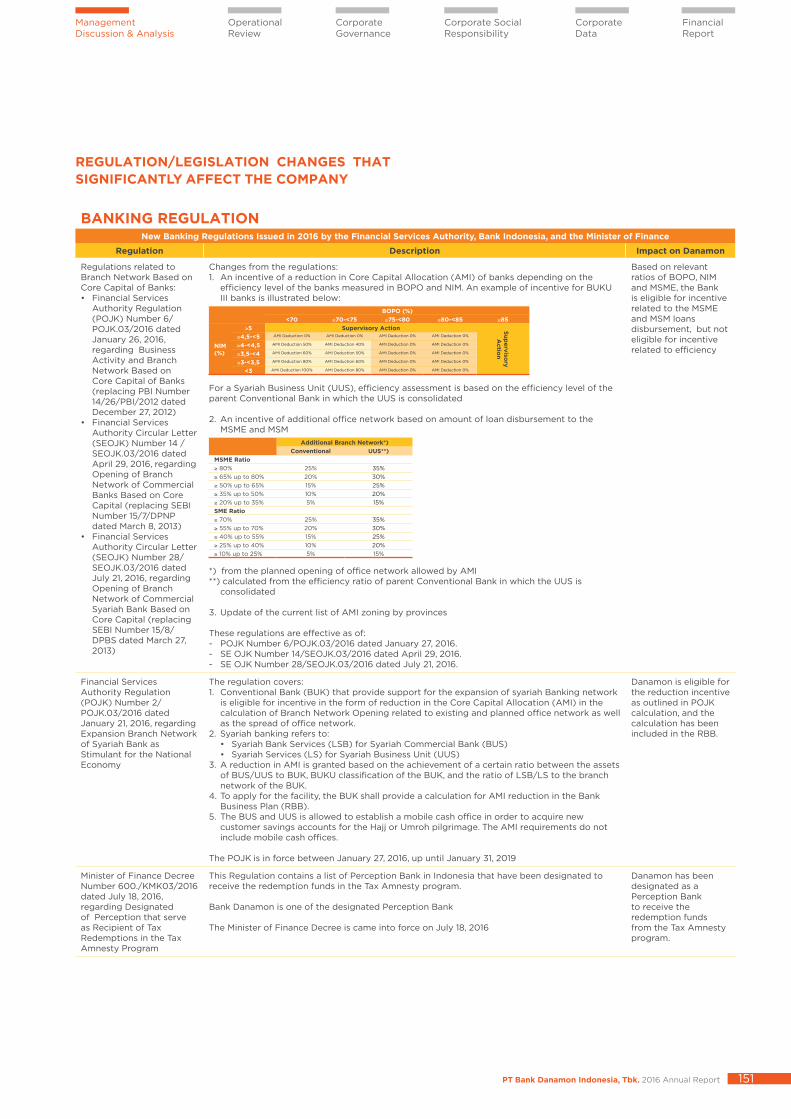
PT Bank Danamon Indonesia, Tbk. 2016 Annual Report 151
Operational Review
Management Discussion & Analysis
Corporate Governance
Corporate Social Responsibility
Corporate Data
Financial Report
REGULATION/LEGISLATION CHANGES THAT SIGNIFICANTLY AFFECT THE COMPANY
BANKING REGULATIONNew Banking Regulations Issued in 2016 by the Financial Services Authority, Bank Indonesia, and the Minister of Finance
Regulation Description Impact on Danamon
Regulations related to Branch Network Based on Core Capital of Banks:• Financial Services
Authority Regulation (POJK) Number 6/POJK.03/2016 dated January 26, 2016, regarding Business Activity and Branch Network Based on Core Capital of Banks (replacing PBI Number 14/26/PBI/2012 dated December 27, 2012)
• Financial Services Authority Circular Letter (SEOJK) Number 14 /SEOJK.03/2016 dated April 29, 2016, regarding Opening of Branch Network of Commercial Banks Based on Core Capital (replacing SEBI Number 15/7/DPNP dated March 8, 2013)
• Financial Services Authority Circular Letter (SEOJK) Number 28/SEOJK.03/2016 dated July 21, 2016, regarding Opening of Branch Network of Commercial Syariah Bank Based on Core Capital (replacing SEBI Number 15/8/DPBS dated March 27, 2013)
Changes from the regulations:1. An incentive of a reduction in Core Capital Allocation (AMI) of banks depending on the
efficiency level of the banks measured in BOPO and NIM. An example of incentive for BUKU III banks is illustrated below:
BOPO (%)<70 ≥70-<75 ≥75-<80 ≥80-<85 ≥85
NIM (%)
≥5 Supervisory Action Superviso
ry A
ction
≥4,5-<5 AMI Deduction 0% AMI Deduction 0% AMI Deduction 0% AMI Deduction 0%
≥4-<4,5 AMI Deduction 50% AMI Deduction 40% AMI Deduction 0% AMI Deduction 0%
≥3,5-<4 AMI Deduction 60% AMI Deduction 50% AMI Deduction 0% AMI Deduction 0%
≥3-<3,5 AMI Deduction 80% AMI Deduction 60% AMI Deduction 0% AMI Deduction 0%
<3 AMI Deduction 100% AMI Deduction 80% AMI Deduction 0% AMI Deduction 0%
For a Syariah Business Unit (UUS), efficiency assessment is based on the efficiency level of the parent Conventional Bank in which the UUS is consolidated
2. An incentive of additional office network based on amount of loan disbursement to the MSME and MSM
Additional Branch Network*)Conventional UUS**)
MSME Ratio≥ 80% 25% 35%≥ 65% up to 80% 20% 30%≥ 50% up to 65% 15% 25%≥ 35% up to 50% 10% 20%≥ 20% up to 35% 5% 15%SME Ratio≥ 70% 25% 35%≥ 55% up to 70% 20% 30%≥ 40% up to 55% 15% 25%≥ 25% up to 40% 10% 20%≥ 10% up to 25% 5% 15%
*) from the planned opening of office network allowed by AMI**) calculated from the efficiency ratio of parent Conventional Bank in which the UUS is
consolidated
3. Update of the current list of AMI zoning by provinces
These regulations are effective as of:- POJK Number 6/POJK.03/2016 dated January 27, 2016.- SE OJK Number 14/SEOJK.03/2016 dated April 29, 2016.- SE OJK Number 28/SEOJK.03/2016 dated July 21, 2016.
Based on relevant ratios of BOPO, NIM and MSME, the Bank is eligible for incentive related to the MSME and MSM loans disbursement, but not eligible for incentive related to efficiency
Financial Services Authority Regulation (POJK) Number 2/POJK.03/2016 dated January 21, 2016, regarding Expansion Branch Network of Syariah Bank as Stimulant for the National Economy
The regulation covers:1. Conventional Bank (BUK) that provide support for the expansion of syariah Banking network
is eligible for incentive in the form of reduction in the Core Capital Allocation (AMI) in the calculation of Branch Network Opening related to existing and planned office network as well as the spread of office network.
2. Syariah banking refers to:• Syariah Bank Services (LSB) for Syariah Commercial Bank (BUS)• Syariah Services (LS) for Syariah Business Unit (UUS)
3. A reduction in AMI is granted based on the achievement of a certain ratio between the assets of BUS/UUS to BUK, BUKU classification of the BUK, and the ratio of LSB/LS to the branch network of the BUK.
4. To apply for the facility, the BUK shall provide a calculation for AMI reduction in the Bank Business Plan (RBB).
5. The BUS and UUS is allowed to establish a mobile cash office in order to acquire new customer savings accounts for the Hajj or Umroh pilgrimage. The AMI requirements do not include mobile cash offices.
The POJK is in force between January 27, 2016, up until January 31, 2019
Danamon is eligible for the reduction incentive as outlined in POJK calculation, and the calculation has been included in the RBB.
Minister of Finance Decree Number 600./KMK03/2016 dated July 18, 2016, regarding Designated of Perception that serve as Recipient of Tax Redemptions in the Tax Amnesty Program
This Regulation contains a list of Perception Bank in Indonesia that have been designated to receive the redemption funds in the Tax Amnesty program.
Bank Danamon is one of the designated Perception Bank
The Minister of Finance Decree is came into force on July 18, 2016
Danamon has been designated as a Perception Bank to receive the redemption funds from the Tax Amnesty program.
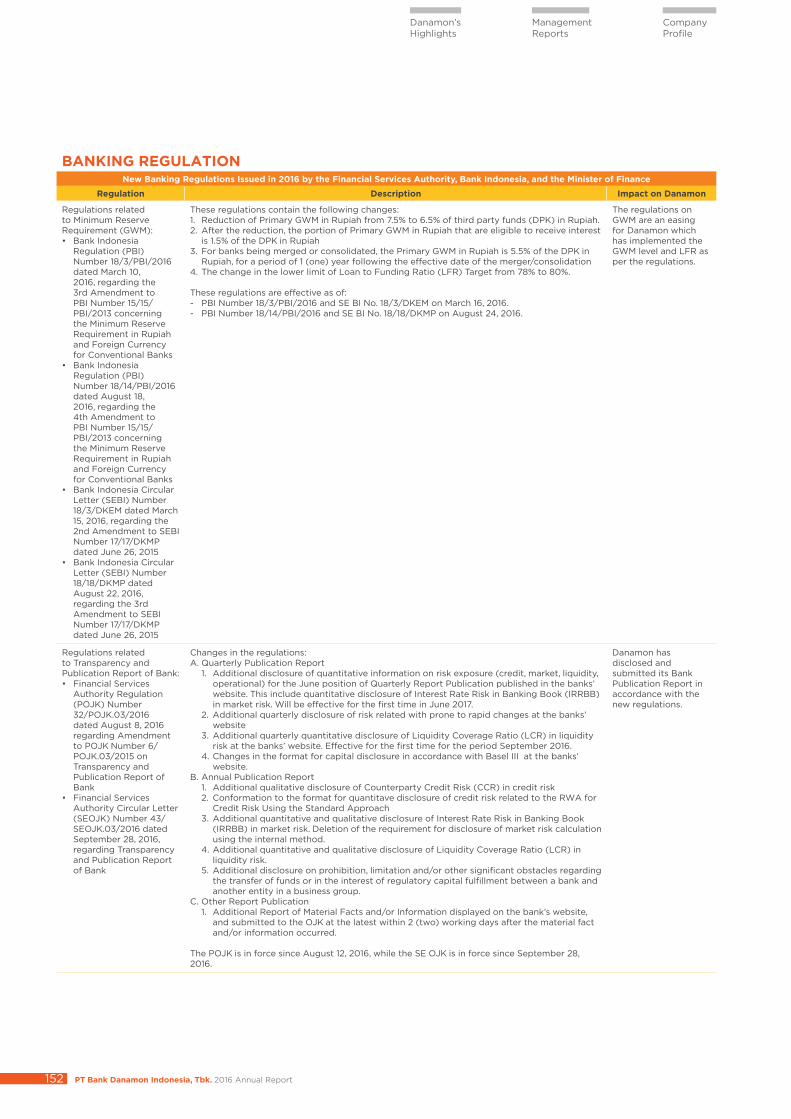
PT Bank Danamon Indonesia, Tbk. 2016 Annual Report152
Danamon’s Highlights
Management Reports
Company Profile
BANKING REGULATIONNew Banking Regulations Issued in 2016 by the Financial Services Authority, Bank Indonesia, and the Minister of Finance
Regulation Description Impact on Danamon
Regulations related to Minimum Reserve Requirement (GWM):• Bank Indonesia
Regulation (PBI) Number 18/3/PBI/2016 dated March 10, 2016, regarding the 3rd Amendment to PBI Number 15/15/PBI/2013 concerning the Minimum Reserve Requirement in Rupiah and Foreign Currency for Conventional Banks
• Bank Indonesia Regulation (PBI) Number 18/14/PBI/2016 dated August 18, 2016, regarding the 4th Amendment to PBI Number 15/15/PBI/2013 concerning the Minimum Reserve Requirement in Rupiah and Foreign Currency for Conventional Banks
• Bank Indonesia Circular Letter (SEBI) Number 18/3/DKEM dated March 15, 2016, regarding the 2nd Amendment to SEBI Number 17/17/DKMP dated June 26, 2015
• Bank Indonesia Circular Letter (SEBI) Number 18/18/DKMP dated August 22, 2016, regarding the 3rd Amendment to SEBI Number 17/17/DKMP dated June 26, 2015
These regulations contain the following changes:1. Reduction of Primary GWM in Rupiah from 7.5% to 6.5% of third party funds (DPK) in Rupiah.2. After the reduction, the portion of Primary GWM in Rupiah that are eligible to receive interest
is 1.5% of the DPK in Rupiah3. For banks being merged or consolidated, the Primary GWM in Rupiah is 5.5% of the DPK in
Rupiah, for a period of 1 (one) year following the effective date of the merger/consolidation4. The change in the lower limit of Loan to Funding Ratio (LFR) Target from 78% to 80%.
These regulations are effective as of:- PBI Number 18/3/PBI/2016 and SE BI No. 18/3/DKEM on March 16, 2016.- PBI Number 18/14/PBI/2016 and SE BI No. 18/18/DKMP on August 24, 2016.
The regulations on GWM are an easing for Danamon which has implemented the GWM level and LFR as per the regulations.
Regulations related to Transparency and Publication Report of Bank:• Financial Services
Authority Regulation (POJK) Number 32/POJK.03/2016 dated August 8, 2016 regarding Amendment to POJK Number 6/POJK.03/2015 on Transparency and Publication Report of Bank
• Financial Services Authority Circular Letter (SEOJK) Number 43/SEOJK.03/2016 dated September 28, 2016, regarding Transparency and Publication Report of Bank
Changes in the regulations:A. Quarterly Publication Report
1. Additional disclosure of quantitative information on risk exposure (credit, market, liquidity, operational) for the June position of Quarterly Report Publication published in the banks’ website. This include quantitative disclosure of Interest Rate Risk in Banking Book (IRRBB) in market risk. Will be effective for the first time in June 2017.
2. Additional quarterly disclosure of risk related with prone to rapid changes at the banks’ website
3. Additional quarterly quantitative disclosure of Liquidity Coverage Ratio (LCR) in liquidity risk at the banks’ website. Effective for the first time for the period September 2016.
4. Changes in the format for capital disclosure in accordance with Basel III at the banks’ website.
B. Annual Publication Report1. Additional qualitative disclosure of Counterparty Credit Risk (CCR) in credit risk 2. Conformation to the format for quantitave disclosure of credit risk related to the RWA for
Credit Risk Using the Standard Approach3. Additional quantitative and qualitative disclosure of Interest Rate Risk in Banking Book
(IRRBB) in market risk. Deletion of the requirement for disclosure of market risk calculation using the internal method.
4. Additional quantitative and qualitative disclosure of Liquidity Coverage Ratio (LCR) in liquidity risk.
5. Additional disclosure on prohibition, limitation and/or other significant obstacles regarding the transfer of funds or in the interest of regulatory capital fulfillment between a bank and another entity in a business group.
C. Other Report Publication1. Additional Report of Material Facts and/or Information displayed on the bank’s website,
and submitted to the OJK at the latest within 2 (two) working days after the material fact and/or information occurred.
The POJK is in force since August 12, 2016, while the SE OJK is in force since September 28, 2016.
Danamon has disclosed and submitted its Bank Publication Report in accordance with the new regulations.
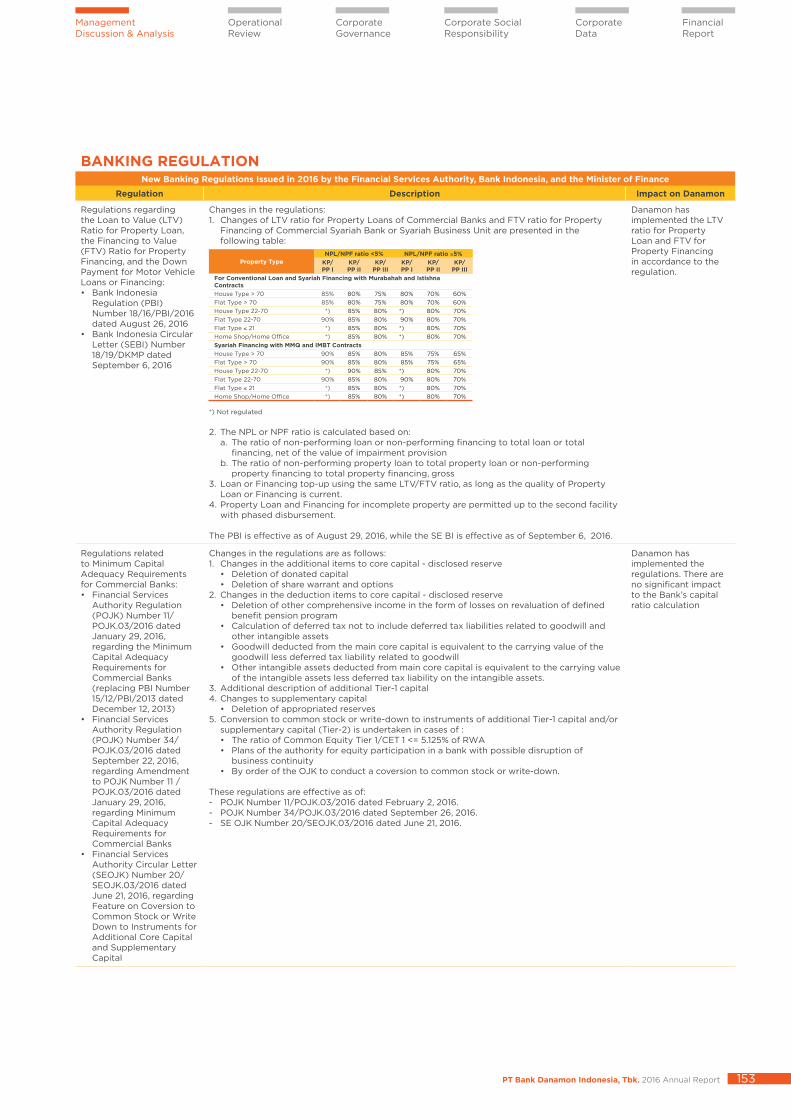
PT Bank Danamon Indonesia, Tbk. 2016 Annual Report 153
Operational Review
Management Discussion & Analysis
Corporate Governance
Corporate Social Responsibility
Corporate Data
Financial Report
BANKING REGULATIONNew Banking Regulations Issued in 2016 by the Financial Services Authority, Bank Indonesia, and the Minister of Finance
Regulation Description Impact on Danamon
Regulations regarding the Loan to Value (LTV) Ratio for Property Loan, the Financing to Value (FTV) Ratio for Property Financing, and the Down Payment for Motor Vehicle Loans or Financing:• Bank Indonesia
Regulation (PBI) Number 18/16/PBI/2016 dated August 26, 2016
• Bank Indonesia Circular Letter (SEBI) Number 18/19/DKMP dated September 6, 2016
Changes in the regulations:1. Changes of LTV ratio for Property Loans of Commercial Banks and FTV ratio for Property
Financing of Commercial Syariah Bank or Syariah Business Unit are presented in the following table:
Property TypeNPL/NPF ratio <5% NPL/NPF ratio ≥5%
KP/PP I
KP/PP II
KP/PP III
KP/PP I
KP/PP II
KP/PP III
For Conventional Loan and Syariah Financing with Murabahah and Istishna ContractsHouse Type > 70 85% 80% 75% 80% 70% 60%Flat Type > 70 85% 80% 75% 80% 70% 60%House Type 22-70 *) 85% 80% *) 80% 70%Flat Type 22-70 90% 85% 80% 90% 80% 70%Flat Type ≤ 21 *) 85% 80% *) 80% 70%Home Shop/Home Office *) 85% 80% *) 80% 70%Syariah Financing with MMQ and IMBT ContractsHouse Type > 70 90% 85% 80% 85% 75% 65%Flat Type > 70 90% 85% 80% 85% 75% 65%House Type 22-70 *) 90% 85% *) 80% 70%Flat Type 22-70 90% 85% 80% 90% 80% 70%Flat Type ≤ 21 *) 85% 80% *) 80% 70%Home Shop/Home Office *) 85% 80% *) 80% 70%
*) Not regulated
2. The NPL or NPF ratio is calculated based on:a. The ratio of non-performing loan or non-performing financing to total loan or total
financing, net of the value of impairment provisionb. The ratio of non-performing property loan to total property loan or non-performing
property financing to total property financing, gross3. Loan or Financing top-up using the same LTV/FTV ratio, as long as the quality of Property
Loan or Financing is current.4. Property Loan and Financing for incomplete property are permitted up to the second facility
with phased disbursement.
The PBI is effective as of August 29, 2016, while the SE BI is effective as of September 6, 2016.
Danamon has implemented the LTV ratio for Property Loan and FTV for Property Financing in accordance to the regulation.
Regulations related to Minimum Capital Adequacy Requirements for Commercial Banks:• Financial Services
Authority Regulation (POJK) Number 11/POJK.03/2016 dated January 29, 2016, regarding the Minimum Capital Adequacy Requirements for Commercial Banks (replacing PBI Number 15/12/PBI/2013 dated December 12, 2013)
• Financial Services Authority Regulation (POJK) Number 34/POJK.03/2016 dated September 22, 2016, regarding Amendment to POJK Number 11 /POJK.03/2016 dated January 29, 2016, regarding Minimum Capital Adequacy Requirements for Commercial Banks
• Financial Services Authority Circular Letter (SEOJK) Number 20/SEOJK.03/2016 dated June 21, 2016, regarding Feature on Coversion to Common Stock or Write Down to Instruments for Additional Core Capital and Supplementary Capital
Changes in the regulations are as follows:1. Changes in the additional items to core capital - disclosed reserve
• Deletion of donated capital • Deletion of share warrant and options
2. Changes in the deduction items to core capital - disclosed reserve • Deletion of other comprehensive income in the form of losses on revaluation of defined
benefit pension program • Calculation of deferred tax not to include deferred tax liabilities related to goodwill and
other intangible assets • Goodwill deducted from the main core capital is equivalent to the carrying value of the
goodwill less deferred tax liability related to goodwill• Other intangible assets deducted from main core capital is equivalent to the carrying value
of the intangible assets less deferred tax liability on the intangible assets.3. Additional description of additional Tier-1 capital 4. Changes to supplementary capital
• Deletion of appropriated reserves 5. Conversion to common stock or write-down to instruments of additional Tier-1 capital and/or
supplementary capital (Tier-2) is undertaken in cases of : • The ratio of Common Equity Tier 1/CET 1 <= 5.125% of RWA• Plans of the authority for equity participation in a bank with possible disruption of
business continuity • By order of the OJK to conduct a coversion to common stock or write-down.
These regulations are effective as of:- POJK Number 11/POJK.03/2016 dated February 2, 2016.- POJK Number 34/POJK.03/2016 dated September 26, 2016.- SE OJK Number 20/SEOJK.03/2016 dated June 21, 2016.
Danamon has implemented the regulations. There are no significant impact to the Bank’s capital ratio calculation
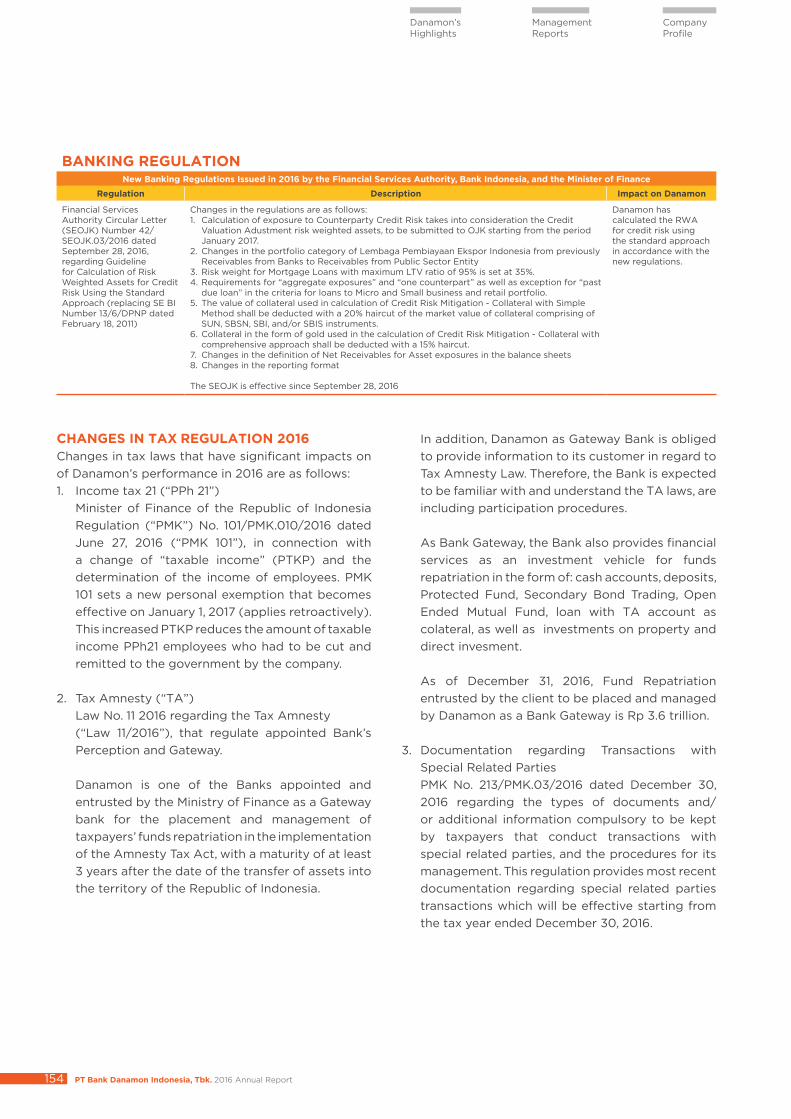
PT Bank Danamon Indonesia, Tbk. 2016 Annual Report154
Danamon’s Highlights
Management Reports
Company Profile
BANKING REGULATIONNew Banking Regulations Issued in 2016 by the Financial Services Authority, Bank Indonesia, and the Minister of Finance
Regulation Description Impact on Danamon
Financial Services Authority Circular Letter (SEOJK) Number 42/SEOJK.03/2016 dated September 28, 2016, regarding Guideline for Calculation of Risk Weighted Assets for Credit Risk Using the Standard Approach (replacing SE BI Number 13/6/DPNP dated February 18, 2011)
Changes in the regulations are as follows:1. Calculation of exposure to Counterparty Credit Risk takes into consideration the Credit
Valuation Adustment risk weighted assets, to be submitted to OJK starting from the period January 2017.
2. Changes in the portfolio category of Lembaga Pembiayaan Ekspor Indonesia from previously Receivables from Banks to Receivables from Public Sector Entity
3. Risk weight for Mortgage Loans with maximum LTV ratio of 95% is set at 35%.4. Requirements for “aggregate exposures” and “one counterpart” as well as exception for “past
due loan” in the criteria for loans to Micro and Small business and retail portfolio.5. The value of collateral used in calculation of Credit Risk Mitigation - Collateral with Simple
Method shall be deducted with a 20% haircut of the market value of collateral comprising of SUN, SBSN, SBI, and/or SBIS instruments.
6. Collateral in the form of gold used in the calculation of Credit Risk Mitigation - Collateral with comprehensive approach shall be deducted with a 15% haircut.
7. Changes in the definition of Net Receivables for Asset exposures in the balance sheets 8. Changes in the reporting format
The SEOJK is effective since September 28, 2016
Danamon has calculated the RWA for credit risk using the standard approach in accordance with the new regulations.
CHANGES IN TAX REGULATION 2016Changes in tax laws that have significant impacts on of Danamon’s performance in 2016 are as follows:1. Income tax 21 (“PPh 21”) Minister of Finance of the Republic of Indonesia
Regulation (“PMK”) No. 101/PMK.010/2016 dated June 27, 2016 (“PMK 101”), in connection with a change of “taxable income” (PTKP) and the determination of the income of employees. PMK 101 sets a new personal exemption that becomes effective on January 1, 2017 (applies retroactively). This increased PTKP reduces the amount of taxable income PPh21 employees who had to be cut and remitted to the government by the company.
2. Tax Amnesty (“TA”) Law No. 11 2016 regarding the Tax Amnesty (“Law 11/2016”), that regulate appointed Bank’s
Perception and Gateway.
Danamon is one of the Banks appointed and entrusted by the Ministry of Finance as a Gateway bank for the placement and management of taxpayers’ funds repatriation in the implementation of the Amnesty Tax Act, with a maturity of at least 3 years after the date of the transfer of assets into the territory of the Republic of Indonesia.
In addition, Danamon as Gateway Bank is obliged to provide information to its customer in regard to Tax Amnesty Law. Therefore, the Bank is expected to be familiar with and understand the TA laws, are including participation procedures.
As Bank Gateway, the Bank also provides financial services as an investment vehicle for funds repatriation in the form of: cash accounts, deposits, Protected Fund, Secondary Bond Trading, Open Ended Mutual Fund, loan with TA account as colateral, as well as investments on property and direct invesment.
As of December 31, 2016, Fund Repatriation
entrusted by the client to be placed and managed by Danamon as a Bank Gateway is Rp 3.6 trillion.
3. Documentation regarding Transactions with Special Related Parties
PMK No. 213/PMK.03/2016 dated December 30, 2016 regarding the types of documents and/or additional information compulsory to be kept by taxpayers that conduct transactions with special related parties, and the procedures for its management. This regulation provides most recent documentation regarding special related parties transactions which will be effective starting from the tax year ended December 30, 2016.
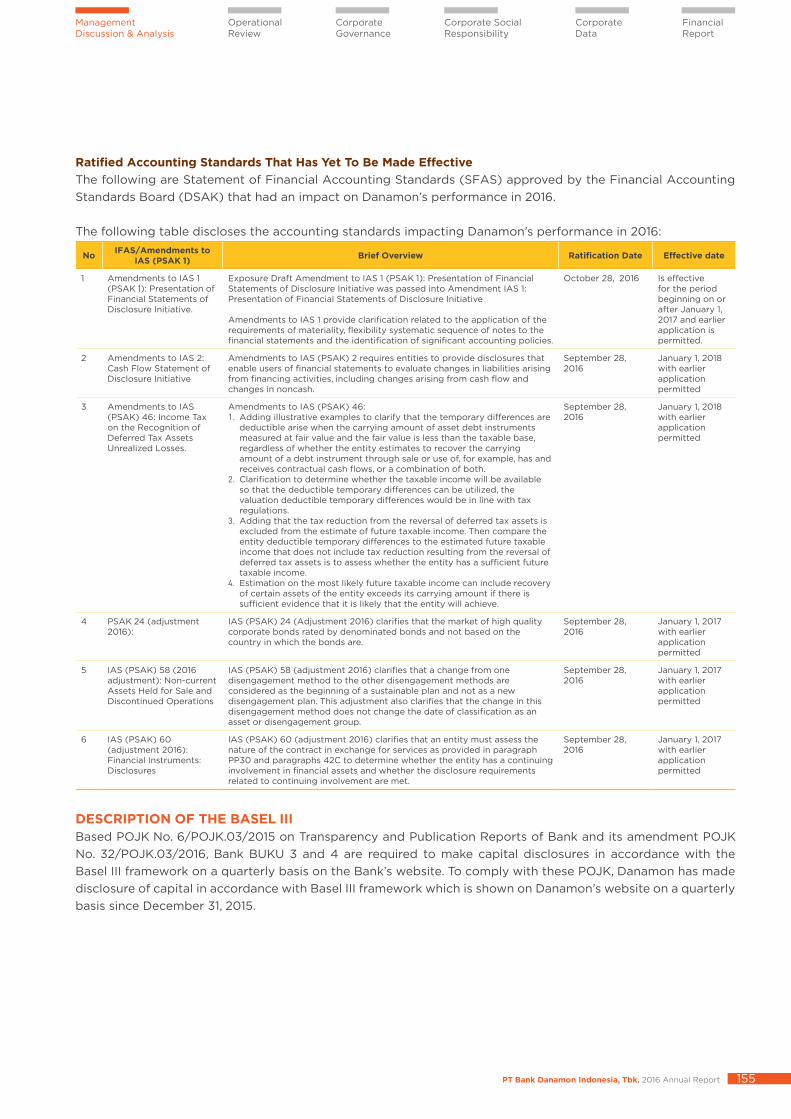
PT Bank Danamon Indonesia, Tbk. 2016 Annual Report 155
Operational Review
Management Discussion & Analysis
Corporate Governance
Corporate Social Responsibility
Corporate Data
Financial Report
Ratified Accounting Standards That Has Yet To Be Made Effective The following are Statement of Financial Accounting Standards (SFAS) approved by the Financial Accounting Standards Board (DSAK) that had an impact on Danamon’s performance in 2016.
The following table discloses the accounting standards impacting Danamon’s performance in 2016:
No IFAS/Amendments to IAS (PSAK 1) Brief Overview Ratification Date Effective date
1 Amendments to IAS 1 (PSAK 1): Presentation of Financial Statements of Disclosure Initiative.
Exposure Draft Amendment to IAS 1 (PSAK 1): Presentation of Financial Statements of Disclosure Initiative was passed into Amendment IAS 1: Presentation of Financial Statements of Disclosure Initiative Amendments to IAS 1 provide clarification related to the application of the requirements of materiality, flexibility systematic sequence of notes to the financial statements and the identification of significant accounting policies.
October 28, 2016 Is effective for the period beginning on or after January 1, 2017 and earlier application is permitted.
2 Amendments to IAS 2: Cash Flow Statement of Disclosure Initiative
Amendments to IAS (PSAK) 2 requires entities to provide disclosures that enable users of financial statements to evaluate changes in liabilities arising from financing activities, including changes arising from cash flow and changes in noncash.
September 28, 2016
January 1, 2018 with earlier application permitted
3 Amendments to IAS (PSAK) 46: Income Tax on the Recognition of Deferred Tax Assets Unrealized Losses.
Amendments to IAS (PSAK) 46:1. Adding illustrative examples to clarify that the temporary differences are
deductible arise when the carrying amount of asset debt instruments measured at fair value and the fair value is less than the taxable base, regardless of whether the entity estimates to recover the carrying amount of a debt instrument through sale or use of, for example, has and receives contractual cash flows, or a combination of both.
2. Clarification to determine whether the taxable income will be available so that the deductible temporary differences can be utilized, the valuation deductible temporary differences would be in line with tax regulations.
3. Adding that the tax reduction from the reversal of deferred tax assets is excluded from the estimate of future taxable income. Then compare the entity deductible temporary differences to the estimated future taxable income that does not include tax reduction resulting from the reversal of deferred tax assets is to assess whether the entity has a sufficient future taxable income.
4. Estimation on the most likely future taxable income can include recovery of certain assets of the entity exceeds its carrying amount if there is sufficient evidence that it is likely that the entity will achieve.
September 28, 2016
January 1, 2018 with earlier application permitted
4 PSAK 24 (adjustment 2016):
IAS (PSAK) 24 (Adjustment 2016) clarifies that the market of high quality corporate bonds rated by denominated bonds and not based on the country in which the bonds are.
September 28, 2016
January 1, 2017 with earlier application permitted
5 IAS (PSAK) 58 (2016 adjustment): Non-current Assets Held for Sale and Discontinued Operations
IAS (PSAK) 58 (adjustment 2016) clarifies that a change from one disengagement method to the other disengagement methods are considered as the beginning of a sustainable plan and not as a new disengagement plan. This adjustment also clarifies that the change in this disengagement method does not change the date of classification as an asset or disengagement group.
September 28, 2016
January 1, 2017 with earlier application permitted
6 IAS (PSAK) 60 (adjustment 2016): Financial Instruments: Disclosures
IAS (PSAK) 60 (adjustment 2016) clarifies that an entity must assess the nature of the contract in exchange for services as provided in paragraph PP30 and paragraphs 42C to determine whether the entity has a continuing involvement in financial assets and whether the disclosure requirements related to continuing involvement are met.
September 28, 2016
January 1, 2017 with earlier application permitted
DESCRIPTION OF THE BASEL III Based POJK No. 6/POJK.03/2015 on Transparency and Publication Reports of Bank and its amendment POJK No. 32/POJK.03/2016, Bank BUKU 3 and 4 are required to make capital disclosures in accordance with the Basel III framework on a quarterly basis on the Bank’s website. To comply with these POJK, Danamon has made disclosure of capital in accordance with Basel III framework which is shown on Danamon’s website on a quarterly basis since December 31, 2015.