fortress europe in long-term perspective: agricultural ... · "fortress europe" in...
TRANSCRIPT
"Fortress Europe" in Long-term Perspective: Agricultural Protection in the European Community, 1957-2003
Mark Spoerer
Abstract: Since its inception, the European Union’s Common Agricultural Policy (CAP) has been discussed controversially. Based on data compiled by the OECD and the World Bank which have so far not been used for historical research, we show that the protectionist effects of the CAP between the 1960s and the 1980s were larger than those of its national predecessors. Moreover, there is evidence that already the piecemeal re-forms of the 1980s reduced the level of protection and support in the EU, that is prior to the MacSharry reform of 1992.
The history of European integration is usually told as a success story. Countries that used to fight against each other for centuries decided to cooperate politically as well as economically and established supranational institutions. More than half a century after its foundation, the European Union forms an umbrella under which its member states pursue common interests or compete peacefully for resources and markets.1 At least for the core of the states that joined the European Union before the turn of the century, the very idea that neighbouring states take up arms to resolve conflicts is hardly con-ceivable. By all political standards this is indeed a tremendous success.
This historical achievement, however, did not come without cost. As numerous states have to coordinate their decision-making, costly institutions emerged to manage the European Union. The notorious 'bureaucrats in Brussels', though, cost the Euro-pean taxpayer not more than 0.06 per cent of the combined gross national income (GNI) of the EU member states.2 Even if some bureaucratic excesses may call for ra-tionalization, the EU's political coordination costs are quantitatively negligible.
For an assessment of the true costs of the European Union it is not sufficient to consider administration costs alone. A more interesting issue is whether the policies pursued by the EU caused costs that feasible alternatives would not have had. In this respect the EU's Common Agricultural Policy (CAP) comes immediately to mind. In the first three decades of the EU it was the CAP that received by far most public attention, to an extent that the CAP seemed at times to be nearly congruent with EU politics. This was mirrored by the EU budget, the expenditure side of which was (and still is) domi-nated by the CAP, with its share peaking at 90 per cent in 1970.3
Yet the CAP cost European consumers and taxpayers much more than what was visible in the EU budgets. European farmers enjoyed high protection levels against cheaper imports and even received subsidies to export their production surpluses. This may be interpreted as a huge redistribution program from the non-agricultural sectors to agriculture. In total, however, the costs borne by taxpayers and consumers were larger than the farmers’ benefits because high prices crowded out consumer demand and the subsidized expansion of European agriculture bound labour and capital re-
1 Throughout this article the term 'European Union' will be used for its predecessors as well: EEC -
European Economic Community and EC - European Community. I would like to thank the German Historical Institute Paris and the Deutsche Forschungsgemeinschaft for generous funding of this research project and Carine Germond, Fernando Guirao, Markus Hofreither, Cathérine Moreddu, Katja Seidel and Stefan Tangermann for very helpful comments on earlier drafts of this paper and Michael Buchner and Valentin Kreilinger for very able research assistance.
2 Calculated from European Commission, EU Budget 2008: Financial Report, Office for Official Publications of the European Communities, Luxembourg, 2009, pp.77-83.
3 EAGGF Guarantee Section plus related structural funds, calculated from ibid., p.78.
2
sources that might have been used more productively in other parts of the economy. Hence the CAP was not just a zero-sum game. The purpose of this paper is to present first results of a larger exercise aimed at estimating the full costs of the CAP, thus supplementing historians' EU success stories with the sober results of the cost side. Within the EU taxpayers and consumers incurred these costs while farmers benefited. Outside the EU the CAP was criticized for its pro-tectionist effects. In this paper, we are particularly interested in the degree of agricul-tural protection caused by the CAP and its development over the last half century. This will allow us to assess the validity of two arguments that are often repeated. First, that the EU's Common Agricultural Policy just continued national agricultural policies, and second, that the MacSharry reform of 1992 led to a substantial reduction of agricultural protection in the EU.4
The empirical backbone of this undertaking are two databases measuring agri-cultural protection set up by the Organization for Economic Co-operation and Devel-opment (OECD) and the World Bank, respectively. While the World Bank database has not yet been exploited for historical research, that of the OECD has only very recently been used by economic history research, in a pioneering article by Giovanni Federico.5 From a conceptual point of view the OECD database is ideal for the purposes pursued here. Its drawback, however, is that it starts only with the year 1979 and underwent a fundamental conceptual change for the years since 1986. The World Bank database builds on the OECD data and goes, for some countries at least, back to 1956. The economic concepts underlying these databases are compatible so that the two data-bases combined cover the main member states of the EU.
A cautionary remark needs to be made. The findings presented here are in themselves not sufficient for a normative assessment of the CAP. Apart from the politi-cal benefits of the CAP – paying for an inefficient supranational policy is certainly more sensible than to wage war against each other – and its non-agricultural economic bene-fits – to achieve France's consent for the Common Market some form of agricultural policy coordination was considered a conditio sine qua non in the early 1960s – it is now widely accepted that certain agricultural activities produce positive external effects for which farmers should be rewarded. In particular, the preservation of a historically emerged landscape is a public good for which modern societies are willing to pay. This argument is not necessarily ahistorical. What is described here in sober notions of wel-fare economics may have been felt by politicians and taxpayers of the 1960s as well, even though it was expressed in terms like 'tradition', 'heritage', etc. In this respect this paper is far from pretending to deliver complete data for a normative assessment of the CAP – not addressing the benefits for farmers and the society, it is just confined to the cost side.
The paper proceeds as follows. In the first section we will briefly review the de-velopment of the CAP from its beginnings to the MacSharry reform of 1992, which is usually seen as a turning point in the history of the CAP. Section two discusses the OECD and World Bank databases and how they are combined for deriving the results which are presented in section three. Section four concludes.
4 M. TRACY, Government and Agriculture in Western Europe, 1880-1988, 3rd ed., Harvester
Wheatsheaf, New York, 1989, p.362; G. THIEMEYER, The failure of the Green Pool and the success of the CAP: long-term structures in European agricultural integration in the 1950s and 1960s, in: K.K. PATEL (ed.), Fertile Ground for Europe? The History of European Integration and the Common Agricultural Policy since 1945, Nomos, Baden-Baden, 2009, pp.47-59, here pp.53-54.
5 G. FEDERICO, Was the CAP the worst agricultural policy of the 20th century?, in: PATEL (ed.), Fertile Ground …, op.cit., pp.257-271.
3
1. Chronology: A Short Economic History of the CAP Up to the MacSharry Reform After World War II the United States wished to establish a new order in which European states cooperated and adhered to the principles of free trade. The process that led to the foundation of the European Economic Community (EEC) in March 1957 was not exactly what the United States had wished for, but the benefits of a politically united and capitalist Western Europe outweighed the costs of a customs union, which was but a second-best solution for the White House because of the trade-diverting effects. Mak-ing the customs union work was a painstaking process for the EEC member states that bound much diplomatic resources in the late 1950s and 1960s. In particular, France, keen to improve the trade balance by exporting agricultural surpluses to her neighbours, made clear that some form of a common European agricultural policy was a necessary prerequisite for a European customs union, a project favoured by Germany and its ex-port-oriented manufacturing sector. Indeed, given the weight of agriculture in the EU6-economies in the 1950s (on average 11 per cent of gross domestic product (GDP) in 1955-59), the perspective of large intra-EEC agricultural trade flows and the quite dif-ferent national regimes of agricultural support, a harmonization of agricultural policies was inevitable.6 In post-war Europe two agricultural subsidization regimes were in practice which relied either on direct payments (direct income support) or on market protection to raise the domestic price level artificially high (indirect income support). As Great Britain had exposed its agriculture to the competitive forces of the world market since the abolition of the corn laws in the 1840s, its agricultural sector was very small (1955-59: 4 per cent of GDP). Consumers profited from low food prices close to the world market level and the few remaining British farmers received tax-financed direct payments.7
In the other European countries, and especially in the countries that were to form the EEC in 1957, the situation was different. Domestic farmers had been protected by tariff barriers since the last quarter of the 19th century when the grain invasion from more efficient overseas producers had set in.8 Moreover, since the inter-war period many states had introduced quantity restrictions for imports.9 These protective meas-ures slowed down structural change and so the farm sectors were characterized by numerous and often very small farms, many of which would not survive in competitive markets. A customs union, even if it protected EU farmers as a whole from outward competition, would imply that comparably efficient agricultural producers like those in France or the Netherlands would expand at the cost of the less efficient ones in Italy or Germany. Direct income support as practiced in Great Britain would have been very costly, difficult to implement on a supranational scale (especially in Italy with its many
6 Calculated from B.R. MITCHELL, International historical statistics: Europe 1750-2005, 6th ed.,
Palgrave/Macmillan, Basingstoke et al., 2007, pp.1036-1039. 7 More in A.S. MILWARD, The European Rescue of the Nation State, Routledge, London, 1992, pp.
253-254; T.E. JOSLING, Western Europe, in: K. ANDERSON (ed.), Distortions to Agricultural Incentives: A Global Perspective, 1955-2007, Palgrave/Macmillan - World Bank, London/Washing-ton DC, 2009, pp.115-176, here p.126. Agricultural shares from B.R. MITCHELL, op.cit., pp.1037 and 1041.
8 See the classic study of K.H. O'ROURKE and J.G. WILLIAMSON, Globalization and History. The Evolution of a Nineteenth Century Atlantic Economy, MIT Press, Cambidge/Mass., 1999, chapters 3 and 6.
9 G. FEDERICO, Feeding the World. An Economic History of Agriculture, 1800-2000, Princeton Uni-versity Press, Princeton/Oxford, 2005, pp.191-196.
4
small farms) and would have faced opposition because it would have openly demon-strated that farmers could no longer earn their living on their own but rather were on welfare.10
The solution finally chosen in January 1962 followed the traditional pattern of continental European agricultural policy support. The CAP foresaw a system of politi-cally determined minimum prices which shielded less efficient producers from price competition of more efficient producers either from countries inside the customs union or outside. The produce of the latter was made dearer by import levies which varied according to the difference of the guaranteed minimum price and the world price. Intra-EEC competition in the agricultural sector was dampened by a system of border levies ('transitional compensatory amounts') which were to be phased out once the level of EEC-wide common prices was specified.11
Using price policy to conduct income policy was the original sin of the CAP. When the Council of Ministers chose this option in early 1962 there could be no doubt on the consequences. Already in 1958 the so-called Haberler Report, an expertise for the General Agreement on Tariffs and Trade (GATT) by a commission led by the Har-vard economist Gottfried Haberler, had clearly analyzed the consequences of such a policy. If a producer knows that all his output will sell at a guaranteed minimum price, he will expand production until his marginal costs equal the guarantee price.12 The Eu-ropean Commission was also well aware of this simple economic logic.13
Given the principal decision for common minimum prices, the decisive question was of course their level. Countries with less efficient producers like Italy and in particu-lar Germany argued for high prices whereas France feared their inflationary conse-quences for the consumers (and voters). After a long negotiation process in which Germany assumed the role of a veto player, the EU6 states opted for a quite high price level in December 1964.14 This enabled many German farms to survive and brought French farmers decent profits. The bill was paid by taxpayers and consumers who were not in the position to form powerful lobby groups able to influence the negotiations in the way the producer lobbies did.
Already before the introduction of common prices on July 1, 1967, European farmers proved that they understood the economic logic laid out in the Haberler Report. Once the first EEC-wide market regulations became effective in July 1962, agricultural production in the EU6 states grew strongly, leading to excess supplies which were ei-ther stored, destroyed or dumped on the world market. Butter mountains, milk and wine lakes, etc. symbolized the flawed policies of the CAP already in the mid-1960s.15
10 R. FENNELL, The Common Agricultural Policy: Continuity and Change, Clarendon, Oxford, 1997,
pp.101-102; A.-C. L. KNUDSEN, Farmers on Welfare: The Making of Europe's Common Agricultural Policy, Cornell University Press, Ithaca, 2009, pp.232-251.
11 B.E. HILL, The Common Agricultural Policy: Past, present and future, Methuen, London, 1984, pp.22-23.
12 GATT, Trends in international trade: report by a panel of experts, GATT, Geneva, 1958, pp.82 and 87-102.
13 Europäische Wirtschaftsgemeinschaft, Erster Gesamtbericht über die Tätigkeit der Gemeinschaft, [Brussels], 1958, pp.74-75.
14 K.K. PATEL, Veto player no. 1? Germany and the creation of the EEC's Common Agricultural Policy, 1957-1964, in: M. GEHLER (ed.), From Common Market to European Union Building. 50 years of the Rome Treaties 1957-2007, Böhlau, Vienna, 2009, pp.349-370; A.-C. L. KNUDSEN, op.cit., pp.260-265; C. GERMOND, The agricultural bone of contention: the Franco-German tandem and the making of the CAP, in: Journal of European Integration History (this volume).
15 See, e.g., Der Butterberg, in: Der Volkswirt, 09.07.1965.
5
As early as 1969 the EEC had to give up the idea of a common price, one of the fundamental pillars of the original policy. Following a revaluation of the German mark and a devaluation of the French franc, the European Commission introduced the 'monetary compensatory amount' (MCA). As the devaluation made French farmers more competitive, they had to pay MCAs when they exported to other EEC member countries. In contrast, German farmers exporting to other member countries received MCAs so as to not have their competitive position deteriorated. As a consequence, considerable national price differences re-emerged in the supposedly 'common market', so that the introduction of the MCAs has often been interpreted as a renationalization of agricultural price policies.16 Later a 'switch-over' mechanism was introduced which re-lieved the farmers in the devaluing country while leaving the farmers in other countries eligible for MCAs. This contributed to further price increases.17
It did not necessarily require the expertise of economists to realize the perverse incentives of the price guarantee system. Yet once on its path, reforming the CAP proved to be extremely difficult.18 An important factor for reform was not so much eco-nomic insight but rather the need to avert budget crises. In fact, the CAP proved to be so expensive and the ensuing political deadlocks so intricate that at times the whole European project was called into question. The internal push for reform was intensified by external pressure on the EU. Its protection of European agricultural markets was a constant stumbling block in international trade rounds within the GATT and WTO framework (Kennedy, Tokyo, Uruguay, Doha rounds) and undermined the credibility of the EU.19
The European Commission drafted numerous reform proposals, but as the sys-tem of guaranteed prices was successfully defended by its beneficiaries the underlying problem was not approached.20 Instead of tackling it from the price side those propos-als that were put into practice introduced quantity limits (the milk quota 1984, 'producer co-responsibility', etc.). Only the reform package of 1992, named after the then com-missioner for agriculture, Ray MacSharry, decoupled income policy from price policy in the cereal sector. Prices were reduced and farmers were compensated by direct pay-ments, a quite similar system to the policy regime operative in Great Britain prior to ad-hesion to the European Community in 1973.21
16 E. RIEGER, The Common Agricultural Policy: External and internal dimensions, in: H. WALLACE,
W. WALLACE (eds.), Policy-Making in the European Union, Oxford, Oxford University Press, 1996, pp.97-123.
17 M.F. HOFREITHER, Origins and development of the Common Agricultural Policy, in: M. GEHLER, op.cit., pp.333-348.
18 A. KAY, Path dependency and the CAP, in: Journal of European Public Policy, 10(2003), pp.405-420.
19 T.E. JOSLING, S. TANGERMANN, T.K. WARLEY, Agriculture in the GATT, Macmillan, Basing-stoke, 1996; L. COPPOLARO, The Six, agriculture, and GATT: an international history of the CAP negotiations, 1958-1967, in: K.K. PATEL (ed.), Fertile Ground …, op.cit., pp.201-219.
20 See, e.g., K. SEIDEL, Taking farmers off welfare. The EEC Commission's memorandum "Agricul-ture 1980" of 1968, in: Journal of European Integration History (this volume).
21 The institutional history of the CAP has been subject of several studies mostly written by political scientists, see A. KAY, The Reform of the Common Agricultural Policy: The Case of the MacSharry Reforms, CABI Publ., Wallingford, 1998; E. FOUILLEUX, La Politique agricole commune et ses réformes: une politique à l'épreuve de la globalisation, L’Harmattan, Paris, 2003; I. GARZON, Reforming the Common Agricultural Policy: History of a Paradigm Change, Palgrave/Macmillan, Basingstoke, 2006. See for economically informed accounts B.E. HILL, op.cit., and R. FENNELL, op.cit.
6
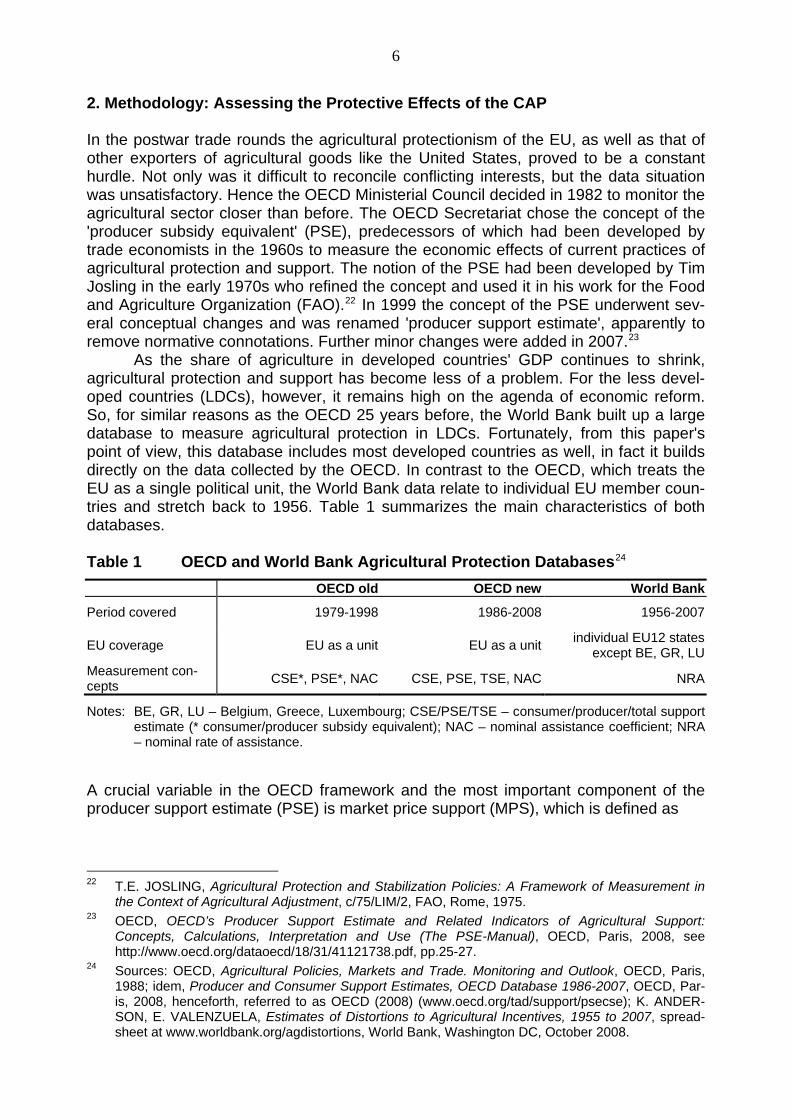
2. Methodology: Assessing the Protective Effects of the CAP In the postwar trade rounds the agricultural protectionism of the EU, as well as that of other exporters of agricultural goods like the United States, proved to be a constant hurdle. Not only was it difficult to reconcile conflicting interests, but the data situation was unsatisfactory. Hence the OECD Ministerial Council decided in 1982 to monitor the agricultural sector closer than before. The OECD Secretariat chose the concept of the 'producer subsidy equivalent' (PSE), predecessors of which had been developed by trade economists in the 1960s to measure the economic effects of current practices of agricultural protection and support. The notion of the PSE had been developed by Tim Josling in the early 1970s who refined the concept and used it in his work for the Food and Agriculture Organization (FAO).22 In 1999 the concept of the PSE underwent sev-eral conceptual changes and was renamed 'producer support estimate', apparently to remove normative connotations. Further minor changes were added in 2007.23
As the share of agriculture in developed countries' GDP continues to shrink, agricultural protection and support has become less of a problem. For the less devel-oped countries (LDCs), however, it remains high on the agenda of economic reform. So, for similar reasons as the OECD 25 years before, the World Bank built up a large database to measure agricultural protection in LDCs. Fortunately, from this paper's point of view, this database includes most developed countries as well, in fact it builds directly on the data collected by the OECD. In contrast to the OECD, which treats the EU as a single political unit, the World Bank data relate to individual EU member coun-tries and stretch back to 1956. Table 1 summarizes the main characteristics of both databases.
Table 1 OECD and World Bank Agricultural Protection Databases24 OECD old OECD new World Bank
Period covered 1979-1998 1986-2008 1956-2007
EU coverage EU as a unit EU as a unit individual EU12 states except BE, GR, LU
Measurement con-cepts CSE*, PSE*, NAC CSE, PSE, TSE, NAC NRA
Notes: BE, GR, LU – Belgium, Greece, Luxembourg; CSE/PSE/TSE – consumer/producer/total support estimate (* consumer/producer subsidy equivalent); NAC – nominal assistance coefficient; NRA – nominal rate of assistance.
A crucial variable in the OECD framework and the most important component of the producer support estimate (PSE) is market price support (MPS), which is defined as
22 T.E. JOSLING, Agricultural Protection and Stabilization Policies: A Framework of Measurement in
the Context of Agricultural Adjustment, c/75/LIM/2, FAO, Rome, 1975. 23 OECD, OECD’s Producer Support Estimate and Related Indicators of Agricultural Support:
Concepts, Calculations, Interpretation and Use (The PSE-Manual), OECD, Paris, 2008, see http://www.oecd.org/dataoecd/18/31/41121738.pdf, pp.25-27.
24 Sources: OECD, Agricultural Policies, Markets and Trade. Monitoring and Outlook, OECD, Paris, 1988; idem, Producer and Consumer Support Estimates, OECD Database 1986-2007, OECD, Par-is, 2008, henceforth, referred to as OECD (2008) (www.oecd.org/tad/support/psecse); K. ANDER-SON, E. VALENZUELA, Estimates of Distortions to Agricultural Incentives, 1955 to 2007, spread-sheet at www.worldbank.org/agdistortions, World Bank, Washington DC, October 2008.
7
"the annual monetary value of gross transfers from consumers and taxpayers to agricultural pro-ducers, measured at the farm gate level, arising from policy measures that support agriculture by creating a gap between domestic market prices and border prices of specific agricultural com-modities”.25
Basically, the MPS for a commodity is determined by adding together transfers to pro-ducers from consumers and taxpayers, which empirically corresponds to the quantity of domestic production multiplied by the difference between domestic market price and world price. In other words, MPS measures indirect support via price policies, i.e. pro-tection.
The PSE is a broader measurement concept and also includes direct subsidies, i.e. support. It is defined as
"the annual monetary value of gross transfers from consumers and taxpayers to agricultural pro-ducers, measured at the farm gate level, arising from policies that support agriculture, regardless of their nature, objectives or impacts on farm production or income”.26
The PSE for a country c is calculated by adding together MPSi for all commodities i and adding the aggregate Budgetary and Other Transfers to producers from policies (BOT).
Like the MPS, the PSE is a figure expressed in currency units. For international comparisons the OECD recommends non-dimensional measures like the Percentage PSE (%PSE) and the Producer Nominal Assistance Coefficient (NAC). In order to cal-culate %PSE, PSE is related to the value of Gross Farm Receipts (GFR), which is the sum of the Value of Production (VP) at domestic prices and BOT. Note that market pro-tection and support policies may inflate VP by lifting domestic prices over world prices and/or may result in paying direct subsidies (BOT). In the absence of any subsidies or protectionist policies, BOT = 0 and PSE = 0, and so GFR = VP = domestic production valued at world prices (or, in this case equivalent, at domestic prices) and %PSE = 0.
(1)
100*100*%c
c
cc
cc GFR
PSEBOTVP
PSEPSE =
+=
The producer NAC is just a transformation of %PSE. It is determined by dividing the value of gross farm receipts by the value of production at world prices, which is the val-ue of production at domestic prices less market price support:
(2)
c
c
cc
cc PSE
PSEMPSVP
GFRNAC%100
%1−
+=−
= The Agricultural Distortions Project of the World Bank bases its measures on the same conceptual framework as the OECD. For its database the World Bank has chosen the Nominal Rate of Assistance (NRA), which is NAC minus unity.27 In the absence of any assistance (subsidies or price-distorting policies) PSE is zero, NAC equals unity and NRA equals zero. As we find NAC slightly more intuitive than NRA, we will rely on this 25 OECD (2008), p.57. Prices at "farm gate level" or "border prices" correspond to domestic prices and
world prices, respectively. The economic concepts behind acronyms like PSE, NAC or NRA are derived from welfare and trade economics. In this paper, we will not go into the details. Basically, the OECD and the World Bank undertake a classical partial-analytical exercise. For a deeper analysis, see ibid.
26 Ibid., p.107, emphasis added by author. 27 Ibid., p.171.
8
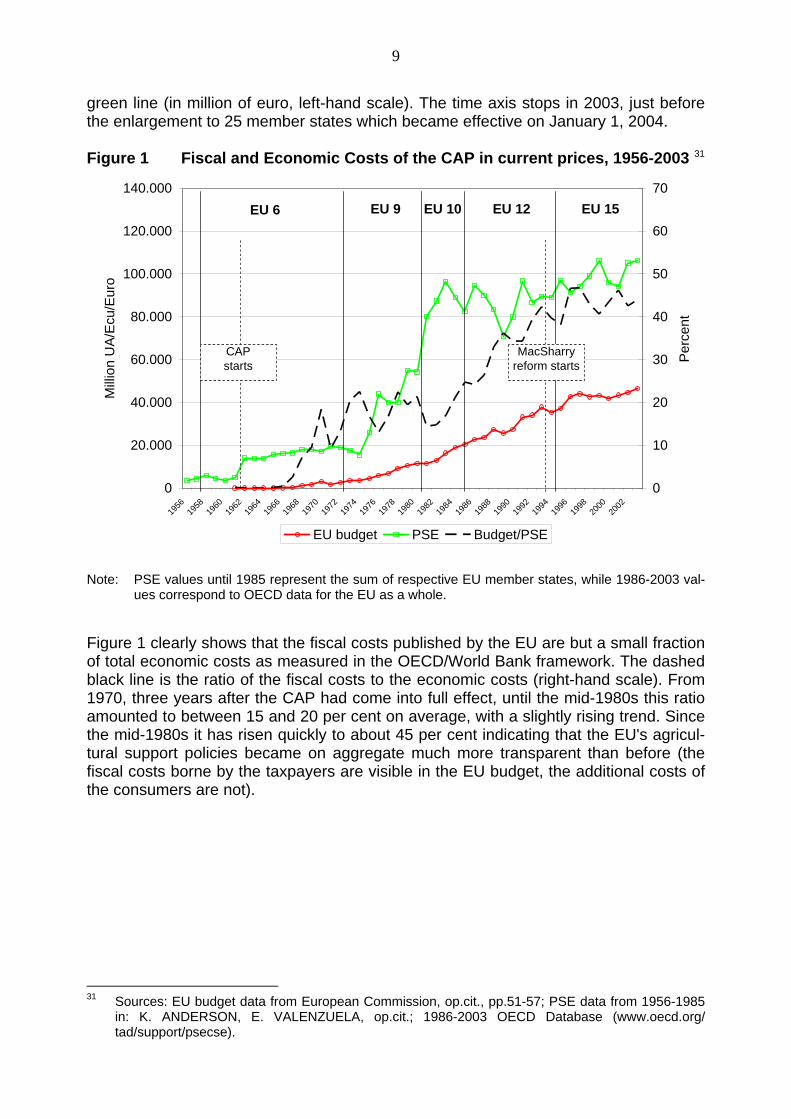
measure for international and intertemporal comparisons of agricultural protection and support. Before moving into the following section, the reader should note that the PSE and NAC values so-far discussed underestimate the true figures of protection and sup-port for at least two reasons. First, not all direct support measures on national and sub-national levels are included, in particular prior to 1986, and second, the 'welfare loss triangles' (consumer demand crowded out and inefficient resource allocation) are not accounted for. However, both effects are probably not large, and their exclusion cer-tainly does not change the overall picture. Note also that the economic costs we are about to discuss are different from the welfare costs in a typical welfare economic exer-cise. The main difference is that a large part of the economic costs are transfers to the farmers. While an analysis of the welfare costs might be interpreted as a net concept, our focus on the economic costs is a gross concept. 3. Results: Agricultural Protection and Support in the European Union We are now able to calculate the economic costs of the CAP and compare them to the fiscal costs. The fiscal costs are published in the EU budget and include expenditure for price guarantees (EAGGF Guarantee Section) and expenditure for structural measures (EAGGF Guidance Section). They are borne by the taxpayers and are plotted as red line in figure 1 (in million of euro, left-hand scale).
The economic costs are measured by the PSE concept using the OECD/World Bank data. In addition to the fiscal costs borne by the taxpayers, they also include those borne by the consumers who pay politically influenced prices for food directly or indirectly (if processed) subject to CAP regulation rather than (usually lower) world prices. As the World Bank's agricultural protection database does not include Belgium, Luxembourg and Greece we estimated the PSE for the EU6, EU9 and EU10 by adding up PSE for all other member countries and add a fictitious PSE for Belgium and Lux-embourg (90 per cent of the Dutch PSE) and for Greece (14 per cent of the Italian PSE).28 From 1986 onwards, we rely directly on the OECD's PSE data for the EU as a whole.29 The original PSE data are in US dollar. As our focus here is on the burden borne by taxpayers and consumers of the EU, the interpretation should not be blurred by the fluctuations of the US dollar. Hence we chose the European unit of account, Ecu and Euro as 'currency' (which, in the strict sense, it is only since 1999) for the compari-son and converted the PSE data accordingly.30 The economic costs are plotted as
28 The results are very similar if we assume that the combined PSE of Belgium and Luxembourg is
equal to that of the weighted average of the other EU member states. 29 We proceed as follows (variables taken from the World Bank database are in lower case letters):
NAC = nra_totd + 1, VP = vop_tot * NAC (in order to correct for the difference between domestic and world market prices) and BOT = nps. In order to check whether this interpretation of the World Bank database corresponds to equation (2) we compared the PSE figures calculated by this method from the World Bank database with the OECD's figures for Australia, Canada, Iceland, Japan, New Zealand, Norway, Switzerland and the US for 1986 to 2007. The correlation coefficient is 0.986.
30 In December 1952 the European Community for Steel and Coal created a parity unity of account (UA) for their budget, which was taken over by the European Communities. Initially the UA equaled one US$. When the Bretton Woods system broke down in 1971 and currencies floated, the EC pegged the UA to the gold value that the US$ had had between 1934 and 1971. The UA was re-placed by the Ecu in March 1979, which in turn gave way to the Euro in January 1999. The ex-change rate between the UA and the US$ was 1 until August 1971. The rates since 1971 are taken from Eurostat, table ert_bil_eur a (http://appsso.eurostat.ec.europa.eu/nui/show.do?dataset= ert_bil_eur_a&lang=en).
9
green line (in million of euro, left-hand scale). The time axis stops in 2003, just before the enlargement to 25 member states which became effective on January 1, 2004.
Figure 1 Fiscal and Economic Costs of the CAP in current prices, 1956-2003 31
0
20.000
40.000
60.000
80.000
100.000
120.000
140.000
1956
1958
1960
1962
1964
1966
1968
1970
1972
1974
1976
1978
1980
1982
1984
1986
1988
1990
1992
1994
1996
1998
2000
2002
Milli
on U
A/E
cu/E
uro
0
10
20
30
40
50
60
70
Per
cent
EU budget PSE Budget/PSE
EU 6 EU 9 EU 10 EU 12 EU 15
MacSharry reform starts
CAP starts
Note: PSE values until 1985 represent the sum of respective EU member states, while 1986-2003 val-ues correspond to OECD data for the EU as a whole.
Figure 1 clearly shows that the fiscal costs published by the EU are but a small fraction of total economic costs as measured in the OECD/World Bank framework. The dashed black line is the ratio of the fiscal costs to the economic costs (right-hand scale). From 1970, three years after the CAP had come into full effect, until the mid-1980s this ratio amounted to between 15 and 20 per cent on average, with a slightly rising trend. Since the mid-1980s it has risen quickly to about 45 per cent indicating that the EU's agricul-tural support policies became on aggregate much more transparent than before (the fiscal costs borne by the taxpayers are visible in the EU budget, the additional costs of the consumers are not).
31 Sources: EU budget data from European Commission, op.cit., pp.51-57; PSE data from 1956-1985
in: K. ANDERSON, E. VALENZUELA, op.cit.; 1986-2003 OECD Database (www.oecd.org/ tad/support/psecse).
10
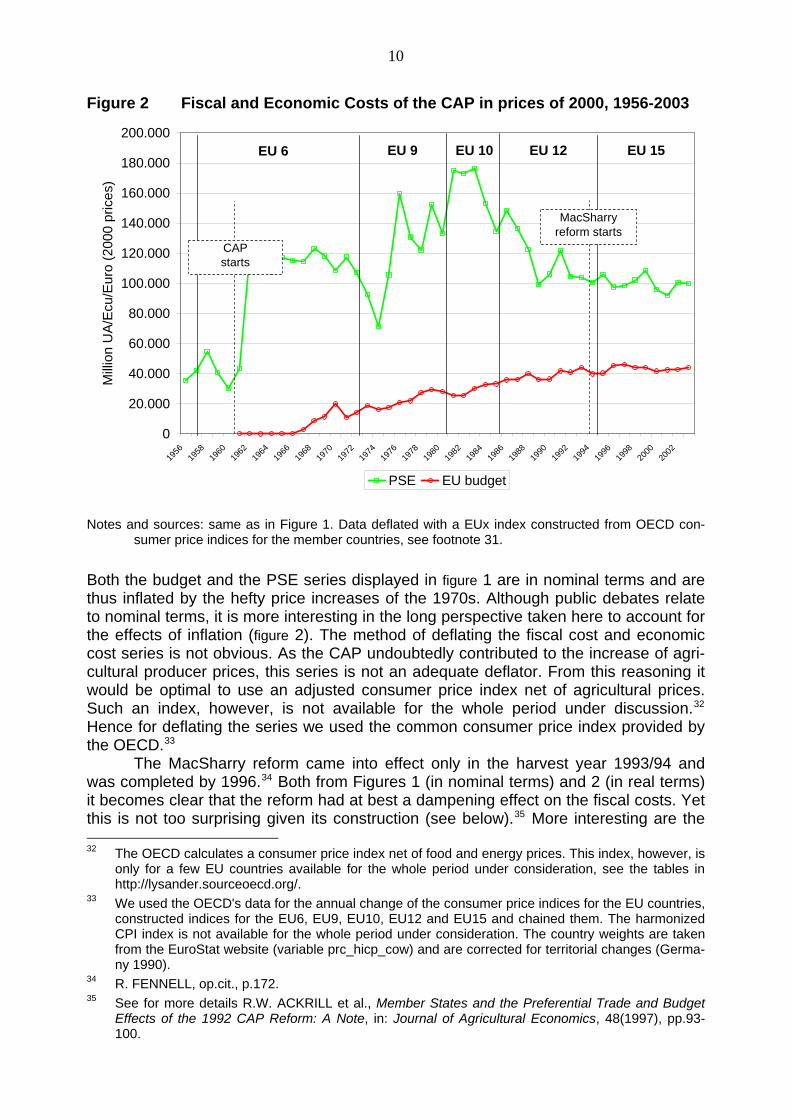
Figure 2 Fiscal and Economic Costs of the CAP in prices of 2000, 1956-2003
0
20.000
40.000
60.000
80.000
100.000
120.000
140.000
160.000
180.000
200.000
1956
1958
1960
1962
1964
1966
1968
1970
1972
1974
1976
1978
1980
1982
1984
1986
1988
1990
1992
1994
1996
1998
2000
2002
Milli
on U
A/Ec
u/E
uro
(200
0 pr
ices
)
PSE EU budget
EU 6 EU 9 EU 10 EU 12 EU 15
CAP starts
MacSharry reform starts
Notes and sources: same as in Figure 1. Data deflated with a EUx index constructed from OECD con-sumer price indices for the member countries, see footnote 31.
Both the budget and the PSE series displayed in figure 1 are in nominal terms and are thus inflated by the hefty price increases of the 1970s. Although public debates relate to nominal terms, it is more interesting in the long perspective taken here to account for the effects of inflation (figure 2). The method of deflating the fiscal cost and economic cost series is not obvious. As the CAP undoubtedly contributed to the increase of agri-cultural producer prices, this series is not an adequate deflator. From this reasoning it would be optimal to use an adjusted consumer price index net of agricultural prices. Such an index, however, is not available for the whole period under discussion.32 Hence for deflating the series we used the common consumer price index provided by the OECD.33
The MacSharry reform came into effect only in the harvest year 1993/94 and was completed by 1996.34 Both from Figures 1 (in nominal terms) and 2 (in real terms) it becomes clear that the reform had at best a dampening effect on the fiscal costs. Yet this is not too surprising given its construction (see below).35 More interesting are the 32 The OECD calculates a consumer price index net of food and energy prices. This index, however, is
only for a few EU countries available for the whole period under consideration, see the tables in http://lysander.sourceoecd.org/.
33 We used the OECD's data for the annual change of the consumer price indices for the EU countries, constructed indices for the EU6, EU9, EU10, EU12 and EU15 and chained them. The harmonized CPI index is not available for the whole period under consideration. The country weights are taken from the EuroStat website (variable prc_hicp_cow) and are corrected for territorial changes (Germa-ny 1990).
34 R. FENNELL, op.cit., p.172. 35 See for more details R.W. ACKRILL et al., Member States and the Preferential Trade and Budget
Effects of the 1992 CAP Reform: A Note, in: Journal of Agricultural Economics, 48(1997), pp.93-100.
11
economic costs. In nominal terms they stagnate since the mid-1980s whereas they fall quite considerably in real terms in spite of two accession rounds and although agricul-tural prices did not fall on average.36 From an economic point of view, the piecemeal reforms of the 1980s seem to have had more impact on the protective effects of the CAP than the MacSharry reform.
We now take a closer look at the effects of starting the CAP and acceding to the EU. As outlined in section 2, the producer NAC is determined by dividing the (actual) value of gross farm receipts by the (hypothetical) value of production at world prices. If agriculture is neither protected nor supported, there is no difference between domestic prices and world prices so that MPS = 0, there are no subsidies BOT, hence VP = GFR, the numerator will equal the denominator, and NAC equals unity. If agriculture receives direct support or indirect support (protection) the value of gross farm receipts is inflated by subsidies paid out directly (BOT > 0) or by artificially high prices (MPS > 0), and NAC will rise above unity. A NAC of 1.5, for example, means that direct and indirect support equal half of the total value of production measured at world prices. If it is below unity, agriculture finances other sectors of the economy, for example if agricul-tural exports are taxed as was often the case in Mediterranean countries before they joined the European Union.
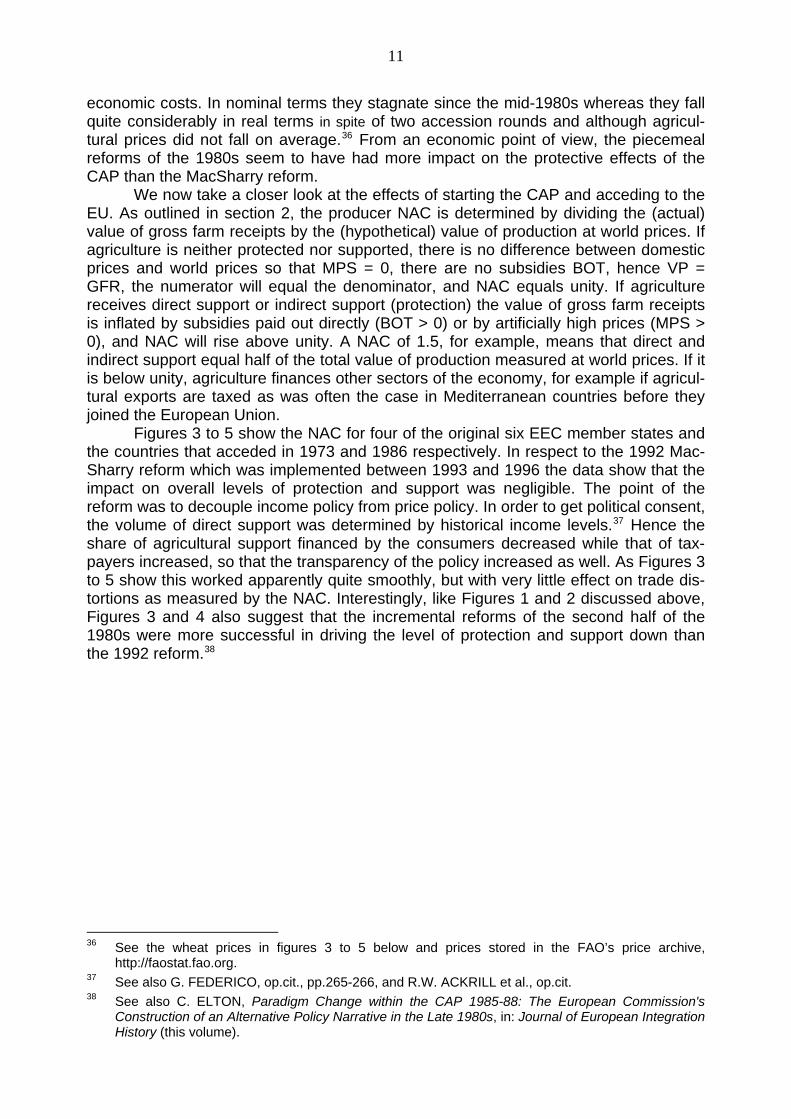
Figures 3 to 5 show the NAC for four of the original six EEC member states and the countries that acceded in 1973 and 1986 respectively. In respect to the 1992 Mac-Sharry reform which was implemented between 1993 and 1996 the data show that the impact on overall levels of protection and support was negligible. The point of the reform was to decouple income policy from price policy. In order to get political consent, the volume of direct support was determined by historical income levels.37 Hence the share of agricultural support financed by the consumers decreased while that of tax-payers increased, so that the transparency of the policy increased as well. As Figures 3 to 5 show this worked apparently quite smoothly, but with very little effect on trade dis-tortions as measured by the NAC. Interestingly, like Figures 1 and 2 discussed above, Figures 3 and 4 also suggest that the incremental reforms of the second half of the 1980s were more successful in driving the level of protection and support down than the 1992 reform.38
36 See the wheat prices in figures 3 to 5 below and prices stored in the FAO’s price archive,
http://faostat.fao.org. 37 See also G. FEDERICO, op.cit., pp.265-266, and R.W. ACKRILL et al., op.cit. 38 See also C. ELTON, Paradigm Change within the CAP 1985-88: The European Commission's
Construction of an Alternative Policy Narrative in the Late 1980s, in: Journal of European Integration History (this volume).
12
Figure 3 Agricultural protection and support in four of the original six EEC states, 1956-200739
0,00
0,50
1,00
1,50
2,00
2,50
3,0019
56
1959
1962
1965
1968
1971
1974
1977
1980
1983
1986
1989
1992
1995
1998
2001
2004
2007
Nom
inal
ass
ista
nce
coef
ficie
nt
0
50
100
150
200
250
300
US
whe
at p
rices
(UA/
Ecu/
Eur
o)
France Germany Italy Netherlands US wheat prices
implementationMacSharry
1993-96transition period
1962-1967
Note: Data for Belgium and Luxembourg are not available.
39 Sources for figures 3: NAC, K. ANDERSON, E. VALENZUELA, op.cit.; US wheat prices per metric
ton, United States Department of Agriculture, Economic Research Service, Wheat Situation and Outlook Yearbook, Table 20 (http://www.ers.usda.gov/Data/Wheat/Yearbook/WheatYearbook Table20-Full.htm). Data for harvest years recalculated for calendar years and converted to UA/Ecu/Euro according to the procedure described in footnote 30.
13
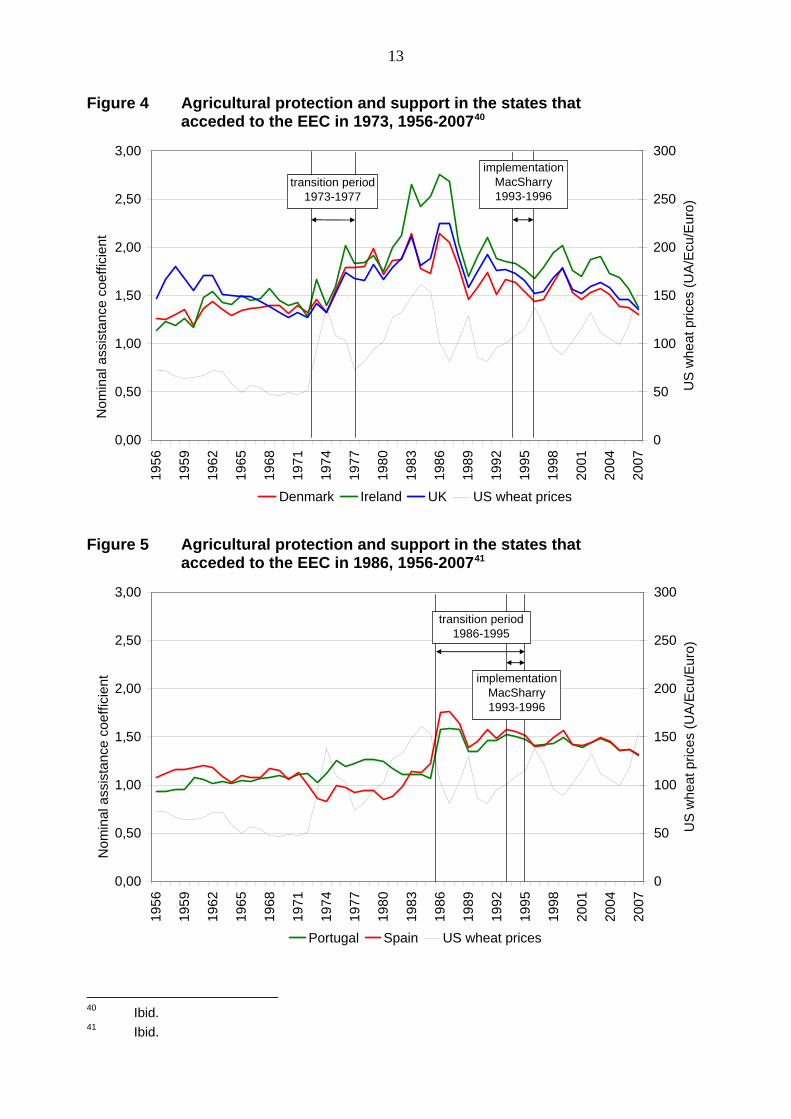
Figure 4 Agricultural protection and support in the states that acceded to the EEC in 1973, 1956-200740
0,00
0,50
1,00
1,50
2,00
2,50
3,0019
56
1959
1962
1965
1968
1971
1974
1977
1980
1983
1986
1989
1992
1995
1998
2001
2004
2007
Nom
inal
ass
ista
nce
coef
ficie
nt
0
50
100
150
200
250
300
US
whe
at p
rices
(UA
/Ecu
/Eur
o)
Denmark Ireland UK US wheat prices
transition period 1973-1977
implementationMacSharry1993-1996
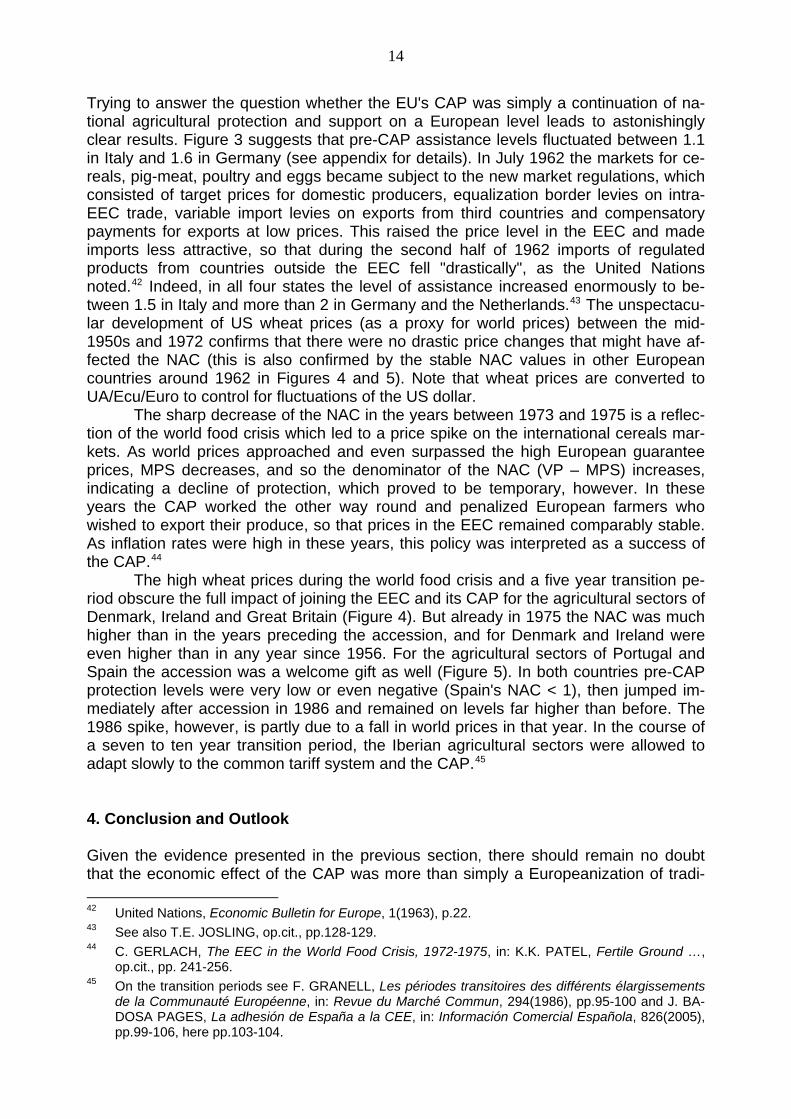
Figure 5 Agricultural protection and support in the states that acceded to the EEC in 1986, 1956-200741
0,00
0,50
1,00
1,50
2,00
2,50
3,00
1956
1959
1962
1965
1968
1971
1974
1977
1980
1983
1986
1989
1992
1995
1998
2001
2004
2007
Nom
inal
ass
ista
nce
coef
ficie
nt
0
50
100
150
200
250
300
US
whe
at p
rices
(UA
/Ecu
/Eur
o)
Portugal Spain US wheat prices
transition period1986-1995
implementationMacSharry1993-1996
40 Ibid. 41 Ibid.
14
Trying to answer the question whether the EU's CAP was simply a continuation of na-tional agricultural protection and support on a European level leads to astonishingly clear results. Figure 3 suggests that pre-CAP assistance levels fluctuated between 1.1 in Italy and 1.6 in Germany (see appendix for details). In July 1962 the markets for ce-reals, pig-meat, poultry and eggs became subject to the new market regulations, which consisted of target prices for domestic producers, equalization border levies on intra-EEC trade, variable import levies on exports from third countries and compensatory payments for exports at low prices. This raised the price level in the EEC and made imports less attractive, so that during the second half of 1962 imports of regulated products from countries outside the EEC fell "drastically", as the United Nations noted.42 Indeed, in all four states the level of assistance increased enormously to be-tween 1.5 in Italy and more than 2 in Germany and the Netherlands.43 The unspectacu-lar development of US wheat prices (as a proxy for world prices) between the mid-1950s and 1972 confirms that there were no drastic price changes that might have af-fected the NAC (this is also confirmed by the stable NAC values in other European countries around 1962 in Figures 4 and 5). Note that wheat prices are converted to UA/Ecu/Euro to control for fluctuations of the US dollar.
The sharp decrease of the NAC in the years between 1973 and 1975 is a reflec-tion of the world food crisis which led to a price spike on the international cereals mar-kets. As world prices approached and even surpassed the high European guarantee prices, MPS decreases, and so the denominator of the NAC (VP – MPS) increases, indicating a decline of protection, which proved to be temporary, however. In these years the CAP worked the other way round and penalized European farmers who wished to export their produce, so that prices in the EEC remained comparably stable. As inflation rates were high in these years, this policy was interpreted as a success of the CAP.44
The high wheat prices during the world food crisis and a five year transition pe-riod obscure the full impact of joining the EEC and its CAP for the agricultural sectors of Denmark, Ireland and Great Britain (Figure 4). But already in 1975 the NAC was much higher than in the years preceding the accession, and for Denmark and Ireland were even higher than in any year since 1956. For the agricultural sectors of Portugal and Spain the accession was a welcome gift as well (Figure 5). In both countries pre-CAP protection levels were very low or even negative (Spain's NAC < 1), then jumped im-mediately after accession in 1986 and remained on levels far higher than before. The 1986 spike, however, is partly due to a fall in world prices in that year. In the course of a seven to ten year transition period, the Iberian agricultural sectors were allowed to adapt slowly to the common tariff system and the CAP.45 4. Conclusion and Outlook Given the evidence presented in the previous section, there should remain no doubt that the economic effect of the CAP was more than simply a Europeanization of tradi- 42 United Nations, Economic Bulletin for Europe, 1(1963), p.22. 43 See also T.E. JOSLING, op.cit., pp.128-129. 44 C. GERLACH, The EEC in the World Food Crisis, 1972-1975, in: K.K. PATEL, Fertile Ground …,
op.cit., pp. 241-256. 45 On the transition periods see F. GRANELL, Les périodes transitoires des différents élargissements
de la Communauté Européenne, in: Revue du Marché Commun, 294(1986), pp.95-100 and J. BA-DOSA PAGES, La adhesión de España a la CEE, in: Información Comercial Española, 826(2005), pp.99-106, here pp.103-104.
15
tional national policies. One may insist that, in a very wide sense, the set of policy in-struments did not change much. But the economic outcome of the policy chosen, i.e. the level of agricultural protection and support, was markedly shifted upwards. This was by no means inevitable. The fact alone that in 1993 the CAP introduced the system of direct payments that Britain had been required to abandon when it joined the EEC in 1973 demonstrates that there had been an alternative to the path actually chosen.46
The path chosen was extremely expensive. For all states analyzed here, the four of the original EU6 as well as the new members joining in 1973 and 1986, the CAP was an effective shield against world markets. Assistance levels usually jumped by 0.5 points, that is up to half of the total value of production measured at world prices. Under the CAP, the level of EU agricultural protection and support continued to increase until the mid-1980s, disrupted only by the world food crisis of 1973-75. Since the late 1980s protection levels have declined. As cereal prices fluctuated around a constant trend between 1975 and 2005 this decline was probably the result of incremental changes before the MacSharry reform of 1992, a hypothesis which needs further elaboration.
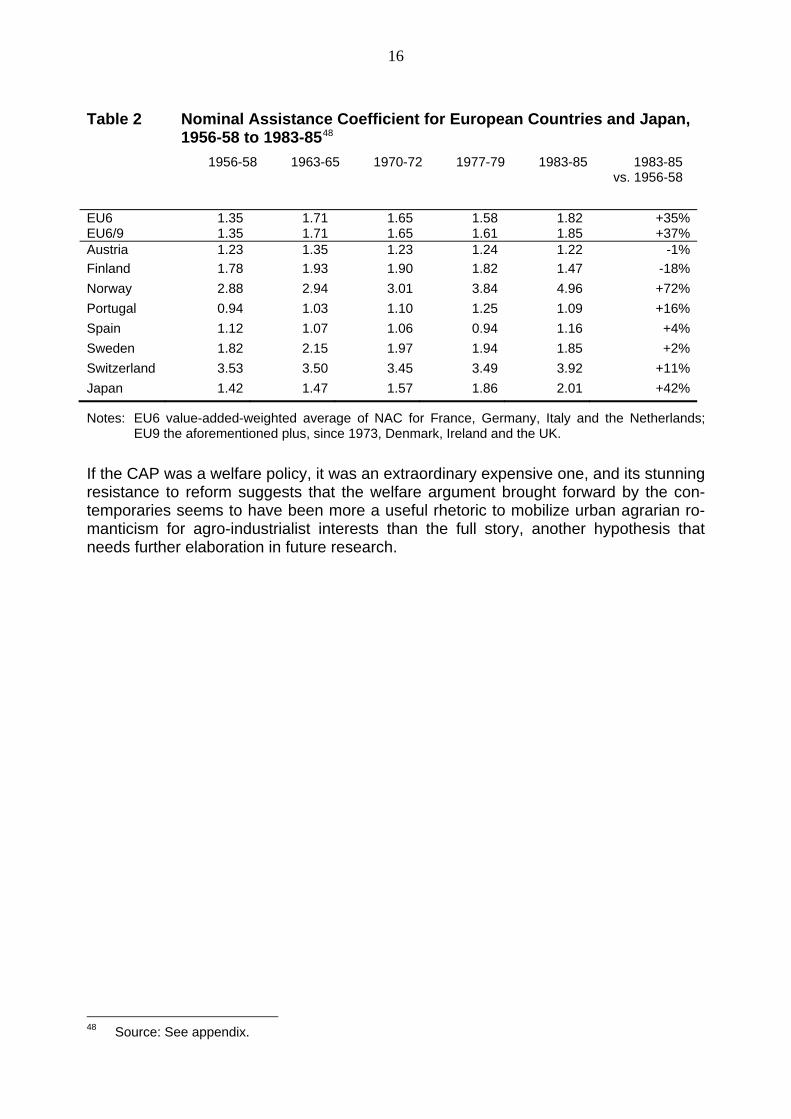
It is certainly true, as Ann-Christina L. Knudsen has forcefully argued, that the CAP must be interpreted as a welfare policy for the farming population.47 But this should not be interpreted as an inevitable feature of the emergence of the European welfare state. The NAC data for other European countries that also developed the welfare state and were not at the time member states of the EU do not necessarily follow such a trend, as table 2 shows. In the mid-1980s, only Norway and Switzerland, countries whose agricul-tural sectors would certainly qualify as "less-favoured areas" in the CAP nomenclature, had higher assistance levels than the EU on average. Moreover, apart from Norway only Japan expanded its assistance to agriculture between the mid-1950s and the mid-1980s on a similar scale to the EU. The assistance levels of the agricultural sectors in Portugal, Spain, Sweden and even Switzerland grew pronouncedly less than in the EU, while those of Austria and Finland even decreased.
46 In Germany, the British model was discussed in the business press and in the public since at least
1958, see F. WALTERMANN, Verbraucher zahlen die EWG-Zeche, in: Der Volkswirt, 27.07.1962, pp.1574-1577. The Commission discussed this alternative in 1963, see Commission de la Commu-nauté Économique Européenne, Mesures en vue de l'établissement d'un niveau commun des prix des céréales, VI/COM(63)430 final (20.11.1963).
47 A.-C.L. KNUDSEN, op.cit.; see also A.D. SHEINGATE, The Rise of the Agricultural Welfare State: Institutions and Interest Group Power in the United States, France, and Japan, Princeton University Press, Princeton, 2001, and E. RIEGER, Agricultural Policy: Constrained Reforms, in: H. WAL-LACE, W. WALLACE, M. POLLACK (eds.), Policy-making in the European Union, Oxford, Oxford University Press, 2005, pp.161-190, here p.166.
16
Table 2 Nominal Assistance Coefficient for European Countries and Japan, 1956-58 to 1983-8548
1956-58 1963-65 1970-72 1977-79 1983-85 1983-85 vs. 1956-58
EU6 1.35 1.71 1.65 1.58 1.82 +35%EU6/9 1.35 1.71 1.65 1.61 1.85 +37%Austria 1.23 1.35 1.23 1.24 1.22 -1%Finland 1.78 1.93 1.90 1.82 1.47 -18%Norway 2.88 2.94 3.01 3.84 4.96 +72%Portugal 0.94 1.03 1.10 1.25 1.09 +16%Spain 1.12 1.07 1.06 0.94 1.16 +4%Sweden 1.82 2.15 1.97 1.94 1.85 +2%Switzerland 3.53 3.50 3.45 3.49 3.92 +11%Japan 1.42 1.47 1.57 1.86 2.01 +42%
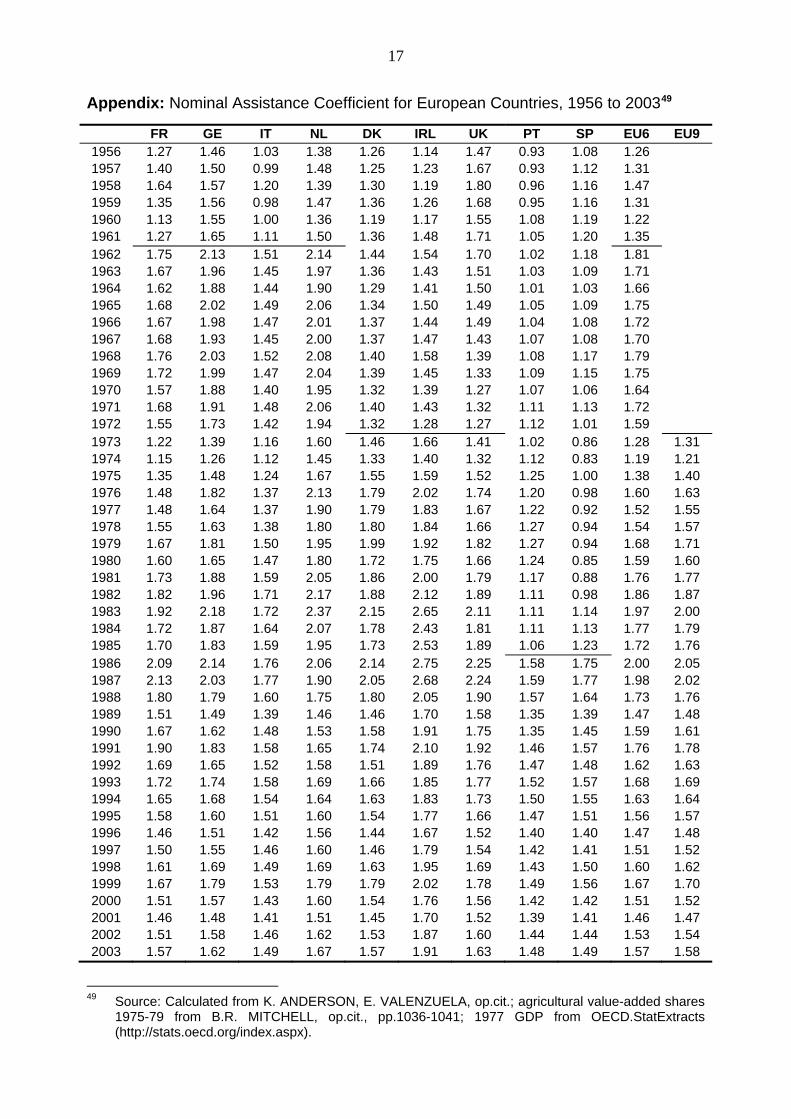
Notes: EU6 value-added-weighted average of NAC for France, Germany, Italy and the Netherlands; EU9 the aforementioned plus, since 1973, Denmark, Ireland and the UK.
If the CAP was a welfare policy, it was an extraordinary expensive one, and its stunning resistance to reform suggests that the welfare argument brought forward by the con-temporaries seems to have been more a useful rhetoric to mobilize urban agrarian ro-manticism for agro-industrialist interests than the full story, another hypothesis that needs further elaboration in future research.
48 Source: See appendix.
17
Appendix: Nominal Assistance Coefficient for European Countries, 1956 to 200349
FR GE IT NL DK IRL UK PT SP EU6 EU9 1956 1.27 1.46 1.03 1.38 1.26 1.14 1.47 0.93 1.08 1.26 1957 1.40 1.50 0.99 1.48 1.25 1.23 1.67 0.93 1.12 1.31 1958 1.64 1.57 1.20 1.39 1.30 1.19 1.80 0.96 1.16 1.47 1959 1.35 1.56 0.98 1.47 1.36 1.26 1.68 0.95 1.16 1.31 1960 1.13 1.55 1.00 1.36 1.19 1.17 1.55 1.08 1.19 1.22 1961 1.27 1.65 1.11 1.50 1.36 1.48 1.71 1.05 1.20 1.35 1962 1.75 2.13 1.51 2.14 1.44 1.54 1.70 1.02 1.18 1.81 1963 1.67 1.96 1.45 1.97 1.36 1.43 1.51 1.03 1.09 1.71 1964 1.62 1.88 1.44 1.90 1.29 1.41 1.50 1.01 1.03 1.66 1965 1.68 2.02 1.49 2.06 1.34 1.50 1.49 1.05 1.09 1.75 1966 1.67 1.98 1.47 2.01 1.37 1.44 1.49 1.04 1.08 1.72 1967 1.68 1.93 1.45 2.00 1.37 1.47 1.43 1.07 1.08 1.70 1968 1.76 2.03 1.52 2.08 1.40 1.58 1.39 1.08 1.17 1.79 1969 1.72 1.99 1.47 2.04 1.39 1.45 1.33 1.09 1.15 1.75 1970 1.57 1.88 1.40 1.95 1.32 1.39 1.27 1.07 1.06 1.64 1971 1.68 1.91 1.48 2.06 1.40 1.43 1.32 1.11 1.13 1.72 1972 1.55 1.73 1.42 1.94 1.32 1.28 1.27 1.12 1.01 1.59 1973 1.22 1.39 1.16 1.60 1.46 1.66 1.41 1.02 0.86 1.28 1.31 1974 1.15 1.26 1.12 1.45 1.33 1.40 1.32 1.12 0.83 1.19 1.21 1975 1.35 1.48 1.24 1.67 1.55 1.59 1.52 1.25 1.00 1.38 1.40 1976 1.48 1.82 1.37 2.13 1.79 2.02 1.74 1.20 0.98 1.60 1.63 1977 1.48 1.64 1.37 1.90 1.79 1.83 1.67 1.22 0.92 1.52 1.55 1978 1.55 1.63 1.38 1.80 1.80 1.84 1.66 1.27 0.94 1.54 1.57 1979 1.67 1.81 1.50 1.95 1.99 1.92 1.82 1.27 0.94 1.68 1.71 1980 1.60 1.65 1.47 1.80 1.72 1.75 1.66 1.24 0.85 1.59 1.60 1981 1.73 1.88 1.59 2.05 1.86 2.00 1.79 1.17 0.88 1.76 1.77 1982 1.82 1.96 1.71 2.17 1.88 2.12 1.89 1.11 0.98 1.86 1.87 1983 1.92 2.18 1.72 2.37 2.15 2.65 2.11 1.11 1.14 1.97 2.00 1984 1.72 1.87 1.64 2.07 1.78 2.43 1.81 1.11 1.13 1.77 1.79 1985 1.70 1.83 1.59 1.95 1.73 2.53 1.89 1.06 1.23 1.72 1.76 1986 2.09 2.14 1.76 2.06 2.14 2.75 2.25 1.58 1.75 2.00 2.05 1987 2.13 2.03 1.77 1.90 2.05 2.68 2.24 1.59 1.77 1.98 2.02 1988 1.80 1.79 1.60 1.75 1.80 2.05 1.90 1.57 1.64 1.73 1.76 1989 1.51 1.49 1.39 1.46 1.46 1.70 1.58 1.35 1.39 1.47 1.48 1990 1.67 1.62 1.48 1.53 1.58 1.91 1.75 1.35 1.45 1.59 1.61 1991 1.90 1.83 1.58 1.65 1.74 2.10 1.92 1.46 1.57 1.76 1.78 1992 1.69 1.65 1.52 1.58 1.51 1.89 1.76 1.47 1.48 1.62 1.63 1993 1.72 1.74 1.58 1.69 1.66 1.85 1.77 1.52 1.57 1.68 1.69 1994 1.65 1.68 1.54 1.64 1.63 1.83 1.73 1.50 1.55 1.63 1.64 1995 1.58 1.60 1.51 1.60 1.54 1.77 1.66 1.47 1.51 1.56 1.57 1996 1.46 1.51 1.42 1.56 1.44 1.67 1.52 1.40 1.40 1.47 1.48 1997 1.50 1.55 1.46 1.60 1.46 1.79 1.54 1.42 1.41 1.51 1.52 1998 1.61 1.69 1.49 1.69 1.63 1.95 1.69 1.43 1.50 1.60 1.62 1999 1.67 1.79 1.53 1.79 1.79 2.02 1.78 1.49 1.56 1.67 1.70 2000 1.51 1.57 1.43 1.60 1.54 1.76 1.56 1.42 1.42 1.51 1.52 2001 1.46 1.48 1.41 1.51 1.45 1.70 1.52 1.39 1.41 1.46 1.47 2002 1.51 1.58 1.46 1.62 1.53 1.87 1.60 1.44 1.44 1.53 1.54 2003 1.57 1.62 1.49 1.67 1.57 1.91 1.63 1.48 1.49 1.57 1.58
49 Source: Calculated from K. ANDERSON, E. VALENZUELA, op.cit.; agricultural value-added shares
1975-79 from B.R. MITCHELL, op.cit., pp.1036-1041; 1977 GDP from OECD.StatExtracts (http://stats.oecd.org/index.aspx).
18
Notes: EU6 value-added-weighted average of NAC for France, Germany, Italy and the Netherlands; EU9 the aforementioned plus, since 1973, Denmark, Ireland and the UK.