formation of advanced glycation endproducts in ground beef under pasteurisation conditions
TRANSCRIPT

Accepted Manuscript
Formation of advanced glycation endproducts in ground beef under pasteurisa-tion conditions
Xiaohua Sun, Juming Tang, Jing Wang, Barbara A. Rasco, Keqiang Lai, YiqunHuang
PII: S0308-8146(14)01514-3DOI: http://dx.doi.org/10.1016/j.foodchem.2014.09.129Reference: FOCH 16485
To appear in: Food Chemistry
Received Date: 13 May 2014Revised Date: 9 September 2014Accepted Date: 11 September 2014
Please cite this article as: Sun, X., Tang, J., Wang, J., Rasco, B.A., Lai, K., Huang, Y., Formation of advancedglycation endproducts in ground beef under pasteurisation conditions, Food Chemistry (2014), doi: http://dx.doi.org/10.1016/j.foodchem.2014.09.129
This is a PDF file of an unedited manuscript that has been accepted for publication. As a service to our customerswe are providing this early version of the manuscript. The manuscript will undergo copyediting, typesetting, andreview of the resulting proof before it is published in its final form. Please note that during the production processerrors may be discovered which could affect the content, and all legal disclaimers that apply to the journal pertain.

1
Formation of advanced glycation endproducts in ground beef under
pasteurisation conditions
Xiaohua Suna, Juming Tang
b, Jing Wang
a, Barbara A Rasco*
c, Keqiang Lai
a, Yiqun
Huang*a,c
a College of Food Science and Technology, Shanghai Ocean University, No. 999
Hucheng Huan Road, LinGang New City, Shanghai, China 201306.
b Department of Biological System Engineering, Washington State University,
Pullman, WA 99164-6120, USA.
c School of Food Science, Washington State University, Pullman, WA 99164-6376,
USA.
*Corresponding authors:
(509)335-1858(phone), (509)335-4815(fax), [email protected] (B. A. Rasco);
(86-21)6190-0370(phone), (86-21)6190-03659 (fax), [email protected] (Y.
Huang).

2
Abstract
Advanced glycation endproducts (AGEs) in food products may pose health risks, and
thermal processing of foods accelerates the formation of AGEs. The effects of heat
treatments (65−100 °C, 0−60 min) on the formation of AGEs including
Nε-carboxymethyllysine (CML) and N
ε-carboxyethyllysine (CEL) in ground beef
were investigated. The levels of CML and CEL in ground beef steadily increased with
heating time and heating temperature. A strong linear relationship (r2 = 0.920)
between the amounts of CML (2.76−19.96 mg/kg) and CEL (2.32−11.89 mg/kg) in
raw and thermally treated beef was found. The formations of both CML and CEL in
ground beef during heat treatments basically fitted zero-order reactions (CML: r2 =
0.851−0.995, rate constant = 0.031−0.224 mg·kg-1
·min-1
; CEL: r2 = 0.907−0.971, rate
constant = 0.044−0.118 mg·kg-1·min-1), with an activation energy of 61.01 kJ/mol for
CML and 29.21 kJ/mol for CEL.
Keywords
beef; carboxymethyllysine; carboxyethyllysine; advanced glycation endproducts;
thermal process; kinetics

3
1. Introduction
The Maillard reaction involves a series of complicated reactions starting from the
reaction between the carbonyl group of reducing sugars and amino group of amino
acids or free amino groups of proteins to form a Schiff base, and undergoing Amadori
rearrangement. From the Amadori products, various reactive intermediate products
are produced following different pathways before more stable products are formed,
such as aroma and browning compounds, and advanced glycation endproducts
(AGEs). AGEs were initially believed to be formed at later or advanced stages of the
Maillard reaction as a result of the attachment of saccharides (most often
monosaccharides) or their derivatives to a protein or its derivatives, from which the
term "advanced glycation endproducts" came (Rabbani & Thornalley, 2012). Recent
studies indicate that AGEs in foods can be formed in the early stages of the Maillard
reaction through potent glycating agents such as α-dicarbonyl compounds formed
directly from degradation of glucose or Schiff base, or from lipid oxidation (Fu,
Requena, Jenkins, Lyons, Baynes, & Thorpe, 1996; Rabbani & Thornalley, 2012;
Poulsen et al., 2013). AGEs can be formed in vivo and in foods during thermal
processing and storage. In the human body, AGEs may promote aging and oxidative
stress and increase risks for various diseases such as diabetes, obesity, and
cardiovascular diseases, though the risk effects of dietary AGEs on human health are
still controversial (Nguyen, 2006; Ames, 2007; Uribarri et al., 2010; Poulsen et al.,
2013).
Assessments of various foods such as infant formulas (Birlouez-Aragon et al.,

4
2004), milk and beverages (Ahmed, Mirshekar-Syahkal, Kennish, Karachalias,
Babaei-Jadidi, & Thornalley, 2005), almonds (Zhang, Huang, Xiao, & Mitchell, 2011),
sauces and sauces treated meat and fish (Chao, Hsu, & Yin, 2009), as well as several
hundred commonly consumed foods (Goldberg et al., 2004; Uribarri et al., 2010; Hull,
Woodside, Ames, & Cuskelly, 2012) indicate that heat treatments significantly affect
the levels of AGEs in foods; and high protein/high fat foods (such as meat, pork,
chicken) have higher levels of AGEs compared to low fat or carbohydrate-rich foods
(such as fruits, vegetables, grains, legumes, and nonfat milk). Although the effects of
heating on the levels of AGEs in foods have been acknowledged (Chao et al., 2009;
Wellner, Huettl, & Henle, 2011; Zhang et al., 2011), very few studies have been
published on how thermal processes (such as heating temperature and heating time)
affect the amounts of AGEs in foods. What is more, among these limited number of
reported studies on AGEs, simple model systems (such as monosaccharide-lysine
mixtures) instead of real food systems were often used (Morales & Van Boekel, 1996;
Fu, Li, & Li, 2012). Since foods in general contain numerous components that may
participate in or interfere with the formation of AGEs of varying molecular structures,
the use of simple model systems cannot reveal what actually happens regarding AGEs
formation in real food systems.
The goal of this study was to determine the overall amounts of two commonly
occurring AGEs, Nε-carboxymethyllysine (CML) and N
ε-carboxyethyllysine (CEL)
formed in ground beef, one of the most widely consumed foods, under pasteurisation
conditions covering a wide range of heating temperatures (65−100 °C) and heating

5
times (0−60 min). In addition to exploring the kinetics of formation for both CML and
CEL, the relationship between the levels of CML and CEL formed in thermal
processed ground beef was investigated.
2. Materials and methods
2.1.Reagents
Analytical grade hydrochloric acid 37%, sodium hydroxide, sodium borohydride,
and boric acid were purchased from Sinopharm (Shanghai, China). HPLC-grade
methanol, chloroform, formic acid, and ammonium acetate were purchased from
Sigma (St Louis, MO). CML (98%), CEL (98%) and d4-CML (98%) were purchased
from Toronto Research Chemicals Inc. (Toronto, Ontario, Canada). Stock standard
solutions for CML (390 mg/L), CEL (310 mg/L) and the internal standard d4-CML
(200 mg/L) were prepared in methanol-water (80:20, v/v) and stored at −20 °C.
Working standard solutions including AGEs standard mixture (CML 195 µg/L, CEL
155 µg/L, and d4-CML 100 µg/L) and the internal standard (d4-CML 4 mg/L) were
prepared by diluting the stock solutions in methanol-water (80:20, v/v) solution.
2.2. Sample information
Ground beef brisket packaged in modified atmosphere was purchased from a
local retailer in Shanghai, China. Ground beef was mixed with a homogeniser (8010S;
Waring, Inc., Torrington, CT) at low speed for 20 s, packed in plastic bags with about
120 g of beef per bag, and stored at −50°C. The beef sample was thawed overnight at

6
4 °C before further testing.
The moisture content of ground beef was determined based upon an oven drying
method (Lawrence, 2005) in which ca. 4.0000 g of sample was heated at 105 °C until
reaching a constant weight, taking about 24 h. Fat content was determined using a
solvent extraction method (Lawrence, 2005) with an automatic Soxhlet solvent
extractor (SZF-06; Shanghai Jiading Food and Oil Instrument Ltd, Shanghai, China).
Protein content was measured using the Kjeldahl Method (Lawrence, 2005) with an
automatic Kjeldahl apparatus (UDK 159; VELP Scientific, Inc., Italy). A conversion
factor of 6.25 was used for the calculation of the protein content from nitrogen
content. The moisture, fat and protein contents for the ground beef were 70.92%
(±0.07%), 5.92% (±0.42%), and 20.54% (±0.16%) on a wet weight basis,
respectively.
2.3. Thermal treatments
Ground beef (13.0±0.1g) was sealed into cylindrical aluminium cells (Kong, Tang,
Rasco, Crapo, & Smiley, 2007) with inner diameter of 50 mm and inner height of 5
mm and heated at 65, 70, 75, 80, 85, 90, or 100 °C for 2.5, 5, 7.5, 10, 15, 20, 40, or 60
min in a water bath (Isotemp 5150 H7; Fisher Scientific Inc., Pittsburgh PA) or in
boiling water directly (for 100 °C treatment only). The selected treatment of
temperatures and times covered a range used in cooking and in-package pasteurisation
protocols. Following heating, test cells containing the beef samples were immediately
immersed in ice-water mixture. After cooling, both the meat and exuded juice were

7
mixed well in a mortar before AGEs analysis. Each thermal treatment was repeated
twice on different days, and duplicate analysis for AGEs was conducted for each
sample. The come-up time, defined as the time required for the sample central
temperature to reach 0.5 °C below the targeted temperature, was determined based on
the methods of Kong et al. (2007).
2.4. Sample preparation for AGEs analyses
Sample preparation for AGEs analyses was based upon an acid hydrolysis
method, in which the beef sample was reduced with sodium borohydride before the
acid hydrolysis step and the protein hydrolysate was cleaned up with solid-phase
extraction (Assar, Moloney, Lima, Magee, & Ames, 2009; Niquet-Léridon & Tessier,
2011). First, ca. 0.2000 g raw or cooked beef was incubated with 2 mL borate buffer
(0.2 M, pH 9.2) and 0.4 mL sodium borohydride (2 M in 0.1 N NaOH) at 4 °C for 8 h.
The reduction step was to prevent the formation of CML or CEL from Amadori
products during the acid hydrolysis which would lead to overestimation of CML or
CEL (Niquet-Léridon & Tessier, 2011). The sample was then vigorously mixed with 4
mL of methanol-chloroform (1:2, v:v) and centrifuged (TDL-5-A; Shanghai Anting
Scientific Instrument Factory, Shanghai, China) at 5,000 rpm for 10 min to defat and
precipitate protein. The precipitated protein was hydrolysed with 4 mL of 6 M
hydrochloric acid (HCl) at 110 °C for 24 h. The protein hydrolysate was diluted with
water to 20 mL, from which 4 mL were withdrawn and spiked with 100 µL d4-CML
(4 mg/L, internal standard) and dried in a vacuum oven (DZF-6050; Shanghai

8
Jinghong Laboratory instrument Co., Ltd, Shanghai, China) at 50 °C. The dried
protein hydrolysate was reconstituted in 4 mL water (the final concentration of
d4-CML was 100 µg/L) and 2 mL of sample solution was passed through an MCX
cartridge (60 mg/3 mL; Shanghai ANPEL Scientific instrument Co., Ltd, Shanghai,
China) pre-activated with 3 mL methanol and 3 mL water in sequence. The cartridge
was then washed with 3 mL water and 3 mL methanol, respectively. Finally, the target
compounds were eluted with 5 mL methanol (containing 5% aqueous ammonia),
dried in nitrogen with a nitrogen evaporator (DC12H; Shanghai ANPEL Scientific
Instrument Co., Ltd, Shanghai, China), reconstituted with 2 mL methanol-water
(80:20, v:v), and filtered through a 0.22-µm filter before chromatographic analysis.
The MCX cartridge was chosen in our study since our preliminary results indicated
that a higher recovery rate could be achieved with the use of MCX than the most
commonly used C18 cartridge due to the strong polarity of CML and CEL.
Recovery experiments were conducted by spiking the protein hydrolysate with
CML or CEL at three different levels (CML: 19.5, 97.5, 195 µg/L; CEL: 15.5, 77.5,
155 µg/L for CEL) and the internal standard d4-CML (100 µg/L). In addition, protein
hydrolysate with only d4-CML added was used as a blank. Since raw ground beef
contained CML and CEL, the amount of CML or CEL in the blank was deducted from
that of the spiked samples to calculate the recovery of CML or CEL. Recovery
experiments were repeated six times.
2.5. HPLC-MS/MS analysis

9
Liquid chromatography analysis was performed with a Waters 2695 HPLC
system (Waters Inc., Milford, MA). An Atlantis hydrophilic interaction liquid
chromatography (HILIC) silica column (150 mm × 2.1 mm, 3 µm; Waters Inc.) was
used. Since CML and CEL are highly polar, the use of common reversed-phase
columns (such as C18) would not be able to retain both chemicals well, unless an
ion-pairing reagent such as nonafluoropentanoic acid is used (Assar et al., 2009;
Zhang et al., 2011). However, the strong acidity of ion-pairing reagents may result in
rapid deterioration of the column (Schettgen, Tings, Brodowsky, Müller-Lux, Musiol,
& Kraus, 2007; Zhang et al., 2011). HILIC is a combination of hydrophilic stationary
phase and an aqueous mobile phase containing a high proportion of organic solvent,
which successfully separates polar compounds such as CML, as demonstrated by
Schettgen et al. (2007) and confirmed in our preliminary study. The sample injection
volume was 10 µL, and the column temperature was set at 35 °C. The binary mobile
phase used was composed of (A) methanol containing 2 mM ammonium acetate and
0.1% formic acid, and (B) water containing 2 mM ammonium acetate and 0.1%
formic acid. The flow rate was 0.2 mL/min with the percentage of mobile phase
changed as follows: 0−3 min, 80−50% A; 3−6 min, 50% A; 6−6.1 min, 50−80% A;
6.1−12 min, 80% A).
Mass spectrometric analysis was performed using a Waters Quattro Micro
triple-quadrupole tandem mass spectrometer (MS/MS) (Waters Inc., Milford, MA)
operated in positive electrospray ionisation (ESI) mode. The source and the
desolvation temperature were 120 °C and 350 °C, respectively. The extractor voltage

10
was 3 V, and the capillary voltage was 3 kV. Nitrogen was used as desolvation gas at a
flow rate of 500 L/h, and as cone gas at 50 L/h. Argon was used as collision gas with
collision pressure set as 3 × 10⁻³ mbar. Multiple reaction monitoring (MRM) mode
was applied to detect CML and CEL with 200 ms as dwell time for each transition;
the transition ions, collision energy, as well as cone voltage are specified in Table 1.
The product ion at m/z 130 was used for quantification of both CML and CEL, while
the ions at m/z 84 and m/z 173 were used for confirmation of CML and CEL,
respectively (Table 1). Response factors (spectral peak area to the amount of
substance) of CML, CEL and d4-CML were calculated based on the LC-MS/MS
analysis results of AGEs standards mixture (CML 195 µg/L, CEL 155 µg/L, and
d4-CML 100 µg/L), and the LC-MS/MS analysis of the standards mixture was
conducted each time before analysing ground beef samples. The ratio of response
factor of CML or CEL to that of the internal standard was used for calculation of
CML or CEL in beef samples.
2.6. Data analysis
To evaluate how fast the levels of CML and CEL changed in ground beef during
heating, the amounts of CML and CEL during different heating times at a specific
temperature were used to fit the kinetic function,
��/�� = ��� (1)
where k is the rate constant, C is the concentration of CML or CEL at time t, n is the
order of reaction and n = 0, 0.5, 1, 2 were tested in this study. Plots of C (n = 0), √�

11
(n = 0.5), lnC (n =1), and 1/C (n = 2) against t were obtained, and the r2 values of
their linear regression trendlines were compared. The best fitted reaction order
resulted in the highest r2 value.
The effect of temperature on reaction rate was modelled with the Arrhenius
equation,
� = ������� (2)
where A is a pre-exponential factor (unit the same as k), Ea is the activation energy
(J/mol), R is the universal gas constant (8.314 J·mol-1·K-1), and T is absolute
temperature (K). Data analyses were conducted using Microsoft Excel 2007
(Redmond, WA).
3. Results and discussion
3.1. LC-MS/MS chromatogram of AGEs, sensitivity and recovery
Fig. 1 shows the LC-MS/MS chromatogram of mixture of AGEs standards
including d4-CML, CML and CEL obtained through MRM in positive-ion mode.
Mass transitions of m/z 209→m/z 88 for d4-CML, m/z 205→m/z 130 for CML, m/z
219→m/z 130 for CEL were the most prominent ions detected. The retention time for
both d4-CML and CML was 3.88 min, and for CEL was 3.67 min. The collision
induced dissociation of these three AGEs was due to the loss of fragments of
-NHCH2COOH and/or -COOH, which was consistent with other reports (Teerlink,
Barto, Brink, & Schalkwijk, 2004; Zhang et al., 2011), although the most prominent
ions identified by separated research groups may be different due to the use of

12
different parameters (such as collision energy) in the tests.
The LC-MS/MS method had high sensitivity for CML and CEL, leading to a
limit of detection (LOD) of 4 and 5 µg/kg, respectively, while the limit of
quantification (LOQ) was 12 and 15 µg/kg for CML and CEL, respectively. Zhang et
al. (2011) reported similar LOD and LOQ for analysis of CML (LOD, 3 µg/kg; LOQ,
9 µg/kg) and CEL (LOD, 4 µg/kg; LOQ, 12 µg/kg) with LC-MS/MS for standard
solutions. The quantification linearity range of the LC-MS/MS was 20−1000 µg/kg,
and the levels of CML and CEL in all tested beef extracts (from 0.2 g beef to 20 mL
solution during sample preparation for LC-MS/MS analysis, diluted 100 times) are
within the linear range. The recovery of CML ranged from 78% (±10.7%) to 98%
(±5.9%) for protein hydrolysate spiked with CML of 19.5 µg/kg to 195 µg/kg, and for
CEL (spiked with 15.5 µg/kg to 155 µg/kg) ranged from 81% (±11.1%) to 108%
(±5.4%). A lower recovery of CML and CEL (78−81%) was found for hydrolysates
spiked with less than 20 µg/kg, which is very commonly seen at these low
concentration levels; the recovery of CML and CEL from this study were comparable
with other similar studies (Teerlink et al., 2004; Zhang et al., 2011).
3.2. CML and CEL in raw and heat treated ground beef
The raw ground beef contained 2.76−4.32 mg/kg CML, and the heat-treated
ground beef contained 3.12−19.96 mg/kg CML. As shown in Fig. 2a, the CML levels
in ground beef samples were greatly affected by heat treatments. The amounts of
CML in ground beef steadily increased with heating time at all seven tested

13
temperatures. For the same heating time, the higher the temperature, the more CML
produced. For example, 60 min of heating at 65 °C led to 50% increase of CML in
ground beef. The same heating time resulted in 154% increase of CML at 75 °C, 263%
at 85 °C and 361% at 100 °C, respectively.
The amounts of CML in raw or cooked beef varied greatly in a limited number of
reported studies. Chao et al. (2009) reported that the raw beef and processed beef
strips (average 50 g per strip, boiled at 100 °C, fried at 180 °C, and baked at 230 °C
for 15 min) contained about 0.13 mg/kg to 0.6 mg/kg CML (data estimated from
published figures). The boiled strips had 230% increase in CML (from 0.13 to 0.43
mg/kg), which was similar to the 190% CML increase in our 100 °C/15 min treatment
for ground beef. Assar et al. (2009) reported that the amount of CML in raw minced
beef, minced beef boiled for 3 min (50 g beef in 250 g water), and minced beef
pan-fried for 3 min (50 g, detailed unknown) were 0.72, 5.02, 11.2 mg/kg,
respectively. The amount of CML in their boiled minced beef increased six times in
only 3 min of heating. Hull et al. (2012) reported that CML in roasted beef ranged
from 1.5 mg/kg for raw, 2.5 mg/kg for medium, to 4.2 mg/kg for well-done beef.
Obviously, the source, freshness and process methods of beef samples used in
different studies varied greatly, leading to great differences in these reported data. It is
very likely that ground beef is more susceptible to lipid oxidation, which forms
glycating agents such as α-dicarbonyl compounds during storage, accelerating the
formation of AGEs and leading to relatively high levels of CML as reported in our
studies.

14
The levels of CEL in raw ground beef were 2.32−3.18 mg/kg, and in heat-treated
ground beef ranged from 2.65 to 11.89 mg/kg. Similar to that for CML, the amount of
CEL increased with heating time and temperature. After 60 min of heat treatments, the
levels of CEL increased 72% to 301% (Fig. 2b). In addition, we observed a strong
linear relationship (r2 = 0.920) between CEL and CML contents in raw and heated
treated beef samples (Fig. 3), indicating that CEL and CML were affected in a similar
pattern by heat treatments and may be formed under similar pathways. A linear
relationship between CEL and CML (r2 = 0.87) for almonds roasted at 129 °C for 32
to 70 min was found based upon the data reported by Zhang et al. (2011), although
there was no linear relationship between CEL and CML in almonds roasted at 138 °C
to 182 °C.
3.3. Kinetics of formation of CML and CEL in ground beef during thermal treatments
Since the come-up time for the central temperature of ground beef reaching the
targeted temperature was about 3.5−4 min, the CML and CEL data before 5 min of
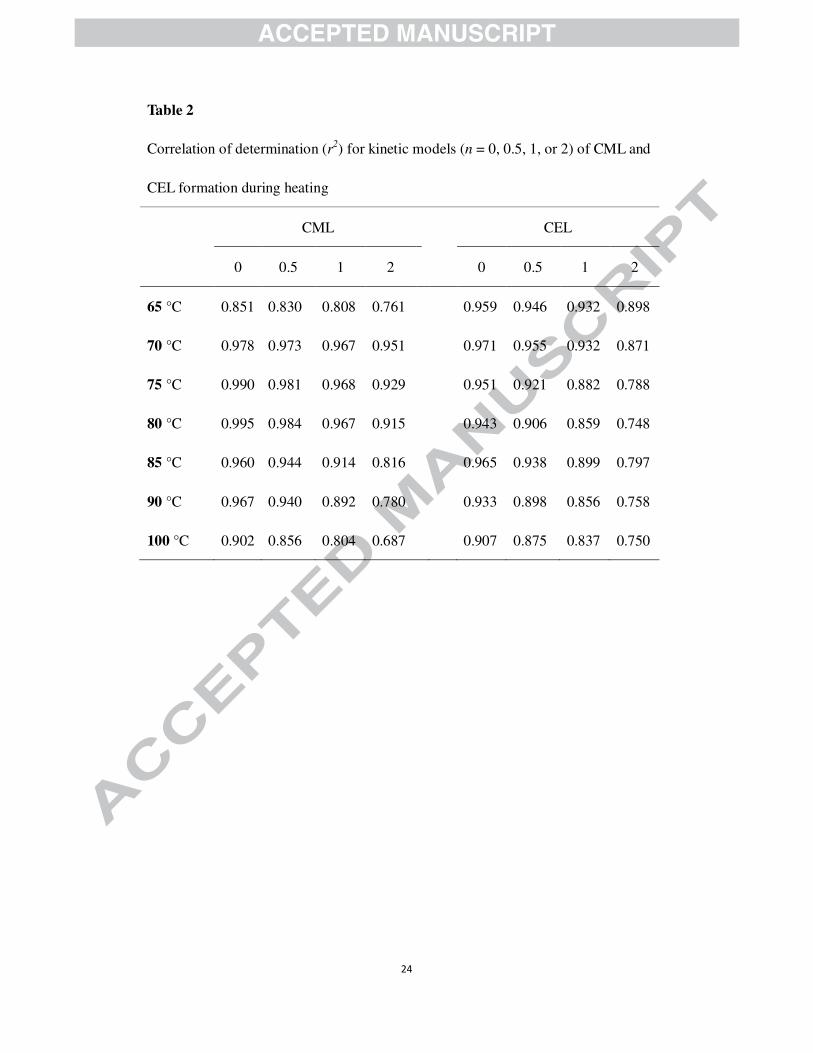
heating time were not used for determining reaction order. As shown in Table 2, the
higher the reaction order used, the less satisfactory were the results for fitting the
kinetic models; a zero-order reaction resulted in the highest r2 value for both CML
and CEL at all seven different temperatures (CML: r2 = 0.851−0.995; CEL: r
2 =
0.907−0.971) (Table 2). However, at high temperature conditions including 90 and
100 ºC, although zero-order reactions fitted well for both CML and CEL at heating
time up to 20 min (CML, r2 = 0.903 at 90 ºC, r2 = 0.965 at 100 ºC; CEL, r2 = 0.918 at

15
90 ºC, r2 =0.981 at 100 ºC), the rate of AGEs formation seemed to decrease at longer
heating time; yet zero-order reaction still fitted very well for the data from 20−60 min
of heating (CML: r2 = 1 at 90 ºC, r
2 = 0.976 at 100 ºC; CEL, r2 = 1 at 90 ºC, r
2 =
0.986 at 100 ºC) (Fig. 4 a & b). Because of limited data for 20 min or longer heat
treatments, no specific two-step zero-order models were developed for the formation
of AGEs at 90 and 100 ºC and further studies are needed. A zero-order reaction
indicated that the amount of CML or CEL in ground beef did not affect the reaction
rate. Zero-order reactions are very common for food systems when the product
formed is much less than the precursors present in foods (Van Boekel, 2008), and such
a finding is typically tied to products from the Maillard reaction (Morales & Van
Boekel, 1996; Van Boekel, 2001; Boonchiangma, Chanthai, Srijaranai, & Srijaranai,
2011; Güneser, Toklucu, & Karagül-Yüceer, 2013).
The reaction rate constant calculated at each temperature based upon a
zero-order reaction for CML increased from 0.031 to 0.224 mg·kg-1
·min-1
, and for
CEL from 0.044 to 0.118 mg·kg-1
·min-1
as reaction temperature increased from 65 to
100 ºC. The rate constants for both CML and CEL in ground beef during heating
basically fitted the Arrhenius equation (Fig. 4c & d; CML, r2 = 0.952; CEL, r2= 0.910)
with activation energy of 61.01 kJ/mol (±2.40 kJ/mol) for CML, and 29.21 kJ/mol
(±2.19 kJ/mol) for CEL.
The study of Morales and Van Boekel (1996) for sugar-casein model systems
(110−150 ºC for 0−30 min) showed that the formation of L-lysyl pyrraline (an AGE)
was zero-order with an activation energy of 109.1−138.1 kJ/mol. Several other studies
16
indicated that the formation of another typical Maillard reaction product,
hydroxymethylfurfural, also followed zero-order reaction with an activation energy of
96.31 kJ/mol in goat milk heated at 75−95 ºC for 0−540 min (Güneser et al., 2013)
and 135.4−139.6 kJ/mol in honey (25−85 ºC for 0−14 days) (Boonchiangma et al.,
2011). In our study, the activation energies for CML and CEL were relatively lower
than the other reported Maillard reaction products, such as hydroxymethylfurfural and
L-lysyl pyrraline. This may indicate that the formation of CML and CEL is less
temperature dependent than other reported Maillard products (Van Boekel, 2008), but
further study is needed since test conditions were not the same across different
studies.
4. Conclusions
The levels of CML and CEL in ground beef increased with heating time and
heating temperature, and the amounts of these two AGEs in thermally-treated ground
beef were highly correlated. The formation of both CML and CEL in ground beef
could be considered to be zero-order reactions. A zero-order reaction implied that the
amounts of CML and CEL in the samples did not affect the production rate of CML
and CEL, which was expected, since the single- or two-digit ppm-levels of CML and
CEL in the ground beef samples were much less than precursors such as lysine.
The formation of CML and CEL results from at least four identified pathways
involving numerous intermediate products in complex food systems. The dominant
pathway(s) leading to the formation of AGEs may change at different temperatures.

17
Meanwhile, some of the intermediate products may follow different pathways to form
other end products in addition to AGEs. This makes it very difficult, if not impossible
to apply kinetic models to reveal the mechanisms of AGEs formation in complex food
systems. In this study, an order of reaction was determined to help understand the
quantitative changes of AGEs in ground beef under pasteurisation conditions.
Although the study could not reveal the underlying mechanism for the formation of
AGEs, a systematical study like this helps advance our knowledge on the overall
formation of AGEs under pasteurisation conditions in complex food systems.
Acknowledgements
This study was funded by the USDA-NIFA 2011-68003-20096, Shanghai Ocean
University and the Washington State University Agricultural Research Center.

18
References
Ahmed, N., Mirshekar-Syahkal, B., Kennish, L., Karachalias, N., Babaei-Jadidi, R., &
Thornalley, P. J. (2005). Assay of advanced glycation endproducts in selected
beverages and food by liquid chromatography with tandem mass spectrometric
detection. Molecular Nutrition & Food Research, 49, 691–699.
Ames, J. M. (2007). Evidence against dietary advanced glycation endproducts being a
risk to human health. Molecular Nutrition & Food Research, 51, 1085–1090.
Assar, S. H., Moloney, C., Lima, M., Magee, R., & Ames, J. M. (2009).
Determination of Nε-(carboxymethyl)lysine in food systems by ultra
performance liquid chromatography-mass spectrometry. Amino Acids, 36,
317–326.
Birlouez-Aragon, I., Pischetsrieder, M., Leclѐre, J., Morales, F. J., Hasenkopf, K.,
Kientsch-Engel, R., Ducauze, C. J., & Rutledge, D. (2004). Assessment of
protein glycation markers in infant formulas. Food Chemistry, 87, 253–259.
Boonchiangma, S., Chanthai, S., Srijaranai, S., & Srijaranai, S. (2011). Chemical
compositions and non-enzymatic browning compounds of Thai honey: a kinetic
study. Journal of Food Process Engineering, 34, 1584–1596.
Chao, P-C., Hsu, C-C., & Yin, M-C. (2009). Analysis of glycative products in sauces
and sauce-treated foods. Food Chemistry, 113, 262–266.
Fu, M-X., Requena, J. R., Jenkins, A. J., Lyons, T. J., Baynes, J. W., & Thorpe, S. R.
(1996). The advanced glycation end product, Nε-(carboxymethyl)lysine, is a
product of both lipid peroxidation and glycoxidation reactions. The Journal of

19
Biological Chemistry, 271(17), 9982–9986.
Fu, Q., Li, L., & Li, B. (2012). Formation of Nε-(carboxymethyl)lysine in
saccharide-lysine model systems by different heat treatments. International
Journal of Food Engineering, 8(3), Article 1. DOI: 10.1515/1556-3758.2724.
Goldberg, T., Cai, W., Peppa, M., Dardaine, V., Baliga, B. S., Uribarri, J., & Vlassara,
H. (2004). Advanced glycoxidation end products in commonly consumed foods.
Journal of the American Dietetic Association, 104, 1287–1291.
Güneser, O., Toklucu, A. K., & Karagül-Yüceer, Y. (2013). Formation kinetics of
hydroxymethylfurfural and brown coloured compounds in goat milk during
heating. International Journal of Dairy Technology, 66, 14–19.
Hull, G. L. J., Woodside, J. V., Ames, J. M., & Cuskelly, G. J. (2012).
Nε-(carboxymethyl)lysine content of foods commonly consumed in a Western
style diet. Food Chemistry, 131, 170–174.
Kong, F., Tang, J., Rasco, B., Crapo, C., & Smiley, S. (2007). Quality changes of
salmon (Oncorhynchus gorbuscha) muscle during thermal processing. Journal of
Food Science, 72, S103–S111.
Lawrence J. (2005). Meat and meat products. AOAC Official Method 950.46.
Moisture in meat; Method 991.36. Fat (crude) in meat and meat products.
Solvent extraction (submersion) method; Method 928.08. Nitrogen in meat.
Kjeldahl method. In W. Horwitz, & G. W. Latimer (Eds.) Official methods of
analysis of AOAC international (Chapter 39, pp. 1-6). Arlington: AOAC
international.

20
Morales, F. J., & Van Boeckel, M. A. J. S. (1996). Formation of lysylpyrraline in
heated sugar-casein solutions. Netherlands Milk and Dairy Journal, 50,
347–370.
Niquet-Léridon, C., & Tessier, F. J. (2011). Quantification of Nε-carboxymethyl-lysine
in selected chocolate-flavoured drink mixes using high-performance liquid
chromatography-linear ion trap tandem mass spectrometry. Food Chemistry, 126,
655–663.
Nguyen, C. V. (2006). Toxicity of the AGEs generated from the Maillard reaction: On
the relationship of food-AGEs and biological-AGEs. Molecular Nutrition &
Food Research, 50, 1140–1149.
Poulsen, M. W., Hedegaard, R. V., Andersen, J. M., de Courten, B., Bügel, S., Nielsen,
J., Skibsted, L. H., & Dragsted, L. O. (2013). Advanced glycation endproducts in
food and their effects on health. Food and Chemical Toxicology, 60, 10–37.
Rabbani, N., & Thornalley, P. J. (2012). Glycation research in amino acids: a place to
call home. Amino Acids, 42, 1087–1096.
Schettgen, T., Tings, A., Brodowsky, C., Müller-Lux, A., Musiol, A., & Kraus, T.
(2007). Simultaneous determination of the advanced glycation end product
Nɛ-carboxymethyllysine and its precursor, lysine, in exhaled breath condensate
using isotope-dilution–hydrophilic-interaction liquid chromatography coupled to
tandem mass spectrometry. Analytical and Bioanalytical Chemistry, 387,
2783–2791.
Teerlink, T., Barto, R., Brink, H. J. T., & Schalkwijk, C. G. (2004). Measurement of
21
Nɛ-(carboxymethyl)lysine and N
ɛ-(carboxyethyl)lysine in human plasma protein
by stable-isotope-dilution tandem mass spectrometry. Clinical Chemistry, 50,
1222–1228.
Uribarri, J., Woodruff, S., Goodman, S., Cai, W., Chen, X., Pyzik, R., Yong, A.,
Striker, G. E., & Vlassara, H. (2010). Advanced glycation end products in foods
and a practical guide to their Reduction in the diet. Journal of the American
Dietetic Association, 110, 911–916.
van Boekel, M. A. J. S. (2001). Kinetic aspects of the Maillard reaction: a critical
review. Nahrung/Food, 45, 150–159.
van Boekel, M. A. J. S. (2008). Kinetic modeling of food quality: a critical review.
Comprehensive Reviews in Food Science and Food Safety, 7, 144–158.
Wellner, A., Huettl, C., & Henle, T. (2011). Formation of Maillard reaction products
during heat treatment of carrots. Journal of Agricultural and Food Chemistry, 59,
7992–7998.
Zhang, G., Huang, G., Xiao, L., & Mitchell, A. E. (2011). Determination of advanced
glycation endproducts by LC-MS/MS in raw and roasted almonds (Prunus
dulcis). Journal of Agricultural and Food Chemistry, 59, 12037–12046.

22
Figure Captions
Fig. 1. LC-MS/MS chromatogram of a mixture of AGEs standards obtained through
multiple reaction monitoring in positive-ion mode. The concentrations of AGEs were:
CML 195 µg/kg, CEL 155 µg/kg, and d4-CML 100 µg/kg.
Fig. 2. Change of (a) CML and (b) CEL concentrations in ground beef heated at
65−100°C for 0−60 min. Data are presented as mean ± standard deviation of four
measurements.
Fig. 3. Plot of CEL versus CML content in raw and heat-treated ground beef.
Fig. 4. (a) (b) Plot of CML and CEL versus time at different temperatures,
respectively. Each solid line is the linear regression trendline at a specific temperature.
The red dashed lines show linear regression trendlines for two different heating time
periods at 100 ºC. (c) (d) Plot of ln k for CML and CEL versus 1/T , respectively. The
unit for k is mg·kg-1·min-1.

23
Table 1
Mass spectrometric parameters for multiple reactions monitoring AGEs
compounds precursor
ion (m/z)
product
ion (m/z)
collision
energy (eV)
cone
voltage (V)
d4-CML 209 88 15 20
CML 205 130* 10 20
84 20 20
CEL 219 130* 12 25
173 12 25
* ion used for quantification.
24
Table 2
Correlation of determination (r2) for kinetic models (n = 0, 0.5, 1, or 2) of CML and
CEL formation during heating
CML CEL
0 0.5 1 2 0 0.5 1 2
65 °C 0.851 0.830 0.808 0.761 0.959 0.946 0.932 0.898
70 °C 0.978 0.973 0.967 0.951 0.971 0.955 0.932 0.871
75 °C 0.990 0.981 0.968 0.929 0.951 0.921 0.882 0.788
80 °C 0.995 0.984 0.967 0.915 0.943 0.906 0.859 0.748
85 °C 0.960 0.944 0.914 0.816 0.965 0.938 0.899 0.797
90 °C 0.967 0.940 0.892 0.780 0.933 0.898 0.856 0.758
100 °C 0.902 0.856 0.804 0.687 0.907 0.875 0.837 0.750

1
Fig. 1. LC-MS/MS chromatogram of mixture of AGEs standards obtained through
multiple reaction monitoring in positive-ion mode. The concentrations of AGEs were:
CML 195 μg/kg, CEL 155 μg/kg, and d4-CML 100 μg/kg.
Time0.00 2.00 4.00 6.00 8.00 10.00 12.00
%
0
100
0.00 2.00 4.00 6.00 8.00 10.00 12.00
%
0
100
0.00 2.00 4.00 6.00 8.00 10.00 12.00
%
0
100
0.00 2.00 4.00 6.00 8.00 10.00 12.00
%
0
100
CML_20130826_01 MRM of 9 Channels ES+ 209 > 87.7 (D4-CML)
5.20e3
3.88
CML_20130826_01 MRM of 9 Channels ES+ 205.39 > 130.03 (CML-1)
7.44e3
3.88
CML_20130826_01 MRM of 9 Channels ES+ 219.2 > 130.1 (CEL-1)
1.80e4
3.67
CML_20130826_01 MRM of 9 Channels ES+ TIC
2.92e4
3.81
Re
lati
ve a
bu
nd
an
ce
(%
) D4-CML, m/z 209>88
CML, m/z 205 >130
CEL, m/z 219>130
Total ion current
Retention time (min)

1
Fig. 2. Change of (a) CML and (b) CEL concentrations in ground beef heated at
65−100°C for 0−60 min. Data are presented as mean ± standard deviation of four
measurements.
(a) (b)

1
Fig. 3. Plot of CEL versus CML content in raw and heat treated ground beef.

Fig. 4. (a) (b) Plot of CML and CEL versus time at different temperature, respectively. Each
solid line is the linear regression trendline at a specific temperature. The red dash lines show
linear regression trendlines for two different heating time periods at 100 ºC. (c) (d) Plot of ln k
for CML and CEL versus 1/T , respectively. The unit for k is mg·kg-1
·min-1
.
(a) (b)
(d) (c)

25
Highlights
� The effects of heat treatments (65−100 °C, 0−60 min) on AGEs in beef were
tested.
� Formation of carboxymethyllysine and carboxyethyllysine was via a zero-order
reaction.
� Carboxymethyllysine and carboxyethyllysine levels were linearly correlated.