form evaluation algorithms in coordinate metrology evaluation algorithms in coordinate metrology d....
TRANSCRIPT
Form evaluation algorithms in coordinate metrology
D. Zhang, M. Hill, J. McBride & J . Loh Mechanical Engineering, University of Southampton, United Kingdom
Abstract
Form evaluation algorithms that characterise geometric dimensions and verify the conformance to a given tolerance from the 3D measurement data play a significant role in 3D coordinate metrology. This paper reviews the research on form evaluation software, including the approaches to development, testing and selection of appropriate algorithms for form evaluation. By investigating the issues raised in form evaluation software, a methodology for testing of spherical form evaluation algorithms has been proposed and presented, including drawing up the criteria for algorithms testing, and designing approaches to testing procedures. Based on testing and analysing, conclusions have been drawn for properly applying form evaluation algorithms.
1. Introduction
Three-dimensional coordinate measurement has become significant in industrial dimensional metrology. It allows the acquisition of accurate surface data and readily gives the relationship between various part features. The results of the 3D measurements can also be used for process control. In coordinate metrology, the measurement data are coordinates of the measured features instead of the geometrical dimensions, thus these measurement data need to be analysed to create a geometry model, usually called the substitute geometry [l]. In data processing methods, the features of the substitute geometry are the prime targets. Mathematical software, particularly curve and surface fitting is a critical and necessary component of a coordinate measurement system and had become one of the key components in 3D metrology [2].
Since data analysis is performed using mathematical algorithms whose results (the geometric features) depend strongly on many factors, including the sampling methods chosen for data acquisition, the noise in the data caused by systematic
Transactions on Engineering Sciences vol 44, © 2003 WIT Press, www.witpress.com, ISSN 1743-3533

274 Laser Metrology und Muchiize Performance VI
and pseudo-random machne error, form error of the measured surfaces, surface finish, algorithm correctness and robustness, the results reported after analysis may contain large errors though it may appear to the user that data of high accuracy are obtained. Therefore, the numerical algorithms themselves, as well as the relationship between algorithms, the measurement error, and sampling strategy are a research focus in coordinate metrology. Many researchers have concentrated their research interest in development, test and selection of appropriate algorithms for form evaluation [3-71. This paper reviews this research and presents an approach to test and selection of form evaluation algorithms based on computer simulations and experimental validation.
2. Outline of algorithms for form evaluation
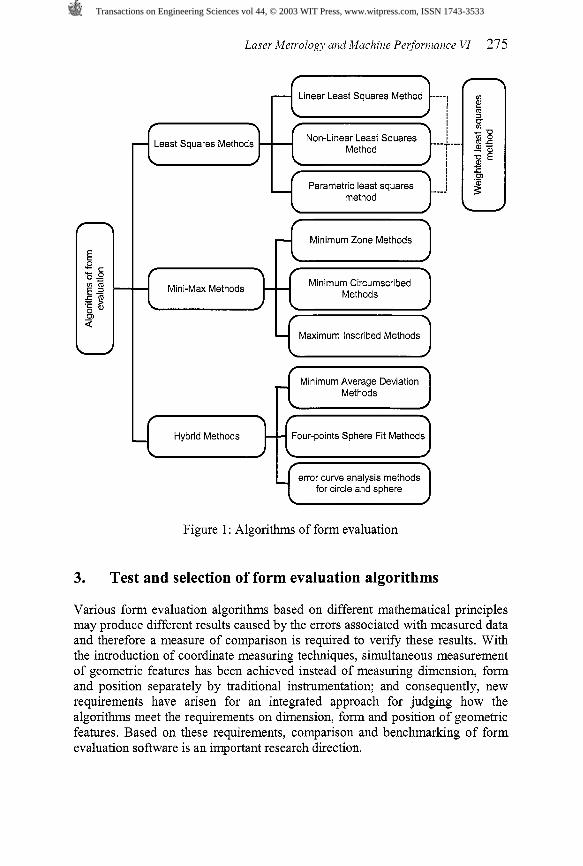
Two types of algorithm predominate in form evaluation software of CMS measurements: the least squares (Gaussian) methods and Mini-Max (Chebyshev) methods. Based on the mathematical procedures to obtain the best-fit elements, the least squares methods can be classified into linear least squares and non- linear least squares. Based on the principle of the least squares, Soulier [g] has developed a method for providing a best-fit solution for any surface by representing the surface in parametric form, which is hereafter referred to as the parametric least squares method. Mini-Max algorithms can be also classified into three types: minimum zone, minimum circumscribed and maximum inscribed. The minimum zone method can be used to evaluate various geometries and will result in a minimum tolerance zone, however, the remaining two Mini-Max methods, such as minimum circumscribed and maximum inscribed methods can only sensibly be defined for a circle, sphere or cylinder [9] and are suitable where mating of parts is required.
The weighted least squares method, in whch the concept of weight has been associated with least squares methods, has been used to mask out unwanted data or increase the influence of reliable data and to decrease that of less reliable data where least squares theory is not changed by using weighting function [10].
In addition, some hybrid methods have been developed in resent research. The minimum average deviation algorithm has been introduced for form error evaluation by Shunmugam [ l l ] . This method minimizes the average of the deviations and considers all the points on the geometrical feature. McBride et a1 [l21 developed a method for sphere characterization, based on four-points sphere fits. From discrete data, four points are chosen on a defmed cluster. The centre coordinates and the radius of a sphere are calculated from those four points and the procedure is repeated for as many times as four points on a defined cluster can be chosen within the data set and the best fit parameters are defined as the average of all outcomes. Another method for sphere fitting, the error curve analysis method, has been developed by Jung et a1 [7]. The algorithm is based on a circle-fitting algorithm published by McBride and Cross [12]. To show the relationship of the existing algorithms for form evaluation, the methods are categorised in Figure 1.
Transactions on Engineering Sciences vol 44, © 2003 WIT Press, www.witpress.com, ISSN 1743-3533
Laser Metrology and Machine Performance VI 275
Linear Least Squares Metho
Least Squares Methods Non-Linear Least Squares Method
Parametric least squares method
Minimum Zone Methods
Mini-Max Methods Minimum Circumscribed Methods
Maximum Inscribed Methods
Minimum Average Deviation Methods
Hybrid Methods Four-points Sphere Fit Methods
error curve analysis methods for circle and sphere
Figure l : Algorithms of form evaluation
3. Test and selection of form evaluation algorithms
Various form evaluation algorithms based on different mathematical principles may produce different results caused by the errors associated with measured data and therefore a measure of comparison is required to verify these results. With the introduction of coordinate measuring techniques, simultaneous measurement of geometric features has been acheved instead of measuring dimension, form and position separately by traditional instrumentation; and consequently, new requirements have arisen for an integrated approach for judging how the algorithms meet the requirements on dimension, form and position of geometric features. Based on these requirements, comparison and benchmarking of form evaluation software is an important research direction.
Transactions on Engineering Sciences vol 44, © 2003 WIT Press, www.witpress.com, ISSN 1743-3533

276 Laser Metrology und Muchiize Performance VI
3.1 Criteria for test and selection of form evaluation algorithms
Least squares fitting techniques are accepted and widely employed for form tolerance evaluation, but they do not result in a minimum tolerance zone so the minimum tolerance zone approach has been developed. However, these are not the only criteria to judge an algorithm. Form evaluation software used in measuring instruments is expected to meet the measurement objectives, known as the function-oriented approach [13]. BS7120 also recommends the use of methods that are appropriate to the task in hand, rather than advocating a single approach to the analysis of data. This requires appropriate criteria for judging and selecting algorithms based on measuring tasks.
Cox and Forbes [4] propose a comparison of the fitting results by the parameter values or residual errors. Parameter values are the most important factors in determining the measured geometry. In addition, Cox and Forbes suggest that algorithm selection could be carried out based on residual errors. Alternatively, the standard deviation of the residuals might be feasible for the comparisons.
Recently, the Guide to the Expression of Uncertainty in Measurement (GUM) [l41 recommends that all measurement results should be presented with their measurement uncertainty. The measurement uncertainty is associated with many factors, such as the algorithms themselves, the types of errors, densities and the modes of sampling [2, 151. Investigating and comparing the measurement uncertainty will be a significant approach for selection of appropriate algorithms.
3.2 Approaches to algorithm testing
After determining the criteria for judging and selecting algorithms, software testing can be performed. There are two approaches to testing scientific software; the first based on using reference software and the second using data generators [16]. The procedure for testing by reference software is illustrated in Figure 2. In this procedure, reference software and test software are each applied to the reference data set to produce, respectively, corresponding reference results and test results. The reference and test results are then compared based on criteria. Clearly, this approach relies on the availability of reference software.
C Reference data set 1 Reference software Test software Q<
v Comparison
Figure 2: The procedure for testing software by reference software
Transactions on Engineering Sciences vol 44, © 2003 WIT Press, www.witpress.com, ISSN 1743-3533

Laser Metrology and Machine Performance VI 277
The procedure for testing using a data generator is illustrated in Figure 3. Starting with some reference results, a data generator is used to generate corresponding reference data sets. The test software is applied to the reference data sets to produce corresponding test results that are then compared with the reference results based on the criteria.
Data generator Reference data I
. Comparison Test results Test software
Figure 3: Procedure for testing software by data generators
3.3 Current research trends on testing and selection of form evaluation algorithms
Many researchers have concentrated on testing and selection of form fitting algorithms and have presented research approaches. Anthony et a1 [9] have noted that the least squares method is appropriate where random measurement errors predominate. They further noted that the minimum zone method is most appropriate in the cases where the form errors are dominant, because it can lead to minimum tolerance zones.
Lin et a1 [l71 have compared three form evaluation algorithms: the methods of least squares, the minimum zone and the minimum average deviation for evaluating geometric elements. In thls research, tolerance zone and computational efficiency have been taken as the comparative criteria.
Hopp et a1 [l81 emphasized the best choice of fitting objectives is that which produces the smallest combined uncertainty in the results. To investigate the sensitivity of measurement error for different fitting algorithms, Hopp tested the circle-fitting problem by least squares methods and minimum circumscribed method by comparing the variations of radii and centre coordinates derived. It has been found that Mini-Max method will propagate more of the point measurement error to evaluated results than least squares methods.
4 A methodology for the testing and selection of form evaluation algorithms
T h s section investigates the issues raised in section 3 as applied to the selection of form evaluation algorithms for spherical forms.
4.1 The criteria for algorithms testing
The application of modern coordinate measurement systems demands that form evaluation algorithms can provide minimum tolerance zones, unique solutions
Transactions on Engineering Sciences vol 44, © 2003 WIT Press, www.witpress.com, ISSN 1743-3533

278 Laser Metrology und Muchiize Performance VI
and are easy to implement. According to this requirement a set of criteria has been proposed for testing of spherical form evaluation algorithms as following:
Deviation of estimated radius: The estimated radius derived from a cluster of measurement points is usually different from its nominal value. Deviation of the estimated radius means the difference between estimated radius and its nominal value. The smaller the deviation is, the better the measurement results is.
Uncertainty (standard deviation) of estimated radius: Uncertainty of measurement is defined as a range on either side of the mean value of a set of measurements. The range is associated with a confidence level. In this research, the uncertainty is represented by standard deviation.
Sphericity: Sphericity is a term related to the form errors of a spherical surface. It is defined as the radial difference between two concentric spheres about a specified centre, which are sufficient to contain the spherical surface. In general, a form estimate algorithm that produces a low sphericity value is particularly useful for applications in which tolerance and fits are critical. The smaller the sphericity value is, the better the measurement result is.
4.2 Prescribed algorithms for testing
In Section 2, several form evaluation algorithms have been outlined. Among these algorithms, the methods of maximum inscribed and minimum circumscribed sphere are only sensibly defined for whole spheres and specified for the cases in which two spheres need to mate with each other. If these two methods are applied to hemi- or less than hemi-spheres, they cannot derive correct results [6]. Spherical features found on manufactured parts often come in the form of a portion of a sphere, rather than a whole sphere. Algorithm testing emphasizes investigating the effects of the sampling size and density on the estimated form parameters. Therefore, the algorithms to be selected for testing do not include the methods of maximum inscribed and minimum circumscribed.
Jung et a1 [7] tested five algorithms on partial spheres. They are non-linear least squares method, linear least squares method, minimum zone method, four- point sphere fitting and sphere-fit by error curve analysis. It was concluded that the non-linear least squares method provided the best performance over the different sampling sizes for the cases where the distribution of surface irregularity is normal, and minimum zone fitting is most accurate when the surface irregularity deviates from the normal distribution based on comparison of the deviation of estimated radii. Chen et a1 [l91 has found that there is no practical difference between non-linear and linear least squares methods based analysis of the fitting radii and central coordinates, as well as the standard deviation of residual errors. From these results, the non-linear least squares method (NLS), the linear least squares methods (LLS) and minimum zone fitting (MZ) are selected for further test. In addition, it is claimed by Lin et a1 [l71 that minimum average deviation method results in smaller tolerance zones than the least squares method in the evaluation of form error for evaluation of line, plane and circle elements. To prove t h s result in spherical form evaluation, the minimum average deviation method is included in the list of tested algorithms.
Transactions on Engineering Sciences vol 44, © 2003 WIT Press, www.witpress.com, ISSN 1743-3533

Laser Metrology and Machine Performance VI 279
4.3 Approaches to algorithm testing
A common approach to algorithm testing is to use computer simulations. This procedure normally involves generating test data sets, running these data through reference algorithms, and comparing the results of those algorithms to the nominally correct results as outlined in Section 3.2. Considering all of the factors which influence the performance of algorithms, the block diagram of the testing procedure for spherical form evaluation algorithms is illustrated in Figure 4.
First, an ideal sphere is generated with known radius and central coordinates and then form error and surface noise, as well as the instrumental error are superimposed on the ideal spherical surface to form test data. To investigate the effect of form error, Laplace's spherical functions with different orders of harmonic, different phases and different amplitudes are generated to simulate the form errors. For random noise, not only white but also autocorrelated noise with different correlation lengths are examined. In the testing algorithms in the presence of random noise, white noise represents instrumental random error and correlated random noise represents the roughness of the measured surfaces.
ideal sphere
r > add form errors
(varied orders, amplitudes and phases of harmonic errors)
L
j surface irregularity add random noise measurement
v uniangle sampling
sampling strategy
4 it with selected algorit repeat 100 times
fitting radius fitting radius sphericity
conclusions (recommend optimal algorithms)
Figure 4: A procedure for testing spherical form evaluation algorithms
Transactions on Engineering Sciences vol 44, © 2003 WIT Press, www.witpress.com, ISSN 1743-3533
280 Laser Metrology und Muchiize Performance VI
For the tested cases in which form errors dominated, three cases are tested, which correspond to practical machining and measurements. The first tests the influence of positional shift of sampling area for the same measured sample. The second tests the influence of limited change of form errors by the same procedures. And the last tests the randomly changed form errors. All the tests are performed over the different measured segment angles and numbers of lines in sampling grids to reveal the effects of the sampling sizes and densities. All the tests are run 100 times to obtain the mean of the estimated radius, the standard deviation of the estimated radius and the mean of sphericity.
4.4 Test results
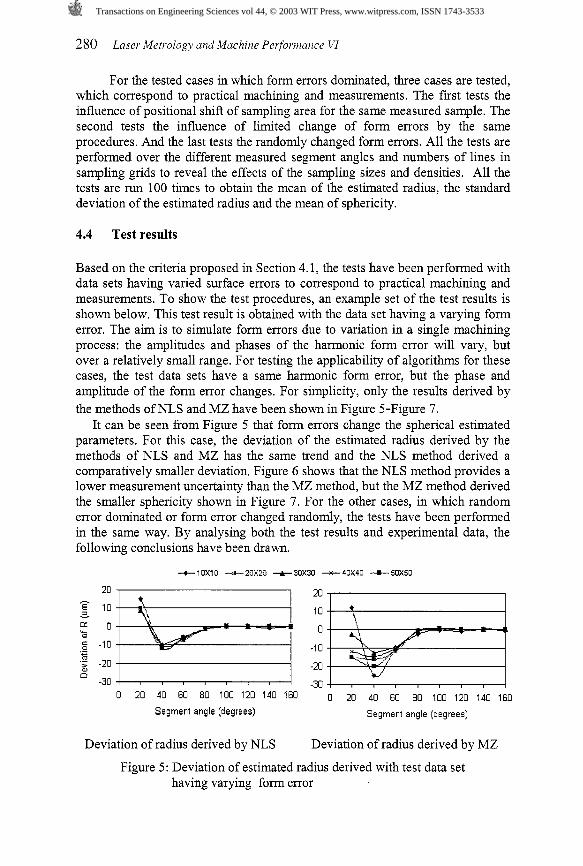
Based on the criteria proposed in Section 4.1, the tests have been performed with data sets having varied surface errors to correspond to practical machining and measurements. To show the test procedures, an example set of the test results is shown below. This test result is obtained with the data set having a varying form error. The aim is to simulate form errors due to variation in a single machining process: the amplitudes and phases of the harmonic form error will vary, but over a relatively small range. For testing the applicability of algorithms for these cases, the test data sets have a same harmonic form error, but the phase and amplitude of the form error changes. For simplicity, only the results derived by the methods of NLS and MZ have been shown in Figure 5-Figure 7.
It can be seen from Figure 5 that form errors change the spherical estimated parameters. For this case, the deviation of the estimated radius derived by the methods of NLS and MZ has the same trend and the NLS method derived a comparatively smaller deviation. Figure 6 shows that the NLS method provides a lower measurement uncertainty than the MZ method, but the MZ method derived the smaller sphericity shown in Figure 7. For the other cases, in which random error dominated or form error changed randomly, the tests have been performed in the same way. By analysing both the test results and experimental data, the following conclusions have been drawn.
Segment angle (degrees] Segment angle (degrees]
Deviation of radius derived by NLS Deviation of radius derived by MZ
Figure 5: Deviation of estimated radius derived with test data set having varying form error
Transactions on Engineering Sciences vol 44, © 2003 WIT Press, www.witpress.com, ISSN 1743-3533

Laser Metrology and Machine Performance VI 28 1
50 50
" 40 E 40
g 30 L
30
20 20
10 10
0 0 0 20 40 60 80 100120140160 0 20 40 60 80 1 0 0 1 2 0 1 4 0 1 6 0
Segment angle (degrees) Segment angle (degrees)
Standard deviation of estimated radius Standard deviation of estimated radius derived by NLS derived by MZ
Figure 6: Standard deviation of estimated radius derived with test data set having varying form error
12 12
- 10 10 E X 8 - .-
8 U .- $ 6 C
6 a
G-J 4 4
2 2 0 20 40 60 80 100 120 140 160 0 20 40 60 80 100 120 140 160
Segment angle (degrees) Segment angle (degrees)
Sphericity derived by NLS Sphericity derived by MZ
Figure 7: Sphericity derived with test data set having varying form error
4.5 Conclusions of the algorithm testing
The test results suggest that no single sphere form evaluation algorithm is appropriate for all measurement situations. Based on these simulations and experimental verification, the following conclusions have been drawn:
(i) For the case where random measurement error is dominant, the NLS method is superior among the methods of LLS, NLS and MA, as it provides an unbiased estimated radius, lowest uncertainty of the estimated radius and lowest sphericity. The MZ method derived a higher uncertainty of the estimated radius
(ii) The random uncertainties derived from these 4 methods are all functions of sampling size and sampling density. Among these algorithms, the NLS method derives a random uncertainty of estimated radius which is
Transactions on Engineering Sciences vol 44, © 2003 WIT Press, www.witpress.com, ISSN 1743-3533

282 Laser Metrology und Muchiize Performance VI
independent on the form error of the measured sphere whereas the uncertainty of estimated radius derived by the MZ method changes significantly with different form errors.
(iii) Gaussian correlated noise shows the same trend with the white noises on the estimated radius, its uncertainty and the sphericity, that is the NLS method derived an unbiased estimated radius with the lowest uncertainty
(iv) When form errors are dominant with measured spheres, the positional shifts of sampling areas and the variations of form error due to production procedures will produce deviation and uncertainty on the estimated radius. Larger variations of the form errors on the measured spherical surface will produce higher uncertainty of the estimated radius and make the difference of uncertainty derived by the methods of NLS and MZ smaller. When the form errors change randomly, the uncertainty of estimated radius is very close derived by the methods of NLS and MZ.
(v) As for sphericity, the MZ method derives a lowest sphericity under all circumstances. Statistically, the difference of the sphericity derived by these 4 algorithms is less than 10%.
5 Conclusion
In this paper, the research on form evaluation has been reviewed. From the review, it is concluded that overall criteria to guide the correct use of algorithms for form assessment are not available. Therefore, an approach for defining criteria of the selection of form evaluation algorithms and guiding the function- oriented use of these algorithms is an urgent need. According to this requirement, a set of criteria has been proposed for testing and selection of spherical form evaluation algorithms, which include the geometric dimension, its measurement uncertainty and tolerance zone. Computer simulations have been performed for comparison and selection of the spherical form evaluation algorithms based on these three factors and experimental results have been applied to verify the conclusions obtained from computer simulations. The tests are emphasized on varieties of types of errors, sampling sizes and density to cover a variety of possible practical measurement situations and to explore the advantages and weaknesses of each algorithm. Judging the test results by the proposed criteria, overall recommendations and conclusions have been obtained for practical measurements. Compared with previous studies of algorithm comparisons, more quantitative conclusions about the effects of noise, sampling size and sampling density on the potential accuracy of measurement estimates are included. Although the work is performed on spherical form evaluation algorithms, the research approach can be extended and applied in other geometric shapes.
References
1. Hocken, R.J., J. Raja, and U. Babu, Sampling issues in coordinate metrology. Manufacturing Review, 1993.6(4): p. 282-294.
Transactions on Engineering Sciences vol 44, © 2003 WIT Press, www.witpress.com, ISSN 1743-3533
Laser Metrology and Machine Performance VI 283
Choi, W., T. Kerfess, and C. Jonathan, Sampling uncertainty in coordinate measuring data analysis. Precision Engineering, 1998. 22: p. 153-163. Forbes, A.B., Least-squares best-fit geometric elements. NPL-Report, DITC 140189. 1989. Cox, M.G. and A.B. Forbes, Strategies for testing form assessment software. NPL-report, DITC 21 1192, 1992. Samuel, G.L. and MS. Shunmugam, Evaluation of circularity from coordinate and form data using computational geometric techniques. Precision Engineering, 2000. 24: p. 251-263. Chen, C.K. and C.H. Liu, A study on analysing the problem of the spherical form error. Precision Engineering, 2000. 24: p. 119-126. Jung, M., et al., A method for the selection of algorithms for form characterisation of nominally spherical surface. Precision Engineering, 2000.24: p. 127-138. Sourlier, D., Surface-independent, theoretically exact bestfit for arbitra y sculptured, complex, or standard geometries. Precision Engineering, 1995. 17: p. 101-113. Anthony, G.T. and H.M. Anthony, Chebychev best-fit geometric elements. NPL Report DITC 221193, 1993. Rice, J.R., Numerical Methods, Software, Analysis. 1983: McGraw-Hill. 355-408. Shunmugam, MS., Technical Briefs: Criteria for computer-aided form evaluation. Journal of Engineering for Industry, 199 1.113: p. 233-238. McBride, J.W. and K.J. Cross, The measurement and analysis of three- dimensional form of curved surfaces,. Int. Journal of Machine Tools and Manufacture, 1996. 36(5): p. 587-610. Weckenmann, A. and H. Eitzert, Functionality-oriented evaluation and sampling strategy in coordinate metrology. Precision Engineering, 1995. 17: p. 244-252. ISO, Guide to the expression of uncertainty in measurement. Geneva, 1993. Phillips, S.D., et al., The estimation of measurement uncertainty of small circular features measured by coordinate measuring machines. Precision Engineering, 1998. 22: p. 87-97. Cox, M.G. and P.M. Harris, Guidelines to help users select and use software for their metrology applications, NPL report CSC 04/00,2000. Lin, SS . and P. Varghese, A comparative analysis of CMM form-fitting algorithms. Manufacturing Review, 1995. 8: p. 47-58. Hopp, T.H., Computational metrology. Manufacturing Review, 1993. 6(4): p. 295--304. Chen, K.W. and A.S. Papadoupoulos, Comparison of linear and non- linear least squares spheres. Microelectronics and Reliability, 1996. 36(1): p. 37-46.
Transactions on Engineering Sciences vol 44, © 2003 WIT Press, www.witpress.com, ISSN 1743-3533

Transactions on Engineering Sciences vol 44, © 2003 WIT Press, www.witpress.com, ISSN 1743-3533