forest nutrient and carbon pools at walker branch watershed
TRANSCRIPT
Forest Nutrient and Carbon Pools at Walker Branch Watershed:Changes during a 21-Year Period
C. C. Trettin,* D. W. Johnson, and D. E. Todd, Jr.
ABSTRACTA 21-yr perspective on changes in nutrient and C pools on undis-
turbed upland forest sites is provided. Plots originally representingfour cover types have been sampled three times. On each plot, forestbiomass, forest floor, and soil, to a depth of 60 cm, were measured,sampled, and analyzed for Ca, Mg, C, N, and P. Exchangeable soilCa and Mg have declined in most soils. Despite the low exchangeableCa, cumulative sequestration in the biomass has exceeded the soilpool, suggesting that soil supplies below 60 cm are satisfying thebiomass demand. Extractable soil P also declined, with means rangingfrom 4.2 to 18.2 kg ha"', as a result of reductions in the mineral soiland Oi horizon. The loss of extractable soil P exceeded biomasssequestration in all but one plot, suggesting abiotic soil processes asthe removal mechanism. Soil C and N were either stable, althoughhighly variable, or declined, which was unexpected in these undis-turbed sites. The net C balance of these sites was controlled byaboveground sequestration, which offset changes in the soil and forestfloor. Soil parent material and geomorphic setting strongly influencedthe changes in soil properties during the 21-yr period, reflecting theimportance of those factors in assessing soil nutrient and C cyclesover that of forest cover type. The variability encountered in theperiodic soil measurements highlights the difficulty in detecting tem-poral changes in soil chemical properties.
SHORT-TERM STUDIES have provided the bulk of theinformation about the structure and function of for-
ested ecosystems. Inadequate temporal scales in thosestudies preclude assessment of the interactions of bio-logical, chemical, and physical processes within the eco-system, especially the contributions of anthropogenicfactors. Long-term studies are instrumental to under-standing nutrient cycling in forests and identifying po-tential limitations to sustainable production as a resultof management practices or climate change.
In contrast to suggestions that soil nutrient pools arebuffered from short-term changes, several recent, long-term studies have shown that soil change can occur ona scale of decades or even on a seasonal basis undercertain conditions (reviewed by Johnson et al., 1991).Significant reductions in the pools of exchangeable basecations for instance, have been noted during periods ofone to three decades in European and North Americanforests (Ahokas, 1997; Binkley et al., 1989; Drohan andSharpe, 1997; Johnson et al., 1994, 1988; Falkengen-Grerup and Eriksson, 1990; Falkengen-Grerup andTyler, 1992; Hallbacken and Tamm, 1986; Knoepp andSwank, 1994; Mandersheid et al., 1995; Richter et al.,
C.C. Trettin, USDA Forest Service, 2730 Savannah Hwy., Charleston,SC 29414; D.W. Johnson, Desert Research Institute, P.O. Box 60220,Reno, NV 89506; and D.E. Todd, Jr., Environmental and ResourceSciences Division, Oak Ridge National Laboratory, P.O. Box 2008,Oak Ridge, TN 27831. Received 8 Apr. 1998. Corresponding au-thor ([email protected]).
Published in Soil Sci. Soc. Am. J. 63:1436-1448 (1999).
1994). Surface soil concentrations may vary on a sea-sonal basis (Haines and Cleveland, 1981; Johnson et al.,1988). These changes were attributed to sequestrationof base cations (especially Ca) in biomass and to leach-ing, the latter of which is often accelerated by acid depo-sition.
A long-term study of soils on the Walker BranchWatershed (WBW), in Tennessee, was among the firstto suggest that soil Ca depletion from uptake could bea major factor constraining sustainable production ifstands were harvested without regard to conserving nu-trients (Johnson et al., 1988). Other work on those soilsshowed that cation leaching was also a major factoraffecting the soil cation balance (Johnson and Todd,1990). Long-term studies on the Coweeta watershedsand a South Carolina piedmont soil have also shownuptake and leaching to result in reductions in soil nutri-ents (Knoepp and Swank, 1994; Richter et al., 1994).Long-term, chronosequence studies have also been im-portant for understanding changes in soil processes fol-lowing disturbance such as agriculture. Those studieshave typically found a reduction in nutrients and C onmanaged sites, and then a "recovery" following rever-sion of the sites to trees. The control or reference sitesare typically "undisturbed" forests, with the assumptionthat the soil conditions are relatively constant. Studiesat the Walker Branch and Coweeta watersheds as wellas elsewhere (e.g., Haines and Cleveland, 1981) havedemonstrated that soil chemical properties are not con-stant in undisturbed stands; accordingly, understandingthe inherent temporal dynamics of soil conditions isfundamental to assessing long-term changes as a resultof external stressors (e.g., management or climatechange).
We present an assessment of nutrients and C in soilsand vegetation within eight sites for a 21-yr period onthe WBW. Our objective is to characterize the temporalchanges in the distribution of nutrients and C withinthe sites and to consider the changes with respect toforest type, soils, and geomorphic position. An earlierstudy of the WBW established the potential for nutrientdepletion in these undisturbed forests, and consideredthe implications of assessing long-term soil changes atthe landscape level following 10 yr of observation (John-son et al., 1988). This study reinforces the findings fromthe previous work on the watershed and offers evidenceto suggest that interactions of soil moisture regime anddeep rooting may affect interpretations of nutrient cy-cling based on characterization of the surface soils. Wealso confirm that parent material and geomorphic posi-
Abbreviations: ICP, inductively coupled plasma spectometry; WBW,Walker Branch Watershed.
1436
TRETTIN ET AL.: FOREST NUTRIENT AND CARBON POOLS AT WALKER BRANCH WATERSHED 1437
tion are important in affecting soil properties with time(e.g., <20 yr).
MATERIALS AND METHODSSite
Walker Branch Watershed is located on Chestnut Ridgewithin the Department of Energy's Oak Ridge Reservationnear Oak Ridge, TN. The 97.5-ha watershed was establishedas a long-term ecological study area in 1967. The watershedis underlain by Knox group dolomite with several differentformations occurring within the study area. The upland resid-ual soils are developed from deep (up to 30 m) saproliteand saprolitic material, although areas of ancient and modernalluvium and colluvium of different ages also occur withinthe watershed boundary (Lietzke, 1994). Soils were originallymapped and representative pedons characterized with periodprocedures and concepts in 1967 (Peters et al, 1970). Anintensive remapping and classification was accomplished inthe early 1990s and published by Lietzke (1994). Major foresttypes were identified by Grigal and Goldstein (1971) andcharacterized predominately as upland hardwoods [oak(Quercus spp.), red maple (Acer rubrum L.), hickory (Caryaspp.)] dominated by chestnut oak (Q. prinus L.) with someintermixing of pine [shortleaf pine (Pinus echineta Mill.) andVirginia pine (P. virginiana Mill.)] on ridges. Mesic covesand riparian zones are mainly yellow poplar (Lirodendrontulipifera L.) and American beech (Fagus grandifolia Ehrh.).The watershed is at =300 to 350 m elevation, has 14.5°C meanannual temperature, and receives =151 cm average annualprecipitation of which 43-48% is estimated to undergo evapo-transpiration (Henderson et al., 1978; Johnson et al., 1988).
In 1967,298 vegetation inventory plots were established onthe WBW per the protocol of Harris et al. (1973). Twenty-four of those plots were selected in 1972 to represent fourmajor forest types (pine, yellow poplar, oak-hickory, andchestnut oak) for an intensive study of nutrient cycling. Aspart of that study, standing biomass, forest floor, and soilswere sampled from four to six subplots at each location (Hen-
derson and Harris, 1975; Henderson et al., 1978). Eight ofthose plots have served as the basis for assessing long-termchanges in soil chemical properties and nutrient cycling (John-son et al., 1988), and were resampled for this study.
The eight long-term soil study plots, although originallyselected on the basis of cover type, represent different soil andgeomorphic settings that are characteristic of the watershedlocally, and more generally of the ridge and valley provinceof the Appalachians (Table 1). Three plots (Plots 179, 107,and 237) occur on soils formed in saprolite weathered fromdolomite. They are characterized by a silt loam surface overly-ing a clay loam argillic horizon. The chert content is variable,ranging from 5 to 35%. Water infiltration is rapid, but perchingmay occur above the argillic. Two plots (Plots 98 and 281)represent the cove position that occurs near the base of theslope. The parent materials of the soils on these plots arederived from creep materials and underlying residuum. Thesoils are characterized by a thick, dark A horizon, tend to bemoist, and are enriched by hydrologic inputs from up slope.Plot 26 is typified by saprolite weathered from dolomite, onthe side slope of a doline. A doline is a collapse structureanalogous to a sinkhole but without an open swallow hole.Plot 26 was originally selected to represent the pine-covertype, but because of mortality, the current vegetation is domi-nated by yellow poplar. Colluvial soils are typified by Plot 42.These soils are formed in deep colluvium derived from residualsoils. The soils occur primarily in upper slope positions andmay contain a restrictive fragic layer that can perch water.Chert content ranges from 15 to 50% by volume. Finally, soilsthat are formed in chert beds, 30 to 60% chert content byvolume, are characterized by Plot 91. These soils occur inupper slope positions and tend to be dry due to the highcoarse-fragment content.
Field and LaboratoryIn spring 1993, the eight plots previously sampled in 1972
and 1982 were located by identifying the plot number onpermanent aluminum corner stakes. The vegetation was re-measured and the soil resampled according to the sample
Table 1. Site characteristics of the eight long-term soil plots on Walker Branch Watershed, TN.
Plot
179
107
237
98
281
26
42
91
Soil/geomorphic
setting
Saprolite
Saprolite
Saprolite
Cove
Cove
Doline-Saprolite
Collovium
Chert Bed
Updated soil map unitf
Dunmore-Chepultepeclight surface phase
Dunmore-Chepultepeclight surface phase
Dunmore-Chepultepeclight surface phase
Fullerton-Longview clayeyskeletal phase, Shack-Tassos Fragic Paleudults
Fullerton-Copperridgedark surface phase
Dunmore-Chepultepec,light surface phase
Shack-Tassos FragicPaleudults
Bodine-Chapultepec
Soil series
Fullertoncherty siltloam
Fullertoncherty siltloam
Fullerton siltloam
Claibornecherty siltloam
Claiborne siltloam
Fullerton siltloam
Fullerton siltloam
Bodine chertysilt loam
Soil classification
Typic Paleudult; Clayey,Kaolinitic, Thermic
Hiimic Paleudult:Clayey, Kaolinitic,Thermic
Hiimic Paleudult:Clayey, Kaolinitic,Thermic
Humic Paleudult:Clayey, Kaolinitic,Thermic
Humic Paleudult:Clayey, Kaolinitic,Thermic
Humic Paleudult:Clayey, Kaolinitic,Thermic
Fragic Paleudults:Loamy-skeletal,Siliceous, Thermic
Typic Paleudults:Loamy-skeletal,Kaolinitic, Thermic
Slope position
Upper slope nearridgetop
Secondary ridgetop
Midslope, slightdepression
Toe
Toe
Mid Slope
Ridgetop
Secondary narrowridgetop
Slope %/aspect
15/280
5.5/355
16/135
10/130
24/65
5/260
13.5/160
12.5/110
Currentdominantvegetation
Chestnut oak,red maple
Black oak,hickory
Chestnut oak,white oak
Yellow-poplar,white oak
Yellow-poplar
Yellow-poplar
Chestnut oak
Chestnut oak,hickory
Originalforesttype*
Chestnut oak
Oak-hickory
Chestnut oak
Yellow-poplar
Yellow-poplar
Pine
Chestnut oak
Oak-hickory
t Updated soil classification from Lietzke (1994).$ Original classification by Grigal and Goldstein (1971).
1438 SOIL SCI. SOC. AM. J., VOL. 63, SEPTEMBER-OCTOBER 1999
procedures used previously. Using allometric equations estab-lished by Harris et al. (1973), change in tree biomass wascalculated from measurements of diameter breast height on0.0404-ha nested plots (Johnson and Van Hook, 1989). Vege-tation nutrient contents were calculated from these mass dataand nutrient concentrations obtained by destructive samplingon WBW (Henderson et al., 1978) and the Chestnut Ridgewhole-tree harvest site (Johnson et al., 1982). More detaileddescriptions of these procedures are found in the above publi-cations.
Six 1-m2 subplots within the 12-m2 soil plot on each sitewere used for sampling. Subplots were randomly selected fromthe 12 by 12 m grid, excepting previously sampled subplotsfrom the selection pool. Within each subplot, all wood of >2.5-cm diameter was collected. Wood of <2.5-cm diameter andthe Oi and Oa horizons were sampled from a 0.25-m2 ringlocated in the center of each subplot. Oi litter was defined asrecognizable by species, while Oa was more highly decom-posed forest floor (Oe material was included in the Oa sam-ple). Using a 7.5-cni diameter bucket auger, soil cores werecollected from the center of the subplot in 15-cm incrementsto a depth of 60 cm. The 60-cm depth was selected originallyon the basis that most roots were present above that depth.
Twigs, bark, and leaves were separated from Oi and Oasamples before drying. Wood, woody litter, and O horizonsamples were oven dried to constant weight at 100°C, whilesoil samples were dried at 60°C. Soil was separated from thecoarse fragments with a 2-mm sieve. Forest floor samples wereground in a Tecator Cyclotec sample mill (Tecator, Herndon,VA). All soil and forest floor samples were stored in archi-val containers.
Samples collected in 1993 and archived samples from 1972and 1982 were analyzed as follows. Soils were analyzed forpH using 1:1 soil solution in both water and 0.01 M CaCl2.Carbon and N were determined using a Perkin Elmer 2400CHN Analyzer (Perkin Elmer, Norwalk, CT). ExchangeableCa2+, Mg2+, K+, Na+, and A13+ were extracted with 1 MNH4C1and analyzed by inductively coupled plasma spectroscopy(ICP). Extractable P was obtained using dilute acid (0.5 MHC1) F (Olsen and Dean, 1965). Forest floor samples wereanalyzed for total N and C using a Perkin-Elmer 2400 CHNAnalyzer (Perkin Elmer). Cation concentrations in the forestfloor samples were obtained from an ICP scan following ashingand solubilization. All laboratory analyses included blanks,standards, and 10% duplication. Concentration data from min-eral soils were converted to content using bulk density thathad be adjusted for coarse fragment content from each soilhorizon (Peters et al., 1970). Forest floor concentration datawas converted to content using the actual mass of the sam-pled volume.
Design and Analytical ConsiderationsThe principal factors affecting temporal assessment of soil
data are season, sampling protocols, and laboratory methods.A previous study on the WBW (Johnson et al., 1988) docu-mented significant seasonal fluctuations in soil chemical prop-erties, hence the need to normalize season when assessinglong-term trends. Since the sampling of the Walker Branchlong-term soil assessment plots has taken place during thesame month in each of the sampling years, seasonal variationshould be minimized. Certainly there is some intraseasonalvariation, but it is likely to be much smaller than the intersea-sonal variation that reflects larger shifts in temperature andmoisture, especially in deeper soil horizons. Variation due tosampling was also minimized by using protocols that wereidentical to those used in the previous study (Johnson et al.,
1988). Finally, variation in laboratory methods and techniquesmay cause significant variation in the analysis of a soil sample.To minimize this factor, samples from 1972 and 1982 werereanalyzed according to current methods. Accordingly, thetemporal changes found in chemical soil properties shouldreflect responses to inherent ecosystem processes.
This study is based on plots that were originally selectedas a subset of inventory plots to characterize selected foresttypes. Accordingly, replication was not a consideration in theoriginal work. For purposes of this study, and the previouslyreported work from 1982, individual plots were considered asthe experimental units. Analyses were conducted using a two-way analysis of variance (ANOVA) with year and plot as thetreatment factors. Comparisons among years for individualplots was done using unpaired Mests. Tests of significancewere conducted at P = 0.05.
RESULTSThe 21-yr record for soils on the WBW includes sam-
ples collected from the A (0-15 cm) and B (45-60 cm)horizons. Results from these samples are presented firstto assess change in soil chemical properties across thethree measurement periods. Data for the entire 0- to60-cm soil profile are available for the 1982 to 1993period. Those results in conjunction with the biomassand forest floor data are presented to assess the ecosys-tem level changes during that 11-yr period.
Changes in Element Concentrationswithin the A and B Horizons
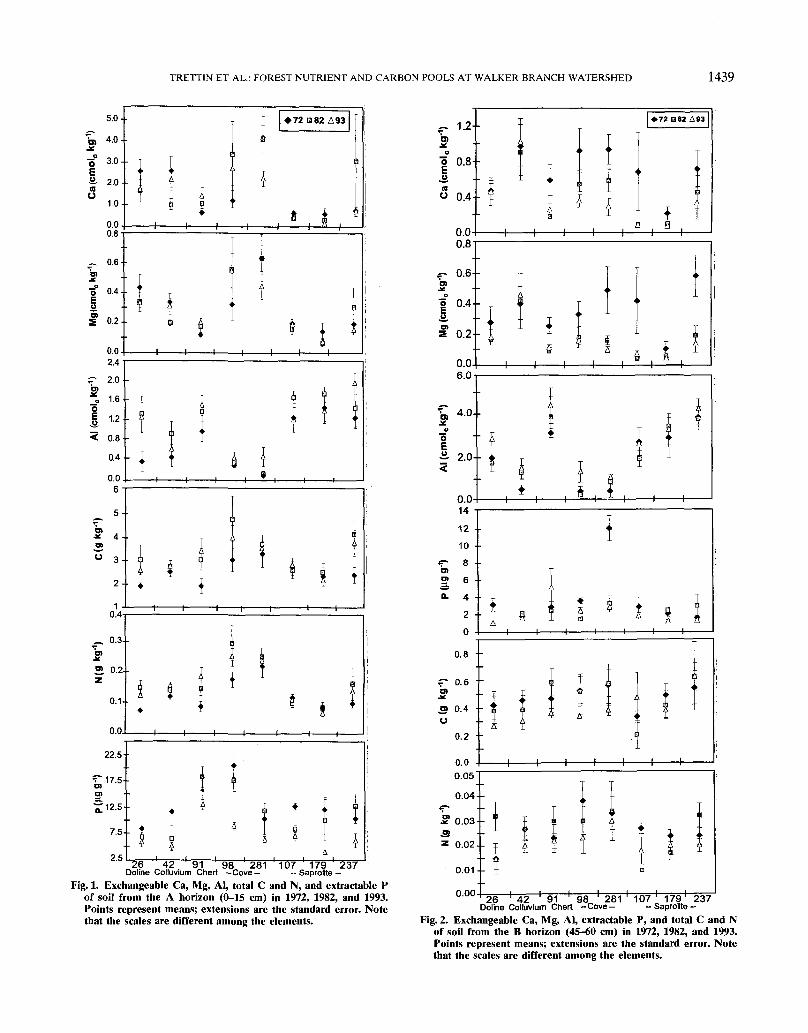
Surface and Subsurface Mineral HorizonsThe concentration of Ca and Mg within the A horizon
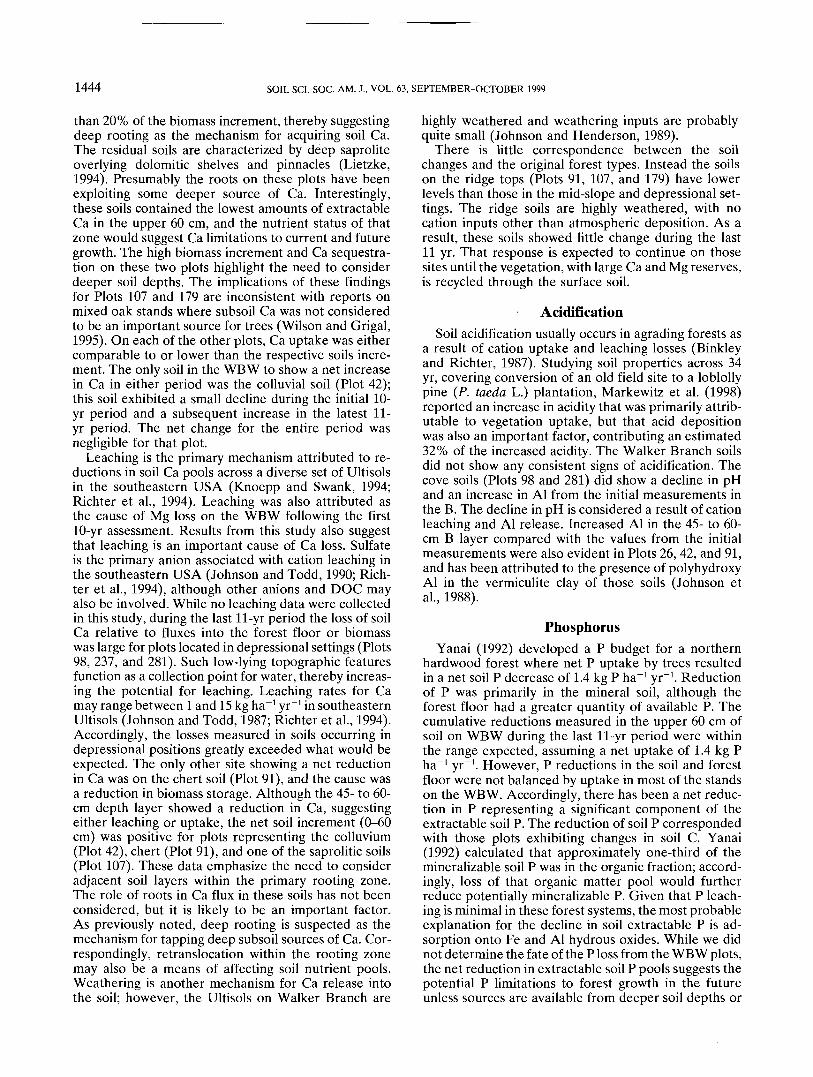
(0-15 cm) has been relatively stable during the 21-yrmeasurement period (Fig. 1). Some interdecade varia-tion in base cation concentration is evident, but noneof the surface mineral soil horizons exhibited eitherincreasing or decreasing trends. Aluminum also did notexhibit significant changes. The content of cations withinthe A horizons does not appear to be strongly affectedby soil type or physiographic position, although the covesoils (Plots 98 and 281) tended to have higher basecation content and lower Al than the other soils. Incontrast, P concentrations were similar across soils, andmost exhibited a reduction in P during the last 11-yrmeasurement period. The reduction in P was particu-larly pronounced on the saprolitic (Plots 107, 179, and237) and the colluvial (Plot 42) soils, which experienceda 25 to 50% decline. Carbon and N tended to increasein the A horizon of all soils except for the saproliticsoils (Plots 107,179, and 237), although the change wasusually not statistically significant. The change in N rela-tive to C was greater for the colluvium (Plot 42), chert(Plot 91), and doline (Plot 26) soils, resulting in a de-crease in the C/N ratio. Conversely, the small changein N relative to C in the saprolitic soils resulted in anincrease in C/N ratio. The cove soils (Plots 98 and 281)did not exhibit a change in C/N ratio.
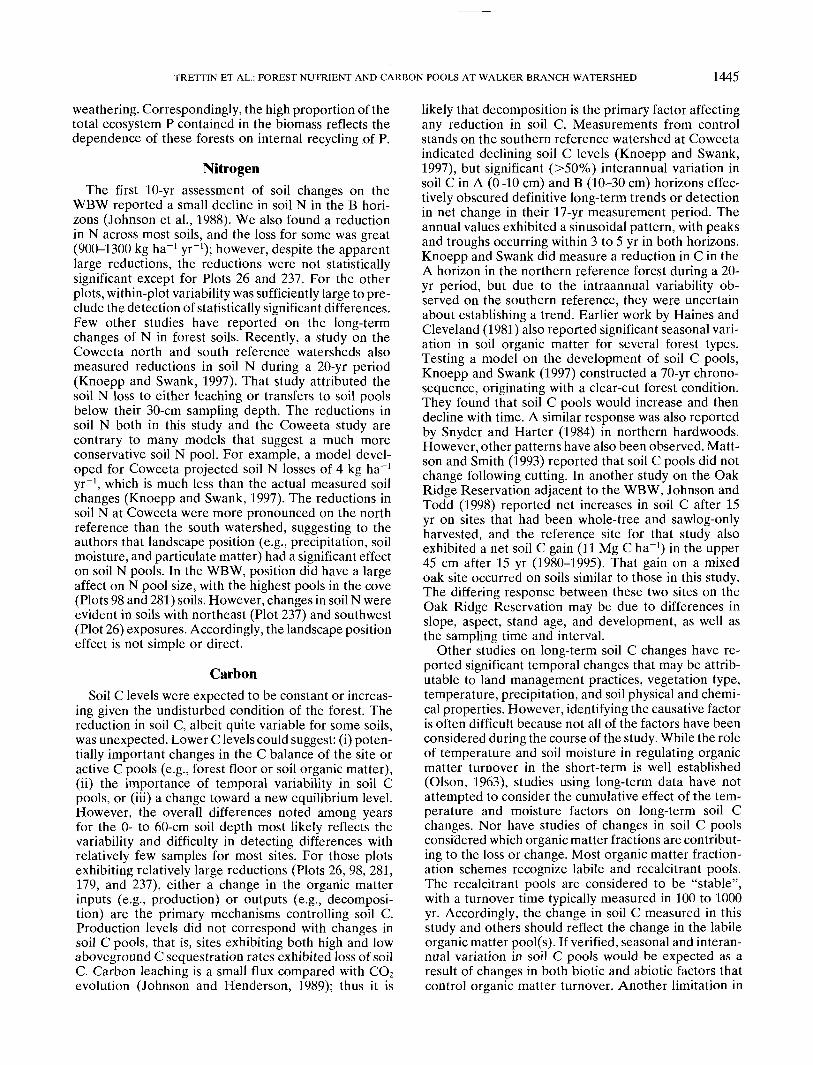
The B soil (45-60 cm) has also exhibited changes inits chemical composition during the 21-yr measurementperiod (Fig. 2). Calcium and Mg exhibited a significantreduction in the first 10-yr period for all soils except
TRETTIN ET AL.: FOREST NUTRIENT AND CARBON POOLS AT WALKER BRANCH WATERSHED 1439
5.0-
4.0-
3.0-_"O
a. 2.0nU
1.0
0.00.8
$_«o
0.6
0.4
0.2
0.02.4
2.0
1.6
1.2
0.8
0.4
0.06
5 -
0.4
_ 0.3.-
S 0.2z
0.1..
0.0
22.5
~17.5O)
12.5
7.5
2.5
-t———h
-I—————I—————I—————I—————I—————I————H
26 42 91 98 281Doline Colluvium Chert -Cove- 107 179 237— Saprolite -Fig. 1. Exchangeable Ca, Mg, Al, total C and N, and extractable P
of soil from the A horizon (0-15 cm) in 1972, 1982, and 1993.Points represent means; extensions are the standard error. Notethat the scales are different among the elements.
~ 1.2'3I 0.8ji.
O 0.4--
0.00.8
<p 0.6--b>J£
| 0.4
S 0.2--
0.06.0
'oI 2.0+
0.0
• 72 a 82 A 93
* Aa B
H———I———I———I———h
5 * a a * TB n-\———I———I———I———III——
12 •
10 •
<T 8 -01ra 6
1 4 .
2 •
0
0.8 •
£~ 0.6 'S3 0.4 •U
0.2
0.0 -0.05
0.04<=-
S 0.03Sz 0.02
0.01
0.00
}
! » H H i i— i — i — i — i — i — i — i — i
: \ | | i :!:| | I * i o !: i— i — i — i — i — i — i — i —
:i i !L " ! * i !;: T I I 1 Z j | f- i °26 ! 42 ' 9 1 ' 98 ' 281 ' 107 ' 179 ' 237Doline Colluvium Chert -Cove- -Saprolite-
Fig. 2. Exchangeable Ca, Mg, Al, extractable P, and total C and Nof soil from the B horizon (45-60 cm) in 1972, 1982, and 1993.Points represent means; extensions are the standard error. Notethat the scales are different among the elements.
1440 SOIL SCI. SOC. AM. J., VOL. 63, SEPTEMBER-OCTOBER 1999
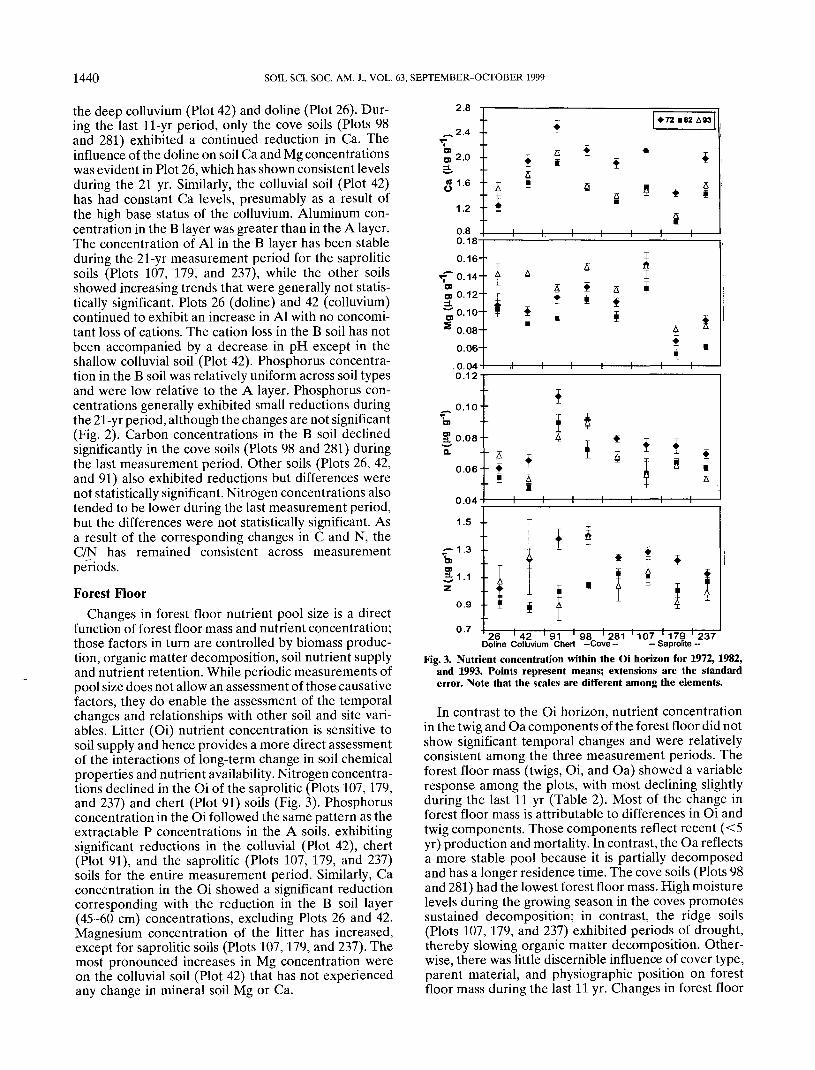
the deep colluvium (Plot 42) and doline (Plot 26). Dur-ing the last 11-yr period, only the cove soils (Plots 98and 281) exhibited a continued reduction in Ca. Theinfluence of the doline on soil Ca and Mg concentrationswas evident in Plot 26, which has shown consistent levelsduring the 21 yr. Similarly, the colluvial soil (Plot 42)has had constant Ca levels, presumably as a result ofthe high base status of the colluvium. Aluminum con-centration in the B layer was greater than in the A layer.The concentration of Al in the B layer has been stableduring the 21-yr measurement period for the saproliticsoils (Plots 107, 179, and 237), while the other soilsshowed increasing trends that were generally not statis-tically significant. Plots 26 (doline) and 42 (colluvium)continued to exhibit an increase in Al with no concomi-tant loss of cations. The cation loss in the B soil has notbeen accompanied by a decrease in pH except in theshallow colluvial soil (Plot 42). Phosphorus concentra-tion in the B soil was relatively uniform across soil typesand were low relative to the A layer. Phosphorus con-centrations generally exhibited small reductions duringthe 21-yr period, although the changes are not significant(Fig. 2). Carbon concentrations in the B soil declinedsignificantly in the cove soils (Plots 98 and 281) duringthe last measurement period. Other soils (Plots 26, 42,and 91) also exhibited reductions but differences werenot statistically significant. Nitrogen concentrations alsotended to be lower during the last measurement period,but the differences were not statistically significant. Asa result of the corresponding changes in C and N, theC/N has remained consistent across measurementperiods.
Forest FloorChanges in forest floor nutrient pool size is a direct
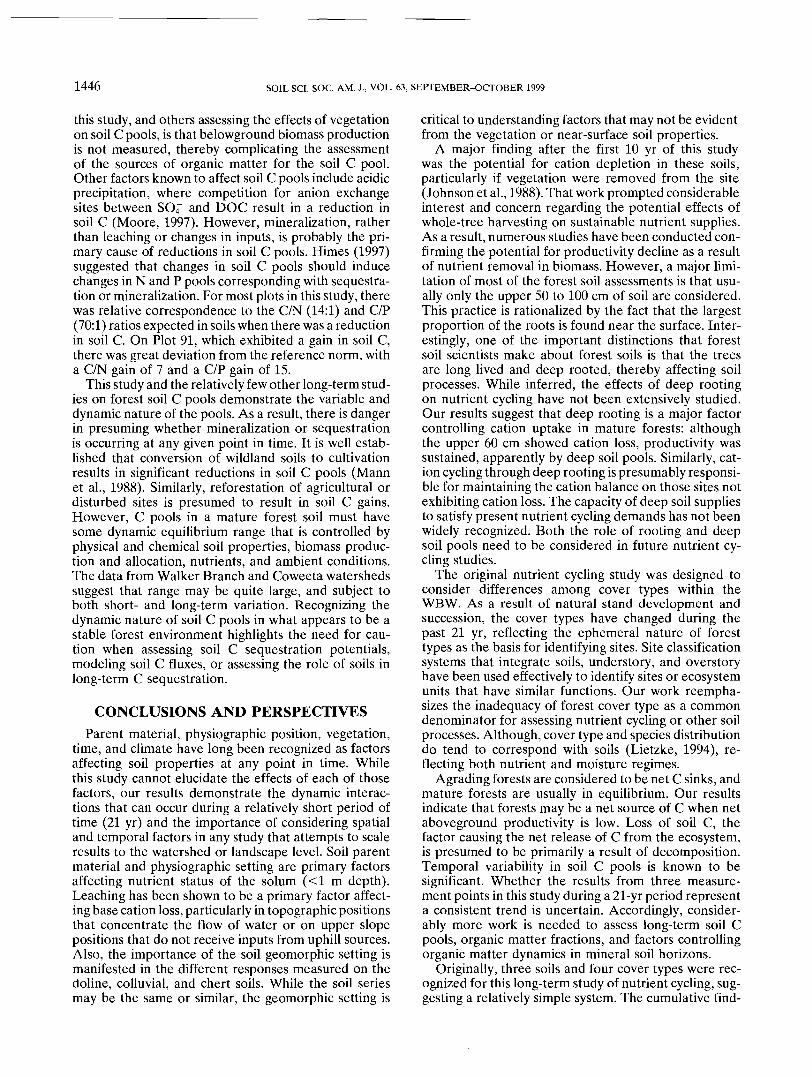
function of forest floor mass and nutrient concentration;those factors in turn are controlled by biomass produc-tion, organic matter decomposition, soil nutrient supplyand nutrient retention. While periodic measurements ofpool size does not allow an assessment of those causativefactors, they do enable the assessment of the temporalchanges and relationships with other soil and site vari-ables. Litter (Oi) nutrient concentration is sensitive tosoil supply and hence provides a more direct assessmentof the interactions of long-term change in soil chemicalproperties and nutrient availability. Nitrogen concentra-tions declined in the Oi of the saprolitic (Plots 107,179,and 237) and chert (Plot 91) soils (Fig. 3). Phosphorusconcentration in the Oi followed the same pattern as theextractable P concentrations in the A soils, exhibitingsignificant reductions in the colluvial (Plot 42), chert(Plot 91), and the saprolitic (Plots 107, 179, and 237)soils for the entire measurement period. Similarly, Caconcentration in the Oi showed a significant reductioncorresponding with the reduction in the B soil layer(45-60 cm) concentrations, excluding Plots 26 and 42.Magnesium concentration of the litter has increased,except for saprolitic soils (Plots 107,179, and 237). Themost pronounced increases in Mg concentration wereon the colluvial soil (Plot 42) that has not experiencedany change in mineral soil Mg or Ca.
T-
^2.0 -=L
a 1.6
1.2 -
0.80.18-
0.16-
*f~ 0.14-D>0) 0.12-
t0'10'S 0.08-
0.06-
,0.04-0.12-
bi
i 0.08-Q.
0.06-
0.04-
1.5 -
^-1.3 -
0)31.1 •Z
O.9 •
O.7 .
^ •72I82A93
" T S f * r
- 1 S a 3 * •1 •
a——— 1 ——— h —— 1 ——— 1 ——— 1 ——— 1 ——— 1 ——
. I & 5 I
;j f 1 1 I *
f '——— 4 ——— 1 ——— 1 ——— 1 ——— 1 ——— 1 ——— 1 ——— '
" 5 f * * s I I *—— 1 —— 1 —— 1 —— 1 —— 1 —— 1 —— 1 ——
I; <> * f *• I „ | | |
- Saprolite -
Fig. 3. Nutrient concentration within the Oi horizon for 1972, 1982,and 1993. Points represent means; extensions are the standarderror. Note that the scales are different among the elements.
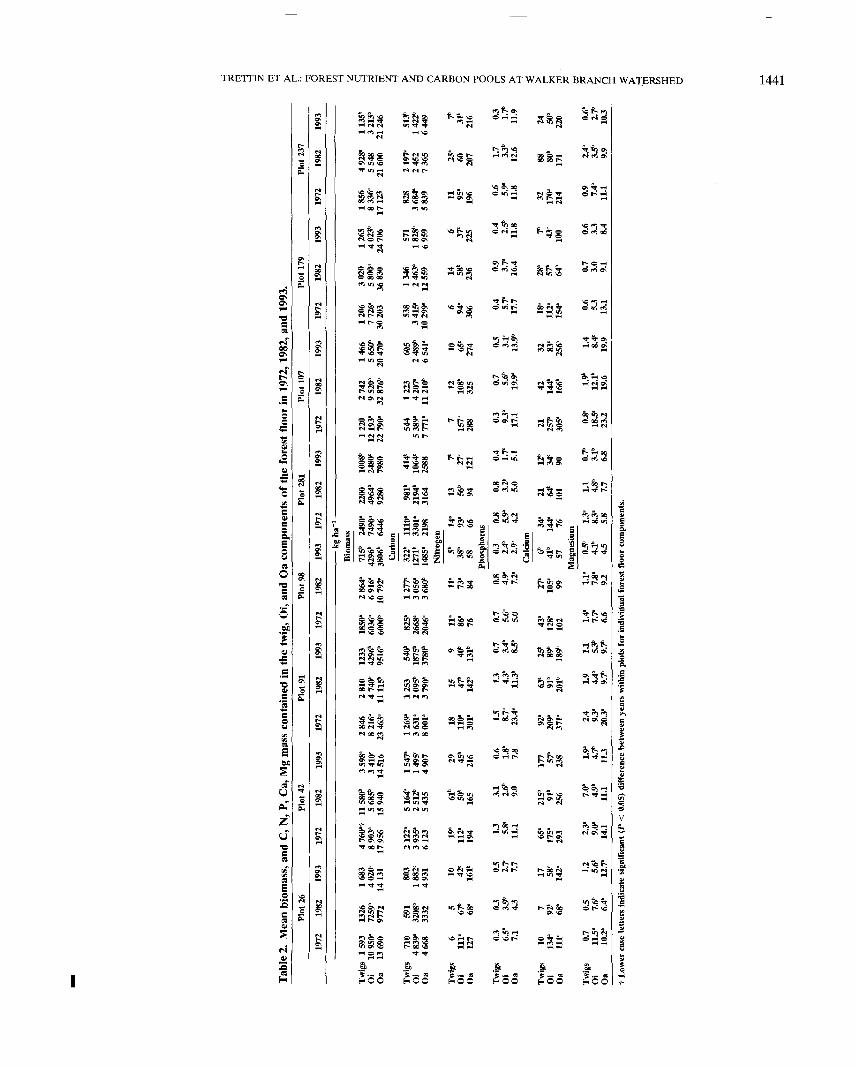
In contrast to the Oi horizon, nutrient concentrationin the twig and Oa components of the forest floor did notshow significant temporal changes and were relativelyconsistent among the three measurement periods. Theforest floor mass (twigs, Oi, and Oa) showed a variableresponse among the plots, with most declining slightlyduring the last 11 yr (Table 2). Most of the change inforest floor mass is attributable to differences in Oi andtwig components. Those components reflect recent (<5yr) production and mortality. In contrast, the Oa reflectsa more stable pool because it is partially decomposedand has a longer residence time. The cove soils (Plots 98and 281) had the lowest forest floor mass. High moisturelevels during the growing season in the coves promotessustained decomposition; in contrast, the ridge soils(Plots 107, 179, and 237) exhibited periods of drought,thereby slowing organic matter decomposition. Other-wise, there was little discernible influence of cover type,parent material, and physiographic position on forestfloor mass during the last 11 yr. Changes in forest floor
73 PI
Tabl
e 2.
Mea
n bi
omas
s, an
d C,
N, P
, Ca,
Mg
mas
s co
ntai
ned
in th
e tw
ig, O
i, an
d O
a co
mpo
nent
s of
the
fore
st f
loor
in 1
972,
1982
, and
199
3.
1972
Twig
s 15
93O
i 10
950
"Oa
13
690
Twig
s 71
0O
i 4
839"
Oa
4668
Twig
s 6
Oi
111"
Oa
127
Twig
s 0.
3O
i 6.5
"Oa
7.
1
Twig
s 10
Oi
134"
Oa
Ill-
Twig
s 0.
7Oi
11
.5"O
a 10
.2"
Plot
26
1982
1326
7259
"97
72 591
3208
"33
32 5 67"
68" 03 3.9
"4.
3
7 92"
68" 0.5
7.6'
6.4'
1993
1683
4020
'14
131
803
1882
'49
31 10 42"
161' 0.
52.
7'7.
7
17 58'
142" 1.2 5.
6'12
.7"
1972
4760
"t89
03"
1795
6
2122
"39
35"
6123 19
"11
2"19
4 1.3 5.8"
11.1
65-
175"
293 2.3
"9.0
"14
.1
Plot
42
1982
1158
0*56
85*
1594
0
5164
"25
12"
5435 61
"50
"16
5 3.1 2.6"
9.0
215" 91"
256 7.0
"4.9
"11
.1
1993
3598
"34
10'
1451
6
1547
'14
95'
4907 29 45
"21
6 0.6 1.8"
7.8
177 57"
238 1.9
"4.7
"11
.3
1972
2846
8216
"23
463"
1269
"36
31"
8001
"
18 110"
301" 1.5 8.7
"23
.4"
92"
209"
371" 2.
49.3
"20
.3"
Plot
91
1982
19
93
1972
2 81
0 12
33
1850
"4
740"
42
96"
6036
"11
115"
95
16"
6000
"
1 2
53
540*
82
5"2
095"
18
75"
2668
"3
790"
37
80"
2046
"
15
9 11
"47
" 40
" 86
"14
2"
131'
76
1.3
0.7
0.7
4.3"
3.4b
5.6"
11.3b
8.5'
5.
0
63-
25b
43"
91"
S9b
128"
201"
18
9b 10
2
1.9
1.1
1.4'
4.4b
5.3"
7.7"
9.7"
9.T
6.6
Plot
98
1982
2864
"69
16"
10 7
92"
1277
"30
56"
3680
* ir 73"
84 0.8
4.9"
7.2"
27-
105" 99 1.1
"7^
"9.2
Plot
281
1993
19
72
——
kg
ha-'
—Bi
omas
s71
5b 24
90"
4296
b 74
90-
3806
" 64
46C
arbo
n32
2"
1110
"12
71"
3301
-14
85-
2198
Nitr
ogen
5"
14"
38"
93"
58
66Ph
osph
orus
0.3
0.82.4
" 5.9
"2.9
" 4.
2Ca
lciu
m6"
34
"41
" 14
4"57
76
Mag
nesiu
m0.5
" 13
"4.1
" 8.3
"4.
5 5.
8
1982
2200
4964
"92
80 981h
2194
"31
64 13 56"
94 0.8
3.2b
5.0
21 64b
101 1.1 4.8
"7.
7
1993
1008
"24
80'
7980 414'
1064
'25
88 7* 27'
121 0.4 1.
7'5.1 12"
34'
90 0.7*
3.1'
6.8
1972
1220
12 1
93"
2279
0"
544
5389
"77
71" 7
157"
288 0.
39.
3'17
.1
21 257"
305" 0.8
"18
.5"23
.2
Plot
107
1982
2742
9520
"32
876
'
1223
4207
"11
210" 12 108"
325 0.
75.6
"19
.9"
42 144'
166' 1.9
"12
.1"19
.6
1993
1466
5650
"20
470"
605
2489
"65
41"
10 65'
274 0.5 3.
1'13
.9'
32 83'
256" 1.4 8.
4'19
.9
1972
1206
7726
"30
203
538
3415
"10
299- 6 94"
306 0.4 5.
7'17
.7
18"
112"
154" 0.6 5.3 13.1
Plot
179
1982
3020
5800
"36
830
1346
2463
"12
559 14 58
'23
6 0.9
3.7"
16.4
28"
57*
64" 0.7
3.0 9.1
1993
1265
4023
'24
706
571
1828
"69
59 6 37'
225 0.
42.5
*11
.8 7" 43'
100 0.6 3.
38.
4
1972
1856
8336
"17
123
828
3684
"58
39 11 95"
196 0.
65.9
"11
.8
32 170"
214 0.
97.4
"11
.1
Plot
237
1982
4928
-55
4821
600
2197
"24
5273
65 25"
60 207 1.7 3.
3'12
.6
88 80'
171 2.4
"3.
5'9.9
1993
1135
'32
13"
2124
6
513'
1422
'64
49 T 31'
216 0.
31.7
*11
.9
24 SO"
220 0.6
*2.7
»10
.3
t Lo
wer
cas
e le
tters
indi
cate
sig
nific
ant
(P <
O.O
S) d
iffer
ence
bet
wee
n ye
ars
with
in p
lots
for
indi
vidu
al fo
rest
floo
r co
mpo
nent
s.
3 z c m o n > 73 CD o s > W m 73 » 73 > n W D
1442 SOIL SCI. SOC. AM. J., VOL. 63, SEPTEMBER-OCTOBER 1999
SO
20.
(0
(0.03)(0 .61)
(0.86)
.48) (0.39) .25)
•8 (0.34)
.2
50
40.
3O
20
10
0
16
!S&§3 & .
4 -
~. 2.0.
1 .0 .
35_ 30£ 25i 20Q.
15105
(0.28)(0.50)
(0.01)
(0.60)
' I 1 'lnl
(0.04)
(0.61)
_ • (0.31)
B.H.B.B.(0 .15) (0.09)
(0.27)
(0.78),
(O.44)
,I,H,
(0.24)
(0.50) I(O.49)
(O.O4)
(0.24)
(0.07).
(n.d)u(0.02) (0.01)
(n.d)(0.32)
U I li I 1 1 I 1 1 I I 1 1 I i I I i 1 1 I il I il I 1 1 1 1 1 I 1 1 I i l l 1 1 I 1 1 IYear 82 93 82*93 82 93 82 93 82 93 82 93 82 93 8293piot 26 42 91 98 281 107 179 237
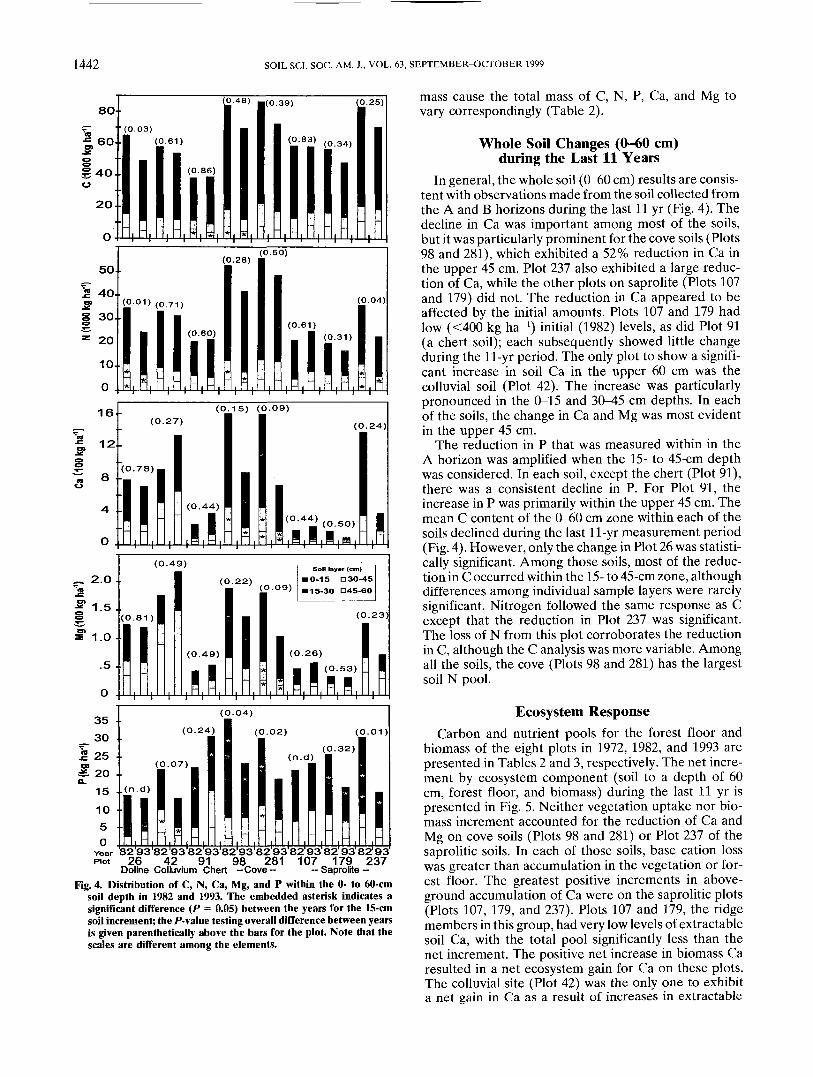
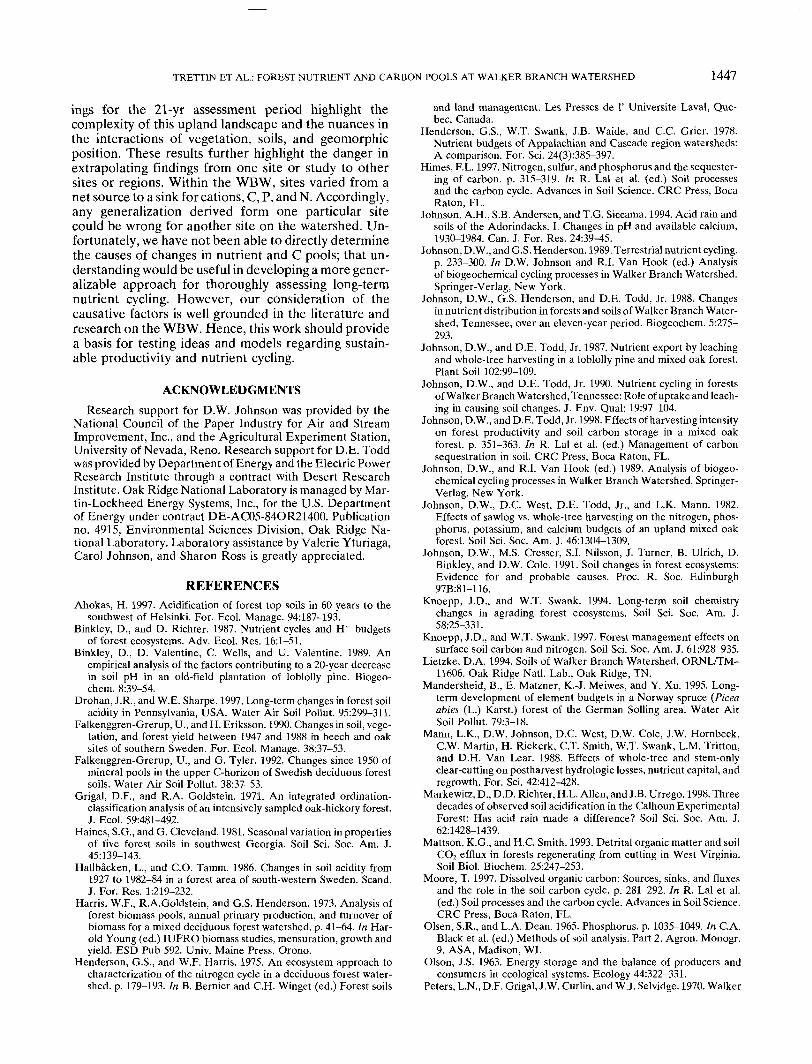
Doline Colluvium Chert -Cove — - Saprolite -Fig. 4. Distribution of C, N, Ca, Mg, and P within the 0- to 60-cm
soil depth in 1982 and 1993. The embedded asterisk indicates asignificant difference (P = 0.05) between the years for the 15-cmsoil increment; the F-value testing overall difference between yearsis given parenthetically above the bars for the plot. Note that thescales are different among the elements.
mass cause the total mass of C, N, P, Ca, and Mg tovary correspondingly (Table 2).
Whole Soil Changes (0-60 cm)during the Last 11 Years
In general, the whole soil (0-60 cm) results are consis-tent with observations made from the soil collected fromthe A and B horizons during the last 11 yr (Fig. 4). Thedecline in Ca was important among most of the soils,but it was particularly prominent for the cove soils (Plots98 and 281), which exhibited a 52% reduction in Ca inthe upper 45 cm. Plot 237 also exhibited a large reduc-tion of Ca, while the other plots on saprolite (Plots 107and 179) did not. The reduction in Ca appeared to beaffected by the initial amounts. Plots 107 and 179 hadlow (<400 kg ha'1) initial (1982) levels, as did Plot 91(a chert soil); each subsequently showed little changeduring the 11-yr period. The only plot to show a signifi-cant increase in soil Ca in the upper 60 cm was thecolluvial soil (Plot 42). The increase was particularlypronounced in the 0-15 and 30-45 cm depths. In eachof the soils, the change in Ca and Mg was most evidentin the upper 45 cm.
The reduction in P that was measured within in theA horizon was amplified when the 15- to 45-cm depthwas considered. In each soil, except the chert (Plot 91),there was a consistent decline in P. For Plot 91, theincrease in P was primarily within the upper 45 cm. Themean C content of the 0-60 cm zone within each of thesoils declined during the last 11-yr measurement period(Fig. 4). However, only the change in Plot 26 was statisti-cally significant. Among those soils, most of the reduc-tion in C occurred within the 15- to 45-cm zone, althoughdifferences among individual sample layers were rarelysignificant. Nitrogen followed the same response as Cexcept that the reduction in Plot 237 was significant.The loss of N from this plot corroborates the reductionin C, although the C analysis was more variable. Amongall the soils, the cove (Plots 98 and 281) has the largestsoil N pool.
Ecosystem ResponseCarbon and nutrient pools for the forest floor and
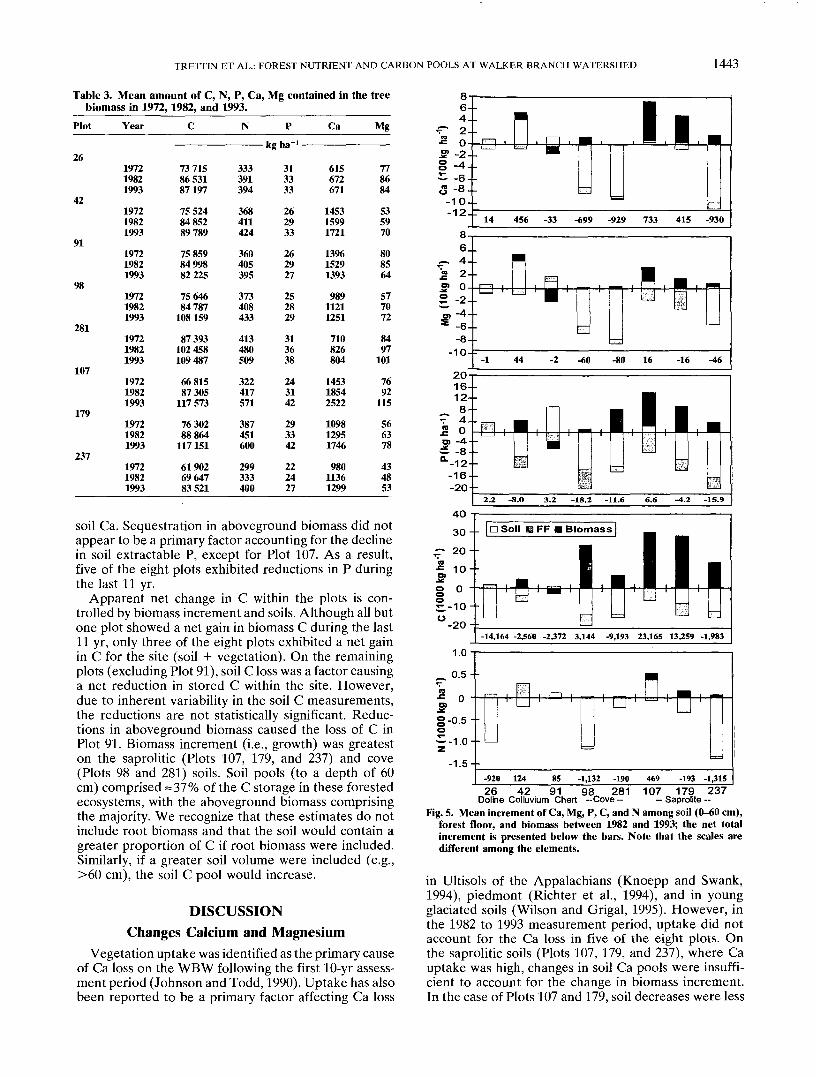
biomass of the eight plots in 1972, 1982, and 1993 arepresented in Tables 2 and 3, respectively. The net incre-ment by ecosystem component (soil to a depth of 60cm, forest floor, and biomass) during the last 11 yr ispresented in Fig. 5. Neither vegetation uptake nor bio-mass increment accounted for the reduction of Ca andMg on cove soils (Plots 98 and 281) or Plot 237 of thesaprolitic soils. In each of those soils, base cation losswas greater than accumulation in the vegetation or for-est floor. The greatest positive increments in above-ground accumulation of Ca were on the saprolitic plots(Plots 107, 179, and 237). Plots 107 and 179, the ridgemembers in this group, had very low levels of extractablesoil Ca, with the total pool significantly less than thenet increment. The positive net increase in biomass Caresulted in a net ecosystem gain for Ca on these plots.The colluvial site (Plot 42) was the only one to exhibita net gain in Ca as a result of increases in extractable
TRETTIN ET AL.: FOREST NUTRIENT AND CARBON POOLS AT WALKER BRANCH WATERSHED 1443
Table 3. Mean amount of C, N, P, Ca, Mg contained in the treebiomass in 1972,1982, and 1993.
Plot
26
42
91
98
281
107
179
237
Year
197219821993
197219821993
197219821993
197219821993
197219821993
197219821993
197219821993
197219821993
C
737158653187197
755248485289789
758598499882225
7564684787108 159
87393102 458109487
6681587305117 573
7630288864117 151
619026964783521
N
333391394
368411424
360405395
373408433
413480509
322417571
387451600
299333400
P
- kg ha~' —
313333
262933
262927
252829
313638
243142
293342
222427
Ca
615672671
145315991721
139615291393
98911211251
710826804
145318542522
109812951746
98011361299
Mg
778684
535970
808564
577072
8497101
7692115
566378
434853
soil Ca. Sequestration in aboveground biomass did notappear to be a primary factor accounting for the declinein soil extractable P, except for Plot 107. As a result,five of the eight plots exhibited reductions in P duringthe last 11 yr.
Apparent net change in C within the plots is con-trolled by biomass increment and soils. Although all butone plot showed a net gain in biomass C during the last11 yr, only three of the eight plots exhibited a net gainin C for the site (soil + vegetation). On the remainingplots (excluding Plot 91), soil C loss was a factor causinga net reduction in stored C within the site. However,due to inherent variability in the soil C measurements,the reductions are not statistically significant. Reduc-tions in aboveground biomass caused the loss of C inPlot 91. Biomass increment (i.e., growth) was greateston the saprolitic (Plots 107, 179, and 237) and cove(Plots 98 and 281) soils. Soil pools (to a depth of 60cm) comprised =37% of the C storage in these forestedecosystems, with the aboveground biomass comprisingthe majority. We recognize that these estimates do notinclude root biomass and that the soil would contain agreater proportion of C if root biomass were included.Similarly, if a greater soil volume were included (e.g.,>60 cm), the soil C pool would increase.
DISCUSSIONChanges Calcium and Magnesium
Vegetation uptake was identified as the primary causeof Ca loss on the WBW following the first 10-yr assess-ment period (Johnson and Todd, 1990). Uptake has alsobeen reported to be a primary factor affecting Ca loss
864.
v- 2^ 0& -2--§ -4--r -6--5 -8---10---12-r
-H- 5i I I i I I i m-L.,—__iL|
14 456 -33 -699 -929 733 415 -930
2.2 -8.0 3.2 -18.2 -11.6 6.6 -4.2 -15.9
£
30 - - I n Soil m FF • Biomass |
20- -
1 0 - -
-14,164 -2,560 -2372 3,144 -9,193 23,165 13,259 -1,9831.0
-1.5 - --920 124 85 -1,132 -190 469 -193 -1,31526 42 91 98 281Doline Colluvium Chert -Cove-
107 179 237— Saprolite —
Fig. 5. Mean increment of Ca, Mg, P, C, and N among soil (0-60 cm),forest floor, and biomass between 1982 and 1993; the net totalincrement is presented below the bars. Note that the scales aredifferent among the elements.
in Ultisols of the Appalachians (Knoepp and Swank,1994), piedmont (Richter et al., 1994), and in youngglaciated soils (Wilson and Grigal, 1995). However, inthe 1982 to 1993 measurement period, uptake did notaccount for the Ca loss in five of the eight plots. Onthe saprolitic soils (Plots 107, 179, and 237), where Cauptake was high, changes in soil Ca pools were insuffi-cient to account for the change in biomass increment.In the case of Plots 107 and 179, soil decreases were less
1444 SOIL SCI. SOC. AM. J., VOL. 63, SEPTEMBER-OCTOBER 1999
than 20% of the biomass increment, thereby suggestingdeep rooting as the mechanism for acquiring soil Ca.The residual soils are characterized by deep saproliteoverlying dolomitic shelves and pinnacles (Lietzke,1994). Presumably the roots on these plots have beenexploiting some deeper source of Ca. Interestingly,these soils contained the lowest amounts of extractableCa in the upper 60 cm, and the nutrient status of thatzone would suggest Ca limitations to current and futuregrowth. The high biomass increment and Ca sequestra-tion on these two plots highlight the need to considerdeeper soil depths. The implications of these findingsfor Plots 107 and 179 are inconsistent with reports onmixed oak stands where subsoil Ca was not consideredto be an important source for trees (Wilson and Grigal,1995). On each of the other plots, Ca uptake was eithercomparable to or lower than the respective soils incre-ment. The only soil in the WBW to show a net increasein Ca in either period was the colluvial soil (Plot 42);this soil exhibited a small decline during the initial 10-yr period and a subsequent increase in the latest 11-yr period. The net change for the entire period wasnegligible for that plot.
Leaching is the primary mechanism attributed to re-ductions in soil Ca pools across a diverse set of Ultisolsin the southeastern USA (Knoepp and Swank, 1994;Richter et al., 1994). Leaching was also attributed asthe cause of Mg loss on the WBW following the first10-yr assessment. Results from this study also suggestthat leaching is an important cause of Ca loss. Sulfateis the primary anion associated with cation leaching inthe southeastern USA (Johnson and Todd, 1990; Rich-ter et al., 1994), although other anions and DOC mayalso be involved. While no leaching data were collectedin this study, during the last 11-yr period the loss of soilCa relative to fluxes into the forest floor or biomasswas large for plots located in depressional settings (Plots98, 237, and 281). Such low-lying topographic featuresfunction as a collection point for water, thereby increas-ing the potential for leaching. Leaching rates for Camay range between 1 and 15 kg ha"1 yr"1 in southeasternUltisols (Johnson and Todd, 1987; Richter et al., 1994).Accordingly, the losses measured in soils occurring indepressional positions greatly exceeded what would beexpected. The only other site showing a net reductionin Ca was on the chert soil (Plot 91), and the cause wasa reduction in biomass storage. Although the 45- to 60-cm depth layer showed a reduction in Ca, suggestingeither leaching or uptake, the net soil increment (0-60cm) was positive for plots representing the colluvium(Plot 42), chert (Plot 91), and one of the saprolitic soils(Plot 107). These data emphasize the need to consideradjacent soil layers within the primary rooting zone.The role of roots in Ca flux in these soils has not beenconsidered, but it is likely to be an important factor.As previously noted, deep rooting is suspected as themechanism for tapping deep subsoil sources of Ca. Cor-respondingly, retranslocation within the rooting zonemay also be a means of affecting soil nutrient pools.Weathering is another mechanism for Ca release intothe soil; however, the Ultisols on Walker Branch are
highly weathered and weathering inputs are probablyquite small (Johnson and Henderson, 1989).
There is little correspondence between the soilchanges and the original forest types. Instead the soilson the ridge tops (Plots 91, 107, and 179) have lowerlevels than those in the mid-slope and depressional set-tings. The ridge soils are highly weathered, with nocation inputs other than atmospheric deposition. As aresult, these soils showed little change during the last11 yr. That response is expected to continue on thosesites until the vegetation, with large Ca and Mg reserves,is recycled through the surface soil.
AcidificationSoil acidification usually occurs in agrading forests as
a result of cation uptake and leaching losses (Binkleyand Richter, 1987). Studying soil properties across 34yr, covering conversion of an old field site to a loblollypine (P. taeda L.) plantation, Markewitz et al. (1998)reported an increase in acidity that was primarily attrib-utable to vegetation uptake, but that acid depositionwas also an important factor, contributing an estimated32% of the increased acidity. The Walker Branch soilsdid not show any consistent signs of acidification. Thecove soils (Plots 98 and 281) did show a decline in pHand an increase in Al from the initial measurements inthe B. The decline in pH is considered a result of cationleaching and Al release. Increased Al in the 45- to 60-cm B layer compared with the values from the initialmeasurements were also evident in Plots 26, 42, and 91,and has been attributed to the presence of polyhydroxyAl in the vermiculite clay of those soils (Johnson etal., 1988).
PhosphorusYanai (1992) developed a P budget for a northern
hardwood forest where net P uptake by trees resultedin a net soil P decrease of 1.4 kg P ha"1 yr"1. Reductionof P was primarily in the mineral soil, although theforest floor had a greater quantity of available P. Thecumulative reductions measured in the upper 60 cm ofsoil on WBW during the last 11-yr period were withinthe range expected, assuming a net uptake of 1.4 kg Pha"1 yr"1. However, P reductions in the soil and forestfloor were not balanced by uptake in most of the standson the WBW. Accordingly, there has been a net reduc-tion in P representing a significant component of theextractable soil P. The reduction of soil P correspondedwith those plots exhibiting changes in soil C. Yanai(1992) calculated that approximately one-third of themineralizable soil P was in the organic fraction; accord-ingly, loss of that organic matter pool would furtherreduce potentially mineralizable P. Given that P leach-ing is minimal in these forest systems, the most probableexplanation for the decline in soil extractable P is ad-sorption onto Fe and Al hydrous oxides. While we didnot determine the fate of the P loss from the WBW plots,the net reduction in extractable soil P pools suggests thepotential P limitations to forest growth in the futureunless sources are available from deeper soil depths or
TRETTIN ET AL.: FOREST NUTRIENT AND CARBON POOLS AT WALKER BRANCH WATERSHED 1445
weathering. Correspondingly, the high proportion of thetotal ecosystem P contained in the biomass reflects thedependence of these forests on internal recycling of P.
NitrogenThe first 10-yr assessment of soil changes on the
WBW reported a small decline in soil N in the B hori-zons (Johnson et al., 1988). We also found a reductionin N across most soils, and the loss for some was great(900-1300 kg ha"1 yr"1); however, despite the apparentlarge reductions, the reductions were not statisticallysignificant except for Plots 26 and 237. For the otherplots, within-plot variability was sufficiently large to pre-clude the detection of statistically significant differences.Few other studies have reported on the long-termchanges of N in forest soils. Recently, a study on theCoweeta north and south reference watersheds alsomeasured reductions in soil N during a 20-yr period(Knoepp and Swank, 1997). That study attributed thesoil N loss to either leaching or transfers to soil poolsbelow their 30-cm sampling depth. The reductions insoil N both in this study and the Coweeta study arecontrary to many models that suggest a much moreconservative soil N pool. For example, a model devel-oped for Coweeta projected soil N losses of 4 kg ha'1yr"1, which is much less than the actual measured soilchanges (Knoepp and Swank, 1997). The reductions insoil N at Coweeta were more pronounced on the northreference than the south watershed, suggesting to theauthors that landscape position (e.g., precipitation, soilmoisture, and particulate matter) had a significant effecton soil N pools. In the WBW, position did have a largeaffect on N pool size, with the highest pools in the cove(Plots 98 and 281) soils. However, changes in soil N wereevident in soils with northeast (Plot 237) and southwest(Plot 26) exposures. Accordingly, the landscape positioneffect is not simple or direct.
CarbonSoil C levels were expected to be constant or increas-
ing given the undisturbed condition of the forest. Thereduction in soil C, albeit quite variable for some soils,was unexpected. Lower C levels could suggest: (i) poten-tially important changes in the C balance of the site oractive C pools (e.g., forest floor or soil organic matter),(ii) the importance of temporal variability in soil Cpools, or (iii) a change toward a new equilibrium level.However, the overall differences noted among yearsfor the 0- to 60-cm soil depth most likely reflects thevariability and difficulty in detecting differences withrelatively few samples for most sites. For those plotsexhibiting relatively large reductions (Plots 26, 98, 281,179, and 237), either a change in the organic matterinputs (e.g., production) or outputs (e.g., decomposi-tion) are the primary mechanisms controlling soil C.Production levels did not correspond with changes insoil C pools, that is, sites exhibiting both high and lowaboveground C sequestration rates exhibited loss of soilC. Carbon leaching is a small flux compared with CO2evolution (Johnson and Henderson, 1989); thus it is
likely that decomposition is the primary factor affectingany reduction in soil C. Measurements from controlstands on the southern reference watershed at Coweetaindicated declining soil C levels (Knoepp and Swank,1997), but significant (>50%) interannual variation insoil C in A (0-10 cm) and B (10-30 cm) horizons effec-tively obscured definitive long-term trends or detectionin net change in their 17-yr measurement period. Theannual values exhibited a sinusoidal pattern, with peaksand troughs occurring within 3 to 5 yr in both horizons.Knoepp and Swank did measure a reduction in C in theA horizon in the northern reference forest during a 20-yr period, but due to the intraannual variability ob-served on the southern reference, they were uncertainabout establishing a trend. Earlier work by Haines andCleveland (1981) also reported significant seasonal vari-ation in soil organic matter for several forest types.Testing a model on the development of soil C pools,Knoepp and Swank (1997) constructed a 70-yr chrono-sequence, originating with a clear-cut forest condition.They found that soil C pools would increase and thendecline with time. A similar response was also reportedby Snyder and Harter (1984) in northern hardwoods.However, other patterns have also been observed. Matt-son and Smith (1993) reported that soil C pools did notchange following cutting. In another study on the OakRidge Reservation adjacent to the WBW, Johnson andTodd (1998) reported net increases in soil C after 15yr on sites that had been whole-tree and sawlog-onlyharvested, and the reference site for that study alsoexhibited a net soil C gain (11 Mg C ha"1) in the upper45 cm after 15 yr (1980-1995). That gain on a mixedoak site occurred on soils similar to those in this study.The differing response between these two sites on theOak Ridge Reservation may be due to differences inslope, aspect, stand age, and development, as well asthe sampling time and interval.
Other studies on long-term soil C changes have re-ported significant temporal changes that may be attrib-utable to land management practices, vegetation type,temperature, precipitation, and soil physical and chemi-cal properties. However, identifying the causative factoris often difficult because not all of the factors have beenconsidered during the course of the study. While the roleof temperature and soil moisture in regulating organicmatter turnover in the short-term is well established(Olson, 1963), studies using long-term data have notattempted to consider the cumulative effect of the tem-perature and moisture factors on long-term soil Cchanges. Nor have studies of changes in soil C poolsconsidered which organic matter fractions are contribut-ing to the loss or change. Most organic matter fraction-ation schemes recognize labile and recalcitrant pools.The recalcitrant pools are considered to be "stable",with a turnover time typically measured in 100 to 1000yr. Accordingly, the change in soil C measured in thisstudy and others should reflect the change in the labileorganic matter pool(s). If verified, seasonal and interan-nual variation in soil C pools would be expected as aresult of changes in both biotic and abiotic factors thatcontrol organic matter turnover. Another limitation in
1446 SOIL SCI. SOC. AM. J., VOL. 63, SEPTEMBER-OCTOBER 1999
this study, and others assessing the effects of vegetationon soil C pools, is that belowground biomass productionis not measured, thereby complicating the assessmentof the sources of organic matter for the soil C pool.Other factors known to affect soil C pools include acidicprecipitation, where competition for anion exchangesites between SO4~ and DOC result in a reduction insoil C (Moore, 1997). However, mineralization, ratherthan leaching or changes in inputs, is probably the pri-mary cause of reductions in soil C pools. Himes (1997)suggested that changes in soil C pools should inducechanges in N and P pools corresponding with sequestra-tion or mineralization. For most plots in this study, therewas relative correspondence to the C/N (14:1) and C/P(70:1) ratios expected in soils when there was a reductionin soil C. On Plot 91, which exhibited a gain in soil C,there was great deviation from the reference norm, witha C/N gain of 7 and a C/P gain of 15.
This study and the relatively few other long-term stud-ies on forest soil C pools demonstrate the variable anddynamic nature of the pools. As a result, there is dangerin presuming whether mineralization or sequestrationis occurring at any given point in time. It is well estab-lished that conversion of wildland soils to cultivationresults in significant reductions in soil C pools (Mannet al., 1988). Similarly, reforestation of agricultural ordisturbed sites is presumed to result in soil C gains.However, C pools in a mature forest soil must havesome dynamic equilibrium range that is controlled byphysical and chemical soil properties, biomass produc-tion and allocation, nutrients, and ambient conditions.The data from Walker Branch and Coweeta watershedssuggest that range may be quite large, and subject toboth short- and long-term variation. Recognizing thedynamic nature of soil C pools in what appears to be astable forest environment highlights the need for cau-tion when assessing soil C sequestration potentials,modeling soil C fluxes, or assessing the role of soils inlong-term C sequestration.
CONCLUSIONS AND PERSPECTIVESParent material, physiographic position, vegetation,
time, and climate have long been recognized as factorsaffecting soil properties at any point in time. Whilethis study cannot elucidate the effects of each of thosefactors, our results demonstrate the dynamic interac-tions that can occur during a relatively short period oftime (21 yr) and the importance of considering spatialand temporal factors in any study that attempts to scaleresults to the watershed or landscape level. Soil parentmaterial and physiographic setting are primary factorsaffecting nutrient status of the solum (<1 m depth).Leaching has been shown to be a primary factor affect-ing base cation loss, particularly in topographic positionsthat concentrate the flow of water or on upper slopepositions that do not receive inputs from uphill sources.Also, the importance of the soil geomorphic setting ismanifested in the different responses measured on thedoline, colluvial, and chert soils. While the soil seriesmay be the same or similar, the geomorphic setting is
critical to understanding factors that may not be evidentfrom the vegetation or near-surface soil properties.
A major finding after the first 10 yr of this studywas the potential for cation depletion in these soils,particularly if vegetation were removed from the site(Johnson et al., 1988). That work prompted considerableinterest and concern regarding the potential effects ofwhole-tree harvesting on sustainable nutrient supplies.As a result, numerous studies have been conducted con-firming the potential for productivity decline as a resultof nutrient removal in biomass. However, a major limi-tation of most of the forest soil assessments is that usu-ally only the upper 50 to 100 cm of soil are considered.This practice is rationalized by the fact that the largestproportion of the roots is found near the surface. Inter-estingly, one of the important distinctions that forestsoil scientists make about forest soils is that the treesare long lived and deep rooted, thereby affecting soilprocesses. While inferred, the effects of deep rootingon nutrient cycling have not been extensively studied.Our results suggest that deep rooting is a major factorcontrolling cation uptake in mature forests: althoughthe upper 60 cm showed cation loss, productivity wassustained, apparently by deep soil pools. Similarly, cat-ion cycling through deep rooting is presumably responsi-ble for maintaining the cation balance on those sites notexhibiting cation loss. The capacity of deep soil suppliesto satisfy present nutrient cycling demands has not beenwidely recognized. Both the role of rooting and deepsoil pools need to be considered in future nutrient cy-cling studies.
The original nutrient cycling study was designed toconsider differences among cover types within theWBW. As a result of natural stand development andsuccession, the cover types have changed during thepast 21 yr, reflecting the ephemeral nature of foresttypes as the basis for identifying sites. Site classificationsystems that integrate soils, understory, and overstoryhave been used effectively to identify sites or ecosystemunits that have similar functions. Our work reempha-sizes the inadequacy of forest cover type as a commondenominator for assessing nutrient cycling or other soilprocesses. Although, cover type and species distributiondo tend to correspond with soils (Lietzke, 1994), re-flecting both nutrient and moisture regimes.
Agrading forests are considered to be net C sinks, andmature forests are usually in equilibrium. Our resultsindicate that forests may be a net source of C when netaboveground productivity is low. Loss of soil C, thefactor causing the net release of C from the ecosystem,is presumed to be primarily a result of decomposition.Temporal variability in soil C pools is known to besignificant. Whether the results from three measure-ment points in this study during a 21-yr period representa consistent trend is uncertain. Accordingly, consider-ably more work is needed to assess long-term soil Cpools, organic matter fractions, and factors controllingorganic matter dynamics in mineral soil horizons.
Originally, three soils and four cover types were rec-ognized for this long-term study of nutrient cycling, sug-gesting a relatively simple system. The cumulative find-
TRETTIN ET AL.: FOREST NUTRIENT AND CARBON POOLS AT WALKER BRANCH WATERSHED 1447
ings for the 21-yr assessment period highlight thecomplexity of this upland landscape and the nuances inthe interactions of vegetation, soils, and geomorphicposition. These results further highlight the danger inextrapolating findings from one site or study to othersites or regions. Within the WBW, sites varied from anet source to a sink for cations, C, P, and N. Accordingly,any generalization derived form one particular sitecould be wrong for another site on the watershed. Un-fortunately, we have not been able to directly determinethe causes of changes in nutrient and C pools; that un-derstanding would be useful in developing a more gener-alizable approach for thoroughly assessing long-termnutrient cycling. However, our consideration of thecausative factors is well grounded in the literature andresearch on the WBW. Hence, this work should providea basis for testing ideas and models regarding sustain-able productivity and nutrient cycling.
ACKNOWLEDGMENTSResearch support for D.W. Johnson was provided by the
National Council of the Paper Industry for Air and StreamImprovement, Inc., and the Agricultural Experiment Station,University of Nevada, Reno. Research support for D.E. Toddwas provided by Department of Energy and the Electric PowerResearch Institute through a contract with Desert ResearchInstitute. Oak Ridge National Laboratory is managed by Mar-tin-Lockheed Energy Systems, Inc., for the U.S. Departmentof Energy under contract DE-AC05-84OR21400. Publicationno. 4915, Environmental Sciences Division, Oak Ridge Na-tional Laboratory. Laboratory assistance by Valerie Yturiaga,Carol Johnson, and Sharon Ross is greatly appreciated.
1448 SOIL SCI. SOC. AM. J., VOL. 63, SEPTEMBER-OCTOBER 1999
Branch watershed project: Chemical physical and morphological following clearcutting of northern hardwood stands. Soil Sci. Soc.properties of the soils of Walker Branch watershed. ORNL/TM- Am. J. 48:223-228.2968. Oak Ridge Natl. Lab., Oak Ridge, TN. Wilson, D.M., and D.F. Grigal. 1995. Effects of pine plantations and
Richter, D.D., D. Markewitz, H.L. Alien, R. April, P.R. Heine, and adjacent deciduous forests on soil calcium. Soil Sci. Soc. Am. J.R. Urrego. 1994. Soil chemical change during three decades in an 59:1755-1761.old-field loblolly pine (Pinus taeda L.) ecosystem. Ecology 75: Yanai, R.D. 1992. Phosphorus budget of a 70-year old northern hard-1463-1473. wood forest. Biogeochemistry 17:1-22.
Snyder, K.E., and R.D. Harter. 1984. Changes in solum chemistry