forest fragmentation and plant-pollinator interactions in...
TRANSCRIPT
Forest fragmentation and plant-pollinator interactions in Western Kenya
Dissertation
zur
Erlangung des Doktorgrades (Dr.rer.nat.)
der
Mathematisch-Naturwissenschaftlichen Fakultät
der
Rheinischen Friedrich-Wilhelms-Universität Bonn
vorgelegt von
Thomas Bergsdorf
aus
Borken/Westfalen
Bonn 2006


Angefertigt mit der Genehmigung der Mathematisch-Naturwissenschaftlichen Fakultät der Reihnischen Friedrich-Wilhelms-Universität Bonn. Die Arbeit wurde am Zoologischen Forschungsmuseum Alexander Koenig (Bonn), durchgeführt. 1. Referent: Prof. Dr. Johann Wolfgang Wägele 2. Referent: Prof. Dr. Wolfgang Böhme Tag der Promotion: 7. Juli 2006 Diese Dissertation ist auf dem Hochschulschriftenserver der ULB Bonn http://hss.ulb.uni-bonn.de/diss_online elektronisch publiziert.


Meinen Eltern


In Andenken an
Prof. Dr. Clas M. Naumann
“Biodiversity benefits people through more than just its contribution to material welfare and livelihoods. Biodiversity contributes to security, resiliency, social relations, health, and freedom of choices and actions.” (WRI, 2005)

Contents
1. Biodiversity in tropical forests and pollination............................................................ 1 2. Pollination and fragmentation...................................................................................... 4 3. Objectives .................................................................................................................... 6 4. Study area .................................................................................................................... 7
4.1 Kakamega Forest and surrounding forest fragments .............................................. 7 4.2 Study sites ............................................................................................................. 10
4.2.1 Main forest study sites ................................................................................... 12 4.2.2 Forest fragments study sites........................................................................... 16
5. Material and methods................................................................................................. 21
5.1 Study plant species................................................................................................ 21
5.1.1 Acanthopale pubescens (Lindau ex Engl.) C.B. Clarke [Acanthaceae] ........ 22 5.1.2 Acanthus eminens (C.B. Clarke) [Acanthaceae]............................................ 22 5.1.3 Heinsenia diervilleoides (K. Schum.) [Rubiaceae] ....................................... 23 5.1.4 Dracaena fragrans (L.) Ker Gawl. [Ruscaceae] ........................................... 24
5.2 Visitation frequency.............................................................................................. 25 5.3 Primary pollination success .................................................................................. 25 5.4 Self-fertilisation field test ..................................................................................... 25 5.5 Fruit set and seed set ............................................................................................. 26 5.6 Considered biotic factors ...................................................................................... 26 5.7 Considered abiotic factors .................................................................................... 27 5.8 Statistics ................................................................................................................ 28
6. Results........................................................................................................................ 30
6.1 Acanthopale pubescens [Acanthaceae]................................................................. 30
6.1.3 Visitation frequency....................................................................................... 30 6.1.2 Primary pollination success ........................................................................... 33 6.1.3 Fruit set .......................................................................................................... 35 6.1.4 Seed set .......................................................................................................... 37 6.1.5 Levels of pollination ...................................................................................... 39
6.2 Acanthus eminens [Acanthaceae]..........................................................................40
6.2.1 Visitation frequency .......................................................................................40 6.2.2 Primary pollination success............................................................................45 6.2.3 Fruit set...........................................................................................................48 6.2.4 Seed set...........................................................................................................51 6.2.5 Levels of pollination.......................................................................................54
6.3 Heinsenia diervilleoides [Rubiaceae]....................................................................56
6.3.1 Visitation frequency .......................................................................................56 6.3.2 Primary pollination success............................................................................59 6.3.3 Fruit set...........................................................................................................61 6.3.4 Seed set...........................................................................................................62 6.3.5 Levels of pollination.......................................................................................64
6.4 Dracaena fragrans [Ruscaceae]............................................................................65
6.4.1 Flower visitation.............................................................................................65 6.4.2 Primary pollination success............................................................................65 6.4.3 Fruit set...........................................................................................................68 6.4.4 Seed set...........................................................................................................69 6.4.5 Levels of pollination.......................................................................................71
7. Discussion ..................................................................................................................72
7.1 Visitation frequency and primary pollination success ..........................................72 7.2 Reproductive success ............................................................................................77 7.3 Plant species and fragmentation............................................................................83
8. Outlook.......................................................................................................................85 9. Summary ....................................................................................................................86 10. References ................................................................................................................88 Appendix .........................................................................................................................94
Biodiversity in tropical forests and pollination 1___________________
1. Biodiversity in tropical forests and pollination The Convention on Biological Diversity of Rio de Janeiro (Brazil) identified the “importance of biological diversity for evolution and for maintaining life sustaining systems of the biosphere” and the “general lack of information and knowledge regarding biological diversiy”. In addition, the signatory states stressed “that biological diversity is being significantly reduced by certain human activities” (CBD, 1992). Historically, scientists recognized the contrast between the tremendous diversity of tropical plants and animals and the much lower diversity of plants and animals in temperate regions since the mid-nineteenth century (Bates, 1864; Wallace, 1878; Huston, 1994). The increase of the average species richness moving from high to low latitudes has already been documented for a wide spectrum of taxonomic groups (Gaston, 2000). After fogging the canopies of tropical rain forests, Erwin (1982) corrected conservative estimations of about 2 million animal species living on our planet “very optimistically” (Freund, 2004) to a plausible upper limit of 30 million species including all rain forests in the world due to a high amount of previously unknown arthropod species in his samples. Myers et al. (2000) identified plant and vertebrate “biodiversity hotspots”. Regarding the 300,000 plants species known world wide, seven of the top ten endemic plant hotspots include rain forests (Myers et al., 2000). This observation led the authors to describe tropical forests as “major wilderness areas”. In addition, Wilson (1988) not only called rain forests “centres of diversity”, but also emphasized two principal reasons for biologists and conservationists to focus increasing attention on tropical rain forests:
“First, although these habitats cover only 7% of the Earth’s land surface, they contain more than half the species in the entire world biota. Second, the forests are being destroyed so rapidly that they will mostly disappear within the next century, taking with them hundreds of thousands of species into extinction.” (Wilson, 1988)
It is well-known that the increase in human population forced a dramatic change upon the natural environment. The high diverse rain forests are under enormous anthropogenic pressure leading to a severe biodiversity decline due to habitat loss (Myers, 1988; Heywood, 1995; Pimm et al., 1995). Unfortunately, this pressure results especially from the fact that surrounding areas of tropical rain forests are densely populated in countries with very high population growth rates (Blackett, 1994; Tattersfield et al., 2001). The increased anthropogenic use of land is one of the most important drivers of environmental change (Sala et al., 2000). Therefore, degradation transforms primary to secondary forest systems. Furthermore, close and widespread forests split up into forest fragments and will be deforest afterwards (Whitmore, 1997; Laurance et al., 2000). Up to now, nearly one quarter of the tropical rain forest biome has been fragmented or removed by humans (Wade et al., 2003).
“The current massive degradation of habitat and extinction of many of the Earth’s biota is unprecedented and is taking place on a catastrophically short timescale.” (Novacek & Cleland, 2001)
Biodiversity in tropical forests and pollination 2 ___________________
Fragmentation of natural habitats not only affects the distribution and the abundance of organisms, it may also disturb the important biological processes that maintain biodiversity and that are of high importance for the functioning and the long-term existence of ecosystems (Harrison & Bruna, 1999; Naeem et al., 1999; Chapin et al., 2000; Kraemer & Bergsdorf, 2001). Janzen (1974) already remarked in the early seventies:
“What escapes the eye, however, is much more insidious kind of extinction: the extinction of ecological interactions. Many of the remaining participants of these interactions will probably hold on for many years, but they constitute little more than haphazard, semi-self-sustaining zoo and botanical garden.”
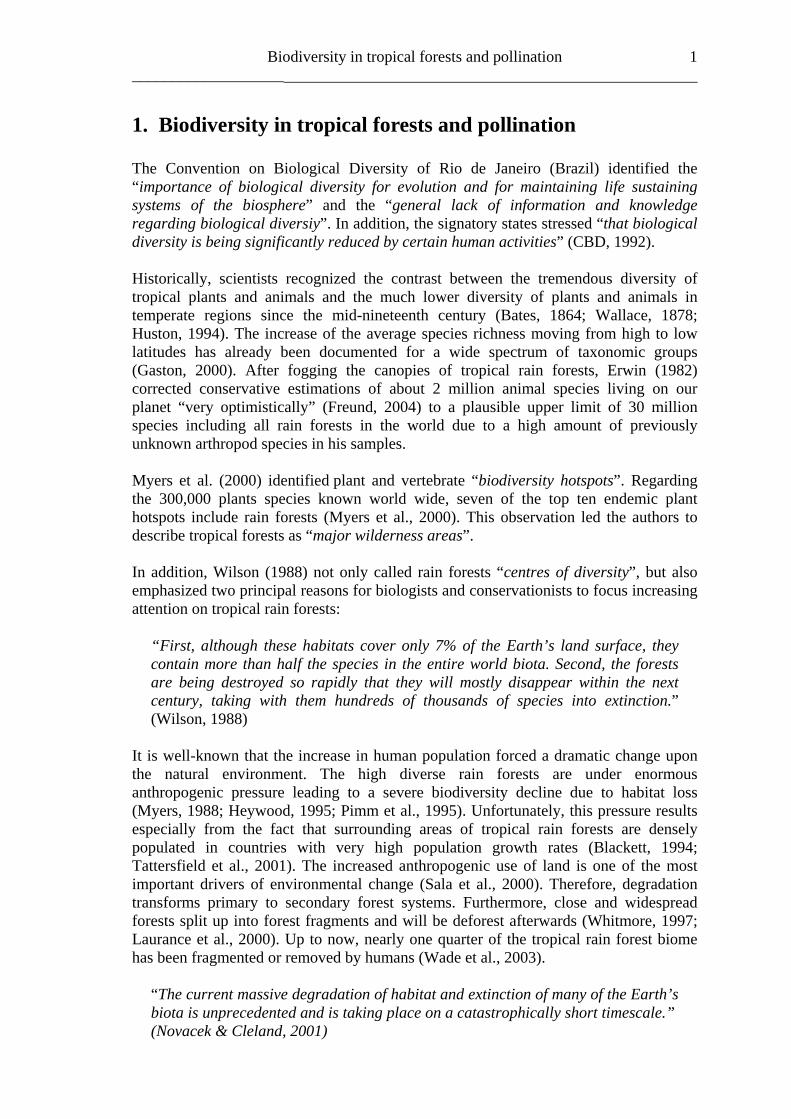
Consequences upon essential ecosystem processes like seed dispersal (Peres, 2000; Wright et al., 2000) and regeneration (Laurance et al., 2000; Pacheco & Simonetti, 2000; Wright et al., 2000) are expected. Furthermore, Kevan (1975) stressed that “the often unknown but undoubtedly important interrelationships of pollinators and plants constitute a serious void” in both agricultural and natural communities. It is generally accepted that pollination is a major step in the life-history of most flowering plants and therefore it is of high significance to the organization of plant communities and to the long-term maintenance of whole vegetational units and its capability for regeneration (Buchmann & Nabhan, 1996). Almost 100 percent of the flowering plant species in tropical forests are pollinated by animals, with bees being among the most important pollinators (Roubik, 1989; Neff & Simpson, 1993; Kraemer & Bergsdorf, 2001). Consequently, pollination is an essential ecosystem service (Fig.1).
Fig. 1: Linking Diversity and Ecosystem Processes (Kraemer et al., 2001)
In consideration of these ecosytematic coherences, Buchmann and Nabhan (1996) stressed the dire need of pollination conservation and established the “Forgotten Pollinators Campaign”. In the same year, the Third Conference of the Parties (COP 3)
Biodiversity in tropical forests and pollination 3___________________
of the Convention on Biological Diversity (CBD) gave pollinators priority for publishing case studies in its biodiversity programme (CBD, 1996). This stimulated global interest in pollination conservation, and the first subsequent major activity was an international symposium in Sao Paulo, Brazil (1998). This resulted in the Sao Paulo Declaration (IPI, 1999), which called for an international pollinator initiative and documented many activities required for pollinator conservation. Moreover, because of the fact that a lot of crops also depend on pollinators, the African Pollinator Initiative (API), founded in 1999, stressed the need for deeper understanding of plant-pollinator interactions both in agricultural and natural ecosystems “for sustainable livelihoods and the conservation of biological diversity in Africa” (API, 2003). But Roger et al. (2004) still identified a huge lack of basic knowledge and information concerning pollination relationships, especially focusing on Africa in general and concerning fragmented rain forest systems in particular.
Pollination and fragmentation 4 ______________________________________________________________________
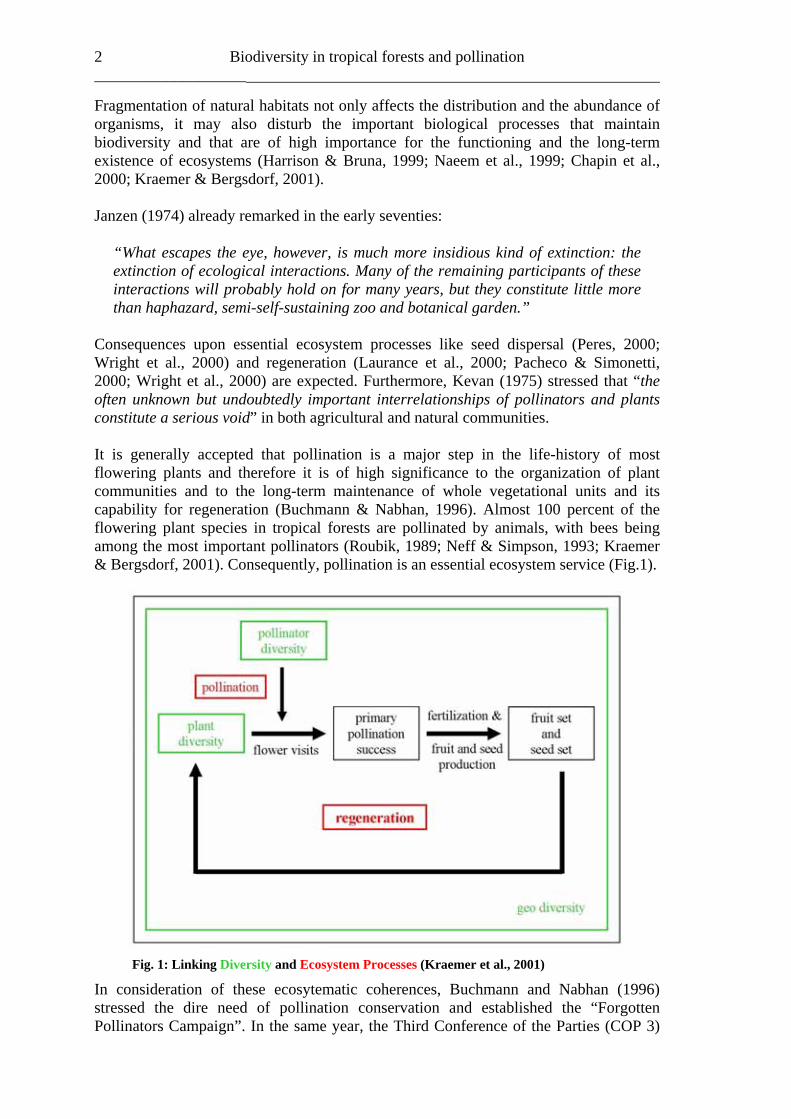
2. Pollination and fragmentation It is largely accepted that fragmentation of natural habitats is one of the greatest threats to terrestrial biodiversity worldwide (Jennersten, 1988; Rathcke & Jules, 1993; Turner, 1996). Habitat fragmentation can affect animal and plant populations, but also essential ecosystem processes, like plant-pollinator interactions (Aizen et al., 2002). In theory (Fig. 2), a reduction in population size and an increase in isolation due to fragmentation may lead to limited gene flow, increased inbreeding, loss of genetic variation, decreased individual fitness, and consequently result in an increased risk of population extinction (Murcia, 1995; Jules & Rathcke, 1999; Cunningham, 2000a; 2000b; Jacquemyn et al., 2002; Ghazoul, 2005).
Fig. 2: Theory of fragmentation and extinction
Several studies appear to support this theory on different levels of pollination and seed dispersal (Jennersten, 1988; Aizen & Feinsinger, 1994b; Murcia, 1995; Didham et al., 1996; Kearns et al., 1998; Jules & Rathcke, 1999; Cunningham, 2000a; 2000b; Jacquemyn et al., 2002). But just a few studies actually quantified pollination success in habitat fragments (Ghazoul, 2005), especially in highly diverse and complex rain forest systems. For the most part studies reported a decline in pollinator abundance as response to habitat fragmentation (Jennersten, 1988; Aizen & Feinsinger, 1994b; Liow et al., 2001; Lennartsson, 2002). In addition, limits to pollinator movement among patches were found (Steffan-Dewenter & Tscharntke, 1999; Goverde et al., 2002). Therefore, fewer flower visits (Jennersten, 1988; LaMont et al., 1993; Schulke & Waser, 2001) and smaller pollen loads (Cunningham, 2000a) or poorer pollen quality (Severns, 2003)
Pollination and fragmentation 5___________________
p to now, following the reviews conducted by Aizen et al. (2002) and Ghazoul (2005)
) and its pollen supply in Costa Rica unningham, 1996); (2) on the tropical tree Pithecellobium elegans [Mimosaceae] and
its genetic diversity and mating system in Costa Rica (Hall et al., 1996); (3) on the tropical forest tree Symphonia globulifera [Buttiferae] and its reproductive dominance in Costa Rica (Aldrich & Hamrick, 1998); and (4) on the tropical tree Dinizia excelsa [Fabaceae] and its pollen dispersal inside the Amazonian rain forest (Dick et al., 2003). In these studies no clear pattern of response became obvious. Cunningham (1996), Hall et. al (1996) and Dick et al. (2003) documented negative effects of smaller patch sizes on plant reproductive biology. In contrast to this, Aldrich & Hamrick (1998) found a higher reproductive output due to fragmentation. Most of the fragmentation and/or patch sizes oriented studies in respect of forest habitats were conducted in non-rain forest systems. Also here, the authors reported about different consequences on pollination and reproductive success as a result of fragmentation processes: significant negative (Aizen & Feinsinger, 1994a; Nason & Hamrick, 1997; Ghazoul & McLeish, 2001; Rocha & Aguilar, 2001; Quesada et al., 2003), significant positive (Aizen & Feinsinger, 1994a) or non-significant (Aizen & Feinsinger, 1994a; Ghazoul & McLeish, 2001; Cascante et al., 2002) effects. Regarding Africa, a large number of studies on pollination in general have been conducted in the floristically unique Cape region in South Africa. This could be assumed as the only region in Africa where pollination biology might be regarded as reasonably well studied (Rodger et al., 2004). But also here, studies on fragmentation and plant reproductive ecology are very rare.
were described in fragments. This might lead to limited pollen flow and increased inbreeding (Richards et al., 1999; Richards, 2000) resulting in progeny that is less fit (Agren, 1996), which among other reasons depresses reproductive success (Cunningham, 2000b). Uabout 40 important studies have been published, which either explicitly or implicitly dealt with the potential impact of fragmentation and/or patch sizes on plant reproductive ecology. In these reviews about 70 plant species were integrated. Only four of these studies were conducted in tropical rain forest remnants: (1) on an understorey palm (Calyptrogyne ghiesbreghtiana [Arecaceae](C
Objectives 6 ______________________________________________________________________
3. Objectives “Chovya chovya humaliza buyu la asali” –
“Dip after dip depletes a jar of honey” (Kenyan saying)
This study was conducted due to the following reasons:
- a general lack of knowledge and a limited understanding of plant-pollinator interactions in fragmented landscapes (Steffan-Dewenter et al., 2006), in particular with respect to tropical forest systems (Aizen et al., 2002; Ghazoul, 2004)
- the reviewed papers showed substantial differences in certain aspects of the
pollination biology between Africa and the rest of the world (Rodger et al., 2004)
- the urgent need of a better understanding of these crucial and highly complex
ecological processes for a potential formulation of effective conservation protocols that could also facilitate the sustainable use of forests and forest resources (Ghazoul, 2004).
In this context this study focused on the following questions:
- Does the fragmentation of the Kakamega Forest affect different levels of pollination, such as visitation frequency, primary pollination success, seed and/or fruit set?
- Are general patterns visible inside the Kakamega main forest and its fragments
regarding pollination levels and the different observed plant species? - Do the observed rain forest plant species potentially show pollinator or pollen
limitation at a forest fragment level in Kakamega Forest? - Which abiotic and biotic factors have influences on the levels of pollination in Kakamega Forest?
Study area 7
4. Study area “Fuata nyuki ule asali” –
“Follow bees and get honey” (Kenyan saying)
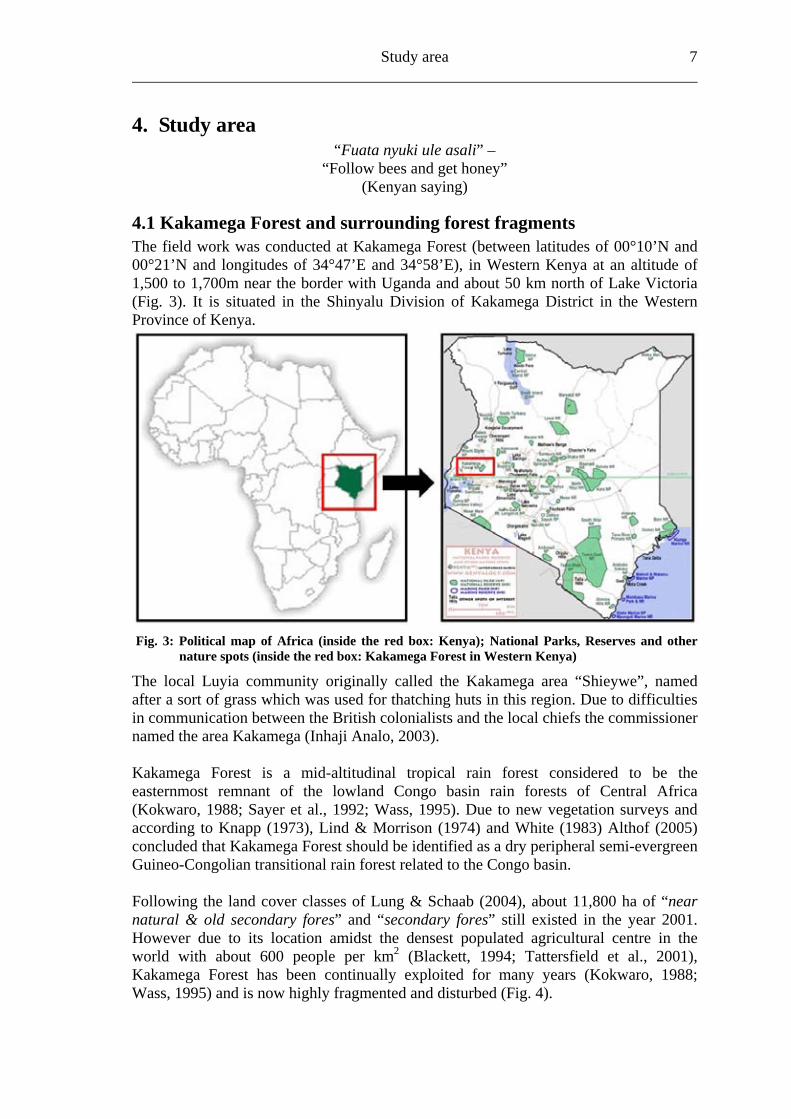
4.1 Kakamega Forest and surrounding forest fragments The field work was conducted at Kakamega Forest (between latitudes of 00°10’N and 00°21’N and longitudes of 34°47’E and 34°58’E), in Western Kenya at an altitude of 1,500 to 1,700m near the border with Uganda and about 50 km north of Lake Victoria (Fig. 3). It is situated in the Shinyalu Division of Kakamega District in the Western Province of Kenya.
Fig. 3: Political map of Africa (inside the red box: Kenya); National Parks, Reserves and other nature spots (inside the red box: Kakamega Forest in Western Kenya)
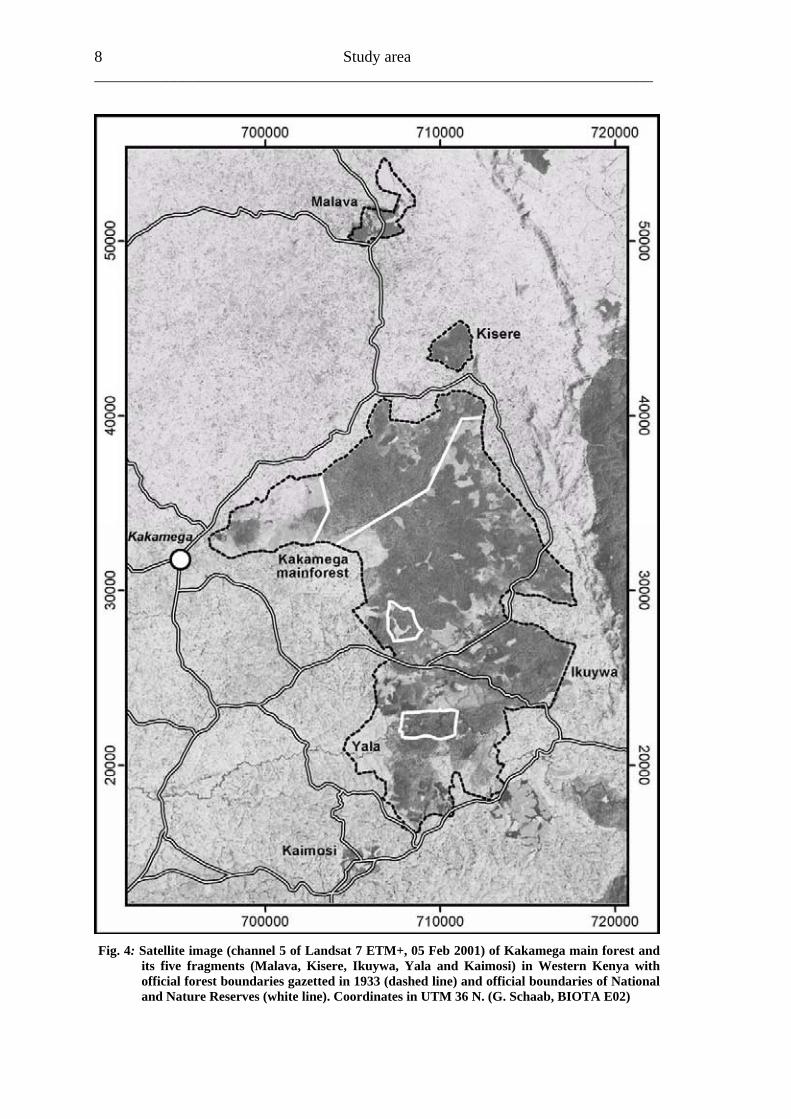
The local Luyia community originally called the Kakamega area “Shieywe”, named after a sort of grass which was used for thatching huts in this region. Due to difficulties in communication between the British colonialists and the local chiefs the commissioner named the area Kakamega (Inhaji Analo, 2003). Kakamega Forest is a mid-altitudinal tropical rain forest considered to be the easternmost remnant of the lowland Congo basin rain forests of Central Africa (Kokwaro, 1988; Sayer et al., 1992; Wass, 1995). Due to new vegetation surveys and according to Knapp (1973), Lind & Morrison (1974) and White (1983) Althof (2005) concluded that Kakamega Forest should be identified as a dry peripheral semi-evergreen Guineo-Congolian transitional rain forest related to the Congo basin. Following the land cover classes of Lung & Schaab (2004), about 11,800 ha of “near natural & old secondary fores” and “secondary fores” still existed in the year 2001. However due to its location amidst the densest populated agricultural centre in the world with about 600 people per km2 (Blackett, 1994; Tattersfield et al., 2001), Kakamega Forest has been continually exploited for many years (Kokwaro, 1988; Wass, 1995) and is now highly fragmented and disturbed (Fig. 4).
Study area 8 ______________________________________________________________________
Fig. 4: Satellite image (channel 5 of Landsat 7 ETM+, 05 Feb 2001) of Kakamega main forest and its five fragments (Malava, Kisere, Ikuywa, Yala and Kaimosi) in Western Kenya with official forest boundaries gazetted in 1933 (dashed line) and official boundaries of National and Nature Reserves (white line). Coordinates in UTM 36 N. (G. Schaab, BIOTA E02)
Study area 9
further increase of population density in the next decades with its linked
sure of harvesting and forest exploitation is most likely (Tsingalia,
in the Forest Reserve in 1967 (Blackett, 1994).
lf of the state (Fig. 4) (Bleher et al.,
the
not vident (Freund, 2004).
e from very strongly
orest (Buyangu hill). The more undisturbed forests in Southern Kakamega (Yala) are richer in different
arable areas in the Northern part (Kisere fragment and the protected
Animal diversity The Kak als. With respect to primates you can find the O ubis), (Colobus guereza), the rcopith Monkey
Aanthropogenic pres1988; Cincotta et al., 2000). Management history Kakamega Forest was first gazetted as Trust Forest under proclamation No. 14 in 1933 and has since been managed by the Forest Department (FD). In 1964 it was declared to be a Central Forest (Blackett, 1994). Three small Nature Reserves, Isecheno, Kisere and Yala, were established and gazetted withIn 1986, the northern part of Kakamega called Buyangu together with the adjacent Kisere Forest was gazetted as Kakamega National Reserve and fell under management of the Kenya Wildlife Service (KWS). Today, Kakamega Forest is partly a Forest Reserve, partly Nature Reserve and partly National Reserve, and its management is under the authority of both, FD and KWS, on beha2005). Wass (1995) characterised the management aims and strategies as follows, the FD is intending “to enhance conservation and protection of indigenous forest, to improveproduction of timber and fuel wood and to establish a framework for long-term development forestry” and the KWS would like “to conserve, protect and sustainably manage the wildlife resources”. Climate and soil conditions Annual rainfall in Kakamega Forest is 2007 mm (as averaged from FD records at Isecheno Forest Station from 1982 to 2001) and highly seasonal with a rainy season from April to November and a short dry season from December to March. The average monthly maximum temperature ranges from 18 to 29°C while the average monthly minimum temperature ranges from 4 to 21°C (Muriuki & Tsingalia, 1990). But, during field work between 2001 and 2003, a regular change of dry and wet season wase The dominant soil classes in Kakamega Forest are Ferrasols, Lixisols, Cambisols and Phaeozems. Most soils are deep to very deep on a flat to undulating terrain. Soil texture is predominantly clayey. All soils have low nutrient levels and rangacidic to slightly acidic (pH 4.5-6.5). Soils in the northern part of the forest are in more advanced stage of weathering as compared to the southern part with an exception of Isecheno soils. These factors may strongly limit plant growth (Musila et al., 2005). Plant diversity Kakamega Forest is a unique mixture of Guineo-Congolian and Afromontane species with most of the Guineo-Congolian species reaching their easternmost distribution limit. All in all, 397 species of 93 families were found in Kakamega Forest with the highest amount of species occurring in the disturbed areas with secondary f
species than comparea of the Colobus forest). All observed plant communities of Kakamega Forest were influenced by human activities in the last decades (Althof, 2005).
amega Forest houses a large number of animlive Baboon (Papio an
Blue Monkey (Ce the Black and White Colobus ecus mitis), the Red-tailed
Study area 10 ______________________________________________________________________ (Cercopithecus asc De Brazza’s Monk cus neglectus). In addition, there are n ope species, iptus), the Blue Duiker (Cephalophus monticola), the Red Duik harveyi) and the Common With respect to reptiles and amphibians, the forest e richest areas in
enya. Commonly encountered species include e.g. the Gaboon Viper (Bitis gabonica), the Rhinoceros Viper (Bitis nasicornis), the Forest Cobra (Naja melanoleuca), the Jameson’s Mamba (Dendroaspis jamesoni kaimosae), and diverse tree frog species (Hyperolius spec.) (Köhler, 2004; Wagner, 2004). The avifauna of the Kakamega Forest is a unique combination of central lowland and highland species. With more than 350 recorded species the diversity is very high (KIFCON, 1994) and over 200 species are forest dependants (Inhaji Analo, 2003). The insect fauna of Kakamega Forest and its surrounding farmland is also greatly diverse, especially with regard to butterflies (Lepidoptera), of which more than 490 species or 55% of approximately 900 Kenyan species have been recognized so far (Kühne et al., 2004). In addition, a total number of 71 dragonfly species (Clausnitzer, 2004) have been recorded from the forest. With respect to bees, the probably most important group of pollinators, all in all about 230 species from four bee families were found by Gikungu (2006). The most dominant families were Apidae, Halictidae and Megachilidae; the family Colletidae was found to be very sparsely distributed. Furthermore, Gikungu (2006) described along a gradient a clear pattern of bee species richness, as well as bee abundance. The highest number was recorded in farmland followed by bushland and found to decrease with forest age in almost every family. Anthropogenic impact Kakamega Forest has been continually exploited for many years due to the high surrounding population pressure (Kokwaro, 1988; Wass, 1995). As a result, it lost about 20% in forest area over the past 30 years (Lung & Schaab, 2004). Human impact – such as logging, paths, debarking, charcoal production and honey gathering – could be found in different forest parts, whereas selective logging occurs over the entire Kakamega Forest (Bleher et al., 2005). These disturbances have also been observed by Mutangah (1996), who stated the highest logging levels took place in the most southern part of the forest as well as along the western edge. Furthermore, Bleher et al. (2005) showed that the number of trees logged illegally in the last 20 years was significantly lower in forest parts managed by KWS and within highly protected National and Nature Reserves, respectively. The lowest logging levels were found in the northern Kakamega National Reserve, in central Ikuywa and Yala.
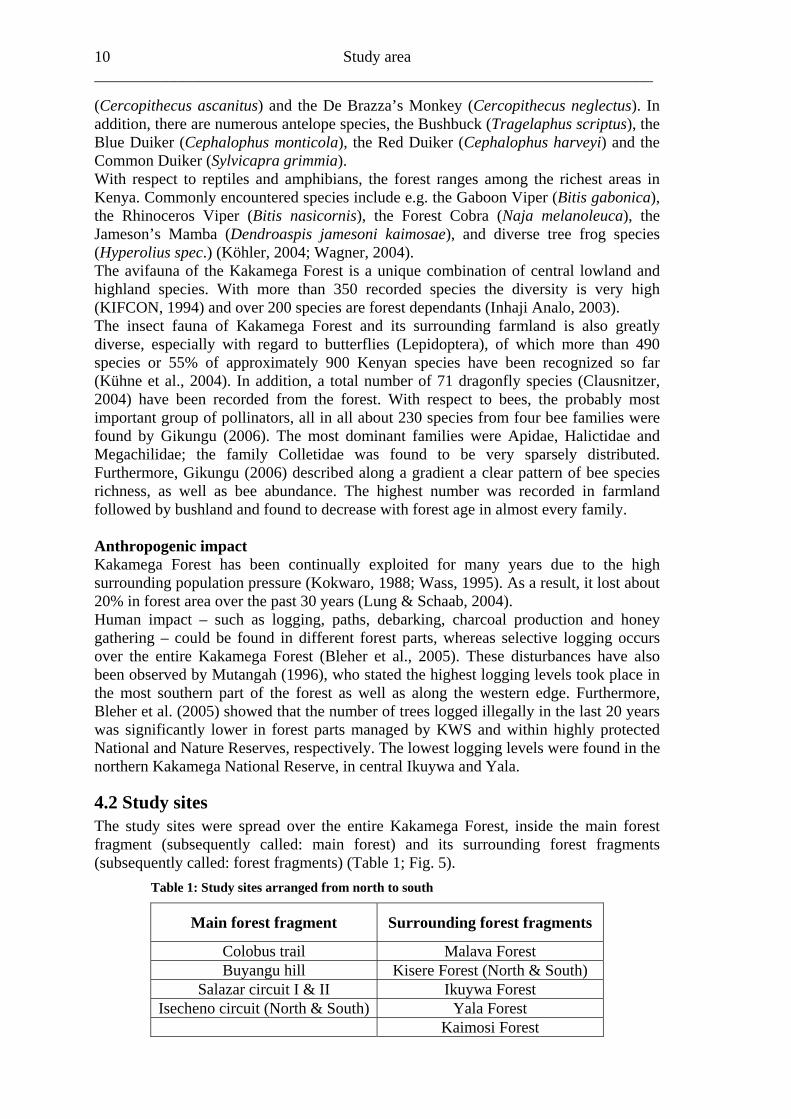
4.2 Study sites The study sites were spread over the entire Kakamega Forest, inside the main forest fragment (subsequently called: main forest) and its surrounding forest fragments (subsequently called: forest fragments) (Table 1; Fig. 5).
Table 1: Study sites arranged from north to south
Main forest fragment Surrounding forest fragments
anitus) and the ey (Cercopitheumerous antel the Bushbuck (Tragelaphus scr
er (CephalophusDuiker (Sylvicapra grimmia).
ranges among thK
Colobus trail Malava Forest Buyangu hill Kisere Forest (North & South)
Salazar circuit I & II Ikuywa Forest Isecheno circuit (North & South) Yala Forest
Kaimosi Forest
Study area 11
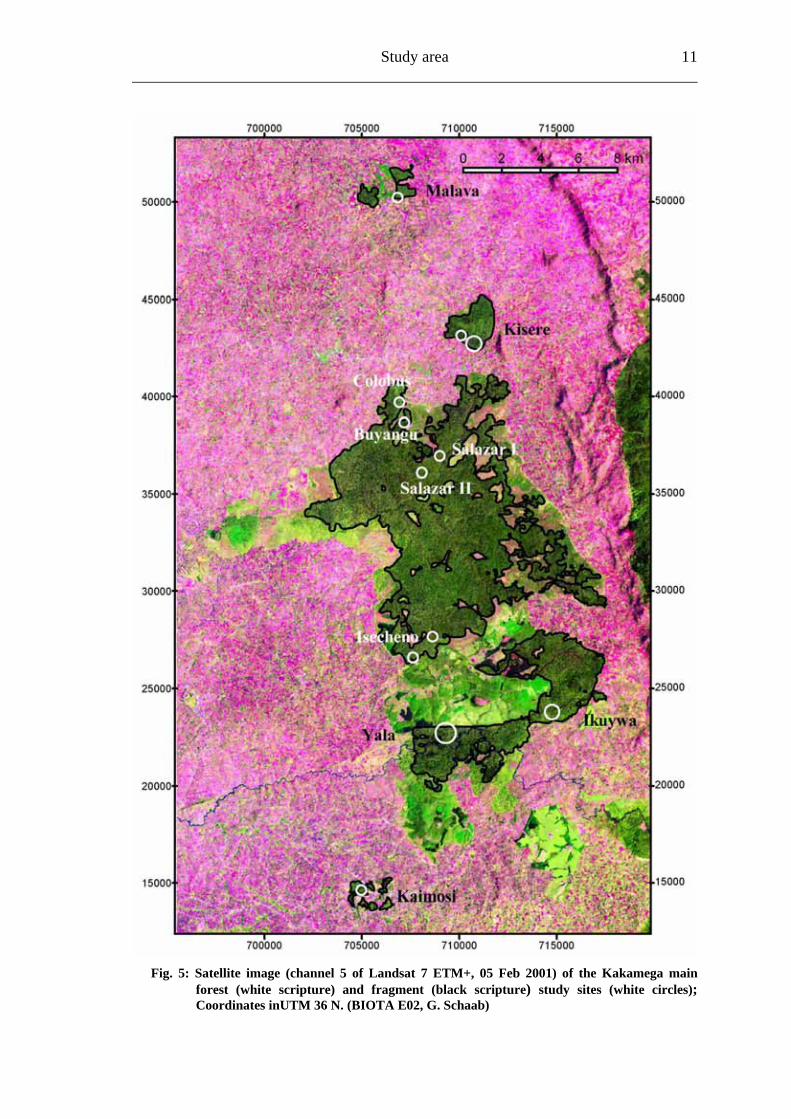
Fi 5: Satellite image (channel 5 of Landsat 7 ETM+, 05 Feb 2001) of the Kakamega main forest (white scripture) and fragment (black scri
g. pture) study sites (white circles);
Coordinates inUTM 36 N. (BIOTA E02, G. Schaab)
Study area 12 ______________________________________________________________________
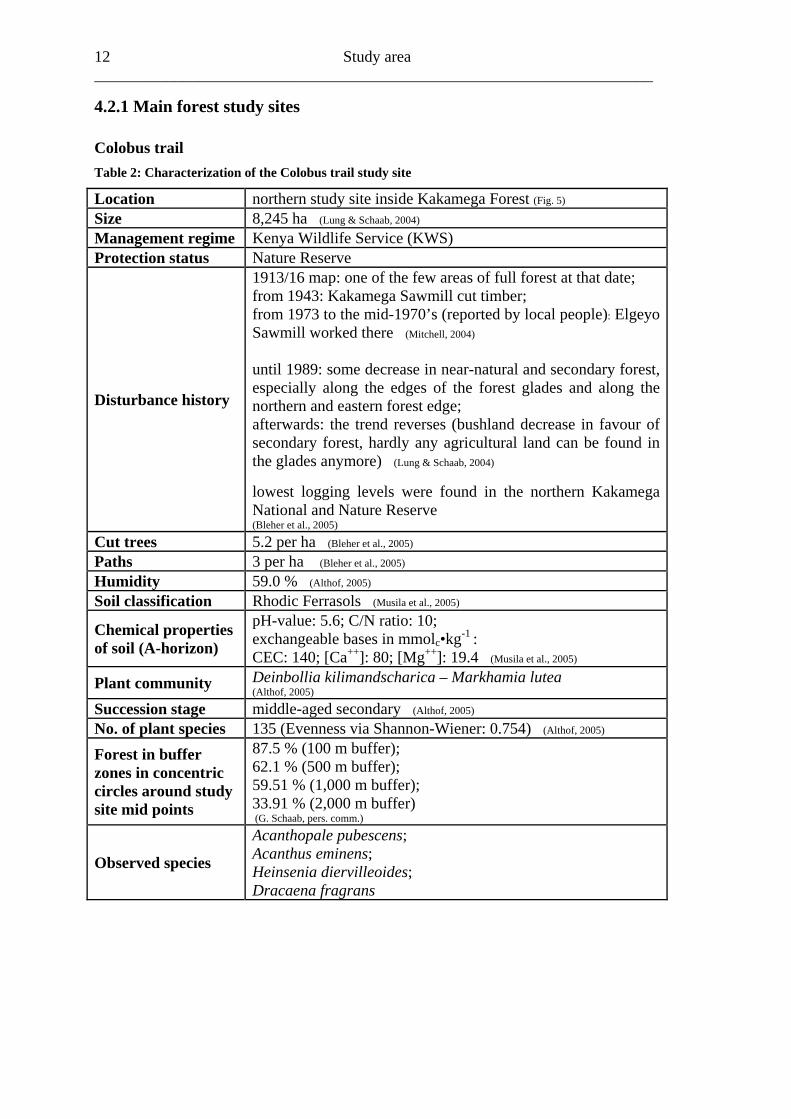
4.2.1 Main forest study sites Colobus trail Table 2: Characterization of the Colobus trail study site
Location northern study site inside Kakamega Forest (Fig. 5) Size 8,245 ha (Lung & Schaab, 2004) Management regime Kenya Wildlife Service (KWS) Protection status Nature Reserve
Disturbance history
1913/16 map: one of the few areas of full forest at that date; from 1943: Kakamega Sawmill cut timber; from 1973 to the mid-1970’s (reported by local people): Elgeyo Sawmill worked there (Mitchell, 2004)
until 1989: some decrease in near-natural and secondary forest, especially along the edges of the forest glades and along the northern and eastern forest edge; afterwards: the trend reverses (bushland decrease in favour of secondary forest, hardly any agricultural land can be found in the glades anymore) (Lung & Schaab, 2004) lowest logging levels were found in the northern Kakamega National and Nature Reserve (Bleher et al., 2005)
Cut trees 5.2 per ha (Bleher et al., 2005) Paths 3 per ha (Bleher et al., 2005) Humidity 59.0 % (Althof, 2005) Soil classification Rhodic Ferrasols (Musila et al., 2005)
Chemical properties of soil (A-horizon)
pH-value: 5.6; C/N ratio: 10; exchangeable bases in mmolc•kg-1 : CEC: 140; [Ca++]: 80; [Mg++]: 19.4 (Musila et al., 2005)
Plant community Deinbollia kilimandscharica – Markhamia lutea (Althof, 2005)
Succession stage middle-aged secondary (Althof, 2005) No. of plant species 135 (Evenness via Shannon-Wiener: 0.754) (Althof, 2005) Forest in buffer zones in concentric circles around study site mid points
87.5 % (100 m buffer); 62.1 % (500 m buffer); 59.51 % (1,000 m buffer); 33.91 % (2,000 m buffer) (G. Schaab, pers. comm.)
Observed species
Acanthopale pubescens; Acanthus eminens; Heinsenia diervilleoides; Dracaena fragrans
Study area 13
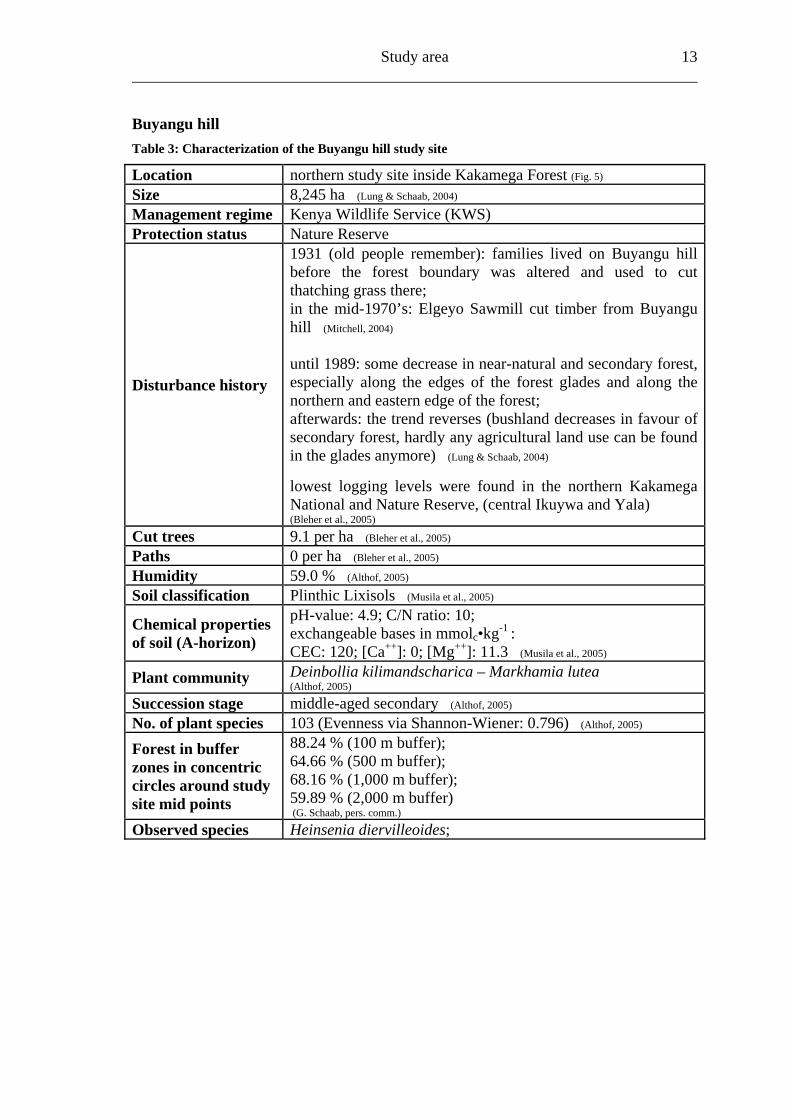
Buyangu hill Table 3: Characterization of the Buyangu hill study site
Location northern study site inside Kakamega Forest (Fig. 5) Size 8,245 ha (Lung & Schaab, 2004) Management regime Kenya Wildlife Service (KWS) Protection status Nature Reserve
Disturbance history
1931 (old people remember): families lived on Buyangu hill before the forest boundary was altered and used to cut thatching grass there; in the mid-1970’s: Elgeyo Sawmill cut timber from Buyangu hill (Mitchell, 2004) until 1989: some decrease in near-natural and secondary forest, especially along the edges of the forest glades and along the northern and eastern edge of the forest; afterwards: the trend reverses (bushland decreases in favour of secondary forest, hardly any agricultural land use can be found in the glades anymore) (Lung & Schaab, 2004) lowest logging levels were found in the northern Kakamega National and Nature Reserve, (central Ikuywa and Yala) (Bleher et al., 2005)
Cut trees 9.1 per ha (Bleher et al., 2005) Paths 0 per ha (Bleher et al., 2005) Humidity 59.0 % (Althof, 2005) Soil classification Plinthic Lixisols (Musila et al., 2005)
Chemical properties of soil (A-horizon)
pH-value: 4.9; C/N ratio: 10; exchangeable bases in mmolc•kg-1 : CEC: 120; [Ca++]: 0; [Mg++]: 11.3 (Musila et al., 2005)
Plant community Deinbollia kilimandscharica – Markhamia lutea (Althof, 2005)
Succession stage middle-aged secondary (Althof, 2005) No. of plant species 103 (Evenness via Shannon-Wiener: 0.796) (Althof, 2005) Forest in buffer zones in concentric circles around study site mid points
88.24 % (100 m buffer); 64.66 % (500 m buffer); 68.16 % (1,000 m buffer); 59.89 % (2,000 m buffer) (G. Schaab, pers. comm.)
Observed species Heinsenia diervilleoides;
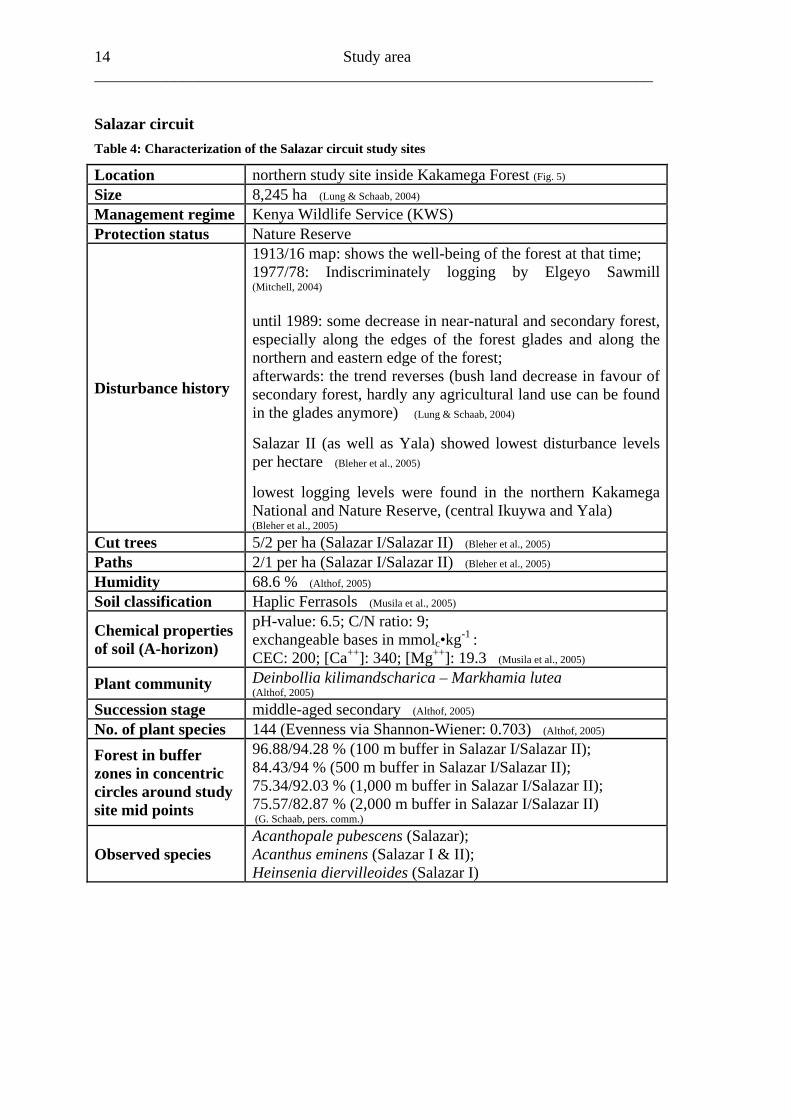
Study area 14 ______________________________________________________________________ Salazar circuit Table 4: Characterization of the Salazar circuit study sites
Location northern study site inside Kakamega Forest (Fig. 5) Size 8,245 ha (Lung & Schaab, 2004) Management regime Kenya Wildlife Service (KWS) Protection status Nature Reserve
Disturbance history
1913/16 map: shows the well-being of the forest at that time; 1977/78: Indiscriminately logging by Elgeyo Sawmill (Mitchell, 2004) until 1989: some decrease in near-natural and secondary forest, especially along the edges of the forest glades and along the northern and eastern edge of the forest; afterwards: the trend reverses (bush land decrease in favour of secondary forest, hardly any agricultural land use can be found in the glades anymore) (Lung & Schaab, 2004) Salazar II (as well as Yala) showed lowest disturbance levels per hectare (Bleher et al., 2005) lowest logging levels were found in the northern Kakamega National and Nature Reserve, (central Ikuywa and Yala) (Bleher et al., 2005)
Cut trees 5/2 per ha (Salazar I/Salazar II) (Bleher et al., 2005) Paths 2/1 per ha (Salazar I/Salazar II) (Bleher et al., 2005) Humidity 68.6 % (Althof, 2005) Soil classification Haplic Ferrasols (Musila et al., 2005)
Chemical properties of soil (A-horizon)
pH-value: 6.5; C/N ratio: 9; exchangeable bases in mmolc•kg-1 : CEC: 200; [Ca++]: 340; [Mg++]: 19.3 (Musila et al., 2005)
Plant community Deinbollia kilimandscharica – Markhamia lutea (Althof, 2005)
Succession stage middle-aged secondary (Althof, 2005) No. of plant species 144 (Evenness via Shannon-Wiener: 0.703) (Althof, 2005) Forest in buffer zones in concentric circles around study site mid points
96.88/94.28 % (100 m buffer in Salazar I/Salazar II); 84.43/94 % (500 m buffer in Salazar I/Salazar II); 75.34/92.03 % (1,000 m buffer in Salazar I/Salazar II); 75.57/82.87 % (2,000 m buffer in Salazar I/Salazar II) (G. Schaab, pers. comm.)
Observed species Acanthopale pubescens (Salazar); Acanthus eminens (Salazar I & II); Heinsenia diervilleoides (Salazar I)
Study area 15
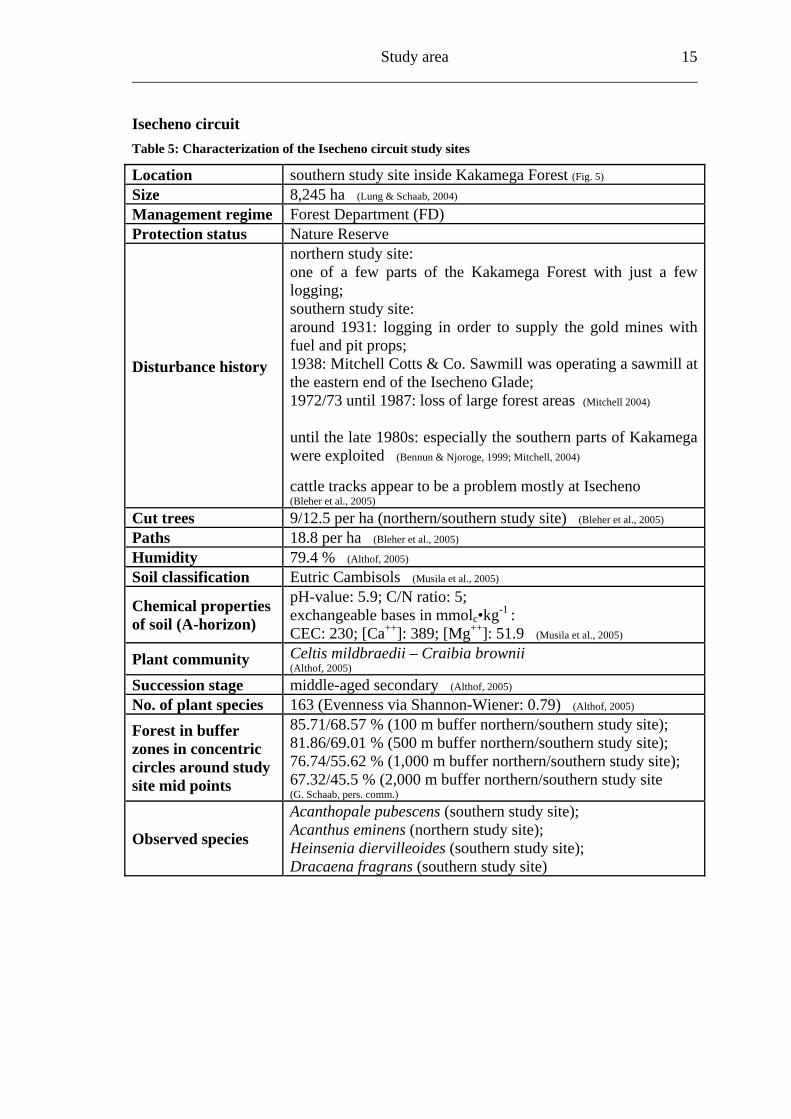
Isecheno circuit Table 5: Characterization of the Isecheno circuit study sites
Location southern study site inside Kakamega Forest (Fig. 5) Size 8,245 ha (Lung & Schaab, 2004) Management regime Forest Department (FD) Protection status Nature Reserve
Disturbance history
northern study site: one of a few parts of the Kakamega Forest with just a few logging; southern study site: around 1931: logging in order to supply the gold mines with fuel and pit props; 1938: Mitchell Cotts & Co. Sawmill was operating a sawmill at the eastern end of the Isecheno Glade; 1972/73 until 1987: loss of large forest areas (Mitchell 2004) until the late 1980s: especially the southern parts of Kakamega were exploited (Bennun & Njoroge, 1999; Mitchell, 2004) cattle tracks appear to be a problem mostly at Isecheno (Bleher et al., 2005)
Cut trees 9/12.5 per ha (northern/southern study site) (Bleher et al., 2005) Paths 18.8 per ha (Bleher et al., 2005) Humidity 79.4 % (Althof, 2005) Soil classification Eutric Cambisols (Musila et al., 2005)
Chemical properties of soil (A-horizon)
pH-value: 5.9; C/N ratio: 5; exchangeable bases in mmolc•kg-1 : CEC: 230; [Ca++]: 389; [Mg++]: 51.9 (Musila et al., 2005)
Plant community Celtis mildbraedii – Craibia brownii (Althof, 2005)
Succession stage middle-aged secondary (Althof, 2005) No. of plant species 163 (Evenness via Shannon-Wiener: 0.79) (Althof, 2005) Forest in buffer zones in concentric circles around study site mid points
85.71/68.57 % (100 m buffer northern/southern study site); 81.86/69.01 % (500 m buffer northern/southern study site); 76.74/55.62 % (1,000 m buffer northern/southern study site); 67.32/45.5 % (2,000 m buffer northern/southern study site (G. Schaab, pers. comm.)
Observed species
Acanthopale pubescens (southern study site); Acanthus eminens (northern study site); Heinsenia diervilleoides (southern study site); Dracaena fragrans (southern study site)
Study area 16 ______________________________________________________________________
4.2.2 Forest fragments study sites Malava Forest Table 6: Characterization of the Malava forest fragment
Location northern forest fragment (Fig. 5) Size 113 ha (Lung & Schaab, 2004) Management regime Forest Department (FD) Protection status Forest Reserve
Disturbance history
1910: definitely isolated from other forests, probably happened much earlier; 1940: FD records show start of intense logging (Mitchell 2004) 1980: decrease in near-natural forest and secondary forest the 1980s: forest plantations and bushed areas observed 2002: forest plantations disappeared in the most northern part and bushed area is used for agriculture again today: two fragments (Lung & Schaab, 2004)
Cut trees 9.2 per ha (Bleher et al., 2005) Paths 8.8 per ha (Bleher et al., 2005) Humidity 67.2 % (Althof, 2005) Soil classification Haplic Ferrasols (Musila et al., 2005)
Chemical properties of soil (A-horizon)
pH-value: 5.8; C/N ratio: 7; exchangeable bases in mmolc•kg-1 : CEC: 230; [Ca++]: 329; [Mg++]: 28.5 (Musila et al., 2005)
Plant community disturbed Deinbollia kilimandscharica – Markhamia lutea (Althof, 2005)
Succession stage logged + planted forest (Althof, 2005) No. of plant species 115 (Evenness via Shannon-Wiener: 0.749) (Althof, 2005) Forest in buffer zones in concentric circles around study site mid points
79.41 % (100 m buffer); 32.99 % (500 m buffer); 20.54 % (1,000 m buffer); 15.15 % (2,000 m buffer) (G. Schaab, pers. comm.).
Observed species Heinsenia diervilleoides [Rubiaceae]
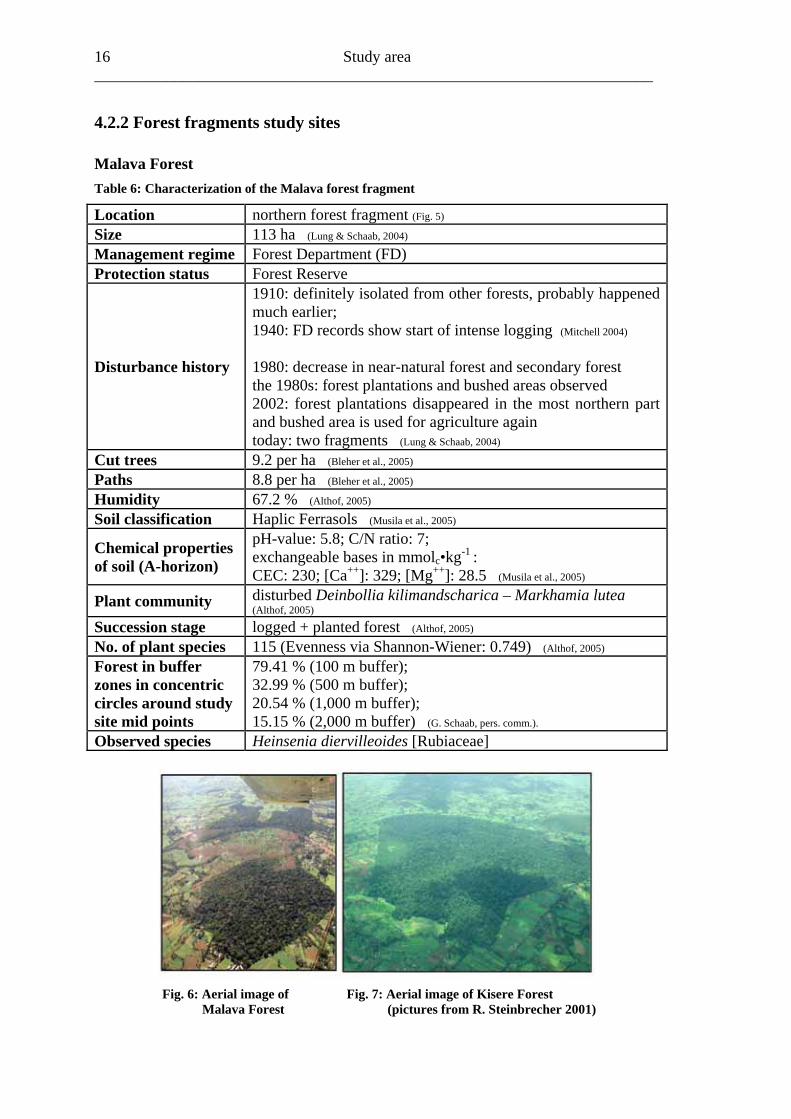
Fig. 6: Aerial im g. 7: Aerial image of Kisere Forest
a
age of Fi Malav Forest (pictures from R. Steinbrecher 2001)
Study area 17
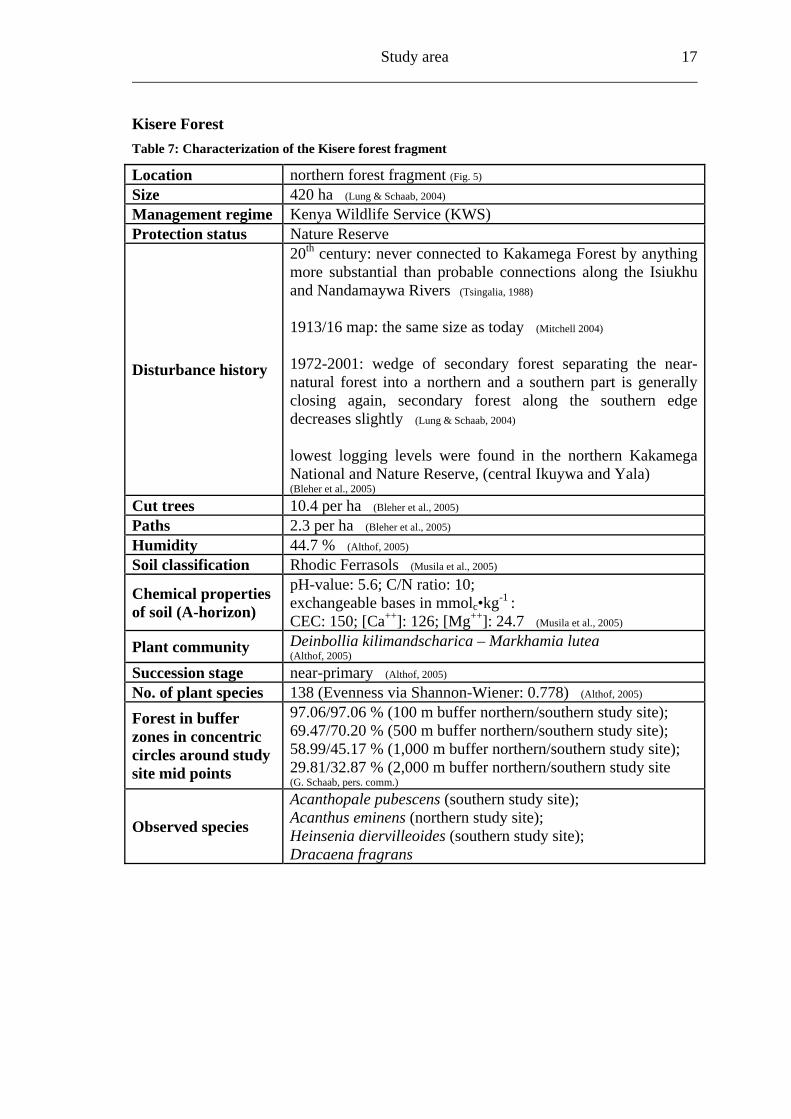
Kisere Forest Table 7: Characterization o
Location
f the Kisere forest fragment
northern forest fragment (Fig. 5) Size 420 ha (Lung & Schaab, 2004) Management regime Kenya Wildlife Service (KWS) Protection status Nature Reserve
Disturbance history
0 century: never connected to Kakamega Forest by anything
as today (Mitchell 2004)
of secondary forest separating the near- a southern part is generally
rest along the southern edge
rn Kakamega d Nature Reserve, (central Ikuywa and Yala)
2 th
more substantial than probable connections along the Isiukhu and Nandamaywa Rivers (Tsingalia, 1988) 1913/16 map: the same size 1972-2001: wedge natural forest into a northern andclosing again, secondary fodecreases slightly (Lung & Schaab, 2004) lowest logging levels were found in the northeNational an(Bleher et al., 2005)
Cut trees 10.4 per ha (Bleher et al., 2005) Paths 2.3 per ha (Bleher et al., 2005) Humidity 44.7 % (Althof, 2005) Soil classification Rhodic Ferrasols (Musila et al., 2005)
Chemical properties of soil (A-horizon)
2005)
pH-value: 5.6; C/N ratio: 10; -1 exchangeable bases in mmolc•kg :
CEC: 150; [Ca++]: 126; [Mg++]: 24.7 (Musila et al.,
Plant community Deinbollia kilimandscharica – Markhamia lute(Althof, 2005)
a
Succession stage near-primary (Althof, 2005)
No. of plant species 138 (Evenness via Shannon-Wiener: 0.778) (Althof, 2005) Forest in buffer zones in concentric circles around study site mid points
97.06/97.06 % (100 m buffer northern/southern study site); 69.47/70.20 % (500 m buffer northern/southern study site); 58.99/45.17 % (1,000 m buffer northern/southern study site); 29.81/32.87 % (2,000 m buffer northern/southern study site (G. Schaab, pers. comm.)
Observed species
Acanthopale pubescens (southern study site); Acanthus eminens (northern study site); Heinsenia diervilleoides (southern study site); Dracaena fragrans

Study area 18 ______________________________________________________________________ Ikuywa Forest Table 8: Characterization of the Ikuywa Forest fragment
Location southern forest fragment (Fig. 5) Size 1,370 ha (Lung & Schaab, 2004) Management regime Forest Department (FD) Protection status Forest Reserve
Disturbance history 1913/16 map: shows the same eastern forest border; 1959 map: shows that a patch south and west of Ikuywa was connected to the Kakamega Forest; before the late 1950’s: Ikuywa was not logged (Mitchell 2004)
1972-2001: small changes in the north, 2001: a stronger share of bushes in the forest along the southern edge of the forest (Lung & Schaab, 2004) 1979: the narrow connection between the Yala and Ikuywa forests was all but lost (Brooks et al., 1999)
lowest logging levels were found in central Ikuywa, (the northern Kakamega National and Nature Reserve and Yala) (Bleher et al., 2005)
Cut trees 3.8 per ha (Bleher et al., 2005) Paths 10.8 per ha (Bleher et al., 2005) Humidity 57.8 % (Althof, 2005) Soil classification Haplic Phaeozems (Musila et al., 2005) Chemical properties of soil (A-horizon)
pH-value: 5.7; C/N ratio: 8; exchangeable bases in mmolc•kg-1 : CEC: 200; [Ca++]: 255; [Mg++]: 32.2 (Musila et al., 2005)
Plant community Celtis mildbraedii – Craibia brownii (Althof, 2005)
Succession stage middle-aged secondary (Althof, 2005) No. of plant species 122 (Evenness via Shannon-Wiener: 0.718) (Althof, 2005) Forest in buffer zones in concentric circles around study site mid points
97.14 % (100 m buffer); 66.05 % (500 m buffer); 50.74 % (1,000 m buffer); 33.14 % (2,000 m buffer) (G. Schaab, pers. comm.)
Observed species Acanthopale pubescens; Acanthus eminens; Dracaena fragrans
Study area 19
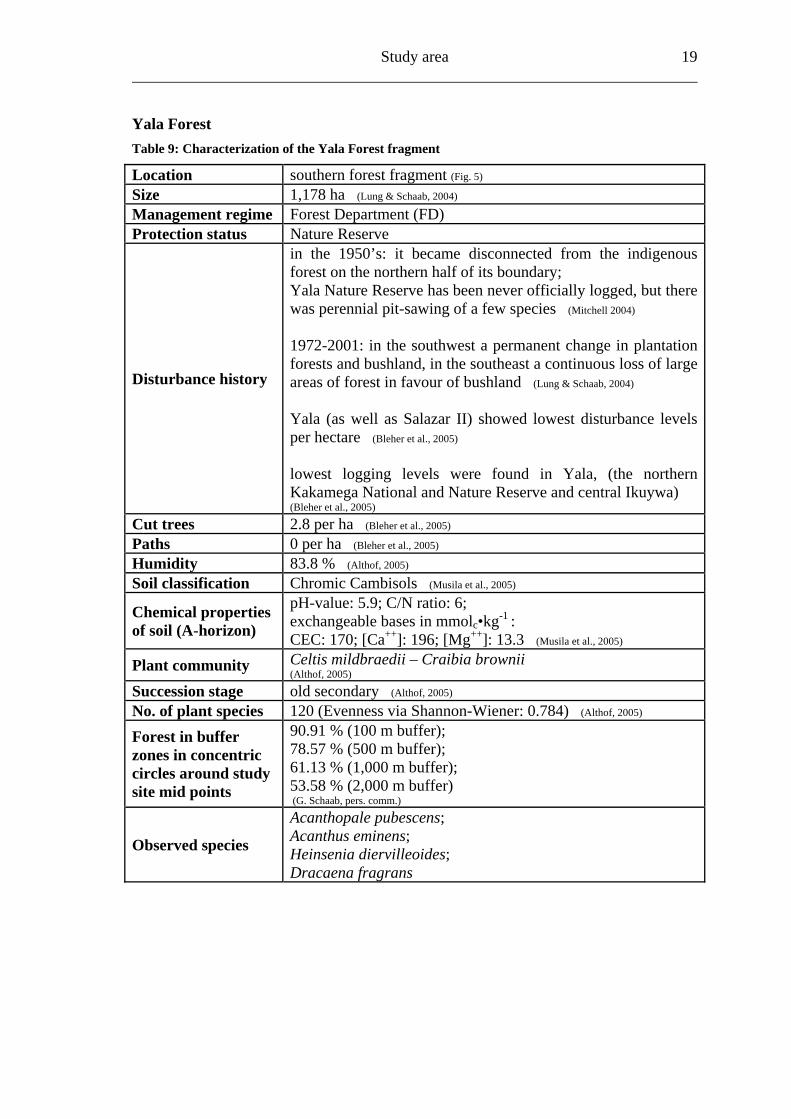
Yala Forest Table 9: Characterization of the Yala Forest fragment
Location southern forest fragment (Fig. 5) Size 1,178 ha (Lung & Schaab, 2004) Management regime Forest Department (FD) Protection status Nature Reserve
Disturbance history
in the 1950’s: it became disconnected from the indigenous forest on the northern half of its boundary; Yala Nature Reserve has been never officially logged, but there was perennial pit-sawing of a few species (Mitchell 2004)
1972-2001: in the southwest a permanent change in plantation forests and bushland, in the southeast a continuous loss of large areas of forest in favour of bushland (Lung & Schaab, 2004)
Yala (as well as Salazar II) showed lowest disturbance levels per hectare (Bleher et al., 2005) lowest logging levels were found in Yala, (the northern Kakamega National and Nature Reserve and central Ikuywa) (Bleher et al., 2005)
Cut trees 2.8 per ha (Bleher et al., 2005) Paths 0 per ha (Bleher et al., 2005) Humidity 83.8 % (Althof, 2005) Soil classification Chromic Cambisols (Musila et al., 2005)
Chemical properties of soil (A-horizon)
pH-value: 5.9; C/N ratio: 6; exchangeable bases in mmolc•kg-1 : CEC: 170; [Ca++]: 196; [Mg++]: 13.3 (Musila et al., 2005)
Plant community Celtis mildbraedii – Craibia brownii (Althof, 2005)
Succession stage old secondary (Althof, 2005) No. of plant species 120 (Evenness via Shannon-Wiener: 0.784) (Althof, 2005) Forest in buffer zones in concentric circles around study site mid points
90.91 % (100 m buffer); 78.57 % (500 m buffer); 61.13 % (1,000 m buffer); 53.58 % (2,000 m buffer) (G. Schaab, pers. comm.)
Observed species
Acanthopale pubescens; Acanthus eminens; Heinsenia diervilleoides; Dracaena fragrans
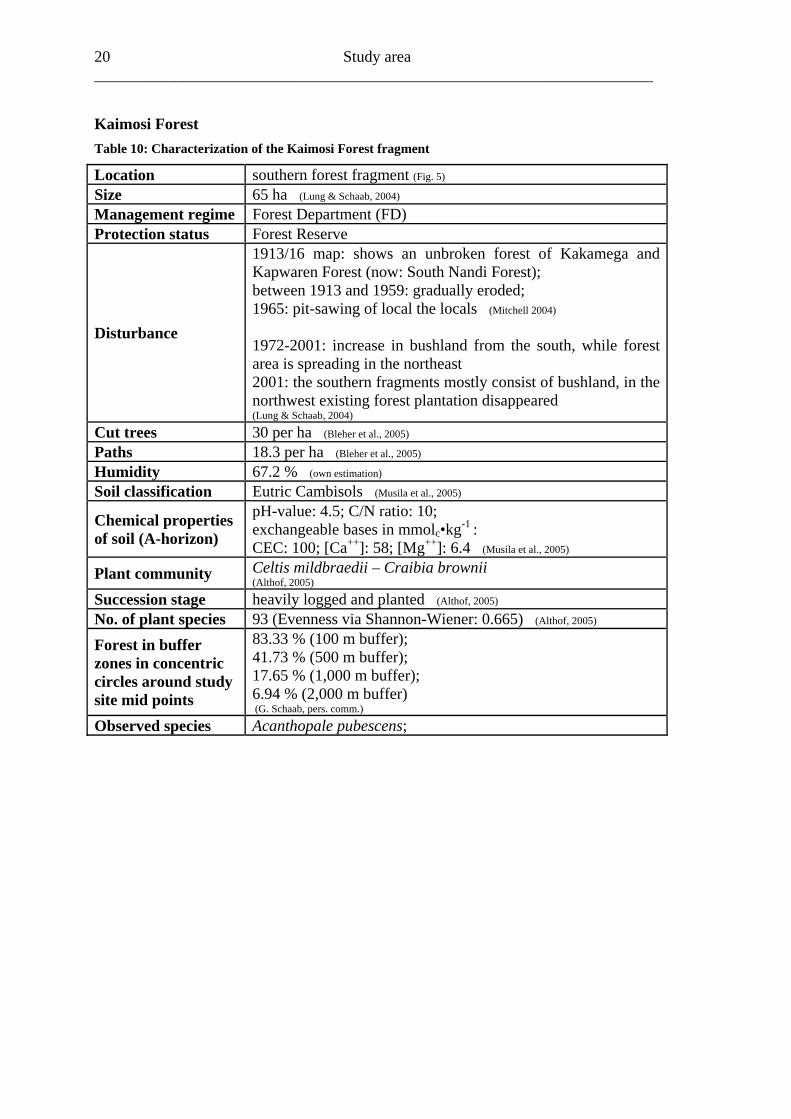
Study area 20 ______________________________________________________________________ Kaimosi Forest Table 10: Characterization of the Kaimosi Forest fragment
Location southern forest fragment (Fig. 5) Size 65 ha (Lung & Schaab, 2004) Management regime Forest Department (FD) Protection status Forest Reserve
Disturbance
1913/16 map: shows an unbroken forest of Kakamega and Kapwaren Forest (now: South Nandi Forest); between 1913 and 1959: gradually eroded; 1965: pit-sawing of local the locals (Mitchell 2004) 1972-2001: increase in bushland from the south, while forest area is spreading in the northeast 2001: the southern fragments mostly consist of bushland, in the northwest existing forest plantation disappeared (Lung & Schaab, 2004)
Cut trees 30 per ha (Bleher et al., 2005) Paths 18.3 per ha (Bleher et al., 2005) Humidity 67.2 % (own estimation) Soil classification Eutric Cambisols (Musila et al., 2005)
Chemical properties of soil (A-horizon)
pH-value: 4.5; C/N ratio: 10; exchangeable bases in mmolc•kg-1 : CEC: 100; [Ca++]: 58; [Mg++]: 6.4 (Musila et al., 2005)
Plant community Celtis mildbraedii – Craibia brownii (Althof, 2005)
Succession stage heavily logged and planted (Althof, 2005) No. of plant species 93 (Evenness via Shannon-Wiener: 0.665) (Althof, 2005) Forest in buffer zones in concentric circles around study site mid points
83.33 % (100 m buffer); 41.73 % (500 m buffer); 17.65 % (1,000 m buffer); 6.94 % (2,000 m buffer) (G. Schaab, pers. comm.)
Observed species Acanthopale pubescens;
Material and methods 21
5. Material and methods
“The primary technique of pollination ecology […] is the same today as in Sprengel’s or Darwin’s days: consistent observation of what really happens in nature, in the original, natural habitat of the plant under investigation.” (Faegri & van der Pijl, 1979)
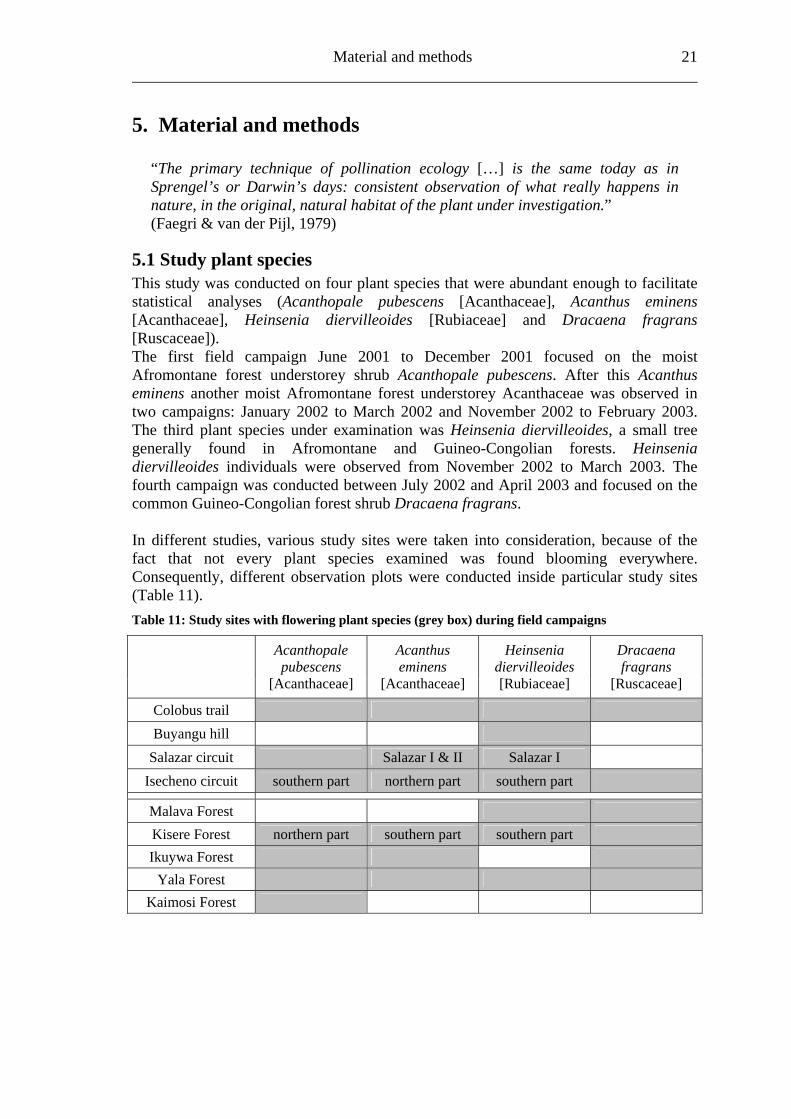
5.1 Study plant species This study was conducted on four plant species that were abundant enough to facilitate statistical analyses (Acanthopale pubescens [Acanthaceae], Acanthus eminens [Acanthaceae], Heinsenia diervilleoides [Rubiaceae] and Dracaena fragrans [Ruscaceae]). The first field campaign June 2001 to December 2001 focused on the moist Afromontane forest understorey shrub Acanthopale pubescens. After this Acanthus eminens another moist Afromontane forest understorey Acanthaceae was observed in two campaigns: January 2002 to March 2002 and November 2002 to February 2003. The third plant species under examination was Heinsenia diervilleoides, a small tree generally found in Afromontane and Guineo-Congolian forests. Heinsenia diervilleoides individuals were observed from November 2002 to March 2003. The fourth campaign was conducted between July 2002 and April 2003 and focused on the common Guineo-Congolian forest shrub Dracaena fragrans. In different studies, various study sites were taken into consideration, because of the fact that not every plant species examined was found blooming everywhere. Consequently, different observation plots were conducted inside particular study sites (Table 11). Table 11: Study sites with flowering plant species (grey box) during field campaigns
Acanthopale pubescens
[Acanthaceae]
Acanthus eminens
[Acanthaceae]
Heinsenia diervilleoides [Rubiaceae]
Dracaena fragrans
[Ruscaceae]
Colobus trail Buyangu hill
Salazar circuit Salazar I & II Salazar I Isecheno circuit southern part northern part southern part
Malava Forest Kisere Forest northern part southern part southern part Ikuywa Forest
Yala Forest Kaimosi Forest
22 Material and methods ______________________________________________________________________
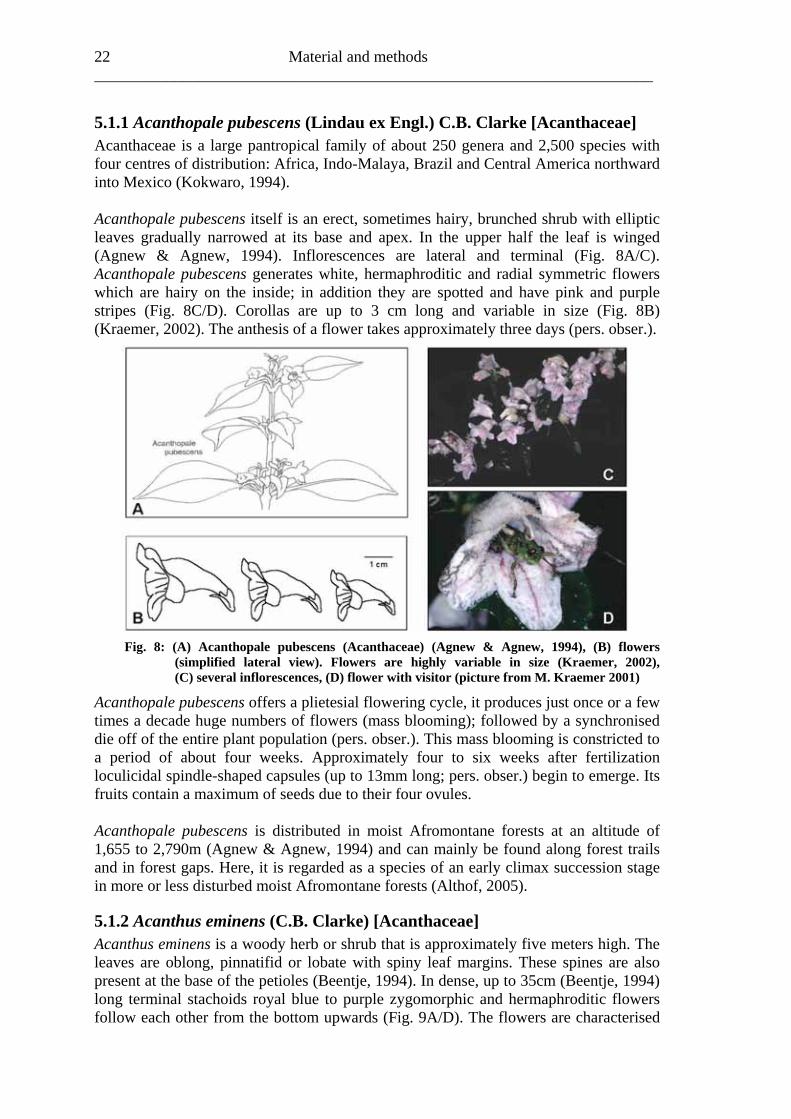
5.1.1 Acanthopale pubescens (Lindau ex Engl.) C.B. Clarke [Acanthaceae] Acanthaceae is a large pantropical family of about 250 genera and 2,500 species with four centres of distribution: Africa, Indo-Malaya, Brazil and Central America northward into Mexico (Kokwaro, 1994). Acanthopale pubescens itself is an erect, sometimes hairy, brunched shrub with elliptic leaves gradually narrowed at its base and apex. In the upper half the leaf is winged (Agnew & Agnew, 1994). Inflorescences are lateral and terminal (Fig. 8A/C). Acanthopale pubescens generates white, hermaphroditic and radial symmetric flowers which are hairy on the inside; in addition they are spotted and have pink and purple stripes (Fig. 8C/D). Corollas are up to 3 cm long and variable in size (Fig. 8B) (Kraemer, 2002). The anthesis of a flower takes approximately three days (pers. obser.).
Fig. 8: (A) Acanthopale pubescens (Acanthaceae) (Agnew & Agnew, 1994), (B) flowers (simplified lateral view). Flowers are highly variable in size (Kraemer, 2002), (C) several inflorescences, (D) flower with visitor (picture from M. Kraemer 2001)
Acanthopale pubescens offers a plietesial flowering cycle, it produces just once or a few times a decade huge numbers of flowers (mass blooming); followed by a synchronised die off of the entire plant population (pers. obser.). This mass blooming is constricted to a period of about four weeks. Approximately four to six weeks after fertilization loculicidal spindle-shaped capsules (up to 13mm long; pers. obser.) begin to emerge. Its fruits contain a maximum of seeds due to their four ovules. Acanthopale pubescens is distributed in moist Afromontane forests at an altitude of 1,655 to 2,790m (Agnew & Agnew, 1994) and can mainly be found along forest trails and in forest gaps. Here, it is regarded as a species of an early climax succession stage in more or less disturbed moist Afromontane forests (Althof, 2005).
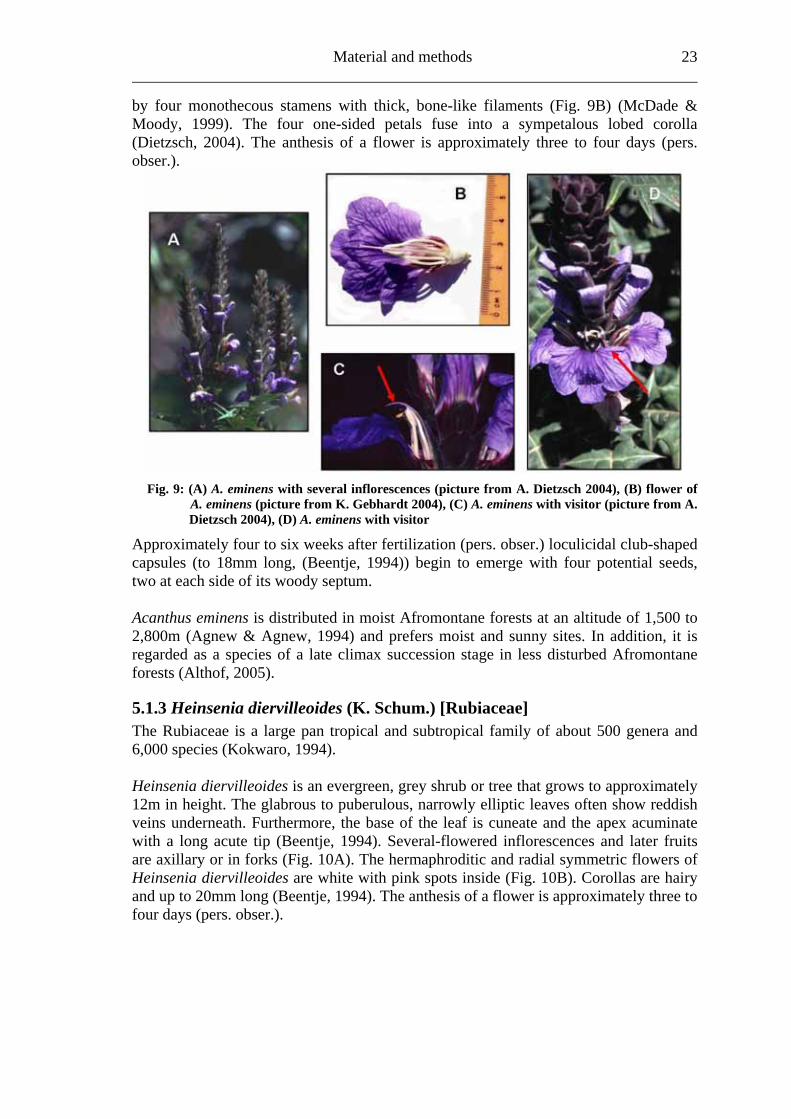
5.1.2 Acanthus eminens (C.B. Clarke) [Acanthaceae] Acanthus eminens is a woody herb or shrub that is approximately five meters high. The leaves are oblong, pinnatifid or lobate with spiny leaf margins. These spines are also present at the base of the petioles (Beentje, 1994). In dense, up to 35cm (Beentje, 1994) long terminal stachoids royal blue to purple zygomorphic and hermaphroditic flowers follow each other from the bottom upwards (Fig. 9A/D). The flowers are characterised
Material and methods 23
by four monothecous stamens with thick, bone-like filaments (Fig. 9B) (McDade & Moody, 1999). The four one-sided petals fuse into a sympetalous lobed corolla (Dietzsch, 2004). The anthesis of a flower is approximately three to four days (pers. obser.).
Fig. 9: (A) A. eminens with several inflorescences (picture from A. Dietzsch 2004), (B) flower of A. eminens (picture from K. Gebhardt 2004), (C) A. eminens with visitor (picture from A. Dietzsch 2004), (D) A. eminens with visitor
Approximately four to six weeks after fertilization (pers. obser.) loculicidal club-shaped capsules (to 18mm long, (Beentje, 1994)) begin to emerge with four potential seeds, two at each side of its woody septum. Acanthus eminens is distributed in moist Afromontane forests at an altitude of 1,500 to 2,800m (Agnew & Agne
w, 1994) and prefers moist and sunny sites. In addition, it is regarded as a species of a late climax succession stage in less disturbed Afromontane forests (Althof, 2005).
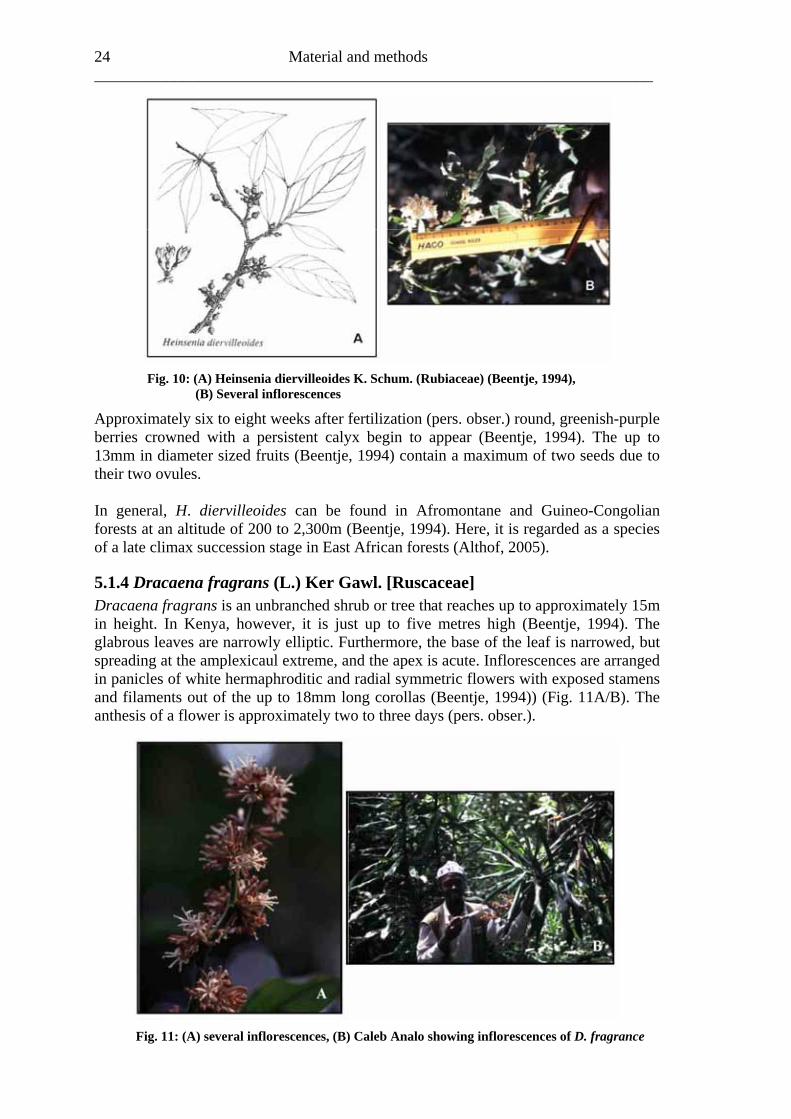
5.1.3 Heinsenia diervilleoides (K. Schum.) [Rubiaceae] The Rubiaceae is a large pan tropical and subtropical family of about 500 genera and 6,000 species (Kokwaro, 1994). Heinsenia diervilleoides is an evergreen, grey shrub or tree that grows to approximately 12m in height. The glabrous to puberulous, narrowly elliptic leaves often show reddish veins underneath. Furthermore, the base of the leaf is cuneate and the apex acuminate with a long acute tip (Beentje, 1994). Several-flowered inflorescences and later fruits are axillary or in forks (Fig. 10A). The hermaphroditic and radial symmetric flowers of Heinsenia diervilleoides are white with pink spots inside (Fig. 10B). Corollas are hairy and up to 20mm long (Beentje, 1994). The anthesis of a flower is approximately three to four days (pers. obser.).
24 Material and methods ______________________________________________________________________
Fig. 10: (A) Heinsenia diervilleoides K. Schum. (Rubiaceae) (Beentje, 1994), (B) Several inflorescences
Approximately six to eight weeks after fertilization (pers. obser.) round, greenish-purple berries crowned with a persistent calyx begin to appear (Beentje, 1994). The up to
3mm in1 diameter sized fruits (Beentje, 1994) contain a maximum of two seeds due to
it is regarded as a species e in East African forests (Althof, 2005).
ranched shrub or tree that reaches up to approximately 15m
s of white hermaphroditic and radial symmetric flowers with exposed stamens
their two ovules. In general, H. diervilleoides can be found in Afromontane and Guineo-Congolian forests at an altitude of 200 to 2,300m (Beentje, 1994). Here, of a late climax succession stag
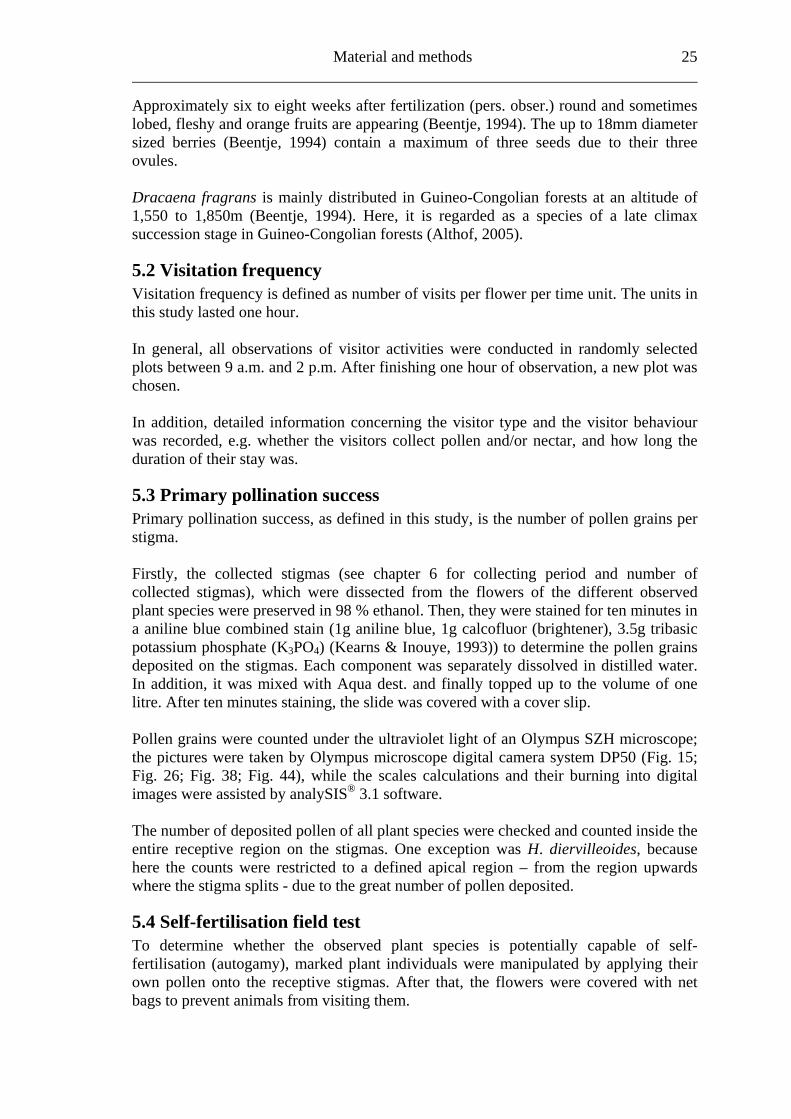
5.1.4 Dracaena fragrans (L.) Ker Gawl. [Ruscaceae] Dracaena fragrans is an unbin height. In Kenya, however, it is just up to five metres high (Beentje, 1994). The glabrous leaves are narrowly elliptic. Furthermore, the base of the leaf is narrowed, but spreading at the amplexicaul extreme, and the apex is acute. Inflorescences are arranged in panicleand filaments out of the up to 18mm long corollas (Beentje, 1994)) (Fig. 11A/B). The anthesis of a flower is approximately two to three days (pers. obser.).
Fig. 11: (A) several inflorescences, (B) Caleb Analo showing inflorescences of D. fragrance
Material and methods 25
5.2 Visitation frequency mber of visits per flower per time unit. The units in
ation, a new plot was hosen.
rded, e.g. whether the visitors collect pollen and/or nectar, and how long the duration of their stay was.
r ten minutes in aniline blue combined stain (1g aniline blue, 1g calcofluor (brightener), 3.5g tribasic
potassium phosphate (K3PO4) (Kearns & Inouye, 1993)) to determine the pollen grains deposited on the stigmas. Each component was s iss lved distilled water. In addition, it was mixed with Aqua dest. and finally topped up to the volume of one
into digital ages were assisted by analySIS® 3.1 software.
eat number of pollen deposited.
t
Approximately six to eight weeks after fertilization (pers. obser.) round and sometimes lobed, fleshy and orange fruits are appearing (Beentje, 1994). The up to 18mm diameter sized berries (Beentje, 1994) contain a maximum of three seeds due to their three ovules. Dracaena fragrans is mainly distributed in Guineo-Congolian forests at an altitude of 1,550 to 1,850m (Beentje, 1994). Here, it is regarded as a species of a late climax succession stage in Guineo-Congolian forests (Althof, 2005).
Visitation frequency is defined as nuthis study lasted one hour. In general, all observations of visitor activities were conducted in randomly selected plots between 9 a.m. and 2 p.m. After finishing one hour of observc In addition, detailed information concerning the visitor type and the visitor behaviour was reco
5.3 Primary pollination success Primary pollination success, as defined in this study, is the number of pollen grains per stigma. Firstly, the collected stigmas (see chapter 6 for collecting period and number of collected stigmas), which were dissected from the flowers of the different observed plant species were preserved in 98 % ethanol. Then, they were stained foa
eparately d o in
litre. After ten minutes staining, the slide was covered with a cover slip. Pollen grains were counted under the ultraviolet light of an Olympus SZH microscope; the pictures were taken by Olympus microscope digital camera system DP50 (Fig. 15; Fig. 26; Fig. 38; Fig. 44), while the scales calculations and their burningim The number of deposited pollen of all plant species were checked and counted inside the entire receptive region on the stigmas. One exception was H. diervilleoides, because here the counts were restricted to a defined apical region – from the region upwards where the stigma splits - due to the gr
5.4 Self-fertilisation field tesTo determine whether the observed plant species is potentially capable of self-fertilisation (autogamy), marked plant individuals were manipulated by applying their own pollen onto the receptive stigmas. After that, the flowers were covered with net bags to prevent animals from visiting them.
26 Material and methods ______________________________________________________________________
hus, at least three individual flowers were tested (Acanthopale pubescens (n=9), aena fragrans
=9)).
TAcanthus eminens (n=10), Heinsenia diervilleoides (n=3) and Drac(n
5.5 Fruit set and seed set The terms “pollination efficiency” and “pollination success” have been used in different ways by different researchers (Kearns & Inouye, 1993). In this study seed and fruit set are defined as indicators for pollination success. After collecting the fruits, its fruit set was ca ulalc ted by dividing harvested fruits by potential fruits (counted flowers). After that, the seed set was determined by dividing counted seeds per fruit by potential ovules of the specific plant species:
fruitspotentialfruitsharvestedsetfruit = ;
ovulespotentialseedcountedsetseed = . s
cy of flower visits, primary pollination success, fruit and seed set).
d flowers
order to test potential plant abundance effects.
ant species on different levels of pollination.
ersity
5.6 Considered biotic factors Apart from the “number of observed flowers”, the following biotic factors were considered in the statistics of each campaign on different levels of pollination (frequen Number of observeAll intraspecific flowers were counted in each observation plot related to every observation unit, verifying the potential influence of intraspecific flower quantity on the visitation frequency. Acanthopale pubescens, Acanthus eminens and Heinsenia diervilleoides flowers were counted. Abundance of the plant species Plant individuals of Acanthopale pubescens and Acanthus eminens were conducted in transects of 100m in length and about 4m in width inside all study sites (M. Kraemer, pers. comm.). In contrast, H. diervilleoides and D. fragrans plant counts were carried out in 10x10m relevés inside every forest fragment (Althof, 2005), but in each case the final abundance of the plant species resulted in an average value calculation on study site level. These data were used in Plant species richness Within the framework of vegetation surveys by Althof (2005) species lists of trees, shrubs and climbers of all forest fragments were generated. These varying number of plant species inside all forest fragments were used for finding potential impacts of the richness of pl Shannon-Wiener index of species div ( 'H )
ere Shannon’s evenness (EH) was considered and calculated by dividing
Apart from the number of plant species, the α-diversity calculations with the aid of Shannon-Wiener function and Shannon’s evenness (EH) were available (Althof, 2005) to analyse possible correlations between plant species diversity and collected data. H 'H by 'H max
between 0 and 1 with 1 indicating the complete evenness. that assumes a value
Material and methods 27
rest fragment) study sites to test all data on potential forest fragmentation ffects.
ercentage of forest in a defined buffer zone (=circumferences) n the basis of a LANDSAT 7 (ETM+) satellite image (band combination 5/4/3,
contrast enhanced) of Kakamega Forest of February 5, 2001, land cover was interpreted by digital image processing with ArcGIS® 8.x (Lung & Schaab, 2004) in concentric circles around study site mid points by Schaab. Inside the 100m, 500m, 1,000m and 2,000m buffers the percentage of forest cover was determined in order to analyse potential edge effects. Cut trees per hectare In an assessment of the threat status and the management effectiveness in the Kakamega Forest, disturbance surveys were carried out at 22 forest sites (Bleher et al., 2005). Here trail transects were run at least 1,000m in length recording disturbance parameters, like logged trees, in a belt of 10m on each side of the transects. The total number of logged trees per hectare was integrated in this thesis statistics to analyse the effect of logging disturbance.
5.7 Considered abiotic factors Apart from “temperature and cloudiness” and “pH-value, C/N ratio, Cation Exchange Capacity (CEC), [Ca++], [Mg++]” all of the following abiotic factors were considered in the statistics concerning the different levels of pollination (frequency of flower visits, primary pollination success, fruit and seed set) for all examined plant species. Management type The Kakamega Forest and its peripheral fragments are managed under the authority of both the Forest Department (FD) and the Kenya Wildlife Service (KWS) on behalf of the state. This allowed analysing a potential influence of different management regimes (Fig. 4). Protection status Kakamega Forest and its five surrounding fragments are partly a Forest Reserve, partly a Nature Reserve and partly a National Reserve (Fig. 4). This study distinguishes between sites with high protection priority, i.e. National or Nature Reserves and sites with low protection priority, i.e. Forest Reserves. Consequently, all data was analysed concerning a potential forest protection impact.
Fragmentation (direct factor) The forest remnants were categorised into main forest fragment study sites (subsequently called: main forest) and surrounding forest fragment (subsequently called: foe Succession stages Categorisations of the Kakamega Forest fragments in different succession stages (near-primary, old secondary, middle-aged secondary, young secondary and heavily logged and planted) were also available (Althof, 2005) for testing the influence of succession on the different levels of pollination . PO
28 Material and methods ______________________________________________________________________ Size of forest fragments On the basis of a LANDSAT 7 (ETM+) satellite image (band combination 5/4/3, contrast enhanced) of the Kakamega Forest February 5, 2001, the size of all forest areas were visually interpreted Schaab (2004). This interpretation allowed testing the fragment size as an interfering factor. North-south gradient Representing a potential microclimatic factor of the Kakamega Forest region, a north-south gradient was included in this study. Here, the forest fragments were numbered consecutively southwards. Paths per hectare As an indicator of human disturbance, paths per hectare in each forest fragment were integrated in this study. Here, trail transect walks of at least 1,000 m in length, were conducted recording all crossing paths (Bleher et al., 2005). Humidity Humidity was measured by two types of Gemini® data loggers: Tinytag Plus (air temperature and humidity) and Tinytalk (humidity), while data was recorded every hour inside all study sites with exception of the Kaimosi forest fragment (Althof, 2005). Due to the correlation between measured humidity and environment conditions, the average humidity of the similar structured Malava forest fragment was assumed. (“The more open a canopy was and the more sunlight could reach the ground, the lower was the measured humidity” (Althof, 2005)). Temperature and cloudiness Observations of visitors’ activities were conducted in randomly selected plots between 9 a.m. and 2 p.m.. Thus, the temperature was measured every hour with a mercury thermometer, while the cloudiness was estimated in eighths. The average temperature and average cloudiness of all units in each study site was used for analysing potential relations between visitation frequency, temperature and cloudiness, respectively. pH-value, C/N ratio, Cation Exchange Capacity (CEC), [Ca++], [Mg++] In all study sites one pit was excavated to up about 2 m and described according to standard procedures of the Food and Agriculture Organization (FAO) Guidelines for soil profile descriptions (FAO, 1977). The soil horizons were identified and analysed by W. Musila with the help of the Kenya Soil Survey (Musila et al., 2005). In this study A-horizon values were considered. Regarding visitation frequency and primary pollination success, the pH-value and the C/N ratio were tested. With reference to fruit and seed set all available soil parameters were considered.
5.8 Statistics In general, Cane (2001) annotate a lack of universal and satisfying strategies for meaningful, insightful, and flexible statistical analyses in fragmentation studies. In this study the received data was listed with Microsoft® Excel 2000 and analysed with SPSS® 12.0 for Windows®. All results of different levels of pollination (frequency of flower visits, primary pollination success, fruit and seed set), separated into plant species, were tested on the assumption of normal distribution by the Kolmogorov-Smirnov goodness-of-fit test on
Material and methods 29
study site level. Although not all data on study site level showed a standard normal distribution, they were treated so here in parametric methods, due to the biological presumptions of these ecological processes (Underwood, 1997). Varieties between the grouped main forest and forest fragment study sites and the D. fragrans covering experiment were tested by one-way analysis of variance (ANOVA). In a Pearson correlation analysis the potential influence of the measured biotic and abiotic factors on the different levels of pollination were tested (see Appendices). Factors showing a significant correlation (α ≤ 0.05) were tested for multi-collinearity by a linear regressions analysis (Backhaus et al., 2003). In the case of R2 ≥ 0.7 factors were considered redundant. Finally, all remaining factors were tested in a backward multiple regressions (variables were successively removed from the model, if the significance level of the parameter estimate was higher than p = 0.10). Significant correlations (p ≤ 0.05) were indicated with one star (*) and highly significant correlations (p ≤ 0.01) respectively with two stars (**). In the interest of a better descriptiveness, the data was presented in box plots (a box around 50% of the data and lines from the minimum to the first quartile and from the maximum to the third quartile; black bar indicates 50% percentile = median). Exceptions were diagrams concerning seed sets; due to their narrow margin of data scale error bars were used.
30 Results ______________________________________________________________________
6. Results The results are listed separately for each plant species (Acanthopale pubescens [Acanthaceae], Acanthus eminens [Acanthaceae], Heinsenia diervilleoides [Rubiaceae] and Dracaena fragrans [Ruscaceae]). Furthermore, they are subdivided into the different levels of pollination (frequency of flower visits, primary pollination success, fruit and seed set).
6.1 Acanthopale pubescens [Acanthaceae]
6.1.3 Visitation frequency During the 254 hours of observation between the June 28 and the August 9, 2001, it became evident that the mainly white flowers of A. pubescens were attractive for a variety of insects. In total, 656 visitors were counted on 30,722 observed flowers during 254 observation units. This study was conducted in three main forest (Colobus trail, Salazar and Isecheno) and four forest fragment (Kisere, Ikuywa, Yala and Kaimosi) sites. The most probable pollinator of A. pubescens appeared to be honey bees (Apis mellifera) due to their size and the permanent contact with stigmas inside the flowers. Therefore, smaller bees like halictids and different sized butterflies will not be considered in the following statistics. Approximately 80% (542) of the flower visitors were honey bees. Even so, the share of honey bee visits differed between 42% (33 of 79) at Salazar to 100% (40 of 40) in Isecheno. In 23.6% (60) of all observation units no honey bee visits at all were detected (Table 12).
Table 12: Observation units without honey bee visits (A. pubescens)
Study site % of units without honey bee visit
Number of units (units without honey
bee visit/ all units) Colobus trail 19.6 9/46
Salazar 26.5 9/34 Isecheno 37 10/27 Kisere 9.3 5/54 Ikuywa 23.5 8/34
Yala 40.5 15/37 Kaimosi 18.2 4/22
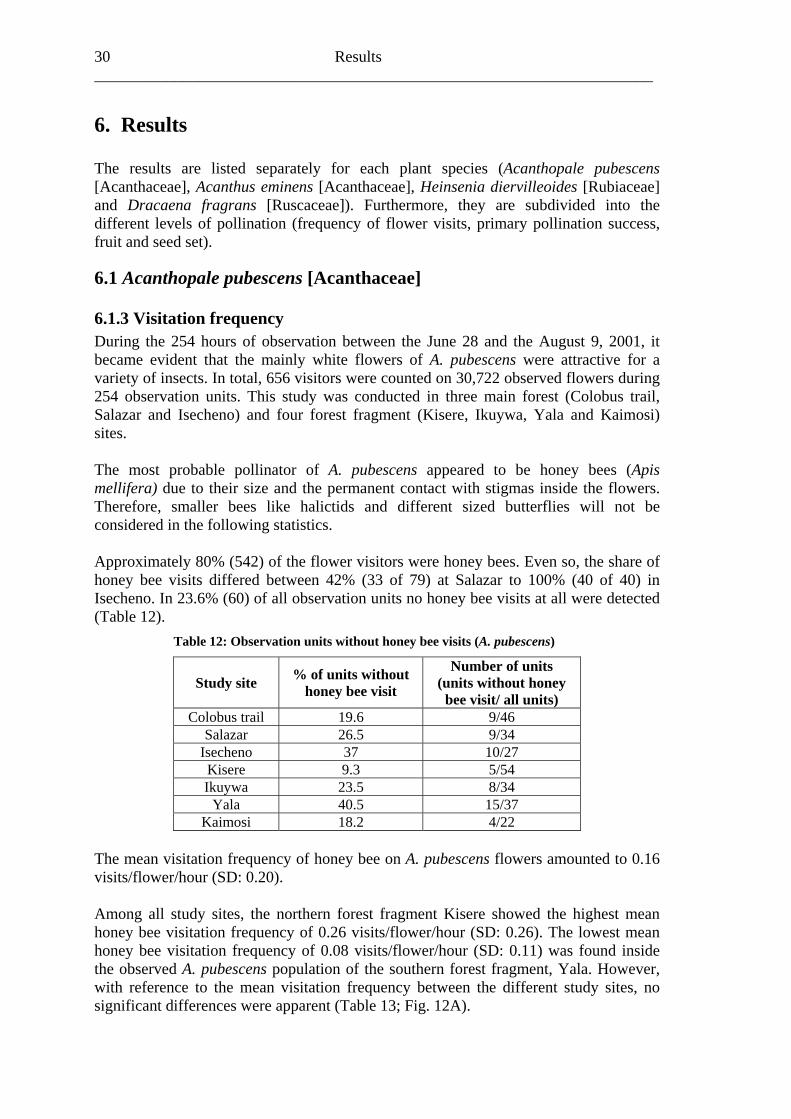
The mean visitation frequency of honey bee on A. pubescens flowers amounted to 0.16 visits/flower/hour (SD: 0.20). Among all study sites, the northern forest fragment Kisere showed the highest mean honey bee visitation frequency of 0.26 visits/flower/hour (SD: 0.26). The lowest mean honey bee visitation frequency of 0.08 visits/flower/hour (SD: 0.11) was found inside the observed A. pubescens population of the southern forest fragment, Yala. However, with reference to the mean visitation frequency between the different study sites, no significant differences were apparent (Table 13; Fig. 12A).
Results 31
Table 13: Mean visitation frequencies (A. pubescens)
Study site Visitation frequency
Standard deviation
(SD) Colobus trail 0.19 0.26
Salazar 0.08 0.09 Isecheno 0.11 0.17 Kisere 0.26 0.26 Ikuywa 0.12 0.12
Yala 0.08 0.11 Kaimosi 0.18 0.17
When comparing main forest (0.14 visits/flower/hour/ SD: 0.20) with forest fragment (0.17 visits/flower/hour/ SD: 0.20), a slightly (p=0.177) higher visitation frequency in main forest plots is evident (Fig. 12B).
Fig. 12: Visitation frequencies on A. pubescens by honey bees (Apis mellifera) (box plots): (A) in three main forest (left of the dashed line) and four forest fragment study sites (right of the dashed line) arranged from north to south, (B) grouped in main forest (3) and forest fragment (4) study sites [(B) tested for differences by one-way ANOVA]
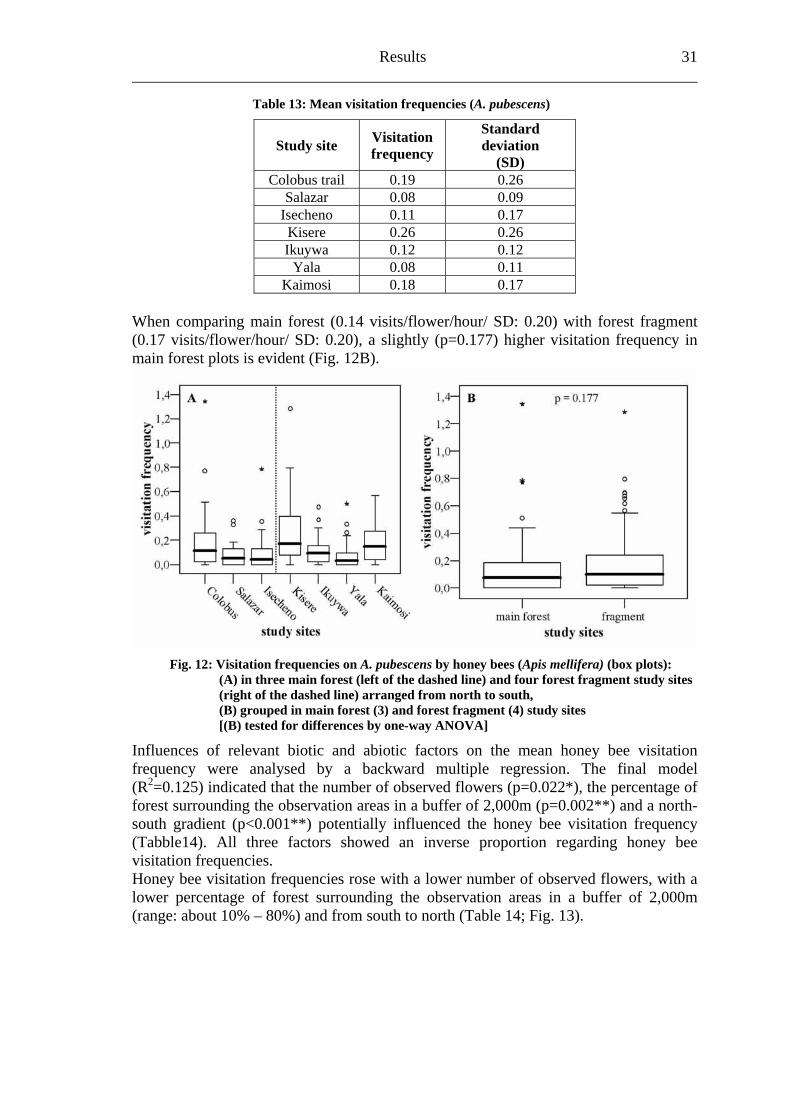
Influences of relevant biotic and abiotic factors on the mean honey bee visitation frequency were analysed by a backward multiple regression. The final model (R2=0.125) indicated that the number of observed flowers (p=0.022*), the percentage of forest surrounding the observation areas in a buffer of 2,000m (p=0.002**) and a north-south gradient (p<0.001**) potentially influenced the honey bee visitation frequency (Tabble14). All three factors showed an inverse proportion regarding honey bee visitation frequencies. Honey bee visitation frequencies rose with a lower number of observed flowers, with a lower percentage of forest surrounding the observation areas in a buffer of 2,000m (range: about 10% – 80%) and from south to north (Table 14; Fig. 13).
32 Results ______________________________________________________________________
Table 14: Final model coefficients of a backward multiple regression (started with n=7 factors; Appendix 11)
Factors B Standarderror Beta t R2 Significance
(constant) .377 .039 9.662 < .001** Number of observed
flowers .000 .000 -.143 -2.305 .022*
% of forest in a 2,000m buffer -.002 .001 -.198 -3.199 .002**
North-south gradient -.022 .006 -.225 -3.794
.125
< .001**
Fig. 13: Regression scatter plots A. pubescens (dependent variable= visitation frequencies): (A) percentage of forest surrounding the observation areas in a buffer of 2,000m to unstandardized residuals of the factors north-south gradient and number of observed flowers, (B) north-south gradient (1=northernmost; 7=southernmost) to unstandardized residuals of the factors percentage of forest surrounding the observation areas in a buffer of 2,000m and number of observed flowers
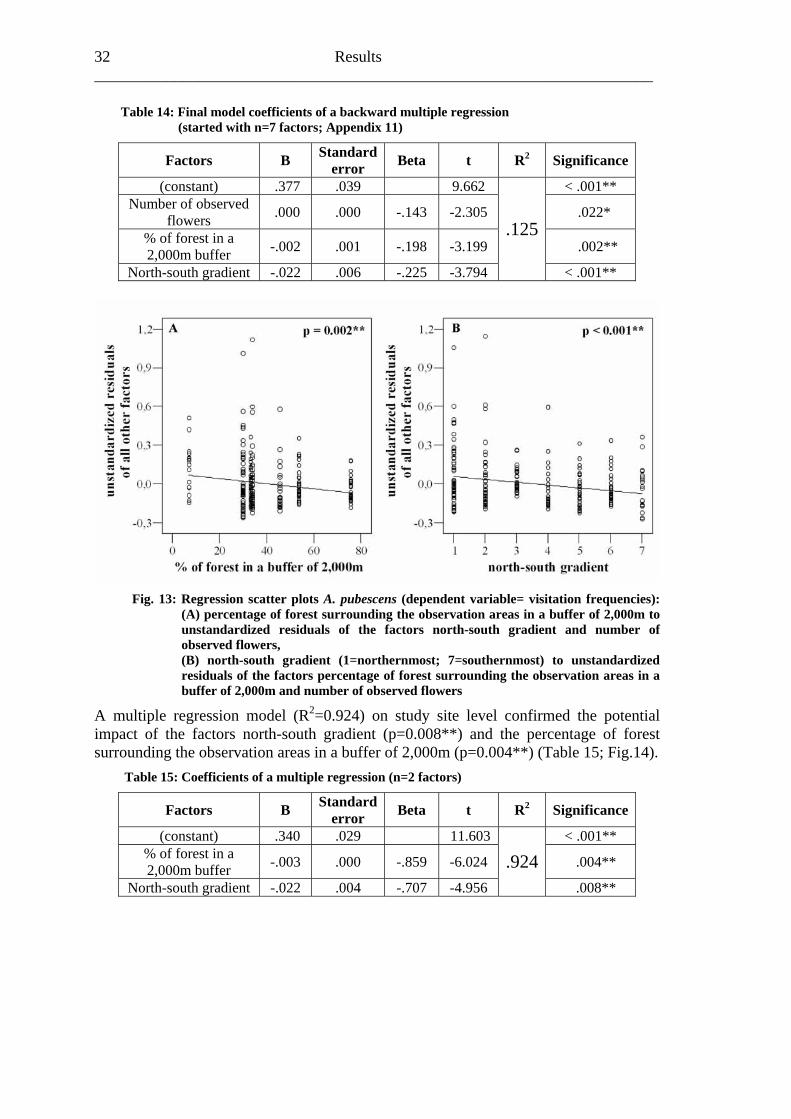
A multiple regression model (R2=0.924) on study site level confirmed the potential impact of the factors north-south gradient (p=0.008**) and the percentage of forest surrounding the observation areas in a buffer of 2,000m (p=0.004**) (Table 15; Fig.14).
Table 15: Coefficients of a multiple regression (n=2 factors)
Factors B Standarderror Beta t R2 Significance
(constant) .340 .029 11.603 < .001** % of forest in a 2,000m buffer -.003 .000 -.859 -6.024 .004**
North-south gradient -.022 .004 -.707 -4.956
.924 .008**
Results 33
Fig. 14: Regression scatter plots A. pubescens study sites (depend. variable= visitation frequencies): (A) percentage of forest surrounding the observation areas in a buffer of 2,000m to unstandardized residuals of the factor north-south gradient, (B) north-south gradient (1=northernmost; 7=southernmost) to unstandardized residuals of the factor percentage of forest surrounding the observation areas in a buffer of 2,000m
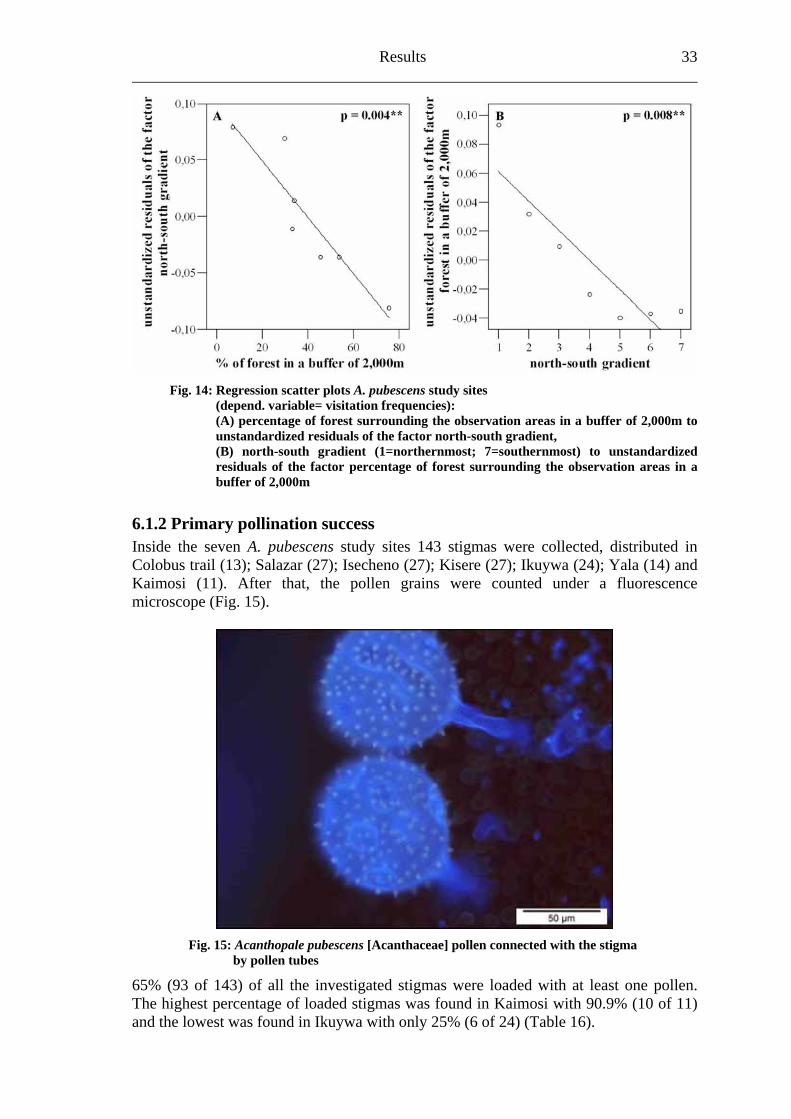
6.1.2 Primary pollination success Inside the seven A. pubescens study sites 143 stigmas were collected, distributed in Colobus trail (13); Salazar (27); Isecheno (27); Kisere (27); Ikuywa (24); Yala (14) and Kaimosi escence microsco e (F
(11). After that, the pollen grains were counted under a fluorp ig. 15).
Fig. 15: Acanthopale pubescens [Acanthaceae] pollen connected with the stigma by pollen tubes
65% (93 of 143) o least one pollen. The highest percentage of loaded stigmas was found in Kaimosi with 90.9% (10 of 11) and the lowest was found in Ikuywa with only 25% (6 of 24) (Table 16).
f all the investigated stigmas were loaded with at
34 Results ______________________________________________________________________
Table 16: Percentage of stigm A. pubescens)
Study of stigmas
ed with r of as
mas loaded with pollen/ all stig
as loaded with pollen (
Numbesite load
pollen
% stigm(stig
mas) Colobus t 84.6 11/1rail 3
Salazar 81.5 22/27 Isecheno 63 17/27 Kisere 74.1 20/27 Ikuywa 25 6/24
Yala 50 7/14 Kaimosi 90.9 10/11
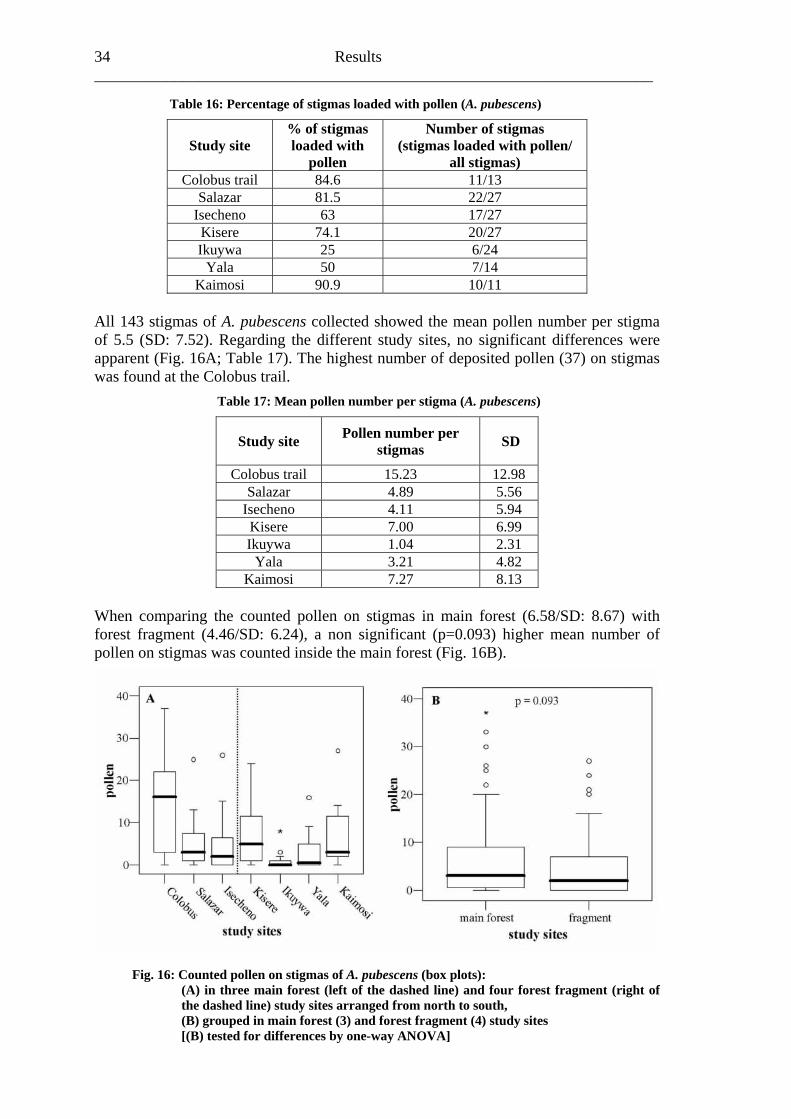
All 143 stigmas of A. pubescens collected showed the mean pollen number per stigma of 5.5 (SD: 7.52). Regarding the different study sites, no significant differences were apparent (Fig. 16A; Table 17). The highest number of deposited pollen (37) on stigmas was found at the Colobus trail.
Table 17: Mean pollen number per stigma (A. pubescens)
Study site Pollen number per stigmas SD
Colobus trail 15.23 12.98 Salazar 4.89 5.56
Isecheno 4.11 5.94 Kisere 7.00 6.99 Ikuywa 1.04 2.31
Yala 3.21 4.82 Kaimosi 7.27 8.13
p as in main forest (6.58/SD: 8.67) with When com
foaring the counted pollen on stigm
rest fragment (4.46/SD: 6.24), a non significant (p=0.093) higher mean number of pollen on stigmas was counted inside the main forest (Fig. 16B).
Fig. 16: Counted pollen on stigmas of A. pubescens (box plots): (A) in three main forest (left of the dashed line) and four forest fragment (right of the dashed line) study sites arranged from north to south, (B) grouped in main forest (3) and forest fragment (4) study sites [(B) tested for differences by one-way ANOVA]
Results 35
f stigmas loaded with pollen was also higher in main forest study sites
Study site loaded with pollen
(stigmas loaded with pollen/ all stigmas)
The percentage o(Table 18).
Table 18: Percentage of stigmas loaded with pollen (A. pubescens)
% of stigmas Number of stigmas
Main forest 74.6 50/67 Forest fragment 56.6 43/76
The potential influence of obtained abiotic and biotic factors on the number of pollen on
e that the protection status (nature or forest reserve) (p= soil (p<0.001**) might have an effect on the number of pollen deposited on the stigmas (Table 19). A higher amount of pollen on the stigmas in natur ves as compared to forest reserve study sites. In addition, more pollen on stigmas was found in forests with a higher C/N ration in th ange: 5 – 10).
Table 19: Final model ts of a backwar ple regressi (started wit ors; Appendix
Factors B Standarderror t Significance
A. pubescens stigmas were analysed by a backward multiple regression. Here, the final model indicated (R2=0.118) with high significanc
0.005**) and the C/N ratio of the
was found e reser
e soil (r ncoefficie d multi on h n=3 fact 13)
Beta R2
(constant) 1.123 2.932 .383 .702 C/N ratio 1.142 .313 .292 3.647 < .001**
Protection status -3.989 1.399 -.229 -2.852 .118
.005** Self-pollination experiments showed an ability for autogamy as 33% (n=9) of the tested plant individuals produced at least one seed. But, generally, these seeds looked poorer and smaller than regular pollinated ones.
6.1.3 Fruit set Between August 24 and December 21, 2001, 9641 Acanthopale pubescens fruits were picked. All in all, the fruit set of 140 marked individuals were observed, distributed in Colobus trail (13); Salazar (18); Isecheno (25); Kisere (14); Ikuywa (21); Yala (20) and Kaimosi (29). 5% (7) of the observed individuals developed no fruits. The same number of individuals (5%/7) produced the maximum potential fruit number (fruit set: 1.0). During this campaign, A. pubescens showed a mean fruit set of 0.59 (SD: 0.29). A ge forest fragm
(SD)
neral tendency of a higher fruit set inside the main forest compared toents became apparent (Table 20; Fig. 17A).
Table 20: Mean fruit set (A. pubescens)
Study site Fruit set Colobus trail 0.68 0.21
Salazar 0.72 0.27 Isecheno 0.72 0.27 Kisere 0.59 0.27 Ikuywa 0.42 0.32
Yala 0.48 0.31 Ka 0.22imosi 0.54
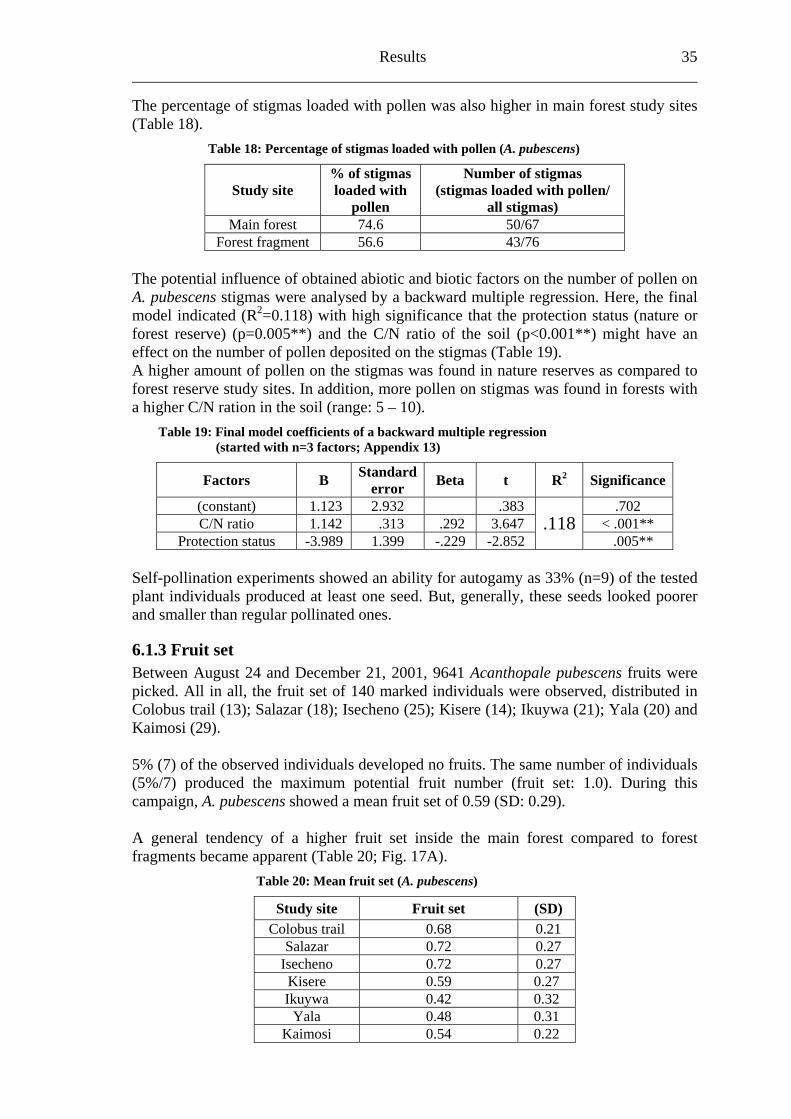
36 Results ______________________________________________________________________ A comparison of the grouped study sites in main forest (0.71/SD: 0.25) and forest fragm 0.51/SD: confi this fi t ass n and documente sign 01* uit A. p cen e th t frag s (Fig.
ent sites ( 0.28) rmed rs umptio d a highlyificant (p<0.017B).
*) lesser fr set of ubes s insid e fores ment plot
Fig. 17: Fruit set of A. pubescens (box plots):
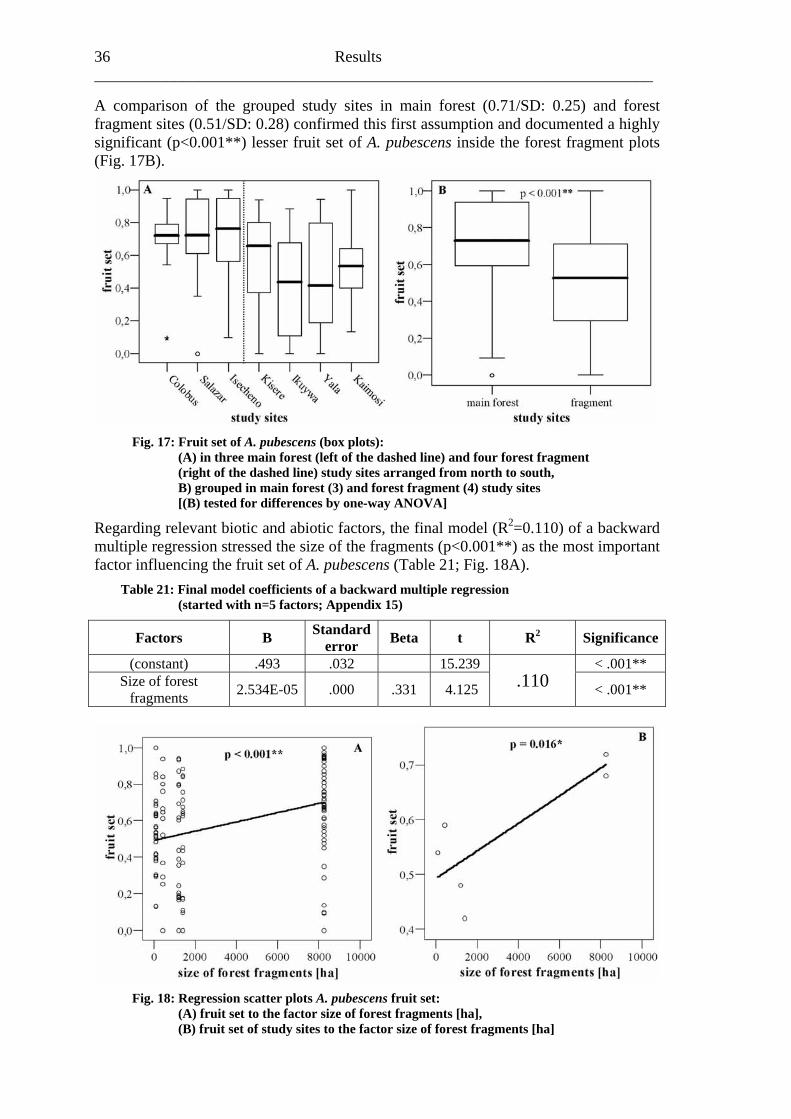
s, the final model (R2=0.110) of a backward multiple regression <0.001**) as the most important factor influencing the fruit set of A. pubescens (Table 21; Fig. 18A).
Table 21: Final mod s of a backw le regress (started with n=5 factors; Appendix 15)
Factors B error t 2 Significance
(A) in three main forest (left of the dashed line) and four forest fragment (right of the dashed line) study sites arranged from north to south, B) grouped in main forest (3) and forest fragment (4) study sites [(B) tested for differences by one-way ANOVA]
Regarding relevant biotic and abiotic factor stressed the size of the fragments (p
el coefficient ard multip ion
Standard Beta R
(constant) .493 .032 15.239 < .001** Size of forest
fragments 2 .000 4.125 10 < .001** .534E-05 .331 .1
Fig. 18: Regression scatter plots A. pubescens fruit set: (A) fruit set to the factor size of forest fragments [ha], (B) fruit set of study sites to the factor size of forest fragments [ha]
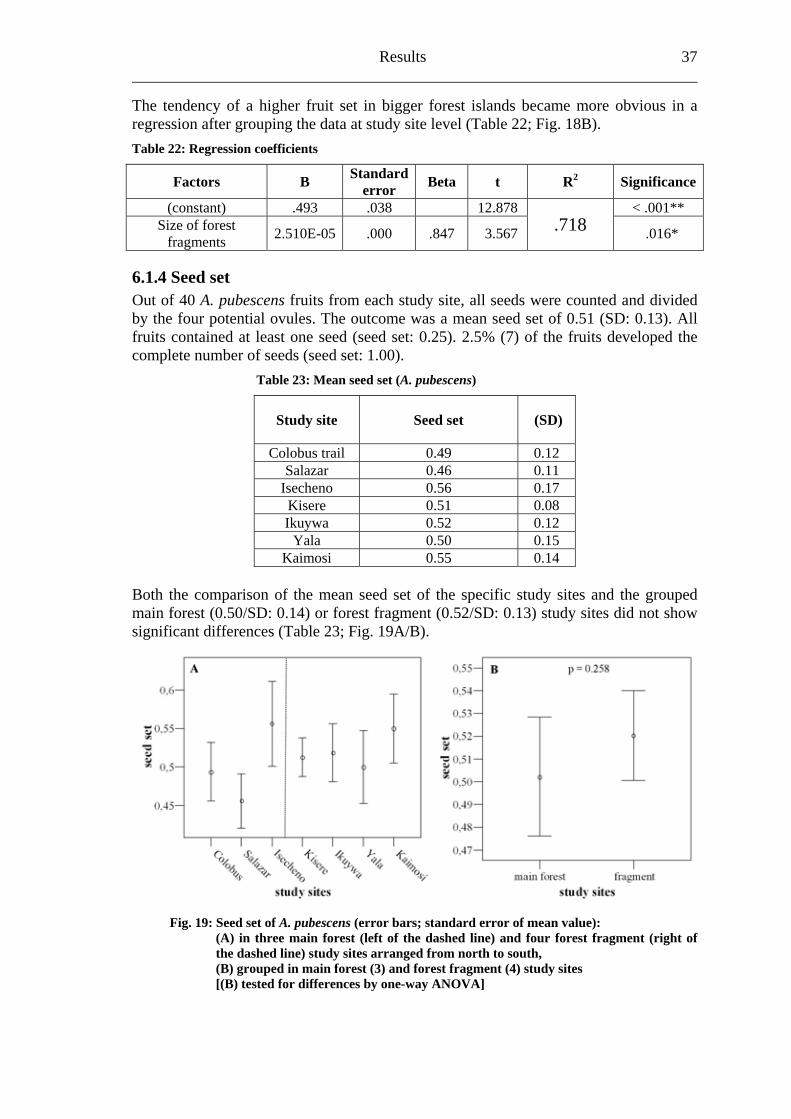
Results 37
The tendency of a higher fruit set in bigger forest islands became more obvious in a regression after grouping the data at study site level (Table 22; Fig. 18B). Table 22: Regression coefficients
Factors B Standarderror Beta t R2 Significance
(constant) .493 .038 12.878 < .001** Size of forest
fragments 2.510E-05 .000 .847 3.567 .718 .016*
6.1.4 Seed set Out of 40 A. pubescens fruits from each study site, all seeds were counted and divided by the four potential ovules. The outcome was a mean seed set of 0.51 (SD: 0.13). All fruits contained at least one seed (seed set: 0.25). 2.5% (7) of the fruits developed the complete number of seeds (seed set: 1.00).
Table 23: Mean seed set (A. pubescens)
Study site Seed set (SD)
Colobus trail 0.49 0.12 Salazar 0.46 0.11
Isecheno 0.56 0.17 Kisere 0.51 0.08 Ikuywa 0.52 0.12
Yala 0.50 0.15 Kaimosi 0.55 0.14
Both the comparison of the mean seed set of the specific study sites and the grouped main forest (0.50/SD: 0.14) or forest fragment (0.52/SD: 0.13) study sites did not show significant differences (Table 23; Fig. 19A/B).
Fig. 19: Seed set of A. pubescens (error bars; standard error of mean value): (A) in three main forest (left of the dashed line) and four forest fragment (right of the dashed line) study sites arranged from north to south, (B) grouped in main forest (3) and forest fragment (4) study sites [(B) tested for differences by one-way ANOVA]
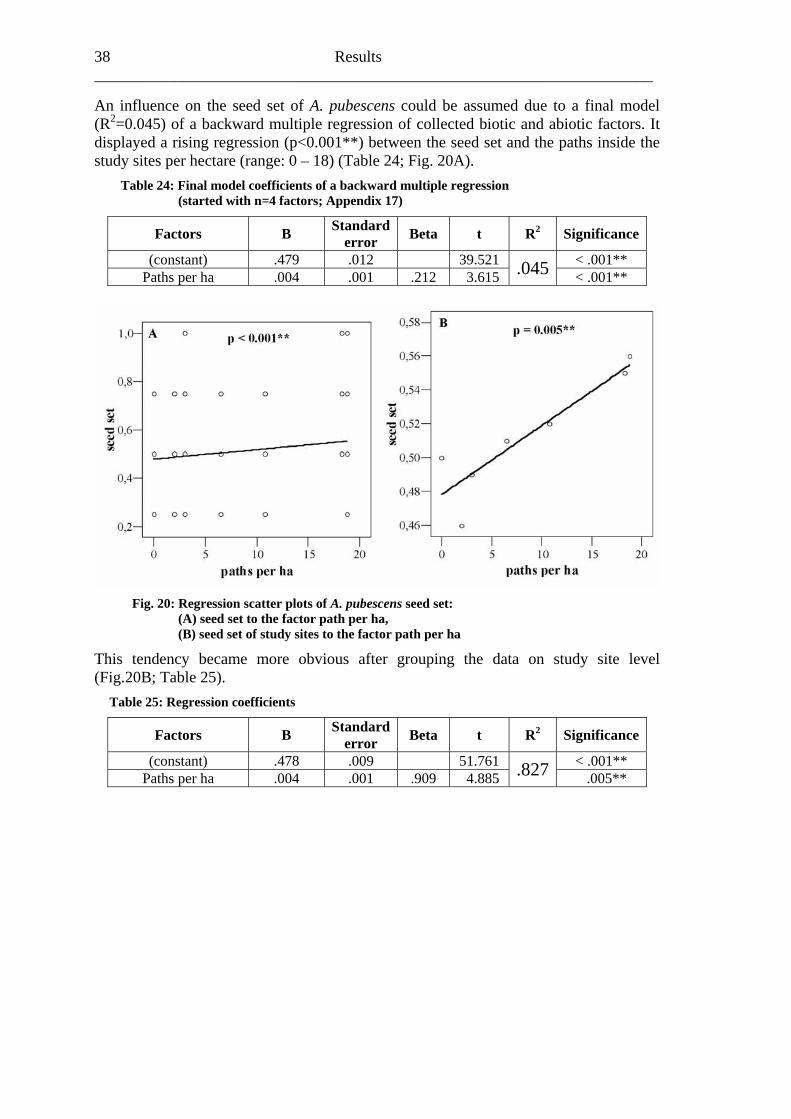
38 Results ______________________________________________________________________ An influence on the seed set of A. pubescens could be assumed due to a final model (R2=0.045) of a backward multiple regression of collected biotic and abiotic factors. It displayed a rising regression (p<0.001**) between the seed set and the paths inside the study sites per hectare (range: 0 – 18) (Table 24; Fig. 20A).
Table 24: Final model coefficients of a backward multiple regression (started with n=4 factors; Appendix 17)
Factors B Standarderror Beta t R2 Significance
(constant) .479 .012 39.521 < .001** Paths per ha .004 .001 .212 3.615 .045 < .001**
Fig. 20: Regression scatter plots of A. pubescens seed set: (A) seed set to the factor path per ha, (B) seed set of study sites to the factor path per ha
This tendency became more obvious after grouping the data on study site level (Fig.20B; Table 25).
Table 25: Regression coefficients
Factors B Standarderror Beta t R2 Significance
(constant) .478 .009 51.761 < .001** Paths per ha .004 .001 .909 4.885 .827 .005**
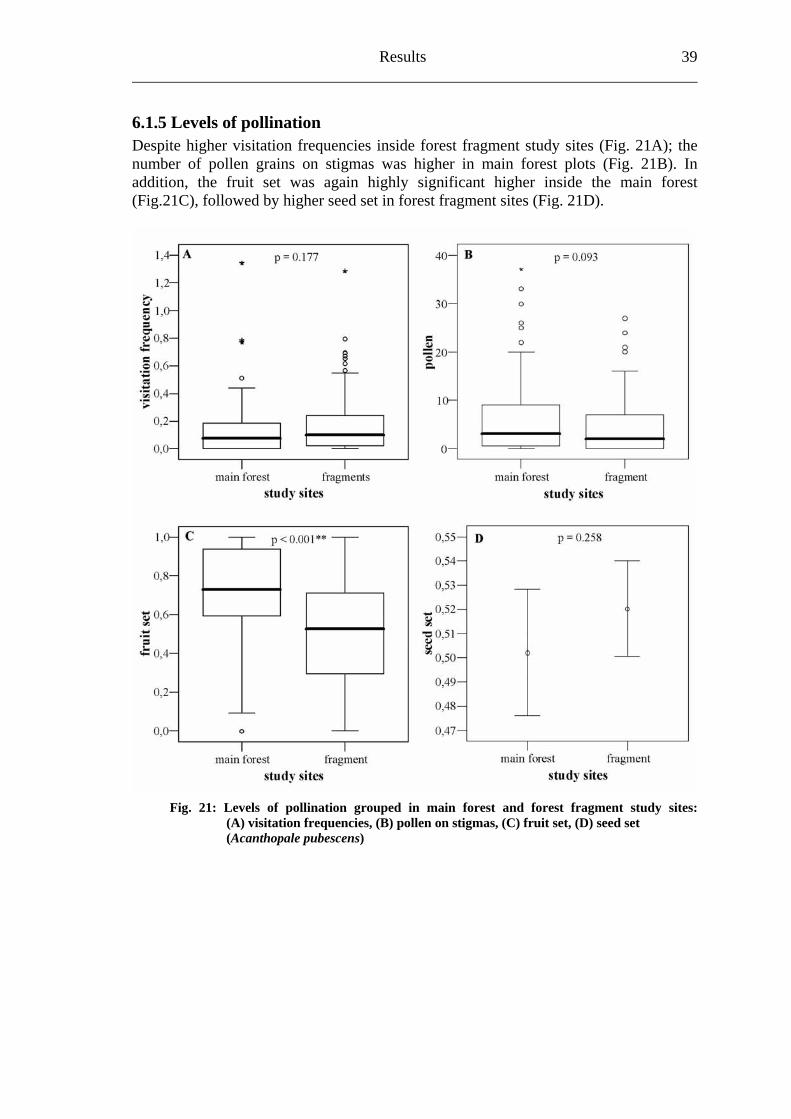
Results 39
6.1.5 Levels of pollination Despite higher visitation frequencies inside forest fragment study sites (Fig. 21A); the number of pollen grains on stigmas was higher in main forest plots (Fig. 21B). In addition, the fruit set was again highly significant higher inside the main forest (Fig.21C), followed by higher seed set in forest fragment sites (Fig. 21D).
Fig. 21: Levels of pollination grouped in main forest and forest fragment study sites: (A) visitation frequencies, (B) pollen on stigmas, (C) fruit set, (D) seed set (Acanthopale pubescens)
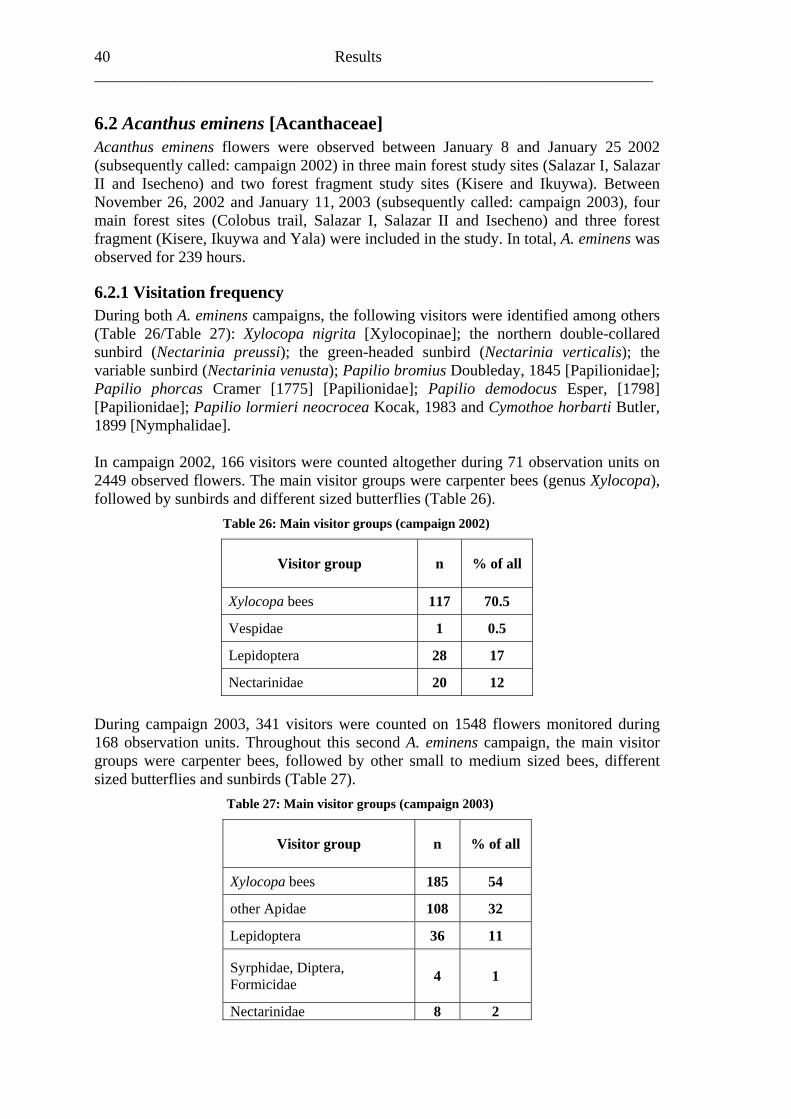
40 Results ______________________________________________________________________
6.2 Acanthus eminens [Acanthaceae] Acanthus eminens flowers were observed between January 8 and January 25 2002 (subsequently called: campaign 2002) in three main forest study sites (Salazar I, Salazar II and Isecheno) and two forest fragment study sites (Kisere and Ikuywa). Between November 26, 2002 and January 11, 2003 (subsequently called: campaign 2003), four main forest sites (Colobus trail, Salazar I, Salazar II and Isecheno) and three forest fragment (Kisere, Ikuywa and Yala) were included in the study. In total, A. eminens was observed for 239 hours.
6.2.1 Visitation frequency During both A. eminens campaigns, the following visitors were identified among others (Table 26/Table 27): Xylocopa nigrita [Xylocopinae]; the northern double-collared sunbird (Nectarinia preussi); the green-headed sunbird (Nectarinia verticalis); the variable sunbird (Nectarinia venusta); Papilio bromius Doubleday, 1845 [Papilionidae]; Papilio phorcas Cramer [1775] [Papilionidae]; Papilio demodocus Esper, [1798] [Papilionidae]; Papilio lormieri neocrocea Kocak, 1983 and Cymothoe horbarti Butler, 1899 [Nymphalidae]. In campaign 2002, 166 visitors were counted altogether during 71 observation units on 2449 observed flowers. The main visitor groups were carpenter bees (genus Xylocopa), followed by sunbirds and different sized butterflies (Table 26).
Table 26: Main visitor groups (campaign 2002)
Visitor group n % of all
Xylocopa bees 117 70.5
Vespidae 1 0.5
Lepidoptera 28 17
Nectarinidae 20 12 During campaign 2003, 341 visitors were counted on 1548 flowers monitored during 168 observation units. Throughout this second A. eminens campaign, the main visitor groups were carpenter bees, followed by other small to medium sized bees, different sized butterflies and sunbirds (Table 27).
Table 27: Main visitor groups (campaign 2003)
Visitor group n % of all
Xylocopa bees 185 54
other Apidae 108 32
Lepidoptera 36 11
Syrphidae, Diptera, Formicidae 4 1
Nectarinidae 8 2
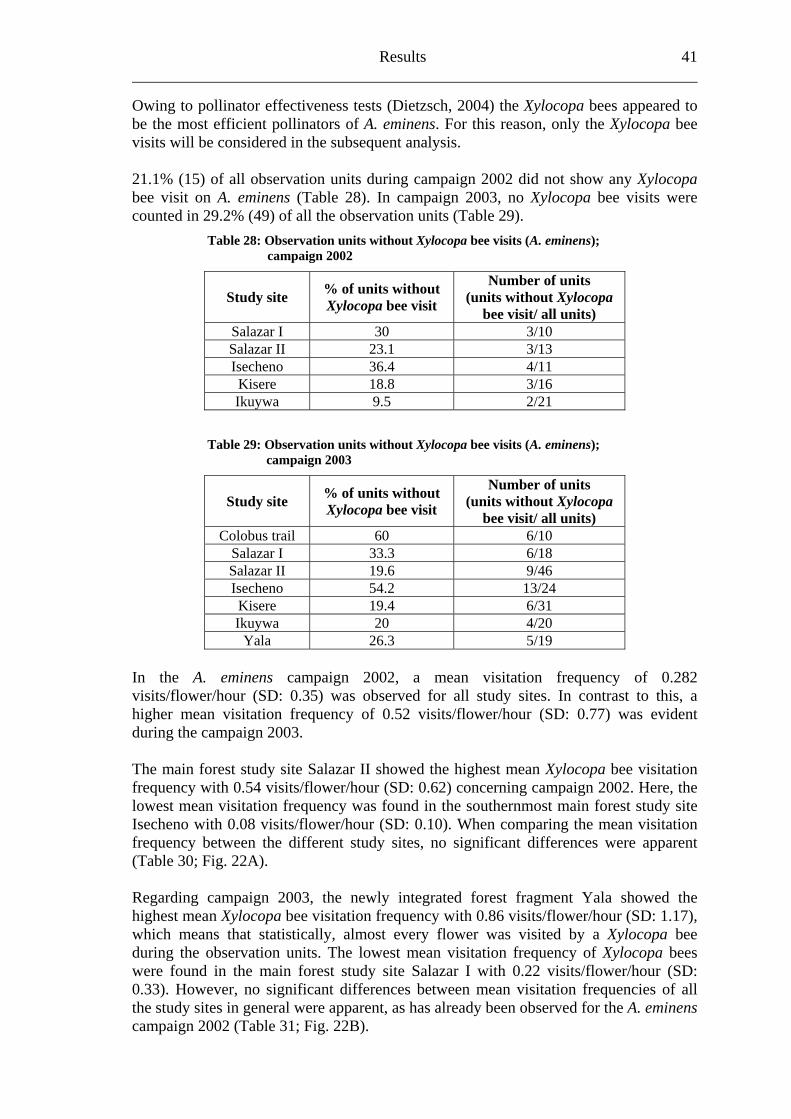
Results 41
Owing to pollinator effectiveness tests (Dietzsch, 2004) the Xylocopa bees appeared to be the most efficient pollinators of A. eminens. For this reason, only the Xylocopa bee visits will be considered in the subsequent analysis. 21.1% (15) of all observation units during campaign 2002 did not show any Xylocopa bee visit on A. eminens (Table 28). In campaign 2003, no Xylocopa bee visits were counted in 29.2% (49) of all the observation units (Table 29).
Table 28: Observation units without Xylocopa bee visits (A. eminens); campaign 2002
Study site % of units without Xylocopa bee visit
Number of units (units without Xylocopa
bee visit/ all units) Salazar I 30 3/10 Salazar II 23.1 3/13 Isecheno 36.4 4/11 Kisere 18.8 3/16 Ikuywa 9.5 2/21
Table 29: Observation units without Xylocopa bee visits (A. eminens); campaign 2003
Study site % of units without Xylocopa bee visit
Number of units (units without Xylocopa
bee visit/ all units) Colobus trail 60 6/10
Salazar I 33.3 6/18 Salazar II 19.6 9/46 Isecheno 54.2 13/24 Kisere 19.4 6/31 Ikuywa 20 4/20
Yala 26.3 5/19 In the A. eminens campaign 2002, a mean visitation frequency of 0.282 visits/flower/hour (SD: 0.35) was observed for all study sites. In contrast to this, a higher mean visitation frequency of 0.52 visits/flower/hour (SD: 0.77) was evident during the campaign 2003. The main forest study site Salazar II showed the highest mean Xylocopa bee visitation frequency with 0.54 visits/flower/hour (SD: 0.62) concerning campaign 2002. Here, the lowest mean visitation frequency was found in the southernmost main forest study site Isecheno with 0.08 visits/flower/hour (SD: 0.10). When comparing the mean visitation frequency between the different study sites, no significant differences were apparent (Table 30; Fig. 22A). Regarding campaign 2003, the newly integrated forest fragment Yala showed the highest mean Xylocopa bee visitation frequency with 0.86 visits/flower/hour (SD: 1.17), which means that statistically, almost every flower was visited by a Xylocopa bee during the observation units. The lowest mean visitation frequency of Xylocopa bees were found in the main forest study site Salazar I with 0.22 visits/flower/hour (SD: 0.33). However, no significant differences between mean visitation frequencies of all the study sites in general were apparent, as has already been observed for the A. eminens campaign 2002 (Table 31; Fig. 22B).
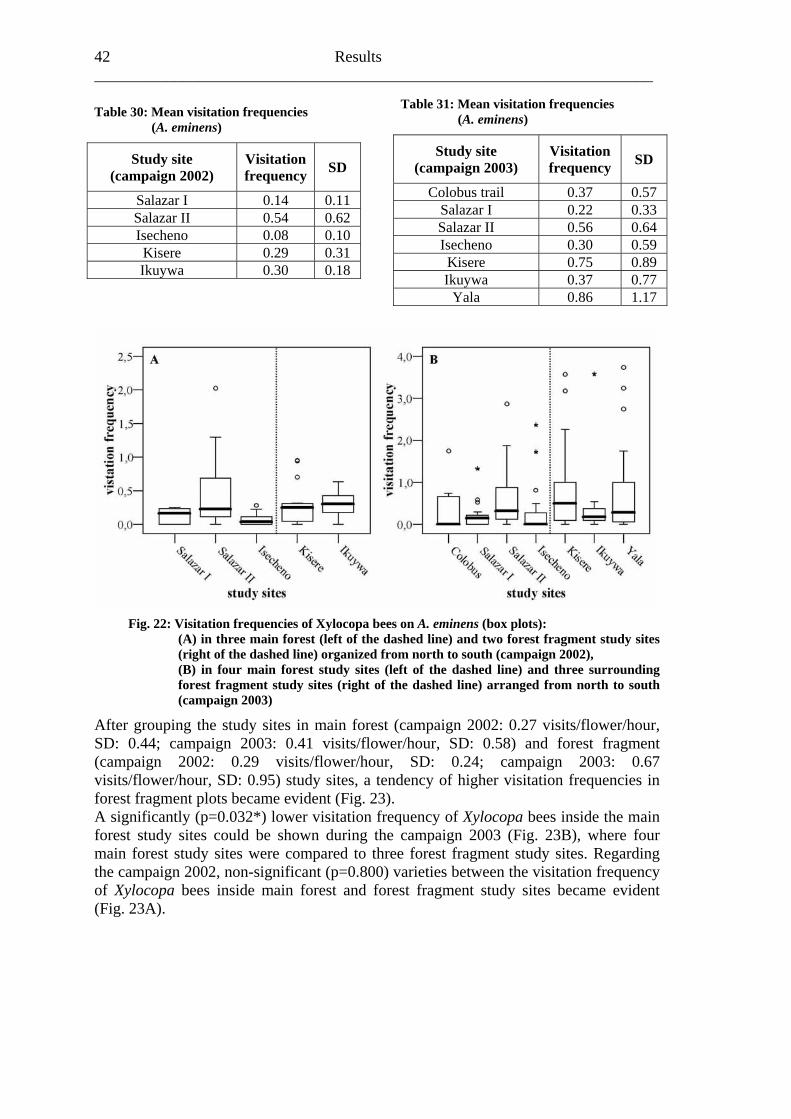
42 Results ______________________________________________________________________
Table 31: Mean visitation frequencies (A. eminens) Table 30: Mean visitation frequencies
(A. eminens)
Study site (campaign 2002)
Visitation frequency SD
Salazar I 0.14 0.11 Salazar II 0.54 0.62 Isecheno 0.08 0.10 Kisere 0.29 0.31 Ikuywa 0.30 0.18
Study site (campaign 2003)
Visitation frequency SD
Colobus trail 0.37 0.57 Salazar I 0.22 0.33 Salazar II 0.56 0.64 Isecheno 0.30 0.59 Kisere 0.75 0.89 Ikuywa 0.37 0.77
Yala 0.86 1.17
Fig. 22: Visitation frequencies of Xylocopa bees on A. eminens (box plots): (A) in three main forest (left of the dashed line) and two forest fragment study sites (ri
ght of the dashed line) organized from north to south (campaign 2002),
(B) in four main forest study sites (left of the dashed line) and three surrounding forest fragment study sites (right of the dashed line) arranged from north to south (campaign 2003)
After grouping the study sites in main forest (campaign 2002: 0.27 visits/flower/hour, SD: 0.44; campaign 2003: 0.41 visits/flower/hour, SD: 0.58) and forest fragment (campaign 2002: 0.29 visits/flower/hour, SD: 0.24; campaign 2003: 0.67 visits/flower/hour, SD: 0.95) study sites, a tendency of higher visitation frequencies in forest fragment plots became evident (Fig. 23). A significantly (p=0.032*) lower visitation frequency of Xylocopa bees inside the main forest study sites could be shown during the campaign 2003 (Fig. 23B), where four main forest study sites were compared to three forest fragment study sites. Regarding the campaign 2002, non-significant (p=0.800) varieties between the visitation frequency of Xylocopa bees inside main forest and forest fragment study sites became evident (Fig. 23A).
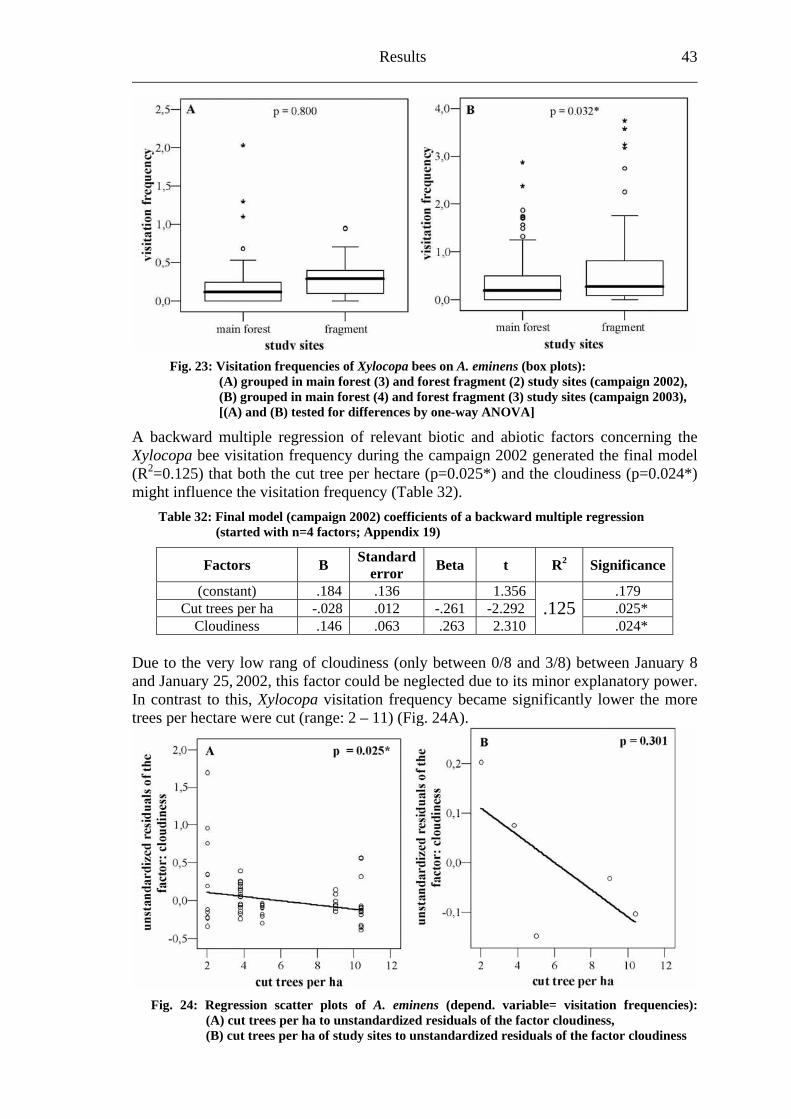
Results 43
Fig. 23: Visitation frequencies of Xylocopa bees on A. eminens (box plots):
n frequency (Table 32). ression
with n=4 tors 19
Standard Beta t R2 Significance
(A) grouped in main forest (3) and forest fragment (2) study sites (campaign 2002), (B) grouped in main forest (4) and forest fragment (3) study sites (campaign 2003),
[(A) and (B) tested for differences by one-way ANOVA]
A backward multiple regression of relevant biotic and abiotic factors concerning the Xylocopa bee visitation frequency during the campaign 2002 generated the final model (R2=0.125) that both the cut tree per hectare (p=0.025*) and the cloudiness (p=0.024*) might influence the visitatio
Table 32: Final model (campaign 2002) coefficients of a backward multiple reg (started fac ; Appendix )
Factors B error (constant) .184 .136 1.356 .179
C a .025* ut trees per h -.028 .012 -.261 -2.292 Cloudiness .146 .063 .263 2.310
.125 .024*
Due to the very low rang of cloudiness (only between 0/8 and 3/8) between January 8
and January 25, 2002, this factor could be neglected due to its minor explanatory power. In contrast to this, Xylocopa visitation frequency became significantly lower the more trees per hectare were cut (range: 2 – 11) (Fig. 24A).
Fig. 24: Regression scatter plots of A. eminens (depend. variable= visitation frequencies): (A) cut trees per ha to unstandardized residuals of the factor cloudiness, (B) cut trees per ha of study sites to unstandardized residuals of the factor cloudiness
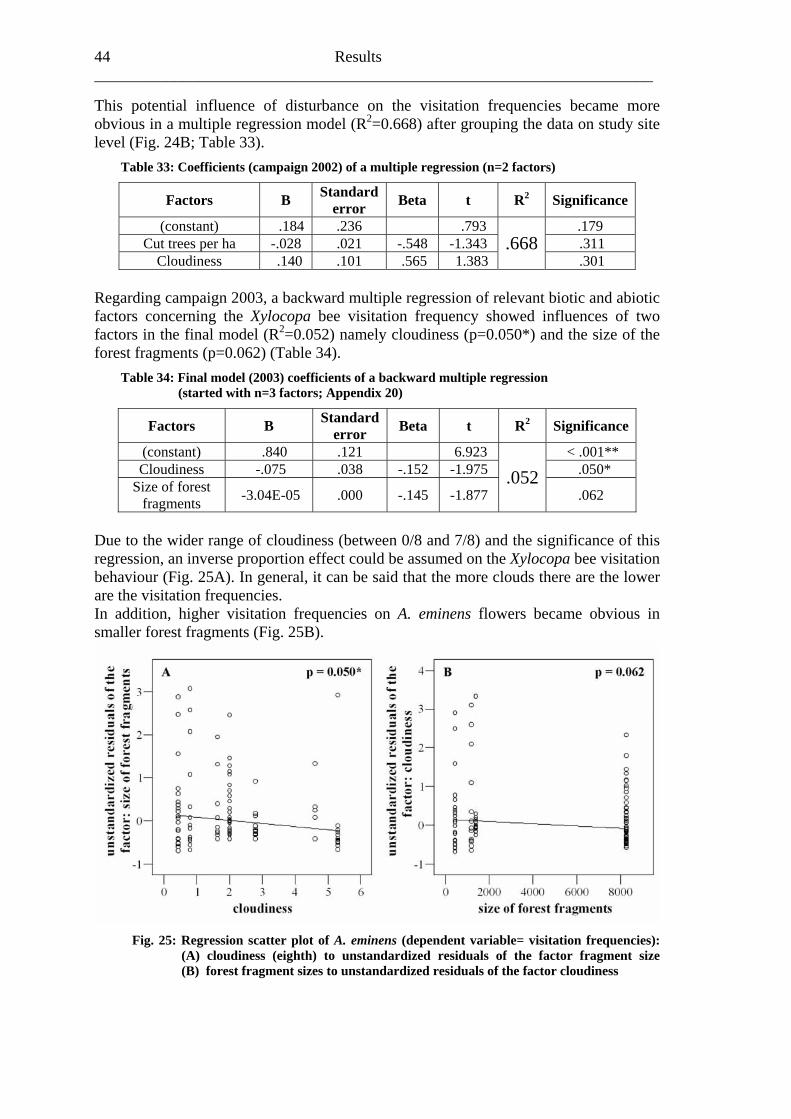
44 Results ______________________________________________________________________ This potential influence of disturbance on the visitation frequencies became more obvious in a multiple regression model (R2=0.668) after grouping the data on study site level (Fig. 24B; Table 33).
Table 33: Coefficients (campaign 2002) of a multiple regression (n=2 factors)
Factors B Standard error Beta t R2 Significance
(constant) .184 .236 .793 .179 Cut trees per ha -.028 .021 -.548 -1.343 .311
Cloudiness .140 .101 .565 1.383 .668
.301 Regarding campaign 2003, a backward multiple regression of relevant biotic and abiotic factors concerning the Xylocopa bee visitation frequency showed influences of two factors in the final model (R2=0.052) namely cloudiness (p=0.050*) and the size of the forest fragments (p=0.062) (Table 34).
Table 34: Final model (2003) coefficients of a backward multiple regression
(started with n=3 factors; Appendix 20)
Factors B Standard error Beta t R2 Significance
(constant) .840 .121 6.923 < .001** Cloudiness -.075 .038 -.152 -1.975 .050*
Size of forest fragments -3.04E-05 .000 -.145 -1.877
.052.062
Due to the wider range of cloudiness (between 0/8 and 7/8) and the significance of this regression, an inverse proportion effect could be assumed on the Xylocopa bee visitation behaviour (Fig. 25A). In general, it can be said that the more clouds there are the lower are the visitation frequencies. In addition, higher visitation frequencies on obvious in smaller f
A. eminens flowers becameorest fragments (Fig. 25B).
Fig. 25: Regression plo eminens (depe able= visi frequ
) cloudin ighth tandardized of the fa ragm forest f ent si standardized f the factor dines
scatter t of A. ndent vari tation encies): (A
(B) ess (er
) to uns residuals ctor f ent size agm zes to un residuals o clou s
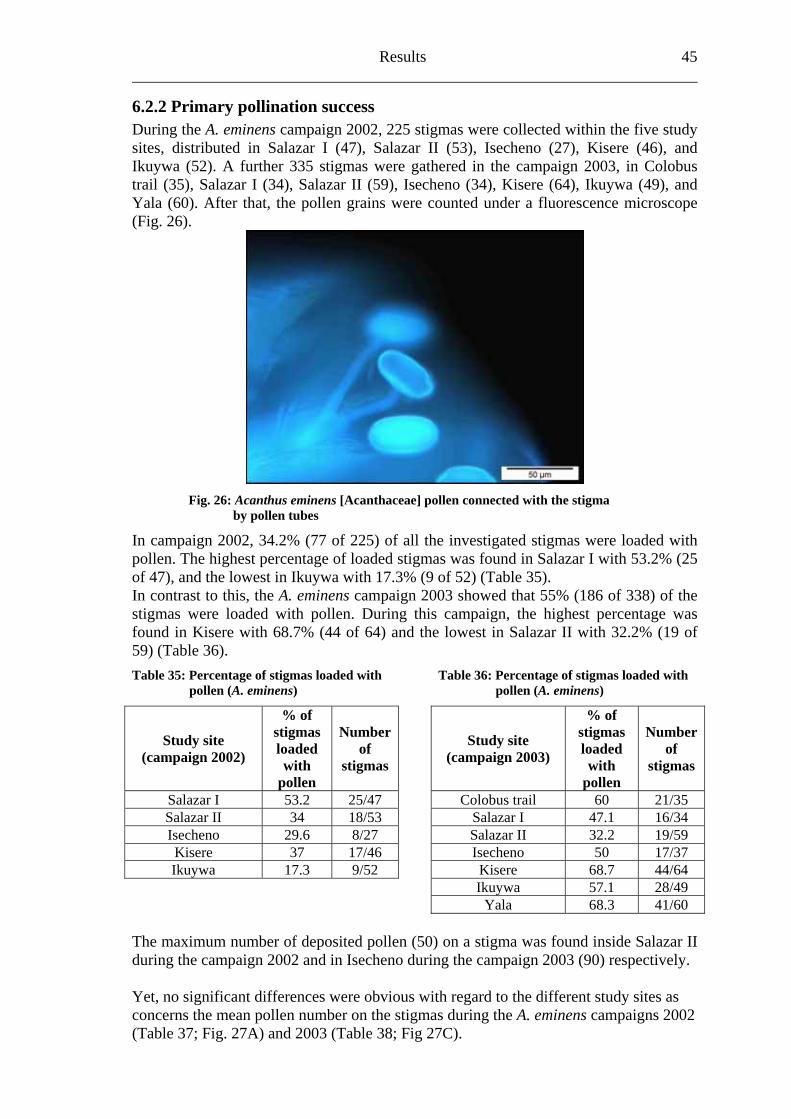
Results 45
.2.2 Primary pollination success
6During the A. eminens campaign 2002, 225 stigmas were collected within the five study sites, distributed in Salazar I (47), Salazar II (53), Isecheno (27), Kisere (46), andIkuywa (52). A further 335 stigmas were gathered in the campaign 2003, in Colobus trail (35), Salazar I (34), Salazar II (59), Isecheno (34), Kisere (64), Ikuywa (49), and Yala (60). After that, the pollen grains were counted under a fluorescence microscope (Fig. 26).
Fig. 26: Acanthus eminens [Acanthaceae] pollen connected with the stigma by pollen tubes
In campaign 2002, 34.2% (77 of 225) of all the investigated stigmas were loaded with pollen. The highest percentage of loaded stigmas was found in Salazar I with 53.2% (25 of 47), and the lowest in Ikuywa with 17.3% (9 of 52) (Table 35). In contrast to this, the A. eminens campaign 2003 showed that 55% (186 of 338) of the stigmas were loaded with pollen. During this campaign, the highest percentage was found in Kisere with 68.7% (44 of 64) and the lowest in Salazar II with 32.2% (19 of 59) (Table 36). Table 35: Percentage of stigmas loaded with pollen (A. eminens)
Study site (campaign 2002)
% of stigmas loaded with
pollen
Number of
stigmas
Salazar I 53.2 25/47 Salazar II 34 18/53 Isecheno 29.6 8/27 Kisere 37 17/46 Ikuywa 17.3 9/52
Table 36: Percentage of stigmas loaded with pollen (A. eminens)
Study site (campaign 2003)
% of stigmas loaded with
pollen
Number of
stigmas
Colobus trail 60 21/35 Salazar I 47.1 16/34 Salazar II 32.2 19/59 Isecheno 50 17/37 Kisere 68.7 44/64 Ikuywa 57.1 28/49
Yala 68.3 41/60 The maximum number of deposited pollen (50) on a stigma was found inside Salazar II during the campaign 2002 and in Isecheno during the campaign 2003 (90) respectively. Yet, no significant differences were obvious with regard to the different study sites as concerns the mean pollen number on the stigmas during the A. eminens campaigns 2002(Table 37; Fig. 27A) and 2003 (Table 38; Fig 27C).
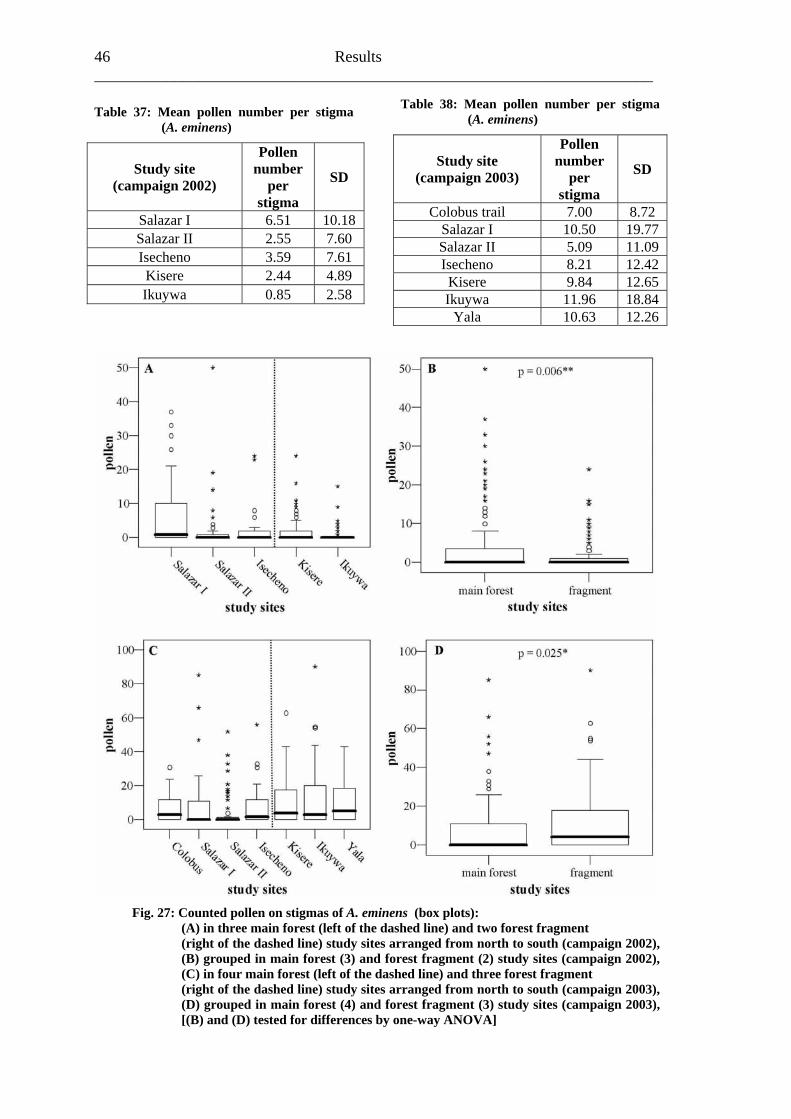
46 Results ______________________________________________________________________
Table
(ca
37: Mean pollen number per stigma (A. eminens)
Study site mpaign 2002)
Pollen number
per stigma
SD
Salazar I 6.51 10.18 Salazar II 2.55 7.60 Isecheno 3.59 7.61 Kisere 2.44 4.89 Ikuywa 0.85 2.58
Table 38: Mea ll (A. eminens)
Study site (campaign 2003)
Pollen number
per stigma
SD
n po en number per stigma
Colobus trail 7.00 8.72 Salazar I 10.50 19.77 Salazar II 5.09 11.09 Isecheno 8.21 12.42 Kisere 9.84 12.65 Ikuywa 11.96 18.84
Yala 10.63 12.26
Fig. 27: Counted pollen on stigmas of A. eminens (box plots):
outh (campaign 2002), st fragment (2) study sites (campaign 2002), four main forest (l he fore t fragment of the dash line) ar from north to s uth 03), uped i res fores gm st es (c 2003),
) t iff y o A
(A) in three main forest (left of the dashed line) and two forest fragment (right of the dashed line) study sites arranged from north to s
(B) grouped in main forest (3) and fore (C) in
(righteft of the dasst s
d line) and three ranged
so
(campaign 20ed udy site
(D) gro n main foe d
t (4) and t fra ent (3)
udy sit ampaign [(B) and (D sted for erences b ne-way NOVA]
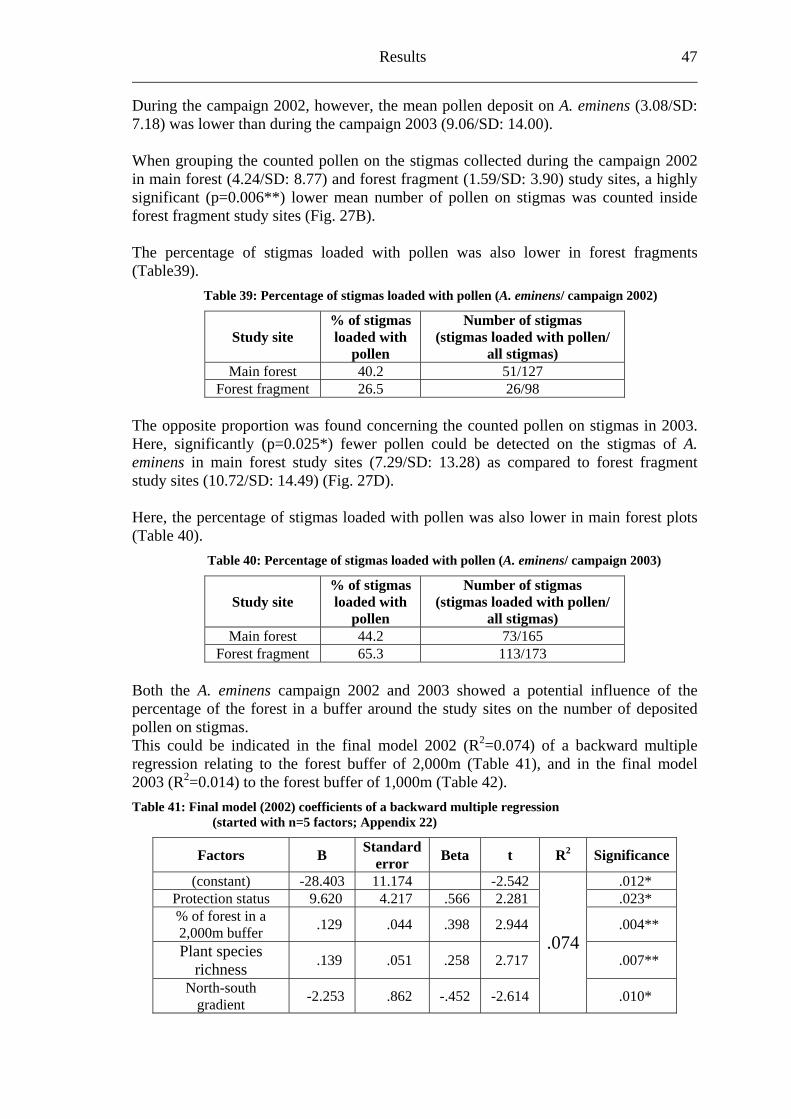
Results 47
During 200 ver A. emi /SD: 7.18) was lower than during the campaign 2003 (9.06/SD: 14.00). When grouping the counted pollen on the in main SD: 8 fo gm .5 .90) study ighly significant (p=0.006**) lower m as was counted inside
rest fragment study sites (Fig. 27B).
lower in forest fragments (Table39).
: Percentag stigma d wi en (A. eminens amp
site f stdedpollen
Num t( s en/
all stigmas)
the campaign 2, howe , the mean pollen deposit on nens (3.08
stigmas collected during the campaign 2002 forest (4.24/ .77) and
ean numrest fra
ber ofent (1 pollen on stigm
9/SD: 3 sites, a h
fo The percentage of stigmas loaded with pollen was also
Table 39 e of s loade th poll / c aign 2002)
Study % o igmas loa with
ber of s igmas ith pollstigma loaded w
Main forest 40.2 51/127 Forest fragment 26.5 26/98
The opposite proportion was found concerning the counted pollen on stigmas in 2003. Here, significantly (p=0.025*) fewer pollen could be detected on the stigmas of A. minens in main forest study sites (7.29/SD: 13.28) as compared to forest fragme ent
rcentage of stigmas loaded with pollen (A. eminens/ campaign 2003)
pollen all stigmas)
study sites (10.72/SD: 14.49) (Fig. 27D). Here, the percentage of stigmas loaded with pollen was also lower in main forest plots (Table 40).
Table 40: Pe
Study site % of stigmas loaded with
Number of stigmas (stigmas loaded with pollen/
Main forest 44.2 73/165 Forest fragment 65.3 113/173
Both the A. eminens campaign 2002 and 2003 showed a potential influence of the percentage of the forest in a buffer around the study sites on the number of deposited pollen on stigmas. This could be indicated in the final model 2002 (R2=0.074) of a backward multiple regression relating to the forest buffer of 2,000m (Table 41), and in the final model
22003 (R =0.014) to the forest buffer of 1,000m (Table 42). Table 41: Final model (2002) coefficients of a backward multiple regression (started with n=5 factors; Appendix 22)
Factors B Standard error Beta t R2 Significance
(constant) -28.403 11.174 -2.542 .012* Protection status 9.620 4.217 .566 2.281 .023* % of forest in a 2,000m buffer .129 .044 .398 2.944 .004**
Plant species richness .139 .051 .258 2.717 .007**
North-south gradient -2.253 .862 -.452 -2.614
.074
.010*
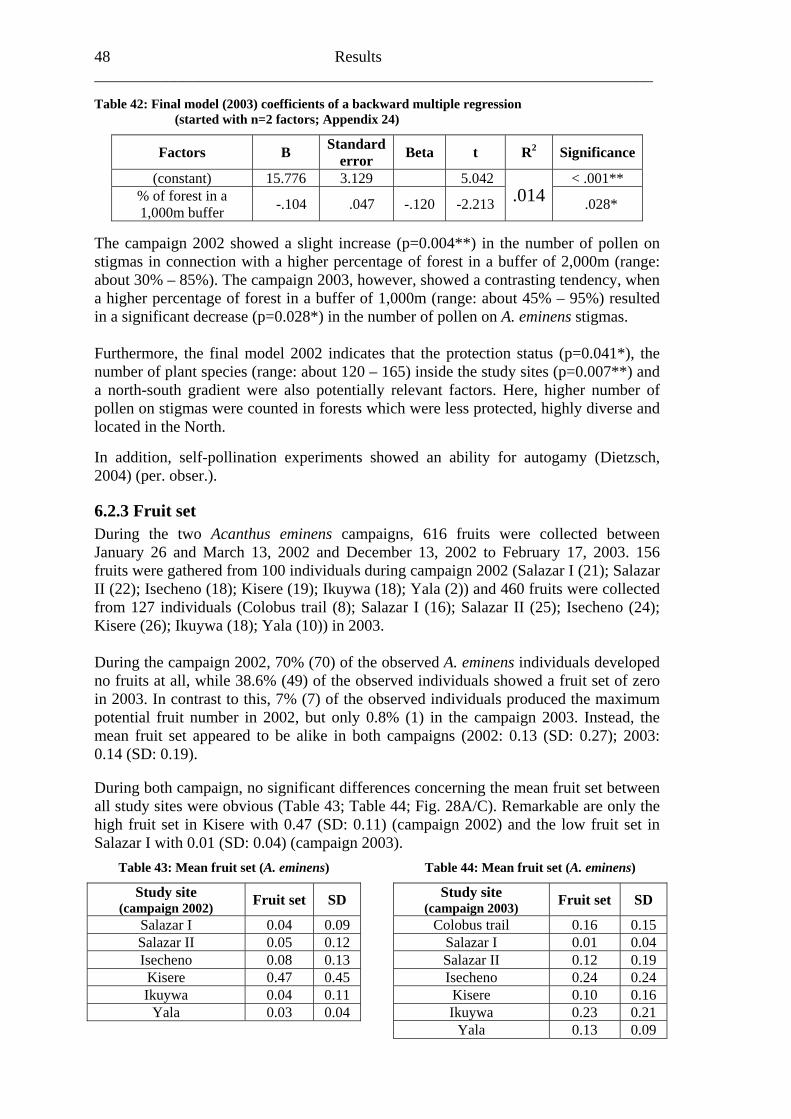
48 Results ______________________________________________________________________ Table 4 del (2003) c ient ackward mu ted with n= 24)
s dard or Beta t R2 S anc
2: Final mo oeffic s of a b ltiple regression (star 2 factors; Appendix
Factor B Stanerr ignific e
(constant) 6 29 ** 15.77 3.1 5.042 < .001% of forest in a -.104 1,000m buffer .047 -.120 .014 8* -2.213 .02
The sho gh crease (p=0.004**) in the number of pollen on stigmas in connection with a higher percentage of forest in a buffer of 2,000m (range: about 30% – 85%). The campaign 2003, however, showed a contrasting tendency, when a higher percentage of forest in a buffer of 1,000m (range: about 45% – 95%) resulted in a significant decrease (p=0.028*) in the number of pollen on A. eminens stigmas. Furthermore, the final model 2002 indicates that the protection status (p=0.041*), the number of plant species (range: about 120 – 165) inside the study sites (p=0.007**) and a north-south gradient were also potentially relevant factors. Here, higher number of pollen on stigmas were counted in forests which were less protected, highly diverse and located in the North. In addition, self-pollination experiments showed an ability for autogamy (Dietzsch, 2004) (per. obser.).
6.2.3 Fruit set During the two Acanthus eminens campaigns, 616 fruits were collected between January 26 and March 13, 2002 and December 13, 2002 to February 17, 2003. 156 fruits were gathered from 100 individuals during campaign 2002 (Salazar I (21); Salazar II (22); Isecheno (18); Kisere (19); Ikuywa (18); Yala (2)) and 460 fruits were collected from 127 individuals (Colobus trail (8); Salazar I (16); Salazar II (25); Isecheno (24); Kisere (26); Ikuywa (18); Yala (10)) in 2003. During the campaign 2002, 70% (70) of the observed A. eminens individuals developed no fruits at all, while 38.6% (49) of the observed individuals showed a fruit set of zero in 2003. In contrast to this, 7% (7) of the observed individuals produced the maximum potential fruit number in 2002, but only 0.8% (1) in the campaign 2003. Instead, the mean fruit set appeared to be alike in both campaigns (2002: 0.13 (SD: 0.27); 2003: 0.14 (SD: 0.19). During both campaign, no significant differences concerning the mean fruit set between all study sites were obvious (Table 43; Table 44; Fig. 28A/C). Remarkable are only the high fruit set in Kisere with 0.47 (SD: 0.11) (campaign 2002) and the low fruit set in Salazar I with 0.01 (SD: 0.04) (campaign 2003).
Table 43: Mean fruit set (A. eminens)
Study site (campaign 2002) Fruit set SD
campaign 2002 wed a sli t in
Salazar I 0.04 0.09 Salazar II 0.05 0.12 Isecheno 0.08 0.13 Kisere 0.47 0.45 Ikuywa 0.04 0.11
Yala 0.03 0.04
Table 44: Mean fruit set (A. eminens)
Study site (campaign 2003) Fruit set SD
Colobus trail 0.16 0.15 Salazar I 0.01 0.04 Salazar II 0.12 0.19 Isecheno 0.24 0.24 Kisere 0.10 0.16 Ikuywa 0.23 0.21
Yala 0.13 0.09
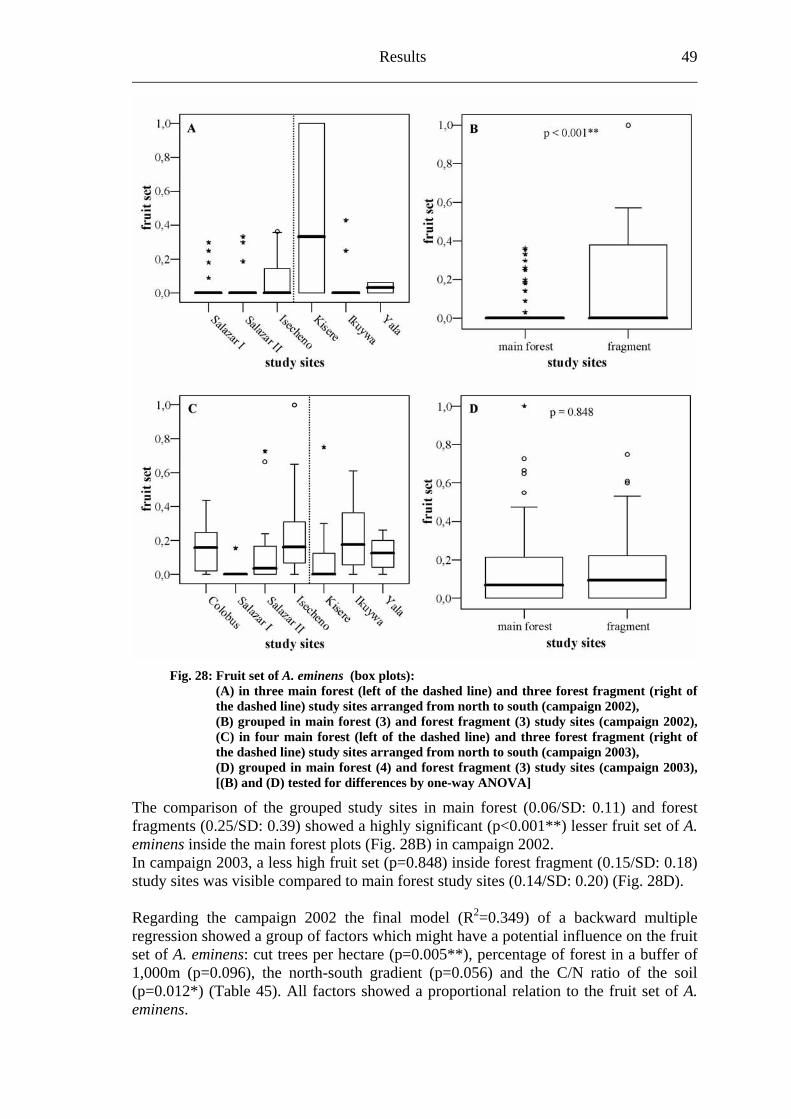
Results 49
F o (A) in thre
ig. 28: Fruit set f A. eminens (box plots): e ma (lef dashed line) e fr ht of
ne ites arranged fr h (campaign 20 uped in rest for m tudy sites (ca 2002), four main (left dashe forest fragment (right of
/SD: 0.20) (Fig. 28D).
l (R2=0.349) of a backward multiple regression a group o ctor ght have a potential influence on the fruit set of A. cut trees p hectar .00 erce age o1,000m (p=0.096), the north-south gradient (p=0.056) and the C/N ratio of the soil (p=0. . Al s sho a pr on io e f A. eminen
e forestin forest t of the and thr agment (rig
the dashed li ) study s om nort to south 02), (B) gro (C) in
main foforest
(3) andof the
est fragd line) and three
ent (3) s mpaign
the dashed line) study sites arranged from north to south (campaign 2003), (D) grouped in main forest (4) and forest fragment (3) study sites (campaign 2003), [(B) and (D) tested for differences by one-way ANOVA]
The comparison of the grouped study sites in main forest (0.06/SD: 0.11) and forest fragments (0.25/SD: 0.39) showed a highly significant (p<0.001**) lesser fruit set of A. eminens inside the main forest plots (Fig. 28B) in campaign 2002. In campaign 2003, a less high fruit set (p=0.848) inside forest fragment (0.15/SD: 0.18) study sites was visible compared to main forest study sites (0.14 Regarding the campaign 2002 the final mode
showedeminens:
f faer
s which mie (p=0 5**), p nt f forest in a buffer of
012*) (Table 45) l factor wed oporti al relat n to th fruit set os.
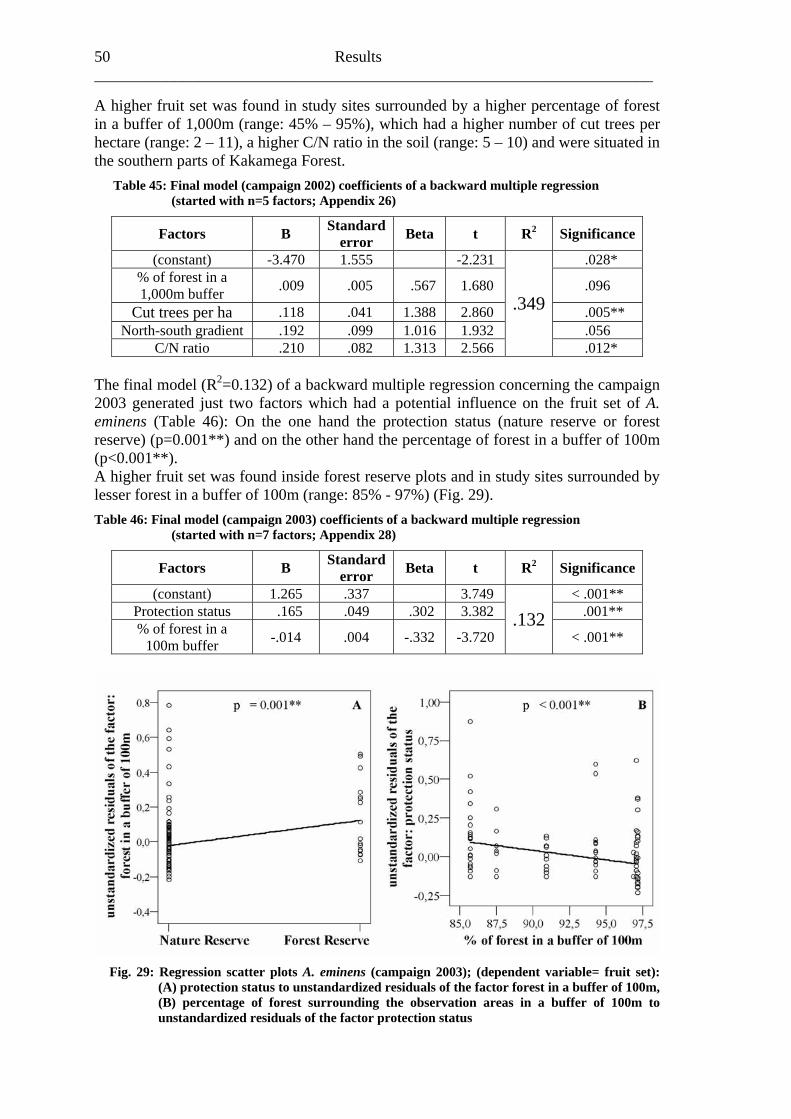
50 Results ______________________________________________________________________
higher fruit set was found in study sites surrounded by a higher percentage of forest in a buffer of 1,000m (range: 45% – 95%), which had a higher number of cut trees per hectare (range: 2 – 11), a higher C/N ratio in the soil (range: 5 – 10) and were situated in the southern parts of Kakamega Forest.
Table 45: Final model (campaign 2002) coefficients of a backward multiple regression (started with n=5 factors; Appendix 26)
Factors B Standard error Beta t R2 Significance
A
(constant) -3.470 1.555 -2.231 .028* % of forest in a 1,000m buffer .009 .005 .567 1.680 .096
Cut trees per ha .118 .041 1.388 2.860 .005** North-south gradient .192 .099 1.016 1.932 .056
C/N ratio .210 .082 1.313 2.566
.349
.012* The final model (R2=0.132) of a backward multiple regression concerning the campaign 2003 generated just two factors which had a . emre rve(p 0.00
Ta multiple regression
potential influence on the fruit set of Ainens (Table 46): On the one hand the protection status (nature reserve or forest
se ) (p=0.001**) and on the other hand the percentage of forest in a buffer of 100m < 1**).
A higher fruit set was found inside forest reserve plots and in study sites surrounded by lesser forest in a buffer of 100m (range: 85% - 97%) (Fig. 29).
ble 46: Final model (campaign 2003) coefficients of a backward (started with n=7 factors; Appendix 28)
Factors B Standard error Beta t R2 Significance
(constant) 1.265 .337 3.749 < .001** Protection status .165 .049 .302 3.382 .001** % of forest in a
100m buffer -.014 .004 -.332 -3.720 .132
< .001**
Fig. 29: Regression scatter plots A. eminens (campaign 2003); (dependent variable= fruit set): (A) protection status to unstandardized residuals of the factor forest in a buffer of 100m, (B) percentage of forest surrounding the observation areas in a buffer of 100m to unstandardized residuals of the factor protection status
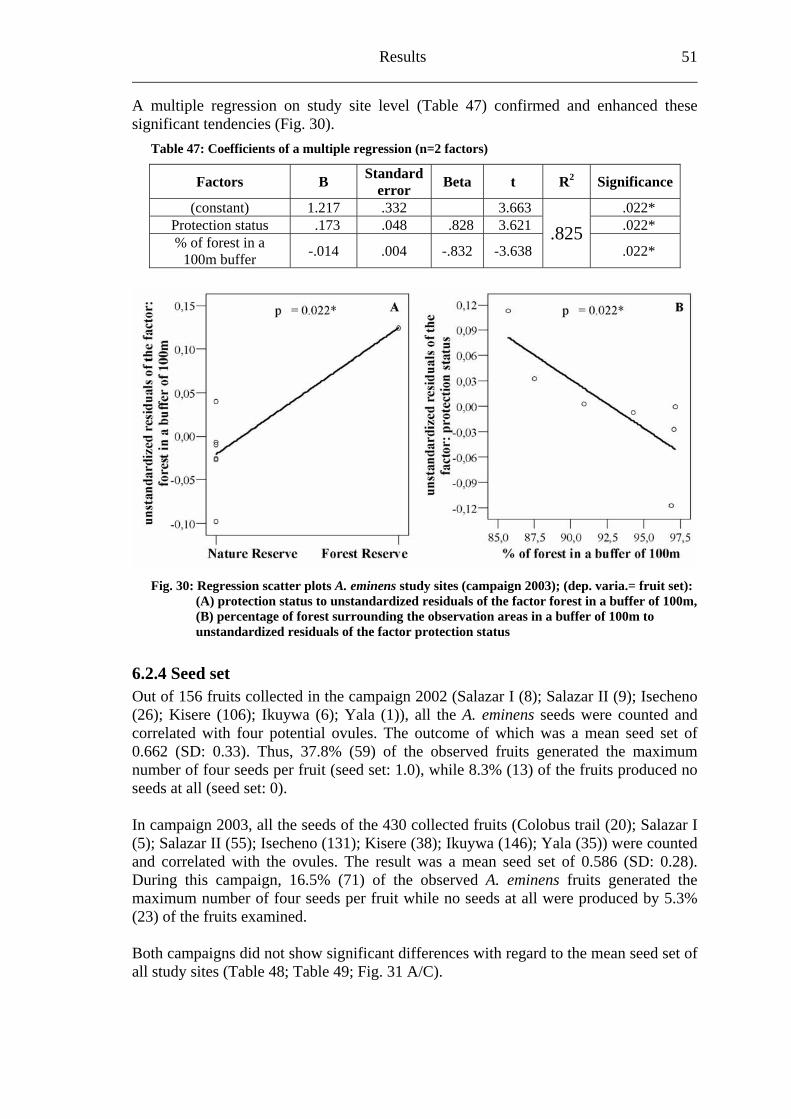
Results 51
multiple regression on study site level (Table 47) confirmed and enhanced these
actors)
Factors B Standard error Beta t R2 Significance
Asignificant tendencies (Fig. 30).
Table 47: Coefficients of a multiple regression (n=2 f
(constant) 1.217 .332 3.663 .022* Protection status .173 .048 .828 3.621 .022* % of forest in a
100m buffer -.014 .004 -.832 -3.638 .825
.022*
Fig. 30: Regression scatter plots A. eminens study sites (campaign 2003); (dep. varia.= fruit set): (A) protection status to unstandardized residuals of the factor forest in a buffer of 100m, (B) percentage of forest surrounding the observation areas in a buffer of 100m to unstandardized residuals of the factor protection status
6.2.4 Seed set Out of 156 fruits collected in the campaign 2002 (Salazar I (8); Salazar II (9); Isecheno (26); Kisere (106); Ikuywa (6); Yala (1)), all the A. eminens seeds were counted and correlated with four potential ovules. The outcome of which was a mean seed set of 0.662 (SD: 0.33). Thus, 37.8% (59) of the observed fruits generated the maximum number of four seeds per fruit (seed set: 1.0), while 8.3% (13) of the fruits produced no seeds at all (seed set: 0). In campaign 2003, all the seeds of the 430 collected fruits (Colobus trail (20); Salazar I (5); Salazar II (55); Isecheno (131); Kisere (38); Ikuywa (146); Yala (35)) were counted and correlated with the ovules. The result was a mean seed set of 0.586 (SD: 0.28). During this campaign, 16.5% (71) of the observed A. eminens fruits generated the maximum number of four seeds per fruit while no seeds at all were produced by 5.3% (23) of the fruits examined. Both campaigns did not show significant differences with regard to the mean seed set of all study sites (Table 48; Table 49; Fig. 31 A/C).
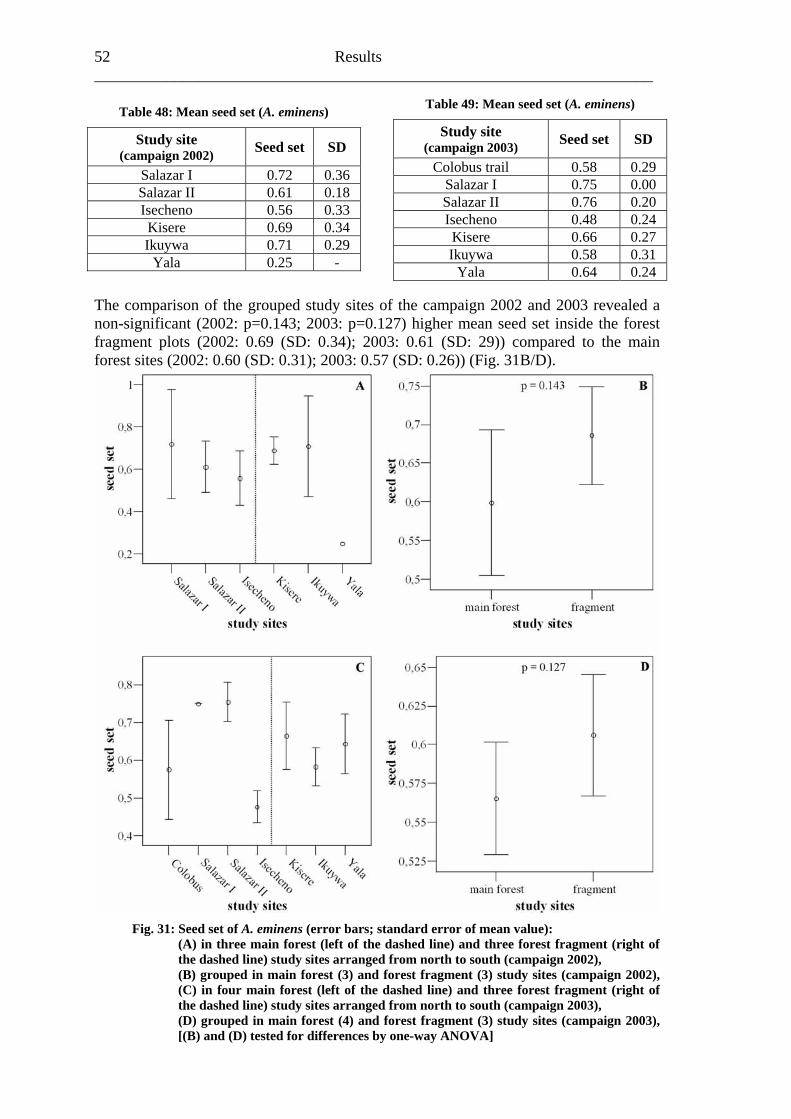
52 Results ______________________________________________________________________
Table 49: Mean seed set (A. eminens) Table 48: Mean seed set (A. eminens)
Study site (campaign 2002) Seed set SD
Salazar I 0.72 0.36 Salazar II 0.61 0.18 Isecheno 0.56 0.33 Kisere 0.69 0.34 Ikuywa 0.71 0.29
Yala 0.25 -
Study site (campaign 2003) Seed set SD
Colobus trail 0.58 0.29 Salazar I 0.75 0.00 Salazar II 0.76 0.20 Isecheno 0.48 0.24 Kisere 0.66 0.27 Ikuywa 0.58 0.31
Yala 0.64 0.24
The comparison of the grouped study sites of the campaign 2002 and 2003 revealed a non-significant (2002: p=0.143; 2003: p=0.127) higher mean seed set inside the forest fragment plots (2002: 0.69 (SD: 0.34); 2003: 0.61 (SD: 29)) compared to the main forest sites (2002: 0.60 (SD: 0.31); 2003: 0.57 (SD: 0.26)) (Fig. 31B/D).
Fig. 31: Seed set of A. eminens (error bars; standard error of mean value): (A) in three main forest (left of the dashed line) and three forest fragment (right of the dashed line) study sites arranged from north to south (campaign 2002), (B) grouped in main forest (3) and forest fragment (3) study sites (campaign 2002), (C) in four main forest (left of the dashed line) and three forest fragment (right of the dashed line) study sites arranged from north to south (campaign 2003), (D) grouped in main forest (4) and forest fragment (3) study sites (campaign 2003), [(B) and (D) tested for differences by one-way ANOVA]
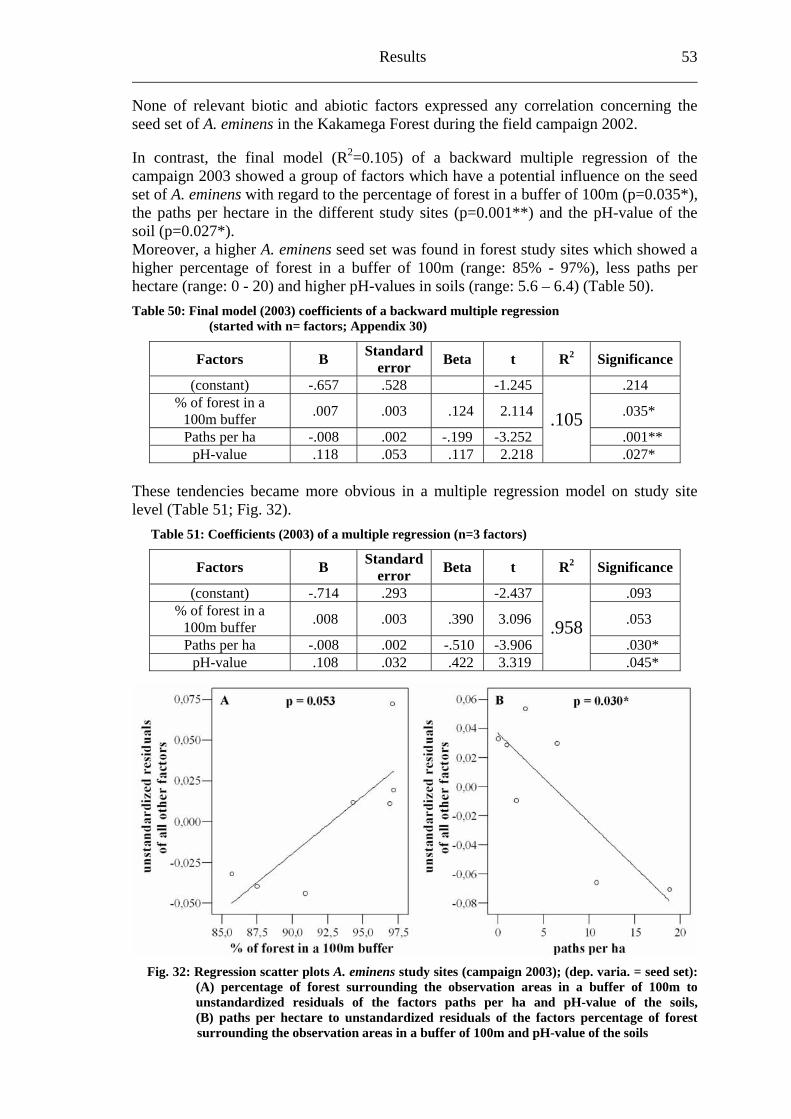
Results 53
None of relevant biotic and abiotic factors expressed any correlation concerning the seed set of A. eminens in the Kakamega Forest during the field campaign 2002. In contrast, the final model (R2=0.105) of a backward multiple regression of the campaign 2003 showed a group of factors which have a potential influence on the seed set of A. eminens with regard to the percentage of forest in a buffer of 100m (p=0.035*), the paths per hectare in the different study sites (p=0.001**) and the pH-value of the soil (p=0.027*). Moreover, a higher A. eminens seed set was found in forest study sites which showed a higher percentage of forest in a buffer of 100m (range: 85% - 97%), less paths per hectare (range: 0 - 20) and higher pH-values in soils (range: 5.6 – 6.4) (Table 50). Table 50: Final model (2003) coefficients of a backward multiple regression (started with n= factors; Appendix 30)
Factors B Standard error Beta t R2 Significance
(constant) -.657 .528 -1.245 .214 % of forest in a
100m buffer .007 .003 .124 2.114 .035*
Paths per ha -.008 .002 -.199 -3.252 .001** pH-value .118 .053 .117 2.218
.105
.027* These tendencies became more obvious in a multiple regression model on study site level (Table 51; Fig. 32).
Table 51: Coefficients (2003) of a multiple regression (n=3 factors)
Factors B Standard error Beta t R2 Significance
(constant) -.714 .293 -2.437 .093 % of forest in a
100m buffer .008 .003 .390 3.096 .053
Paths per ha -.008 .002 -.510 -3.906 .030* pH-value .108 .032 .422 3.319
.958
.045*
Fig. 32: Regression scatter plots A. eminens study sites (campaign 2003); (dep. varia. = seed set): (A) percentage of forest surrounding the observation areas in a buffer of 100m to unstandardized residuals of the factors paths per ha and pH-value of the soils, (B) paths per hectare to unstandardized residuals of the factors percentage of forest surrounding the observation areas in a buffer of 100m and pH-value of the soils
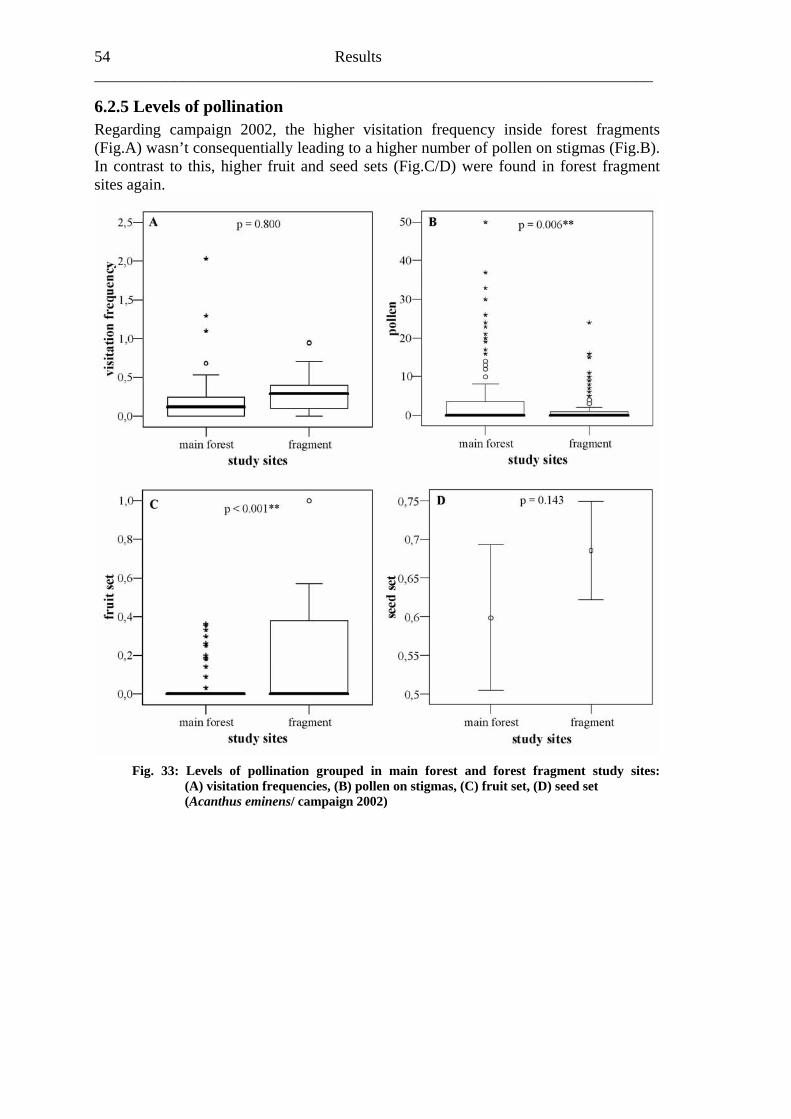
54 Results ______________________________________________________________________
6.2.5 Levels of pollination Regarding campaign 2002, the higher visitation frequency inside forest fragments (Fig.A) wasn’t consequentially leading to a higher number of pollen on stigmas (Fig.B). In contrast to this, higher fruit and seed sets (Fig.C/D) were found in forest fragment sites again.
Fig. 33: Levels of pollination grouped in main forest and forest fragment study sites: (A) visitation frequencies, (B) pollen on stigmas, (C) fruit set, (D) seed set (Acanthus eminens/ campaign 2002)
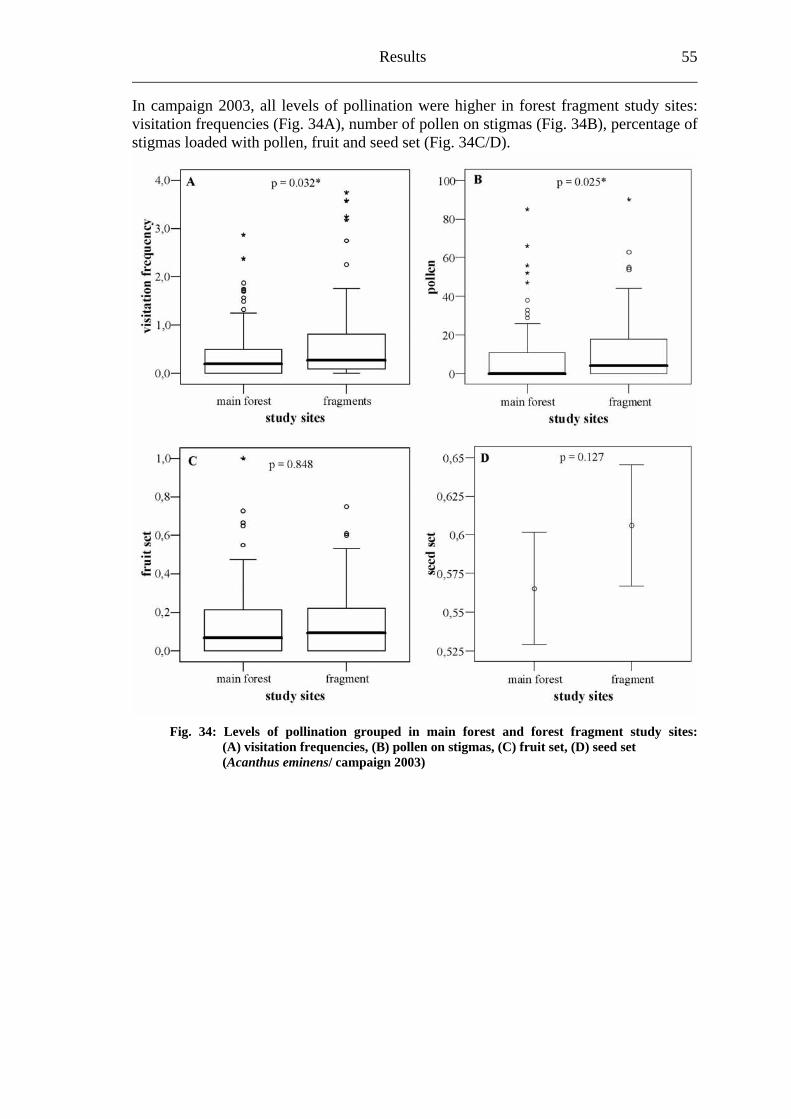
Results 55
In campaign 2003, all levels of pollination were higher in forest fragment study sites: visitation frequencies (Fig. 34A), number of pollen on stigmas (Fig. 34B), percentage of stigmas loaded with pollen, fruit and seed set (Fig. 34C/D).
Fig. 34: Levels of pollination grouped in main forest and forest fragment study sites: (A) visitation frequencies, (B) pollen on stigmas, (C) fruit set, (D) seed set (Acanthus eminens/ campaign 2003)
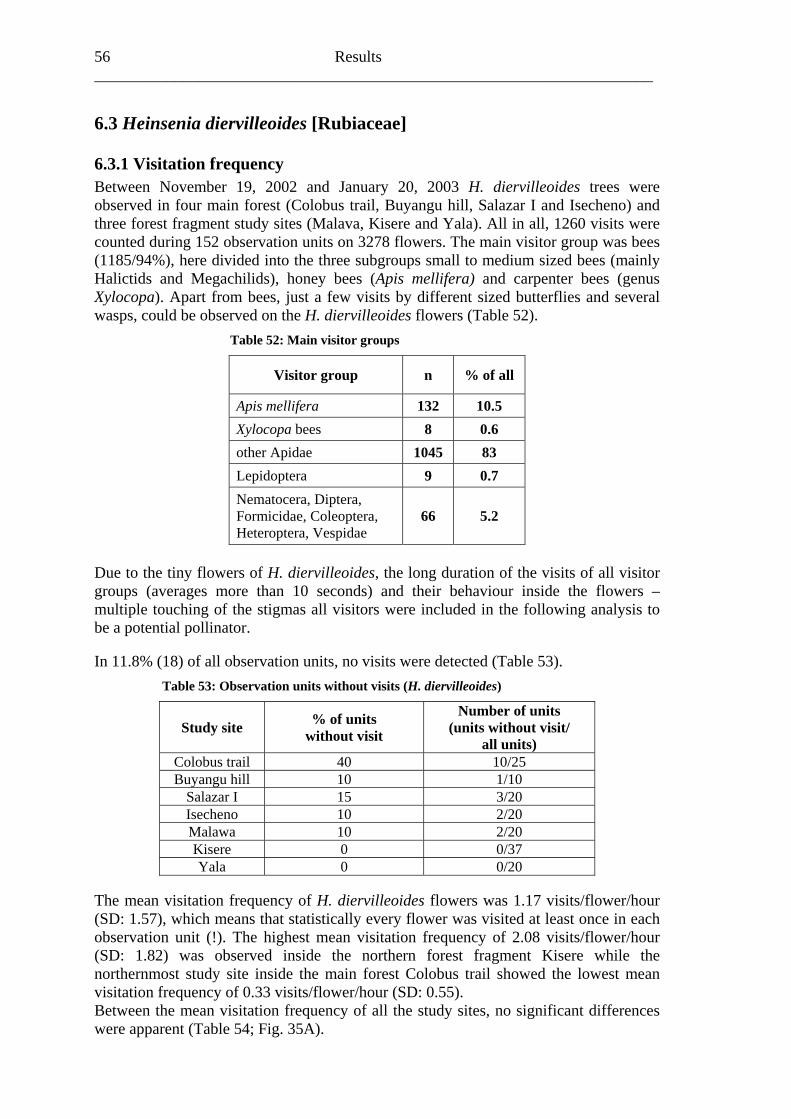
56 Results ______________________________________________________________________
6.3 Heinsenia diervilleoides [Rubiaceae]
6.3.1 Visitation frequency Between November 19, 2002 and January 20, 2003 H. diervilleoides trees were observed in four main forest (Colobus trail, Buyangu hill, Salazar I and Isecheno) and three forest fragment study sites (Malava, Kisere and Yala). All in all, 1260 visits were counted during 152 observation units on 3278 flowers. The main visitor group was bees (1185/94%), here divided into the three subgroups small to medium sized bees (mainly Halictids and Megachilids), honey bees (Apis mellifera) and carpenter bees (genus Xylocopa). Apart from bees, just a few visits by different sized butterflies and several wasps, could be observed on the H. diervilleoides flowers (Table 52).
Table 52: Main visitor groups
Visitor group n % of all
Apis mellifera 132 10.5 Xylocopa bees 8 0.6 other Apidae 1045 83 Lepidoptera 9 0.7 Nematocera, Diptera, Formicidae, Coleoptera, Heteroptera, Vespidae
66 5.2
Due to the tiny flowers of H. diervilleoides, the long duration of the visits of all visitor groups (averages more than 10 seconds) and their behaviour inside the flowers – multiple touching of the stigmas all visitors were included in the following analysis to be a potential pollinator. In 11.8% (18) of all observation units, no visits were detected (Table 53).
Table 53: Observation units without visits (H. diervilleoides)
Study site % of units without visit
Number of units (units without visit/
all units) Colobus trail 40 10/25 Buyangu hill 10 1/10
Salazar I 15 3/20 Isecheno 10 2/20 Malawa 10 2/20 Kisere 0 0/37 Yala 0 0/20
The mean visitation frequency of H. diervilleoides flowers was 1.17 visits/flower/hour (SD: 1.57), which means that statistically every flower was visited at least once in each observation unit (!). The highest mean visitation frequency of 2.08 visits/flower/hour (SD: 1.82) was observed inside the northern forest fragment Kisere while the northernmost study site inside the main forest Colobus trail showed the lowest mean visitation frequency of 0.33 visits/flower/hour (SD: 0.55). Between the mean visitation frequency of all the study sites, no significant differences were apparent (Table 54; Fig. 35A).
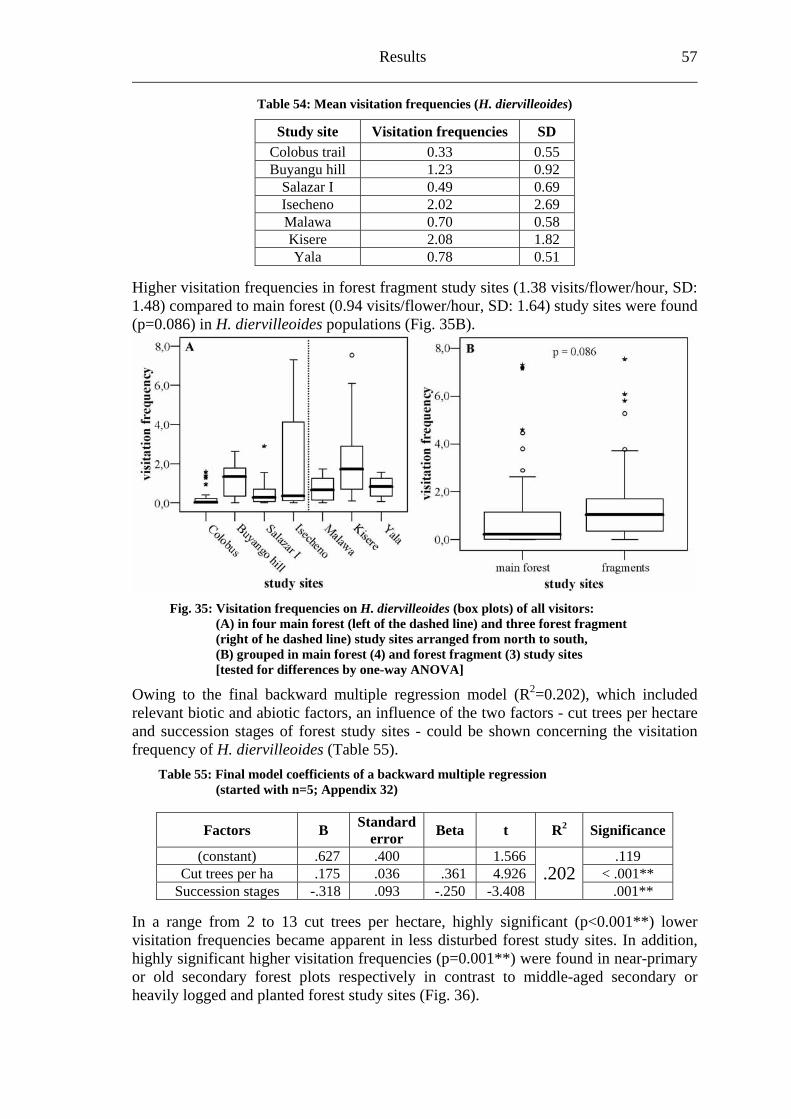
Results 57
Table 54: Mean visitation frequencies (H. diervilleoides)
Study site Visitation frequencies SD Colobus trail 0.33 0.55 Buyangu hill 1.23 0.92
Salazar I 0.49 0.69 Isecheno 2.02 2.69 Malawa 0.70 0.58 Kisere 2.08 1.82 Yala 0.78 0.51
Higher visitation frequencies in forest fragment study sites (1.38 visits/flower/hour, SD: 1.48) compared to main forest (0.94 visits/flower/hour, SD: 1.64) study sites were found (p=0.086) in H. diervilleoides populations (Fig. 35B).
Fig. 35: Visitation frequencies on H. diervilleoides (box plots) of all visitors: (A) in four main forest (left of the dashed line) and three forest fragment (right of he dashed line) study sites arranged from north to south, (B) grouped in main forest (4) and forest fragment (3) study sites [tested for differences by one-way ANOVA]
Owing to the final backward multiple regression model (R2=0.202), which included relevant biotic and abiotic factors, an influence of the two factors - cut trees per hectare and succession stages of forest study sites - could be shown concerning the visitation frequency of H. diervilleoides (Table 55).
Table 55: Final model coefficients of a backward multiple regression (started with n=5; Appendix 32)
Factors B Standard error Beta t R2 Significance
(constant) .627 .400 1.566 .119 Cut trees per ha .175 .036 .361 4.926 < .001**
Succession stages -.318 .093 -.250 -3.408 .202
.001** In a range from 2 to 13 cut trees per hectare, highly significant (p<0.001**) lower visitation frequencies became apparent in less disturbed forest study sites. In addition, highly significant higher visitation frequencies (p=0.001**) were found in near-primary or old secondary forest plots respectively in contrast to middle-aged secondary or heavily logged and planted forest study sites (Fig. 36).
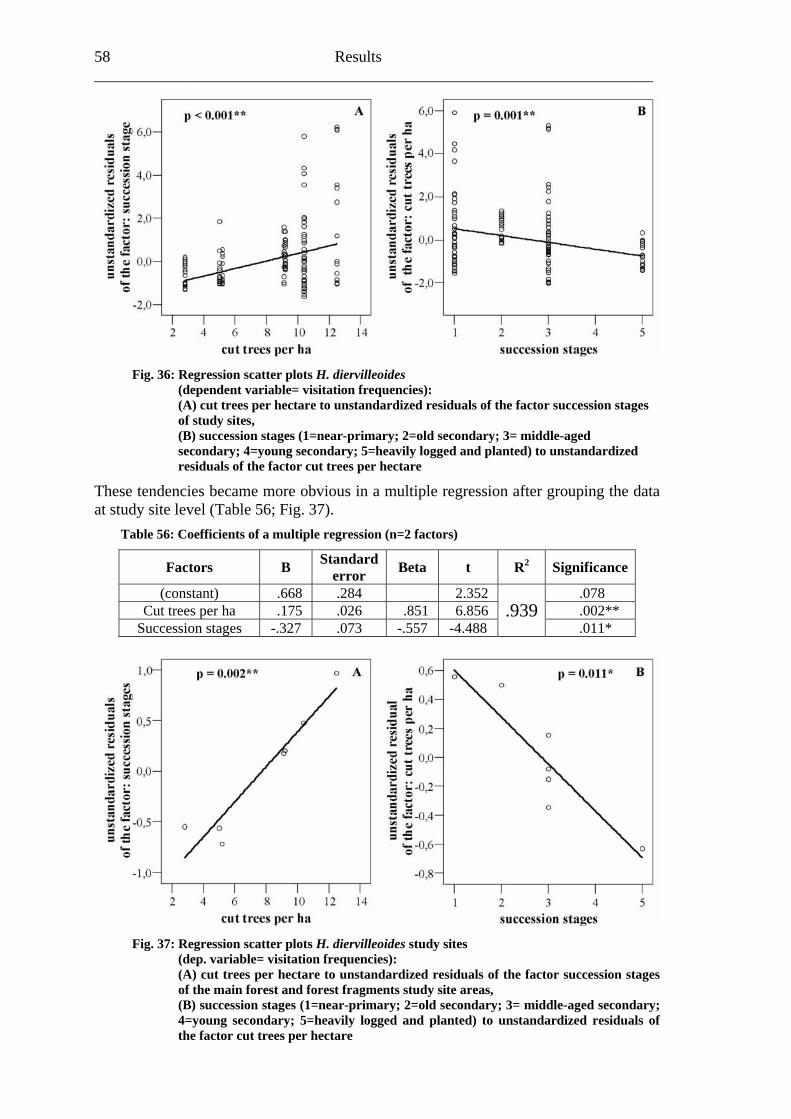
58 Results ______________________________________________________________________
Fig. 36: Regression scatter plots H. diervilleoides (dependent variable= visitation frequencies): (A) cut trees per hectare to unstandardized residuals of the factor succession stages of study sites, (B) succession stages (1=near-primary; 2=old secondary; 3= middle-aged secondary; 4=young secondary; 5=heavily logged and planted) to unstandardized residuals of the factor cut trees per hectare
These tendencies became more obvious in a multiple regression after grouping the data at study site level (Table 56; Fig. 37).
Table 56: Coefficients of a multiple regression (n=2 factors)
Factors B Standard error Beta t R2 Significance
(constant) .668 .284 2.352 .078 Cut trees per ha .175 .026 .851 6.856 .002**
Succession stages -.327 .073 -.557 -4.488 .939
.011*
Fig. 37: Regression scatter plots H. diervilleo es study sites on stages of site areas, (B) succession stages (1=near-primary; 2=old secondary; 3= middle-aged secondary; 4=young secondary; 5=heavily logged and planted) to unstandardized residuals of the factor cut trees per hectare
id (dep. variable= visitation frequencies): (A) cut trees per hectare to unstandardized residuals of the factor successi
the main forest and forest fragments study
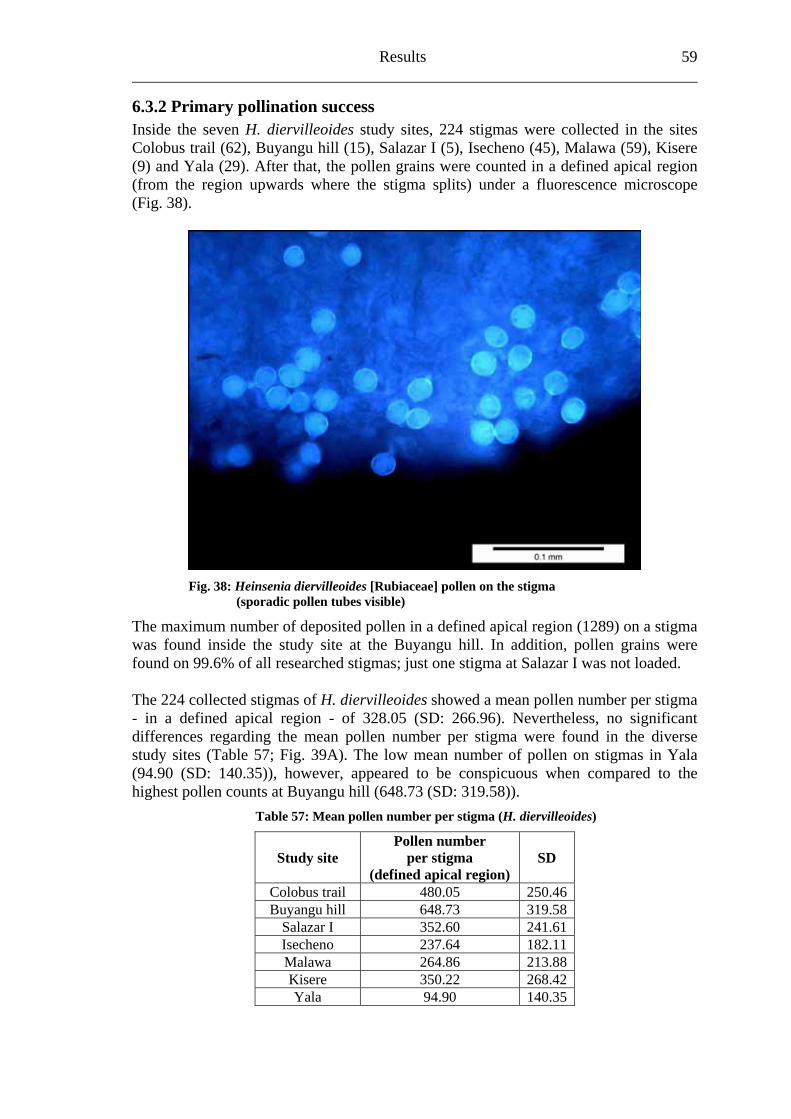
Results 59
6.3.2 Primary pollination success Inside the seven H. diervilleoides study sites, 224 stigmas were collected in the sites Colobus trail (62), Buyangu hill (15), Salazar I (5), Isecheno (45), Malawa (59), Kisere(9) and Yala (29). After that, the pollen grains were counted in a defined apical region (from the region upwards where the stigma splits) under a fluorescence microscope (Fig. 38).
Fig. 38: Heinsenia diervilleoides [Rubiaceae] pollen on the stigma (sporadic pollen tubes visible)
The maximum number of deposited pollen in a defined apical region (1289) on a stigma was found inside the study site at the Buyangu hill. In addition, pollen grains were found on 99.6% of all researched stigmas; just one stigma at Salazar I was not loaded. The 224 collected stigmas of H. diervilleoides showed a mean pollen number per stigma - in a defined apical region - of 328.05 (SD: 266.96). Nevertheless, no significant differences regarding the mean pollen number per stigma were found in the diverse study sites (Table 57; Fig. 39A). The low mean number of pollen on stigmas in Yala (94.90 (SD: 140.35)), however, appeared to be conspicuous when compared to the highest pollen counts at Buyangu hill (648.73 (SD: 319.58)).
Table 57: Mean pollen number per stigma (H. diervilleoides)
Study site Pollen number
per stigma SD (defined apical region)
Colobus trail 480.05 250.46 Buyangu hill 648.73 319.58
Salazar I 352.60 241.61 Isecheno 237.64 182.11 Malawa 264.86 213.88 Kisere 350.22 268.42 Yala 94.90 140.35
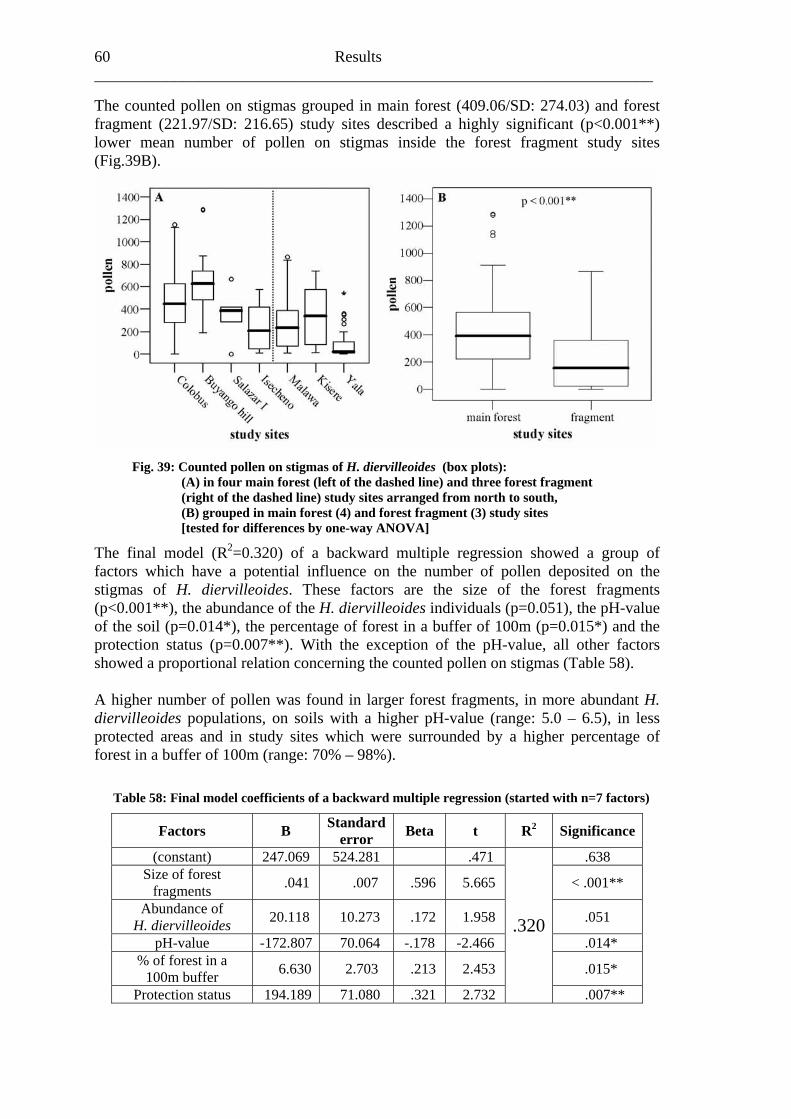
60 Results ______________________________________________________________________
*) wer mean number of pollen on stigmas inside the forest fragment study sites
The counted pollen on stigmas grouped in main forest (409.06/SD: 274.03) and forest fragment (221.97/SD: 216.65) study sites described a highly significant (p<0.001*lo(Fig.39B).
Fig. 39: Counted pollen on s of (b
[tested for differences by one-way ANOVA]
(R2=0.320) of a backward multiple regression showed a group of
(p=0.014*), the percentage of forest in a buffer of 100m (p=0.015*) and the rotection status (p=0.007**). With the exception of the pH-value, all other factors
re abundant H. iervilleoides populations, on soils with a higher pH-value (range: 5.0 – 6.5), in less
Table 58: Final m ession (started with n=7 factors)
Factors B Standaerror t 2 Significance
tigmas H. diervilleoides ox plots): (A) in four main forest (left of the dashed line) and three forest fragment (right of the dashed line) study sites arranged from north to south, (B) grouped in main forest (4) and forest fragment (3) study sites
The final modelfactors which have a potential influence on the number of pollen deposited on the stigmas of H. diervilleoides. These factors are the size of the forest fragments (p<0.001**), the abundance of the H. diervilleoides individuals (p=0.051), the pH-value of the soil pshowed a proportional relation concerning the counted pollen on stigmas (Table 58). A higher number of pollen was found in larger forest fragments, in modprotected areas and in study sites which were surrounded by a higher percentage of forest in a buffer of 100m (range: 70% – 98%).
odel coefficients of a backward multiple regr
rd Beta R
(constant) 524.281 .471 .638 247.069 Size of forest
fragments .007 96 5.665 < .001** .041 .5
Abundance of H. diervilleoides 8 10.273 72 1.958 .051 20.11 .1
pH-value 07 70.064 78 -2.466 .014* -172.8 -.1 % of forest in a
100m buffer 630 2.703 13 2.453 .015*
.32
6. .2
Protection status 194.189 71.080 .321 2.732 .007**
0
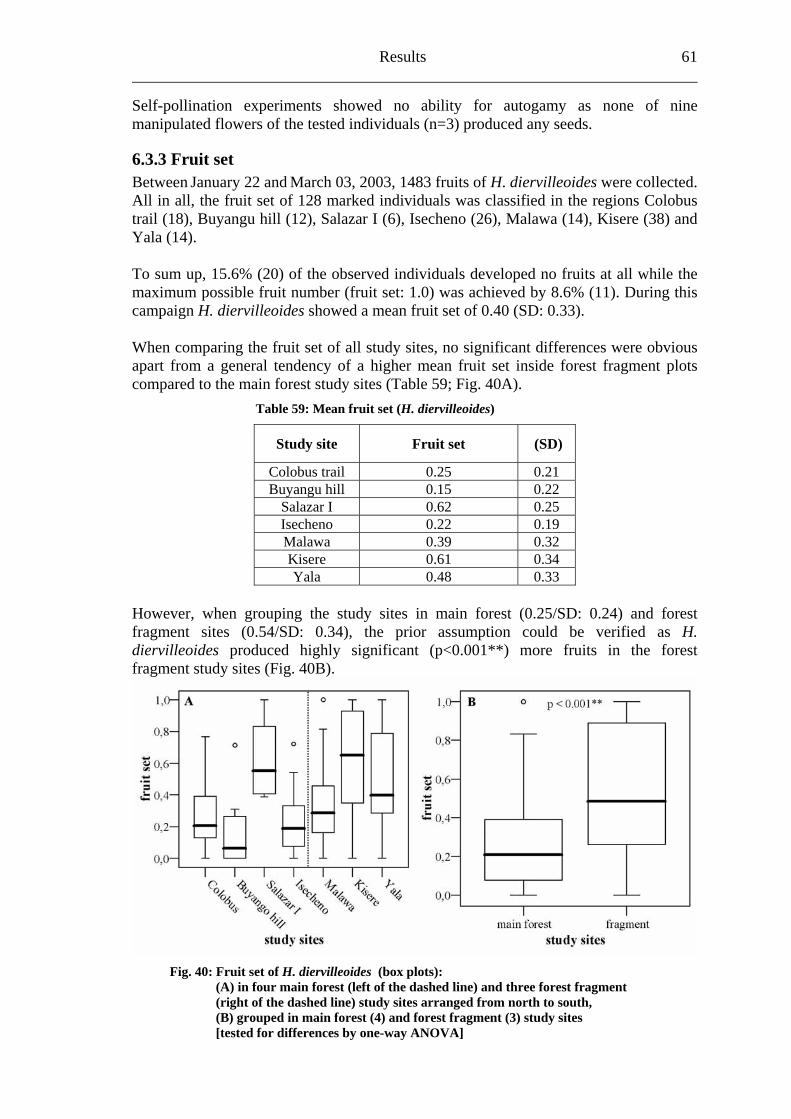
Results 61
individuals (n=3) produced any seeds.
6.3.3Betw collected. All in e ions Colobus trail ( K sere (38) and Yala
: Mean fruit set (H. diervilleoides)
it set (SD)
Self-pollination experiments showed no ability for autogamy as none of nine manipulated flowers of the tested
Fruit set een January 22 and March 03, 2003, 1483 fruits of H. diervilleoides were all, the fruit set of 128 marked individuals was classified in the r g18), Buyangu hill (12), Salazar I (6), Isecheno (26), Malawa (14), i(14).
To sum up, 15.6% (20) of the observed individuals developed no fruits at all while the maximum possible fruit number (fruit set: 1.0) was achieved by 8.6% (11). During this campaign H. diervilleoides showed a mean fruit set of 0.40 (SD: 0.33). When comparing the fruit set of all study sites, no significant differences were obvious apart from a general tendency of a higher mean fruit set inside forest fragment plots compared to the main forest study sites (Table 59; Fig. 40A).
Table 59
Study site Fru
Colobus trail 25 0.21 0. Buya l 0.15 2 ngu hil 0.2
Sal 0.62 5 azar I 0.2Isec 0.22 9 heno 0.1Ma 0.39 2lawa 0.3 Ki 0.61 4 sere 0.3Yala 0.48 3 0.3
However, when grouping the study sites in main forest (0.25/SD: 0.24) and forest
(0.54/SD: 0.34), the prior assumption could be verified as H. fragment sites diervilleoides produced highly significant (p<0.001**) more fruits in the forest fragment study sites (Fig. 40B).
Fig. 40: Fruit set of oides (box plo (A) in four eft of the da ne) and thre t fragment (right of the ne) study sites a ed from nort uth, (B) grouped t (4) and fo agment (3) st tes [tested for differences by one-way ANOVA]
H. diervillem st (l
ts): ain fore
dashed lished lirrang
e foresh to so
in main fores rest fr udy si
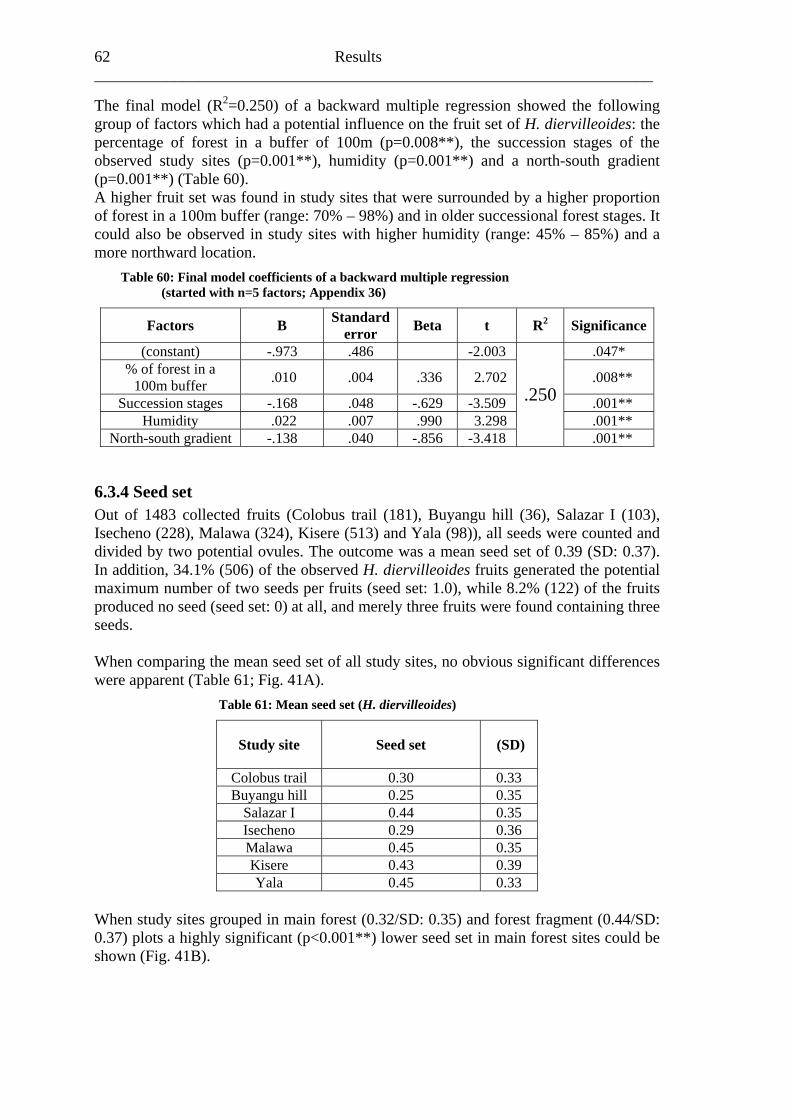
62 Results ______________________________________________________________________
he final model (R2=0.250) of a backward multiple regression showed the following
es (p=0.001**), humidity (p=0.001**) and a north-south gradient (p=0.001**) (Table 60). A higher fruit set was found in study sites that were surrounded by a higher proportion of forest in a 100m buffer (range: 70% – 98%) and in older successional forest stages. It could also be observed in study sites with higher humidity (range: 45% – 85%) and a more northward location.
Table 60: Final model coefficients of a backward multiple regression (started with n=5 factors; Appendix 36)
Factors B Standard error Beta t R2 Significance
Tgroup of factors which had a potential influence on the fruit set of H. diervilleoides: the percentage of forest in a buffer of 100m (p=0.008**), the succession stages of the observed study sit
(constant) -.973 .486 -2.003 .047* % of forest in a
100m buffer .010 .004 .336 2.702 .008**
Succession stages -.168 .048 -.629 -3.509 .001** Humidity .022 .007 .990 3.298 .001**
North-south gradient -.138 .040 -.856 -3.418
.250
.001**
6.3.4Out o S lazar I (103), Isech a (98)), all seeds were counted and
Seed set f 1483 collected fruits (Colobus trail (181), Buyangu hill (36), a
eno (228), Malawa (324), Kisere (513) and Yaldivided by two potential ovules. The outcome was a mean seed set of 0.39 (SD: 0.37). In addition, 34.1% (506) of the observed H. diervilleoides fruits generated the potential maximum number of two seeds per fruits (seed set: 1.0), while 8.2% (122) of the fruits produced no seed (seed set: 0) at all, and merely three fruits were found containing three seeds. When comparing the mean seed set of all study sites, no obvious significant differences were apparent (Table 61; Fig. 41A).
Table 61: Mean seed set (H. diervilleoides)
Study site Seed set (SD)
Colobus trail .30 0.33 0Buyangu hill .2 0.35 0 5
Sal 0.44 .35 azar I 0Isecheno 0.29 0.36 Malawa 0.45 .35 0Kisere 0.43 0.39 Yala 0.45 .330
When study sites grouped in m ent (0.44/SD: 0.37) p ly sign 0.00 low ain forest sites could be sho
ain forest (ificant (p<
0.32/SD: 0.35) and forest fragm1**)lots a high er seed set in m
wn (Fig. 41B).
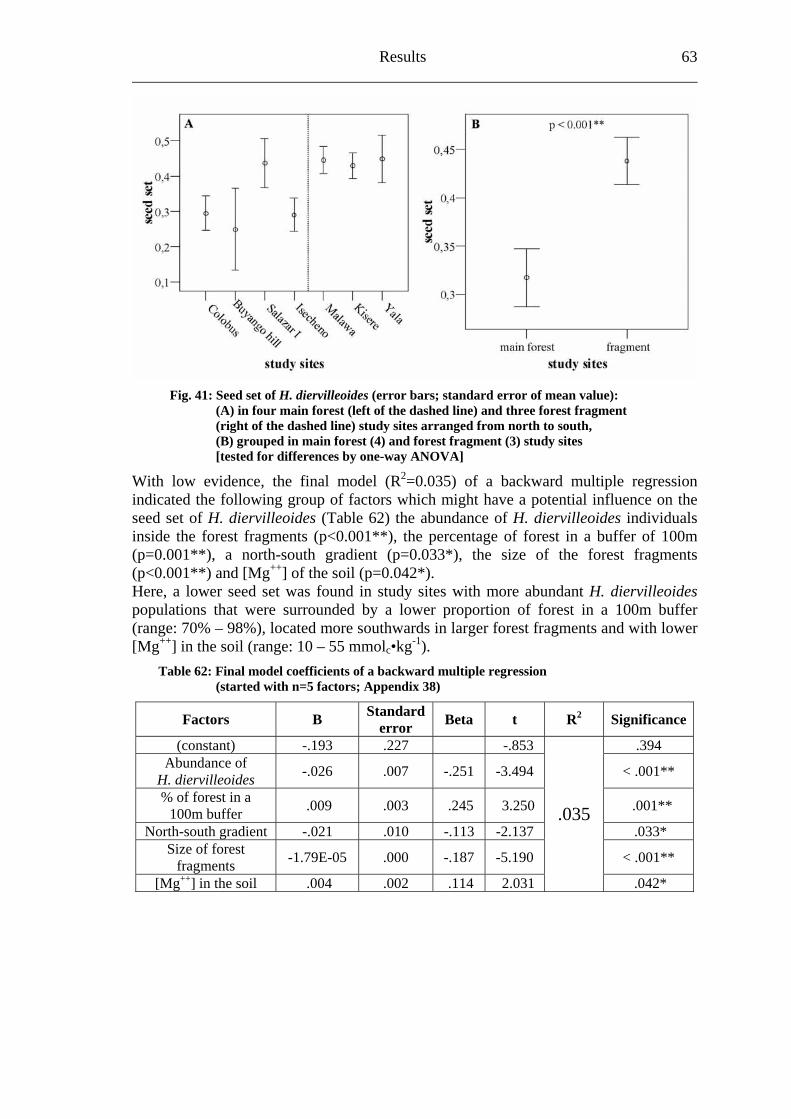
Results 63
Fig. 41: Seed set of H. diervilleoides (error bars; standard error of mean value): (A) in four main forest (left of the dashed line) and three forest fragment (right of the dashed line) study sites arranged from north to south, (B) grouped in main forest (4) and forest fragment (3) study sites [tested for differences by one-way ANOVA]
With low evidence, the final model (R2=0.035) of a backward multiple regression indicated the following group of factors which might have a potential influence on the seed set of H. diervilleoides (Table 62) the abundance of H. diervilleoides individuals inside the forest fragments (p<0.001**), the percentage of forest in a buffer of 100m (p=0.001**), a north-south gradient (p=0.033*), the size of the forest fragments (p<0.001**) and [Mg++] of the soil (p=0.042*). Here, a lower seed set was found in study sites with more abundant H. diervilleoides populations that were surrounded by a lower proportion of forest in a 100m buffer (range: 70% – 98%), located more southwards in larger forest fragments and with lower [Mg++] in the soil (range: 10 – 55 mmolc•kg-1).
Table 62: Final model coefficients of a backward multiple regression (started with n=5 factors; Appendix 38)
Factors B Standard error Beta t R2 Significance
(constant) -.193 .227 -.853 .394 Abundance of
H. diervilleoides -.026 .007 -.251 -3.494 < .001**
% of forest in a 100m buffer .009 .003 .245 3.250 .001**
North-south gradient -.021 .010 -.113 -2.137 .033* Size of forest
fragments -1.79E-05 .000 -.187 -5.190 < .001**
[Mg++] in the soil .004 .002 .114 2.031
.035
.042*
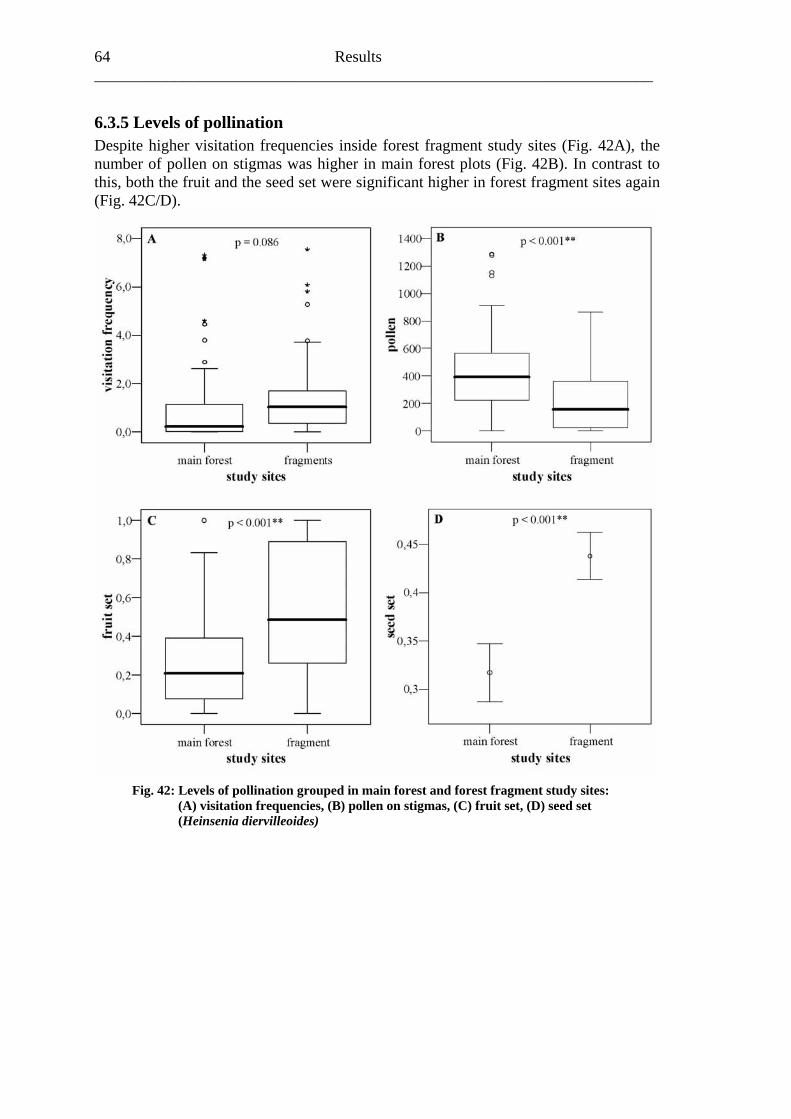
64 Results ______________________________________________________________________
Despite higher visitation frequencies inside forest fragment study sites (Fig. 42A), the as was higher in main forest plots (Fig. 42B). In contrast to
6.3.5 Levels of pollination
number of pollen on stigmthis, both the fruit and the seed set were significant higher in forest fragment sites again (Fig. 42C/D).
Fig. 42: Levels of pollination grouped in main forest and forest fragment study sites: (A) visitation frequencies, (B) pollen on stigmas, (C) fruit set, (D) seed set (Heinsenia diervilleoides)
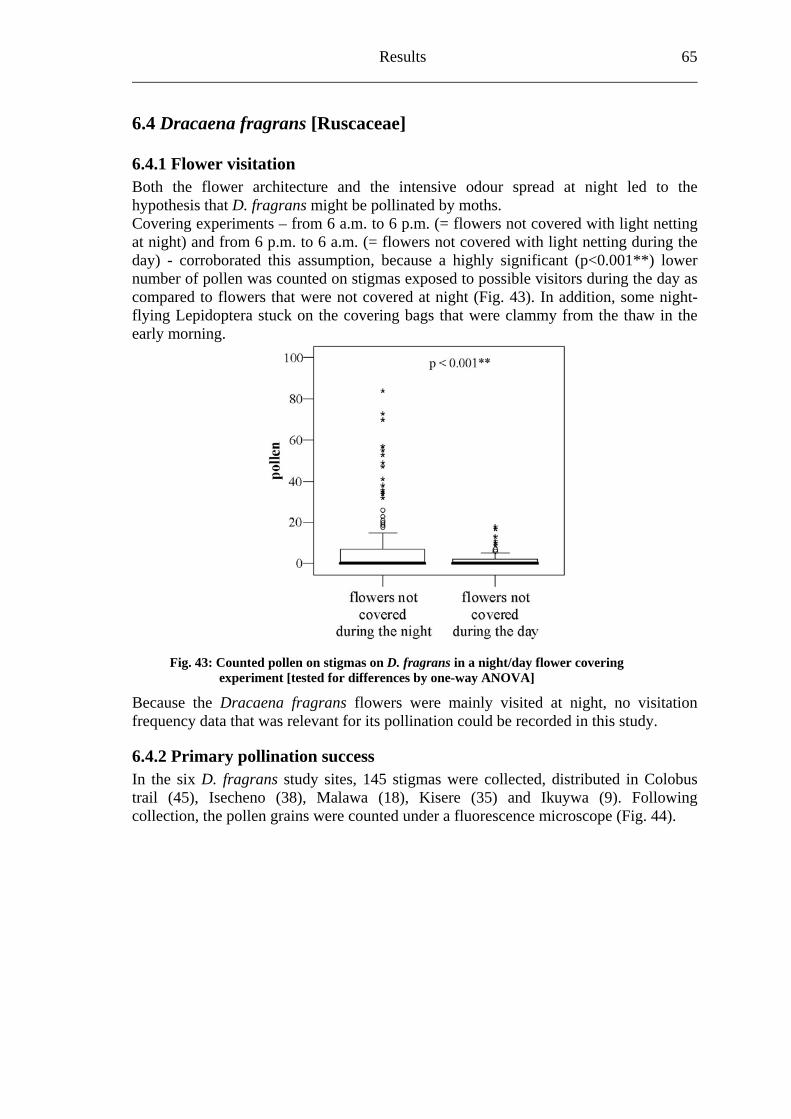
Results 65
6.4 Dracaena fragrans ceae]
6.4.1 Flower visitation oth the flower architectu e odour spread at night led to the
at night (Fig. 43). In addition, some night-flying Lepidoptera m the thaw in the early morning.
[Rusca
B re and the intensivhypothesis that D. fragrans might be pollinated by moths. Covering experiments – from 6 a.m. to 6 p.m. (= flowers not covered with light netting at night) and from 6 p.m. to 6 a.m. (= flowers not covered with light netting during the day) - corroborated this assumption, because a highly significant (p<0.001**) lower number of pollen was counted on stigmas exposed to possible visitors during the day as compared to flowers that were not covered
stuck on the covering bags that were clammy fro
Fig. 43: Counted pollen on stigmas on D. fragrans in a night/day flower covering experiment [tested for differences by one-way ANOVA]
Because the Dracaena fragrans flowers were mainly visited at night, no visitation frequency data that was relevant for its pollination could be recorded in this study.
6.4.2 Primary pollination success In the six D. fragrans study sites, 145 stigmas were collected, distributed in Colobus trail (45), Isecheno (38), Malawa (18), Kisere (35) and Ikuywa (9). Following collection, the pollen grains were counted under a fluorescence microscope (Fig. 44).
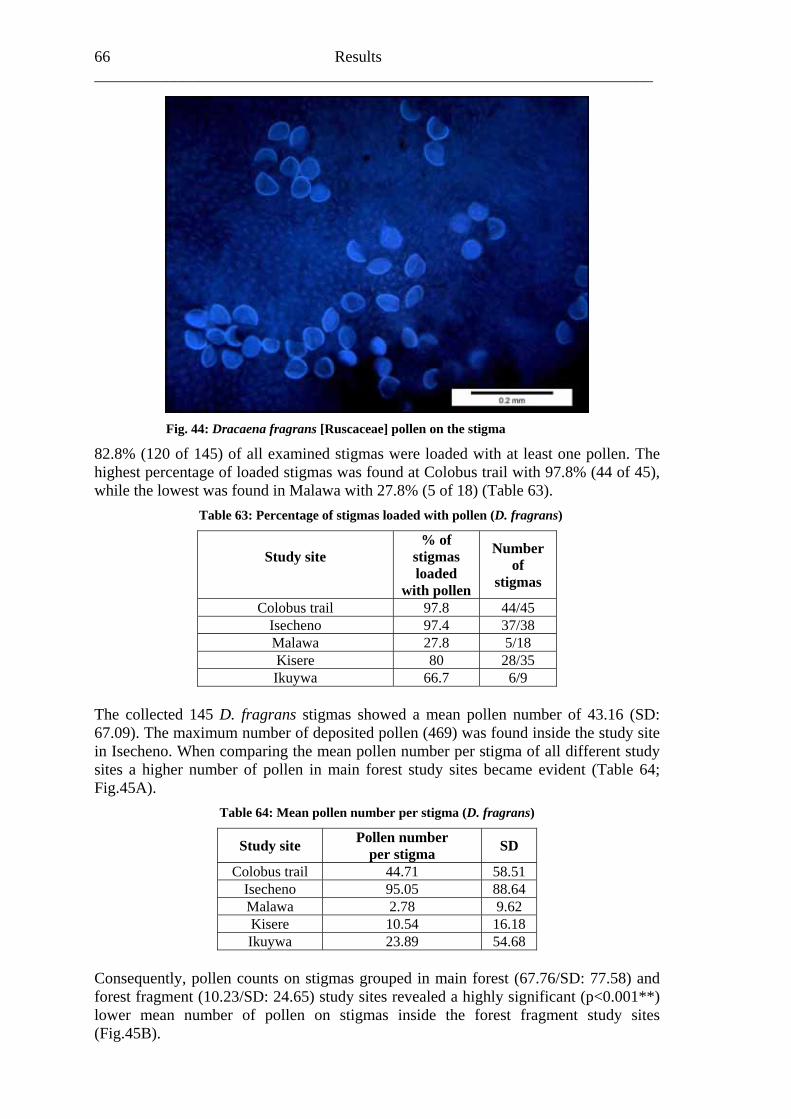
66 Results ______________________________________________________________________
Fig. 44: Dracaen [R ] pollen on t
63: Percentage of stigmas loaded with pollen (D. fragrans)
a fragrans uscaceae he stigma
82.8% (120 of 145) of all examined stigmas were loaded with at least one pollen. The highest percentage of loaded stigmas was found at Colobus trail with 97.8% (44 of 45), while the lowest was found in Malawa with 27.8% (5 of 18) (Table 63).
Table
Study site
% of stigmas loaded
with pollen
Number of
stigmas
Colobus trail 97.8 44/45 Isecheno 97.4 37/38 Malawa 27.8 5/18 Kisere 80 28/35 Ikuywa 66.7 6/9
The collected 145 D. fragrans stigmas showed a mean pollen number of 43.16 (SD: 67.09). The maxim 9) was found inside the study site in Isecheno. When a of all different study sites a higher number of pollen in main forest study sites became evident (Table 64; Fig.45A).
T ollen numbe stigma (D. fr )
Study site Pollen number per stigma
um number of deposited pollen (46 comparing the mean pollen number per stigm
able 64: Mean p r per agrans
SD
Colobus trail 44.71 58.51 Isecheno 95.05 88.64 Malawa 2.78 9.62 Kisere 10.54 16.18 Ikuywa 23.89 54.68
Consequently, pollen counts on stigmas grouped in main forest (67.76/SD: 77.58) and forest 001**) lower udy sites (Fig.4
fragment (10.23/SD: 24.65) study sites revealed a highly significant (p<0. mean number of pollen on stigmas inside the forest fragment st5B).
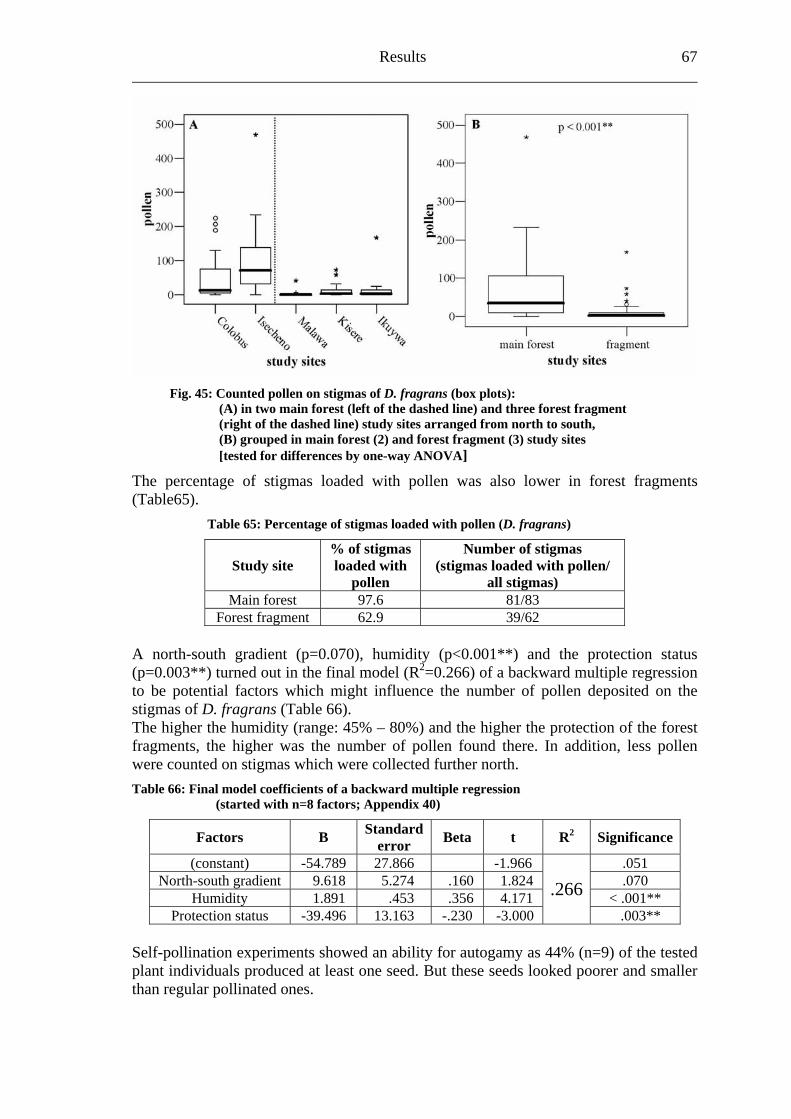
Results 67
Fig. 45: Counted pollen on stigmas of D. fragrans (box plots): (A) in two main forest (left of the dashed line) and three forest fragment (right of the dashed line) study sites arranged from north to south, (B) grouped in main forest (2) and forest fragment (3) study sites [tested for differences by one-way ANOVA]
The percentage of stigmas loaded with pollen was also lower in forest fragments (Table65).
Table 65: Percentage of stigmas loaded with pollen (D. fragrans)
Study site % of stigmas loaded with
pollen
Number of stigmas (stigmas loaded with pollen/
all stigmas) Main forest 97.6 81/83
Forest fragment 62.9 39/62 A north-south gradient (p=0.070), humidity (p<0.001**) and the protection status (p=0.003**) turned out in the final model (R2=0.266) of a backward multiple regression to be potential factors which might influence the number of pollen deposited on the stigmas of D. fragrans (Table 66). The higher the humidity (range: 45% – 80%) and the higher the protection of the forest fragments, the higher was the number of pollen found there. In addition, less pollen were counted on stigmas which were collected further north. Table 66: Final model coefficients of a backward multiple regression (started with n=8 factors; Appendix 40)
Factors B Standard error Beta t R2 Significance
(constant) -54.789 27.866 -1.966 .051 North-south gradient 9.618 5.274 .160 1.824 .070
Humidity 1.891 .453 .356 4.171 < .001** Protection status -39.496 13.163 -.230 -3.000
.266 .003**
Self-pollination experiments showed an ability for autogamy as 44% (n=9) of the tested plant individuals produced at least one seed. But these seeds looked poorer and smaller than regular pollinated ones.
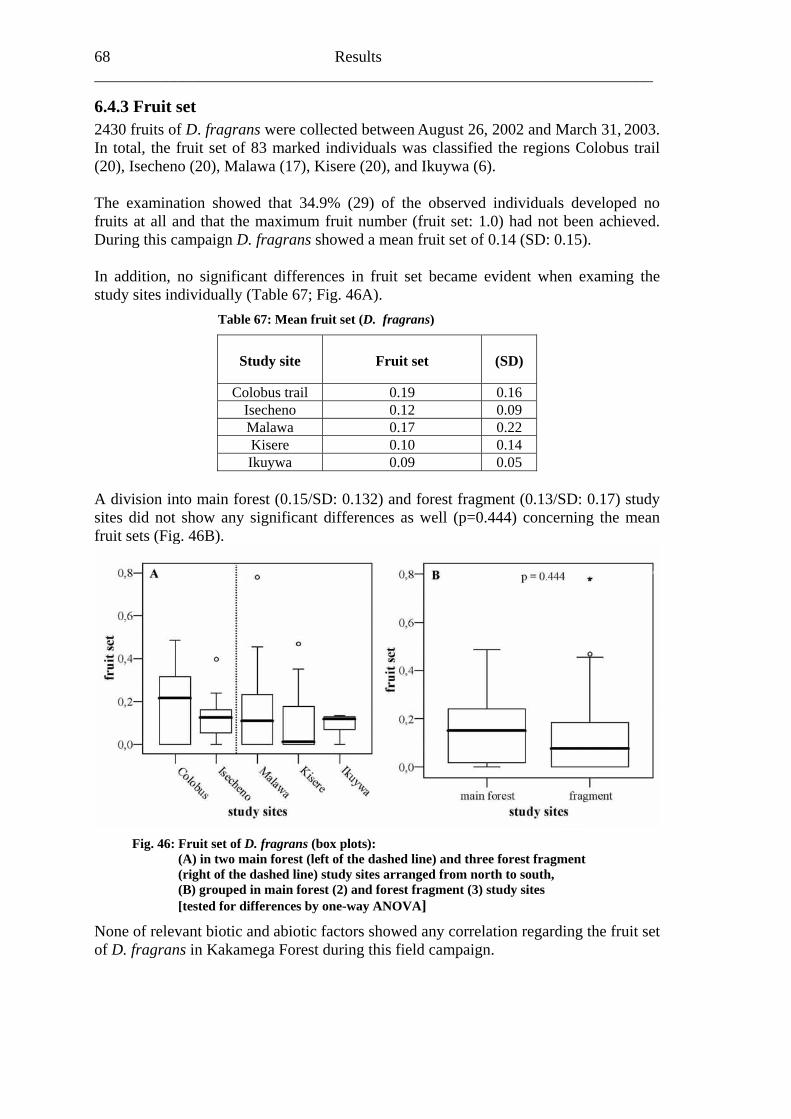
68 Results ______________________________________________________________________
6.4.3 Fruit set fragrans were collected between August 26, 2002 and March 31, 2003.
fragrans showed a mean fruit set of 0.14 (SD: 0.15).
2430 fruits of D.In total, the fruit set of 83 marked individuals was classified the regions Colobus trail (20), Isecheno (20), Malawa (17), Kisere (20), and Ikuywa (6). The examination showed that 34.9% (29) of the observed individuals developed no fruits at all and that the maximum fruit number (fruit set: 1.0) had not been achieved. During this campaign D. In addition, no significant differences in fruit set became evident when examing the study sites individually (Table 67; Fig. 46A).
Table 67: Mean fruit set (D. fragrans)
Study site
Fruit set
(SD)
Colobus trail 0.19 0.16 Isecheno 0.12 0.09 Malawa 0.17 0.22 Kisere 0.10 0.14 Ikuywa 0.09 0.05
division into main forest (0.15/SD: 0.132) and forest fragment (0.13/SD: 0.17) study A
sites did not show any significant differences as well (p=0.444) concerning the mean fruit sets (Fig. 46B).
Fig. 46: Fruit set of D. fragrans (box plots):
nt
None of relevant biotic and
(A) in two main forest (left of the dashed line) and three forest fragme (right of the dashed line) study sites arranged from north to south, (B) grouped in main forest (2) and forest fragment (3) study sites [tested for differences by one-way ANOVA]
abiotic factors showed any correlation regarding the fruit setof D. fragrans in Kakamega Forest during this field campaign.
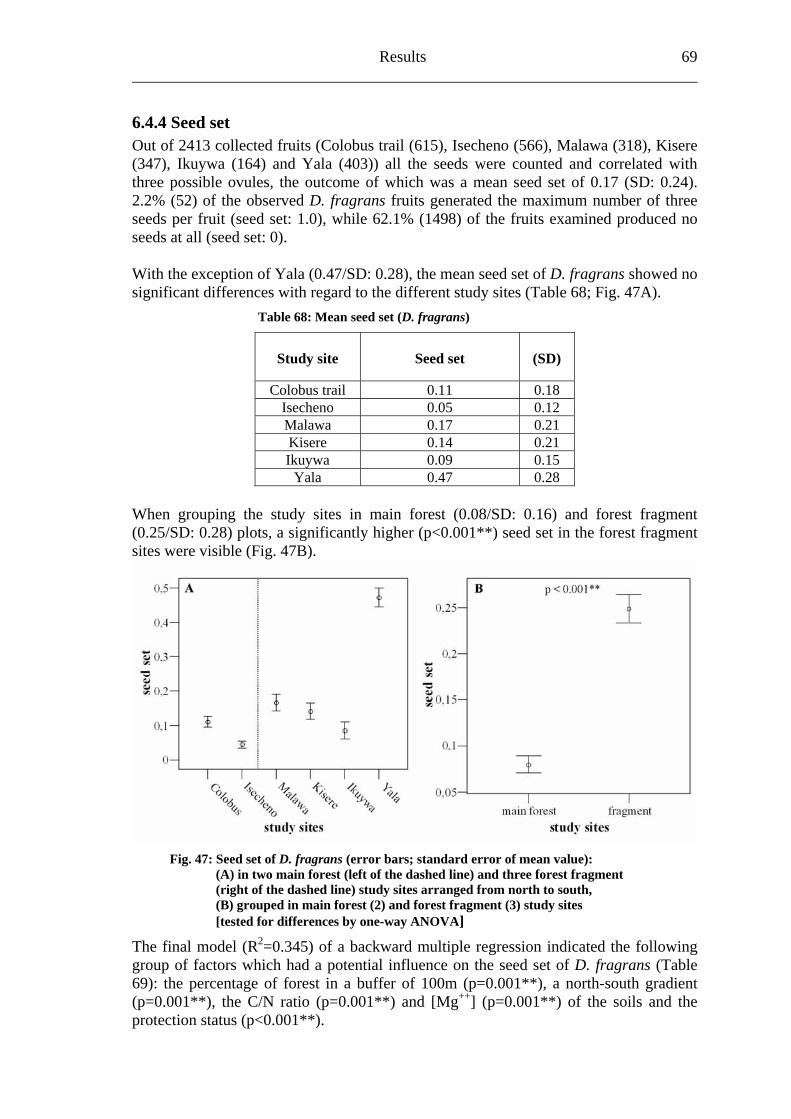
Results 69
the outcome of which was a mean seed set of 0.17 (SD: 0.24). 2. xi um number of three seeds per fruit (seed set: 1.0), while 62.1% (1498) of the fruits examined produced no seeds at all (seed set: 0). With the exception of Yala (0.47/SD: 0.28), the mean seed set of D. fragran no significant differences with regard to the able 68; Fig. 47A).
Table 68 seed . fragr
Study site See (SD)
6.4.4 Seed set Out of 2413 collected fruits (Colobus trail (615), Isecheno (566), Malawa (318), Kisere (347), Ikuywa (164) and Yala (403)) all the seeds were counted and correlated with three possible ovules,
2% (52) of the observed D. fragrans fruits generated the ma m
s showeddifferent study sites (T
set (D: Mean ans)
d set
Colobus trail 0.11 0.18 Isecheno 0.05 0.12 Malawa 0.17 0.21 Kisere 0.14 0.21 Ikuywa 0.09 0.15
Yala 0.47 0.28
si
When grouping the study sites in main forest (0.08/SD: 0.16) and forest fragment (0.25/SD: 0.28) plots, a significantly higher (p<0.001**) seed set in the forest fragment
tes were visible (Fig. 47B).
Fig. 47: Seed set of D. fragrans (error bars; standard error of mean value): (A) in two main forest (left of the dashed line) and three forest fragment (right of the dashed line) study sites arranged from north to south, (B) grouped in main forest (2) and forest fragment (3) study sites [tested for differences by one-way ANOVA]
The final model (R2=0.345) of a backward multiple regression indicated the following group of factors which had a potential influence on the seed set of D. fragrans (Table 69): the percentage of forest in a buffer of 100m (p=0.001**), a north-south gradient (p=0.001**), the C/N ratio (p=0.001**) and [Mg++] (p=0.001**) of the soils and the protection status (p<0.001**).
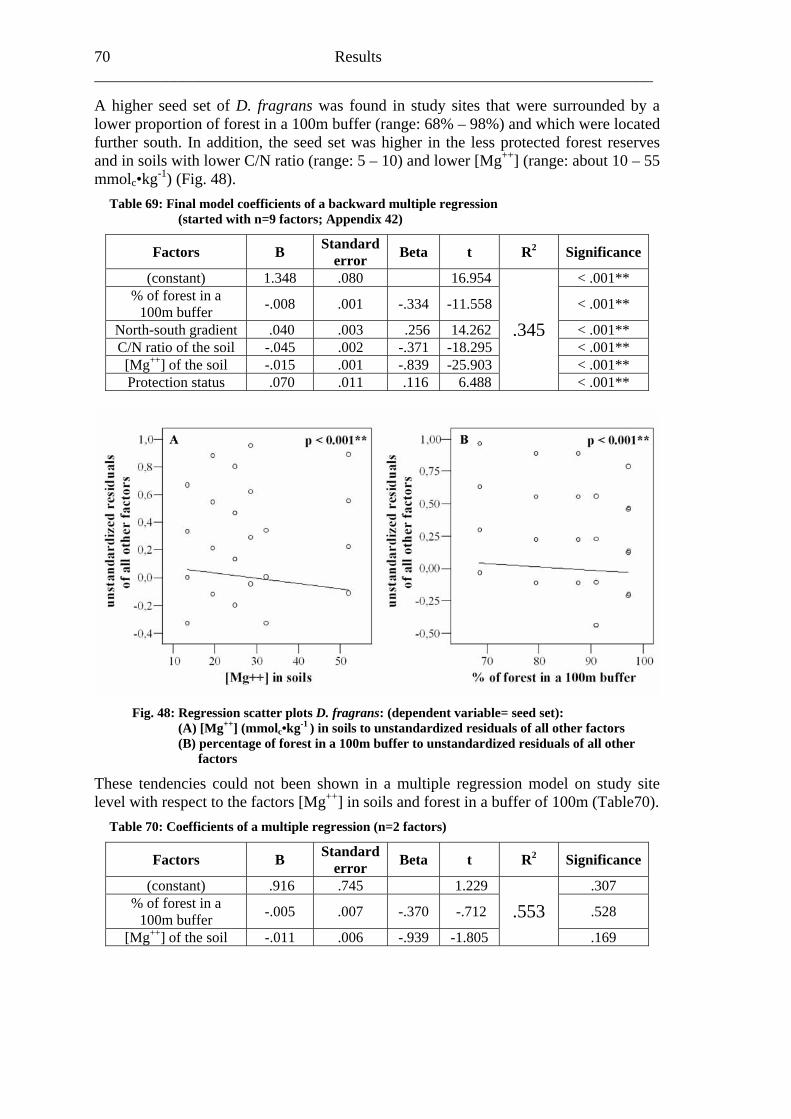
70 Results ______________________________________________________________________ A higher seed set of D. fragrans was found in study sites that were surrounded by a
100m buffer (range: 68% – 98%) and which were located
Table 69: Final model coefficients of a backward multiple regression (started with n=9 factors; Appendix 42)
Factors B Standard error Beta t R2 Significance
lower proportion of forest in a further south. In addition, the seed set was higher in the less protected forest reserves and in soils with lower C/N ratio (range: 5 – 10) and lower [Mg++] (range: about 10 – 55 mmolc•kg-1) (Fig. 48).
(constant) 1.348 .080 16.954 < .001** % of forest in a
100m buffer -.008 .001 -.334 -11.558 < .001**
North-south gradient .040 .003 .256 14.262 < .001** C/N ratio of the soil -.045 .002 -.371 -18.295 < .001** [Mg++] of the soil -.015 .001 -.839 -25.903 < .001** Protection status .070 .011 .116 6.488
.345
< .001**
Fig. 48: Regression scatter plots D. fragrans: (dependent variable= seed set): (A) [Mg++] (mmolc•kg-1 ) in soils to unstandardized residuals of all other factors (B) percentage of forest in a 100m buffer to unstandardized residuals of all other
These l on study site level with respect to the factors [Mg ] in soils and forest in a buffer of 100m (Table70).
Table 70: Coefficients of a multiple regression (n=2 factors)
Factors B Standard error Beta t R2 Significance
factors
tendencies could not been shown in a multiple regression mode++
(constant) .916 .745 1.229 .307 % of forest in a
100m buffer -.005 .007 -.370 -.712 .528
[Mg++] of the soil -.011 .006 -.939 -1.805
.553 .169
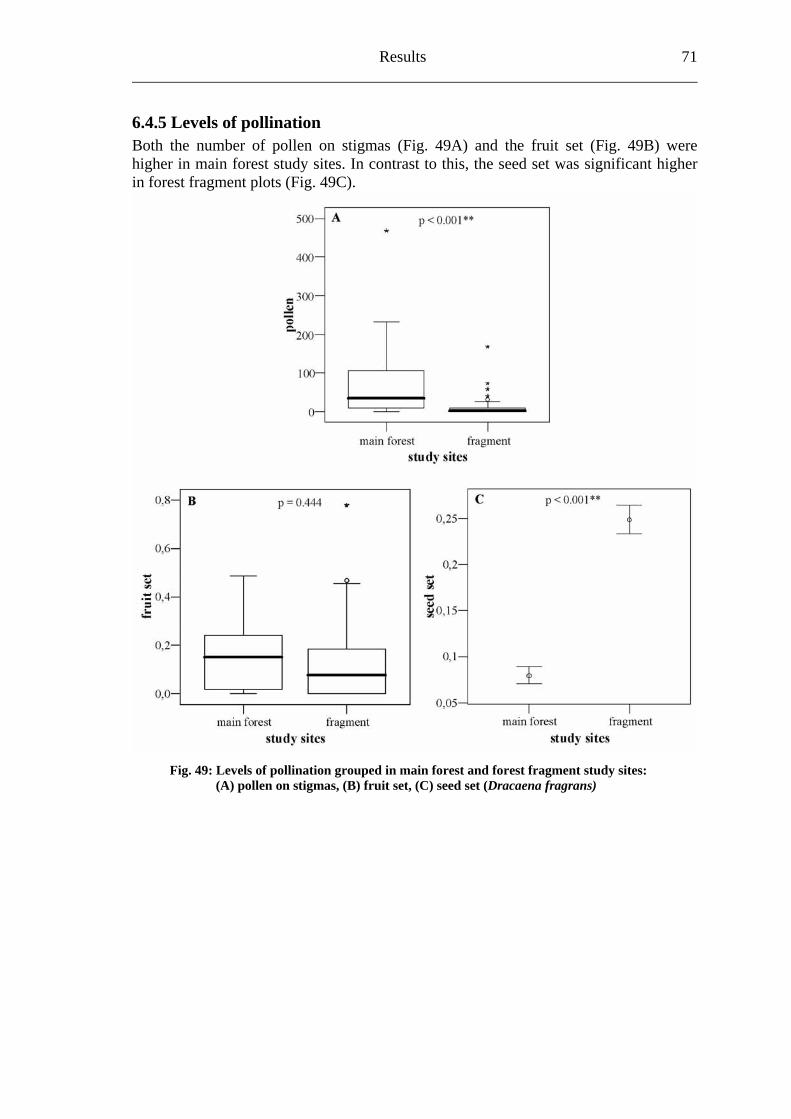
Results 71
lination Both the number of pollen fruit set (Fig. 49B) were higher in main fores s significant higher in forest fragment plots (Fig. 49C).
6.4.5 Levels of pol on stigmas (Fig. 49A) and the
t study sites. In contrast to this, the seed set wa
Fig. 49: Levels of pollination grouped in main forest and forest fragment study sites: (A) pollen on stigmas, (B) fruit set, (C) seed set (Dracaena fragrans)
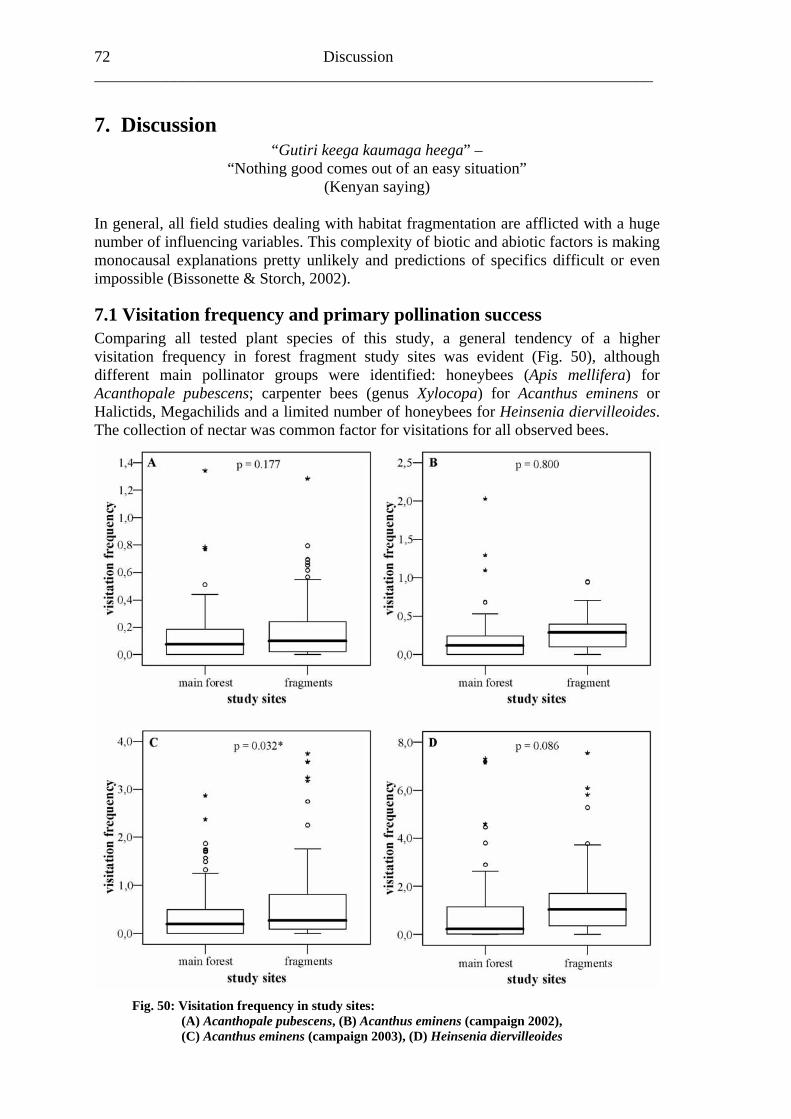
72 Discussion ______________________________________________________________________
ommon factor for visitations for all observed bees.
7. Discussion “Gutiri keega kaumaga heega” –
“Nothing good comes out of an easy situation” (Kenyan saying)
In general, all field studies dealing with habitat fragmentation are afflicted with a huge number of influencing variables. This complexity of biotic and abiotic factors is making monocausal explanations pretty unlikely and predictions of specifics difficult or even impossible (Bissonette & Storch, 2002).
7.1 Visitation frequency and primary pollination success Comparing all tested plant species of this study, a general tendency of a higher visitation frequency in forest fragment study sites was evident (Fig. 50), although different main pollinator groups were identified: honeybees (Apis mellifera) for Acanthopale pubescens; carpenter bees (genus Xylocopa) for Acanthus eminens or Halictids, Megachilids and a limited number of honeybees for Heinsenia diervilleoides.
he collection of nectar was cT
Fig. 50: Visitation frequency in study sites: (A) Acanthopale pubescens, (B) Acanthus eminens (campaign 2002), (C) Acanthus eminens (campaign 2003), (D) Heinsenia diervilleoides
Discussion 73
eaceae]) in smaller (1 ha) compared to larger (>20 ha) rain forest agments, has already described from southern Chile (Smith-Ramirez & Armesto,
umidity and loudiness; the diversity of habitat types; the diversity and abundance of plant and
redation on visitors; the amount and quality of nectar, but also the
ee abundance
mega Forest (Gikungu, 2006), owed a bee fauna richer in diversity and abundance around the forest compared to the
side the forest sites could be expected,
The same phenomenon of a higher number of bird visits on tree flowers (Embothrium coccineum [Protfr2003). Higher visitation frequency is either the result of higher visitor abundance on the flowers or a higher number of visits per visitor. Both scenarios might be influenced by various abiotic and biotic factors: e.g. the microclimate like temperature, hcvisitor species; the pavailability of the resource nectar inside the forage range. At the same time many parameters are linked with each other. BAs generally known, bees invaded almost all parts of the world, nevertheless the greatest diversity is found in warm and dry areas (O' Toole & Raw, 1999). In addition, bees are more abundant in warm-temperate xeric regions (Michener, 1979). Along a humidity-gradient the greatest abundance of bees was also documented in the dryer extreme (Devoto et al., 2005). Here, nesting conditions might play an important role (Michener, 2000). However, other reasons for patterns of abundance of bees like diversity of habitat types (Steffan-Dewenter et al., 2002), plant diversity and abundance (Potts et al., 2001; Ghazoul, 2006) and predation of larvae by ants (Michener, 2000) have been reported. Two of these three factors also might promote higher abundance of bees inside the Kakamega Forest fragments as explained below. The recently conducted bee study in and next to Kakashforest islands itself. Generally a higher influence of the dryer bush and farmland and its bee populations could be postulated compared to the main forest, due to higher forest edge proportion of the forest fragments. As likely as not, foraging flights of these bees - many flights into the forest have been observed - might enclose the entire forest fragments (65 ha -1.370 ha). But in this context, Steffan-Dewenter et al. (2006) remarked that the response to habitat fragmentation on bee communities is still poorly understood. Basically, the nectar gathered by foraging bees must cover the cost of collection and provide a surplus for personal and offspring need (Proctor et al., 1996). In tropical habitats, bee flight ranges have been studied in only a few species, but studies on Apis mellifera showed a peak foraging range of about 10 km and an average forage range between roughly 2 km and 5 km (Roubik, 1989). The same is true with the larger Xylocopa bees, where average forage ranges between 6 km and 10 km from the nest were documented (Roubik, 1989). Regarding the very tiny Halictids next to the forest, just a lower impact on the visitation frequency indue to their general limited forage ranges of not more than about 1 km (Roubik, 1989). Nevertheless, because of the foraging efficiency, a pollen transfer between forest study sites appeared to be unlikely. Given that the entire Kakamega Forest region was surrounded by a diverse farmland, especially around the forest fragments, a “higher diversity of habitat types” could also be postulated in relation to their sizes. This kind of more heterogeneous landscape is
74 Discussion ______________________________________________________________________
ance of Xylocopa calens next to the forest, especially
ig. 14B). Additionally, the local communities in the orth housed more bees.
ed in main forest
condary, old secondary, near-primary) were compared lthof, 2005).
r forest fragments which potentially reflected ee abundance.
ns
e different observed plant species.
s very low ith 0.16 visits/flower/hour. The visitation frequency even declined with a higher umber of A. pubescens flower per observation unit (Table14). This could mean that
f nectar or the percentage of sugar in the nectar was very low, or
me evident inside study sites where sser forest was found in a buffer of 2000m around the study sites (Fig. 13A; Fig. 14A)
expected to have higher abundances of wild bees on different scales (Steffan-Dewenter et al., 2002). Even in Kakamega, a higher abundin the North (10 km transect) (Kasina, 2005), could be explained by a higher diversity of habitat types next to the forest. Furthermore the Xylocopa bees depend mainly on trees for nesting (M. Gikungu, pers. comm.). In contrast, the more homogeneous farmland in the South next to Kakamega Forest revealed no effects (Kasina, 2005). Concerning A. pubescens visited by honey bees, the same phenomenon could be observed, the visitation frequency was higher inside the northern compared to the southern study sites (Fig. 13B; FNBecker et al. (1991) also reported in this context, that higher Euglossa bee abundance was found inside smaller forest fragments (up to 10 ha) in South America compared to larger forest fragments (100 ha) or the continuous rain forest. The authors also referred these effects to changes in the landscape matrix, which provides diverse nest sites. The plant diversity (Althof, 2005) inside main forest or forest fragment sites showed no effects on the visitation frequencies or on the bee abundance. This could be explained due to nonexistent significant differences of species numbers, distributsites (n= 103 to 163) or forest fragment sites (n= 93 to 138). The same was true, if main forest (middle-aged secondary) and forest fragment succession stages (heavily logged and planted, middle-aged se(A An additional explanation for a higher abundance of bees inside forest fragments appeared to be the predation of bee larvae by ants (Michener, 2000). Here, the abundance of the forest specialist army ant (genus Dorylus) showed a positive correlation to the forest size (Peters, 2003). Therefore lower predation pressure on bee larvae could be assumed inside the smalleb To all intents and purposes, studies of fragmentation and edge effects on pollinator populations should as well have temporal depth (Cane, 2001). In this context, Roubik (2001) showed ups and downs in pollinator populations over decades. This could be one possible explanation for the differences of the visitation frequencies inside the same study sites during the A. eminens campaigns 2002 and the campaign 2003. Flower visitatioApart from the postulated higher abundance of bees inside the forest fragments due to higher edge effect, several other biotic and abiotic factors might have influenced the visitation frequencies for th In general, Acanthopale pubescens appeared not to be very attractive to honey bees. Despite the fact that A. pubescens as a mass blooming plant species provided a great abundance of flowers, the overall visitation frequency of all study sites wawneither the amount oboth. But also the final multi regression model stressed the importance of the location of the study sites. Higher visitation frequencies becale
Discussion 75
ation between visitation frequencies and cut trees
ion due to igher solar radiation. Apart from this exogenic factor a strong genetic component on
nectar production was reported (Kearns & Inouye, 1993). Campaign 2003 showed a negative correlation of cloudiness and visitation frequency (Fig. 25). Here, the denser cloudiness could have influenced the foraging behaviour of the Xylocopa bees, the more clouds the less foraging flights. Furthermore, also with respect to the A. eminens campaign 2003 the final multi regression model stressed the importance of the location of the study sites; higher visitation frequencies were found in smaller forest fragments. As described for Acanthopale pubescens, these findings might confirm the assumption of a potential impact of the surrounding farmland bee populations on the forest visitation frequencies. The differences between main forest and forest fragment visitation frequency in 2002 compared to 2003 should be traced back to lower study site samples or seasonal changes in the bee populations (Roubik, 2001). Halictids and Megachilids as main pollinator groups of Heinsenia diervilleoides, nest in exposed areas of the forest, especially in disturbed sites and along forest pathways, but also outside the forest (M. Gikungu, pers. comm.). In particular for Halictids, combined with their limited forage ranges, a higher visitation frequency should be an indicator for a higher abundance of bees. Here, the positive correlation between the amount of cut trees per hectare and the visitation frequencies inside the study sites supported this assumption (Fig. 36A; Fig. 37A). In Kakamega Forest the oldest succession stages were found in the fragments Kisere and Yala compared to the middle-aged secondary study sites in the main forest (Althof, 2005). Consequently, the higher visitation frequencies on H. diervilleoides flowers in older succession stages of the forests (in particular in Kisere and Yala) (Fig. 36B; Fig. 37B) could result from lower predation pressure on bee larvae by army ants (genus Dorylus) inside the smaller forest fragments (Peters, 2003) which potentially reflected positively on the bee abundance. A closer examination of the visitation frequency data showed also differences on spatial scales. Here, high variations were found on study site as well as on observation unit data level. One likely explanation to this could be a possible dependency of bee foraging behav t factors, as for example, the different macro cial foraging strate described by Proctor et al.
996), might inherently provoke disproportionate shifts concerning mean study site visitation frequencies of, for instance, the H. diervilleoides campaign.
ter et al. (2006) stressed that the variation of plant-
and which were located further north. These findings confirmed the assumption of a potential impact of the farmland bee populations with respect to the higher visitation frequencies of A. pubescens inside the forest fragments. In contrast, the less abundant Acanthus eminens flowers were highly frequented by Xylocopa bees during both campaigns 2002: 0.282 visits/flower/hour and 2003: 0.52 visits/flower/hour. The negative correlper hectare during campaign 2002 (Fig. 24A) might lead to the suggestion that Xylocopa bees - as carpenter bees - lost potential nesting sites in higher disturbed forests. But also the more open canopy could have changed the nectar producth
iour with respect to microhabita climate or varieties in the blooming composition. But also spe
gies, such as group-foraging of non-social bees as(1
In this context, Steffan-Dewenpollinator interactions in response to habitat fragmentation on the spatial and temporal scales is still less understood.
76 Discussion ______________________________________________________________________
lower visitations and pollen transfer ed plant species in this study were found inside Kakamega Forest and its
this study showed at the forest fragment level that high visitation frequencies do not inevitably led to more pollen on stigmas. Only A. eminens (campaign 2003) pollen on stimore or pollen limitation could be
en no pollen grains with every visit. But a higher number of visitors
reasons and/or genetic
FAll observfragments. Due to the long distances between these forest remnants and the highly attractive composition of flowering plants in the bush- and farmland in between, it can be postulated that no intensive exchange of genetic material through pollination occurred between these forest fragments. In addition,
showed a positive correlation between visitation frequencies and countedgmas (Fig. 34). Here, higher visitation frequency in forest fragments might lead to pollen on stigmas. Hence, a potential pollinator and/
assumed on A. eminens flowers in 2003, in particular due to the fact that 34.7% of the forest fragment and even 55.8% of the main forest stigmas did not show any deposited pollen grain. In contrast to this, with respect to A. pubescens, A. eminens (campaign 2003) and H. diervilleoides a contrary relation between visitation frequency and number of pollen on stigmas became obvious. Generally, it has to be considered that each visitor was potentially able to transfer either large number or eva
might also have removed a higher number of pollen grains from the stigmas. Pollen on stigmas In this study, no general pattern of higher or lower amounts of pollen in main forest or forest fragment study sites were evident (Fig. 51). On closer examination, a very high variability of pollen number on stigmas was evident with respect to all observed plant species. The standard deviation in many cases was ven higher than the counted mean number of pollen on stigma. Therefore, e
interpretations concerning the potential influences of the measured biotic and abiotic factors should be of limited significance. In addition, the final models of multiple regressions also showed either a larger quantity of potential influencing variables and/or only a low explanatory power (R2). In general, differences of pollen numbers on stigmas might be rather a result of biotic ffects – such as the transfer by pollinators, plant species specific e
variations in the populations - than due to discrepancies of the abiotic factors.
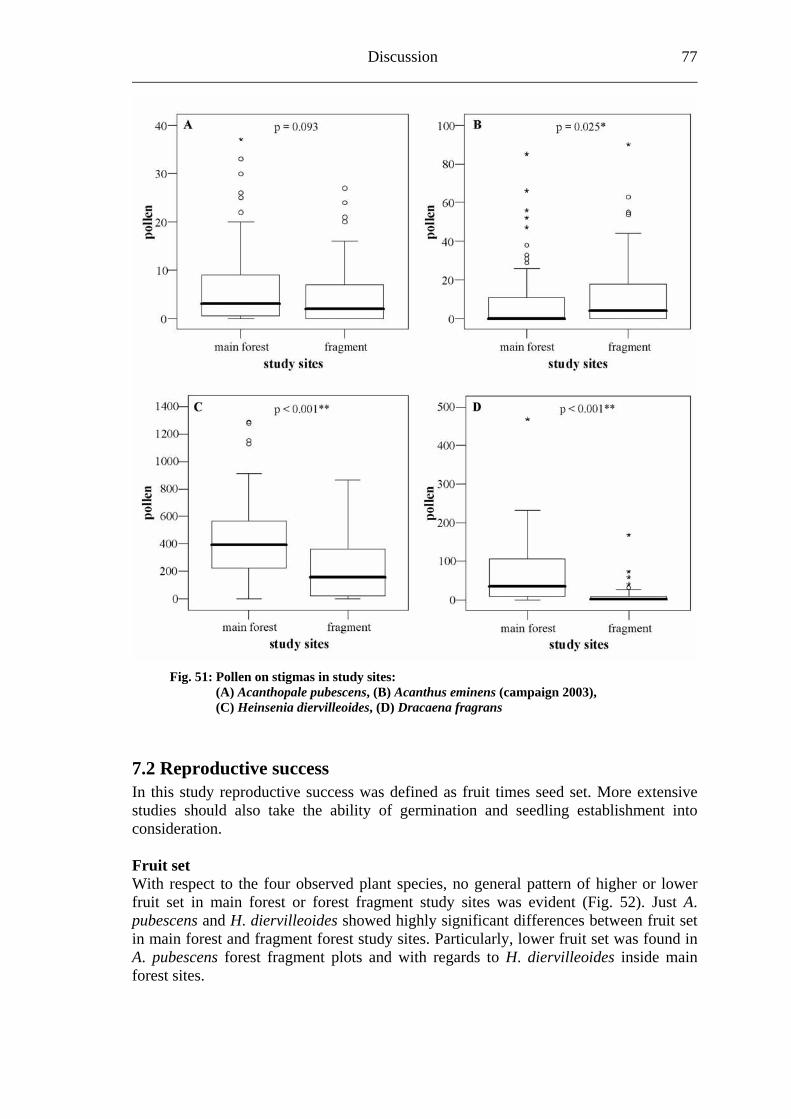
Discussion 77
Fig. 51: Pollen on stigmas in study sites: (A) Acanthopale pubescens, (B) Acanthus eminens (campaign 2003), (C) Heinsenia diervilleoides, (D) Dracaena fragrans
7.2 Reproductive success In this study reproductive success was defined as fruit times seed set. More extensive studies should also take the ability of germination and seedling establishment into consideration. Fruit set With respect to the four observed plant species, no general pattern of higher or lower fruit set in main forest or forest fragment study sites was evident (Fig. 52). Just A. pubescens and H. diervilleoides showed highly significant differences between fruit set in main forest and fragment forest study sites. Particularly, lower fruit set was found in A. pubescens forest fragment plots and with regards to H. diervilleoides inside main forest sites.
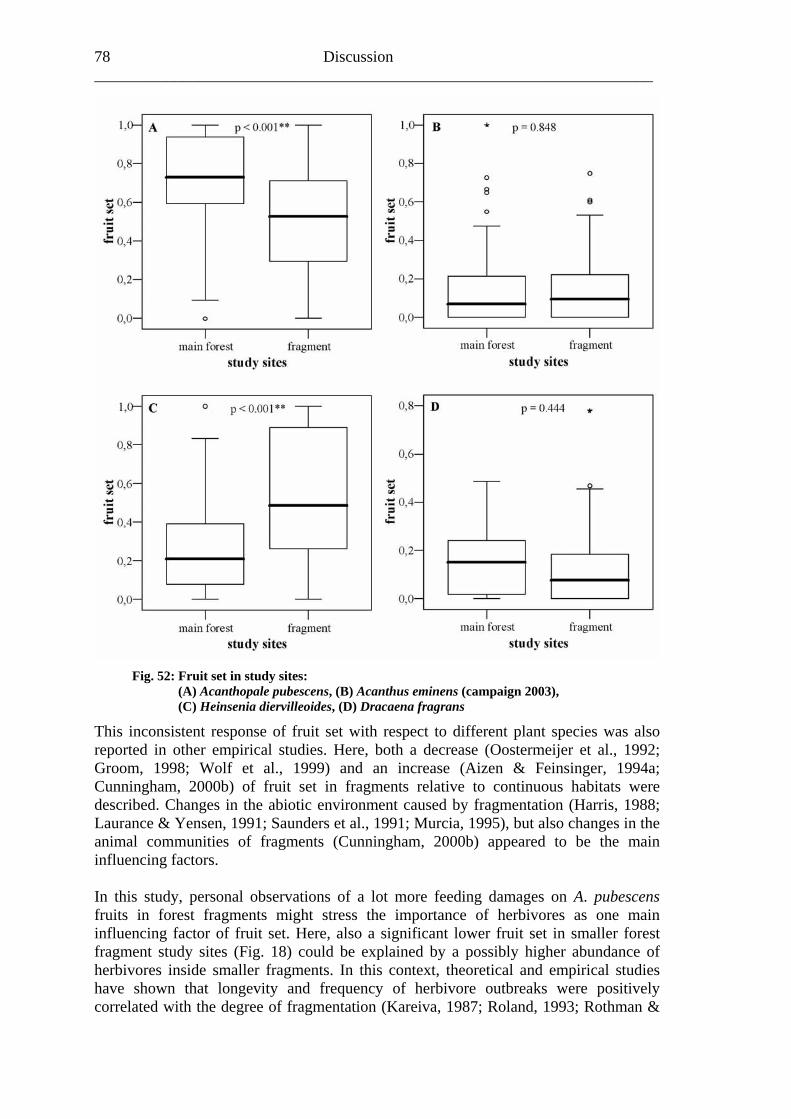
78 Discussion ______________________________________________________________________
Fig. 52: Fruit set in study sites:
0b) of fruit set in fragments relative to continuous habitats were
ce of herbivores as one main fluencing factor of fruit set. Here, also a significant lower fruit set in smaller forest
(A) Acanthopale pubescens, (B) Acanthus eminens (campaign 2003), (C) Heinsenia diervilleoides, (D) Dracaena fragrans
This inconsistent response of fruit set with respect to different plant species was also reported in other empirical studies. Here, both a decrease (Oostermeijer et al., 1992; Groom, 1998; Wolf et al., 1999) and an increase (Aizen & Feinsinger, 1994a; Cunningham, 200described. Changes in the abiotic environment caused by fragmentation (Harris, 1988; Laurance & Yensen, 1991; Saunders et al., 1991; Murcia, 1995), but also changes in the animal communities of fragments (Cunningham, 2000b) appeared to be the main influencing factors. In this study, personal observations of a lot more feeding damages on A. pubescens fruits in forest fragments might stress the importaninfragment study sites (Fig. 18) could be explained by a possibly higher abundance of herbivores inside smaller fragments. In this context, theoretical and empirical studies have shown that longevity and frequency of herbivore outbreaks were positively correlated with the degree of fragmentation (Kareiva, 1987; Roland, 1993; Rothman &
Discussion 79
ct to A. eminens (campaign 2003); many fruits were found in various stages f rot inside all study sites. Thus, a negative dependency to moisture connected with
eed set
gmentation r isolation on reproductive success (Spears, 1987; Aizen & Feinsinger, 1994a; Aldrich
s (Fig. 53), H. diervilleoides and D. fragrans even a
Roland, 1998; Kondoh, 2003). Freund (2004) also described seasonal varieties in the abundance of herbivores inside the differed Kakamega Forest fragments. (Freund, 2004) With respeosolar radiation could be assumed regarding A. eminens fruit set. This assumption might be consolidated, because of higher fruit set in study sites which were less protected and located nearer to the forest edges (Fig. 29; Fig. 30). In this study no factors became evident which could explain substantially the significant lower fruit set of H. diervilleoides inside main forest study sites. But among others, the correlations between fruit set and a north-south gradient allowed assumptions that different soil types and parameters might influence the fruit synthesis of H. diervilleoides. The fruit set of D. fragrans showed no response to all observed factors. Subsumed, fruit set might mainly be resource limited, but not pollinator limited, and therefore changes in pollinator abundance would be less important (Schemske & Horvitz, 1988). SSeed production could not easily be linked to habitat fragmentation, but fragmentation might affect plant population genetics by loss of alleles through drift and by inbreeding (Ghazoul & McLeish, 2001; Ghazoul, 2005). Several studies reported that small plant populations in fragmented habitats showed reduced seed set, genetic diversity and offspring fitness (Oostermeijer et al., 1994; Fischer & Matthies, 1997; Fischer & Stöcklin, 1997; Morgan, 1999; Hendrix & Kyhl, 2000; Kéry et al., 2000; Luijten et al., 2000). In this context, Steffan-Dewenter et al. (2006) remarked that relatively few studies included direct observations of flower visitation and experimentally test for pollinator limitation as the cause for lower seed set. But also different studies were published, which showed non-significant or significant positive effects of frao& Hamrick, 1998; Cunningham, 2000b; Costin et al., 2001). All in all, the tested plant species of this study showed a general tendency for higher seed set in forest fragment study sitehighly significant tendency. In general, seed set is mainly depending on either pollen quantity and/or pollen quality (Waser & Price, 1991; Ramsey & Vaughton, 2000). Several factors have been described which might contribute to insufficient pollination (Waser & Price, 1991; Brown & Kephart, 1999), such as low visitation frequencies or poor genetic variation inside the plant population gene pool.
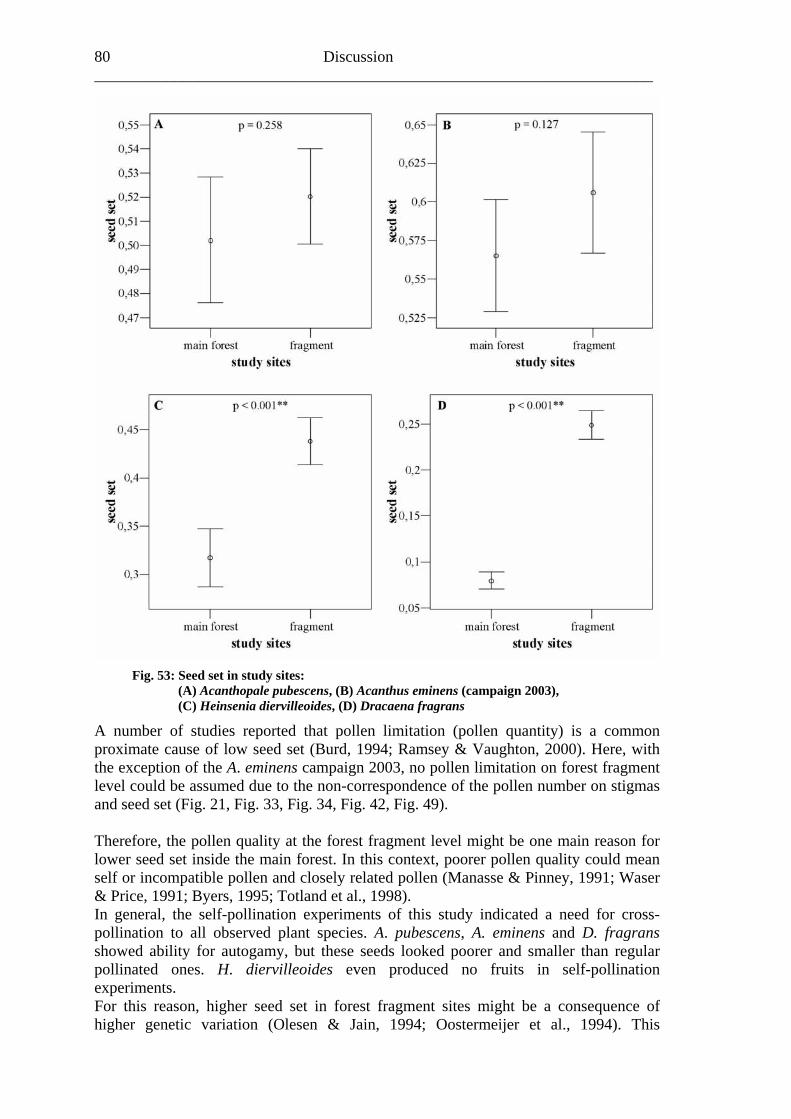
80 Discussion ______________________________________________________________________
Fig. 53: Seed set in study sites: (A) Acanthopale pubescens, (B) Acanthus eminens (campaign 2003), (C) Heinsenia diervilleoides, (D) Dracaena fragrans
A number of studies reported that pollen limitation (pollen quantity) is a common
the exception of the A. eminens campaign 2003, no pollen limitation on forest fragment le ssum the pond f the po umb and seed set (Fig. 21, Fig. 33, Fig. 34, Fig. 42, Fig. 49). Therefore, the pollen q ty at the fo fragment level might be one main reason for lo insid for c er lity cou mean self or incompatible pollen and closel lated polle Manasse & inney, 1991; Waser & yers, 1 ; Totland e , 1998). In general, the self e o in need fo cross-pollination to all obser ecies. A. pubescens, A. eminens and D. fragrans s for bu ds re ler than gular pollinated ones. oi pr self-pollination experimF hig set a m onsequ e of higher genetic variation (O eijer et al., 1994). This
proximate cause of low seed set (Burd, 1994; Ramsey & Vaughton, 2000). Here, with
vel could be a ed due to non-corres ence o llen n er on stigmas
uali restwer seed set e the main est. In this ontext, poor pollen qua l d
y ret al.
n ( P Price, 1991; B 995
-pollination xperiments f this study dicated a r ved plant sp
howed ability autogamy, H. dierville
t these seedes even
looked poooduced no
r and smalfruits in
re
ents. or this reason, her seed
lesen & Jain, 1994; Oosterm in forest fr gment sites ight be a c enc
Discussion 81
assumption at first looked implausible, but closer examination of the Kakamega Forest fra history, gest t lts of the visitation frequencies and the
d su po
se higher foraging ranges, because of the higher number of ompetitors.
Consequently, the patchy distributed plant populations inside the forest fragments could have been better connected through pollination, resulting in higher genetic variation in these populations and in consequence a higher seed set. In this context, Montgomery et al. (2003) were able to show that the boost of seed set of Peraxilla tetrapetala (Loranthaceae) on forest edges was directly linked to a higher number of visits by the pollinating birds. In the long run, in contrast, genetic erosion appears more likely in plant populations located in forest fragments, because of the lower number of plant individuals distributed in smaller forest areas. This was shown already in isolated populations of a neotropical rain forest canopy tree (Pithecellobium elegans [Mimosaceae]) (Hall et al., 1996). In addition, undergoing population decline and fragmentation of many plant species in the tropics is making Allee effects on seed production likely to become increasingly relevant to plant species conservation (Ghazoul, 2005). In this study, A. pubescens showed a rather low number of flower visitations but also a tendency of higher visitation frequencies and seed set inside fragment study sites. These results might support the hypothesis of a temporarily higher genetic variation inside forest fragment populations. In addition, higher seed set was found in forests sites where a higher number of paths (n=0−20) were counted (Fig. 20). Due to the biology of A. pubescens as a disturbance indicator (E. Fischer, pers. comm.), these findings also could document a more intensive exchange of genetic material through pollination, because of better connection of the patchy distributed plant population through populations along the paths. The Acanthus eminens campaign 2003 showed very low mean pollen numbers on stigmas inside the study sites (5.09 to 11.96), a high percentage of completely unloaded stigmas (34.2 %) and a higher amount of pollen on stigmas in forest fragment sites (Fig. 27D). The seed set also was higher (Fig. 31). These observation results allowed the assumption that seed set was strongly limited by pollen quantity. In addition, seed set was higher in study sites which were surrounded by a higher percentage of forest in a buffer of 100m (Fig. 32). This finding corresponded with the results of the pollination biology study conducted by Dietzsch (2004) focusing on Acanthus eminens (forest confined) and Acanthus pubescens (open grassland confined); Dietzsch showed that heterospecific pollen has the potential to reduce seed set of both related species. In addition to this possible pollen limitation, pollen quality might also have had a strong impact on seed set. As described for A. pubescens, A. eminens (campaign 2002 and
gmentation sug hat the resupport this hypatchy plant distribution coul
Fthesis.
irst of all, due to the very young forest fragments (about 100 years or younger), the plant populations inside these fragments should have more or less the same genetic variation as those in the main forest. In addition, the sizes of the forest fragments are still rather large (65-1,370 ha), compared to the main forest (8,245 ha). However, another crucial factor appeared in this study; there is also a generally higher visitation frequency inside the forest fragment study sites. With the aforementioned exception of the A. eminens campaign 2003, this higher visitation frequencies were not leading to a higher amount of pollen on stigma, but could have led to higher genetic intermixture through higher rates of long-distance cross-pollination events (Schmitt, 1983). In addition, the postulated higher pollinator abundance inside the forest fragments also could cauc
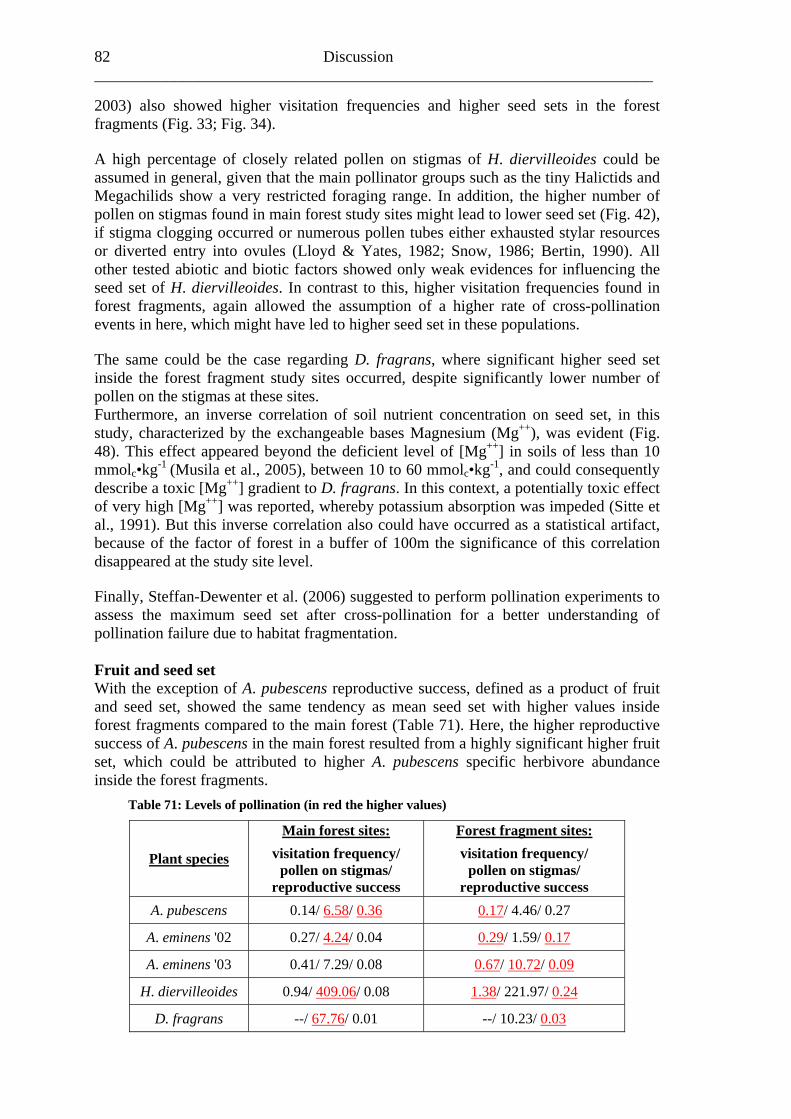
82 Discussion ______________________________________________________________________
34).
encing the
he same could be the case regarding D. fragrans, where significant higher seed set
gh [Mg ] was reported, whereby potassium absorption was impeded (Sitte et
Table 71: Levels of pollination (in red the higher values)
2003) also showed higher visitation frequencies and higher seed sets in the forest fragments (Fig. 33; Fig. A high percentage of closely related pollen on stigmas of H. diervilleoides could be assumed in general, given that the main pollinator groups such as the tiny Halictids and Megachilids show a very restricted foraging range. In addition, the higher number of pollen on stigmas found in main forest study sites might lead to lower seed set (Fig. 42), if stigma clogging occurred or numerous pollen tubes either exhausted stylar resources or diverted entry into ovules (Lloyd & Yates, 1982; Snow, 1986; Bertin, 1990). All other tested abiotic and biotic factors showed only weak evidences for influseed set of H. diervilleoides. In contrast to this, higher visitation frequencies found in forest fragments, again allowed the assumption of a higher rate of cross-pollination events in here, which might have led to higher seed set in these populations. Tinside the forest fragment study sites occurred, despite significantly lower number of pollen on the stigmas at these sites. Furthermore, an inverse correlation of soil nutrient concentration on seed set, in this study, characterized by the exchangeable bases Magnesium (Mg++), was evident (Fig. 48). This effect appeared beyond the deficient level of [Mg++] in soils of less than 10 mmolc•kg-1 (Musila et al., 2005), between 10 to 60 mmolc•kg-1, and could consequently describe a toxic [Mg++] gradient to D. fragrans. In this context, a potentially toxic effect of very hi ++
al., 1991). But this inverse correlation also could have occurred as a statistical artifact, because of the factor of forest in a buffer of 100m the significance of this correlation disappeared at the study site level. Finally, Steffan-Dewenter et al. (2006) suggested to perform pollination experiments to assess the maximum seed set after cross-pollination for a better understanding of pollination failure due to habitat fragmentation. Fruit and seed set With the exception of A. pubescens reproductive success, defined as a product of fruit and seed set, showed the same tendency as mean seed set with higher values inside forest fragments compared to the main forest (Table 71). Here, the higher reproductive success of A. pubescens in the main forest resulted from a highly significant higher fruit set, which could be attributed to higher A. pubescens specific herbivore abundance inside the forest fragments.
Plant species
Main forest sites:
visitation frequency/ pollen on stigmas/
reproductive success
Forest fragment sites:
visitation frequency/ pollen on stigmas/
reproductive success A. pubescens 0.14/ 6.58/ 0.36 0.17/ 4.46/ 0.27
A. eminens '02 0.27/ 4.24/ 0.04 0.29/ 1.59/ 0.17
A. eminens '03 0.41/ 7.29/ 0.08 0.67/ 10.72/ 0.09
H. diervilleoides 0.94/ 409.06/ 0.08 1.38/ 221.97/ 0.24
D. fragrans --/ 67.76/ 0.01 --/ 10.23/ 0.03
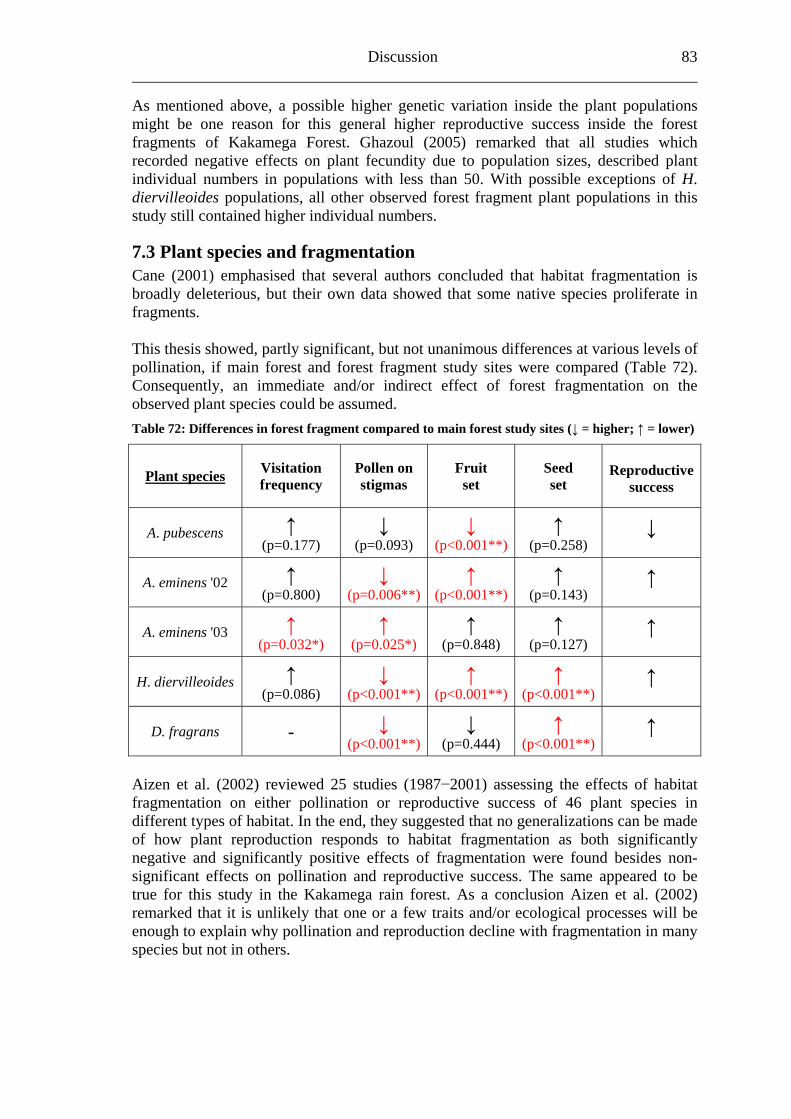
Discussion 83
As mentioned above, a possible higher genetic variation inside the plant populations
ason for this general higher reproductive success inside the forest agments of Kakamega Forest. Ghazoul (2005) remarked that all studies which
might be one refrrecorded negative effects on plant fecundity due to population sizes, described plant individual numbers in populations with less than 50. With possible exceptions of H. diervilleoides populations, all other observed forest fragment plant populations in this study still contained higher individual numbers.
.3 Plant species and fragmentation 7Cane (2001) emphasised that several authors concluded that habitat fragmentation is broadly deleterious, but their own data showed that some native species proliferate in fragments. This thesis showed, partly significant, but not unanimous differences at various levels of pollination, if main forest and forest fragment study sites were compared (Table 72). Consequently, an immediate and/or indirect effect of forest fragmentation on the observed plant species could be assumed. Table 72: Differences in forest fragment compared to main forest study sites (↓ = higher; ↑ = lower)
Plant species
Visitation frequency
Pollen on stigmas
Fruit set
Seed set
Reproductivesuccess
A. pubescens ↑ (p=0.177)
↓ (p=0.093)
↓ (p<0.001**)
↑ (p=0.258)
↓
A. eminens '02 ↑ (p=0.800)
↓ (p=0.006**)
↑ (p<0.001**)
↑ (p=0.143)
↑
A. eminens '03 (p=0.032*) (p=0.025*) (p=0.848) (p=0.127)
↑ ↑ ↑ ↑ ↑
H. diervilleoides ↑ (p=0.086)
↓ (p<0.001**)
↑ (p<0.001**)
↑ (p<0.001**)
↑
D. fragrans - ↓ (p<0.001**)
↓ (p=0.444)
↑ (p<0.001**)
↑
Aizen et al. (2002) reviewed 25 studies (1987−2001) assessing the effects of habitat fragmentation on either pollination or reproductive success of 46 plant species in different types of habitat. In the end, they suggested that no generalizations can be made of how plant reproduction responds to habitat fragmentation as both significantly negative and significantly positive effects of fragmentation were found besides non-significant effects on pollination and reproductive success. The same appeared to be true for this study in the Kakamega rain forest. As a conclusion Aizen et al. (2002) remarked that it is unlikely that one or a few traits and/or ecological processes will be enough to explain why pollination and reproduction decline with fragmentation in many species but not in others.
84 Discussion ______________________________________________________________________ In general, a number of factors have to be considered for reasonable comparisons of
es. ne crucial variable appeared to be the size of included fragments. Ghazoul et al.
48 ha) a transfer, or even a generalisation of its
g experiment), a higher number of frugivores inside the
individual fitness which might enhance the risk of population extinction. But only if the Kakamega Forest will exist that long?!
fragmentation studiO(2001), for example, conducted a fragmentation study in dry deciduous forests in Costa Rica and reported both reduced fertilisation and seed set in smaller fragments regarding the tree species Anacardium exelsum [Anacardiaceae]. Just by the fragment sizes in his tudy (in the main between 0.3 ands
findings appeared to be very problematic to other forest systems, such as Kakamega Forest (fragment sizes between 65 to 8.245 ha). In addition, Morgan (1999) stressed that also the history of the fragmentation process in studies has to be considered. Another important parameter is how the visitation frequencies data were collected. Here, short distance observations (like practised in this study), the use of video cameras (Cunningham, 2000a) or less precise methods, like binocular inspections of tree canopies (Ghazoul & McLeish, 2001), have been described. But also the individual biology of each plant species might play a crucial role. The Acanthaceas A. pubescens and A. eminens in this study for instance, as disturbance indicators (E. Fischer, pers. comm.), prefer paths or forest gaps. Due to this distinct ecological niche the populations of these plant species were even fragmented inside the main forest. But, with regards to their restricted seed dispersal opportunity, owing to the fruit type of capsules, genetic exchange mainly occurs through pollination. Hence, the higher visitation frequencies in forest fragments could lead to higher reproduction success. The same effect could be assumed concerning the very scattered distribution of flowering H. diervilleoides individuals: the higher visitation frequencies in forest fragments did not consequently lead to a higher number of pollen on stigmas. However, through a generally higher number of flower visits by pollinators inside the forest fragments the likelihood of long-distance cross-pollination might increase. A lack of information concerning the pollinators and the visitation frequencies of D. fragrans complicated the interpretation of the higher number of pollen on stigmas in the main forest, and higher seed set in the forest fragments. Here, the widespread distribution inside the Kakamega Forest remnants (Althof, 2005) and the potential of vegetative reproduction through rhizomes led to the suggestion that the pollen found on D. fragrans stigmas might be closely related. But also in this study, in addition to possibly greater intensive exchange of genetic material through higher visitation rates of
oths (see 6.4.1 coverinmKakamega Forest fragments (Farwig, 2005) - birds that also should feed on the reddish D. fragrans fruits - might lead to higher seed set inside the forest fragments. Finally, in case of further degradation and fragmentation of the Kakamega Forest remnants and its plant populations, combined with longer periods of isolation, an increased inbreeding could lead in the long-term to a decrease of
Outlook 85
studies at the rest study site level could be very valuable.
n effects for land-use planning and conservation
red one-fourth of their land
orest over a longer period.
8. Outlook The results of this thesis pointed to the fact that the genetic variation in the plant populations of the Kakamega Forest and its fragments might present a crucial parameter relating to the reproductive success of the different plant species. For a better understanding of these complex coherences further population genetic fo In addition, the heterogeneous findings with respect to the different plant species, showed the necessity of a greater extent of plant-pollinator interaction studies in rain forests on the one hand, and the implication of other plant regeneration processes like seed dispersal and seedling establishment on the other hand. In this context, Harris et al. (2004) suggested in a review article dealing with the consequences of habitat fragmentation for plant-pollinator mutualism, that studies of whole suites of species will always be more informative than studies of single species that have prevailed until now. But also the importance of the agricultural landscape imbedded rain forests, as nutrition and nesting resourse for forest plant and crop pollinators, should be studied in more detail. The pushing requests by policy makers for obtaining consolidated recommendations for a sustainable use of forests and its biodiversity, particularly, stresses the demands of a better understanding of the underlying ecosystem services. But in this study the generalisation of habitat fragmentatioappeared to be rather difficult. Dillard (2002) assigned three reasons for this: (1) the high specificity of the taxa, spatial scales, and ecological processes; (2) the variation according to the landscape types and its structure; and (3) the dominance of local effects, such as changes to certain microhabitat features. Nevertheless, even economic advisors to governments (Sachs, 2005), realised that the loss of “natural capital”, described as ecosystems and their biodiversity, will have serious adverse consequences for the whole society or even the whole planet. Therefore, requirements that governments have a crucial role to play in conserving natural capital, have to be supplemented with the suggestions of Leakey (2002). He emphasized that especially poor countries like Kenya, which almost declaarea as biological reserves, need and deserve financial support from the richer countries. In this context, Leakey (2002) also highlighted the concepts of protected National Parks and eco tourism. The new Forests Bill in Kenya (2005), in which a participatory forest management is aimed, might also contain chances for an existence of the KakamegaF
86 Zusammenfassung ______________________________________________________________________
of
In this d Kakam st and its five lager forest fragments in Western Kenya, four plant
),
r the effect o quency, primary pollination success, fruit
ies ,
In gene and mean seed set was found inside the
t
by the her
be
ght be an increase of the long-distance cross-pollination ratio owing to the higher visitation
higher
of gene
es, emphas forests,
9. Summary Rain forest fragmentation can affect plant-pollinator interactions and the reproductivesuccess of plant species. Understanding these consequences is a crucial component conserving vulnerable ecosystems.
study, conducted between June 2001 and March 2003 in the highly fragmenteega Fore
species: Acanthopale pubescens [Acanthaceae] (June 2001 to December 2001ens [AcaAcanthus emin nthaceae] (January 2002 to March 2002 and November 2002 to
February 2003), Heinsenia diervilleoides [Rubiaceae] (November 2002 to March 2003) and Dracaena fragrans [Ruscaceae] (July 2002 to March 2003) were tested fo
f forest fragmentation on visitation freand seed set. Furthermore, several biotic and abiotic factors, such as plant specdiversity, the succession stages of the study sites, the number of cut trees per hectarethe protection status and parameters of clima and soil, were related to these different levels of pollination.
ral, a higher mean visitation frequency surrounding forest fragments compared to the main forest. In contrast to this, theprimary pollination success and fruit set varied with respect to the different planspecies. Only regarding the A. eminens campaign 2003, the higher number of visitspollinating Xylocopa bees inside the forest fragments, consequently caused a hig
r of pollen on stigmasnum and increased fruit and seed set. Thus, a pollinator and/or llen lim the papo itation in tchy distributed A. eminens population might have occurred in
2003. Due to the generally lower primary pollination success inside the forest fragment populations of all other plant species, one essential factor of the higher seed set mi
frequency, shown for A. pubescens and H. diervilleoides. Even a temporarilygenetic variation could be postulated. Nevertheless, for longer periods a reduction in population size and an increase in isolation due to fragmentation may lead to limited gene flow, increased inbreeding, loss
tic variation, decreased individual fitness, and consequently to an increased riskof population extinction. These complex coherences combined with several other possible influencing factors and the heterogeneous findings on plant species level, also on spatial and temporal scal
ized the need of further pollination studies in fragmented rain particularly with regard to the demands by policy makers for receiving consolidated
endations for a sustain of frecomm able use orests and its biodiversity.
Summary 87
Zusa
n sich sowohl n
edeute
In die ega Forest, einem n
serfolg wie
Dezem 2 und m
003).
wie z.B hl und
len Samenansätze festgestellt werden.
des Fruchta
die A. eminen
terla eine e.
ein.
selhaft rbrei
steigen n biologi es Aussterbens führen.
her
, e Ha hrer
mmenfassung
Die anthropogen bedingte Fragmentierung von tropischen Regenwäldern kan auf Tier-Pflanzen-Interaktionen als auch auf den Reproduktionserfolg vo
Pflanzen auswirken. Die Aufklärung dieser komplexen Zusammenhänge ist eine b nde Komponente zum möglichen Schutz wertvoller Ökosysteme.
ser zwischen Juni 2001 und März 2003 im Kakamfragmentierten Regenwald und seinen fünf größeren Waldfragmenten im WesteKenias durchgeführten Studie, wurden Besuchsfrequenzen, primärer Bestäubungso Frucht- und Samenansätze folgender Pflanzenarten auf mögliche Effekte der Waldfragmentierung untersucht: Acanthopale pubescens [Acanthaceae] (Juni 2001 bis
ber 2001), Acanthus eminens [Acanthaceae] (Januar 2002 bis März 200ber 2002 bis Februar 2003), HeinseNove nia diervilleoides [Rubiaceae] (November
2002 bis März 2003) und Dracaena fragrans [Ruscaceae] (Juli 2002 bis März 2Des Weiteren wurde der mögliche Einfluss diverser biotischer und abiotischer Faktoren
. Diversität der Pflanzen, Sukzessionsstadien der Untersuchungsgebiete, Anzagefällter Bäume pro Hektar, Schutzstatus, klimatische Einflussgrößen Bodenparameter, auf die oben genannten Ebenen der Bestäubung gestestet. Im Vergleich zum Hauptwald konnten in den umliegenden Waldfragmenten bei alPflanzenarten höhere Besucherfrequenzen undDagegen ergab sich beim Vergleich des primären Bestäubungserfolges und
nsatz kein einheitliches Bild. Entgegen vorheriger Annahmen ergab nur die Untersuchung von A. eminens im Jahre
u einem 2003, dass eine höhere Besucherfrequenz der bestäubenden Xylocopa-Bienen zgrößeren primären Bestäubungserfolg und einem höheren Frucht- und Samenansatz in den Waldfragmenten führte. Dieses Ergebnis lässt die Vermutung zu, dass nur
s Populationen im Jahre 2003 einer Bestäuber- und/oder einer Pollenlimitierung gen. Bei der Untersuchung der anderen un Pflanzenarten zeigte sich, dass
höhere Besuchsfrequenz nicht zu einem größeren primären Bestäubungserfolg führtEine mögliche Erklärung für den trotzdem höheren Samenansatz könnte hier einehöhere Fremdbestäubungsrate, verursacht durch die höhere Besuchsfrequenz, sAuch eine temporäre Erhöhung der genetischen Variation innerhalb der in
teten Pflanzenpopulationen wäre dadurch denkbar. veAuf lange Sicht dagegen könnte eine Reduktion der Populationsgrößen und eine
inersteigende Isolation durch Fragmentierung zu einem verminderten Genfluss, eden Inzucht, einem Verlust an genetischer Variabilität, einer abnehmendeschen Fitness und somit zu einem ansteigenden Risiko d
plexeDiese kom n Zusammenhänge, kombiniert mit einer Vielzahl anderer möglic
Einflussgrößen und der heterogenen Ergebnisse der verschiedenen Pflanzenarten,bekräftigen den Bedarf für weitere Bestäubungsstudien in fragmentierten Regenwäldern. Ebenso erfordern die drängenden Anfragen von Entscheidungsträgern
ndlungsempfehlungen für eine nachhaltige Nutzung der di Wälder und iBiodiversität erwarten, weiterführende Studien auf diesem Gebiet.
88 References ______________________________________________________________________
ty,
patible herb
AIZEN, M d habitats: do
forest, Argentina. Ecology 75, 330 - 351. y
e 281, 103-105.
BACKHA ., PLINKE, W. & WEIBER, R. (2003). Multivariate Analysemethoden, 9th
BATES, H 1864). The Naturalist on the River Amazons, 1962 edition. University of California Press,
BECKER RALTA, F. J. A. (1991). More about euglossine bees in Amazonian forest
BENNUN
BISSONE 14
10. R ces eferen
AGNEW, A. D. & AGNEW, S. (1994). Upland Kenya Wild Flowers. East African Natural History SocieNairobi.
AGREN, J. (1996). Population size, pollinator limitation, and seed set in the self-incomLythrum salicaria. Ecology 77, 1779-1790. . A., ASHWORTH, L. & GALETTO, L. (2002). Reproductive success in fragmente
compatibility systems and pollination specialization matter? Journal of Vegetation Science 13, 885-892.
AIZEN, M. A. & FEINSINGER, P. (1994a). Forest fragmentation, pollination, and plant reproduction in a Chaco dry
AIZEN, M. A. & FEINSINGER, P. (1994b). Habitat fragmentation, native insect pollinators, and feral honebees in Argentine Chaco Serrano. Ecological Applications 4, 378 - 392.
ALDRICH, P. P. & HAMRICK, J. L. (1998). Reproductive dominance of pasture trees in a fragmented tropical forest mosaic. Scienc
ALTHOF, A. (2005). Human Impact on Flora and Vegetation of Kakamega Forest, Kenya. PhD thesis, Universität Koblenz-Landau.
API. (2003). Plan of Action of the African Pollinator Initiative. African Pollinator Initiative Secretariat, Nairobi. US, K., ERICHSON, Bedition. Springer-Verlag, Berlin & Heidelberg. . W. (Berkeley.
, P., MOURE, J. S. & PEfragments. Biotropica 23, 586-591.
BEENTJE, H. J. (1994). Kenya Trees, Shrubs and Lianas. National Museums of Kenya, Nairobi. , L. & NJOROGE, P. (1999). Important Bird Areas in Kenya. The East Africa Natural History Society, Nairobi, Kenya.
BERTIN, R. (1990). Effects of pollination intensity in Campsis radicans. American Journal of Botany 77. TTE, J. A. & STORCH, I. (2002). Fragmentation: is the message clear? Conservation Ecology 6,[online] URL: http://www.consecol.org/vol6/iss2/art14.
TT, H. L. (1994). Forest inventory report No. 3: KakaBLACKE mega (KIFCON). National Museums of
BLEHER DORF, T. (2005). Assessment of threat status and management
BROOKS nction
es 160,
. BURD, M
60, 83-139.
CANE, J. remature verdict? Conservation Ecology 5,
Kenya, Nairobi. , B., USTER, D. & BERGSeffectiveness in Kakamega Forest, Kenya. Biodiversity and Conservation. , T. M., PIMM, S. L. & OYUGI, J. O. (1999). Time Lag between Deforestration and Bird Extiin Tropical Forest Fragments. Conservation Biology 13, 1140 - 1150.
BROWN, E. & KEPHART, S. (1999). Variability in pollen load: implications for reproduction and seedling vigor in a rare plant, Silene Dougladii Var. Oraria. International Journal of Plant Scienc1145-1152.
BUCHMANN, S. L. & NABHAN, G. P. (1996). The Forgotten Pollinators. Island Press, Washington D.C. (1994). Bateman's principle and plant reproduction: the role of pollen limitation in fruit and seed set. Botanical Review
BYERS, D. L. (1995). Pollen quantity and quality as explanations for low seed set in small populations exemplified by Eupatorium (Asteraceae). American Journal of Botany 82, 1000-1006.
H. (2001). Habitat fragmentation and native bees: a p3 [online] URL: http://www.consecol.org/vol5/iss1/art3.
TE, A., QUESADA, M., LOBO, J. J. & FUCHS, E. A. (2002). Effects of dry tropical forest fragme
CASCANntation on the reproductive success and genetic structure of the tree Samanea sama.
CBD. (1 rasil.
ference of the Parties, Nairobi, Kenya. . L.,
, M. C. & DIAZ, S. (2000).
CINCOTT 000). Human population in the biodiversity hotspots.
Conservation Biology 16, 137-147. 992). Convention on Biological Diversity (CBD), Rio de Janeiro, B
CBD. (1996). Decision III/11: Conservation and Sustainable Use of Agricultural Biological Diversity (COP3). In Third Meeting of the Con
CHAPIN, F. S. I., ZAVALETA, E. S., EVINER, V. T., NAYLOR, R. L., VITOUSEK, P. M., REYNOLDS, HHOOPER, D. U., LAVOREL, S., SALA, O. E., HOBBIE, S. E., MACKConsequences of changing biodiversity. Nature 405, 234 - 242. A, R. P., WISNEWSKI, J. & ENGELMAN, R. (2Nature 404, 990-992.
References 89
st Africa - ersity
COSTIN, , J. W. & YOUNG, A. G. (2001). Reproductive success does not decline in .
CUNNING . Journal
CUNNING ngs
nt
DICK, C. TCHELECU, G. & AUSTERLITZ, F. (2003). Pollen dispersal of tropical trees (Dinizia excelsa:
rest. Molecular Ecology 12, 753-764. sts: a
DIETZSC East African Acanthus
ERWIN, T
FARWIG, fragmentation and disturbance on the endangered tropical tree
FISCHER THIES, D. (1997). Mating structure and inbreeding and outbreeding depression in the
FISCHER sed
FREUND
GHAZOU otropica 36, 128-130.
-443. GHAZOUGHAZOU
GIKUNG ts in a
GOVERDnus
GROOM, mit population viability of an annual plant. American Naturalist 151,
nd - 768.
HARRIS, ffects and conservation of biotic diversity. Conservation Biology 2, 330-332.
HARRISO ). Habitat fragmentation and large-scale conservation: What do we
HENDRIX
HUSTON versity, pp. 15-62. Cambridge University Press, New York.
CLAUSNITZER, V. (2004). Diversity and species composition of Odonata as indicators of biotope quality of East African rain forests and their replacement communities. In: BIOTA EaBiodiversity in conversion - The influence of fragmentation and disturbance on the biodivof East African highland rain forests (ed. J. Köhler), pp. 87-100. BMBF, Bonn. B. J., MORGANfragmented populations of Leucochrysum albicans subsp. albicans var. tricolor (Asteraceae)Biological Conservation 98, 273-284. HAM, S. A. (1996). Pollen supply limits fruit initiation by a rain forest understorey palmof Ecology 84, 185-194. HAM, S. A. (2000a). Depressed pollination in habitat fragments causes low fruit set. Proceediof the Royal Society of London B-Biological Sciences 267, 1149-1152.
CUNNINGHAM, S. A. (2000b). Effects of habitat fragmentation on the reproductive ecology of four plaspecies in mallee woodland. Conservation Biology 14, 758-768.
DEVOTO, M., MEDAN, D. & MONTALDO, N. H. (2005). Pattern of interaction between plants and pollinators along an environmental gradient. OIKOS 109, 461-472. W., EFabaceae) by native insects and Africa honeybees in pristine and fragmented Amazonian rainfo
DIDHAM, R. K., GHAZOUL, J., STORK, N. E. & DAVIS, A. J. (1996). Insects in fragmented forefunctional approach. Trends in Ecology and Evolution 11, 255-260. H, A. C. (2004). Effects of interspecific pollen transfer on seed set in two species (Acanthaceae). Diploma thesis, Rheinische Friederich-Wilhelms-Universität zu Bonn. . L. (1982). Tropical forests: Their richness in Coleoptera and other arthropod species. The Coleopterists Bulletin 36, 74 - 75.
FAEGRI, K. & VAN DER PIJL, L. (1979). The Principles of Pollination Ecology, 3rd edition. Pergamon, Oxford.
FAO. (1977). Guidelines for soil profile description, Rom. N. (2005). Impact of forestPrunus africansa (Rosaceae). PhD thesis, Johannes Gutenberg-Universität. , M. & MATrare plant Gentianella germanica (Gentianaceae). American Journal of Botany 84, 1685-1692. , M. & STÖCKLIN, J. (1997). Local extinctions of plants in remnants of extensively ucalcareous grasslands 1950-1985. Conservation Biology 11, 727-737.
, W. (2004). Effects of fragmentation and degradation of an afrotropical rain forest on thediversity structure of leaf beetle communities (Coleoptera, Chrysomelidae). PhD thesis, Rheinische Friedrich-Wilhelms-Universität Bonn.
GASTON, K. J. (2000). Global patterns in biodiversity. Nature insight - Biodiversity 405, 220 - 227.L, J. (2004). Sex in space: pollination among spatially isolated plants. Bi
GHAZOUL, J. (2005). Pollen and seed dispersal among dispersed plants. Biological Reviews 80, 413L, J. (2006). Floral diversity and facilitation of pollination. Journal of Ecology 94, 295-304. L, J. & MCLEISH, M. (2001). Reproductive ecology of tropical forest trees in logged and fragmented habitats in Thailand and Costa Rica. Plant Ecology 153, 335-345.
U, M. (2006). Bee diversity and some aspects of their ecological interactions with plansuccessional tropical community. PhD thesis, Rheinische Friedrich-Wilhelms-Universität Bonn. E, M., SCHWEIZER, K., BAUR, B. & ERHARDT, A. (2002). Small-scale habitat fragmentation effects on pollinator behaviour: experimental evidence from the bumblebee Bombus veteraon calcareous grasslands. Biological Conservation 104, 293-299. M. J. (1998). Allee effects li487-496.
HALL, P., WALKER, S. & BAWA, K. (1996). Effect of Forest Fragmentation on Genetic Diversity aMating System in a Tropical Tree, Pithecellobium elegans. Conservation Biology 10, 757L. D. (1988). Edge e
HARRIS, L. F. & JOHNSON, S. D. (2004). The consequences of habitat fragmentation for plant-pollinator mutualisms. International Journal of Tropical Insect Science 24, 29-43. N, S. & BRUNA, E. (1999know for sure? Ecography 22, 225-232. , S. D. & KYHL, J. F. (2000). Population size and reproduction in Phlox pilosa. Conservation Biology 14, 304-313.
HEYWOOD, V. D. (1995). Global Biodiversity Assessment. Cambridge University Press, UK. , M. A. (1994). General Patterns of Species Diversity. In: Biological Di
90 References ______________________________________________________________________
est herb (Primula elatior) in a fragmented landscape. Oecologia, 617-625.
JENNERSd Set. Conservation Biology 2, 359 - 366.
ents. Conservation Biology 13, 784-793.
KASINA,published BIOTA E10 report), Kakamega.
s of
ions. Annual Review of Ecology and Systematics 29, 83-112.
eclining grassland plants Primula veris and Gentiana lutea. Journal of
KEVAN, vironmental Conservation 2, 293 -
KIFCON
KÖHLER odiversity in conversion - The
pp. 1-16. BMBF, Bonn. KOKWARO, J. O. (1988). Conservation Status of the Kakamega Forest in Kenya: The Easternmost Relic of
the Equatorial Rain Forests of Africa. Monogr. Syst. Bot. Missouri Bot. Gard. 25, 471 - 489. KOKWARO, J. O. (1994). Flowering Plant Families of East Africa - An Introduction to Plant Taxonomy.
East African Educational Publishers Ltd., Nairobi. KONDOH, M. (2003). Habitat fragmentation resulting in overgrazing by herbivores. Journal of Theoretical
Biology 225, 453-460. KRAEMER, M. (2002). Auswirkungen von Habitatfragmentierung auf Bestäuber-Pflanzen-Interaktion in
ostafrikanischen Regenwäldern. In: Biodiversity Monitoring Transect Analysis in Africa - Zwischenbericht, pp. 79-86. BIOTA East Africa Zwischenbericht, Bonn.
KRAEMER, M. & BERGSDORF, T. (2001). Effects of habitat fragmentation on plant-pollinator interactions in East African rainforests. In: German Programme on Biodiversity and Global Change (BIOLOG), Annual Report 2001, pp. 71-77. German Aerospace Research Establishment, Bonn.
KRAEMER, M., BLEHER, B., BERGSDORF, T. & BÖHNING-GAESE, K. (2001). Threatened mutualisms: pollination, seed dispersal and regeneration in forest remnants. 1. Statusseminar des BIOLOG-Programmes des BMBF.
KÜHNE, L., COLLINS, S. C. & KINUTHIA, W. (2004). Check-list of the butterflies of the Kakamega Forest Nature Reserve in western Kenya (Lepidoptera: Hesperioidea, Papilionoidea). Nachrichten des Entomologischen Vereins Apollo, N.F. 25, 161-174.
LAMONT, B. B., KLINKHAMER, P. G. L. & WITKOWSKI, E. T. F. (1993). Population fragmentation may reduce fertility to zero in Banksia goodii - a demonstration of the Allee effect. Oecologia 94, 446 - 450.
LAURANCE, W. F., VASCONCELOS, H. L. & LOVEJOY, T. E. (2000). Forest loss and fragmentation in the Amazon: implications for wildlife conservation. Oryx 34, 39 - 45.
LAURANCE, W. F. & YENSEN, E. (1991). Predicting the impacts of edge effects in fragmented habitats. Biological Conservation 55, 77-92.
LEAKEY, R. & MORELL, V. (2002). Wildlife Wars: My Fight to Save Africa's Natural Treasures. McMillan Press and St. Martin's Press, London and New York.
LENNARTSSON, T. (2002). Extinction thresholds and disrupted plant-pollinator interactions in fragmented plant populations. Ecology 83, 3060-3072.
LIND, E. M. & MORRISON, M. E. S. (1974). East African Vegetation. Longman, London.
INHAJI ANALO, C. (2003). Adventures of Kakamega Forest, First edition. BIOTA East Africa E 12, Germany.
IPI. (1999). International Pollinators Initiative: The Sao Paulo Declaration on Pollinators, pp. 79. Brazilian Ministry of the Environment, Brasilia.
JACQUEMYN, H., BRYS, R. & HERMY, M. (2002). Patch occupancy, population size and reproductive success of a for
JANZEN, D. H. (1974). The deflowering of Central America. Natural History 83, 49. TEN, O. (1988). Pollination in Dianthus deltoides (Caryophyllaceae): Effects of Habitat Fragmentation on Visitation and See
JULES, E. S. & RATHCKE, B. J. (1999). Mechanisms of reduced Trillium recruitment along edges of old-growth forest fragm
KAREIVA, P. (1987). Habitat fragmentation and the stability of predator-prey interactions. Nature 326, 388-390. J. M. (2005). Bee pollinator species in Kakamega Farmlands as affected by distance from the Kakamega Forest edges. (internal & un
KEARNS, C. A. & INOUYE, D. W. (1993). Techniques for Pollination Biologists. University PresColorado, Niwot, Colorado.
KEARNS, C. A., INOUYE, D. W. & WASER, N. M. (1998). Endangered mutualism: The conservation of plant-pollinator interact
KÉRY, M., MATTHIES, D. & SPILLMANN, H.-H. (2000). Reduced fecundity and offspring performance in small populations of the dEcology 88, 17-30. P. G. (1975). Pollination and environmental conservation. En298. . (1994). Kakamega Forest - The Official Guide. Kenya Indigenous Forest Conservation Programme, Nairobi.
KNAPP, R. (1973). Die Vegetation von Afrika. Fischer, Stuttgart. , J. (2004). Synthesis of Phase I. In: BIOTA East Africa - Biinfluence of fragmentation and disturbance on the biodiversity of East African highland rain forests (ed. J. Köhler),
References 91
LIOW, L. H., SODHI, N. S. & ELMQVIST, T. (2001). Bee diversity along a disturbance gradient in tropical
lowland forests of south-east Asia. Journal of Applied Ecology 38, 180-192. LLOYD, D. & YATES, J. (1982). Intersexual selection and the segregation of pollen and stigmas in
hermaphrodite plants, exemplified by Wahlenbergia albomarginata (Campanulaceae). Evolution 36, 903-913.
LUIJTEN, S. H., DIERICK, A., OOSTERMEIJER, J. G. B., RAIJMANN, L. E. L. & DEN NIJS, C. M. (2000). Population size, genetic variation and reproductive success in a rapidly declining, self-incompatible perennial Arnica montana in the Netherlands. Conservation Biology 14.
LUNG, T. & SCHAAB, G. (2004). Change-detection in Western Kenya - The documentation of fragmentation and disturbance for Kakamega Forest and associated forest areas by means of remotely-sensed imagery. In ISPRS XXth Congress, vol. XXXV. ISPRS Archives, Istanbul.
MANASSE, R. S. & PINNEY, K. (1991). Limits to reproductive success in a partially self-incompatible herb: Fecundity depression at serial life-cycle stages. Evolution 45, 712-720.
MCDADE, L. A. & MOODY, M. L. (1999). Phylogenetic Relationships Among Acanthaceae: Evidence From Noncoding TRNL-TRNF Chloroplast DNA Sequences. American Journal of Botany 86, 70 - 80.
MICHENER, C. D. (1979). Biogeography of the bees. Annals of the Missouri Botanical Garden 66, 277-347.
MICHENER, C. D. (2000). The Bees of the World. John Hopkins University Press, Baltimore. MITCHELL, N. (2004). BIOTA East Report No.1 - The exploitation and disturbance history of Kakamega
Forest, Western Kenya. Bielefelder Ökologische Beiträge Band 20, 77. MONTGOMERY, B. R., KELLY, D., ROBERTSON, A. W. & LADLEY, J. J. (2003). Pollinator behaviour, not
increased resources, boosts seed set on forest edges in a New Zealand Loranthaceous mistletoe. New Zealand Journal of Botany 41, 277-286.
MORGAN, J. W. (1999). Effects of population size on seed production and germinability in an endangered, fragmented grassland plant. Conservation Biology 13, 266-273.
MURCIA, C. (1995). Edge effects in fragmented forests: implications for conservation. Trends in Ecology & Evolution 10, 58-62.
MURIUKI, J. W. & TSINGALIA, M. H. (1990). A new population of de Brazza's monkey in Kenya. Oryx 24, 157 - 162.
MUSILA, W., DALITZ, H., TODT, H. & USTER, D. (2005). BIOTA East Report No.1 - Soil characteristics of Kakamega Forest, Western Kenya. Bielefelder Ökologische Beiträge Band 21.
MUTANGAH, J. G. (1996). An investigation of vegetation status and process in relation to human disturbance in Kakamega Forest, western Kenya. PhD thesis, University of Wales, UK.
MYERS, N. (1988). Tropical forests and their species: Going, going ...? In: Biodiversity (ed. E. O. Wilson), pp. 28 - 35. National Academy Press, Washington.
MYERS, N., MITTERMEIER, R. A., MITTERMEIER, C. G., DA FONSECA, G. A. B. & KENT, J. (2000). Biodiversity hotspots for conservation priorities. Nature 403, 853-858.
NAEEM, S., CHAIR, F. S., CHAPIN, I. C. R., EHRLICH, P. R., GOLLEY, F. B., HOOPER, D. U., J.H., L., O'NEILL, R. V., MOONEY, H. A., SALA, O. E., SYMSTAD, A. J. & TILMAN, D. (1999). Biodiversity and ecosystem functioning: Maintaining natural life support processes. Issues in Ecology 4, 1-12.
NASON, J. D. & HAMRICK, J. L. (1997). Reproductive and genetic consequences of forest fragmentation: two case studies of neotropical canopy trees. The Journal of Heredity 88, 264-276.
NEFF, J. L. & SIMPSON, B. B. (1993). Bees, pollination systems and plant diversity. In: Hymenoptera and Biodiversity (ed. J. LaSalle and I. D. Gauld), pp. 143 - 167. CAB international, Wallingford.
NOVACEK, M. J. & CLELAND, E. E. (2001). The current biodiversity extinction event: scenarios for mitigation and recovery. Proceedings of the National Academy of Sciences of the United States of America 98, 5466-5470.
O' TOOLE, C. & RAW, A. (1999). Bees of the Wold. Blandford, London. OLESEN, J. M. & JAIN, S. K. (1994). Fragmented plant populations and their lost interactions. In:
Conservation Genetics (ed. V. Loeschcke, J. Tomiuk and S. K. Jain). Birkhäuser Verlag, Basel/Switzerland.
OOSTERMEIJER, J., EIJCK, M. V. & NIJS, J. D. (1994). Offspring fitness in relation to population size and genetic variation in the rare perennial plant species Gentiana pneumonanthe (Gentianaceae). Oecologia 97, 289-296.
OOSTERMEIJER, J. G. B., DEN NIJS, J. C. M., RAIJMANN, L. E. L. & MENKEN, S. B. L. (1992). Population biology and management of the marsh gentian (Gentiana pneumonanthev L.), a rare species in The Netherlands. Botanical Journal of the Linnean Society 108.
PACHECO, L. F. & SIMONETTI, J. A. (2000). Genetic structure of a mimosoid tree deprived of its seed disperser, the spider monkey. Conservation Biology 14, 1766 - 1775.
92 References ______________________________________________________________________ PERES, C. A. (2000). Effects of subsistence hunting on vertebrate community structure in Amazonian
Forests. Conservation Biology 14, 240 - 253. PETERS, M. (2003). Habitatfragmentierung und ihre Auswirkungen auf ostafrikanische Wanderameisen.
Diploma thesis, Rheinische Friedrich-Wilhelms-Universität Bonn. PIMM, S. L., RUSSEL, G. J., GITTLEMAN, J. L. & BROOKS, T. M. (1995). The future of biodiversity. Science
269, 347-350. POTTS, S. G., DAFNI, A. & NE'EMAN, G. (2001). Pollination of a core flowering shrub species in
Mediterranean phrygana: variation in pollinator diversity, abundance and effectiveness in response to fire. OIKOS 92, 71-80.
PROCTOR, M., YEO, P. & LACK, A. (1996). The Natural History of Pollination, 1 edition. Timber Press, Portland, Oregon.
QUESADA, M., STONER, E. K., ROSAS-GUERRERO, V., PALACIOS-GUEVARA, C. & LOBO, J. A. (2003). Effects of habitat disruption on the activity of nectarivorous bats (Chiroptera: Phyllostomidae) in a dry tropical forest: implications for the reproductive success of the neotropical tree Ceiba grandiflora. Oecologia 135, 400-406.
RAMSEY, M. & VAUGHTON, G. (2000). Pollen quality limits seed set in Burchardia umbellata (Colchicaceae). American Journal of Botany 87, 845-852.
RATHCKE, B. J. & JULES, E. S. (1993). Habitat fragmentation and plant-pollinator interactions. Current Science 65, 273 - 277.
RICHARDS, C. M. (2000). Inbreeding depression and genetic rescue in a plant metapopulation. American Naturalist 155, 383-394.
RICHARDS, C. M., CHURCH, S. & MCCAULEY, D. E. (1999). The influence of population size and isolation on gene flow by pollen in Silene alba. Evolution 53, 63-73.
ROCHA, O. J. & AGUILAR, G. (2001). Reproductive biology of the dry forest tree Enterolobium cyclocarpum (Guanacaste) in Costa Rica: a comparison between trees left in pastures and trees in continuous forest. American Journal of Botany 88, 1607-1614.
RODGER, J., BALKWILL, K. & GEMMILL, B. (2004). African Pollination Studies: where are the gaps? International Journal of Tropical Insect Science 24, 5-28.
ROLAND, J. (1993). Larger-scale forest fragmentation increases the duration of tent caterpillar outbreak. Oecologia 93, 25-30.
ROTHMAN, L. D. & ROLAND, J. (1998). Forest fragmentation and colony performance of forest tent caterpillar. Ecography 21, 383-391.
ROUBIK, D. W. (1989). Ecology and Natural History of Tropical Bees. Cambridge University Press. ROUBIK, D. W. (2001). Ups and downs in pollinator populations: when is there a decline? Conservation
Ecology 5, 2 [online] URL: http://www.consecol.org/vol5/iss1/art2. SACHS, J. (2005). The End of Poverty. Penguin Group, London. SALA, O. E., CHAPIN III, F. S., ARMESTO, J. J., BERLOW, E., BLOOMFIELD, J., DIRZO, R., HUBER-
SANWALD, E., HUENNEKE, L. F., JACKSON, R. B., KINZIG, A., LEEMANS, R., LODGE, D. M., MOONEY, H. A., OESTERHELD, M., POFF, N. L., SYKES, M. T., WALKER, B. H., WALKER, M. & WALL, D. H. (2000). Global Biodiversity Scenarios for the year 2100. Science 287, 1770-1774.
SAUNDERS, D. A., HOBBS, R. J. & MARGULES, C. R. (1991). Biological consequences of ecosystem fragmentation: a review. Conservation Biology 5, 18-32.
SAYER, J. A., HARCOURT, C. S. & COLLINS, N. M. (1992). The Conservation Atlas of Tropical Forests: Africa. United Kingdom by Macmillan Publishers Ltd., Basingstoke, UK.
SCHEMSKE, D. W. & HORVITZ, C. C. (1988). Plant-animal interactions and fruit production in a neotropical herb: a path analysis. Ecology 69, 1128-1137.
SCHMITT, J. (1983). Density-dependent pollinator foraging, flowering phenology, and temporal pollen dispersal patterns in Linanthus bicolor. Evolution 37, 1247-1257.
SCHULKE, B. & WASER, N. M. (2001). Long-distance pollinator flights and pollen dispersal between populations of Delphinium nuttallianum. Oecologia 127, 239-245.
SEVERNS, P. (2003). Inbreeding and small population size reduce seed set in a threatened and fragmented plant species, Lupinus sulphureus ssp kincaidii (Fabaceae). Biological Conservation 110, 221-229.
SITTE, P., ZIEGLER, H., EHRENDORFER, F. & BRESINSKY, A. (1991). Strasburger, Lehrbuch der Botanik. Gustav-Fischer Verlag.
SMITH-RAMIREZ, C. & ARMESTO, J. J. (2003). Foraging behaviour of bird pollinators on Embothrium coccineum (Proteaceae) trees in forest fragments and pastures in southern Chile. Austral Ecology 28, 53-60.
SNOW, A. (1986). Pollination dynamics in Epilobium canum (Onagraceae): consequences for gametophytic selection. American Journal of Botany 73, 139-151.
References 93
SPEARS, E. E. (1987). Island and mainland pollination ecology of Centrosoma virginianum and Opuntia
stricta. Journal of Ecology 75, 351-362. STEFFAN-DEWENTER, I., KLEIN, A.-M., GAEBELE, V., ALFERT, T. & TSCHARNTKE, T. (2006). Bee
diversity and plant-pollinator interactions in fragmented landscapes. In: Plant-Pollinator Interactions - From specialization to generalization (ed. N. M. Waser and J. Ollerton). The University of Chicago Press, London.
STEFFAN-DEWENTER, I., MÜNZENBERG, U. & BUERGER, C. (2002). Scale-dependent effects of landscape context on three pollinator guilds. Ecology 83, 1421-1432.
STEFFAN-DEWENTER, I. & TSCHARNTKE, T. (1999). Effects of habitat isolation on pollinator communities and seed set. Oecologia 121, 432-440.
TATTERSFIELD, P., SEDDON, M. B. & LANGE, C. N. (2001). Land-snail faunas in indigenous rainforest and commercial forestry plantations in Kakamega Forest, western Kenya. Biodiversity and Conservation 10, 1809-1829.
TOTLAND, O., ANDERSON, H. L., BJELLAND, T., DAHL, V., EIDE, W., HOUGE, S., PEDERSEN, S. T. R. & VIE, E. U. (1998). Variation in pollen limitation among plants and phenotypic selection on floral traits in an early spring flowering herb. OIKOS 82, 491-501.
TSINGALIA, M. H. (1988). Animals and the regeneration of an African rainforest tree. PhD thesis, University of California, USA.
TURNER, I. M. (1996). Species loss in fragments of tropical rain forest: a review of the evidence. Journal of Applied Ecology 33, 200-209.
UNDERWOOD, A. (1997). Experiments in Ecology. Their Logical Design and Interpretation Using Analysis of Variance. University Press, Cambridge.
VILLARD, M.-A. (2002). Habitat fragmentation: major conservation issue or intellectual attractor? Ecological Applications 12, 319-320.
WADE, T. G., RIITTERS, K. H., WICKHAM, J. D. & JONES, B. K. (2003). Distribution and Causes of Global Forest Fragmentation. Conservation Ecology 7, 7 [online] URL: http://www.consecol.org/vol7/iss2/art7.
WAGNER, P. (2004). Systematik und Zoogeographie der Reptilienfauna des Kakamega Forest in Kenia. Diploma thesis, Rheinische-Friedrich-Wilhelms-Universität.
WALLACE, A. R. (1878). Tropical nature and other essays. Macmillan, London. WASER, N. & PRICE, M. V. (1991). Outcrossing distance effects in Delphinium nelsonii: pollen loads,
pollen tubes, and seed set. Ecology 72, 171-179. WASS, P. (1995). Kenya's indigenous forests - status, management and conservation. IUCN, Gland,
Switzerland. WHITE, F. (1983). The vegetation of Africa. UNESCO, Paris. WHITMORE, T. C. (1997). Tropical forest disturbance, disappearance and species loss. In: Tropical forest
remnants: Ecology, management, and conservation of fragmented communities (ed. W. L. Laurence and R. O. Bieregaard Jr.), pp. 3-12. University of Chicago Press.
WILSON, E. O. (1988). The Current State of Biological Diversity. In: Biodiversity (ed. E. O. Wilson), pp. 3-18. National Academy Press, Washington.
WOLF, A., BRODMANN, P. A. & HARRISON, S. (1999). Distribution of the rare serpentine sunflower, Helianthus exilis (Asteraceae), the roles of habitat availability, dispersal limitation and species interactions. OIKOS 84.
WRI. (2005). Millennium Ecosystem Assessment, Ecosystems and Human Well-being: Biodiversity Synthesis. World Resources Institute, Washington, DC.
WRIGHT, S. J., ZEBALLOS, H., DOMINGUEZ, I., GALLARDO, M. M., MORENO, M. C. & IBANEZ, R. (2000). Poachers alter mammal abundance, seed dispersal, and seed predation in a neotropical forest. Conservation Biology 14, 227 -239.
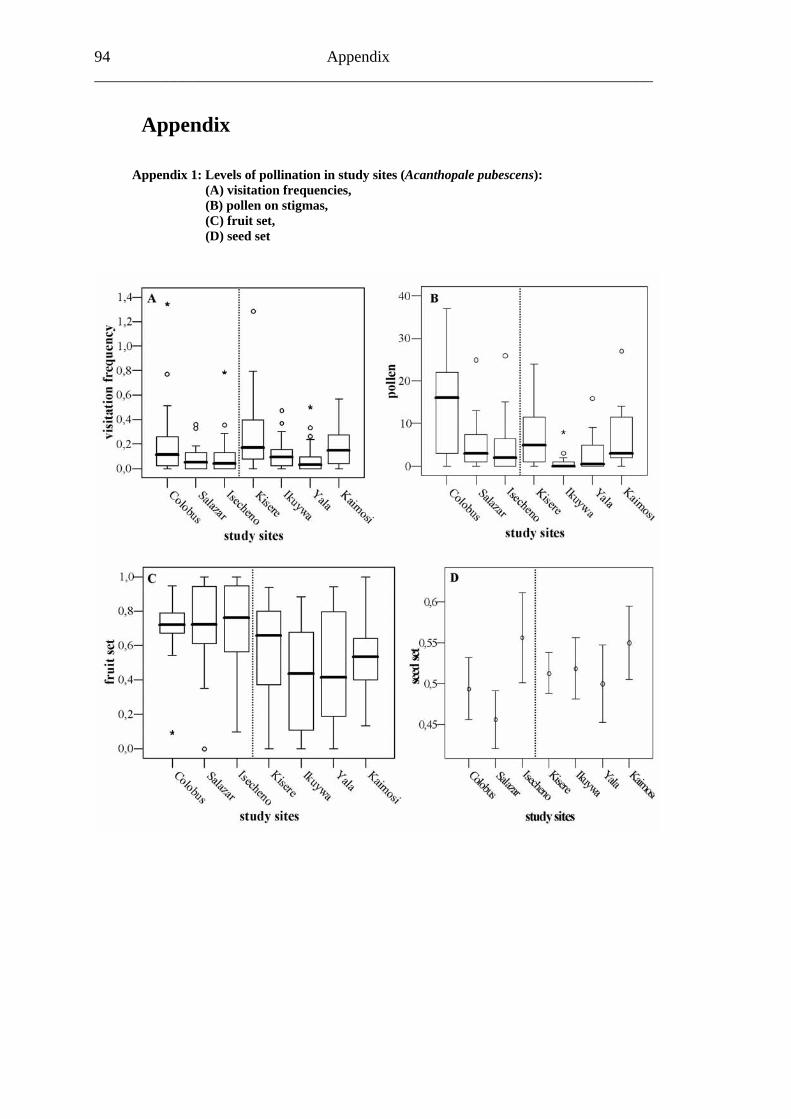
94 Appendix ______________________________________________________________________
Appendix
Appendix 1: Levels of pollination in study sites (Acanthopale pubescens): (A) visitation frequencies, (B) pollen on stigmas, (C) fruit set, (D) seed set
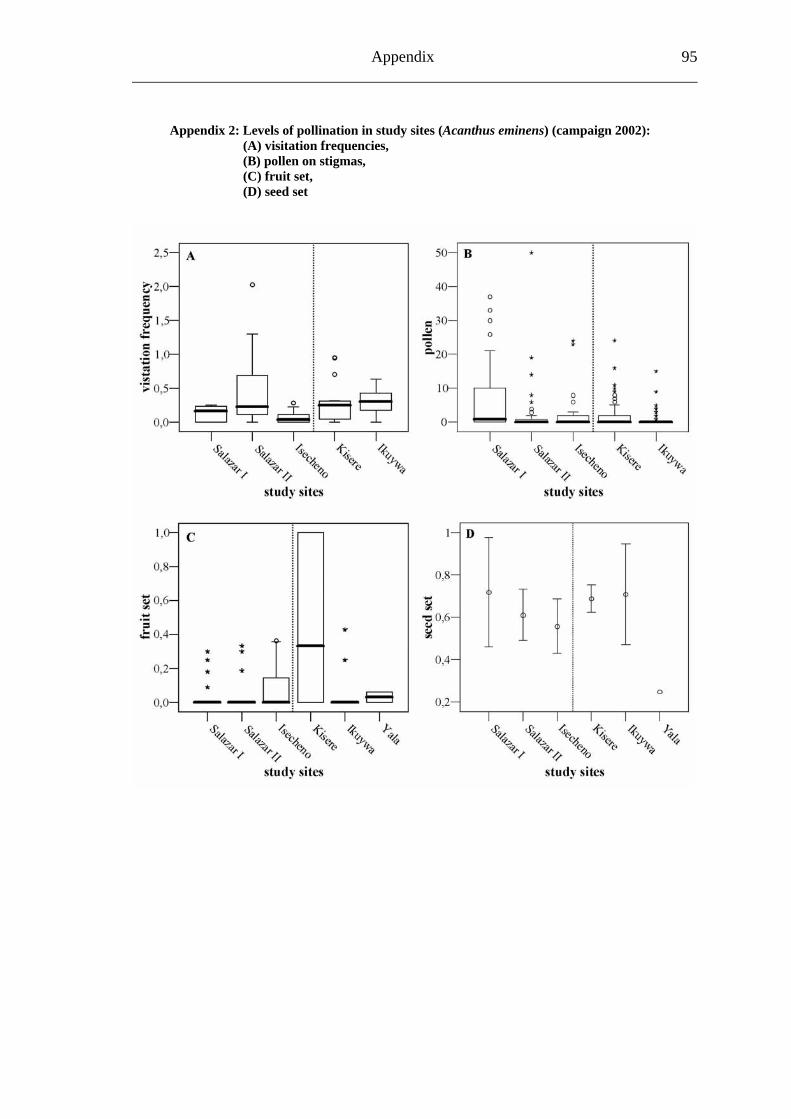
Appendix 95
Appendix 2: Levels of pollination in study sites (Acanthus eminens) (campaign 2002): (A) visitation frequencies, (B) pollen on stigmas, (C) fruit set, (D) seed set
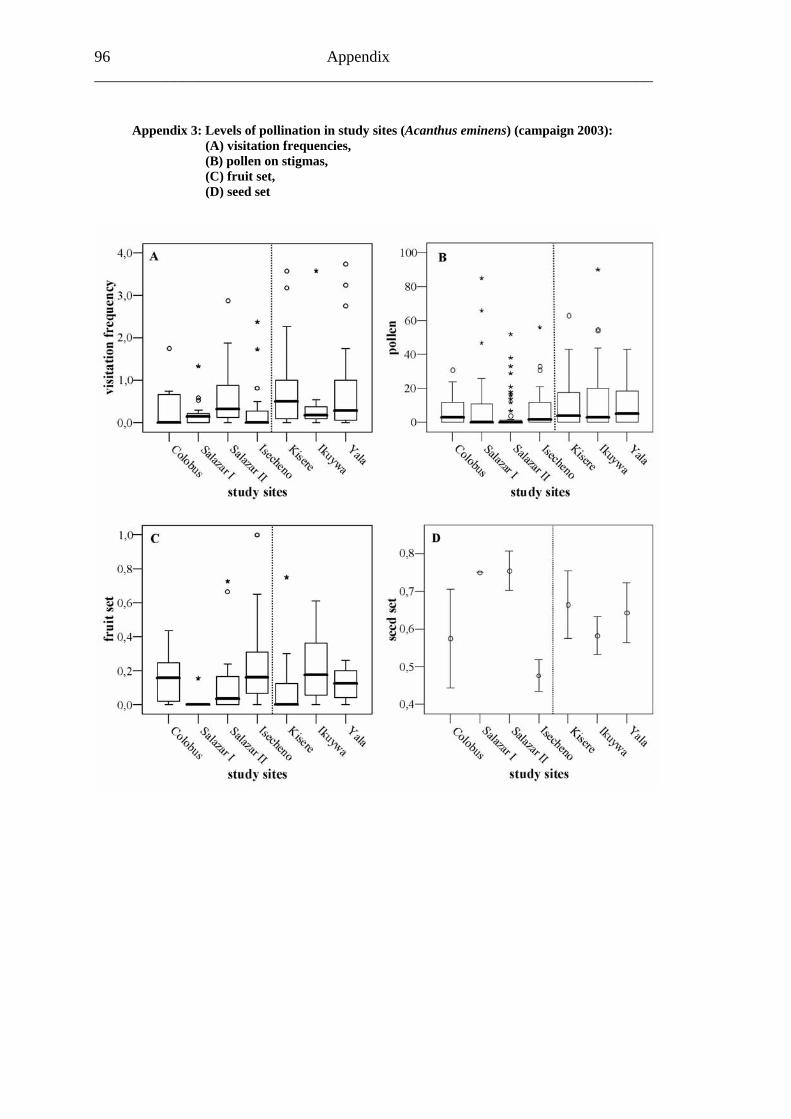
96 Appendix ______________________________________________________________________
Appendix 3: Levels of pollination in study sites (Acanthus eminens) (campaign 2003): (A) visitation frequencies, (B) pollen on stigmas, (C) fruit set, (D) seed set
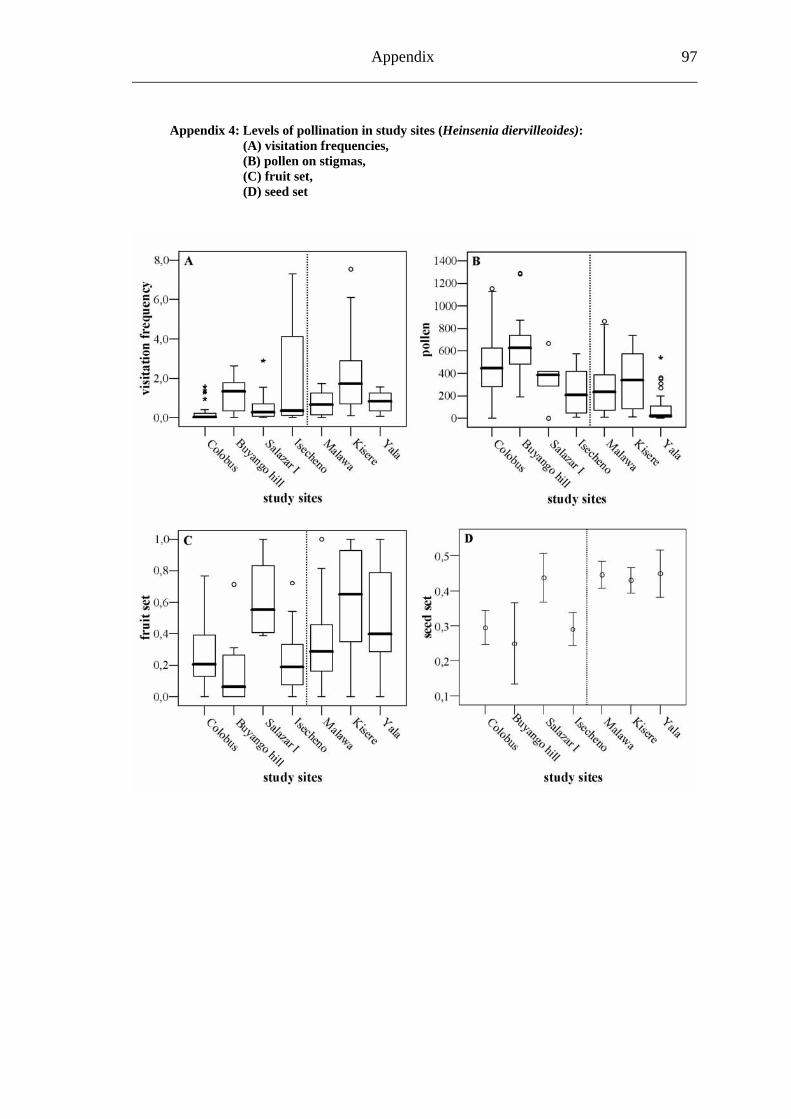
Appendix 97
Appendix 4: Levels of pollination in study sites (Heinsenia diervilleoides): (A) visitation frequencies, (B) pollen on stigmas, (C) fruit set, (D) seed set
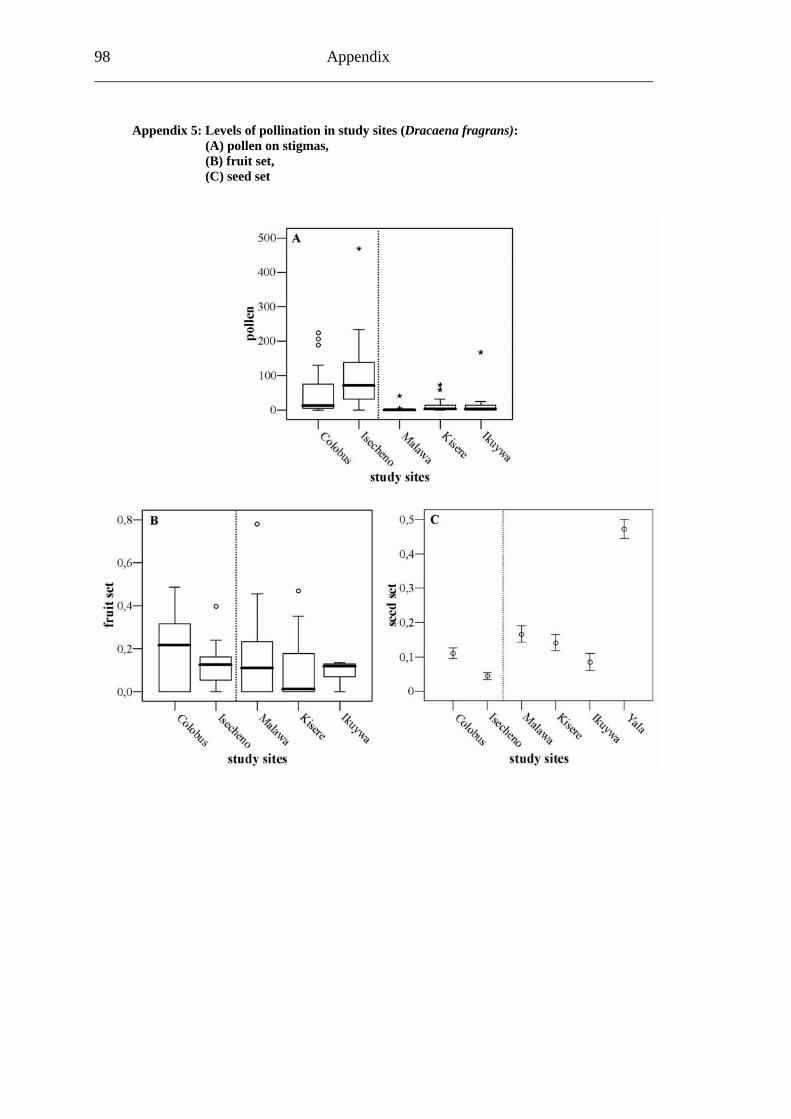
98 Appendix ______________________________________________________________________
Appendix 5: Levels of pollination in study sites (Dracaena fragrans): (A) pollen on stigmas, (B) fruit set, (C) seed set
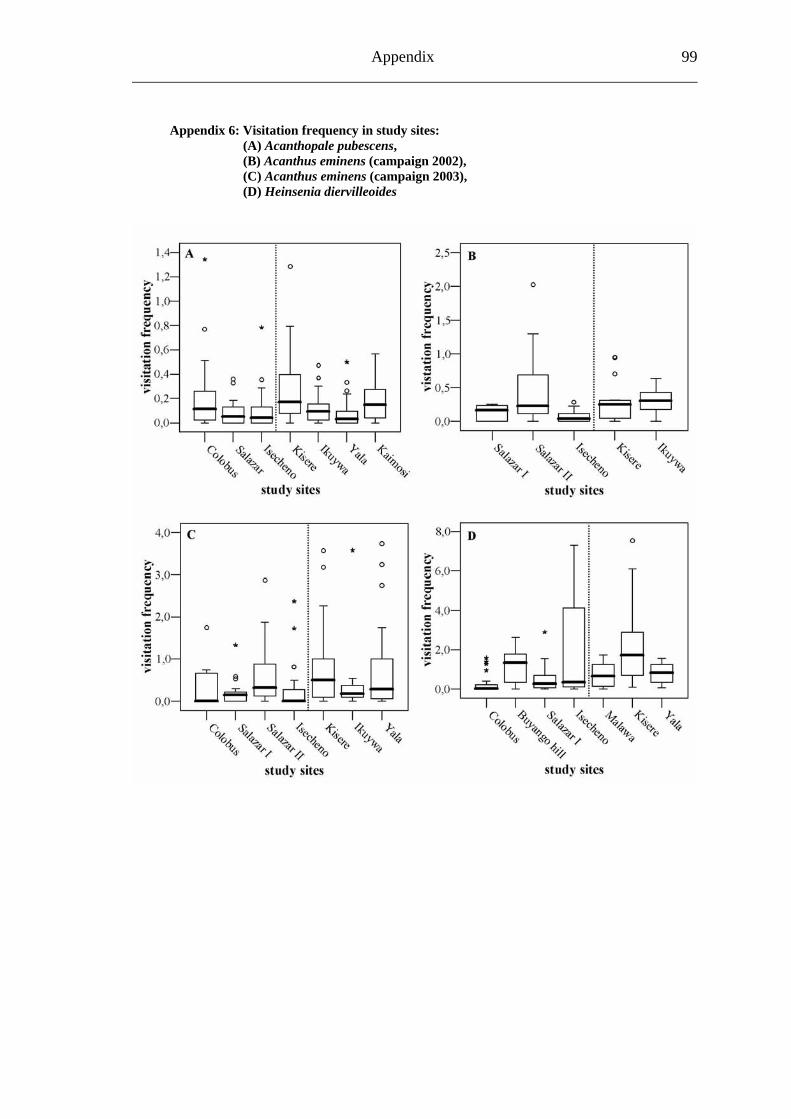
Appendix 99
Appendix 6: Visitation frequency in study sites: (A) Acanthopale pubescens, (B) Acanthus eminens (campaign 2002), (C) Acanthus eminens (campaign 2003), (D) Heinsenia diervilleoides
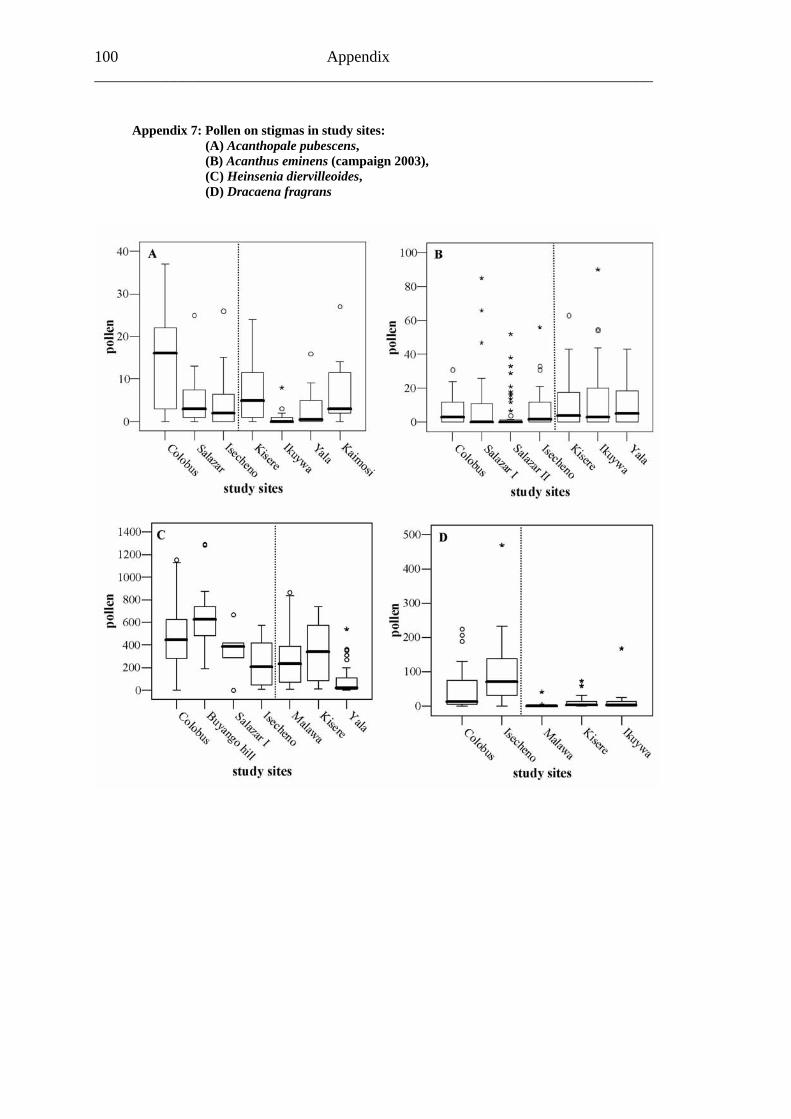
100 Appendix ______________________________________________________________________
Appendix 7: Pollen on stigmas in study sites: (A) Acanthopale pubescens, (B) Acanthus eminens (campaign 2003), (C) Heinsenia diervilleoides, (D) Dracaena fragrans
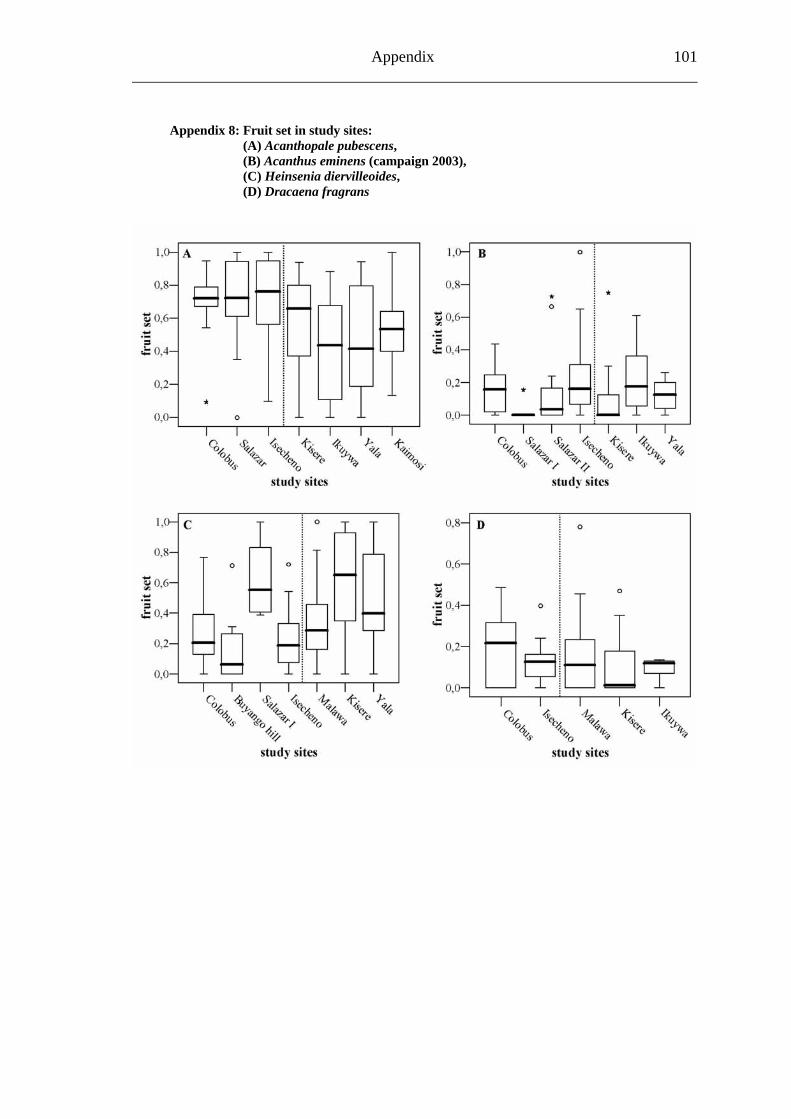
Appendix 101
Appendix 8: Fruit set in study sites: (A) Acanthopale pubescens, (B) Acanthus eminens (campaign 2003), (C) Heinsenia diervilleoides, (D) Dracaena fragrans
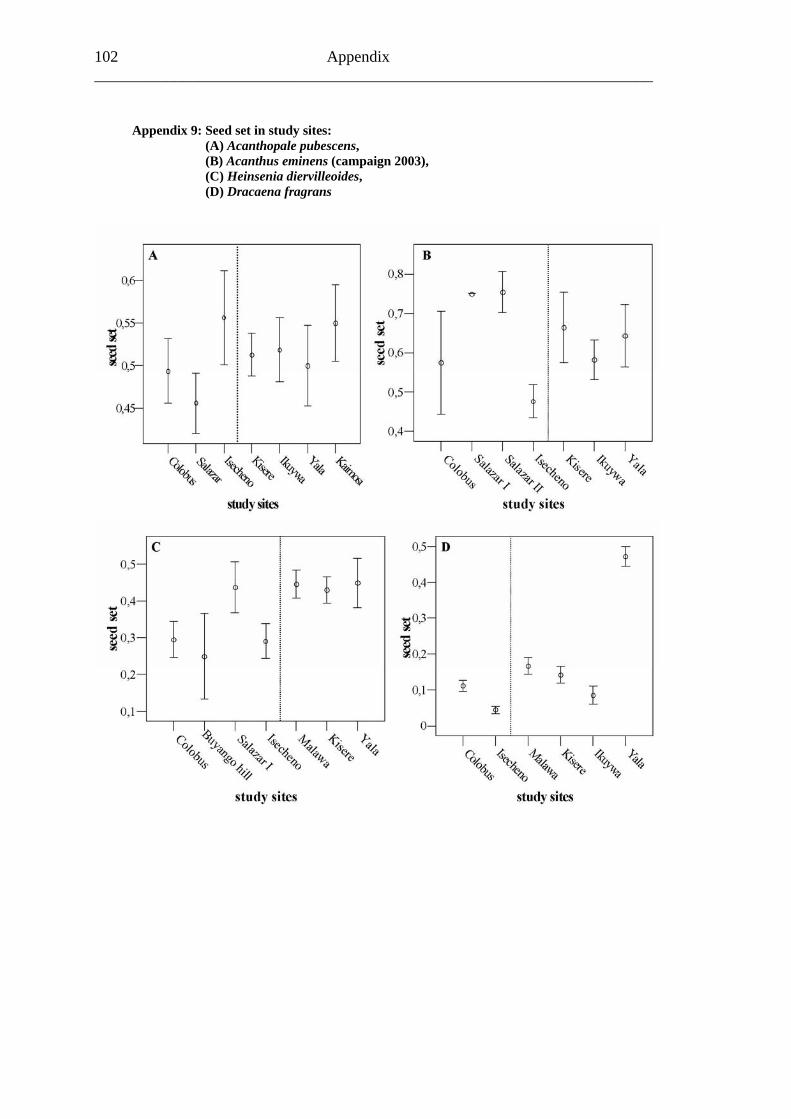
102 Appendix ______________________________________________________________________
Appendix 9: Seed set in study sites: (A) Acanthopale pubescens, (B) Acanthus eminens (campaign 2003), (C) Heinsenia diervilleoides, (D) Dracaena fragrans
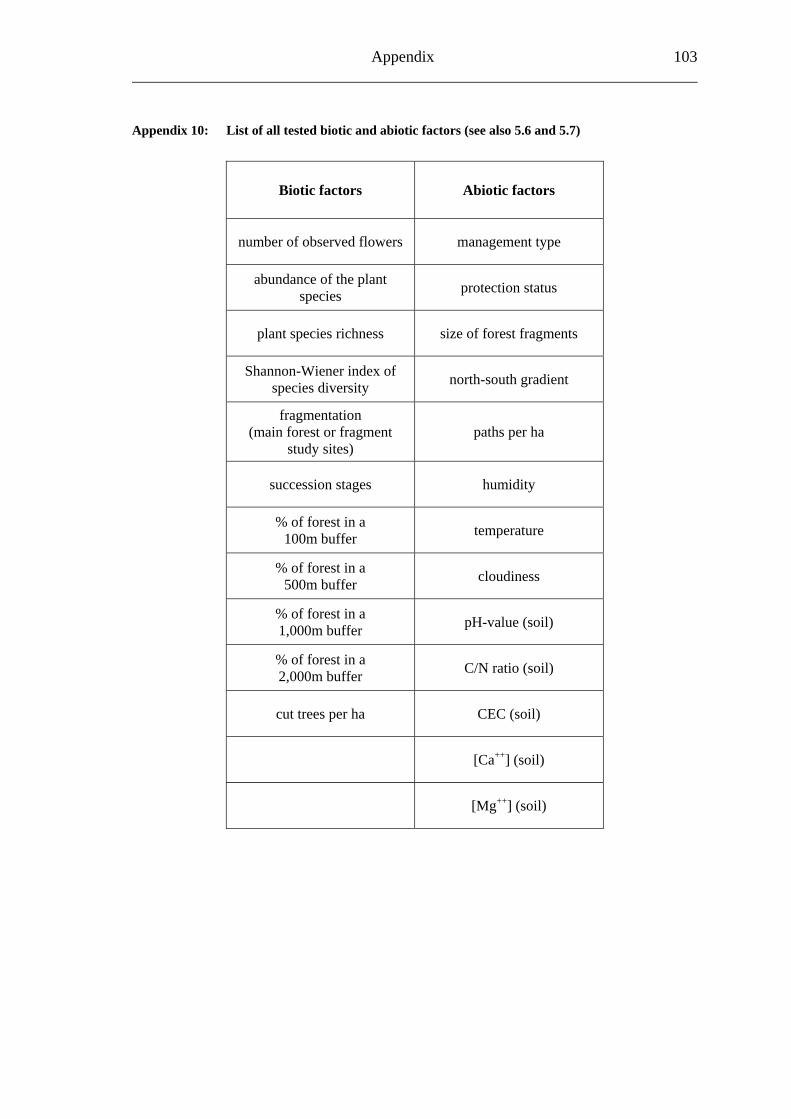
Appendix 103
Appendix 10: List of all tested biotic and abiotic factors (see also 5.6 and 5.7)
Biotic factors Abiotic factors
number of observed flowers management type
abundance of the plant species protection status
plant species richness size of forest fragments
Shannon-Wiener index of species diversity north-south gradient
fragmentation (main forest or fragment
study sites) paths per ha
succession stages humidity
% of forest in a 100m buffer temperature
% of forest in a 500m buffer cloudiness
% of forest in a 1,000m buffer pH-value (soil)
% of forest in a 2,000m buffer C/N ratio (soil)
cut trees per ha CEC (soil)
[Ca++] (soil)
[Mg++] (soil)
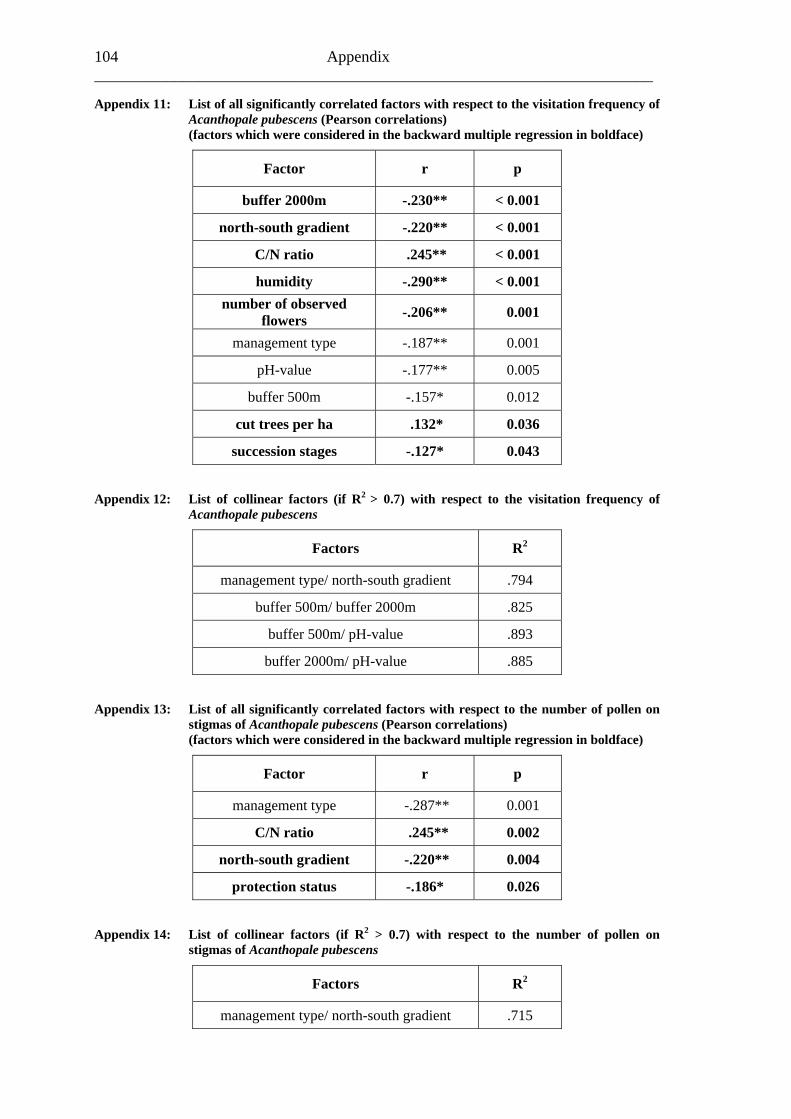
104 Appendix ______________________________________________________________________ Appendix 11: List of all significantly correlated factors with respect to the visitation frequency of Acanthopale pubescens (Pearson correlations) (factors which were considered in the backward multiple regression in boldface)
Factor r p
buffer 2000m -.230** < 0.001
north-south gradient -.220** < 0.001
C/N ratio .245** < 0.001
humidity -.290** < 0.001 number of observed
flowers -.206** 0.001
management type -.187** 0.001
pH-value -.177** 0.005
buffer 500m -.157* 0.012
cut trees per ha .132* 0.036
succession stages -.127* 0.043 Appendix 12: List of collinear factors (if R2 > 0.7) with respect to the visitation frequency of Acanthopale pubescens
Factors R2
management type/ north-south gradient .794
buffer 500m/ buffer 2000m .825
buffer 500m/ pH-value .893
buffer 2000m/ pH-value .885 Appendix 13: List of all significantly correlated factors with respect to the number of pollen on stigmas of Acanthopale pubescens (Pearson correlations) (factors which were considered in the backward multiple regression in boldface)
Factor r p
management type -.287** 0.001
C/N ratio .245** 0.002
north-south gradient -.220** 0.004
protection status -.186* 0.026 Appendix 14: List of collinear factors (if R2 > 0.7) with respect to the number of pollen on stigmas of Acanthopale pubescens
Factors R2
management type/ north-south gradient .715
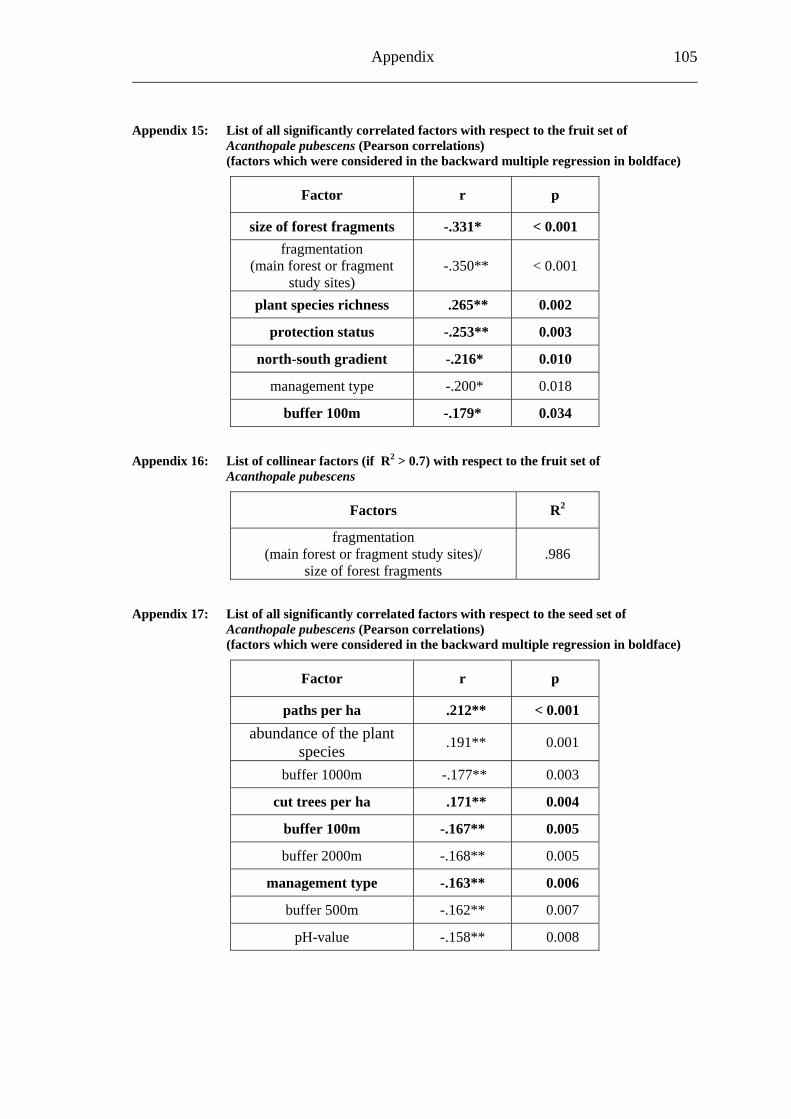
Appendix 105
Appendix 15: List of all significantly correlated factors with respect to the fruit set of Acanthopale pubescens (Pearson correlations) (factors which were considered in the backward multiple regression in boldface)
Factor r p
size of forest fragments -.331* < 0.001 fragmentation
(main forest or fragment study sites)
-.350** < 0.001
plant species richness .265** 0.002
protection status -.253** 0.003
north-south gradient -.216* 0.010
management type -.200* 0.018
buffer 100m -.179* 0.034 Appendix 16: List of collinear factors (if R2 > 0.7) with respect to the fruit set of Acanthopale pubescens
Factors R2
fragmentation (main forest or fragment study sites)/
size of forest fragments .986
Appendix 17: List of all significantly correlated factors with respect to the seed set of Acanthopale pubescens (Pearson correlations) (factors which were considered in the backward multiple regression in boldface)
Factor r p
paths per ha .212** < 0.001 abundance of the plant
species .191** 0.001
buffer 1000m -.177** 0.003
cut trees per ha .171** 0.004
buffer 100m -.167** 0.005
buffer 2000m -.168** 0.005
management type -.163** 0.006
buffer 500m -.162** 0.007
pH-value -.158** 0.008
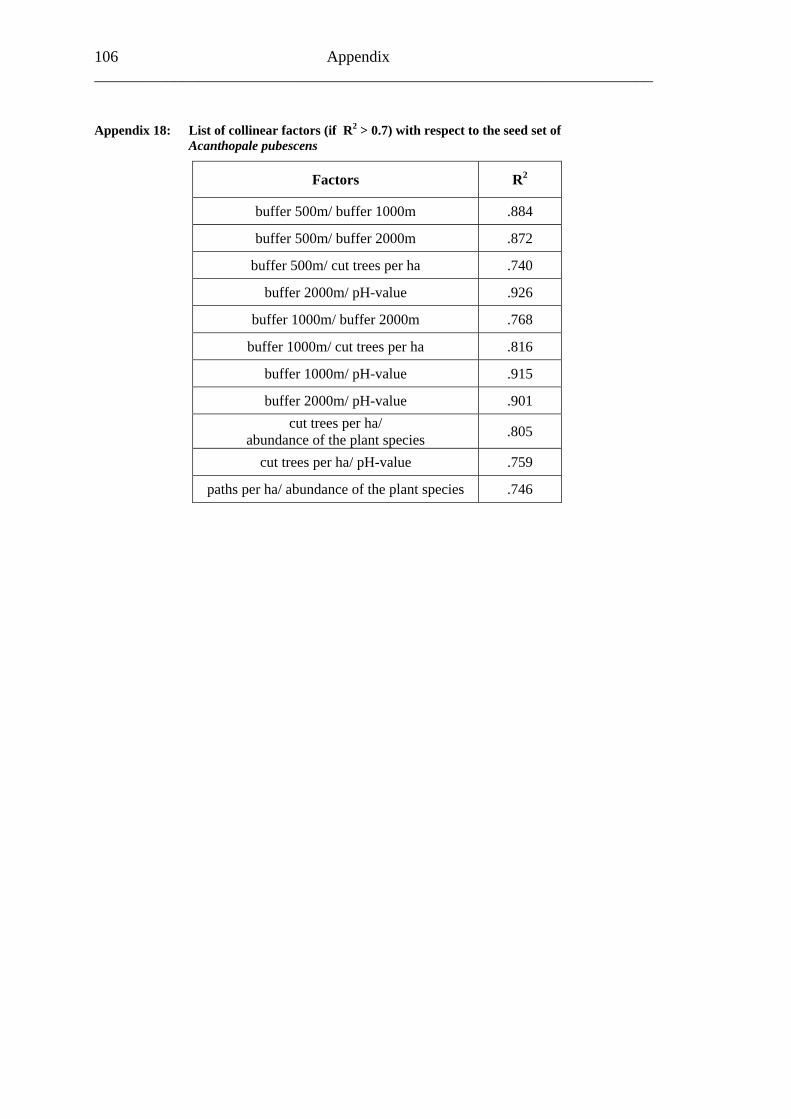
106 Appendix ______________________________________________________________________ Appendix 18: List of collinear factors (if R2 > 0.7) with respect to the seed set of Acanthopale pubescens
Factors R2
buffer 500m/ buffer 1000m .884
buffer 500m/ buffer 2000m .872
buffer 500m/ cut trees per ha .740
buffer 2000m/ pH-value .926
buffer 1000m/ buffer 2000m .768
buffer 1000m/ cut trees per ha .816
buffer 1000m/ pH-value .915
buffer 2000m/ pH-value .901 cut trees per ha/
abundance of the plant species .805
cut trees per ha/ pH-value .759
paths per ha/ abundance of the plant species .746
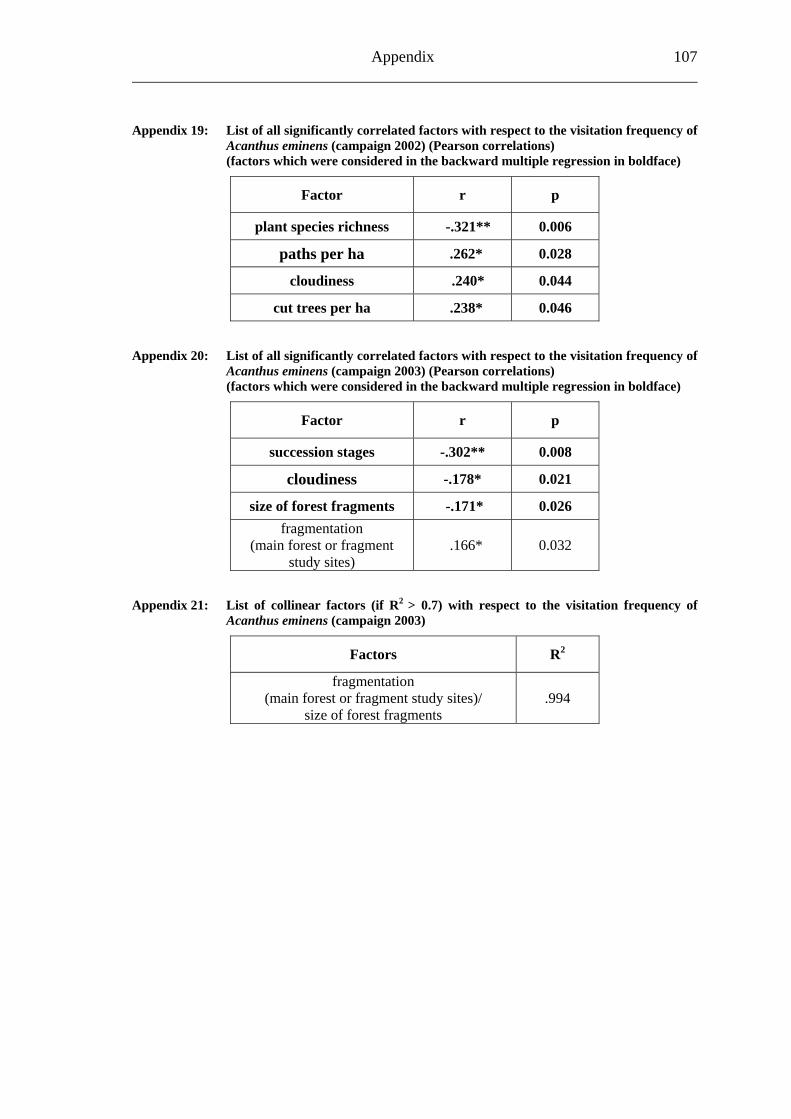
Appendix 107
Appendix 19: List of all significantly correlated factors with respect to the visitation frequency of Acanthus eminens (campaign 2002) (Pearson correlations) (factors which were considered in the backward multiple regression in boldface)
Factor r p
plant species richness -.321** 0.006
paths per ha .262* 0.028
cloudiness .240* 0.044
cut trees per ha .238* 0.046 Appendix 20: List of all significantly correlated factors with respect to the visitation frequency of Acanthus eminens (campaign 2003) (Pearson correlations) (factors which were considered in the backward multiple regression in boldface)
Factor r p
succession stages -.302** 0.008
cloudiness -.178* 0.021
size of forest fragments -.171* 0.026 fragmentation
(main forest or fragment study sites)
.166* 0.032
Appendix 21: List of collinear factors (if R2 > 0.7) with respect to the visitation frequency of Acanthus eminens (campaign 2003)
Factors R2
fragmentation (main forest or fragment study sites)/
size of forest fragments .994
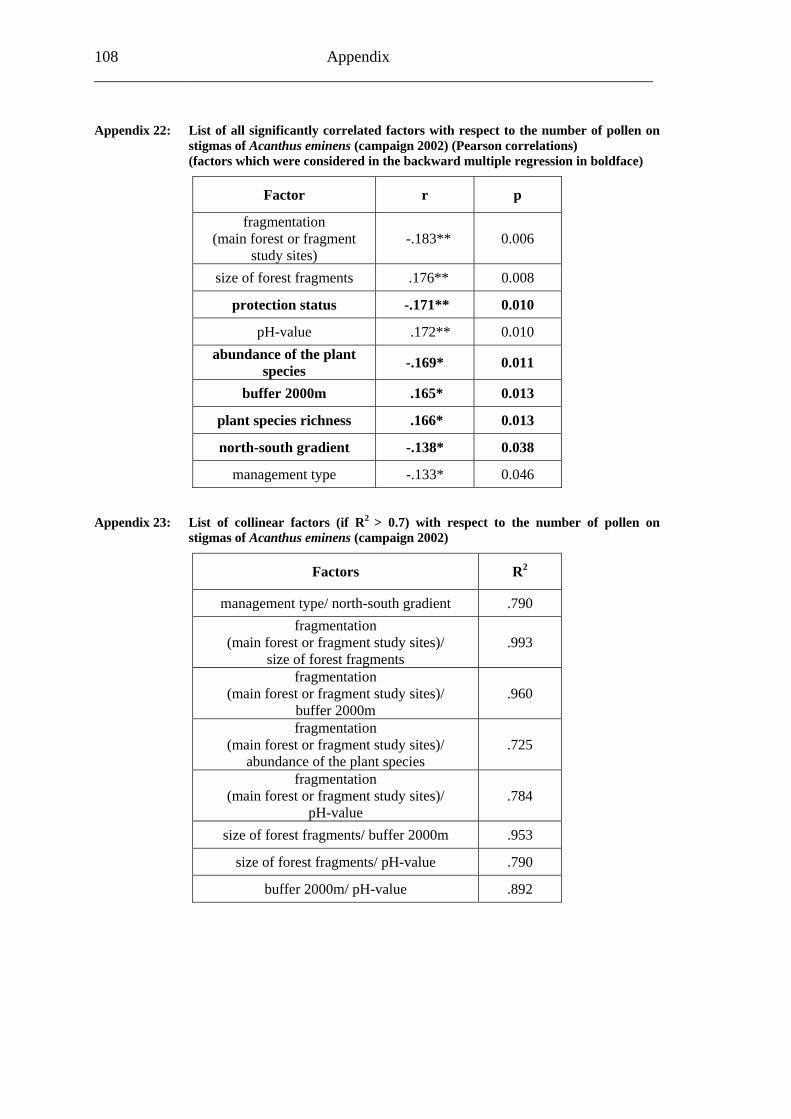
108 Appendix ______________________________________________________________________ Appendix 22: List of all significantly correlated factors with respect to the number of pollen on stigmas of Acanthus eminens (campaign 2002) (Pearson correlations) (factors which were considered in the backward multiple regression in boldface)
Factor r p
fragmentation (main forest or fragment
study sites) -.183** 0.006
size of forest fragments .176** 0.008
protection status -.171** 0.010
pH-value .172** 0.010 abundance of the plant
species -.169* 0.011
buffer 2000m .165* 0.013
plant species richness .166* 0.013
north-south gradient -.138* 0.038
management type -.133* 0.046 Appendix 23: List of collinear factors (if R2 > 0.7) with respect to the number of pollen on stigmas of Acanthus eminens (campaign 2002)
Factors R2
management type/ north-south gradient .790 fragmentation
(main forest or fragment study sites)/ size of forest fragments
.993
fragmentation (main forest or fragment study sites)/
buffer 2000m .960
fragmentation (main forest or fragment study sites)/
abundance of the plant species .725
fragmentation (main forest or fragment study sites)/
pH-value .784
size of forest fragments/ buffer 2000m .953
size of forest fragments/ pH-value .790
buffer 2000m/ pH-value .892
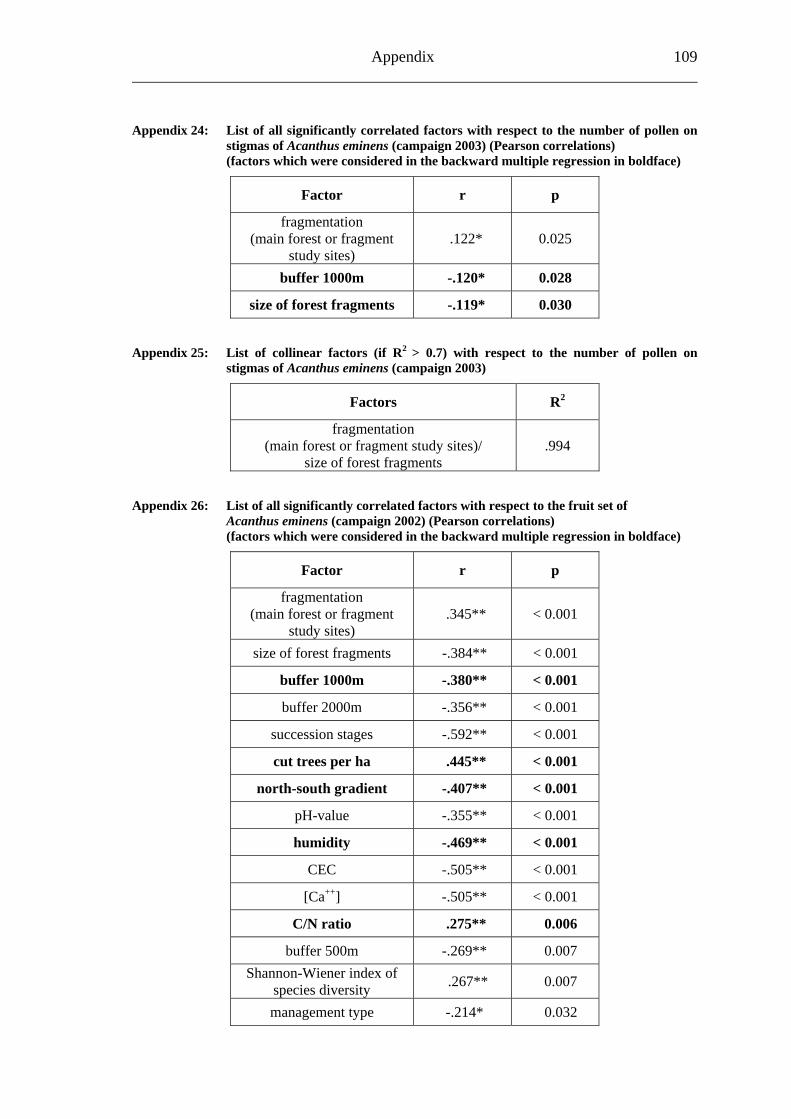
Appendix 109
Appendix 24: List of all significantly correlated factors with respect to the number of pollen on stigmas of Acanthus eminens (campaign 2003) (Pearson correlations) (factors which were considered in the backward multiple regression in boldface)
Factor r p
fragmentation (main forest or fragment
study sites) .122* 0.025
buffer 1000m -.120* 0.028
size of forest fragments -.119* 0.030 Appendix 25: List of collinear factors (if R2 > 0.7) with respect to the number of pollen on stigmas of Acanthus eminens (campaign 2003)
Factors R2
fragmentation (main forest or fragment study sites)/
size of forest fragments .994
Appendix 26: List of all significantly correlated factors with respect to the fruit set of Acanthus eminens (campaign 2002) (Pearson correlations) (factors which were considered in the backward multiple regression in boldface)
Factor r p
fragmentation (main forest or fragment
study sites) .345** < 0.001
size of forest fragments -.384** < 0.001
buffer 1000m -.380** < 0.001
buffer 2000m -.356** < 0.001
succession stages -.592** < 0.001
cut trees per ha .445** < 0.001
north-south gradient -.407** < 0.001
pH-value -.355** < 0.001
humidity -.469** < 0.001
CEC -.505** < 0.001
[Ca++] -.505** < 0.001
C/N ratio .275** 0.006
buffer 500m -.269** 0.007 Shannon-Wiener index of
species diversity .267** 0.007
management type -.214* 0.032
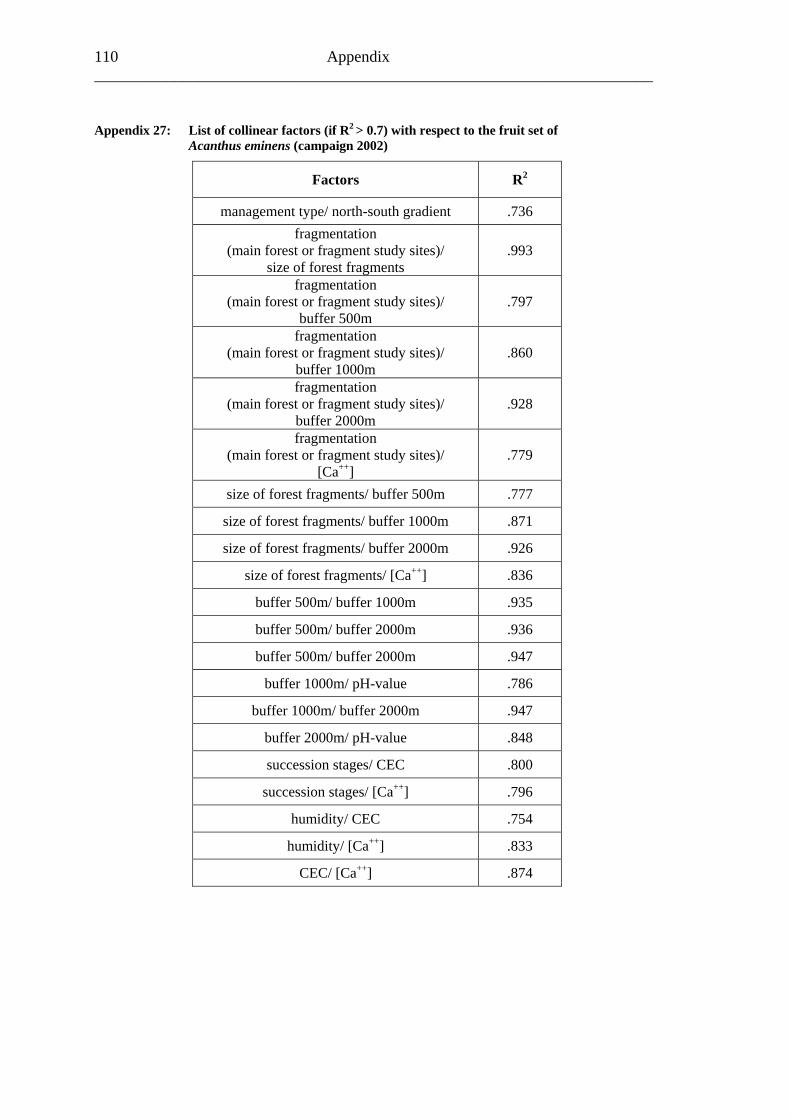
110 Appendix ______________________________________________________________________ Appendix 27: List of collinear factors (if R2 > 0.7) with respect to the fruit set of Acanthus eminens (campaign 2002)
Factors R2
management type/ north-south gradient .736 fragmentation
(main forest or fragment study sites)/ size of forest fragments
.993
fragmentation (main forest or fragment study sites)/
buffer 500m .797
fragmentation (main forest or fragment study sites)/
buffer 1000m .860
fragmentation (main forest or fragment study sites)/
buffer 2000m .928
fragmentation (main forest or fragment study sites)/
[Ca++] .779
size of forest fragments/ buffer 500m .777
size of forest fragments/ buffer 1000m .871
size of forest fragments/ buffer 2000m .926
size of forest fragments/ [Ca++] .836
buffer 500m/ buffer 1000m .935
buffer 500m/ buffer 2000m .936
buffer 500m/ buffer 2000m .947
buffer 1000m/ pH-value .786
buffer 1000m/ buffer 2000m .947
buffer 2000m/ pH-value .848
succession stages/ CEC .800
succession stages/ [Ca++] .796
humidity/ CEC .754
humidity/ [Ca++] .833
CEC/ [Ca++] .874
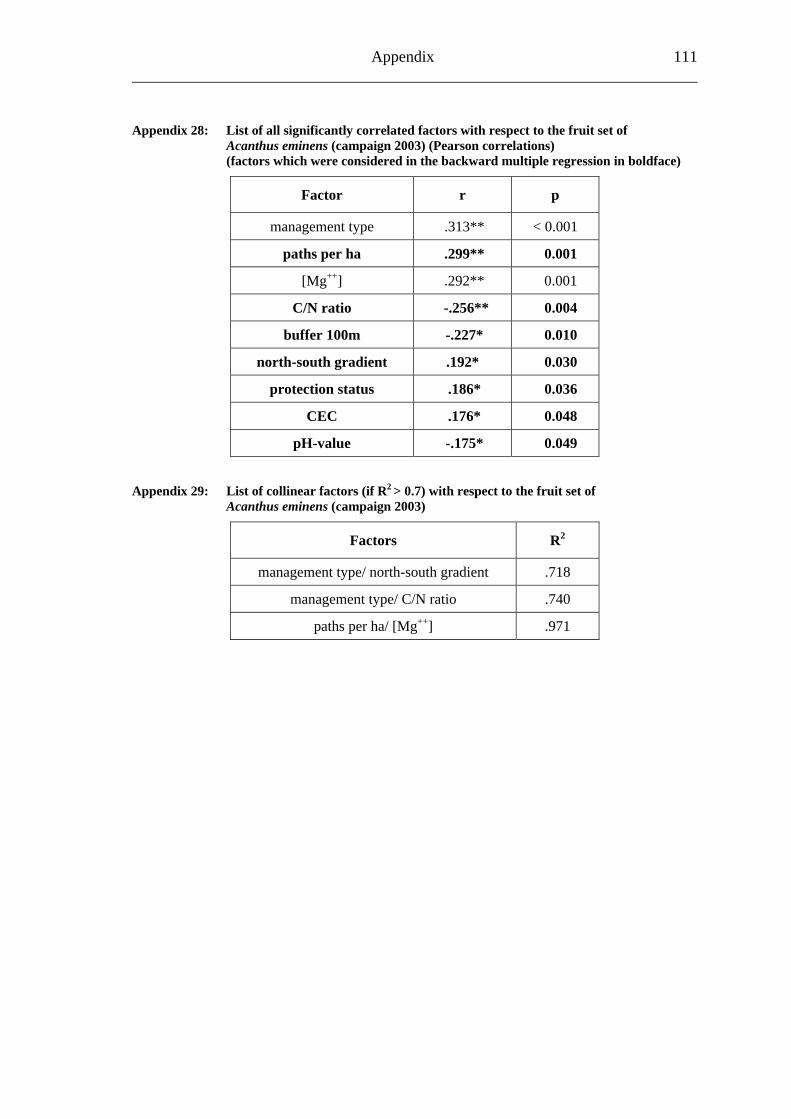
Appendix 111
Appendix 28: List of all significantly correlated factors with respect to the fruit set of Acanthus eminens (campaign 2003) (Pearson correlations) (factors which were considered in the backward multiple regression in boldface)
Factor r p
management type .313** < 0.001
paths per ha .299** 0.001
[Mg++] .292** 0.001
C/N ratio -.256** 0.004
buffer 100m -.227* 0.010
north-south gradient .192* 0.030
protection status .186* 0.036
CEC .176* 0.048
pH-value -.175* 0.049 Appendix 29: List of collinear factors (if R2 > 0.7) with respect to the fruit set of Acanthus eminens (campaign 2003)
Factors R2
management type/ north-south gradient .718
management type/ C/N ratio .740
paths per ha/ [Mg++] .971
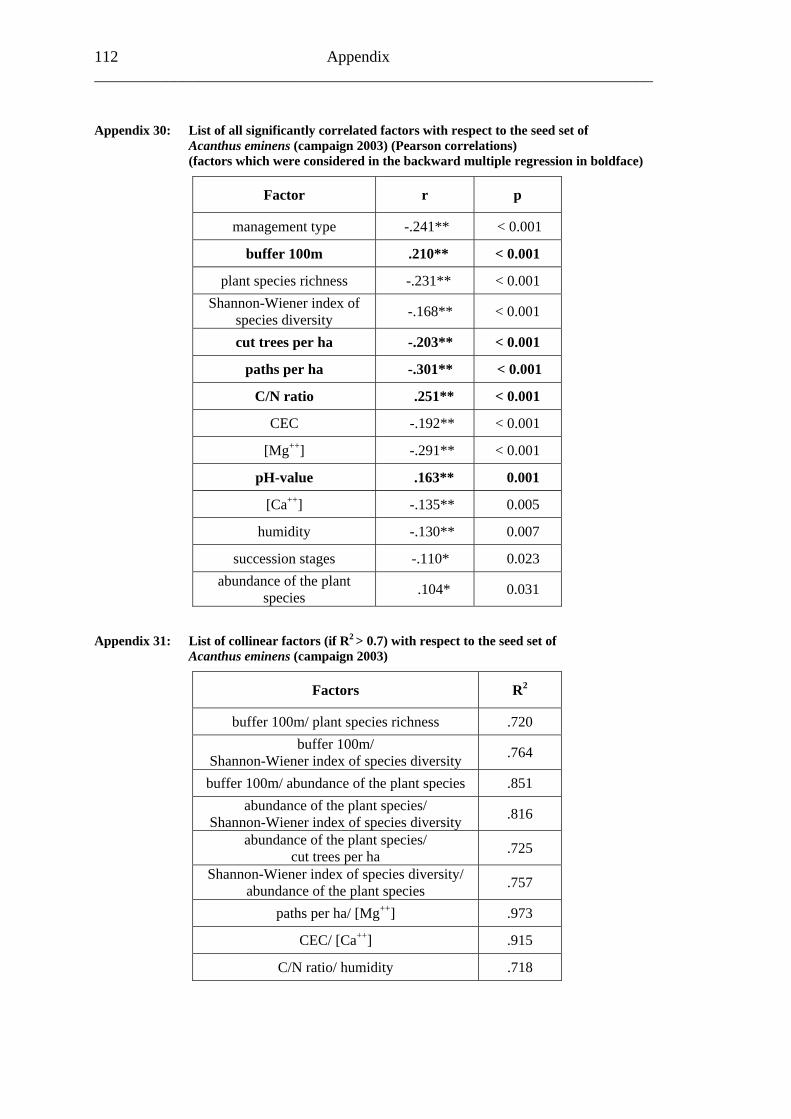
112 Appendix ______________________________________________________________________ Appendix 30: List of all significantly correlated factors with respect to the seed set of Acanthus eminens (campaign 2003) (Pearson correlations) (factors which were considered in the backward multiple regression in boldface)
Factor r p
management type -.241** < 0.001
buffer 100m .210** < 0.001
plant species richness -.231** < 0.001 Shannon-Wiener index of
species diversity -.168** < 0.001
cut trees per ha -.203** < 0.001
paths per ha -.301** < 0.001
C/N ratio .251** < 0.001
CEC -.192** < 0.001
[Mg++] -.291** < 0.001
pH-value .163** 0.001
[Ca++] -.135** 0.005
humidity -.130** 0.007
succession stages -.110* 0.023 abundance of the plant
species .104* 0.031
Appendix 31: List of collinear factors (if R2 > 0.7) with respect to the seed set of Acanthus eminens (campaign 2003)
Factors R2
buffer 100m/ plant species richness .720 buffer 100m/
Shannon-Wiener index of species diversity .764
buffer 100m/ abundance of the plant species .851 abundance of the plant species/
Shannon-Wiener index of species diversity .816
abundance of the plant species/ cut trees per ha .725
Shannon-Wiener index of species diversity/ abundance of the plant species .757
paths per ha/ [Mg++] .973
CEC/ [Ca++] .915
C/N ratio/ humidity .718
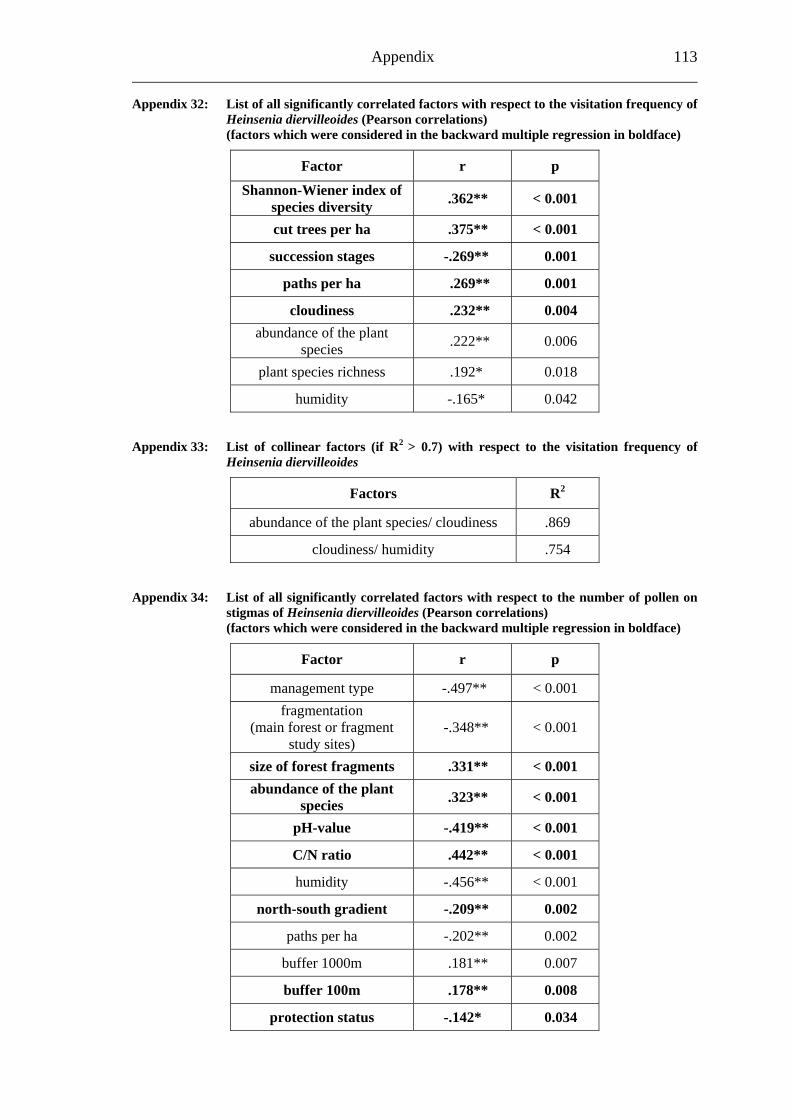
Appendix 113
Appendix 32: List of all significantly correlated factors with respect to the visitation frequency of Heinsenia diervilleoides (Pearson correlations) (factors which were considered in the backward multiple regression in boldface)
Factor r p
Shannon-Wiener index of species diversity .362** < 0.001
cut trees per ha .375** < 0.001
succession stages -.269** 0.001
paths per ha .269** 0.001
cloudiness .232** 0.004 abundance of the plant
species .222** 0.006
plant species richness .192* 0.018
humidity -.165* 0.042 Appendix 33: List of collinear factors (if R2 > 0.7) with respect to the visitation frequency of Heinsenia diervilleoides
Factors R2
abundance of the plant species/ cloudiness .869
cloudiness/ humidity .754 Appendix 34: List of all significantly correlated factors with respect to the number of pollen on stigmas of Heinsenia diervilleoides (Pearson correlations) (factors which were considered in the backward multiple regression in boldface)
Factor r p
management type -.497** < 0.001 fragmentation
(main forest or fragment study sites)
-.348** < 0.001
size of forest fragments .331** < 0.001 abundance of the plant
species .323** < 0.001
pH-value -.419** < 0.001
C/N ratio .442** < 0.001
humidity -.456** < 0.001
north-south gradient -.209** 0.002
paths per ha -.202** 0.002
buffer 1000m .181** 0.007
buffer 100m .178** 0.008
protection status -.142* 0.034
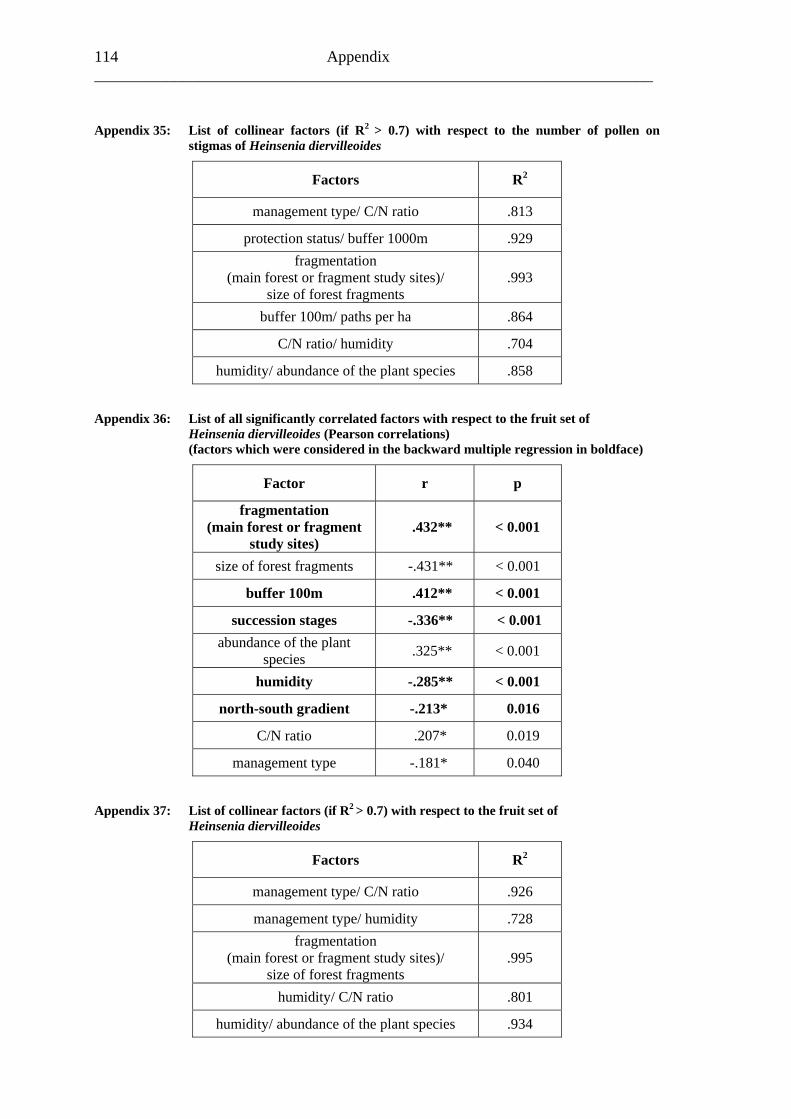
114 Appendix ______________________________________________________________________ Appendix 35: List of collinear factors (if R2 > 0.7) with respect to the number of pollen on stigmas of Heinsenia diervilleoides
Factors R2
management type/ C/N ratio .813
protection status/ buffer 1000m .929 fragmentation
(main forest or fragment study sites)/ size of forest fragments
.993
buffer 100m/ paths per ha .864
C/N ratio/ humidity .704
humidity/ abundance of the plant species .858 Appendix 36: List of all significantly correlated factors with respect to the fruit set of Heinsenia diervilleoides (Pearson correlations) (factors which were considered in the backward multiple regression in boldface)
Factor r p
fragmentation (main forest or fragment
study sites) .432** < 0.001
size of forest fragments -.431** < 0.001
buffer 100m .412** < 0.001
succession stages -.336** < 0.001 abundance of the plant
species .325** < 0.001
humidity -.285** < 0.001
north-south gradient -.213* 0.016
C/N ratio .207* 0.019
management type -.181* 0.040 Appendix 37: List of collinear factors (if R2 > 0.7) with respect to the fruit set of Heinsenia diervilleoides
Factors R2
management type/ C/N ratio .926
management type/ humidity .728 fragmentation
(main forest or fragment study sites)/ size of forest fragments
.995
humidity/ C/N ratio .801
humidity/ abundance of the plant species .934
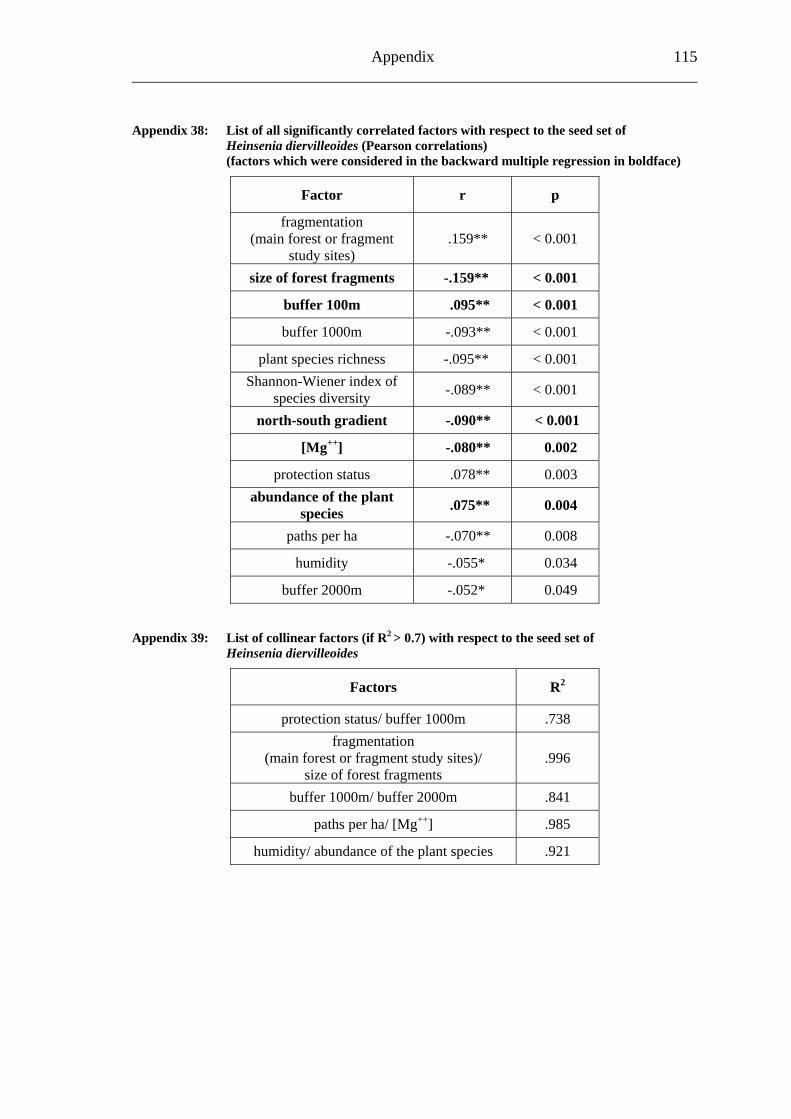
Appendix 115
Appendix 38: List of all significantly correlated factors with respect to the seed set of Heinsenia diervilleoides (Pearson correlations) (factors which were considered in the backward multiple regression in boldface)
Factor r p
fragmentation (main forest or fragment
study sites) .159** < 0.001
size of forest fragments -.159** < 0.001
buffer 100m .095** < 0.001
buffer 1000m -.093** < 0.001
plant species richness -.095** < 0.001 Shannon-Wiener index of
species diversity -.089** < 0.001
north-south gradient -.090** < 0.001
[Mg++] -.080** 0.002
protection status .078** 0.003 abundance of the plant
species .075** 0.004
paths per ha -.070** 0.008
humidity -.055* 0.034
buffer 2000m -.052* 0.049 Appendix 39: List of collinear factors (if R2 > 0.7) with respect to the seed set of Heinsenia diervilleoides
Factors R2
protection status/ buffer 1000m .738 fragmentation
(main forest or fragment study sites)/ size of forest fragments
.996
buffer 1000m/ buffer 2000m .841
paths per ha/ [Mg++] .985
humidity/ abundance of the plant species .921
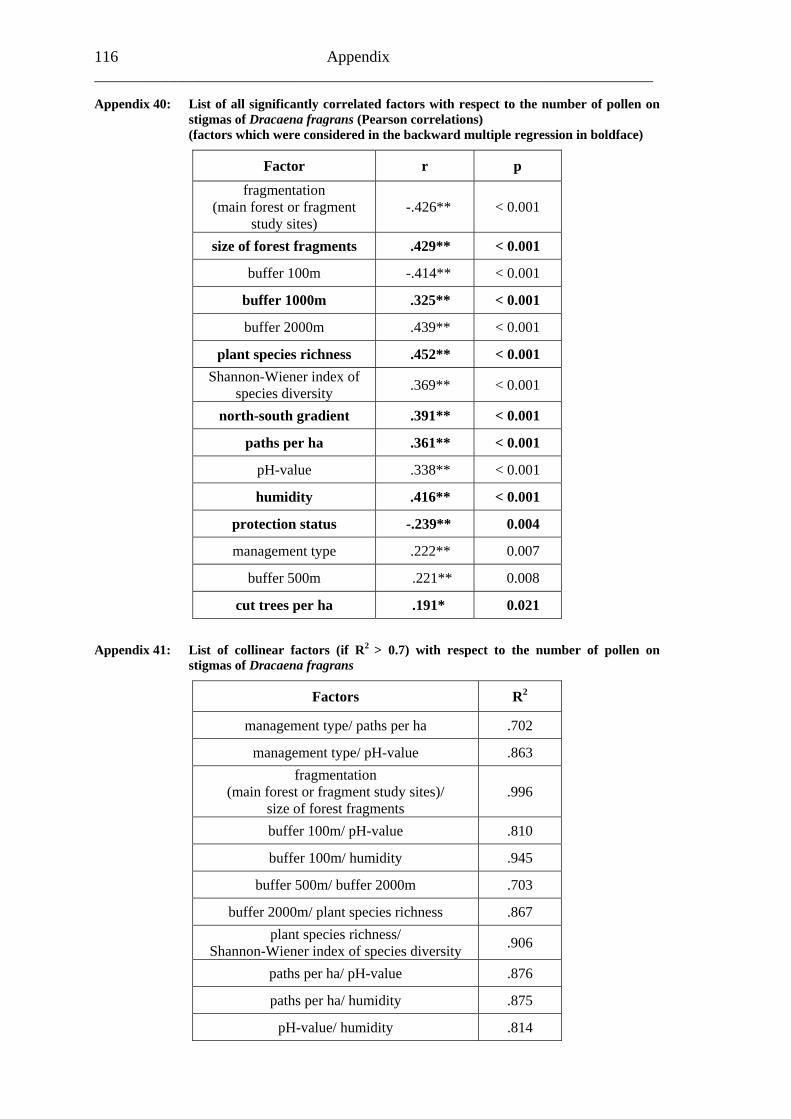
116 Appendix ______________________________________________________________________ Appendix 40: List of all significantly correlated factors with respect to the number of pollen on stigmas of Dracaena fragrans (Pearson correlations) (factors which were considered in the backward multiple regression in boldface)
Factor r p
fragmentation (main forest or fragment
study sites) -.426** < 0.001
size of forest fragments .429** < 0.001
buffer 100m -.414** < 0.001
buffer 1000m .325** < 0.001
buffer 2000m .439** < 0.001
plant species richness .452** < 0.001 Shannon-Wiener index of
species diversity .369** < 0.001
north-south gradient .391** < 0.001
paths per ha .361** < 0.001
pH-value .338** < 0.001
humidity .416** < 0.001
protection status -.239** 0.004
management type .222** 0.007
buffer 500m .221** 0.008
cut trees per ha .191* 0.021
Appendix 41: List of collinear factors (if R2 > 0.7) with respect to the number of pollen on stigmas of Dracaena fragrans
Factors R2
management type/ paths per ha .702
management type/ pH-value .863 fragmentation
(main forest or fragment study sites)/ size of forest fragments
.996
buffer 100m/ pH-value .810
buffer 100m/ humidity .945
buffer 500m/ buffer 2000m .703
buffer 2000m/ plant species richness .867 plant species richness/
Shannon-Wiener index of species diversity .906
paths per ha/ pH-value .876
paths per ha/ humidity .875
pH-value/ humidity .814
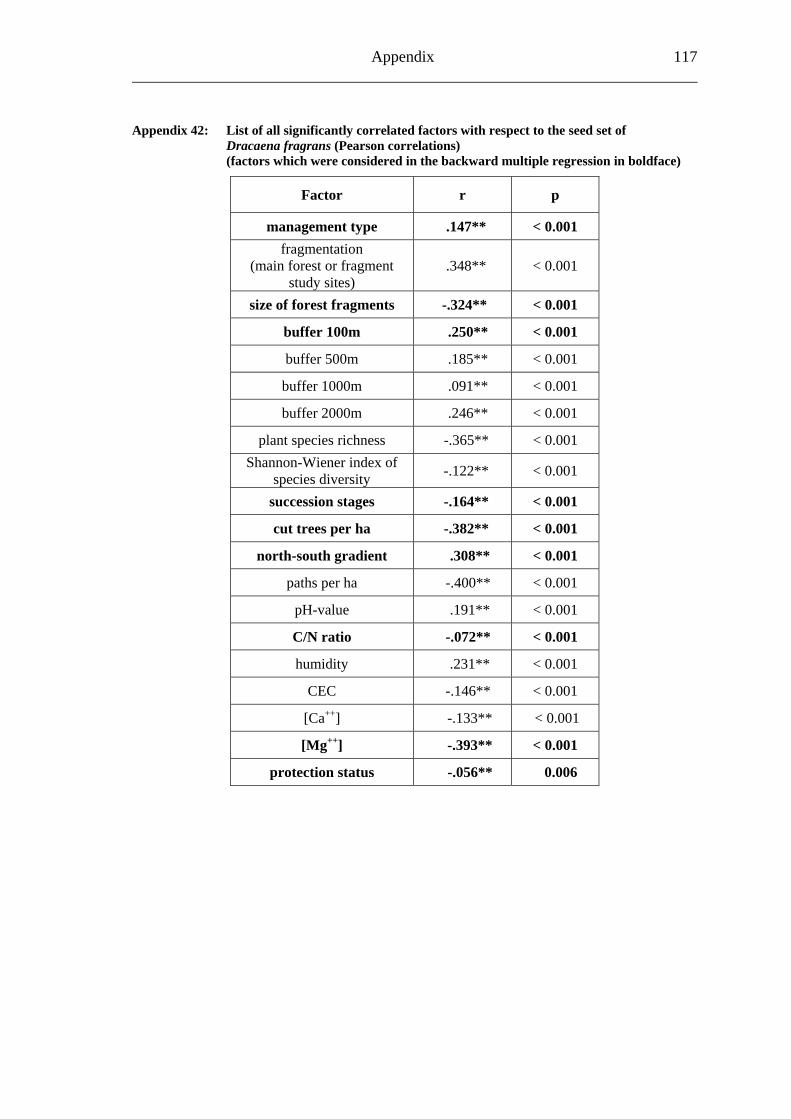
Appendix 117
Appendix 42: List of all significantly correlated factors with respect to the seed set of Dracaena fragrans (Pearson correlations) (factors which were considered in the backward multiple regression in boldface)
Factor r p
management type .147** < 0.001 fragmentation
(main forest or fragment study sites)
.348** < 0.001
size of forest fragments -.324** < 0.001
buffer 100m .250** < 0.001
buffer 500m .185** < 0.001
buffer 1000m .091** < 0.001
buffer 2000m .246** < 0.001
plant species richness -.365** < 0.001 Shannon-Wiener index of
species diversity -.122** < 0.001
succession stages -.164** < 0.001
cut trees per ha -.382** < 0.001
north-south gradient .308** < 0.001
paths per ha -.400** < 0.001
pH-value .191** < 0.001
C/N ratio -.072** < 0.001
humidity .231** < 0.001
CEC -.146** < 0.001
[Ca++] -.133** < 0.001
[Mg++] -.393** < 0.001
protection status -.056** 0.006
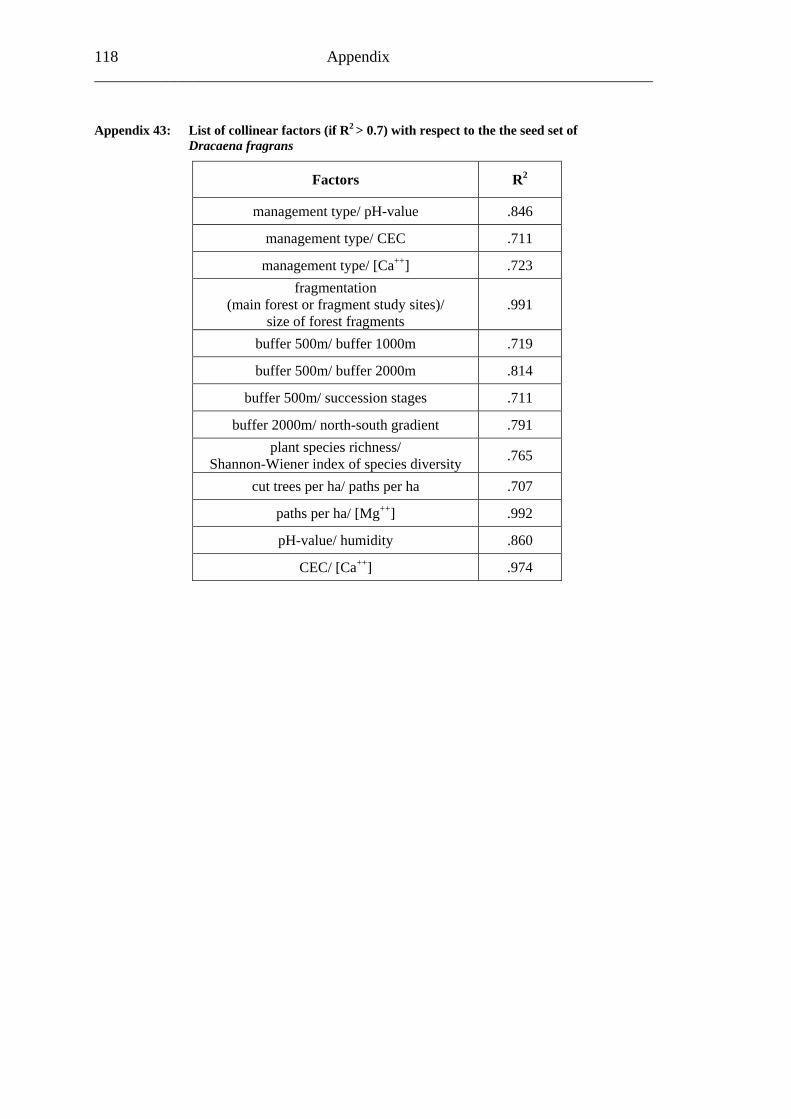
118 Appendix ______________________________________________________________________ Appendix 43: List of collinear factors (if R2 > 0.7) with respect to the the seed set of Dracaena fragrans
Factors R2
management type/ pH-value .846
management type/ CEC .711
management type/ [Ca++] .723 fragmentation
(main forest or fragment study sites)/ size of forest fragments
.991
buffer 500m/ buffer 1000m .719
buffer 500m/ buffer 2000m .814
buffer 500m/ succession stages .711
buffer 2000m/ north-south gradient .791 plant species richness/
Shannon-Wiener index of species diversity .765
cut trees per ha/ paths per ha .707
paths per ha/ [Mg++] .992
pH-value/ humidity .860
CEC/ [Ca++] .974

Danksagung Diese Arbeit wäre ohne die Hilfe von vielen lieben Menschen nicht möglich gewesen, denen ich an dieser Stelle danken möchte. Prof. Dr. Clas Naumann († 15.02.2004) für das mir entgegengebrachte Vertrauen und seine herzliche Aufnahme als Doktorand am Zoologischen Forschungsinstitut und Museum Alexander Koenig. Prof. Dr. J. Wolfgang Wägele und Prof. Dr. Wolfgang Böhme möchte herzlich für die unkomplizierte und für sie völlig selbstverständliche Übernahme der Betreuung und Korrektur dieser Arbeit danken. Gleiches gilt für Prof. Dr. Eberhard Fischer und Prof. Dr. Jes Rust. Mein größter Dank gebührt Dr. Manfred Kraemer. Er war mir jederzeit ein kompetenter Ansprechpartner und freundschaftlicher Ratgeber. In allen Phasen meiner Doktorarbeit hat er mich kritisch begleitet, vorbehaltlos unterstützt und in vielen verschiedenen Bereichen gefördert. Seine Betreuung war mehr als vorbildlich. Dankeschön für den faszinierenden Einblick in die Welt der Tier-Pflanzen-Interaktionen und der Tropenökologie! Aber auch unserer Arbeitsgruppe um den „Don“ herum, im besonderen Anke Dietzsch, Christina Gebhardt, Mary W. Gikungu, Melanie Hagen, Christopher Kaiser, Marcell Peters und Guido Velten ein großes Dankeschön für die Unterstützung und die vielen konstruktiven und spannenden Gespräche. Ein besonderes „asante sana“ gilt Caleb I. Analo; ohne seine unermüdliche, verlässliche und kompetente Unterstützung bei der Feldarbeit wäre diese Arbeit nicht möglich gewesen. Dankeschön für das große Geschenk, mir einen Einblick in die Kultur der Luja ermöglicht zu haben und die großherzige Gastfreundschaft. Danken will ich auch der „BIOTA Familie“ für einen nicht selbstverständlichen und umfangreichen Datenaustausch. Eine besondere Erwähnung sollen in diesem Zusammenhang die eigens für diese Arbeit errechneten Daten zur Landschaftsstruktur und die verwendeten Karten von Prof. Dr. Gertrud Schaab (BIOTA E02) finden. Aber auch die Vegetations- und Klimadaten von Dr. Arnhild Althof (BIOTA E04), die Bodendaten von Winfred Musila (BIOTA E03) und die Störungsdaten von Dr. Bärbel Bleher (BIOTA E11), Dana Uster (BIOTA E03) und Nick Mitchell waren für diese Arbeit sehr wertvoll. Auch den tapferen Helferinnen im Freiland Nadja Riemoneit, Verena Ick, Alice Kasprzik und Melanie Schloßberger ein großes Dankeschön. Den vielen Menschen die mit mir das Leben im BIOTA Camp im Kakamega Forest teilten und den Aufenthalt in Afrika zu einer wunderbaren Erfahrung werden ließen sei ebenfalls herzlich gedankt. Im Besonderen möchte ich hier Christopher Kaiser und Dr. Wolfram Freund erwähnen. Vielen Dank an Frank Bergsdorf, Ingo Bergsdorf, Dr. Wolfram Freund, Yvonne Hewer, Verena Ick, Dr. Bradley Sinclair und vor allem Dr. Manfred Kraemer für ihre ausdauernde und wunderbare Hilfe beim Korrekturlesen und bei diversen „Software-Herausforderungen“.

Meinen Eltern Helga und Ingo Bergsdorf sei an dieser Stelle ein besonderer Dank ausgesprochen. Sie haben mich stets in meinen Entscheidungen beratend unterstützt und zu jeder Zeit alles in ihrer Macht Stehende für mich getan. Gleiches gilt auch für meinen Bruder Frank. Genauso soll der immer verständnisvolle Beistand während der Fertigstellung dieser Arbeit durch Verena Ick nicht unerwähnt bleiben. Diese Studie wurde vom Bundesministerium für Bildung und Forschung im Rahmen des Biodiversitätsprojektes BIOTA East Africa (www.biota-africa.org) finanziert.