foreign aid in the aftermath of large natural disasters
TRANSCRIPT

Foreign Aid in the Aftermath of LargeNatural Disasters
Oscar Becerra, Eduardo Cavallo, and Ilan Noy*
AbstractThis paper examines Official Development Assistance (ODA) in the aftermath of large natural disastersbetween 1970 and 2008. Using an event-study approach, the paper finds that while the median increase inODA is 18% compared with pre-disaster flows, the typical surge is small in relation to the size of theaffected economies. Moreover, aid surges typically cover only 3% of the total estimated economic damagescaused by the disasters. The main determinants of post-disaster aid surges are found to be the intensity ofthe event itself and the recipient country’s characteristics such as the level of development, country size andthe stock of foreign reserves. The paper does not find evidence that political considerations or strategicbehavior on the part of donors determine the size of post-disaster aid surges.
1. Introduction
Human and economic catastrophes associated with natural hazards are obviously notnew, even if new media have changed the way we are aware of them. The January2010 earthquake in Haiti and the Indian Ocean tsunami of 2004 both generated muchinternational media attention and unprecedented amounts of international pledges ofaid from private charities, non-governmental organizations (NGOs), governmentsand multilateral organizations.1 Nonetheless, aid pledges made while media attentionis at its peak may not always be disbursed, could take a long time to arrive, or mayreplace previously pledged aid. This raises the following questions: (1) How muchdoes foreign aid really increase in the aftermath of large disasters? (2) Are aid surgessizable in relation to the estimated economic damages caused by disasters? (3) Whatdetermines the actual size of the surges?
As far as we could find, no one has ever looked at these questions systematically, inspite of their obvious importance. One stumbling block is that data sources thatdescribe emergency international assistance (for example, the United Nations’ Finan-cial Tracking Service database), do not compare their information with disbursementsprior to the event. Therefore, it may be that much of these resources recorded aspost-disaster aid would have been provided anyway (i.e. without a disaster occur-ring).2 We try to avoid this problem by exploiting the data available through theOrganisation for Economic Co-operation and Development’s (OECD’s) OfficialDevelopment Assistance (ODA) dataset which tracks bilateral aid flows from 44donor countries (32 OECD and 12 non-OECD) to 165 recipient countries since 1960.Therefore, using an event study approach, we present estimates of the actual surges inaid flows that affected countries experienced following large natural disasters.
* Noy: School of Economics and Finance, Victoria University of Wellington, PO Box 600, Wellington, NewZealand. Tel: +64-4-4635737; E-mail: [email protected] (also affiliated to University of Hawaii atManoa). Becerra: University of British Columbia, Canada. Cavallo: Inter-American Development Bank,Washington DC, USA.
Review of Development Economics, 18(3), 445–460, 2014DOI:10.1111/rode.12095
© 2014 John Wiley & Sons Ltd
Our results suggest a mixed picture: while ODA typically increases significantlyrelative to pre-disaster flows (i.e. median aid flows increase by 18% after disasters),post-disaster aid surges are usually small compared with the size of the economies(i.e. the median increase is 0.14% of GDP), and to the actual direct damages causedby the events (i.e. the median aid surge covers less than 3% of total estimateddamages). From a normative standpoint, whether these amounts of aid are high orlow for development purposes is debatable because such an assessment would requirea study on aid effectiveness. Instead, the point that we make in this paper is that post-disaster aid surges are typically small in relation to the overall damages caused by thedisasters.
After calculating the magnitudes of post-disaster aid surges, we extend the eventstudy approach to examine the determinants of the size of these surges. Not surpris-ingly, we find that the severity of the event is a determinant of the post-disaster aidsurge. In addition, we find richer countries—conceivably with more resources avail-able to be re-directed toward reconstruction—receive less foreign aid in the aftermathof natural disasters. Similarly, countries with larger stocks of foreign exchangereserves—i.e. more resources available to use for importing capital goods to facilitatereconstruction—are also given less aid. We also find that media reporting of a disasteris positively related with larger aid inflows, although media attention is largely corre-lated to the severity of the event. In addition, we find that initial pre-disaster interna-tional humanitarian support reduces post-disaster aid inflow surges. Finally, we do notfind evidence that supports the commonly held views that political/cultural affinitybetween donors and affected countries and geopolitical interests drive donor behaviorfollowing catastrophic natural events.
Based on these findings, we conclude that while some countries could expect toreceive more aid than others, the evidence suggests that the expectation of largesurges in post-disaster aid flows is not warranted given the current configuration ofglobal foreign aid. Therefore, we conjecture that countries facing potentially biglosses from natural disasters should not expect foreign aid inflows to cover a largeproportion of the hefty toll that these events usually impose.3 This stresses the needfor vulnerable countries to develop complementary sources of financing for post-disaster relief in order to help to manage risks efficiently.
The structure of the paper is as follows. First, we review the related literature inorder to place our contribution in context. Next, we discuss the data and introducesome stylized facts on post-disaster aid flows based on an event study approach. Wethen explore the determinants of aid surges using a cross-section of events. Finally, weconclude with discussion and topics for further research.
2. The Literature on Emergency International Assistance
Few papers examine post-natural disasters aid flows. Yang (2008) uses hurricaneintensity data and concludes that official foreign aid increases significantly after disas-ters; for the developing countries in his sample, 73% of disaster damages are ulti-mately covered by aid inflows.4 David (2011) examines a similar question but with adifferent empirical approach. He finds that aid does not seem to increase after cli-matic disasters, and their increase following geological ones is delayed and very small.This divergence in results suggests the need to revisit the question using a largersample of countries and events and different methods.5
Strömberg (2007) is interested in answering two questions: whether the amount ofaid given after a disaster is influenced by news coverage of the disaster (the answer:
446 Oscar Becerra, Eduardo Cavallo, and Ilan Noy
© 2014 John Wiley & Sons Ltd
yes); and whether a potential donor country is more likely to give aid if it has awell-established connection with the affected country (the answer is again: yes).Our approach is different methodologically, and our answers are correspondinglydifferent.
Not surprisingly, the hypothesis that foreign aid is also affected by geo-strategicinterests has also been examined empirically. A large number of papers focus on thepolitics of aid given by the USA (without focusing on post-disaster aid), and mostemphasize that geo-strategic and political interests play a large role in determiningUS aid allocations across space and over time (recent examples are Drury et al.,2005 and Fleck and Kilby, 2010). However, others suggest a humanitarian motiva-tion is also evident (e.g. Demirel-Pegg and Moskowitz, 2009).6 While we do notfocus on the determinants of aid allocation across space and time, in this paper wefind no evidence that political factors are determinants of post-natural disasters aidsurges.
Beyond these supply factors guiding aid allocations, Olsen et al. (2003) note thatdemand factors (i.e. the receiving country’s characteristics), and in particular its readi-ness to absorb new flows through NGOs, are important in determining aid inflows. Incontrast, they find little evidence that policy effectiveness by the receiving govern-ment and the presence of efficient institutional capacity to implement aid matter forthe magnitude of aid donations (though this may vary by the nature of the donatingsource; see Easterly and Pfutze, 2008).
In work that is similar to ours in its approach even if the subject matter and specificempirical methodologies are different, Kang and Meernik (2004) examine theincrease in aid following armed conflict.7 They quantify the average post-conflictsurge in aid and attempt to explain the size of the surge by the nature of the conflictand the regime type that reigned at its end.
Agénor and Aizenman (2010) examine aid surges and argue, with the support of atheoretical model, that aid volatility potentially leads to poverty traps. In spite of thisadverse risk imposed by aid volatility, they find that under certain conditions self-insurance (i.e. a contingency fund) that would ameliorate this volatility is sub-optimalsince its existence distorts donors’ motivations. Some supporting evidence regardingthis “moral hazard” problem is provided by our findings on the availability of domes-tic resources (in particular foreign reserves) as an important determinant of post-disaster aid allocations.8
These papers suggest different hypotheses that are worthwhile examining withinthe context of post-disaster aid allocations. Our contribution is to emphasize a differ-ent (and we think more accurate) measure of post-disaster aid that we calculate basedon the baseline aid flows that precede the disaster. Using this novel measure of post-disaster aid-surges, we are able to shed light both on the determinants of these aidflow surges and examine several hypotheses concerning these determinants.
3. Data
Disaster and Aid Data
Almost all the empirical work on natural disasters relies on the publicly availableEmergency Events Database (EM-DAT) maintained by the Center for Research onthe Epidemiology of Disasters (CRED) at the Catholic University of Louvain,Belgium (http://www.emdat.be/). EM-DAT defines a disaster as a natural situation orevent which overwhelms local capacity and/or necessitates a request for external
AID AFTER DISASTERS 447
© 2014 John Wiley & Sons Ltd
assistance. For a disaster to be entered into the EM-DAT database, at least one of thefollowing criteria must be met: (i) 10 or more people are reported killed; (ii) 100people are reported affected; (iii) a state of emergency is declared; or (iv) a call forinternational assistance is issued. Disasters can be hydro-meteorological, includingfloods, wave surges, storms, droughts, landslides and avalanches; geophysical, includ-ing earthquakes, tsunamis and volcanic eruptions; and biological, covering epidemicsand insect infestations (the latter are less frequent).
The disaster impact data reported in the EM-DAT database consists of directdamages (e.g. value of damage to infrastructure, crops, and housing in currentdollars), the number of people killed and the number of people affected.9 As Cavalloand Noy (2011) observe, many of the events reported in this database are quite smalland are unlikely to have any significant impact on aid disbursements and on themacro-economy more generally. We therefore limit our investigation to disasters inwhich the number of people killed is above the mean for the entire dataset (more onthis below).10
Detailed data on aid flows are available from the OECD’s Development AssistanceCommittee (OECD-DAC) and from the United Nations’ Financial Tracking Service(UN-FTS). The OECD-DAC data on official development assistance cover annualbilateral aid extended from 44 donor countries (32 OECD and 12 non-OECD plusseveral multilateral agencies) to a large number of recipient countries. The UN-FTSdatabase does not aggregate aid flows annually but rather presents information foreach international humanitarian aid appeal issued by the UN. Many of these appealsinvolve natural disasters.
The UN-FTS data have two advantages: First, they provide data for each appealseparately, hence allowing direct one-to-one correspondence between aid flows andindividual disasters. Second, while the OECD-DAC focuses only on OECD donorgovernments and multilateral organizations, the UN-FTS also tracks aid flows ofsome large private/NGO donors. However, UN-FTS data are based on donors’ vol-untary reporting and may significantly mis-estimate the volume of actual new aidgiven.
We choose to use the OECD-DAC data because of its more comprehensive natureand because it is based on actual disbursements rather than pledges or commitments.Thus, we can directly estimate by how much foreign official aid increases in the after-math of disasters instead of focusing on undisbursed pledges or on re-labeled flows.Moreover, while the OECD-DAC data do not separately measure post-disaster aid,the event study methodology we apply seeks to overcome this problem. By comparingaid flows before and after a natural disaster, we are able to calculate the actual aidsurge observed from aid data; we assume this aid surge is related only to the disasteritself.11
For further disaster data for the period 1970–2008 see Table S1 in the SupportingInformation (for access details see the end of the paper).
Descriptive Statistics on Aid and Disasters
There are a total of 6,530 events recorded in the EM-DAT database between January1970 and June 2008, of which 3,097 (47.4%) are floods, 2,617 (40.1%) are storms and816 (12.5%) are earthquakes. Oftentimes there are multiple events recorded in agiven country–year. In those cases, we add up the corresponding disaster magnitudesand define a “combined” disaster for that country–year observation.12
448 Oscar Becerra, Eduardo Cavallo, and Ilan Noy
© 2014 John Wiley & Sons Ltd
Disasters are fairly common. Out of a total of 7,644 year–country observations (196countries × 39 years), 1,658 (22%) meet the requirements to be designated as anatural disaster. However, as already noted, large events are less common. When werestrict the sample only to large events and where “large” is defined to be larger thanthe world mean of 31 people killed per million inhabitants, only 137 year–countryobservations remain. We further exclude 17 additional observations either becausethey coincided with another major event in the country that also could have affectedforeign aid (e.g. Afghanistan in 2002) or we found some anomalies in the aid data.13
Out of the remaining subset of events, 98 have the full set of information required todo the event study we pursue here (particularly aid data in the OECD-DAC dataset).This is the sample of events that we study.
In other words, an “event” in our sample is a country–year observation for which:(i) there is record in the EM-DAT database of one or several natural disasters that hitthe country in that year that caused at least as many fatalities as the world mean forthe entire time period; (ii) the disaster itself was not too small in absolute terms; (iii)aid data are available to perform the event study analysis; and (iv) the observation isnot an obvious outlier, nor does it or coincide with another major event that couldhave triggered an aid surge.14
In order to evaluate the robustness of the results to small variations in the sampleof events, we disaggregate events into three sub-samples. Sample 1 includes all of thedisasters described above. Sample 2 excludes the events that overlapped with othernatural disasters in the same country within a two-year window. Sample 3 includesoverlapping events but excludes observations in which there were multiple disastersin a given year and for which intensity data (i.e. number of killed people or economicdamages data) were not available for at least one of these events. Sample 1, the mostcomprehensive, includes 98 events, while the most restrictive sample, Sample 2,includes only 68 disasters.
Table 1 presents summary statistics and the first set of results for the event study.An “aid surge” is computed as the difference between the average aid flows up to twoyears after the disasters and the average aid flows in the two years preceding disas-ters.15 We also calculate the medians of the severity of the disasters (in terms ofnumber of people killed and direct economic damages).16
In the case of sample 1, the median mortality per disaster was 474 people, or 80people killed per million inhabitants. The median economic damage was 5.7% ofGDP. In terms of the “aid surge” post disaster, we find that median post-disaster aidincreased by approximately 18% compared with the pre-disaster average flows. Thisis equivalent to 0.25% of recipient countries’ GDP. The numbers for the othersamples are very similar, suggesting that the results are not driven by a particularsubset of events.
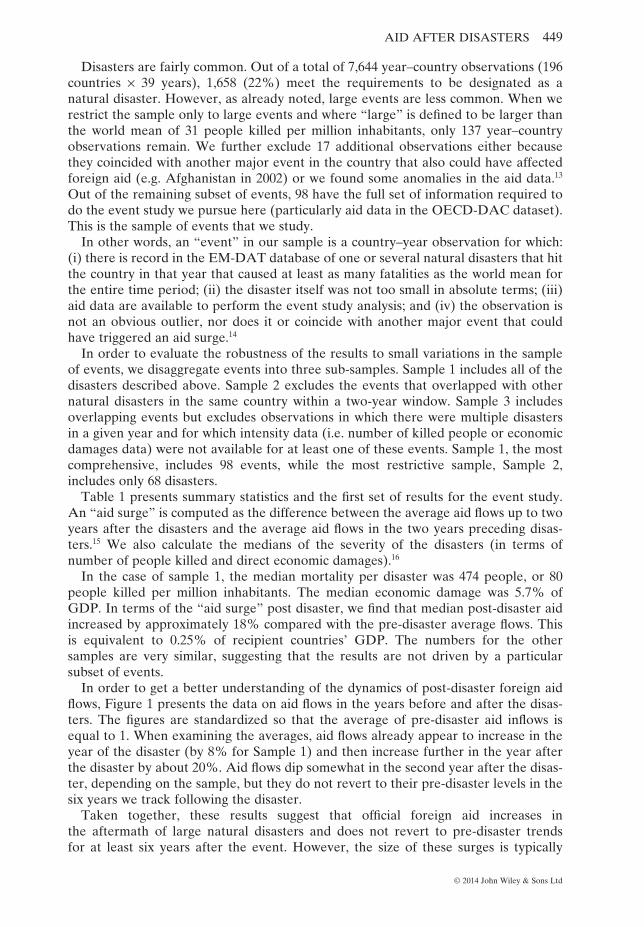
In order to get a better understanding of the dynamics of post-disaster foreign aidflows, Figure 1 presents the data on aid flows in the years before and after the disas-ters. The figures are standardized so that the average of pre-disaster aid inflows isequal to 1. When examining the averages, aid flows already appear to increase in theyear of the disaster (by 8% for Sample 1) and then increase further in the year afterthe disaster by about 20%. Aid flows dip somewhat in the second year after the disas-ter, depending on the sample, but they do not revert to their pre-disaster levels in thesix years we track following the disaster.
Taken together, these results suggest that official foreign aid increases inthe aftermath of large natural disasters and does not revert to pre-disaster trendsfor at least six years after the event. However, the size of these surges is typically
AID AFTER DISASTERS 449
© 2014 John Wiley & Sons Ltd

Tab
le1.
Des
crip
tive
Stat
istic
sfo
rP
ost-
disa
ster
Surg
es
Sam
ple
Obs
erva
tions
Num
ber
ofpe
ople
kille
d
Kill
edpe
rm
illio
nof
inha
bita
nts
Eco
nom
icda
mag
es(2
000
US$
mill
ions
)
Eco
nom
icda
mag
es(%
ofG
DP
)
Aid
surg
e(2
000
US$
mill
ions
)A
idsu
rge
(%of
GD
P)
Cov
erag
era
tio(%
ofda
mag
es)
Aid
surg
e(%
)
Sam
ple
198
474
80.1
350.
15.
711
.50.
251
2.9
17.8
Sam
ple
268
486
74.1
417.
54.
214
.20.
222
3.2
18.7
Sam
ple
392
443
81.0
350.
15.
712
.20.
292
3.4
18.1
Not
e:E
vent
win
dow
:2ye
ars.
Sour
ce:
Aut
hors
’cal
cula
tion
sba
sed
onE
M-D
AT
and
WD
Ida
tase
ts.
450 Oscar Becerra, Eduardo Cavallo, and Ilan Noy
© 2014 John Wiley & Sons Ltd
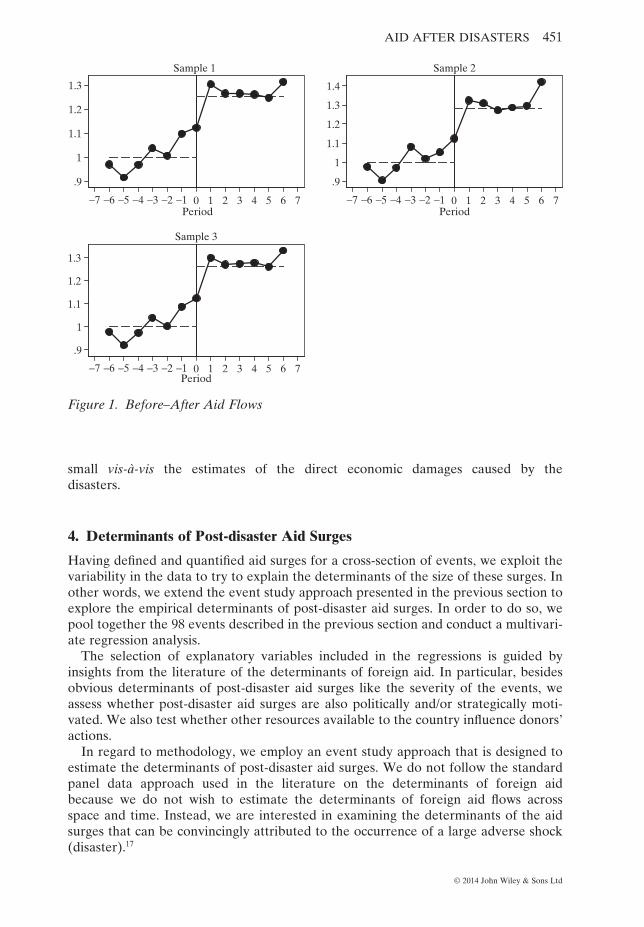
small vis-à-vis the estimates of the direct economic damages caused by thedisasters.
4. Determinants of Post-disaster Aid Surges
Having defined and quantified aid surges for a cross-section of events, we exploit thevariability in the data to try to explain the determinants of the size of these surges. Inother words, we extend the event study approach presented in the previous section toexplore the empirical determinants of post-disaster aid surges. In order to do so, wepool together the 98 events described in the previous section and conduct a multivari-ate regression analysis.
The selection of explanatory variables included in the regressions is guided byinsights from the literature of the determinants of foreign aid. In particular, besidesobvious determinants of post-disaster aid surges like the severity of the events, weassess whether post-disaster aid surges are also politically and/or strategically moti-vated. We also test whether other resources available to the country influence donors’actions.
In regard to methodology, we employ an event study approach that is designed toestimate the determinants of post-disaster aid surges. We do not follow the standardpanel data approach used in the literature on the determinants of foreign aidbecause we do not wish to estimate the determinants of foreign aid flows acrossspace and time. Instead, we are interested in examining the determinants of the aidsurges that can be convincingly attributed to the occurrence of a large adverse shock(disaster).17
.9
1
1.1
1.2
1.3
−7 −6 −5 −4 −3 −2 −1 0 1 2 3 4 5 6 7Period
Sample 1
.9
1
1.1
1.2
1.3
1.4
−7 −6 −5 −4 −3 −2 −1 0 1 2 3 4 5 6 7Period
Sample 2
.9
1
1.1
1.2
1.3
−7 −6 −5 −4 −3 −2 −1 0 1 2 3 4 5 6 7Period
Sample 3
Figure 1. Before–After Aid Flows
AID AFTER DISASTERS 451
© 2014 John Wiley & Sons Ltd

Model Specification
We estimate regressions of the following type:
Δ ln ln ln ln, , ,Aid Aid Intensity Media Covei t i t i t= + + + +−β β β β0 1 1 2 3 1 rrageGDP Pop GDPReserves GDP
i t
i t i t
( )+ ( ) ++ (
− −
,
, ,ln lnln
β ββ
4 1 5 1
6 )) + +− −i t i t i tAffinity u, , ,1 7 1β
The dependent variable is the same as in the previous section. It is computed as thelog difference between average post-disaster aid flows (up to two years after the disas-ter, including the disaster year itself) and average aid flows in the two years precedingthe disaster. The subscript i denotes the event location, and the subscript t denotes theyear of the event. As a result, every pair i, t denotes one of the 98 events in Sample 1described in the previous section.
When deciding on control variables, we rely on benchmark specifications on thedeterminants of aid, as used most recently in Werker et al. (2009) and Fink andRedaelli (2009). Details on the variables and their sources are shown in Table 2.
Our list of control variables includes the following:
• ln Aidi,t−1: The natural logarithm of the initial pre-disaster aid level (average aidflows of two years preceding the event). We include this variable to assess theimpact of pre-disaster aid relationships on post-disaster aid allocation.
• ln Intensityi,t: Either the natural logarithm of the reported amount of economicdamages caused by the disaster(s), or the number of people killed in the immediateaftermath of the event(s). This is included to assess how the catastrophic nature ofthe events shapes the post-disaster aid response.
• ln(1+Media Coverage)i,t: The natural logarithm of 1 plus media coverage of the dis-aster measured by the number of stories about it published in the Associated Presswithin a six-month period following the event. Media attention helps to raiseawareness about the destructive nature of the events and, as a result, it may influ-ence the post-disaster aid response.
• ln(GDP/Pop)i,t−1: The natural logarithm of the country’s pre-disaster GDP percapita. The inclusion of this variable allows us to assess whether the level of eco-nomic development is a determinant of post-disaster aid allocation.
• ln GDPi,t−1: The natural logarithm of pre-disaster real GDP (US$ 2000). We use itas a proxy for country size. The aid literature has long observed that small countriestend to receive a larger per capita share of aid.
• ln(Reserves/GDP)i,t−1: The natural logarithm of pre-disaster foreign exchangereserves (as a percentage of GDP). We include this variable to take into accountthat the availability of alternative funding may influence the size of the post-disaster aid surge.
• Affinityi,t−1: Political affinity index (based on the UN voting patterns). We includethis variable to test if post-disaster aid allocation is influenced by political consid-erations like the political affinity between recipient and donor countries. Geopoliti-cal considerations are frequently mentioned in the literature on donor motivationsin providing aid.
Regression Results
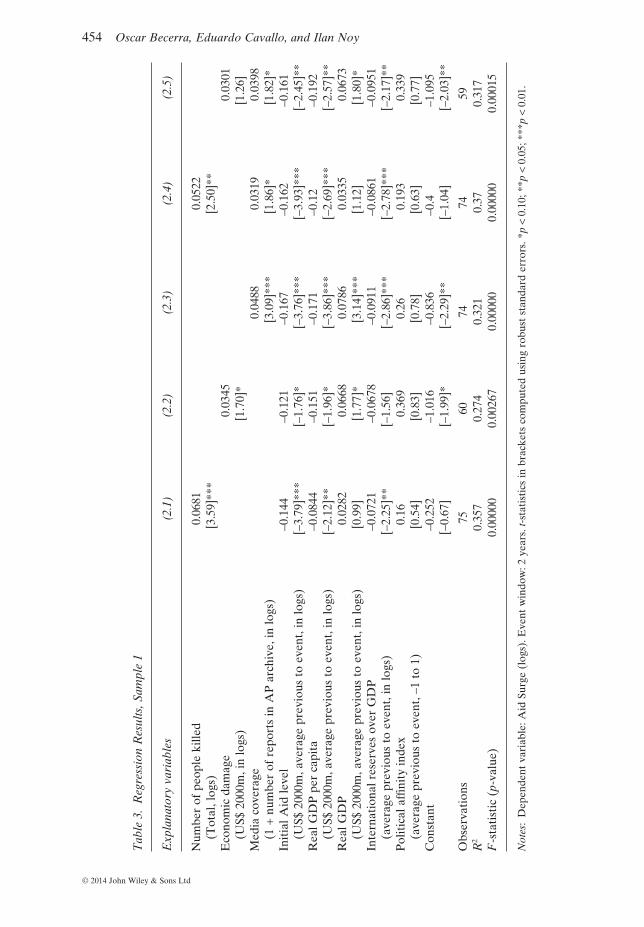
The estimation results for the determinants of aid surges are presented in Table 3.Each column represents a different regression specification. The effective sample sizein each case is determined by data availability for the control variables.18
452 Oscar Becerra, Eduardo Cavallo, and Ilan Noy
© 2014 John Wiley & Sons Ltd

Table 2. Data Sources
Variable Source Notes
ODA total net disbursements OECD DAC Database. Available athttp://stats.oecd.org/
US$ 2000m
Economic damage EM-DAT Database. Available athttp://www.emdat.be/database
US$ 2000m
Number of people killed EM-DAT Database. Available athttp://www.emdat.be/database
Total
Media coverage Associated Press Archive. Availableat http://www.aparchive.com/
Number of reports
Real GDP World Development IndicatorsDatabase. Available at http://data.worldbank.org/data-catalog/world-development-indicators
US$ 2000 dollars
Population World Development IndicatorsDatabase. Available at http://data.worldbank.org/data-catalog/world-development-indicators
Total
International reserves overGDP
World Development IndicatorsDatabase. Available at http://data.worldbank.org/data-catalog/world-development-indicators
Ratio
Political affinity index The Affinity Of Nations Index database(Version 4.0). Available at http://dss.ucsd.edu/~egartzke/htmlpages/data.html
Average with DACcountries, –1 (lowaffinity) to 1 (highaffinity)
Land area World Development IndicatorsDatabase. Available at http://data.worldbank.org/data-catalog/world-development-indicators
Squared kilometers
Openness to internationaltrade
World Development IndicatorsDatabase. Available athttp://data.worldbank.org/data-catalog/world-development-indicators
%. Author’s calculations.
Armed conflict dummy UCDP PRIO Armed Conflict Dataset.Available at http://www.prio.no/CSCW/Datasets/
Author’s calculations
Small island state dummy United Nations. Available at http://www.un.org/special-rep/ohrlls/sid/list.htm
Former colony dummy Correlates of War. Available athttp://www.correlatesofwar.org/
Author’s calculations
Type of disaster dummy EM-DAT Database. Available athttp://www.emdat.be/database
Author’s calculations
Sovereign debt as percentageof GDP
Ugo Panizza debt dataset. Avaiable athttp://sites.google.com/site/md4stata/linked/public-debt
Author’s calculations
Polity IV’s revised combinedpolity score
Polity IV project. Available at http://www.systemicpeace.org/inscr/inscr.htm
–10 (autocracy) to 10(democracy)
ICRG corruption index International Country Risk Guidedataset. Available at http://www.prsgroup.com/ICRG.aspx
0 (high corruption) to 6(low corruption)
ICRG law and order index International Country Risk Guidedataset. Available at http://www.prsgroup.com/ICRG.aspx
0 (low law and order) to6 (high law and order)
Central government balanceas percentage of GDP
World Economic Outlook dataset. %
AID AFTER DISASTERS 453
© 2014 John Wiley & Sons Ltd
Tab
le3.
Reg
ress
ion
Res
ults
,Sam
ple
1
Exp
lana
tory
vari
able
s(2
.1)
(2.2
)(2
.3)
(2.4
)(2
.5)
Num
ber
ofpe
ople
kille
d0.
0681
0.05
22(T
otal
,log
s)[3
.59]
***
[2.5
0]**
Eco
nom
icda
mag
e0.
0345
0.03
01(U
S$20
00m
,in
logs
)[1
.70]
*[1
.26]
Med
iaco
vera
ge0.
0488
0.03
190.
0398
(1+
num
ber
ofre
port
sin
AP
arch
ive,
inlo
gs)
[3.0
9]**
*[1
.86]
*[1
.82]
*In
itia
lAid
leve
l–0
.144
–0.1
21–0
.167
–0.1
62–0
.161
(US$
2000
m,a
vera
gepr
evio
usto
even
t,in
logs
)[–
3.79
]***
[–1.
76]*
[–3.
76]*
**[–
3.93
]***
[–2.
45]*
*R
ealG
DP
per
capi
ta–0
.084
4–0
.151
–0.1
71–0
.12
–0.1
92(U
S$20
00m
,ave
rage
prev
ious
toev
ent,
inlo
gs)
[–2.
12]*
*[–
1.96
]*[–
3.86
]***
[–2.
69]*
**[–
2.57
]**
Rea
lGD
P0.
0282
0.06
680.
0786
0.03
350.
0673
(US$
2000
m,a
vera
gepr
evio
usto
even
t,in
logs
)[0
.99]
[1.7
7]*
[3.1
4]**
*[1
.12]
[1.8
0]*
Inte
rnat
iona
lres
erve
sov
erG
DP
–0.0
721
–0.0
678
–0.0
911
–0.0
861
–0.0
951
(ave
rage
prev
ious
toev
ent,
inlo
gs)
[–2.
25]*
*[–
1.56
][–
2.86
]***
[–2.
78]*
**[–
2.17
]**
Pol
itic
alaf
finit
yin
dex
0.16
0.36
90.
260.
193
0.33
9(a
vera
gepr
evio
usto
even
t,–1
to1)
[0.5
4][0
.83]
[0.7
8][0
.63]
[0.7
7]C
onst
ant
–0.2
52–1
.016
–0.8
36–0
.4–1
.095
[–0.
67]
[–1.
99]*
[–2.
29]*
*[–
1.04
][–
2.03
]**
Obs
erva
tion
s75
6074
7459
R2
0.35
70.
274
0.32
10.
370.
317
F-s
tati
stic
(p-v
alue
)0.
0000
00.
0026
70.
0000
00.
0000
00.
0001
5
Not
es:
Dep
ende
ntva
riab
le:A
idSu
rge
(log
s).E
vent
win
dow
:2ye
ars.
t-st
atis
tics
inbr
acke
tsco
mpu
ted
usin
gro
bust
stan
dard
erro
rs.*
p<
0.10
;**p
<0.
05;*
**p
<0.
01.
454 Oscar Becerra, Eduardo Cavallo, and Ilan Noy
© 2014 John Wiley & Sons Ltd
The R2 for the different specifications vary between 0.27 and 0.37. While theexplanatory power of our model is modest, this is in line with previous attempts toestimate the determinants of aid flows (e.g. Strömberg, 2007). However, reassuringly,the F -statistic for the joint significance of the explanatory variables is consistently sta-tistically significant across the different specifications.
In column 1, we report the results of the benchmark specification. The resultssuggest that the severity of the event matters for post-disaster aid allocation. In par-ticular, we find that a 10% increase in the severity of the disaster (measured in termsof the number of people killed) implies a 0.7% average increase in aid, conditional onthe other control variables. The same qualitative result holds when the magnitude ofthe disaster is measured in terms of the size of economic damages (i.e. destroyedinfrastructure and other direct costs, see column 2). In column 3 we examine whethermedia exposure is also a determinant of the supply of aid. While media coverage doesindeed seem to increase the amount of post-disaster aid, a close examination (seecolumns 4 and 5) reveals that this effect is largely due to the correlation between theseverity of the disasters (measured by either economic damages or fatalities) andmedia exposure. Over the entire sample, the correlation between number of peoplekilled in the events and media coverage (in logs) is 0.61, whereas the same figure formedia coverage and economic damages is 0.56. The result is intuitive: the most severeevents capture more media attention. This in turn raises public awareness about thedisaster and results in more post-disaster foreign aid.
One of the most robust results in the regressions is that a higher initial (pre-disaster) aid level is associated to lower aid surges. This result is consistent with theview that aid flows follow a persistent process, provided that aid is committed to proj-ects with a long-run horizon.19 An alternative non-competing interpretation for thenegative estimated coefficient on initial aid is that there could be aid reallocation inthe aftermath of natural disasters. This interpretation would be consistent with evi-dence presented by Benson and Clay (2004) who, using case studies, find that theaggregate post-disaster aid flows do not increase considerably because of re-allocationof pre-disaster aid flows.
In terms of the other control variables we find that, on average, countries witha higher real GDP per capita receive less post-disaster aid, controlling for themagnitude of the disaster. The same, however, is not true for the size in theeconomy: the larger the size of the economy, the bigger the aid surge a country willreceive.
The amount of foreign exchange reserves that a country possesses also seem tomatter for the size of the post-disaster aid flow. In particular, countries with morereserves receive less in international assistance. Therefore, this is evidence consistentwith the view that donors’ behavior may be influenced by their perception of therecipients’ economic needs. This notwithstanding, given that the size of aid surges aresmall in relation to the damages caused by disasters, and given that the estimatedcrowding out is less than 1-to-1, then reserves accumulation and foreign aid should beviewed as complementary. In other words, foreign aid does not appear to be a substi-tute for other forms of country insurance against the consequences of natural disas-ters such as reserves accumulation.
Finally, the measure of political affinity is never significant in the estimations.While it is possible that this reflects a difficulty in measuring political interest whenaggregating over several donor groups, the bottom line is that we do not find evi-dence supporting the hypothesis that post-disaster aid surges are driven by politicalmotivations.
AID AFTER DISASTERS 455
© 2014 John Wiley & Sons Ltd

Robustness
The literature has suggested several other possible determinants of foreign aid. Inunreported specifications we included the following additional control variables: (i)land area (square kilometers, in logs) as another proxy for country size; (ii) opennessto international trade (total imports as percent of world total exports, in logs) sincedonor countries may possibly be more likely to assist trading partners in times ofneed; (iii) a dummy variable indicating whether or not there is an armed conflict inthe country inhibiting aid flows following the time of the disaster; (iv) a dummy vari-able for small island states since these generally receive proportionally more aid; (v)a dummy variable for former colony status, as the former colonial master may bemore likely to assist; and (vi) dummy variables for the type of disaster. In all cases,these coefficients were not significantly different from zero, suggesting eithermismeasurement/misspecification or a lack of real correlation/causality. Importantly,however, the inclusion of these additional control variables did not change the resultsreported in the previous section.20
Finally, we also run panel regressions akin to those in the literature on the determi-nants of foreign aid. In order to do so, instead of pooling by events, we keep thecountry/year format of the original dataset, and we change the dependent variable tothe actual aid flows by recipient country in every year (i.e. Aidi,t). In terms of theexplanatory variables, the main change is that the disaster intensity variables (i.e. eco-nomic damages or fatalities) and the proxy for media coverage were set to zero forthose country/year observations in which there were no events. In other words, themodel that we run is the following:
ln ln, , , ,Aid Aid X ui t i t i t i t= + + +− −β β θ0 1 1 1
where θ and Xi,t–1 are a parameter vector and a vector including the remainingexplanatory variables, respectively.
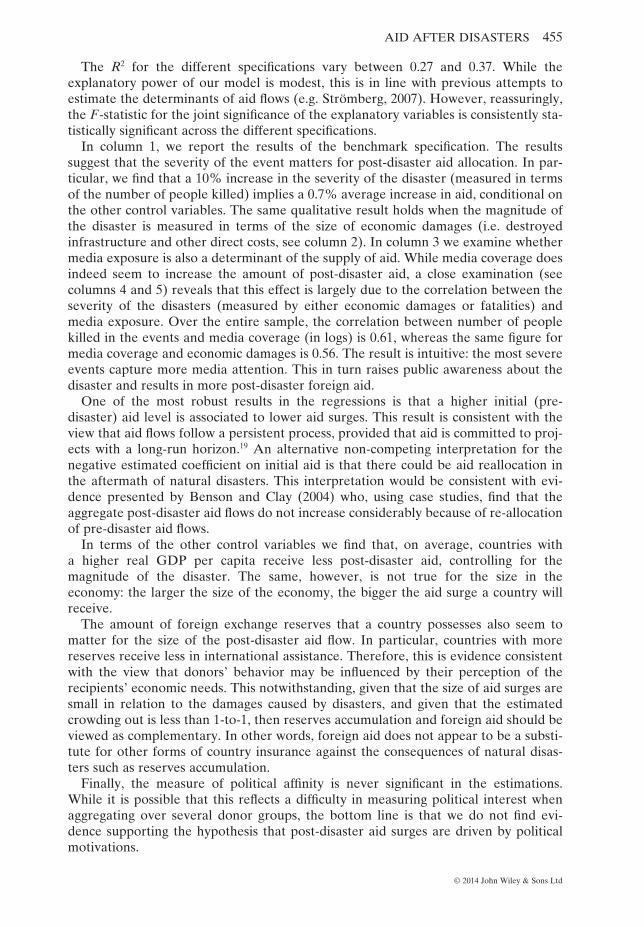
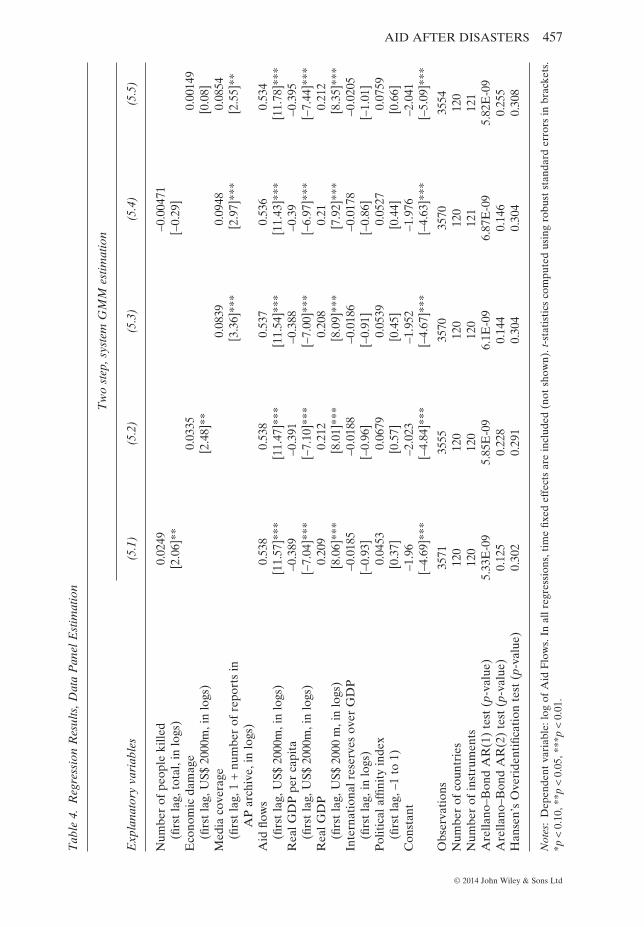
Given the characteristics of the panel and the fact that we included the laggeddependent variable in the regressions, we estimated the model by dynamic panelmethods. The regression results, reported in Table 4, confirm the findings of the eventstudy approach. In particular, based on the set of control variables included in theregressions, we find that the disaster intensity variables and the lagged dependentvariable, are the main determinants of aid allocation.21
Notwithstanding the consistency of the results with our baseline estimation, we donot emphasize them because we think that the event study approach is better suitedto address the question of the paper. In other words, a full assessment of the determi-nants of aid flows across space and time (which is essentially what the panel dataapproach does) is outside the scope of this paper.
In summary, the results of a battery of sensitivity tests confirm that the main deter-minants of foreign aid in the aftermath of natural disasters are: the intensity of theevent itself, the pre-disaster level of aid, and the recipient country’s characteristicssuch as the level of development, country size and the stock of foreign reserves avail-able. Moreover, we do not find evidence that political considerations or strategicbehavior on the part of donors determine the size of post-disaster aid surges.
5. Conclusion and Future Research
We estimated the size of post-disaster aid surges. Our results indicate that themedian increase in realized post-disaster aid is approximately 18% compared with
456 Oscar Becerra, Eduardo Cavallo, and Ilan Noy
© 2014 John Wiley & Sons Ltd
Tab
le4.
Reg
ress
ion
Res
ults
,Dat
aP
anel
Est
imat
ion
Exp
lana
tory
vari
able
s
Tw
ost
ep,s
yste
mG
MM
estim
atio
n
(5.1
)(5
.2)
(5.3
)(5
.4)
(5.5
)
Num
ber
ofpe
ople
kille
d0.
0249
–0.0
0471
(firs
tla
g,to
tal,
inlo
gs)
[2.0
6]**
[–0.
29]
Eco
nom
icda
mag
e0.
0335
0.00
149
(firs
tla
g,U
S$20
00m
,in
logs
)[2
.48]
**[0
.08]
Med
iaco
vera
ge0.
0839
0.09
480.
0854
(firs
tla
g,1
+nu
mbe
rof
repo
rts
inA
Par
chiv
e,in
logs
)[3
.36]
***
[2.9
7]**
*[2
.55]
**
Aid
flow
s0.
538
0.53
80.
537
0.53
60.
534
(firs
tla
g,U
S$20
00m
,in
logs
)[1
1.57
]***
[11.
47]*
**[1
1.54
]***
[11.
43]*
**[1
1.78
]***
Rea
lGD
Ppe
rca
pita
–0.3
89–0
.391
–0.3
88–0
.39
–0.3
95(fi
rst
lag,
US$
2000
m,i
nlo
gs)
[–7.
04]*
**[–
7.10
]***
[–7.
00]*
**[–
6.97
]***
[–7.
44]*
**R
ealG
DP
0.20
90.
212
0.20
80.
210.
212
(firs
tla
g,U
S$20
00m
,in
logs
)[8
.06]
***
[8.0
1]**
*[8
.09]
***
[7.9
2]**
*[8
.35]
***
Inte
rnat
iona
lres
erve
sov
erG
DP
–0.0
185
–0.0
188
–0.0
186
–0.0
178
–0.0
205
(firs
tla
g,in
logs
)[–
0.93
][–
0.96
][–
0.91
][–
0.86
][–
1.01
]P
olit
ical
affin
ity
inde
x0.
0453
0.06
790.
0539
0.05
270.
0759
(firs
tla
g,–1
to1)
[0.3
7][0
.57]
[0.4
5][0
.44]
[0.6
6]C
onst
ant
–1.9
6–2
.023
–1.9
52–1
.976
–2.0
41[–
4.69
]***
[–4.
84]*
**[–
4.67
]***
[–4.
63]*
**[–
5.09
]***
Obs
erva
tion
s35
7135
5535
7035
7035
54N
umbe
rof
coun
trie
s12
012
012
012
012
0N
umbe
rof
inst
rum
ents
120
120
120
121
121
Are
llano
–Bon
dA
R(1
)te
st(p
-val
ue)
5.33
E-0
95.
85E
-09
6.1E
-09
6.87
E-0
95.
82E
-09
Are
llano
–Bon
dA
R(2
)te
st(p
-val
ue)
0.12
50.
228
0.14
40.
146
0.25
5H
anse
n’s
Ove
ride
ntifi
cati
onte
st(p
-val
ue)
0.30
20.
291
0.30
40.
304
0.30
8
Not
es:
Dep
ende
ntva
riab
le:l
ogof
Aid
Flo
ws.
Inal
lreg
ress
ions
,tim
efix
edef
fect
sar
ein
clud
ed(n
otsh
own)
.t-s
tati
stic
sco
mpu
ted
usin
gro
bust
stan
dard
erro
rsin
brac
kets
.*p
<0.
10,*
*p<
0.05
,***
p<
0.01
.
AID AFTER DISASTERS 457
© 2014 John Wiley & Sons Ltd

pre-disaster flows. While this is potentially a significant amount, the median aid surgecovers only a small fraction of estimated direct damages caused by the disasters. Thissuggests that vulnerable countries need to plan for complementary sources of financ-ing during the recovery phase.
In terms of the determinants of the size of post-disaster aid surges, we find thatdamages caused by the disaster are positively related to subsequent aid inflows, butthat higher incomes and higher incomes per capita, ceteris paribus, are associated withlower post-disaster aid flows. More foreign exchange reserves are also associated withless post-disaster aid being provided. We do not, however, find evidence that post-disaster aid inflows are positively associated with measures of political affinity andgeo-strategic interests of donor countries.
We view this paper as the “opening shot” in a larger research effort to understandpost-disaster reconstruction. In this paper we have not addressed important issueslike, for example, the effectiveness of post-disaster aid allocation in mitigating theconsequences of disasters, or the optimal composition of foreign aid for developmentpurposes.
A different set of questions, and one that has not really been tackled in any com-parative way, focuses on identifying the most productive ways in which post-disasteraid should be disbursed (quickly as a lump-sum or sequenced over time?, in-kind orin-cash?). Observers have pointed out that large aid surges lead to higher prices andmay therefore be less effective. Is this indeed the case? Should aid nevertheless con-centrate on reconstructing as quickly as possible, in spite of the higher costs? Whatabout the trade-off between quickly rebuilding what was there before and a slowerrebuilding process that also accounts for newly exposed hazards and vulnerabilitiesand attempts to develop more resilient communities? We expect to see more researchalong these themes in the near future.
References
Agénor, Pierre-Richard and Joshua Aizenman, “Aid Volatility and Poverty Traps,” Journal ofDevelopment Economics 91 (2010):1–7.
Benson, Charloote and Edward Clay, “Understanding the Economic and Financial Impacts ofNatural Disasters,” Disaster Risk Management Series 4, World Bank, Washington DC(2004).
Cavallo, Eduardo and Ilan Noy, “Natural Disasters and the Economy: A Survey,” InternationalReview of Environmental and Resource Economics 5 (2011):63–102.
Cavallo, Eduardo, Andrew Powell, and Oscar Becerra, “Estimating the Direct EconomicDamages of the Earthquake in Haiti,” Economic Journal 120 (2010):F298–F312.
David, Antonio, “How do International Financial Flows to Developing Countries Respond toNatural Disasters?” Global Economy Journal 11 (2011):1–36.
Demirel-Pegg, Tijen and James Moskowitz, “US Aid Allocation: The Nexus of Human Rights,Democracy, and Development,” Journal of Peace Research 46 (2009):181–98.
Drury, Cooper, Richard Olson, and Douglas Van Belle, “The Politics of Humanitarian Aid:U.S. Foreign Disaster Assistance, 1964–1995,” Journal of Politics 67 (2005):454–73.
Easterly, William and Tobias Pfutze, “Best Practice for Foreign Aid: Who Knows Where theMoney Goes?” Journal of Economic Perspectives 22 (2008):29–52.
Fink, Guenther and Silvia Redaelli, “Determinants of International Emergency Aid: Humani-tarian Need Only?” Policy Research working paper 4839, World Bank, Washington DC(2009).
Fleck, Robert and Christopher Kilby, “Changing Aid Regimes? U.S. Foreign Aid from theCold War to the War on Terror,” Journal of Development Economics 91 (2010):185–97.
458 Oscar Becerra, Eduardo Cavallo, and Ilan Noy
© 2014 John Wiley & Sons Ltd

Kang, Seonjou and James Meernik, “Determinants of Post-conflict Economic Assistance,”Journal of Peace Research 41 (2004):149–66.
Noy, Ilan, “Investing in Disaster Risk Reduction: A Global Fund,” in B. Lomborg (ed.), GlobalProblems, Smart Solutions: Cost and Benefits. Cambridge: Cambridge University Press(2013).
Olsen, Gorm Rye, Nils Carstensen, and Kristian Høyen, “Humanitarian Crises: What Deter-mines the Level of Emergency Assistance? Media Coverage, Donor Interests and the AidBusiness,” Disasters 27 (2003):109–26.
Raschky, Paul and Manijeh Schwindt, “Aid, Catastrophes and the Samaritan’s Dilemma,”Monash University working paper, Caufield, Australia (2011).
———, “On the Channel and Type of International Disaster Aid,” European Journal of Politi-cal Economy 28 (2012):119–31.
Strömberg, David, “Natural Disasters, Economic Development, and Humanitarian Aid,”Journal of Economic Perspectives 21 (2007):199–222.
Werker, Eric, Faisal Z. Ahmed, and Charles Cohen, “How Is Foreign Aid Spent? Evidencefrom a Natural Experiment,” American Economic Journal: Macroeconomics 1 (2009):225–44.
Yang, Dean, “Coping with Disaster: The Impact of Hurricanes on International FinancialFlows,” B.E. Journal of Economic Analysis and Policy 8, no. 1 (2008): article 13,DOI:10.2202/1935-1682.1903.
Notes
1. For example, according to the UN, total disbursements for relief in the countries affectedby the Indian Ocean tsunami reached US$1.25bn and US$3.59bn was disbursed for reliefin Haiti through official channels or large donors (http://fts.unocha.org/, accessed 25 May2012).2. Poor countries, the usual recipients of foreign aid, are disproportionally affected by naturaldisasters (see Cavallo and Noy, 2011).3. This would be especially true for catastrophic disasters (i.e. those that fall significantlyoutside the normal distribution of disaster damages). See the general discussion in Noy (2013)and the estimates for the Haiti 2010 earthquake damages vs its aid inflows (Cavallo et al., 2010).4. Yang’s sample is concentrated in a few island nations, the countries of Central America andtwo big countries that frequently experience storm damage, Bangladesh and the Philippines.5. Both papers attempt to estimate the impact of disasters on financial flows more generally.6. Raschky and Schwindt (2012), using data on specific post-disaster bilateral donations,analyze a different political-economy aspect. They focus on the reasons for donors’ choiceswhether to channel the aid through a multilateral and whether to provide aid as cash or in-kind.7. They examine the determinants of these aid surges using an 11-year cross-country panel witha conflict binary variable.8. Raschky and Schwindt (2011) focus on a different aspect of this “moral hazard” which theyterm the “Samaritan’s Dilemma”.9. The measure for direct damages does not include indirect impacts caused by the damage tophysical infrastructure and productive capacity. Indirect damages can also be a consequence ofthe fact that reconstruction pulls resources away from normal production.10. The two other papers that are closest to ours in their interest use more lenient criteria forinclusion. Fink and Redaelli (2009) use a sample of 400 disasters in the last 15 years, whileRaschky and Schwindt (2012) use 228 disasters from 2000 to 2007.11. It is possible that another event that had an impact on aid flows happened concurrently.However, since the specific timing of large natural disasters is largely unpredictable it seemsreasonable to assume that our event study approach overcomes this problem in a large enoughsample.12. To avoid over-representation of small countries, before the country-year aggregation weexclude 1,436 very small events, defined as those with fewer than 10 people reported dead ormissing and for which reported damages are less than US$10m.
AID AFTER DISASTERS 459
© 2014 John Wiley & Sons Ltd

13. Dropped events are: Afghanistan (2002), war in Afghanistan; Bangladesh (1973), post-Independence process; Haiti (1994), UN political intervention after the 1991 coup d’état; Iran(1972), several military conflicts, aid flows dropped by almost 70%; Saint Lucia (1980), SaintLucia’s independence from the UK; Turkey (1999), historically low levels of aid (post-disasteraid flows increased by almost 500%); and Venezuela (1999), historically low levels of aid in1997 (aid after disaster increased by almost 200%). In five cases, the annual variation of the aidflows exceeds 300%. Five additional events were identified as outliers in the estimation pro-cedure.14. A list of these events is available in an Appendix Table included in the Inter-AmericanDevelopment Bank working paper version of our paper.15. Excluding the year of the disaster itself from the post-event averages does not change theresults.16. We prefer to focus on the medians here because averages may be skewed by a few bigoutliers.17. In order to verify the robustness of our results, however, we do estimate the determinantswithin a more common panel-dataset framework. See the next section for details.18. Regression results based on samples 2 and 3 yield similar results and are available from theauthors upon request. Given that the regression results are very similar, we only discuss theresults for regressions based on Sample 1 which is the most comprehensive sub-sample.19. To see this, notice that our benchmark equation can be rewritten as
ln ln ln, , , , ,Aid Aid Aid X ui t i t i t i t i t− = + −( ) + +− − −1 0 1 11β α θwhere α is the autoregressive coefficient of the process, and θ and Xi,t–1 are vectors of param-eters and explanatory variables, respectively. We consistently find that α − 1 < 1, which suggeststhat the process is auto-regressive and aid flows are persistent.20. Several other variables were not included since they reduced the sample significantly.These were: sovereign debt as percentage of GDP, Polity IV’s revised combined polity scoremeasuring the political regime on an autocratic–democratic scale range, the InternationalCountry Risk Guide (ICRG) corruption index, the ICRG law and order index and central gov-ernment balance as percentage of GDP.21. Note that, given the different model specification vis-à-vis the case study approach, thepositive coefficient on the lagged dependent variable in the case of the panel data model is con-sistent with the negative coefficient in the pre-disaster aid flows in the case of the event study.In both cases, higher initial aid (Aidt–1) results in larger post-disaster aid (Aidt in the panel datasetting) which is equivalent to lower aid surge (ΔAid in the case study setting).
Supporting Information
Additional supporting information may be found in the online version of this articleat the publisher’s web site:
Table S1. Disaster Data
460 Oscar Becerra, Eduardo Cavallo, and Ilan Noy
© 2014 John Wiley & Sons Ltd