forecasting repeat buying for new products and...
TRANSCRIPT

Forecasting Repeat Buying for NewProducts and Services
Peter S. FaderUniversity of Pennsylvaniawww.peterfader.com
Bruce G. S. HardieLondon Business Schoolwww.brucehardie.com
15th Annual Advanced Research Techniques Forum
June 13–16, 2004
©2004 Peter S. Fader and Bruce G. S. Hardie
Motivation
Given a customer-level transaction database, what level
of sales should we expect in future periods, both
collectively and individually?
• Forecasting the sales of a new product given test
market/rollout panel data
• Identifying “active” customers from a list of past
customers
• Serving as a key input to a CLV exercise

Philosophy of Model-Building
• Keep it as simple as possible
• Minimize cost of implementation
– Use of readily available software (e.g., Excel)
– Use of data summaries
Outline
Part 1: Forecasting Aggregate Repeat-Buying
Part 2: Forecasting Individual-Level Repeat-Buying
Part 3: Links to the Broader Literature

Part 1
Forecasting Aggregate Repeat-Buying
Setting
Ace Drinks has developed a new shelf-stable juice
product, aimed primarily at children, called Kiwi
Bubbles. Before deciding whether or not to “go
national” with the new product, the marketing manager
for Kiwi Bubbles has decided to commission a year-long
test using IRI’s BehaviorScan� service, with a view to
getting a clearer picture of the product’s potential.
The product has now been under test for 24 weeks.
The marketing manager would like a forecast of the
product’s year-end performance in the test market.

Initial Test-Market Sales
0 4 8 12 16 20 24 28 32 36 40 44 48 52
Week
0
100
200
300
400Cum.Sales(#transactions)
.................................
...............................................................................
...............................................
.....................................
........................................
........................................................................
...................................................
Setting
As part of the BehaviorScan� test, we have been
monitoring the purchasing behavior of a consumer
panel comprising 1499 households.
We summarize these data by determining the
cumulative number of panelists that have made a trial,
first repeat, second repeat, and so on, purchase by the
end of each week.

Purchase Histories: Category
HH 1 ✲× × ×HH 2 ✲× × � × × × ×HH 3 ✲× � × � �HH 4 ✲× ×
......
HH 5 ✲� �
HH n ✲� × ×Launch tc
Purchase Histories: New Product Only
HH 1 ✲
HH 2 ✲�HH 3 ✲� � �HH 4 ✲
......
HH 5 ✲� �
HH n ✲�Launch tc

Summary of Panel Purchasing
Week Trial 1st Rpt 2nd Rpt 3rd Rpt 4th Rpt 5th Rpt 6th Rpt 7th Rpt
1 8 0 0 0 0 0 0 02 14 1 0 0 0 0 0 03 16 2 0 0 0 0 0 04 32 3 0 0 0 0 0 05 40 7 0 0 0 0 0 06 47 9 2 0 0 0 0 07 50 12 2 1 0 0 0 08 52 13 2 1 1 0 0 09 57 17 4 2 1 0 0 010 60 18 6 2 1 0 0 011 65 22 8 4 1 0 0 012 67 23 9 4 1 1 0 013 68 23 9 5 1 1 0 014 72 23 10 5 2 1 0 015 75 23 11 5 2 1 0 016 81 24 13 5 2 1 0 017 90 24 15 7 2 1 1 018 94 28 15 9 4 1 1 019 96 32 16 9 5 1 1 020 96 33 18 9 5 2 1 021 96 33 18 11 5 2 2 022 97 34 18 11 5 2 2 123 97 35 18 11 5 2 2 224 101 35 20 12 5 2 2 2
Initial Test-Market Sales
0 4 8 12 16 20 24 28 32 36 40 44 48 52
Week
0
100
200
300
400
Cum.Sales(#transactions)
........................................
....................................
..................................................
....................................................................
................................................................
......................................................................... Trial
................................................................................................................
....................................................................................................................................
.................................................................... First repeat
............................................................................................
..............................................
.......................................... Additional repeat
..........................
.......................................
............. ............
. ............. ..........................
..........................
............. ............. Total sales
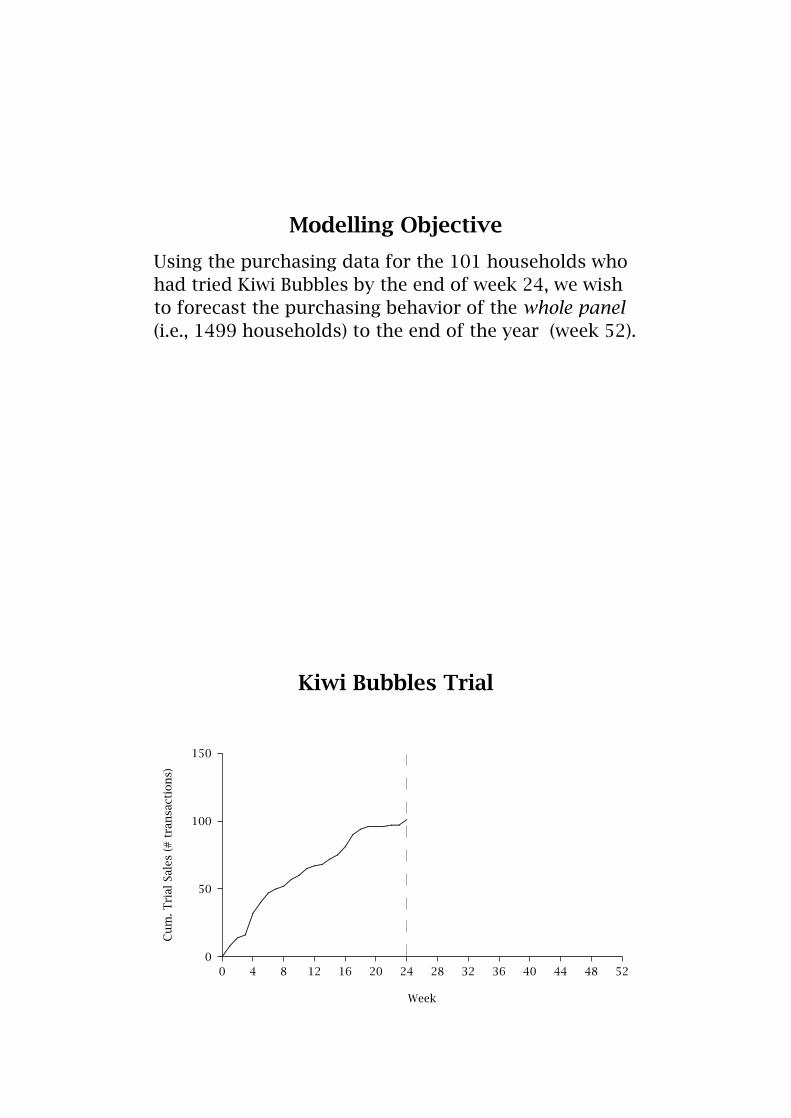
Modelling Objective
Using the purchasing data for the 101 households whohad tried Kiwi Bubbles by the end of week 24, we wishto forecast the purchasing behavior of the whole panel(i.e., 1499 households) to the end of the year (week 52).
Kiwi Bubbles Trial
0 4 8 12 16 20 24 28 32 36 40 44 48 52
Week
0
50
100
150
Cum.TrialSales(#transactions)
...............................................................................................................................................................
............................
...................................
....................................
.............................................................................................................
.............................

Modelling Trial Sales
We model the cumulative number of triers by time t,T(t), by developing an expression for the probabilitythat a randomly-chosen individual has made a trialpurchase by time t.
For a market comprising N individuals (i.e., the size ofthe panel), we have
T(t) = N · P(trial by t)
Illustrative Cumulative Trial Curves
0 13 26 39 52
0%
5%
10%
15%
20%
25%Product E
.........................................................................................
.............................................................................................................................................
0 13 26 39 52
0%
5%
10%
15%
20%
25%Product F
...........................................................................................................
.....................................................
..................................................................
......................................
0 13 26 39 52
0%
5%
10%
15%
20%
25%Product G
.................................
........................................................................................
.............................................................................................
0 13 26 39 52
0%
5%
10%
15%
20%
25%Product K
.......................................................................
.....................................................
.....................................................................................................................
0 13 26 39 52
0%
5%
10%
15%
20%
25%Product M
.................................................................
..............................................................................
...........................................................................................
0 13 26 39 52
0%
5%
10%
15%
20%
25%Product N
....................................................................................................
......................................................................................................................
.............................

Characterizing P(trial by t)
Cumulative penetration curves (from controlledtest-markets) tend to
• increase at a decreasing rate
• towards a penetration limit < 100%
A mathematical expression that captures this is
P(trial by t) = p0(1− e−θT t)
Formal Derivation: Individual-Level Model
• Let T denote the random variable of interest, and tdenote a particular realization.
• Assume time-to-trial is distributed exponentially.
• The probability that an individual has tried by timet is given by:
F(t) = P(T ≤ t) = 1− e−λT t
• λT represents the individual’s trial rate.
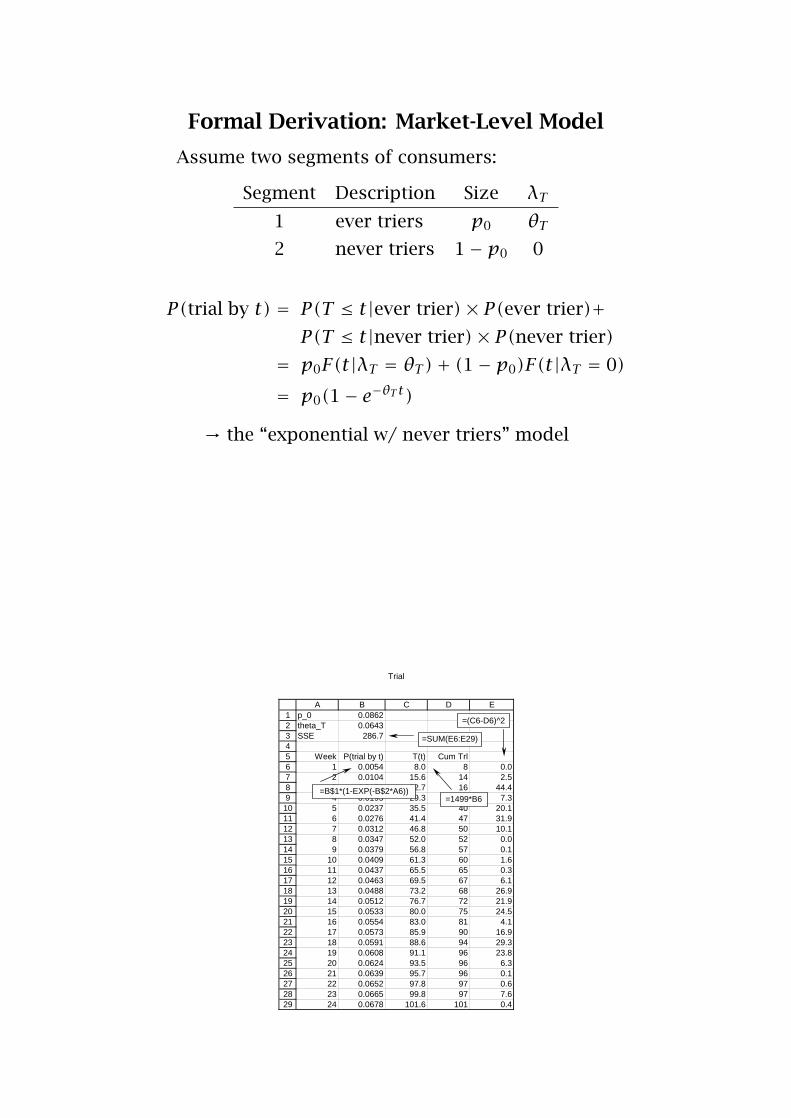
Formal Derivation: Market-Level Model
Assume two segments of consumers:
Segment Description Size λT1 ever triers p0 θT2 never triers 1− p0 0
P(trial by t) = P(T ≤ t|ever trier)× P(ever trier)+P(T ≤ t|never trier)× P(never trier)
= p0F(t|λT = θT)+ (1− p0)F(t|λT = 0)= p0(1− e−θT t)
→ the “exponential w/ never triers” model
Trial
1234567891011121314151617181920212223242526272829
A B C D Ep_0 0.0862theta_T 0.0643SSE 286.7
Week P(trial by t) T(t) Cum Trl1 0.0054 8.0 8 0.02 0.0104 15.6 14 2.53 0.0151 22.7 16 44.44 0.0195 29.3 32 7.35 0.0237 35.5 40 20.16 0.0276 41.4 47 31.97 0.0312 46.8 50 10.18 0.0347 52.0 52 0.09 0.0379 56.8 57 0.1
10 0.0409 61.3 60 1.611 0.0437 65.5 65 0.312 0.0463 69.5 67 6.113 0.0488 73.2 68 26.914 0.0512 76.7 72 21.915 0.0533 80.0 75 24.516 0.0554 83.0 81 4.117 0.0573 85.9 90 16.918 0.0591 88.6 94 29.319 0.0608 91.1 96 23.820 0.0624 93.5 96 6.321 0.0639 95.7 96 0.122 0.0652 97.8 97 0.623 0.0665 99.8 97 7.624 0.0678 101.6 101 0.4
=SUM(E6:E29)
=B$1*(1-EXP(-B$2*A6))=1499*B6
=(C6-D6)^2

Cumulative Trial Forecast
0 4 8 12 16 20 24 28 32 36 40 44 48 52
Week
0
50
100
150Cum.TrialSales(#transactions)
...............................................................................................................................................................
............................
...................................
....................................
.............................................................................................................
...................................................................
..........................................................................................
.....................................................................
..........................................................................................................................................
..................................................
Actual
...........................................................................................
..........................
..........................
..........................
.......................... ............. ............. ............. ............. ............. ............. ............. ............. ............. ............. ............. ............. .............
Predicted
Forecast Index = 88
Cumulative First Repeat Sales
0 4 8 12 16 20 24 28 32 36 40 44 48 52
Week
0
25
50
75
100
Cum.FR
Sales(#transactions)
.........................................................
.................................................................
.............................
..................................................................................................
....................................................................................
....................

Modelling First Repeat
How can an individual have made a first repeatpurchase of the new product by the end of week 4?
• she could have made a trial purchase in week 1 andmade a second purchase (i.e., her first repeat purchase)somewhere in the intervening three weeks,
• she could have made a trial purchase in week 2 and asecond purchase sometime in the following two weeks,or
• she could have made a trial purchase in week 3 and herfirst repeat purchase sometime in the following week.
123456789101122232425262728293031
A B C D E F G H I J K L Y Z
Cumulative First Repeat by Week of Trial
WeekTrial Week #HHs 1 2 3 4 5 6 7 8 9 10 23 24
1 8 0 1 2 2 3 3 4 4 4 4 5 52 6 0 0 1 1 1 2 2 2 2 4 43 2 0 0 1 1 1 1 1 1 1 14 16 0 2 3 4 5 7 8 11 115 8 0 1 1 1 2 2 3 36 7 0 0 0 0 0 1 17 3 0 0 0 0 0 018 4 2 219 2 0 020 0 0 021 0 0 022 1 0 023 0 0 024 4 0
Cum First Repeat 0 1 2 3 7 9 12 13 17 18 35 35First Repeat 0 1 1 1 4 2 3 1 4 1 1 0

123456789101122232425262728293031
A B C D E F G H I J K L Y Z
Cum. First Repeat (as % of Trial) by Week of Trial
WeekTrial Week #HHs 1 2 3 4 5 6 7 8 9 10 23 24
1 8 0.0 12.5 25.0 25.0 37.5 37.5 50.0 50.0 50.0 50.0 62.5 62.52 6 0.0 0.0 16.7 16.7 16.7 33.3 33.3 33.3 33.3 66.7 66.73 2 0.0 0.0 50.0 50.0 50.0 50.0 50.0 50.0 50.0 50.04 16 0.0 12.5 18.8 25.0 31.3 43.8 50.0 68.8 68.85 8 0.0 12.5 12.5 12.5 25.0 25.0 37.5 37.56 7 0.0 0.0 0.0 0.0 0.0 14.3 14.37 3 0.0 0.0 0.0 0.0 0.0 0.018 4 50.0 50.019 2 0.0 0.020 0 0.0 0.021 0 0.0 0.022 1 0.0 0.023 0 0.0 0.024 4 0.0
Cum First Repeat 0 1 2 3 7 9 12 13 17 18 35 35First Repeat 0 1 1 1 4 2 3 1 4 1 1 0
=ROUND(SUMPRODUCT($B5:$B28,D5:D28)/100,0)
Modelling First Repeat Sales
FR(t) =t−1∑t0=1
{P(first repeat by t | trial at t0)
× [T(t0)− T(t0 − 1)]}
where T(t0)− T(t0 − 1) is the number of incrementaltriers in week t0.

123456789101122232425262728293031
A B C D E F G H I J K L Y Z
Cum. First Repeat (as % of Trial) by Week of Trial
WeekTrial Week #HHs 1 2 3 4 5 6 7 8 9 10 23 24
1 8 0.0 12.5 25.0 25.0 37.5 37.5 50.0 50.0 50.0 50.0 62.5 62.52 6 0.0 0.0 16.7 16.7 16.7 33.3 33.3 33.3 33.3 66.7 66.73 2 0.0 0.0 50.0 50.0 50.0 50.0 50.0 50.0 50.0 50.04 16 0.0 12.5 18.8 25.0 31.3 43.8 50.0 68.8 68.85 8 0.0 12.5 12.5 12.5 25.0 25.0 37.5 37.56 7 0.0 0.0 0.0 0.0 0.0 14.3 14.37 3 0.0 0.0 0.0 0.0 0.0 0.018 4 50.0 50.019 2 0.0 0.020 0 0.0 0.021 0 0.0 0.022 1 0.0 0.023 0 0.0 0.024 4 0.0
Cum First Repeat 0 1 2 3 7 9 12 13 17 18 35 35First Repeat 0 1 1 1 4 2 3 1 4 1 1 0
=ROUND(SUMPRODUCT($B5:$B28,D5:D28)/100,0)
123456789101122232425262728
A B C D E F G H I J K L Y Z
(Shifted) Cum. First Repeat (as % of Trial) by Week of Trial
Weeks Since TrialTrial Week #HHs 0 1 2 3 4 5 6 7 8 9 22 23
1 8 0.0 12.5 25.0 25.0 37.5 37.5 50.0 50.0 50.0 50.0 62.5 62.52 6 0.0 0.0 16.7 16.7 16.7 33.3 33.3 33.3 33.3 50.0 66.73 2 0.0 0.0 50.0 50.0 50.0 50.0 50.0 50.0 50.0 50.04 16 0.0 12.5 18.8 25.0 31.3 43.8 50.0 56.3 56.3 56.35 8 0.0 12.5 12.5 12.5 25.0 25.0 25.0 25.0 25.0 25.06 7 0.0 0.0 0.0 0.0 0.0 0.0 0.0 0.0 0.0 0.07 3 0.0 0.0 0.0 0.0 0.0 0.0 0.0 0.0 0.0 0.018 4 0.0 50.0 50.0 50.0 50.0 50.0 50.019 2 0.0 0.0 0.0 0.0 0.0 0.020 0 0.0 0.0 0.0 0.0 0.021 0 0.0 0.0 0.0 0.022 1 0.0 0.0 0.023 0 0.0 0.024 4 0.0

Empirical Time-to-FR Curves by Time of Trial
0 2 4 6 8 10 12 14 16 18 20 22 24
Weeks Since Trial
0
20
40
60
80
Cum.%MakingFR
Purchase
...................................................................................................................................................................
...................................................................................................
....................................................................................................................................................................................................................................................................................................................................
.........................................................................................................................................................................................................................
Wk 1 [8]
.................................
.................................
...............................................................................................
Wk 2 [6]
........................................................................................................................................................................................................................................................................................................................................................................................................................................................................
Wk 3 [2]
.................................................................................................................................................................................................................................................................................................................................................................
....................................................................................................................................................
Wk 4 [16]
.............................................................................................................................
..................................................................................................................................................................................................................................................................................................................................................................................................................
..........................................................................................Wk 5 [8]
......................................................................................................
Wk 6 [7]
Wk 7 [3]........................................................................................................................................................................................................................................................................................................................................................................................................................................................................
Wk 8 [2]
....................................................................................................................................................................................................................................................................................
Wk 9 [5]
................................................................................................................................................................................................................................................................................................................................................................................................................
Wk 10 [3]
Modelling First Repeat
• Let us assume that these empirical time-to-FRcurves are realizations of the same underlying curve
P(first repeat by t | trial at t0)= P(first repeat t − t0 periods after trial)
• Specify a mathematical expression for this curve
P(first repeat by t | trial at t0)= p1
(1− e−θFR(t−t0)
)
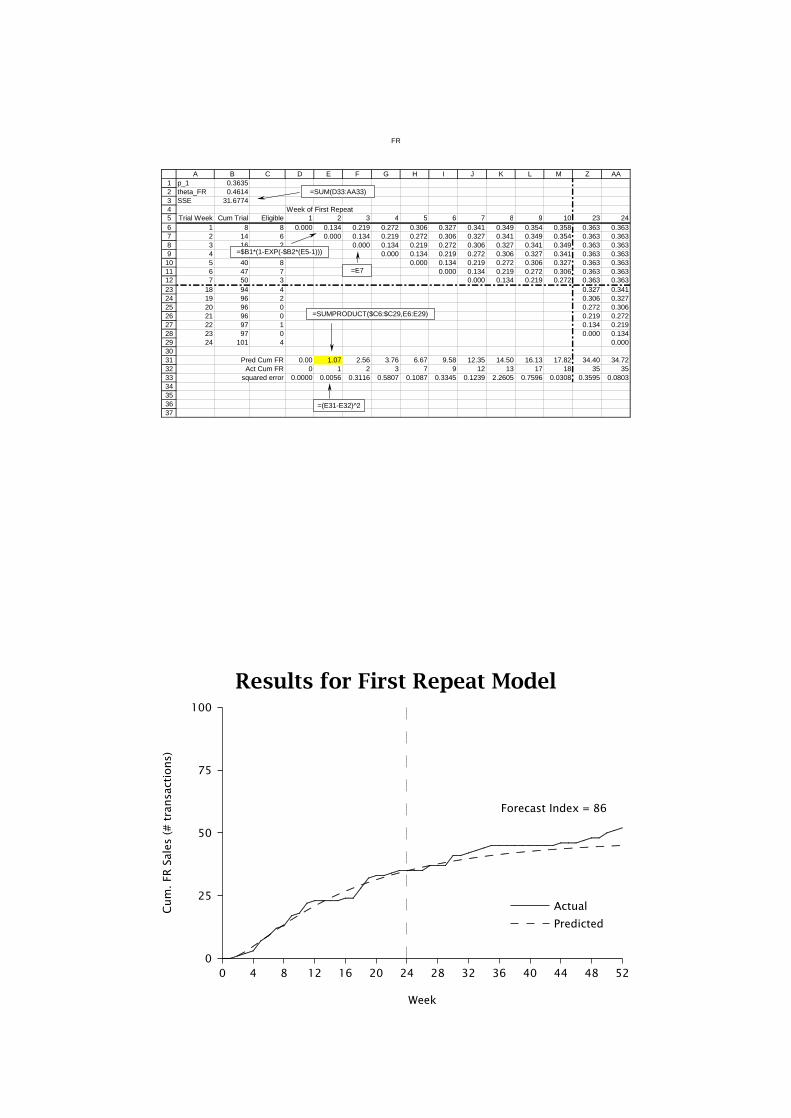
FR
123456789
101112232425262728293031323334353637
A B C D E F G H I J K L M Z AAp_1 0.3635theta_FR 0.4614SSE 31.6774
Week of First RepeatTrial Week Cum Trial Eligible 1 2 3 4 5 6 7 8 9 10 23 24
1 8 8 0.000 0.134 0.219 0.272 0.306 0.327 0.341 0.349 0.354 0.358 0.363 0.3632 14 6 0.000 0.134 0.219 0.272 0.306 0.327 0.341 0.349 0.354 0.363 0.3633 16 2 0.000 0.134 0.219 0.272 0.306 0.327 0.341 0.349 0.363 0.3634 32 16 0.000 0.134 0.219 0.272 0.306 0.327 0.341 0.363 0.3635 40 8 0.000 0.134 0.219 0.272 0.306 0.327 0.363 0.3636 47 7 0.000 0.134 0.219 0.272 0.306 0.363 0.3637 50 3 0.000 0.134 0.219 0.272 0.363 0.363
18 94 4 0.327 0.34119 96 2 0.306 0.32720 96 0 0.272 0.30621 96 0 0.219 0.27222 97 1 0.134 0.21923 97 0 0.000 0.13424 101 4 0.000
Pred Cum FR 0.00 1.07 2.56 3.76 6.67 9.58 12.35 14.50 16.13 17.82 34.40 34.72Act Cum FR 0 1 2 3 7 9 12 13 17 18 35 35
squared error 0.0000 0.0056 0.3116 0.5807 0.1087 0.3345 0.1239 2.2605 0.7596 0.0308 0.3595 0.0803
=$B1*(1-EXP(-$B2*(E5-1)))
=SUM(D33:AA33)
=SUMPRODUCT($C6:$C29,E6:E29)
=(E31-E32)^2
=E7
Results for First Repeat Model
0 4 8 12 16 20 24 28 32 36 40 44 48 52
Week
0
25
50
75
100
Cum.FR
Sales(#transactions)
.........................................................
.................................................................
.............................
..................................................................................................
....................................................................................
..............................................................................................
..............................................
......................................................................................................................................................................................
.....................................................
....................
Actual
............. ..........................
..........................
..........................
..........................
..........................
............. ............. ............. ............. ............. ............. ............. ............. ............. ............. ............. ............. ............. ............. ............. .............
Predicted
Forecast Index = 86

Cumulative Additional Repeat Sales
0 4 8 12 16 20 24 28 32 36 40 44 48 52
Week
0
25
50
75
100
Cum.ARSales(#transactions)
.........................................................................................................
..................................................................................
...................................
...................................................................
............................................................
................
Modelling Additional Repeat
AR(t) =∑j≥2
Rj(t)
where Rj(t) is the cumulative number of individualswho have made at least j repeat purchases by time t.
How do we characterize Rj(t), j = 2,3, . . .?

Cumulative Sales by Depth of Repeat Level
0 4 8 12 16 20 24 28 32 36 40 44 48 52
Week
0
10
20
30
40
Cum.Sales(#transactions)
.......................................................................................................................
.......................................................................................................
..................................................................................................
.....................................................................
....................... 2nd repeat
............. ............. ............. ..........................
..........................
............. ....................................... .............
............. ............. 3rd repeat
.........................................................................................................
................................................................................... 4th repeat
...................................................................................................................................................................................................................................................................
........................................................... 5th /6th repeat............. ............. ............. ............. ............. ............. ............. ............. ............. ............. ............. .............
Modelling Second Repeat
How can an individual have made a second repeatpurchase by the end of week 5?
• she could have made her 1st repeat purchase in week 2 (whichimplies her trial purchase occurred in week 1) and made a 3rdpurchase of the new product (i.e., her 2nd repeat purchase)somewhere in the intervening three weeks,
• she could have made her 1st repeat purchase in week 3 and a2nd repeat purchase sometime in the following two weeks, or
• she could have made her 1st repeat purchase in week 4 andher 2nd repeat purchase sometime in the following week.

123456789101122232425262728293031
A B C D E F G H I J K L Y Z
Cumulative Second Repeat by Week of First Repeat
WeekFR Week #HHs 1 2 3 4 5 6 7 8 9 10 23 24
1 02 1 0 0 0 0 1 1 1 1 1 1 13 1 0 0 0 0 0 0 0 0 0 04 1 0 0 0 0 0 0 0 0 05 4 0 1 1 1 2 2 3 36 2 0 0 0 0 0 1 17 3 0 0 1 3 3 318 4 2 319 4 1 220 1 0 021 0 0 022 1 0 023 1 0 024 0 0
Cum 2nd Repeat 0 0 0 0 0 2 2 2 4 6 18 202nd Repeat 0 0 0 0 0 2 0 0 2 2 0 2
123456789101122232425262728293031
A B C D E F G H I J K L Y Z
Cumulative Second Repeat (as % of FR) by Week of FR
WeekFR Week #HHs 1 2 3 4 5 6 7 8 9 10 23 24
1 02 1 0.0 0.0 0.0 0.0 100.0 100.0 100.0 100.0 100.0 100.0 100.03 1 0.0 0.0 0.0 0.0 0.0 0.0 0.0 0.0 0.0 0.04 1 0.0 0.0 0.0 0.0 0.0 0.0 0.0 0.0 0.05 4 0.0 25.0 25.0 25.0 50.0 50.0 75.0 75.06 2 0.0 0.0 0.0 0.0 0.0 50.0 50.07 3 0.0 0.0 33.3 100.0 100.0 100.018 4 50.0 75.019 4 25.0 50.020 1 0.0 0.021 0 0.0 0.022 1 0.0 0.023 1 0.0 0.024 0 0.0
Cum 2nd Repeat 0 0 0 0 0 2 2 2 4 6 18 202nd Repeat 0 0 0 0 0 2 0 0 2 2 0 2
=ROUND(SUMPRODUCT($B5:$B28,D5:D28)/100,0)

Modelling Second Repeat
R2(t) =t−1∑t1=2
{P(second repeat by t |first repeat at t1)
× [FR(t1)− FR(t1 − 1)]}
where FR(t1)− FR(t1 − 1) is the number of individualswho made their first repeat purchase in week t1.
More Generally …
Rj(t) =t−1∑
tj−1=j
{P(jth repeat by t | (j − 1)th repeat at tj−1)
× [Rj−1(tj−1)− Rj−1(tj−1 − 1)]}
where Rj−1(tj−1)− Rj−1(tj−1 − 1) is the number ofindividuals who made their (j − 1)th repeat purchase inweek tj−1.
Objective: develop a model for
P(jth repeat by t | (j − 1)th repeat at tj−1)
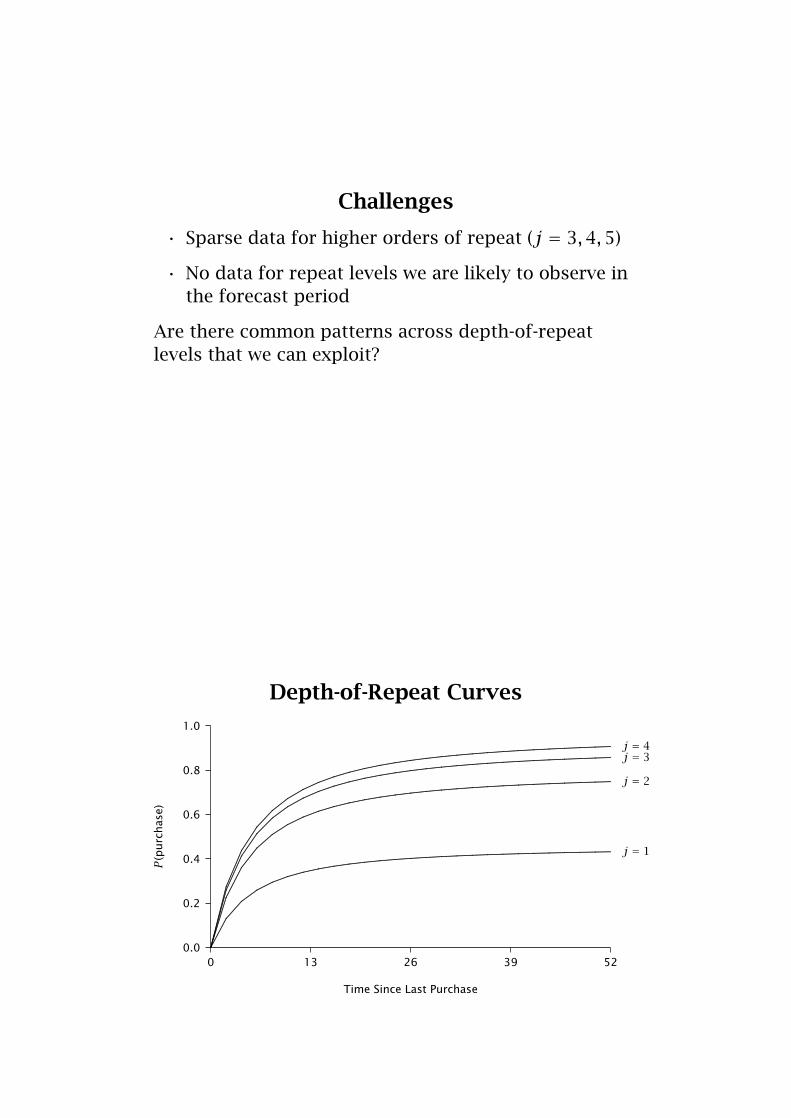
Challenges
• Sparse data for higher orders of repeat (j = 3,4,5)• No data for repeat levels we are likely to observe inthe forecast period
Are there common patterns across depth-of-repeatlevels that we can exploit?
Depth-of-Repeat Curves
0 13 26 39 52
Time Since Last Purchase
0.0
0.2
0.4
0.6
0.8
1.0
P(purchase)
....................................................................................................................................
..........................................
......................................................................
.........................................................................................................................................................................
.............................................................................................................................................................................................................................................................................................. j = 1
.....................................................................................................................................................................................................................................
.................................
................................................
.........................................................................
................................................................................................................................................
................................................................................................................................................................................................................................................ j = 2
.........................................................................................................................................................................................................................................................................................
.......................................
......................................................
.......................................................................................
..................................................................................................................................................................................
........................................................................................................................................................... j = 3
................................................................................................................................................................................................................................................................................................
...................................
................................................
.......................................................................
................................................................................................................................
............................................................................................................................................................................................................................................ j = 4
Probability of jth Repeat
Following the same logic as for trial and first repeat,
P(jth repeat by t | (j − 1)th repeat at tj−1)= pj
(1− e−θAR(t−tj−1)
), t = tj−1 + 1, . . .
Evolution of pjThe asymptote of the depth-of-repeat curves (i.e.,ultimate conversion proportion) increases, at adecreasing rate, as j increases.
The proportion of consumers who have madetheir jth repeat purchase within 52 weeks oftheir (j − 1)th repeat purchase increases with j.
We model the evolution of the ultimate conversionproportions as
pj = p∞(1− e−γj), j ≥ 2
AR
123456789
A B C D E F Gp_infty 0.7816 DoR j p_jgamma 1.0014 2 0.6761theta _AR 0.2309 3 0.7428
4 0.7673SSE 51.17298 5 0.7763
='DoR 2'!B4+'DoR 3'!B4+'DoR 4'!B4+'DoR 5'!B4
=B$1*(1-EXP(-B$2*D2))
DoR 2
123456789
101112132425262728293031323334
A B C D E F G H I J K L M Z AAp_j 0.6761theta_AR 0.2309j 2SSE_j 18.6012
Week of jth RepeatWeek Cum j-1 Eligible 1 2 3 4 5 6 7 8 9 10 23 24
1 0 0 0.000 0.000 0.000 0.000 0.000 0.000 0.000 0.000 0.000 0.000 0.000 0.0002 1 1 0.000 0.000 0.139 0.250 0.338 0.408 0.463 0.507 0.542 0.570 0.671 0.6723 2 1 0.000 0.000 0.000 0.139 0.250 0.338 0.408 0.463 0.507 0.542 0.669 0.6714 3 1 0.000 0.000 0.000 0.000 0.139 0.250 0.338 0.408 0.463 0.507 0.668 0.6695 7 4 0.000 0.000 0.000 0.000 0.000 0.139 0.250 0.338 0.408 0.463 0.666 0.6686 9 2 0.000 0.000 0.000 0.000 0.000 0.000 0.139 0.250 0.338 0.408 0.663 0.6667 12 3 0.000 0.000 0.000 0.000 0.000 0.000 0.000 0.139 0.250 0.338 0.659 0.663
18 28 4 0.000 0.000 0.000 0.000 0.000 0.000 0.000 0.000 0.000 0.000 0.463 0.50719 32 4 0.000 0.000 0.000 0.000 0.000 0.000 0.000 0.000 0.000 0.000 0.408 0.46320 33 1 0.000 0.000 0.000 0.000 0.000 0.000 0.000 0.000 0.000 0.000 0.338 0.40821 33 0 0.000 0.000 0.000 0.000 0.000 0.000 0.000 0.000 0.000 0.000 0.250 0.33822 34 1 0.000 0.000 0.000 0.000 0.000 0.000 0.000 0.000 0.000 0.000 0.139 0.25023 35 1 0.000 0.000 0.000 0.000 0.000 0.000 0.000 0.000 0.000 0.000 0.000 0.13924 35 0 0.000 0.000 0.000 0.000 0.000 0.000 0.000 0.000 0.000 0.000 0.000 0.000
Pred Cum DoR j 0.00 0.00 0.14 0.39 0.73 1.55 2.49 3.65 4.71 6.11 19.53 20.38Act Cum DoR j 0 0 0 0 0 2 2 2 4 6 18 20
squared error 0.0000 0.0000 0.0194 0.1517 0.5292 0.1995 0.2380 2.7154 0.5014 0.0115 2.3365 0.1453
=AR!E2
=AR!B3 =IF($A8<$B$3,0,IF($A8>=F$6,0,$B$1*(1-EXP(-$B$2*(F$6-$A8)))))
DoR 3
123456789
101112132425262728293031323334
A B C D E F G H I J K L M Z AAp_j 0.7428theta_AR 0.2309j 3SSE_j 17.7239
Week of jth RepeatWeek Cum j-1 Eligible 1 2 3 4 5 6 7 8 9 10 23 24
1 0 0 0.000 0.000 0.000 0.000 0.000 0.000 0.000 0.000 0.000 0.000 0.000 0.0002 0 0 0.000 0.000 0.000 0.000 0.000 0.000 0.000 0.000 0.000 0.000 0.000 0.0003 0 0 0.000 0.000 0.000 0.153 0.275 0.371 0.448 0.509 0.557 0.595 0.736 0.7374 0 0 0.000 0.000 0.000 0.000 0.153 0.275 0.371 0.448 0.509 0.557 0.734 0.7365 0 0 0.000 0.000 0.000 0.000 0.000 0.153 0.275 0.371 0.448 0.509 0.731 0.7346 2 2 0.000 0.000 0.000 0.000 0.000 0.000 0.153 0.275 0.371 0.448 0.728 0.7317 2 0 0.000 0.000 0.000 0.000 0.000 0.000 0.000 0.153 0.275 0.371 0.724 0.728
18 15 0 0.000 0.000 0.000 0.000 0.000 0.000 0.000 0.000 0.000 0.000 0.509 0.55719 16 1 0.000 0.000 0.000 0.000 0.000 0.000 0.000 0.000 0.000 0.000 0.448 0.50920 18 2 0.000 0.000 0.000 0.000 0.000 0.000 0.000 0.000 0.000 0.000 0.371 0.44821 18 0 0.000 0.000 0.000 0.000 0.000 0.000 0.000 0.000 0.000 0.000 0.275 0.37122 18 0 0.000 0.000 0.000 0.000 0.000 0.000 0.000 0.000 0.000 0.000 0.153 0.27523 18 0 0.000 0.000 0.000 0.000 0.000 0.000 0.000 0.000 0.000 0.000 0.000 0.15324 20 2 0.000 0.000 0.000 0.000 0.000 0.000 0.000 0.000 0.000 0.000 0.000 0.000
Pred Cum DoR j 0.00 0.00 0.00 0.00 0.00 0.00 0.31 0.55 0.74 1.20 11.14 11.60Act Cum DoR j 0 0 0 0 0 0 1 1 2 2 11 12
squared error 0.0000 0.0000 0.0000 0.0000 0.0000 0.0000 0.4811 0.2029 1.5811 0.6365 0.0204 0.1581
DoR 4
123456789
101112132425262728293031323334
A B C D E F G H I J K L M Z AAp_j 0.7673theta_AR 0.2309j 4SSE_j 10.5477
Week of jth RepeatWeek Cum j-1 Eligible 1 2 3 4 5 6 7 8 9 10 23 24
1 0 0 0.000 0.000 0.000 0.000 0.000 0.000 0.000 0.000 0.000 0.000 0.000 0.0002 0 0 0.000 0.000 0.000 0.000 0.000 0.000 0.000 0.000 0.000 0.000 0.000 0.0003 0 0 0.000 0.000 0.000 0.000 0.000 0.000 0.000 0.000 0.000 0.000 0.000 0.0004 0 0 0.000 0.000 0.000 0.000 0.158 0.284 0.384 0.463 0.526 0.575 0.758 0.7605 0 0 0.000 0.000 0.000 0.000 0.000 0.158 0.284 0.384 0.463 0.526 0.755 0.7586 0 0 0.000 0.000 0.000 0.000 0.000 0.000 0.158 0.284 0.384 0.463 0.752 0.7557 1 1 0.000 0.000 0.000 0.000 0.000 0.000 0.000 0.158 0.284 0.384 0.748 0.752
18 9 2 0.000 0.000 0.000 0.000 0.000 0.000 0.000 0.000 0.000 0.000 0.526 0.57519 9 0 0.000 0.000 0.000 0.000 0.000 0.000 0.000 0.000 0.000 0.000 0.463 0.52620 9 0 0.000 0.000 0.000 0.000 0.000 0.000 0.000 0.000 0.000 0.000 0.384 0.46321 11 2 0.000 0.000 0.000 0.000 0.000 0.000 0.000 0.000 0.000 0.000 0.284 0.38422 11 0 0.000 0.000 0.000 0.000 0.000 0.000 0.000 0.000 0.000 0.000 0.158 0.28423 11 0 0.000 0.000 0.000 0.000 0.000 0.000 0.000 0.000 0.000 0.000 0.000 0.15824 12 1 0.000 0.000 0.000 0.000 0.000 0.000 0.000 0.000 0.000 0.000 0.000 0.000
Pred Cum DoR j 0.00 0.00 0.00 0.00 0.00 0.00 0.00 0.16 0.28 0.54 6.38 6.81Act Cum DoR j 0 0 0 0 0 0 0 1 1 1 5 5
squared error 0.0000 0.0000 0.0000 0.0000 0.0000 0.0000 0.0000 0.7086 0.5129 0.2100 1.9171 3.2711

DoR 5
123456789
101112132425262728293031323334
A B C D E F G H I J K L M Z AAp_j 0.7763theta_AR 0.2309j 5SSE_j 4.3002
Week of jth RepeatWeek Cum j-1 Eligible 1 2 3 4 5 6 7 8 9 10 23 24
1 0 0 0.000 0.000 0.000 0.000 0.000 0.000 0.000 0.000 0.000 0.000 0.000 0.0002 0 0 0.000 0.000 0.000 0.000 0.000 0.000 0.000 0.000 0.000 0.000 0.000 0.0003 0 0 0.000 0.000 0.000 0.000 0.000 0.000 0.000 0.000 0.000 0.000 0.000 0.0004 0 0 0.000 0.000 0.000 0.000 0.000 0.000 0.000 0.000 0.000 0.000 0.000 0.0005 0 0 0.000 0.000 0.000 0.000 0.000 0.160 0.287 0.388 0.468 0.532 0.764 0.7676 0 0 0.000 0.000 0.000 0.000 0.000 0.000 0.160 0.287 0.388 0.468 0.761 0.7647 0 0 0.000 0.000 0.000 0.000 0.000 0.000 0.000 0.160 0.287 0.388 0.757 0.761
18 4 2 0.000 0.000 0.000 0.000 0.000 0.000 0.000 0.000 0.000 0.000 0.532 0.58219 5 1 0.000 0.000 0.000 0.000 0.000 0.000 0.000 0.000 0.000 0.000 0.468 0.53220 5 0 0.000 0.000 0.000 0.000 0.000 0.000 0.000 0.000 0.000 0.000 0.388 0.46821 5 0 0.000 0.000 0.000 0.000 0.000 0.000 0.000 0.000 0.000 0.000 0.287 0.38822 5 0 0.000 0.000 0.000 0.000 0.000 0.000 0.000 0.000 0.000 0.000 0.160 0.28723 5 0 0.000 0.000 0.000 0.000 0.000 0.000 0.000 0.000 0.000 0.000 0.000 0.16024 5 0 0.000 0.000 0.000 0.000 0.000 0.000 0.000 0.000 0.000 0.000 0.000 0.000
Pred Cum DoR j 0.00 0.00 0.00 0.00 0.00 0.00 0.00 0.00 0.16 0.29 2.96 3.15Act Cum DoR j 0 0 0 0 0 0 0 0 0 0 2 2
squared error 0.0000 0.0000 0.0000 0.0000 0.0000 0.0000 0.0000 0.0000 0.0256 0.0825 0.9269 1.3277
Estimated Depth-of-Repeat Curves
0 13 26 39 52
Time Since Last Purchase
0.0
0.2
0.4
0.6
0.8
1.0
P(purchase)
................................................................................................................................................
........................................................................................................................................................................................................................................................................................................................................................................................................................................................................................................................................................................................................................... j = 1
...............................................................................................................................................................................................................................................................
........................................................
............................................................................................................................................................................................................................................................................................................................................................................................................................................................................................................... j = 2
..............................................................................................................................................................................................................................................................................
.............................................
............................................................................................................................................................................................................................................................................................................................................................................................................................................................................................................................. j = 3
....................................................................................................................................................................................................................................................................................................
.............................................................
.............................................................................................................................................................................................................................................................................................................................................................................................................................................................................................. j = 4
..................................................................................................................................................................................................................................................................................................
.......................................................
........................................................................................................................................................................................................................................................................................................................................................................................................................................................................................................
j = 5
Cumulative Sales by Depth of Repeat Level
0 4 8 12 16 20 24 28 32 36 40 44 48 52
Week
0
10
20
30
40
Cum.Sales(#transactions)
.......................................................................................................................
.......................................................................................................
..................................................................................................
.....................................................................
....................... 2nd repeat
............. ............. ............. ..........................
..........................
............. ....................................... .............
............. ............. 3rd repeat
.........................................................................................................
................................................................................... 4th repeat
...................................................................................................................................................................................................................................................................
........................................................... 5th /6th repeat............. ............. ............. ............. ............. ............. ............. ............. ............. ............. ............. .............
Results by Depth of Repeat Level
0 4 8 12 16 20 24 28 32 36 40 44 48 52
Week
0
10
20
30
40
Cum.Sales(#transactions)
.......................................................................................................................
.......................................................................................................
..................................................................................................
.....................................................................
.........................................
.........................................................
..................................................................
...............................................
............................................................................................................................................................................................................................
....
....................................................................................................................
.....................................................................
...........................................................................................................................
..............................................
..............................................................
...............................................................................................
................................
............................................
......................................................................................................................................................................................
...........
.....................................................................................................................................................................................
..........................................................................................................................................................................
...........................................................................................................................................
...................................................................................................................
...................................................
................................................................................................
...................................................................................................................................................................................................................................................................
......................................................................................................................................................................................................................................................
................................................................................................................
..............................................................
......................................................
................................................................................................................................................................................................................................................................................
...............................................................................................................................................................................................................
..................................................................................
...................................................................................................................................................
Actual
............. ............. ..........................
........................................................................................................
..........................
..........................
..........................
..........................
............. ............. ............. ............. ............. ............. ............. ............. .............
............. ............. ............. ............. ..........................
..........................
..........................
..........................
..........................
..........................
..........................
............. ............. ............. ............. ............. ............. ............. ............. .............
............. ............. ............. ............. ............. ............. ............. ..........................
..........................
..........................
..........................
..........................
............. ............. ............. ............. ............. ............. ............. ............. ............. .....
............. ............. ............. ............. ............. ............. ............. ............. ............. ............. ............. ............. ..........................
.......................... ............. ............. ............. ............. ............. ............. ............. ............. ............. .............
............. ............. ............. ............. ............. ............. ............. ............. ............. ............. ............. ............. ............. ............. ............. ............. ............. ............. ............. ............. ............. ............. ............. ............. ............. ............
Predicted2nd repeat
3rd repeat
4th repeat
5th repeat
6th repeat
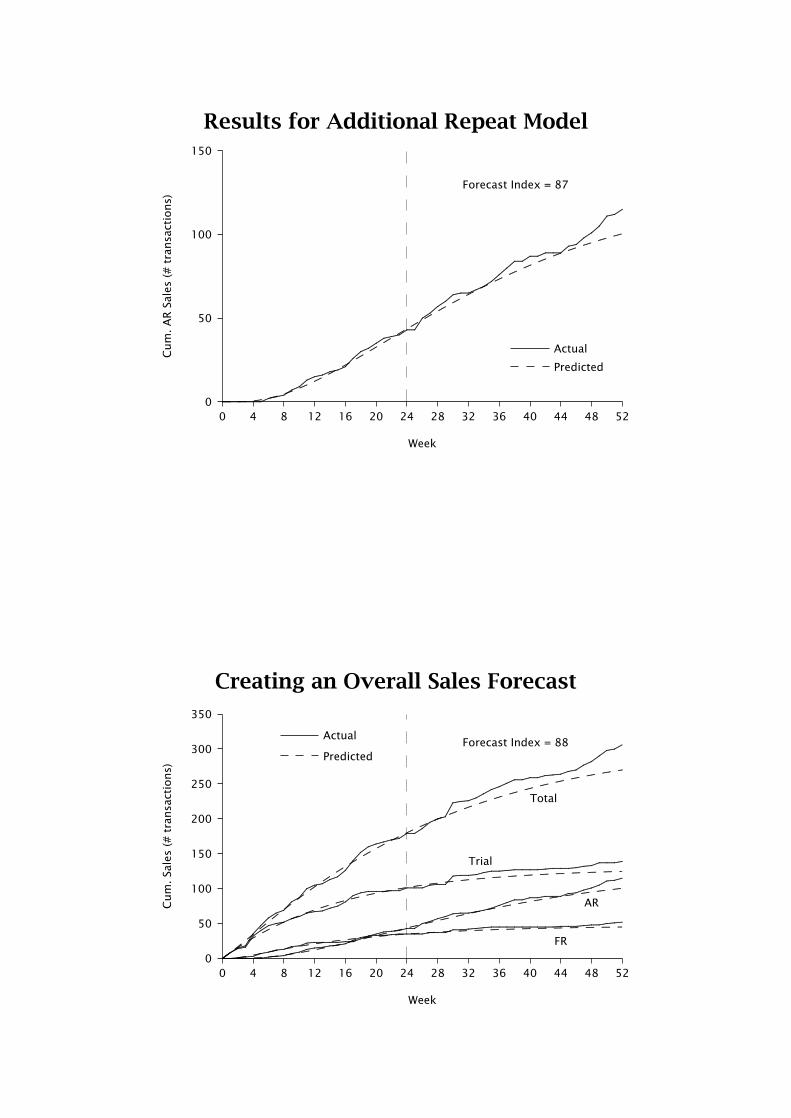
Results for Additional Repeat Model
0 4 8 12 16 20 24 28 32 36 40 44 48 52
Week
0
50
100
150Cum.ARSales(#transactions)
..................................................................................................................
................................................
......................................................
.......................................................
..................................
....................................................
...............................................................
..................................................
....................................
...............................................................................
............................................................................................
....................................................................................
......
Actual
............. ............. ............. ............. ..........................
..........................
..........................
..........................
..........................
..........................
..........................
..........................
..........................
..........................
.......................... ............. .............
Predicted
Forecast Index = 87
Creating an Overall Sales Forecast
0 4 8 12 16 20 24 28 32 36 40 44 48 52
Week
0
50
100
150
200
250
300
350
Cum.Sales(#transactions)
................................
........................................................
....................................................
..............................................................
.....................................................
...................................................................................................................................................
...............................................................
....................................................................................................................................................................................................
..........................................
...........................................................................................................
..............................................................................................................................
......................................................................................................................................................................................
.....................................................................................................................................................................................................................................................................
.....................................................................................................................................................
...............................................................................
................................................................................
.......................................................
......................................................................................
...............................................
.....................................................................................................................
.....................................................
..............
............................
........................................................................................
............................................
..................................................
..................................
..............................................................................
...............................................................
...............................................
........................................................................
....................................
........................................................
........................................................................................
................................
.....................................
.............Actual
..........................
..........................
..........................
.......................... ............. ............. ............. ............. ............. ............. ............. ............. ............. ............. ............. ............. ............. ............. ............. ............. ............. ............. ....
............. ............. ............. ............. ............. ............. ............. ............. ............. ............. ............. ............. ............. ............. ............. ............. ............. ............. ............. ............. ............. ............. ............. ............. ............. .......
............. ............. ............. ............. ............. ............. ............. ............. ............. ............. ............. ............. ............. ............. ............. ............. ............. ............. ............. ............. ............. ............. ............. ............. ............. .............
..........................
..........................
..........................
..........................
..........................
..........................
..........................
..........................
..........................
..........................
............. ............. ............. ............. ............. ............. ............. ............. .......Predicted
Trial
FR
AR
Total
Forecast Index = 88

Extending the Basic Model
• The trial model assumes all triers have the sameunderlying trial rate θT —a bit simplistic.
• Allow for individual differences in (latent) trial ratesacross the population.
• We incorporate the effects of marketing mixcovariates by assuming that the probability of anindividual buying in week t, given she has yet tomake a trial purchase, is a function of marketingactivity in week t.
• Similar modifications to first repeat model, etc.
Overall Sales Forecast for the Extended Model
0 4 8 12 16 20 24 28 32 36 40 44 48 52
Week
0
10
20
30
40
Cum.Sales(#transactions)per100HH
...........................................
...........................................
.............................................................
........................................................................
..................................................................................................................................................
.............................................................................................................................................................................................................................................................
.............................................................................
...........................................................................................
..................................................................................................................................................
..................................................................................................................................................................................................................................................................................................................................................................................
.......................................................................
.........................................................................................................................
.............................................
...............................................................
.....................................................................................................
..................................................................
....................................................................................................
................................................................................................................
...................................................................
.....
............................................................................................................................
..............................................................................
.........................................
................................................
...........................................................
....................................................
.........................................
...........................................................
.................................................................
.............................................................................................
..........................................
..............................................
Actual
..........................
..........................
............. .......................... ............. ............. ............. ............. ............. ............. ............. ............. ............. ............. ............. ............. ............. ............. ............. ............. ............. ............. ............. ..
............. ............. ............. ............. ............. ............. ............. ............. ............. ............. ............. ............. ............. ............. ............. ............. ............. ............. ............. ............. ............. ............. ............. ............. ............. .........
............. ............. ............. ............. ............. .......................... ............. ............. ............. ............. ............. ............. ............. ............. ............. ............. ............. ............. ............. ............. ............. .............
..........................
.............
..........................
.......................................
.......................................
..........................
.......................... ............. .............
............. .......................... ............. .............
.......................... ............. .............
..........................
..........................
..........................
Predicted
Trial
FR
AR
Total
Forecast Index = 108

Implementation Issues
• Projection from panel to market
• Projection from market to region/country
• Adjustments for distribution build, seasonality, etc.
Application:
Using a Depth-of-Repeat Model to Determinethe Impact of 9/11 on Online Travel Sales
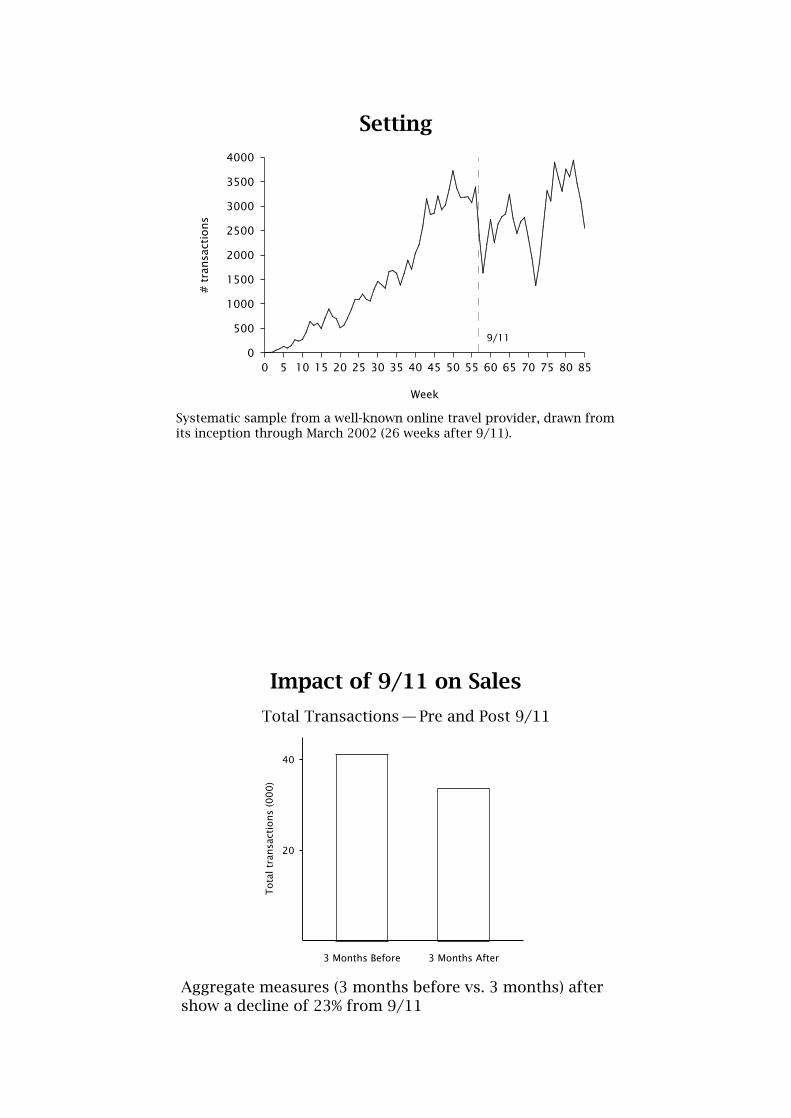
Setting
0 5 10 15 20 25 30 35 40 45 50 55 60 65 70 75 80 85
Week
0
500
1000
1500
2000
2500
3000
3500
4000
#transactions
.....................................................
.......................................................................................
...........................................................................
....................................................................................
...................................................
...............................................................
.............................................................................................................................................................................................................
........................................................
..................................................................................................................................
..................................................................................................................................................................
........
........
........
........
.........
........
........
........
........
....................................................................................................................................................................................................
...........................................................................................................................................
........................................................................................................................................................................................................................................................................................
...................................................................................................................................................................................
9/11
Systematic sample from a well-known online travel provider, drawn fromits inception through March 2002 (26 weeks after 9/11).
Impact of 9/11 on Sales
20
40
Totaltransactions(000)
3 Months Before 3 Months After
Total Transactions—Pre and Post 9/11
Aggregate measures (3 months before vs. 3 months) aftershow a decline of 23% from 9/11
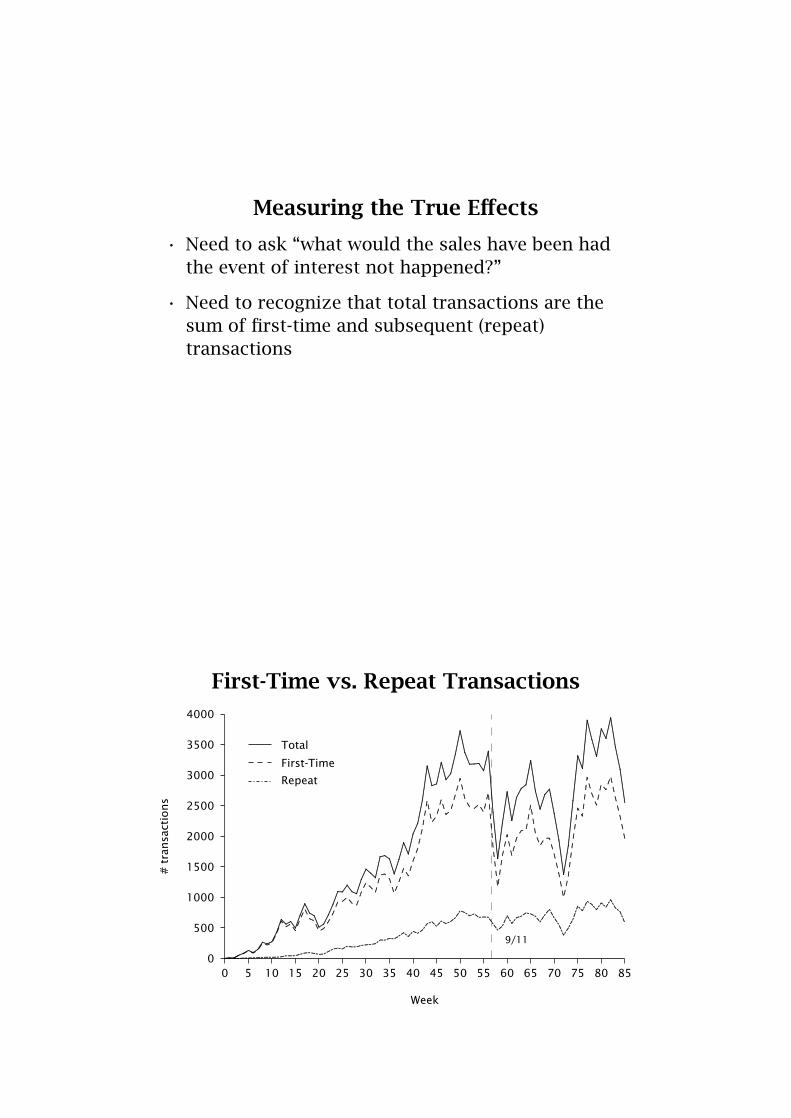
Measuring the True Effects
• Need to ask “what would the sales have been hadthe event of interest not happened?”
• Need to recognize that total transactions are thesum of first-time and subsequent (repeat)transactions
First-Time vs. Repeat Transactions
0 5 10 15 20 25 30 35 40 45 50 55 60 65 70 75 80 85
Week
0
500
1000
1500
2000
2500
3000
3500
4000
#transactions
...............................................................
..................................
...........................................................................
.............................................................................................
........................................................................................................
...............................................................
............................................................................
.............................................................................................................................................................................................................................................................
....................................................................
......................................................................................................................................................................
..........................................................................................................................................................................................................
........
........
........
........
........
........
.........
........
........
........
........
........
................................................................................................................................................................................................................................................
..............................................................................................................................................................................
............................................................................................................................................................................................................................................................................................................................................................
................................................................................................................................................................................................................................
Total
........ ........ ........ ........
.........................................................
...............................................
........................................ ........
................................
........................
........................................
................................................................................................................................................................................ ...................
.....................................................................................................................................................................................................................................................
................................................................................................................................................................................................................................
................................................................
First-Time
.............................................................................................................................
................................................................
....................................
...........................................
..........................................................................................
.............................
.........................................
..................................................
............................................
............................................
..................................
Repeat
9/11
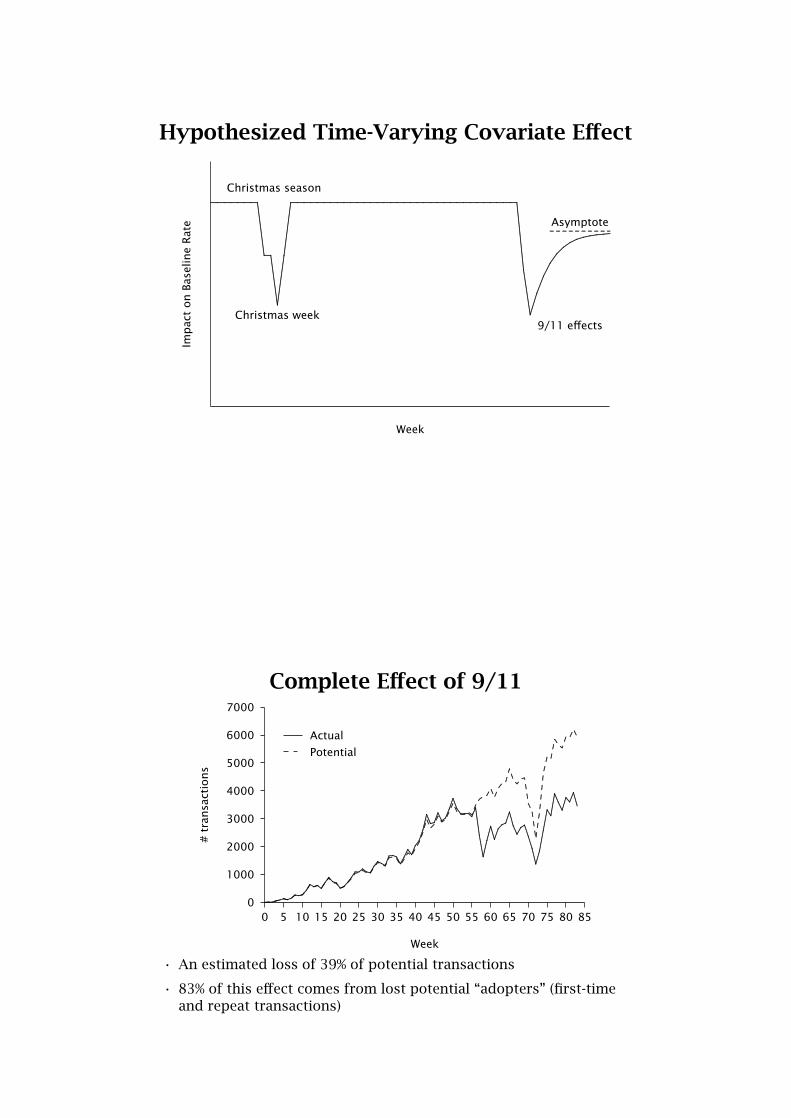
Hypothesized Time-Varying Covariate Effect
Week
ImpactonBaselineRate
...............................................................................................................................................................................................................................................................................................................................................................................................................................................................................................................................................................................................................................................................................................................................................................................................................................................................................................................................................................................................................
.........................................................................................................................................
....................................................................................................................
Asymptote
Christmas season
Christmas week9/11 effects
Complete Effect of 9/11
0 5 10 15 20 25 30 35 40 45 50 55 60 65 70 75 80 85
Week
0
1000
2000
3000
4000
5000
6000
7000
#transactions
..........................................................................
...............................................
......................................................
............................................................
.....................................
...............................................................................
............................................................................................
....................................
.......................................................................................
...................................................................................................................................................................................................................................................................
..........................................................................................................................................................................................................................................................
.............................................................
Actual
........ ........ ........ ........ ........
........ ........................................
................ ........ ......
.......... ........
........ ...............................
.........................................
................................................ ........
................
........................
........................................
................................................................................................................................................................
........................
Potential
• An estimated loss of 39% of potential transactions
• 83% of this effect comes from lost potential “adopters” (first-timeand repeat transactions)

Conclusions• Decompose new product sales into separate trial andrepeat components.
• For each component, tell a behaviorally plausible “story”at the individual customer level, then aggregate up to themarket level.
• While the parameters vary across these components, thesame basic structural model can often be used for eachof them.
• The different stages of “additional repeat” can be linkedtogether and projected in a very parsimonious manner.
• Explanatory variables may be useful additions, but theyare often not essential to developing an accurate salesforecasting model.
Part 2
Forecasting Individual-Level Repeat-Buying

Setting
• New customers at CDNOW, 1/97–3/97
• Systematic sample (1/10) drawn from panel of23,570 new customers
• 39-week calibration period
• 39-week forecasting (holdout) period
Cumulative Repeat Transactions
0 13 26 39
Week
0
1000
2000
3000
#transactions
......................................................................................
................................
...........................................
............................................................................................................
............................
................................
.................................
...................................
...........................................
.............................................
.........................................
.......................................................
...........................................
.........................................
..........................................
......................

Purchase Histories
ID = 0001 � ✲× ×
ID = 0002 � ✲×...
...ID = 1178 � ✲×
ID = 1179 � ✲...
...ID = 2356 � ✲× ×× ×
ID = 2357 � ✲
Week 0 Week 39
Raw Data
1234567891011121314151617181920
1178117911801181235623572358
A B CID x T
0001 2 38.860002 1 38.860003 0 38.860004 0 38.860005 0 38.860006 7 38.860007 1 38.860008 0 38.860009 2 38.860010 0 38.860011 5 38.860012 0 38.860013 0 38.860014 0 38.860015 0 38.860016 0 38.860017 10 38.860018 1 38.860019 3 38.711177 0 32.711178 1 32.711179 0 32.711180 0 32.712355 0 27.002356 4 27.002357 0 27.00

Modelling Objective
Given this customer database, we wish to determine thelevel of transactions that should be expected in nextperiod (e.g., 39 weeks) by those on the customer list,both individually and collectively.
Modelling the Purchasing Process
• A customer purchases “randomly” with an averagetransaction rate λ
• Transaction rates vary across customers

Modelling the Purchasing Process
• Let the random variable X(t) denote the number oftransactions in a period of length t time units.
• At the individual-level, X(t) is assumed to bePoisson distributed with (exposure) rate parameterλt:
P(X(t) = x|λ) = (λt)xe−λt
x!
• Transaction rates (λ) are distributed across thepopulation according to a gamma distribution:
g(λ) = αrλr−1e−αλ
Γ(r)
Modelling the Purchasing Process
• The distribution of transactions for arandomly-chosen individual is given by:
P(X(t) = x) =∫∞0P(X(t) = x|λ)g(λ)dλ
= Γ(r + x)Γ(r)x!
(α
α+ t
)r ( tα+ t
)x
This is called the Negative Binomial Distribution, orNBD model.
• The mean of the NBD is given by E[X(t)] = rt/α.
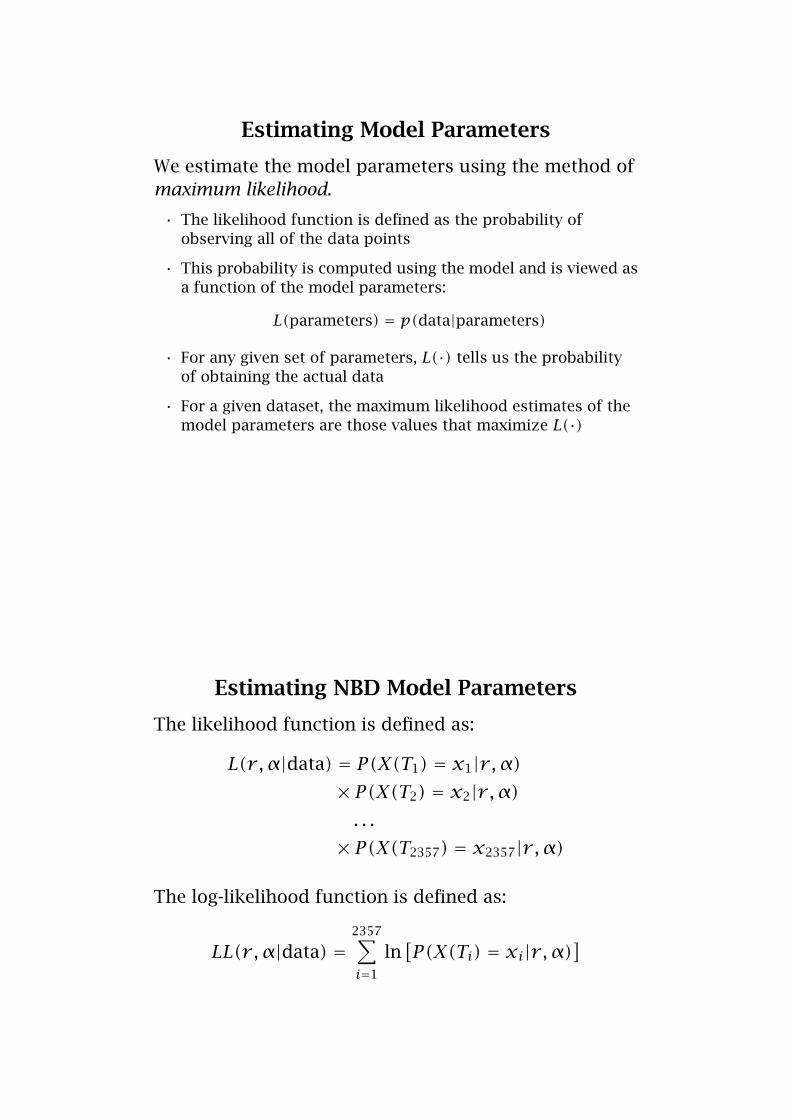
Estimating Model Parameters
We estimate the model parameters using the method ofmaximum likelihood.
• The likelihood function is defined as the probability ofobserving all of the data points
• This probability is computed using the model and is viewed asa function of the model parameters:
L(parameters) = p(data|parameters)
• For any given set of parameters, L(·) tells us the probabilityof obtaining the actual data
• For a given dataset, the maximum likelihood estimates of themodel parameters are those values that maximize L(·)
Estimating NBD Model Parameters
The likelihood function is defined as:
L(r ,α|data) = P(X(T1) = x1|r ,α)× P(X(T2) = x2|r ,α). . .
× P(X(T2357) = x2357|r ,α)
The log-likelihood function is defined as:
LL(r ,α|data) =2357∑i=1ln[P(X(Ti) = xi|r ,α)
]
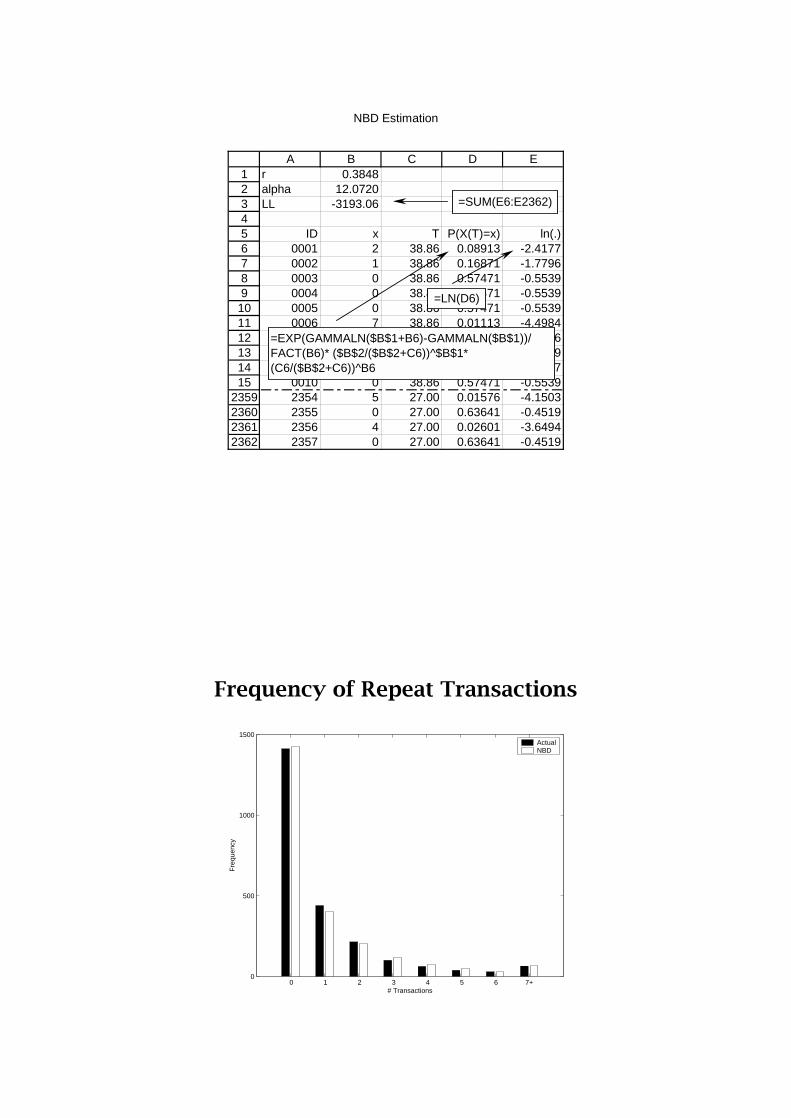
NBD Estimation
123456789101112131415
2359236023612362
A B C D Er 0.3848alpha 12.0720LL -3193.06
ID x T P(X(T)=x) ln(.)0001 2 38.86 0.08913 -2.41770002 1 38.86 0.16871 -1.77960003 0 38.86 0.57471 -0.55390004 0 38.86 0.57471 -0.55390005 0 38.86 0.57471 -0.55390006 7 38.86 0.01113 -4.49840007 1 38.86 0.16871 -1.77960008 0 38.86 0.57471 -0.55390009 2 38.86 0.08913 -2.41770010 0 38.86 0.57471 -0.55392354 5 27.00 0.01576 -4.15032355 0 27.00 0.63641 -0.45192356 4 27.00 0.02601 -3.64942357 0 27.00 0.63641 -0.4519
=EXP(GAMMALN($B$1+B6)-GAMMALN($B$1))/FACT(B6)* ($B$2/($B$2+C6))^$B$1*(C6/($B$2+C6))^B6
=LN(D6)
=SUM(E6:E2362)
Frequency of Repeat Transactions
0 1 2 3 4 5 6 7+0
500
1000
1500
# Transactions
Fre
quen
cy
ActualNBD
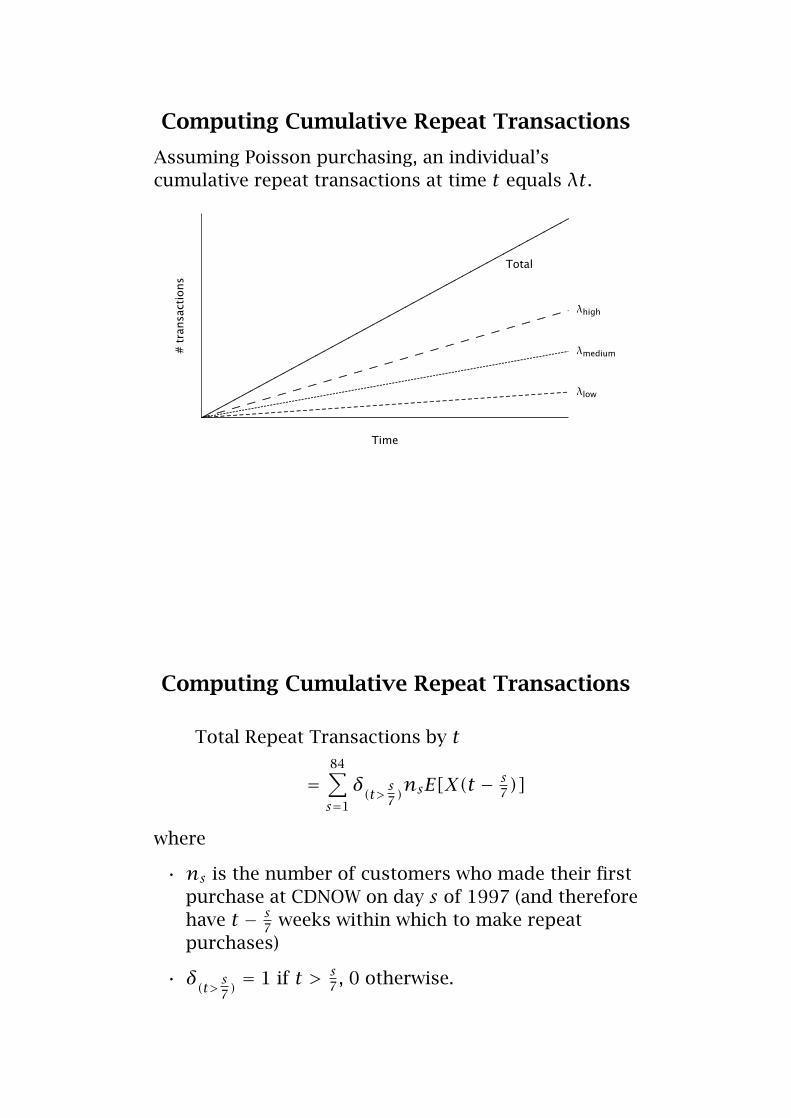
Computing Cumulative Repeat Transactions
Assuming Poisson purchasing, an individual’scumulative repeat transactions at time t equals λt.
Time
#transactions
..................................
..................................
..................................
...................................
..................................
..................................
..................................
...................................
..................................
..................................
...................................
..................................
..................................
..................................
...................................
..................................
..................................
...................................
..................................
........................
Total
............. ............. ............. ............. ............. ............. ............. ............. ............. ............. ............. ............. ............. ............. ............. ............. ............. ............. ............. ............. ............. ............. ............. ............. . λhigh
....................................................................................................................................
....................................................................................................................................
.................................................................................... λlow
......................................................
......................................................
......................................................
......................................................
......................................................
......................................................
............................ λmedium
Computing Cumulative Repeat Transactions
Total Repeat Transactions by t
=84∑s=1
δ(t> s7 )nsE[X(t − s
7)]
where
• ns is the number of customers who made their firstpurchase at CDNOW on day s of 1997 (and thereforehave t − s
7 weeks within which to make repeatpurchases)
• δ(t> s7 )= 1 if t > s
7 , 0 otherwise.
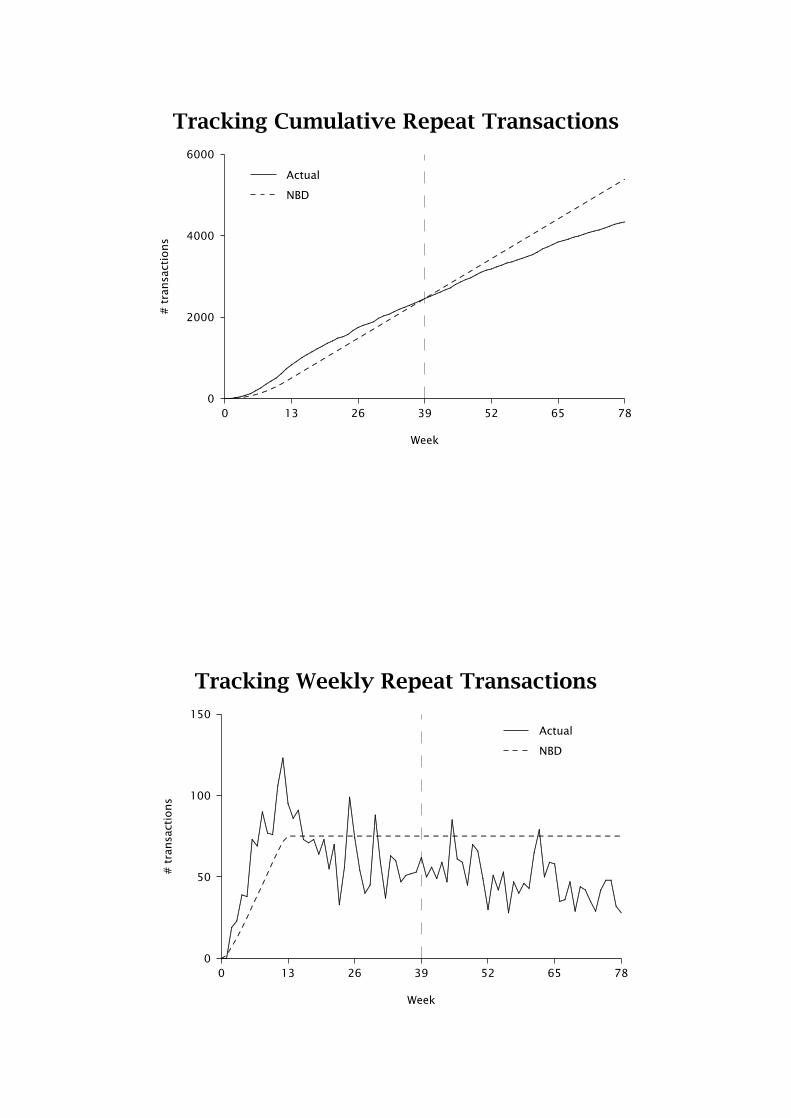
Tracking Cumulative Repeat Transactions
0 13 26 39 52 65 78
Week
0
2000
4000
6000#transactions
.............................................................
..............................
......................................................................
..................................
..........................................
..................................
.......................................
..........................................
........................................
......................................
.......................................
...............................................
...................................................
.....................................
.....................................................
......................................................
.....................
Actual
........ ........ ........ ................ .....
... ........ .......
. ........ .......
. ........ .......
. ........ .......
. ........ .......
. ........ .......
. ........ .......
. ........ .......
. ........ .......
. ........ .......
. ........ .......
. ........ .......
. ........ .......
. ........ .......
. ........ .......
. ........ .......
. ........ .......
. ........ .......
. ........ .......
. ........ .......
. ........ .......
. ..
NBD
Tracking Weekly Repeat Transactions
0 13 26 39 52 65 78
Week
0
50
100
150
#transactions
...............................................................................................................................................................................................................................................................................................................................................
........
........
........
........
........
........
........
........
.........
.....................................................................................................................................................
.................................................................................................................................................................................................................................................................................................................................................................................................................................................................................................................................................................................................................................................................
..................................................................................................................................................................................................................................................................
........
........
........
........
........
........
........
....................................................................................
.................................................................
...............................................................................................................................................................................................................................................................................................................
........
........
........
........
........
........
........
............................................................................................................................................................................................................................................................................................................................................................................
...........................................................................................................................................................................................................................................................................................................
.......................................................................................................................................................................
..............................................................................................................
Actual
................................................................................................................................ ........ ........ ........ ........ ........ ........ ........ ........ ........ ........ ........ ........ ........ ........ ........ ........ ........ ........ ........ ........ ........ ........ ........ ........ ........ ........ ........ ........ ........ ........ ........ ........ ........ ........
NBD
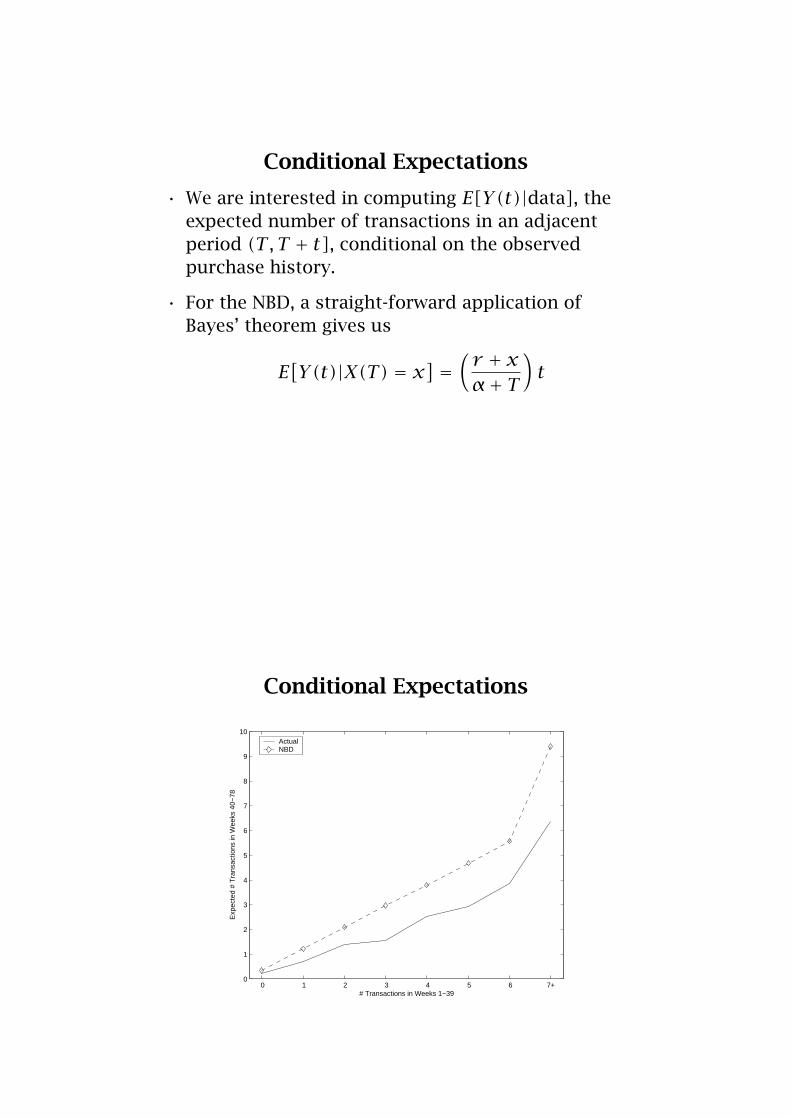
Conditional Expectations
• We are interested in computing E[Y(t)|data], theexpected number of transactions in an adjacentperiod (T , T + t], conditional on the observedpurchase history.
• For the NBD, a straight-forward application ofBayes’ theorem gives us
E[Y(t)|X(T) = x
] = ( r + xα+ T
)t
Conditional Expectations
0 1 2 3 4 5 6 7+0
1
2
3
4
5
6
7
8
9
10
# Transactions in Weeks 1−39
Exp
ecte
d #
Tra
nsac
tions
in W
eeks
40−
78
ActualNBD
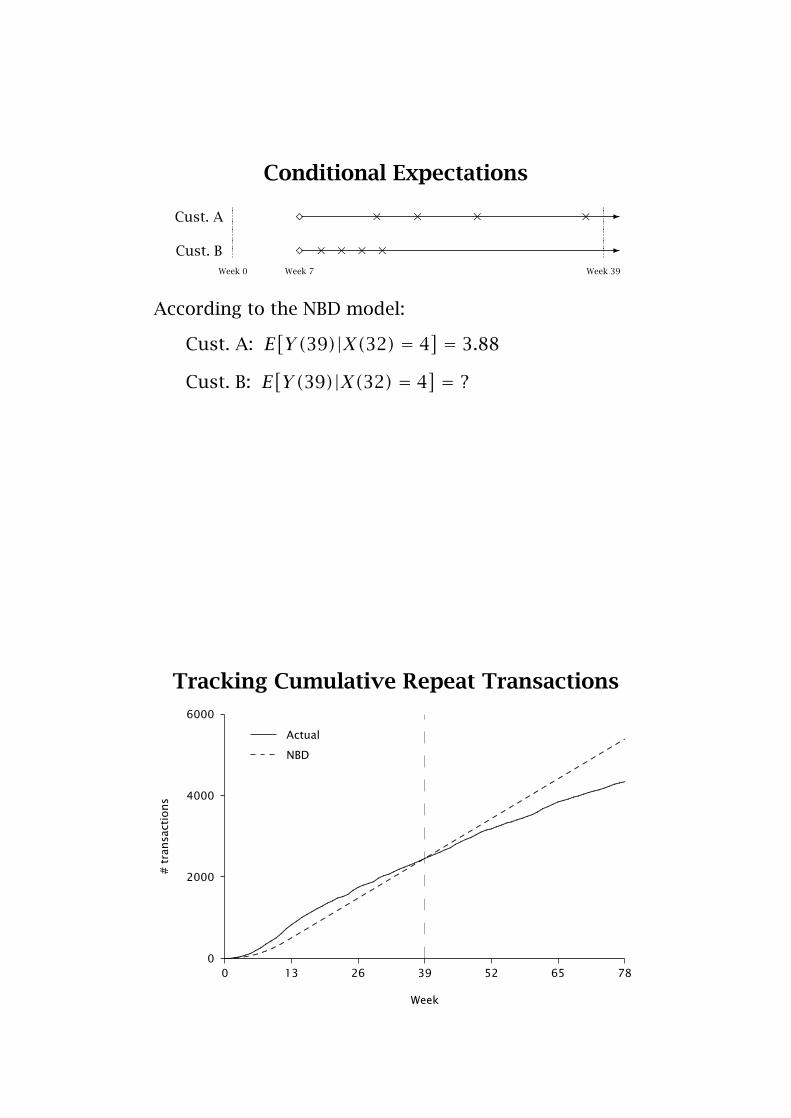
Conditional Expectations
Cust. A � ✲× × × ×
Cust. B � ✲× × × ×Week 0 Week 7 Week 39
According to the NBD model:
Cust. A: E[Y(39)|X(32) = 4] = 3.88
Cust. B: E[Y(39)|X(32) = 4] = ?
Tracking Cumulative Repeat Transactions
0 13 26 39 52 65 78
Week
0
2000
4000
6000
#transactions
.............................................................
..............................
......................................................................
..................................
..........................................
..................................
.......................................
..........................................
........................................
......................................
.......................................
...............................................
...................................................
.....................................
.....................................................
......................................................
.....................
Actual
........ ........ ........ ................ .....
... ........ .......
. ........ .......
. ........ .......
. ........ .......
. ........ .......
. ........ .......
. ........ .......
. ........ .......
. ........ .......
. ........ .......
. ........ .......
. ........ .......
. ........ .......
. ........ .......
. ........ .......
. ........ .......
. ........ .......
. ........ .......
. ........ .......
. ........ .......
. ........ .......
. ..
NBD
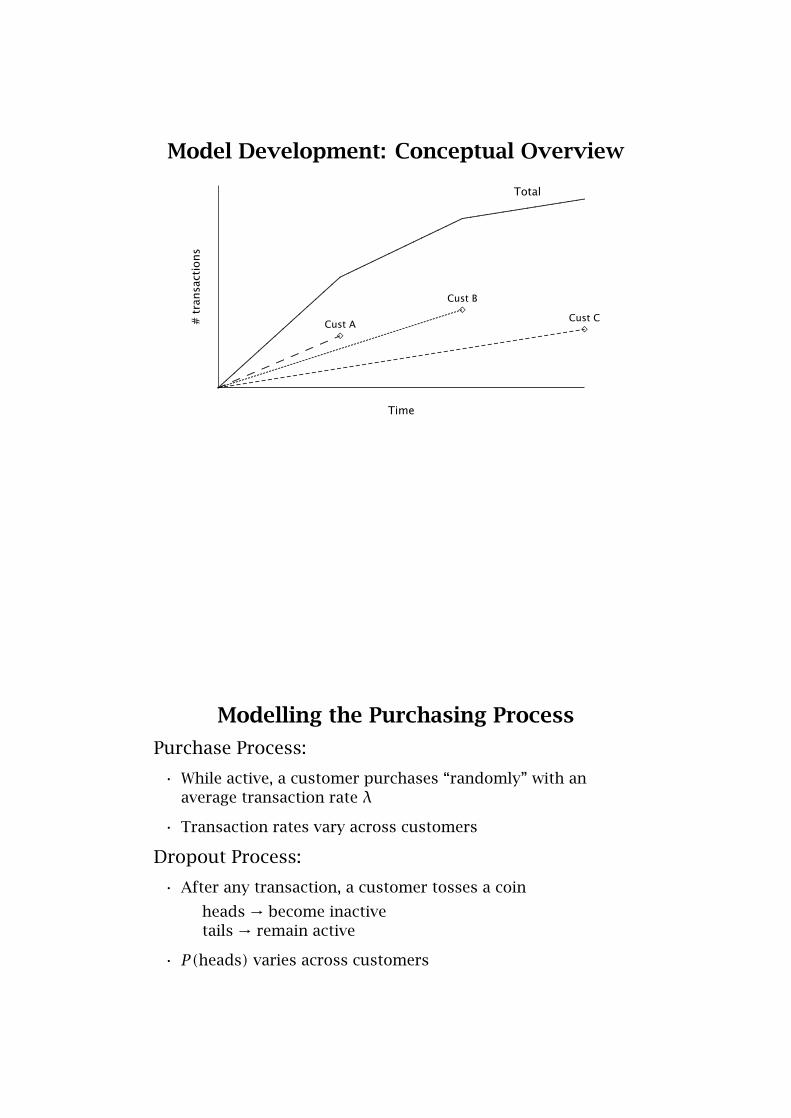
Model Development: Conceptual Overview
Time
#transactions
...........................................................................................................................................................................................................................................................................................
.......................................
.......................................
......................................
.......................................
......................................
....................................................................
..................................................................................................
................................................Total
..........................
..........................
..........................
..........................
.........�Cust A
............................................................
............................................................
............................................................
............................................................
............................................................
....................................................�Cust C
..............................
..............................
..............................
..............................
..............................
..............................
..............................
..............................
...�Cust B
Modelling the Purchasing Process
Purchase Process:
• While active, a customer purchases “randomly” with anaverage transaction rate λ
• Transaction rates vary across customers
Dropout Process:
• After any transaction, a customer tosses a coin
heads → become inactivetails → remain active
• P(heads) varies across customers

The BG/NBD Model
Purchase Process:
• While active, # transactions made by a customer follows aPoisson process with transaction rate λ.
• Heterogeneity in transaction rates across customers isdistributed gamma(r ,α).
Dropout Process:
• After any transaction, a customer becomes inactive withprobability p.
• Heterogeneity in dropout probabilities across customers isdistributed beta(a,b).
Model Illustration: Within CustomerProb.
� p(1− p)2× × ×✛ ✲λ ✛ ✲0
� ✲ (1− p)3× × ×✛ ✲λ
0 T
• More generally,
L(λ,p | t1,t2, . . . , tx, T)= (1− p)xλxe−λT + δx>0 p(1− p)x−1λxe−λtx
where δx>0 = 1 if x > 0, 0 otherwise
• No need for the complete purchase history; “recency”and “frequency” are sufficient summary statistics

Purchase Histories
ID = 0001 � ✲× ×
ID = 0002 � ✲×...
...ID = 1178 � ✲×
ID = 1179 � ✲...
...ID = 2356 � ✲× ×× ×
ID = 2357 � ✲
Week 0 Week 39
Raw Data
1234567891011121314151617181920
1178117911801181235623572358
A B C DID x t_x T
0001 2 30.43 38.860002 1 1.71 38.860003 0 0.00 38.860004 0 0.00 38.860005 0 0.00 38.860006 7 29.43 38.860007 1 5.00 38.860008 0 0.00 38.860009 2 35.71 38.860010 0 0.00 38.860011 5 24.43 38.860012 0 0.00 38.860013 0 0.00 38.860014 0 0.00 38.860015 0 0.00 38.860016 0 0.00 38.860017 10 34.14 38.860018 1 4.86 38.860019 3 28.29 38.711177 0 0.00 32.711178 1 8.86 32.711179 0 0.00 32.711180 0 0.00 32.712355 0 0.00 27.002356 4 26.57 27.002357 0 0.00 27.00

Model Likelihood Function
For a randomly-chosen customer with x transactions inthe period (0, T ], the last occurring at tx:
L(r ,α,a, b |X = x, tx, T) = A1 · A2 · (A3 + δx>0 A4)
whereA1 = Γ(r + x)αr
Γ(r)
A2 = Γ(a+ b)Γ(b + x)Γ(b)Γ(a+ b + x)
A3 =( 1α+ T
)r+xA4 =
( ab + x − 1
)( 1α+ tx
)r+x
BGNBD Estimation
1234567891011121314151617
236223632364
A B C D E F G H Ir 0.243alpha 4.414a 0.793b 2.426LL -9582.4
ID x t_x T ln(.) ln(A_1) ln(A_2) ln(A_3) ln(A_4)0001 2 30.43 38.86 -9.4596 -0.8390 -0.4910 -8.4489 -9.42650002 1 1.71 38.86 -4.4711 -1.0562 -0.2828 -4.6814 -3.37090003 0 0.00 38.86 -0.5538 0.3602 0.0000 -0.9140 0.00000004 0 0.00 38.86 -0.5538 0.3602 0.0000 -0.9140 0.00000005 0 0.00 38.86 -0.5538 0.3602 0.0000 -0.9140 0.00000006 7 29.43 38.86 -21.8644 6.0784 -1.0999 -27.2863 -27.86960007 1 5.00 38.86 -4.8651 -1.0562 -0.2828 -4.6814 -3.90430008 0 0.00 38.86 -0.5538 0.3602 0.0000 -0.9140 0.00000009 2 35.71 38.86 -9.5367 -0.8390 -0.4910 -8.4489 -9.74320010 0 0.00 38.86 -0.5538 0.3602 0.0000 -0.9140 0.00002355 0 0.00 27.00 -0.4761 0.3602 0.0000 -0.8363 0.00002356 4 26.57 27.00 -14.1284 1.1450 -0.7922 -14.6252 -16.49022357 0 0.00 27.00 -0.4761 0.3602 0.0000 -0.8363 0.0000
=SUM(E8:E2364)
=GAMMALN(B$1+B8)-GAMMALN(B$1)+B$1*LN(B$2)
=IF(B8>0,LN(B$3)-LN(B$4+B8-1)-(B$1+B8)*LN(B$2+C8),0)
=-(B$1+B8)*LN(B$2+D8)
=F8+G8+LN(EXP(H8)+(B8>0)*EXP(I8)) =GAMMALN(B$3+B$4)+GAMMALN(B$4+B8)-GAMMALN(B$4)-GAMMALN(B$3+B$4+B8)

Frequency of Repeat Transactions
0 1 2 3 4 5 6 7+0
500
1000
1500
# Transactions
Fre
quen
cy
ActualBG/NBD
Computing Expected # Transactions
Unconditional: E(X(t) | r ,α,a, b)a+ b − 1a− 1
[1−
(α
α+ t
)r2F1
(r , b;a+ b − 1; t
α+t)]
Conditional: E(Y(t) |X = x, tx, T , r ,α,a, b)
a+ b + x − 1a− 1
[1−
(α+ T
α+ T + t
)r+x2F1
(r + x,b + x;a+ b + x − 1; t
α+T+t)]
1+ δx>0a
b + x − 1(α+ Tα+ tx
)r+x
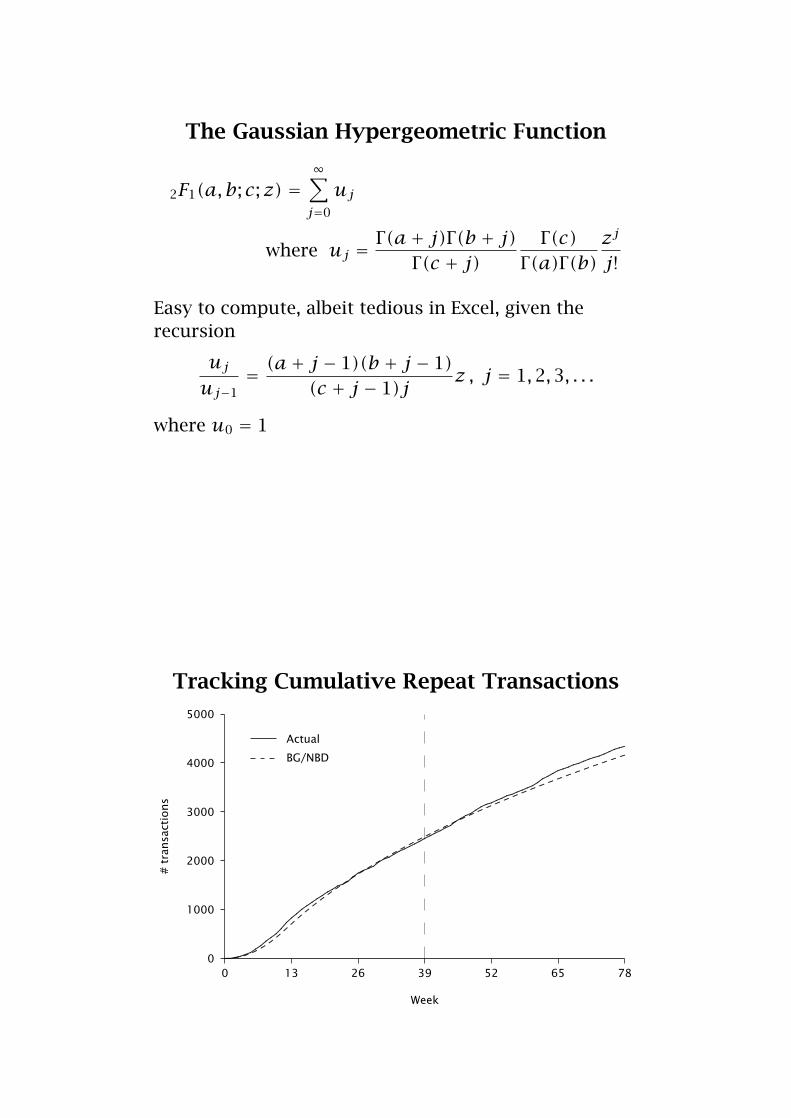
The Gaussian Hypergeometric Function
2F1(a, b; c;z) =∞∑j=0
uj
where uj = Γ(a+ j)Γ(b + j)Γ(c + j)
Γ(c)Γ(a)Γ(b)
zj
j!
Easy to compute, albeit tedious in Excel, given therecursion
uj
uj−1= (a+ j − 1)(b + j − 1)
(c + j − 1)j z , j = 1,2,3, . . .
where u0 = 1
Tracking Cumulative Repeat Transactions
0 13 26 39 52 65 78
Week
0
1000
2000
3000
4000
5000
#transactions
........................................................
..................................................................................................................................................................
.....................................................................
..................................
...................................
....................................
...................................
.................................
..................................
..........................................
.............................................
.................................
.........................................
................................................
.............................................
.......Actual
........ ........ ................ ..
...... ........................................................
................
................
................
................ .
....... ........ ...
..... ........ .......
. ................ ...
..... ........ ........
........ ........ ........
........ ........ ........
........ ........ ........
........ ........ ........
........ ................ ........
........ ........BG/NBD

Tracking Weekly Repeat Transactions
0 13 26 39 52 65 78
Week
0
50
100
150#transactions
...............................................................................................................................................................................................................................................................................................................................................
........
........
........
........
........
........
........
........
.........
.....................................................................................................................................................
.................................................................................................................................................................................................................................................................................................................................................................................................................................................................................................................................................................................................................................................................
..................................................................................................................................................................................................................................................................
........
........
........
........
........
........
........
....................................................................................
.................................................................
...............................................................................................................................................................................................................................................................................................................
........
........
........
........
........
........
........
............................................................................................................................................................................................................................................................................................................................................................................
...........................................................................................................................................................................................................................................................................................................
.......................................................................................................................................................................
..............................................................................................................
Actual
................................................................................................................................................................................................ ........ ........ ........ ........ ........ ........ ........ ........ ........ ........ ........ ........ ........ ........ ........ ........ ........ ........ ........ ........ ........ ........ ........ ........ ........ ........ ........ ........ ........ ........ ........ ........
BG/NBD
Conditional Expectations
ID = 0001 � ✲× × 1.23
ID = 0002 � ✲× 0.20
......
ID = 1178 � ✲× 0.50
ID = 1179 � ✲ 0.22
......
ID = 2356 � ✲× ×× × 3.49
ID = 2357 � ✲ 0.26
Week 0 Week 39
E(Y(39)|X = x, tx , T)

Conditional Expectations
0 1 2 3 4 5 6 7+0
1
2
3
4
5
6
7
8
# Transactions in Weeks 1−39
Exp
ecte
d #
Tra
nsac
tions
in W
eeks
40−
78
ActualBG/NBD
Conditional Expectations
Frequency
RecencyHighLow
High
Low
“high”
value
“medium”value
“low”value

Conditional Expectations
5 10 15 20 25 30 35 40
2
4
6
8
10
12
14
16
18
tx
X1
E[X2|X
1=x,t
x]
0.5
0.5
0.5
1
1
1
1
2
2
2
2
3
3
3
4
4
45
56
6
7
7
8
8
9
10
11
0
10
20
30
40
0
5
10
15
200
2
4
6
8
10
12
14
tx
E[X2|X
1=x,t
x]
X1
The “Increasing Frequency” Paradox
For people with “low” recency, higher frequencyis a bad thing.
Who is a better customer?
Cust. A � ✲× ×
Cust. B � ✲× ×× ××Week 0 Week 7 Week 39
Conclusions
• Static models (NBD) are inadequate for customerbase analysis
• Key is to capture the idea that customers becomeinactive
• Recency and frequency seem to provide enoughinformation to capture the whole process (no needfor the complete purchase histories)
• Usefulness of “iso-value” contours to understandtradeoffs between recency and frequency
Part 3
Links to the Broader Literature

“Simple” versus “Correct” Models
• The depth-of-repeat model is easy to implement andyields good forecasts of aggregate purchasingbehavior
• Using separate submodels for trial, first repeat,second repeat, and so on, that fail to consider anindividual’s complete purchasing history may yieldbiased insights into underlying customer behavior.
• Apparent dynamics may not be ...
“Simple” versus “Correct” Models
Illustration:
• Let us fit the basic DoR model to 24 weeks ofpurchasing data generated for 1500 people using anNBD model with r = 0.5 and α = 40
• An excellent fit to the data, with parameterestimates
p1 θFR p∞ γ θAR0.483 0.085 0.900 0.442 0.132

Implied Depth-of-Repeat Curves
0 13 26 39 52
Time Since Last Purchase
0.0
0.2
0.4
0.6
0.8
1.0P(purchase)
..............................................................................................................................
.................................
.........................................
.................................................
........................................................................
.........................................................................................................................................
............................................................................................................................................................................................................................................................ j = 1
..............................................................................................................................................................................
....................................
.................................................
................................................................................................
.............................................................................................................................................................................................................................................................................................................................................................................................. j = 2
...................................................................................................................................................................................................................................
....................................
.................................................
....................................................................................................
.................................................................................................................................................................................................................................................................................................................................................................. j = 3
..................................................................................................................................................................................................................................................................
....................................
.................................................
....................................................................................................
....................................................................................................................................................................................................................................................................................................................................................... j = 4
.........................................................................................................................................................................................................................................................................................
....................................
.................................................
....................................................................................................
................................................................................................................................................................................................................................................................................................................................................ j = 5
“Simple” versus “Correct” Models
• The “correct” way to model such a multiple-eventtiming process is to first condition on the individual,incorporate any effects of nonstationarity, and thenbring in cross-sectional heterogeneity.
• Fader et al.’s (2004) “dynamic changepoint” model
– a generalization of the BG/NBD model
– difficult to implement, requiring data on the timing ofeach individual’s purchases and specialist modellingenvironments
– minor improvements in forecast accuracy may notoutweigh the incremental cost of implementation

Models for Customer Base AnalysisClassifying Purchasing Processes (SMC 1987)
CPG purchases
Visits to doctor
Cable TV
Bank accounts
Church attendanceTV viewing
Magazine subs
HMO membership
Continuous/
Unobserved
Discrete/
Observed
Opportunities forTransactions
Unobserved Observed
Time At Which Customers Become Inactive