forecast tnuos tariffs for 2018/19 - national grid plc · transmission network use of system...
TRANSCRIPT
NGET: Forecast TNUoS Tariffs for 2018/19 June 2017 1
Forecast TNUoS
Tariffs for 2018/19
June 2017
June 2017
Forecast TNUoS Tariffs for 2018/19
This information paper provides National Grid’s June Forecast Transmission Network Use of System (TNUoS) tariffs for 2018/19, applicable to transmission connected Generators and Suppliers, effective from 1 April 2018. June 2017
NGET: Forecast TNUoS Tariffs for 2018/19 June 2017 3
Contents
Executive Summary 5
Demand Tariffs 8
1.1. Changes Since The Previous Demand Tariffs Forecast 8
1.2. Half-Hourly Demand Tariffs 8
1.3. Non Half-Hourly demand tariffs 10
Generation Tariffs 12
1.4. Wider Generation Tariffs 12
1.5. Changes Since The Last Generation Tariffs Forecast 12
Local Substation and Circuit Tariffs for generation 15
2.1. Onshore Local Substation Tariffs 15
2.2. Onshore Local Circuit Tariffs 15
Offshore Local Tariffs 16
3.1. Offshore local generation tariffs 16
Background to TNUoS Charging 18
4.1. Generation Charging Principles 18
4.2. Demand Charging Principles 19
4.3. HH Demand Tariffs 19
4.4. NHH Demand Tariffs 19
4.5. CMP264/265 20
Updates To Revenue & The Charging Model Since The Last Forecast 21
5.1. Changes affecting the locational element of tariffs 21
5.2. Adjustments for Interconnectors 21
5.3. RPI 22
Expansion Constant 22
Local substation and offshore substation tariffs 22
5.4. Allowed Revenues 22
National Grid Electricity Transmission’s deferral of £480m of RIIO-T1 allowances 23
5.5. Generation: Demand (G/D) Split 23
Exchange Rate 23
Generation Output 24
Error Margin 24
5.6. Charging bases for 2018/19 24
Generation 24
Demand 24

NGET: Forecast TNUoS Tariffs for 2018/19 June 2017 4
5.7. Annual Load Factors 25
5.8. Generation and Demand Residuals 25
5.9. Small Generators Discount 26
Tools and Supporting Information 28
Appendices 29
Appendix A: Locational Demand Charges 30
6.1. Locational Demand Charges 30
Appendix B: Breakdown of Demand Tariffs 31
Appendix C: Annual Load Factors 32
7.1. ALFs 32
Appendix D: Generation Changes Since The February Forecast 38
Appendix E: Transmission Company Revenues 39
8.1. National Grid TO Revenue Forecast 39
8.2. Scottish Power Transmission Revenue Forecast 40
8.3. SHE Transmission Revenue Forecast 41
8.4. Offshore Transmission Owner Revenues 41
Appendix F: Generation Zones Map 43
Appendix G: Demand Zones Map 44
44
Contact Us
If you have any comments or questions on the contents or format of this report, please don’t hesitate to get in touch with us.
Team Email & Phone [email protected] 01926 654633
NGET: Forecast TNUoS Tariffs for 2018/19 June 2017 5
Executive Summary
This document contains the latest
draft of the Transmission Network
Use of System (TNUoS) tariffs for
2018/19, which will become
effective on 1 April 2018. TNUoS
charges are paid by transmission
connected generators and
suppliers for use of the GB
Transmission networks.
Total Revenues to be recovered
Total Transmission Owner (TO)
allowed revenue to be recovered from
TNUoS charges is forecast to be
£2,820m in 2018/19, a decrease of
£13m from the five year forecast
published in February 2017.
Generation Tariffs
Generation tariffs have been set to
recover £430.1m to ensure average
annual generation tariffs remain
below the €2.5/MWh limit set by
European Commission Regulation
(EU) No 838/2010. This is a £3.2m
increase in generation revenue
compared to the February forecast,
which reflects an increase in the
forecast generation output. However,
this is offset by an increase in the
generation charging base of circa
3GW and an increase in the Euro
exchange rate, resulting in an overall
average decrease of £0.21/kW to
generation tariffs. The Error Margin
element of the tariff forecast which is
used to calculate the split of revenue
to be recovered from generation and
demand (the G/D split) remains fixed
at 21%.
Demand Tariffs
Demand tariffs have been set to
recover £2,389.6m of revenue, a
decrease of £17m from the February
forecast. This reflects the above
reduction in overall revenue for GB
Transmission Owners, and the
increased proportion of revenue to be
collected from generators.
Modelling Changes
We have further developed our
demand forecasting capability that we
began in 2016/17. The demand
model takes into account the
significant increase in distributed
generation in recent years and its
potential variability. For 2018/19 we
are forecasting average triad demand
of 46 GW, average Half-Hour (HH)
triad demand of 13.2GW and Non-
Half-Hour (NHH) demand of
24.2TWh.
These chargeable demand numbers,
G/D split and updated TO revenues
mean that the average HH demand
tariff has reduced by £0.57/kW and
the average NHH demand tariff has
increased by 0.05p/kWh compared to
the February forecast.
NGET: Forecast TNUoS Tariffs for 2018/19 June 2017 6
Drivers of changes to the Tariff
forecast
Changes to these forecast tariffs in
relation to our February tariff forecast
have predominantly been influenced
by a reduction in total revenue and a
new demand forecast, which has
altered the balance between HH and
NHH demand. Updated generation
output data and the forecast £:€
exchange rate from the OBR Spring
Forecast have further changed the
proportions of revenue to be
recovered from generaton and
demand.
CMP264/265 and future changes to
the methodology
Please note that this tariff forecast
has been undertaken in accordance
with the current CUSC charging
methodology and therefore no current
charging modifications are taken into
account in these tariffs. There has not
been enough time since Ofgem’s
recent decision on CMP264/2651 for
us to recalculate these tariffs in
accordance with the new
methodology, however we have
revised our forecasts schedule and
will publish our first tariff forecast in
compliance with CMP264/265 in
October 2017.2 More details on
ongoing charging modifications can
1https://www.ofgem.gov.uk/system/files/docs/2017/06/impa
ct_assessment_and_decision_on_industry_cmp264265.pdf
2 Our revised forecast publication timetable is available on
our website: http://www2.nationalgrid.com/WorkArea/DownloadAsset.as
px?id=8589940926
be found on the National Grid
website3.
CMP282
We are also aware of an issue with
the methodology leading to a
potentially incorrect signal in the Final
Zonal Locational Demand Tariff. This
is currently manifesting itself in North
Scotland (Zone 1), where the
locational demand tariff, when
calculated, is being affected by nodes
which are exporting. The calculation
in the methodology requires taking a
zonal weighted demand, and this is
affecting the cost reflectivity of the
final tariffs.
To address this issue, CUSC
Modification CMP282 - The Effect
Negative Demand has on Zonal
Locational Demand Tariffs has been
raised by National Grid at the June
CUSC Panel. The modification is
proposed to be treated as urgent,
with a view to revising the charging
methodology from 1 April 2018, and
be reflected in our tariff forecasts later
this year.
Feedback
This tariff forecast is the first in our
new report format, which has been
redesigned in order to be easier to
navigate and read for all interested
parties. We welcome feedback on
any aspect of this document and the
3 Please find further information here:
http://www2.nationalgrid.com/UK/Industry-information/Electricity-codes/CUSC/Modifications/Current/

NGET: Forecast TNUoS Tariffs for 2018/19 June 2017 7
tariff setting processes. Do let us
know if you have any further
suggestions as to how we can better
work with you to improve the tariff
forecasting process, if you have any
questions on this document or
whether you still welcome webinar
sessions following each forecast.
Next forecast
Following the Ofgem decision on
CMP264/265, NGET will publish the
new “Avoided GSP Infrastructure
Credit” (AGIC) figure in September,
which will then be used in the
forecast for 2018/19 tariffs in October
2017 and also for tariffs in the
updated five year forecast due to be
published in November 2017.
Following this, we will publish draft
tariffs in December 2017 and final
tariffs in January 2018.
The latest timetable can be found on
our website.4
4 Our revised forecast publication timetable is available on
our website: http://www2.nationalgrid.com/WorkArea/DownloadAsset.as
px?id=8589940926
NGET: Forecast TNUoS Tariffs for 2018/19 June 2017 8
Demand Tariffs
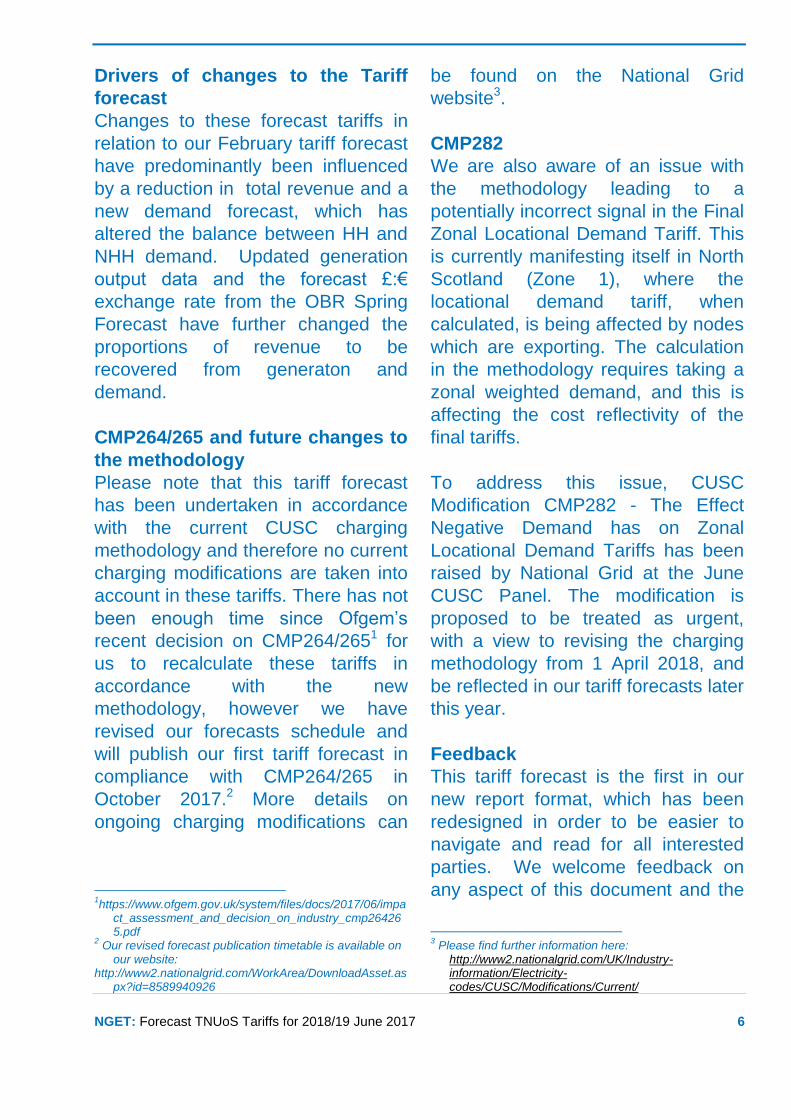
Table 1: Demand Tariffs
The breakdown of the HH tariff into the peak and year round components are found in Appendix A (page 30). Please note that these tariffs do not take into account the changes to the charging methodology directed by CMP264/265.
1.1. Changes Since The Previous Demand Tariffs
Forecast
On the whole, demand tariffs remain relatively stable when compared to those forecast in February, with the exception of certain zones which have felt the impact of reduced generation (HH), or a change to the demand forecast in that particular zone (NHH). The average HH tariff has reduced by £0.57/kW compared to February, and the average NHH tariff has increased by a modest 0.05p/kW. More information on the causes of specific zonal fluctuations are detailed in the HH and NHH sections below.
1.2. Half-Hourly Demand Tariffs
Table 2 and Figure 1 show the difference between the Half-Hourly (HH) demand tariffs forecast in February and this 2018/19 forecast in June.
Zone Zone NameHH Demand
Tariff (£/kW)
NHH Demand
Tariff (p/kWh)
1 Northern Scotland 52.136314 10.184611
2 Southern Scotland 33.996249 4.711528
3 Northern 43.488827 6.143092
4 North West 50.229757 6.512836
5 Yorkshire 49.861241 6.776159
6 N Wales & Mersey 51.571129 7.081867
7 East Midlands 52.800186 7.009019
8 Midlands 54.548379 7.115274
9 Eastern 54.385826 7.782534
10 South Wales 50.953376 6.519821
11 South East 57.217814 8.184488
12 London 59.695139 6.091993
13 Southern 58.571055 7.772624
14 South Western 58.296471 8.233390
Tariffs include small gen tariff of: 0.808401 0.109642
Residual charge for demand: 52.204555£
NGET: Forecast TNUoS Tariffs for 2018/19 June 2017 9
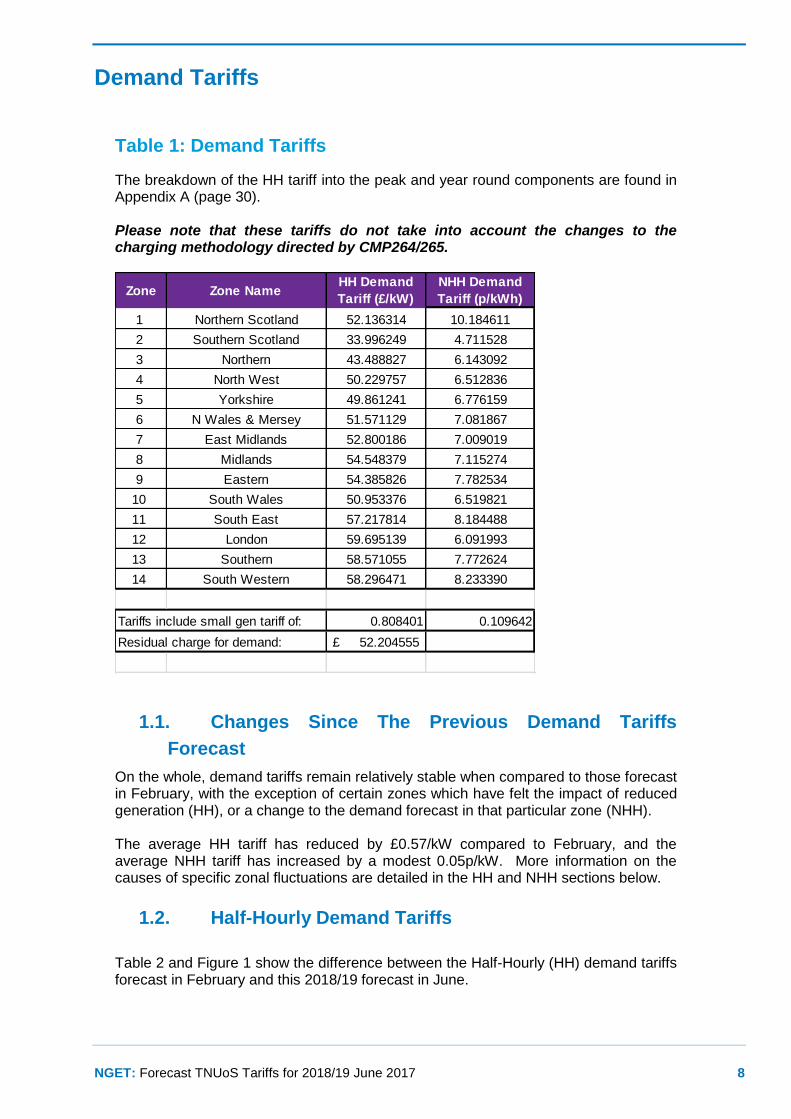
Table 2 - Change in HH Demand Tariffs
Figure 1 - Change in HH Demand Tariffs
Although the demand charging base has reduced slightly by 0.4GW, the average HH demand tariff has decreased by £0.57/kW. This is largely due to a decrease in the total revenue forecast to be recovered, as well as a decrease in the share of that revenue being recovered from demand customers compared to the February forecast.
Zone Zone Name
2018/19
Feb Forecast
(£/kW)
2018/19 June
(£/kW)Change (£/kW)
Change in
Residual (£/kW)
1 Northern Scotland 47.20 52.14 4.94 -0.04
2 Southern Scotland 32.07 34.00 1.93 -0.04
3 Northern 43.06 43.49 0.43 -0.04
4 North West 49.96 50.23 0.27 -0.04
5 Yorkshire 49.84 49.86 0.02 -0.04
6 N Wales & Mersey 51.29 51.57 0.28 -0.04
7 East Midlands 53.18 52.80 -0.38 -0.04
8 Midlands 54.49 54.55 0.06 -0.04
9 Eastern 54.95 54.39 -0.56 -0.04
10 South Wales 50.61 50.95 0.34 -0.04
11 South East 57.31 57.22 -0.09 -0.04
12 London 60.16 59.70 -0.46 -0.04
13 Southern 58.44 58.57 0.13 -0.04
14 South Western 56.89 58.30 1.41 -0.04
NGET: Forecast TNUoS Tariffs for 2018/19 June 2017 10
The decrease in demand share is a direct result of an increase in the share of revenue to be recovered from generation, which went up because of an increase in the forecast generation output assumptions used to calculate the €2.5/MWh cap on average annual generation tariffs. The residual element of the tariff has decreased very slightly by £0.04/kW. As the locational element of HH demand tariffs is typically very small compared to the residual element, changes to HH demand tariffs were therefore negligible in most zones. Exceptions to this were zones 1 and 2 (Scotland), which increased by £5/kW and £2/kW respectively due to the loss of generation from Peterhead, and zone 14 (Southwest), which increased by £1.40/kW due to the loss of generation from Rampion offshore wind farm and Taylors Lane. An additional 3GW of generation largely in the Midlands has shifted the concentration of generation volumes further towards the middle of England and Wales, affecting both the northern and southern extremities of the network..
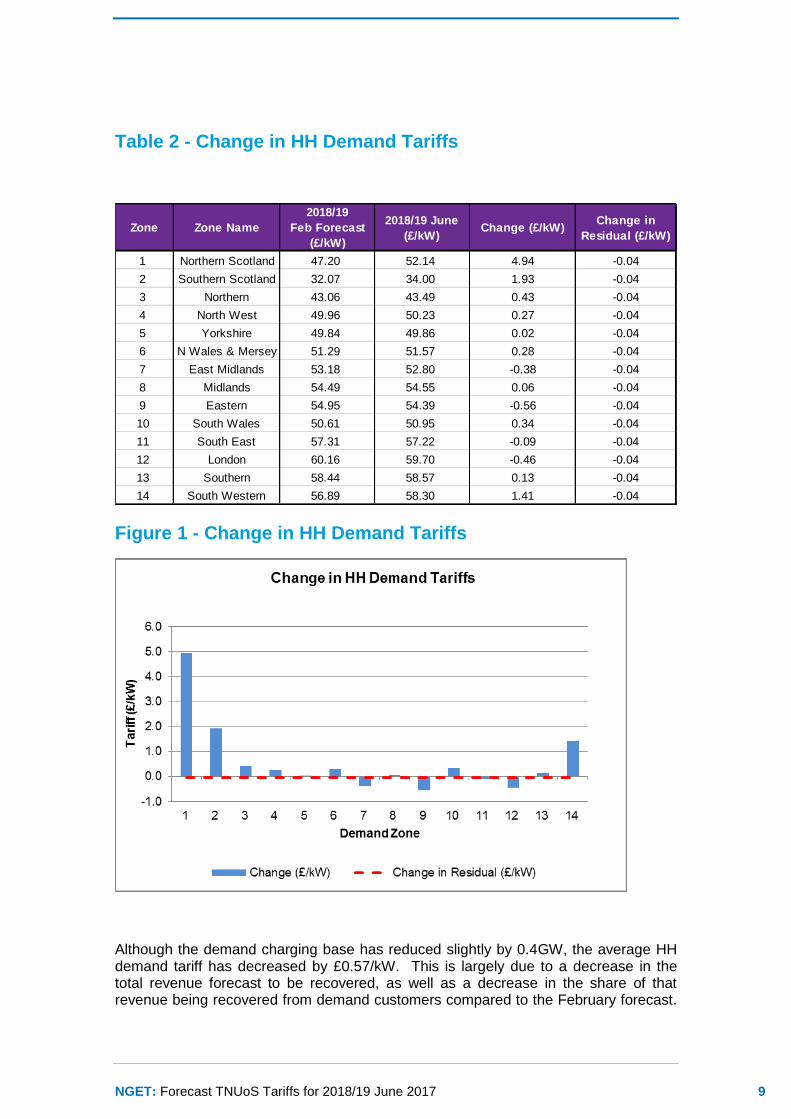
1.3. Non Half-Hourly demand tariffs
Table 3 and Figure 2 show the difference between the Non-Half-Hourly (NHH) demand tariffs forecast in February and this 2018/19 in June.
Table 3 - NHH Demand Tariff Changes
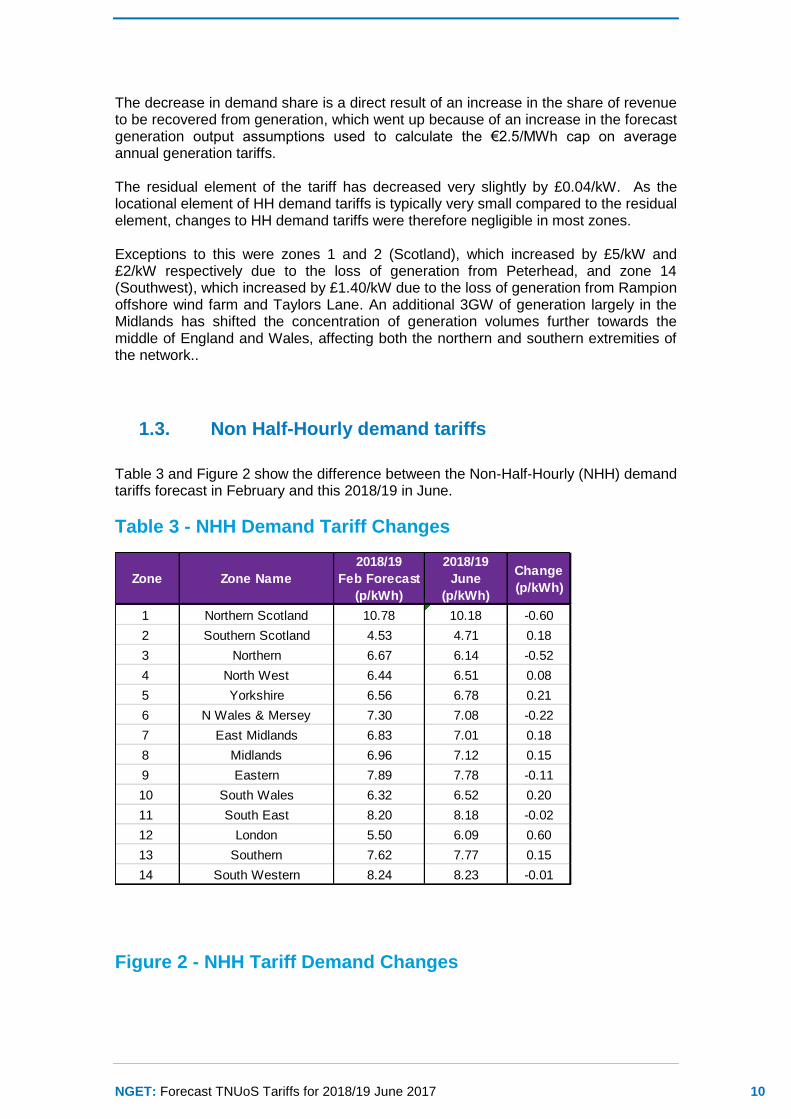
Figure 2 - NHH Tariff Demand Changes
Zone Zone Name
2018/19
Feb Forecast
(p/kWh)
2018/19
June
(p/kWh)
Change
(p/kWh)
1 Northern Scotland 10.78 10.18 -0.60
2 Southern Scotland 4.53 4.71 0.18
3 Northern 6.67 6.14 -0.52
4 North West 6.44 6.51 0.08
5 Yorkshire 6.56 6.78 0.21
6 N Wales & Mersey 7.30 7.08 -0.22
7 East Midlands 6.83 7.01 0.18
8 Midlands 6.96 7.12 0.15
9 Eastern 7.89 7.78 -0.11
10 South Wales 6.32 6.52 0.20
11 South East 8.20 8.18 -0.02
12 London 5.50 6.09 0.60
13 Southern 7.62 7.77 0.15
14 South Western 8.24 8.23 -0.01
NGET: Forecast TNUoS Tariffs for 2018/19 June 2017 11
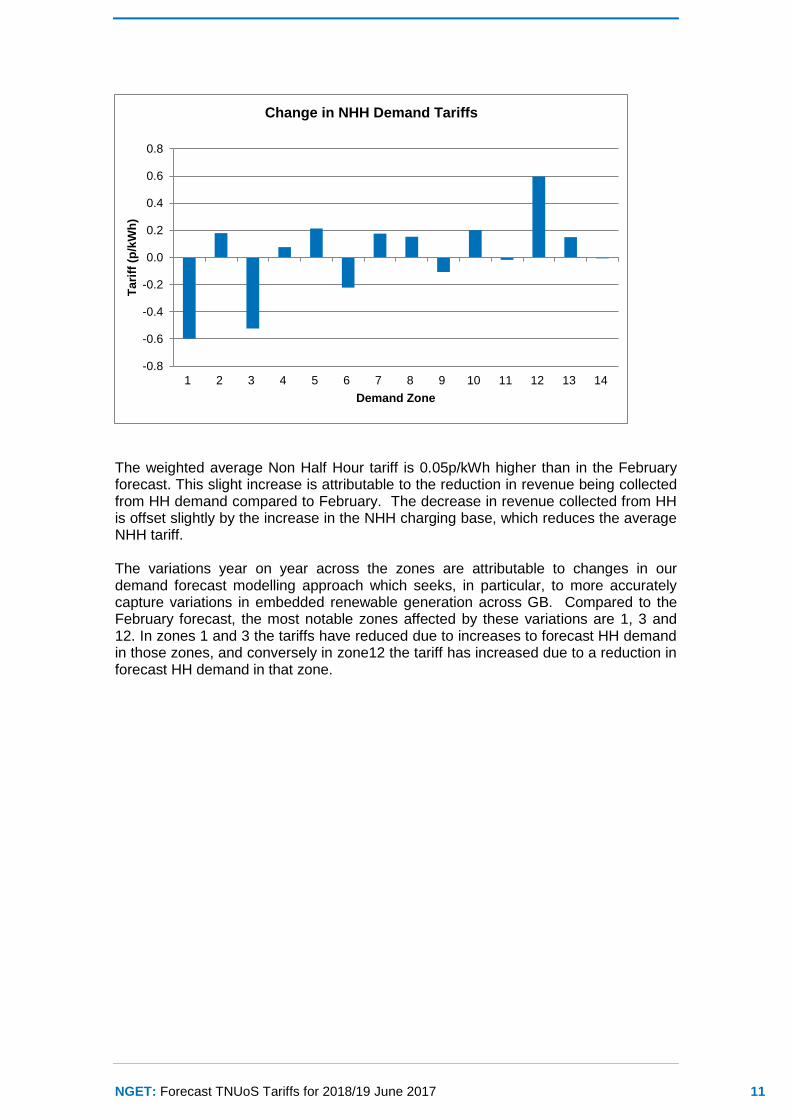
The weighted average Non Half Hour tariff is 0.05p/kWh higher than in the February forecast. This slight increase is attributable to the reduction in revenue being collected from HH demand compared to February. The decrease in revenue collected from HH is offset slightly by the increase in the NHH charging base, which reduces the average NHH tariff. The variations year on year across the zones are attributable to changes in our demand forecast modelling approach which seeks, in particular, to more accurately capture variations in embedded renewable generation across GB. Compared to the February forecast, the most notable zones affected by these variations are 1, 3 and 12. In zones 1 and 3 the tariffs have reduced due to increases to forecast HH demand in those zones, and conversely in zone12 the tariff has increased due to a reduction in forecast HH demand in that zone.
-0.8
-0.6
-0.4
-0.2
0.0
0.2
0.4
0.6
0.8
1 2 3 4 5 6 7 8 9 10 11 12 13 14
Ta
riff
(p
/kW
h)
Demand Zone
Change in NHH Demand Tariffs
NGET: Forecast TNUoS Tariffs for 2018/19 June 2017 12
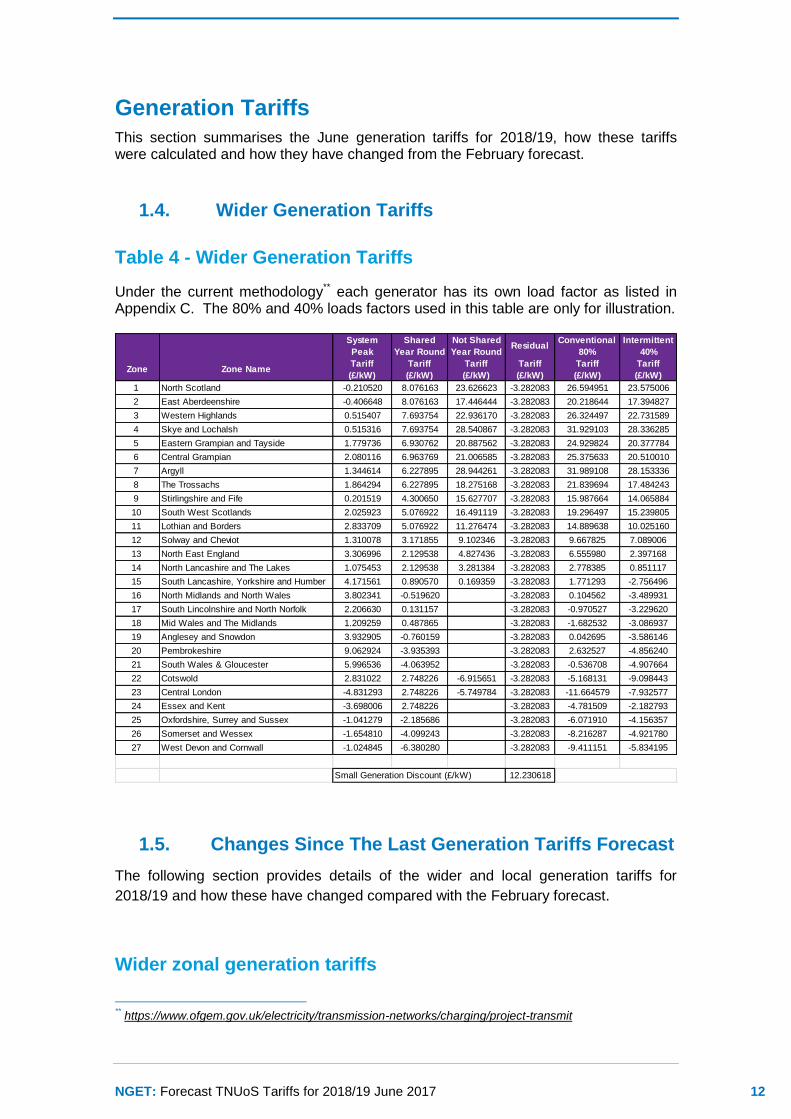
Generation Tariffs
This section summarises the June generation tariffs for 2018/19, how these tariffs were calculated and how they have changed from the February forecast.
1.4. Wider Generation Tariffs
Table 4 - Wider Generation Tariffs
Under the current methodology** each generator has its own load factor as listed in Appendix C. The 80% and 40% loads factors used in this table are only for illustration.
1.5. Changes Since The Last Generation Tariffs Forecast
The following section provides details of the wider and local generation tariffs for
2018/19 and how these have changed compared with the February forecast.
Wider zonal generation tariffs
** https://www.ofgem.gov.uk/electricity/transmission-networks/charging/project-transmit
System
Peak
Shared
Year Round
Not Shared
Year RoundResidual
Conventional
80%
Intermittent
40%
Zone Zone NameTariff
(£/kW)
Tariff
(£/kW)
Tariff
(£/kW)
Tariff
(£/kW)
Tariff
(£/kW)
Tariff
(£/kW)
1 North Scotland -0.210520 8.076163 23.626623 -3.282083 26.594951 23.575006
2 East Aberdeenshire -0.406648 8.076163 17.446444 -3.282083 20.218644 17.394827
3 Western Highlands 0.515407 7.693754 22.936170 -3.282083 26.324497 22.731589
4 Skye and Lochalsh 0.515316 7.693754 28.540867 -3.282083 31.929103 28.336285
5 Eastern Grampian and Tayside 1.779736 6.930762 20.887562 -3.282083 24.929824 20.377784
6 Central Grampian 2.080116 6.963769 21.006585 -3.282083 25.375633 20.510010
7 Argyll 1.344614 6.227895 28.944261 -3.282083 31.989108 28.153336
8 The Trossachs 1.864294 6.227895 18.275168 -3.282083 21.839694 17.484243
9 Stirlingshire and Fife 0.201519 4.300650 15.627707 -3.282083 15.987664 14.065884
10 South West Scotlands 2.025923 5.076922 16.491119 -3.282083 19.296497 15.239805
11 Lothian and Borders 2.833709 5.076922 11.276474 -3.282083 14.889638 10.025160
12 Solway and Cheviot 1.310078 3.171855 9.102346 -3.282083 9.667825 7.089006
13 North East England 3.306996 2.129538 4.827436 -3.282083 6.555980 2.397168
14 North Lancashire and The Lakes 1.075453 2.129538 3.281384 -3.282083 2.778385 0.851117
15 South Lancashire, Yorkshire and Humber 4.171561 0.890570 0.169359 -3.282083 1.771293 -2.756496
16 North Midlands and North Wales 3.802341 -0.519620 0.000000 -3.282083 0.104562 -3.489931
17 South Lincolnshire and North Norfolk 2.206630 0.131157 0.000000 -3.282083 -0.970527 -3.229620
18 Mid Wales and The Midlands 1.209259 0.487865 0.000000 -3.282083 -1.682532 -3.086937
19 Anglesey and Snowdon 3.932905 -0.760159 0.000000 -3.282083 0.042695 -3.586146
20 Pembrokeshire 9.062924 -3.935393 0.000000 -3.282083 2.632527 -4.856240
21 South Wales & Gloucester 5.996536 -4.063952 0.000000 -3.282083 -0.536708 -4.907664
22 Cotswold 2.831022 2.748226 -6.915651 -3.282083 -5.168131 -9.098443
23 Central London -4.831293 2.748226 -5.749784 -3.282083 -11.664579 -7.932577
24 Essex and Kent -3.698006 2.748226 0.000000 -3.282083 -4.781509 -2.182793
25 Oxfordshire, Surrey and Sussex -1.041279 -2.185686 0.000000 -3.282083 -6.071910 -4.156357
26 Somerset and Wessex -1.654810 -4.099243 0.000000 -3.282083 -8.216287 -4.921780
27 West Devon and Cornwall -1.024845 -6.380280 0.000000 -3.282083 -9.411151 -5.834195
12.230618Small Generation Discount (£/kW)
NGET: Forecast TNUoS Tariffs for 2018/19 June 2017 13
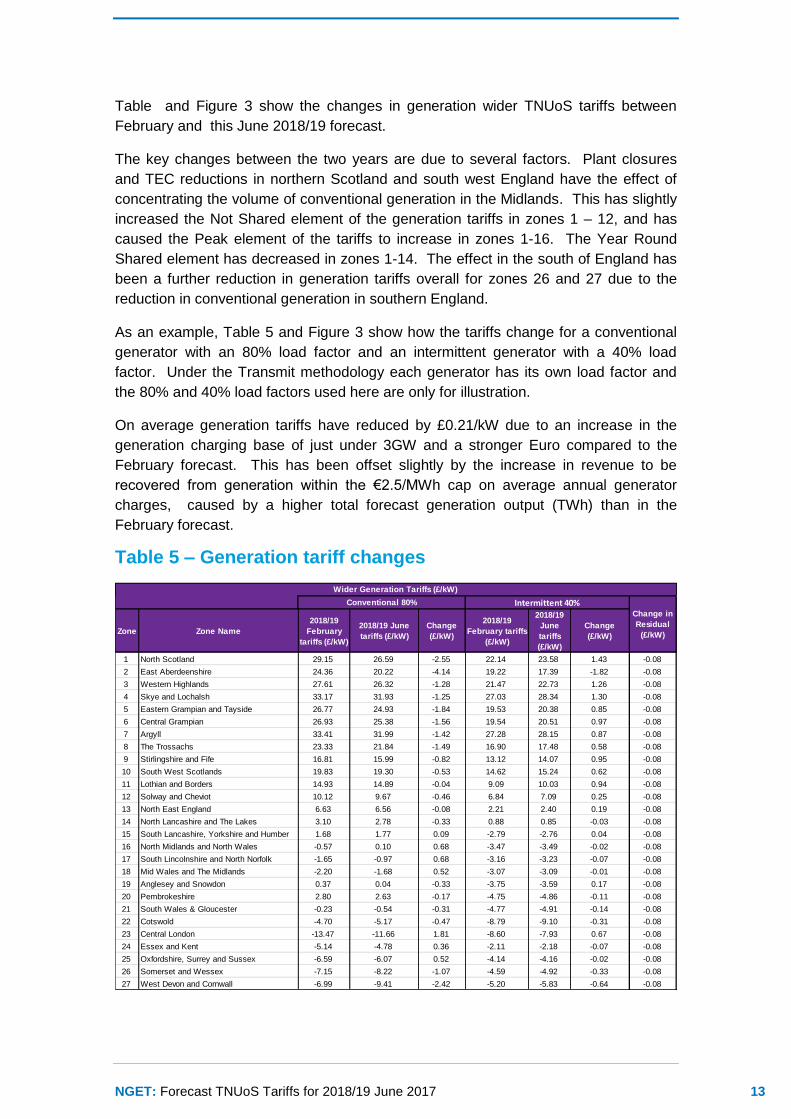
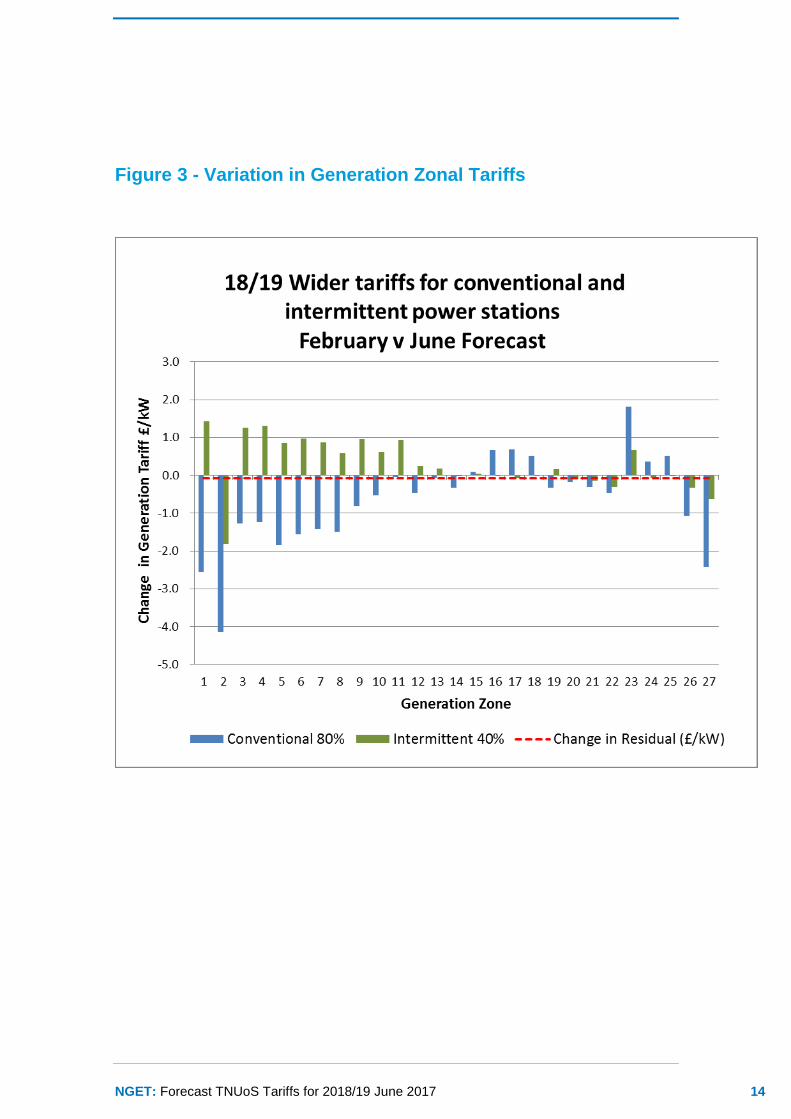
Table and Figure 3 show the changes in generation wider TNUoS tariffs between
February and this June 2018/19 forecast.
The key changes between the two years are due to several factors. Plant closures
and TEC reductions in northern Scotland and south west England have the effect of
concentrating the volume of conventional generation in the Midlands. This has slightly
increased the Not Shared element of the generation tariffs in zones 1 – 12, and has
caused the Peak element of the tariffs to increase in zones 1-16. The Year Round
Shared element has decreased in zones 1-14. The effect in the south of England has
been a further reduction in generation tariffs overall for zones 26 and 27 due to the
reduction in conventional generation in southern England.
As an example, Table 5 and Figure 3 show how the tariffs change for a conventional
generator with an 80% load factor and an intermittent generator with a 40% load
factor. Under the Transmit methodology each generator has its own load factor and
the 80% and 40% load factors used here are only for illustration.
On average generation tariffs have reduced by £0.21/kW due to an increase in the
generation charging base of just under 3GW and a stronger Euro compared to the
February forecast. This has been offset slightly by the increase in revenue to be
recovered from generation within the €2.5/MWh cap on average annual generator
charges, caused by a higher total forecast generation output (TWh) than in the
February forecast.
Table 5 – Generation tariff changes
Zone Zone Name
2018/19
February
tariffs (£/kW)
2018/19 June
tariffs (£/kW)
Change
(£/kW)
2018/19
February tariffs
(£/kW)
2018/19
June
tariffs
(£/kW)
Change
(£/kW)
1 North Scotland 29.15 26.59 -2.55 22.14 23.58 1.43 -0.08
2 East Aberdeenshire 24.36 20.22 -4.14 19.22 17.39 -1.82 -0.08
3 Western Highlands 27.61 26.32 -1.28 21.47 22.73 1.26 -0.08
4 Skye and Lochalsh 33.17 31.93 -1.25 27.03 28.34 1.30 -0.08
5 Eastern Grampian and Tayside 26.77 24.93 -1.84 19.53 20.38 0.85 -0.08
6 Central Grampian 26.93 25.38 -1.56 19.54 20.51 0.97 -0.08
7 Argyll 33.41 31.99 -1.42 27.28 28.15 0.87 -0.08
8 The Trossachs 23.33 21.84 -1.49 16.90 17.48 0.58 -0.08
9 Stirlingshire and Fife 16.81 15.99 -0.82 13.12 14.07 0.95 -0.08
10 South West Scotlands 19.83 19.30 -0.53 14.62 15.24 0.62 -0.08
11 Lothian and Borders 14.93 14.89 -0.04 9.09 10.03 0.94 -0.08
12 Solway and Cheviot 10.12 9.67 -0.46 6.84 7.09 0.25 -0.08
13 North East England 6.63 6.56 -0.08 2.21 2.40 0.19 -0.08
14 North Lancashire and The Lakes 3.10 2.78 -0.33 0.88 0.85 -0.03 -0.08
15 South Lancashire, Yorkshire and Humber 1.68 1.77 0.09 -2.79 -2.76 0.04 -0.08
16 North Midlands and North Wales -0.57 0.10 0.68 -3.47 -3.49 -0.02 -0.08
17 South Lincolnshire and North Norfolk -1.65 -0.97 0.68 -3.16 -3.23 -0.07 -0.08
18 Mid Wales and The Midlands -2.20 -1.68 0.52 -3.07 -3.09 -0.01 -0.08
19 Anglesey and Snowdon 0.37 0.04 -0.33 -3.75 -3.59 0.17 -0.08
20 Pembrokeshire 2.80 2.63 -0.17 -4.75 -4.86 -0.11 -0.08
21 South Wales & Gloucester -0.23 -0.54 -0.31 -4.77 -4.91 -0.14 -0.08
22 Cotswold -4.70 -5.17 -0.47 -8.79 -9.10 -0.31 -0.08
23 Central London -13.47 -11.66 1.81 -8.60 -7.93 0.67 -0.08
24 Essex and Kent -5.14 -4.78 0.36 -2.11 -2.18 -0.07 -0.08
25 Oxfordshire, Surrey and Sussex -6.59 -6.07 0.52 -4.14 -4.16 -0.02 -0.08
26 Somerset and Wessex -7.15 -8.22 -1.07 -4.59 -4.92 -0.33 -0.08
27 West Devon and Cornwall -6.99 -9.41 -2.42 -5.20 -5.83 -0.64 -0.08
Wider Generation Tariffs (£/kW)
Conventional 80% Intermittent 40%Change in
Residual
(£/kW)
NGET: Forecast TNUoS Tariffs for 2018/19 June 2017 14
Figure 3 - Variation in Generation Zonal Tariffs
NGET: Forecast TNUoS Tariffs for 2018/19 June 2017 15
Local Substation and Circuit Tariffs for generation
2.1. Onshore Local Substation Tariffs
Onshore local substation tariffs
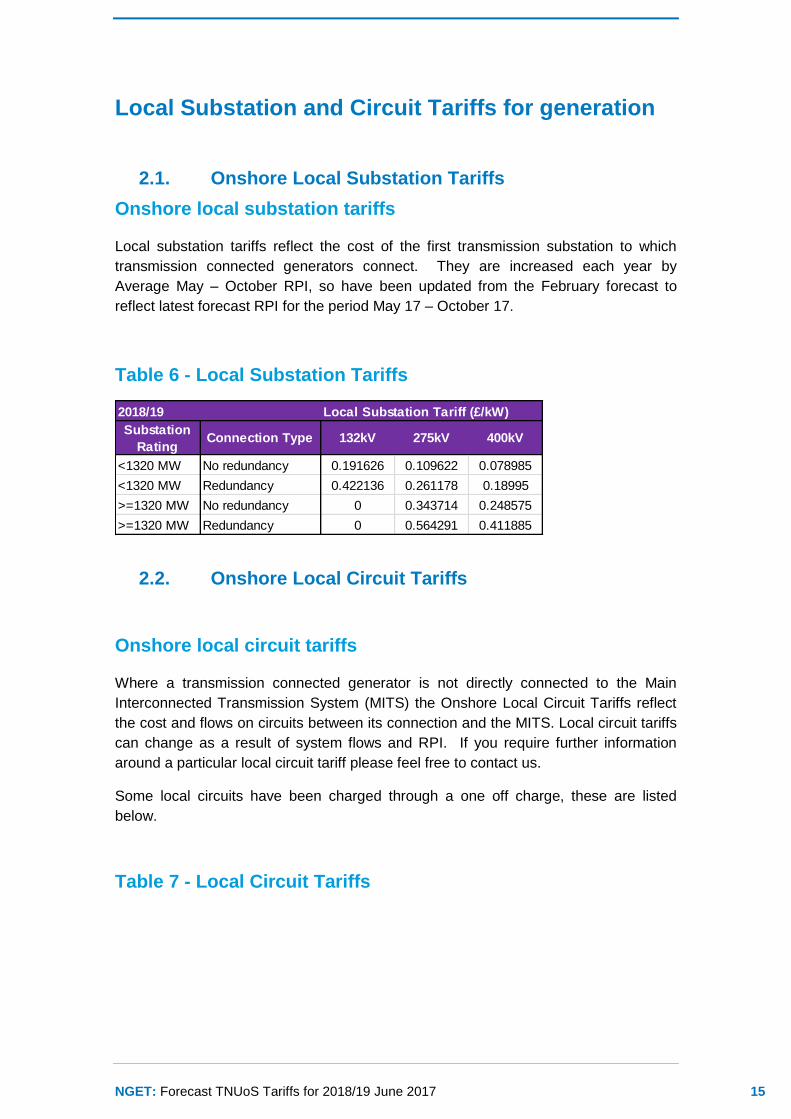
Local substation tariffs reflect the cost of the first transmission substation to which
transmission connected generators connect. They are increased each year by
Average May – October RPI, so have been updated from the February forecast to
reflect latest forecast RPI for the period May 17 – October 17.
Table 6 - Local Substation Tariffs
2.2. Onshore Local Circuit Tariffs
Onshore local circuit tariffs
Where a transmission connected generator is not directly connected to the Main
Interconnected Transmission System (MITS) the Onshore Local Circuit Tariffs reflect
the cost and flows on circuits between its connection and the MITS. Local circuit tariffs
can change as a result of system flows and RPI. If you require further information
around a particular local circuit tariff please feel free to contact us.
Some local circuits have been charged through a one off charge, these are listed
below.
Table 7 - Local Circuit Tariffs
2018/19 Local Substation Tariff (£/kW)
Substation
RatingConnection Type 132kV 275kV 400kV
<1320 MW No redundancy 0.191626 0.109622 0.078985
<1320 MW Redundancy 0.422136 0.261178 0.18995
>=1320 MW No redundancy 0 0.343714 0.248575
>=1320 MW Redundancy 0 0.564291 0.411885
NGET: Forecast TNUoS Tariffs for 2018/19 June 2017 16
Table 8 - CMP203: Circuits subject to one off charges
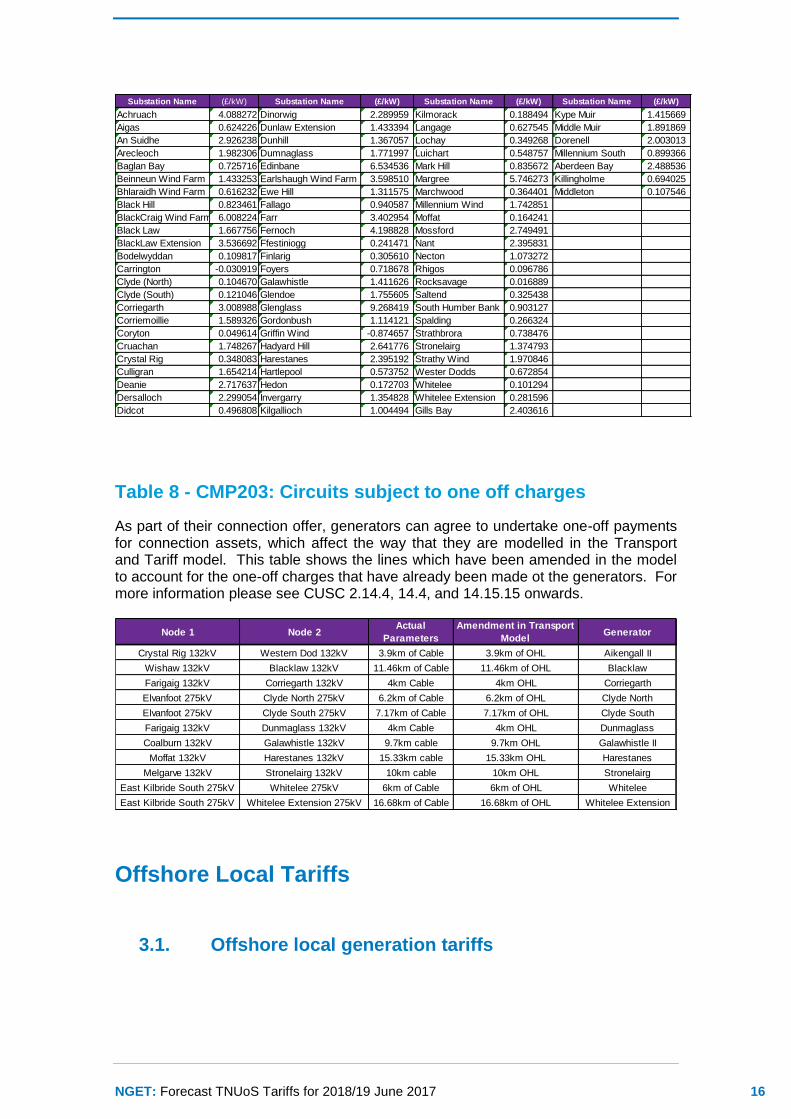
As part of their connection offer, generators can agree to undertake one-off payments for connection assets, which affect the way that they are modelled in the Transport and Tariff model. This table shows the lines which have been amended in the model to account for the one-off charges that have already been made ot the generators. For more information please see CUSC 2.14.4, 14.4, and 14.15.15 onwards.
Offshore Local Tariffs
3.1. Offshore local generation tariffs
Substation Name (£/kW) Substation Name (£/kW) Substation Name (£/kW) Substation Name (£/kW)
Achruach 4.088272 Dinorwig 2.289959 Kilmorack 0.188494 Kype Muir 1.415669
Aigas 0.624226 Dunlaw Extension 1.433394 Langage 0.627545 Middle Muir 1.891869
An Suidhe 2.926238 Dunhill 1.367057 Lochay 0.349268 Dorenell 2.003013
Arecleoch 1.982306 Dumnaglass 1.771997 Luichart 0.548757 Millennium South 0.899366
Baglan Bay 0.725716 Edinbane 6.534536 Mark Hill 0.835672 Aberdeen Bay 2.488536
Beinneun Wind Farm 1.433253 Earlshaugh Wind Farm 3.598510 Margree 5.746273 Killingholme 0.694025
Bhlaraidh Wind Farm 0.616232 Ewe Hill 1.311575 Marchwood 0.364401 Middleton 0.107546
Black Hill 0.823461 Fallago 0.940587 Millennium Wind 1.742851
BlackCraig Wind Farm 6.008224 Farr 3.402954 Moffat 0.164241
Black Law 1.667756 Fernoch 4.198828 Mossford 2.749491
BlackLaw Extension 3.536692 Ffestiniogg 0.241471 Nant 2.395831
Bodelwyddan 0.109817 Finlarig 0.305610 Necton 1.073272
Carrington -0.030919 Foyers 0.718678 Rhigos 0.096786
Clyde (North) 0.104670 Galawhistle 1.411626 Rocksavage 0.016889
Clyde (South) 0.121046 Glendoe 1.755605 Saltend 0.325438
Corriegarth 3.008988 Glenglass 9.268419 South Humber Bank 0.903127
Corriemoillie 1.589326 Gordonbush 1.114121 Spalding 0.266324
Coryton 0.049614 Griffin Wind -0.874657 Strathbrora 0.738476
Cruachan 1.748267 Hadyard Hill 2.641776 Stronelairg 1.374793
Crystal Rig 0.348083 Harestanes 2.395192 Strathy Wind 1.970846
Culligran 1.654214 Hartlepool 0.573752 Wester Dodds 0.672854
Deanie 2.717637 Hedon 0.172703 Whitelee 0.101294
Dersalloch 2.299054 Invergarry 1.354828 Whitelee Extension 0.281596
Didcot 0.496808 Kilgallioch 1.004494 Gills Bay 2.403616
Node 1 Node 2Actual
Parameters
Amendment in Transport
ModelGenerator
Crystal Rig 132kV Western Dod 132kV 3.9km of Cable 3.9km of OHL Aikengall II
Wishaw 132kV Blacklaw 132kV 11.46km of Cable 11.46km of OHL Blacklaw
Farigaig 132kV Corriegarth 132kV 4km Cable 4km OHL Corriegarth
Elvanfoot 275kV Clyde North 275kV 6.2km of Cable 6.2km of OHL Clyde North
Elvanfoot 275kV Clyde South 275kV 7.17km of Cable 7.17km of OHL Clyde South
Farigaig 132kV Dunmaglass 132kV 4km Cable 4km OHL Dunmaglass
Coalburn 132kV Galawhistle 132kV 9.7km cable 9.7km OHL Galawhistle II
Moffat 132kV Harestanes 132kV 15.33km cable 15.33km OHL Harestanes
Melgarve 132kV Stronelairg 132kV 10km cable 10km OHL Stronelairg
East Kilbride South 275kV Whitelee 275kV 6km of Cable 6km of OHL Whitelee
East Kilbride South 275kV Whitelee Extension 275kV 16.68km of Cable 16.68km of OHL Whitelee Extension
NGET: Forecast TNUoS Tariffs for 2018/19 June 2017 17
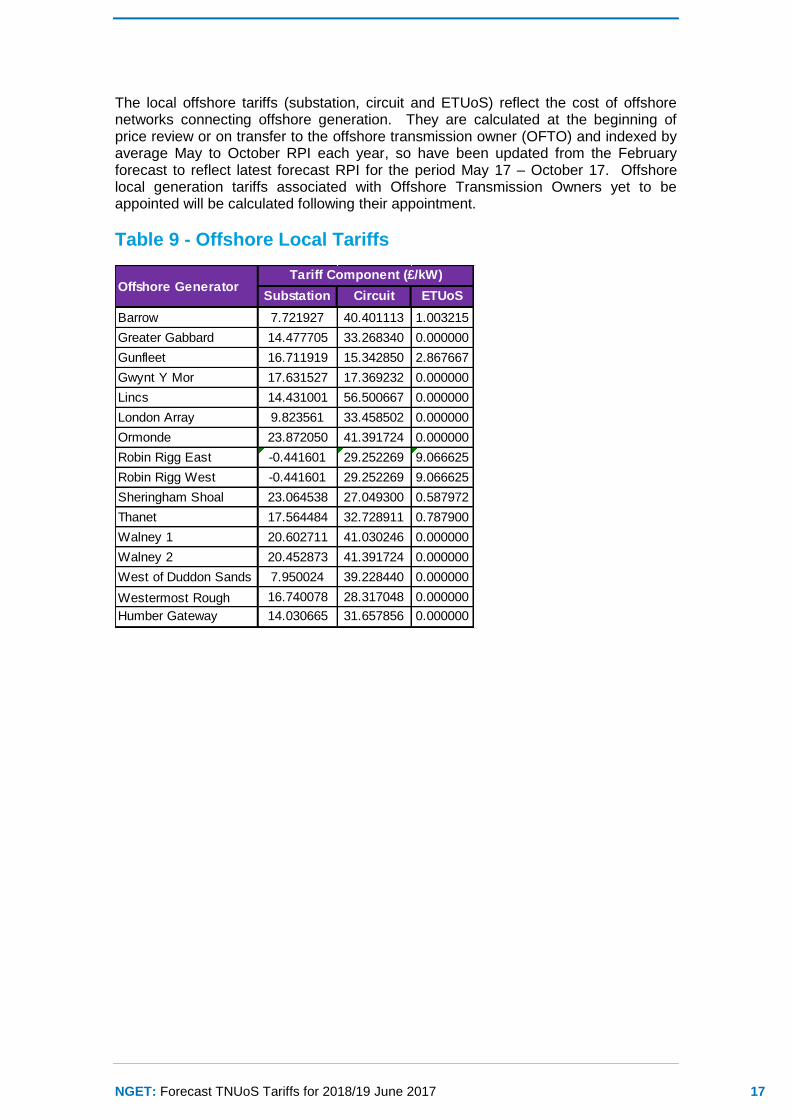
The local offshore tariffs (substation, circuit and ETUoS) reflect the cost of offshore networks connecting offshore generation. They are calculated at the beginning of price review or on transfer to the offshore transmission owner (OFTO) and indexed by average May to October RPI each year, so have been updated from the February forecast to reflect latest forecast RPI for the period May 17 – October 17. Offshore local generation tariffs associated with Offshore Transmission Owners yet to be appointed will be calculated following their appointment.
Table 9 - Offshore Local Tariffs
Substation Circuit ETUoS
Barrow 7.721927 40.401113 1.003215
Greater Gabbard 14.477705 33.268340 0.000000
Gunfleet 16.711919 15.342850 2.867667
Gwynt Y Mor 17.631527 17.369232 0.000000
Lincs 14.431001 56.500667 0.000000
London Array 9.823561 33.458502 0.000000
Ormonde 23.872050 41.391724 0.000000
Robin Rigg East -0.441601 29.252269 9.066625
Robin Rigg West -0.441601 29.252269 9.066625
Sheringham Shoal 23.064538 27.049300 0.587972
Thanet 17.564484 32.728911 0.787900
Walney 1 20.602711 41.030246 0.000000
Walney 2 20.452873 41.391724 0.000000
West of Duddon Sands 7.950024 39.228440 0.000000
Westermost Rough 16.740078 28.317048 0.000000
Humber Gateway 14.030665 31.657856 0.000000
Offshore GeneratorTariff Component (£/kW)
NGET: Forecast TNUoS Tariffs for 2018/19 June 2017 18
Background to TNUoS Charging
National Grid sets Transmission Network Use of System (TNUoS) tariffs for generators
and suppliers. These tariffs serve two purposes: to reflect the transmission cost of
connecting at different locations and to recover the total allowed revenues of the
onshore and offshore transmission owners.
To reflect the cost of connecting in different parts of the network, National Grid
determines a locational component of TNUoS tariffs using two models of power flows
on the transmission system: peak demand and year round. Where a change in
demand or generation increases power flows, tariffs increase to reflect the need to
invest. Similarly, if a change reduces flows on the network, tariffs are reduced. To
calculate flows on the network, information about the generation and demand
connected to the network is required in conjunction with the electrical characteristics of
the circuits that link these.
The charging model includes information about the cost of investing in transmission
circuits based on different types of generic construction, e.g. voltage and cable /
overhead line, and the costs incurred in different TO regions. Onshore, these costs
are based on ‘standard’ conditions, which means that they reflect the cost of replacing
assets at current rather than historical cost, so they do not necessarily reflect the
actual cost of investment to connect a specific generator or demand site.
The locational component of TNUoS tariffs does not recover the full revenue that
onshore and offshore transmission owners have been allowed in their price controls.
Therefore, to ensure the correct revenue recovery, separate non-locational “residual”
tariff elements are included in the generation and demand tariffs. The residual is also
used to ensure the correct proportion of revenue is collected from generation and
demand. The locational and residual tariff elements are combined into a zonal tariff,
referred to as the wider zonal generation tariff or demand tariff, as appropriate.
For generation customers, local tariffs are also calculated. These reflect the cost
associated with the transmission substation they connect to and, where a generator is
not connected to the main interconnected transmission system (MITS), the cost of
local circuits that the generator uses to export onto the MITS. This allows the charges
to reflect the cost and design of local connections and vary from project to project. For
offshore generators, these local charges reflect OFTO revenue allowances.
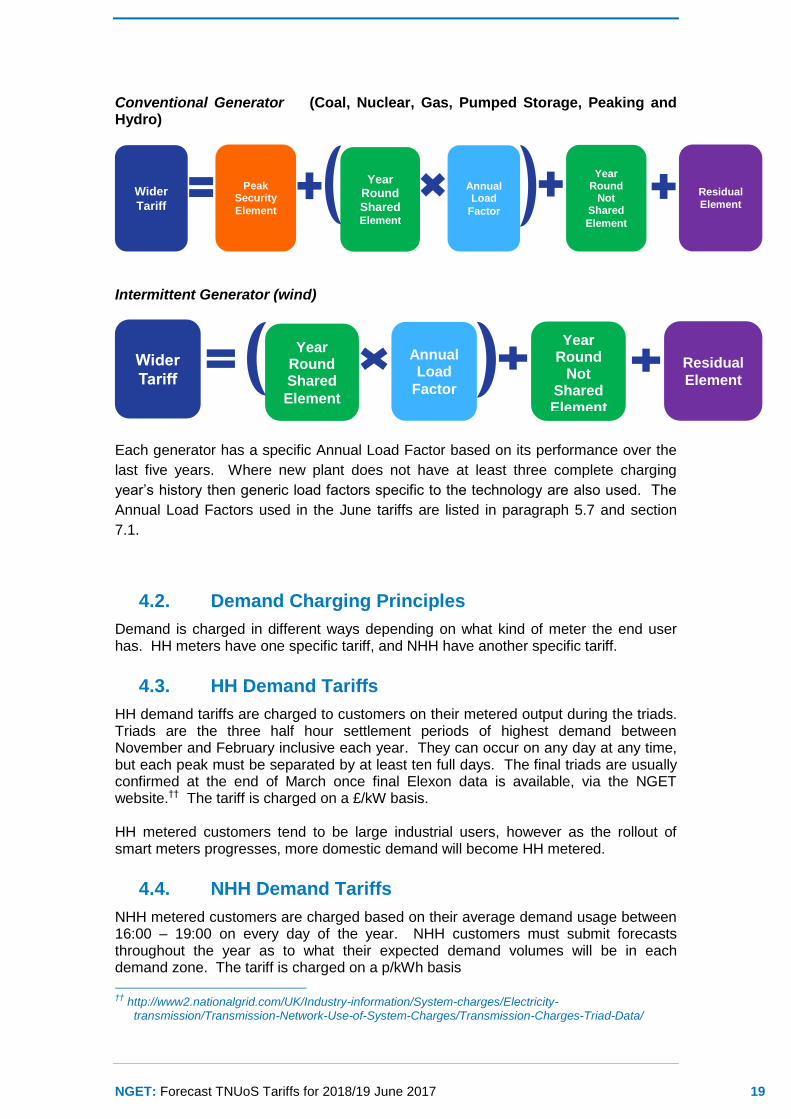
4.1. Generation Charging Principles
Under the current methodology there are 27 generation zones, and each zone has
four tariffs. A generator’s liability is dependent upon its type of generation. Coal,
Nuclear, Gas, Pumped Storage, Peaking and Hydro are classed as conventional and
wind is intermittent. Liability for each tariff component is shown below:
NGET: Forecast TNUoS Tariffs for 2018/19 June 2017 19
Conventional Generator (Coal, Nuclear, Gas, Pumped Storage, Peaking and Hydro)
Intermittent Generator (wind)
Each generator has a specific Annual Load Factor based on its performance over the
last five years. Where new plant does not have at least three complete charging
year’s history then generic load factors specific to the technology are also used. The
Annual Load Factors used in the June tariffs are listed in paragraph 5.7 and section
7.1.
4.2. Demand Charging Principles
Demand is charged in different ways depending on what kind of meter the end user has. HH meters have one specific tariff, and NHH have another specific tariff.
4.3. HH Demand Tariffs
HH demand tariffs are charged to customers on their metered output during the triads. Triads are the three half hour settlement periods of highest demand between November and February inclusive each year. They can occur on any day at any time, but each peak must be separated by at least ten full days. The final triads are usually confirmed at the end of March once final Elexon data is available, via the NGET website.†† The tariff is charged on a £/kW basis. HH metered customers tend to be large industrial users, however as the rollout of smart meters progresses, more domestic demand will become HH metered.
4.4. NHH Demand Tariffs
NHH metered customers are charged based on their average demand usage between 16:00 – 19:00 on every day of the year. NHH customers must submit forecasts throughout the year as to what their expected demand volumes will be in each demand zone. The tariff is charged on a p/kWh basis
††
http://www2.nationalgrid.com/UK/Industry-information/System-charges/Electricity-transmission/Transmission-Network-Use-of-System-Charges/Transmission-Charges-Triad-Data/
Wider
Tariff Peak
Security Element
Year Round Shared Element
Year Round
Not Shared
Element
Residual
Element
Annual Load
Factor
Wider
Tariff
Year Round Shared
Element
Year Round
Not Shared Element
Residual
Element
Annual Load
Factor
NGET: Forecast TNUoS Tariffs for 2018/19 June 2017 20
Customers are billed against these forecast volumes, and a reconciliation of the amounts paid against their actual metered output is performed once the final metering data is available from Elexon up to 16 months after the financial year in question.
4.5. CMP264/265
This June forecast does not take into account the changes to the charging methodology based on CUSC modifications CMP264/265. Currently, HH demand is treated on a net basis and is charged at the Grid Supply Point (GSP), where the transmission network connects to the distribution network, or directly to the customer in question. There have been concerns within the industry that embedded generators are benefiting from large payments from electricity suppliers by generating during peak times thereby helping to reduce the supplier’s exposure to HH demand costs at triad. Ofgem has reacted by approving CUSC modifications 264 and 265 which change the way that HH demand customers are charged. In future, HH triad demand will be treated as two separate amounts instead of a net GSP demand: a gross demand volume (demand without any embedded generation included), and an embedded generation demand volume. A new tariff will be calculated, called the Embedded Export Tariff, which will be payable to embedded generation in return for the volumes they deliver at triad. This tariff will reduce gradually over the next three years. As is the case now, the revenue not recovered from HH metered demand will be recovered from NHH metered customers. The way NHH demand is charged will not be affected by CMP264/265.
NGET: Forecast TNUoS Tariffs for 2018/19 June 2017 21
Updates To Revenue & The Charging Model Since
The Last Forecast
Since the February forecast tariffs were published we have updated allowed revenue for NGET and offshore Transmission Owners, the demand and generation charging bases, transport model generation and circuits, as well as RPI and exchange rates. There have been no changes to the charging methodology, transport model demand, or the error margin that is used to calculate the proportion of revenue to be recovered from generation and demand (G/D split).
5.1. Changes affecting the locational element of tariffs
The locational element of generation and demand tariffs is based upon:
Contracted generation as of May 2017;
The network model;
Demand data provided under the Grid Code, which includes week 24 demand
forecast data provided by the Distribution Network Operators (DNO), forecasts
of demand at directly connected demand sites such as steelworks and
railways and the effect of some embedded generation; and
RPI (which increases the expansion constant).
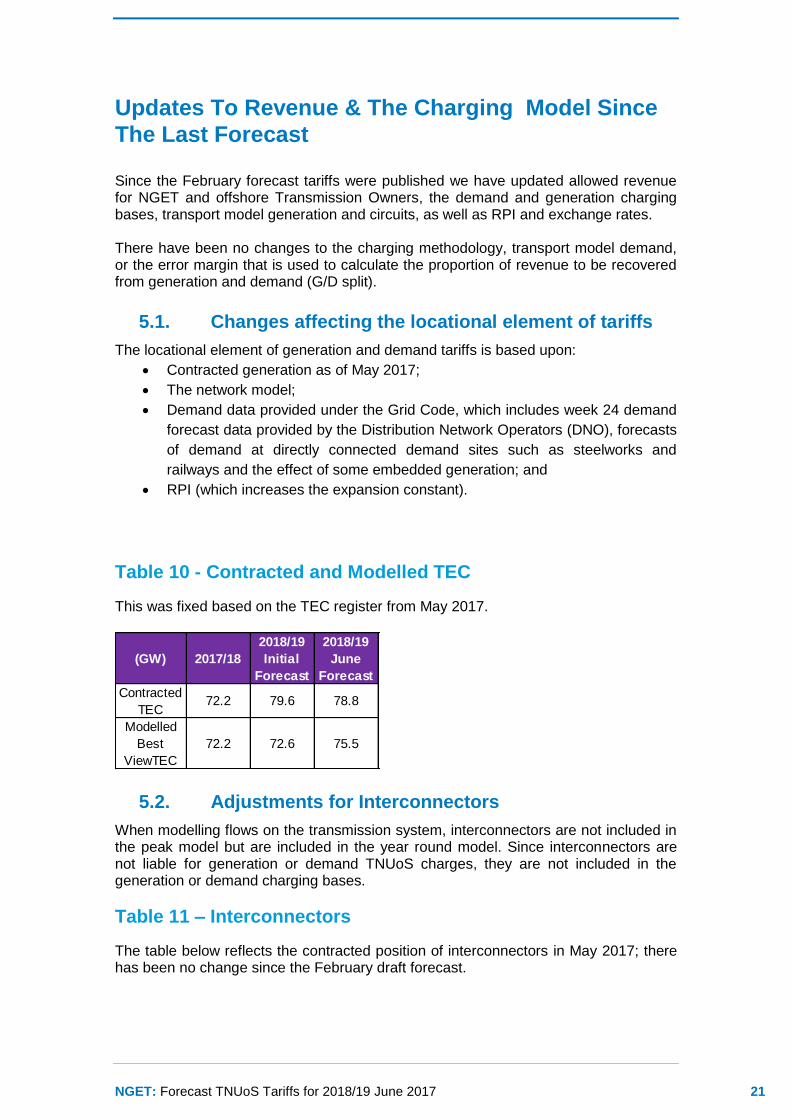
Table 10 - Contracted and Modelled TEC
This was fixed based on the TEC register from May 2017.
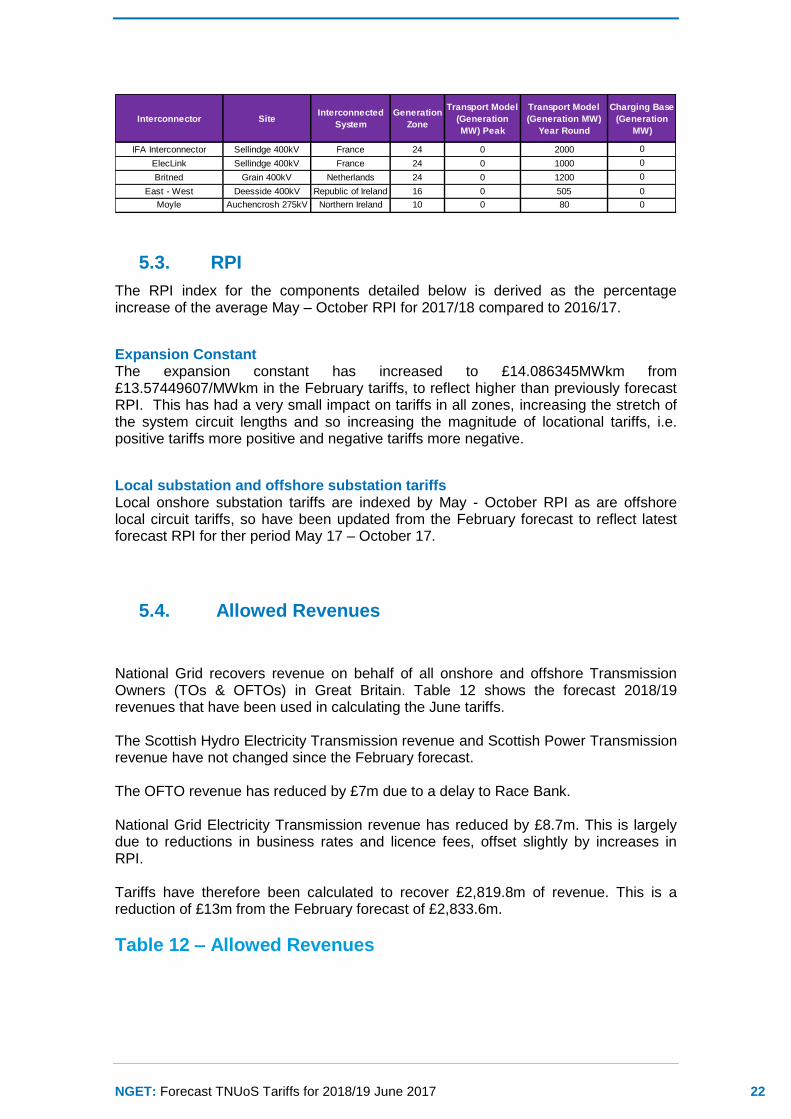
5.2. Adjustments for Interconnectors
When modelling flows on the transmission system, interconnectors are not included in the peak model but are included in the year round model. Since interconnectors are not liable for generation or demand TNUoS charges, they are not included in the generation or demand charging bases.
Table 11 – Interconnectors
The table below reflects the contracted position of interconnectors in May 2017; there has been no change since the February draft forecast.
(GW) 2017/18
2018/19
Initial
Forecast
2018/19
June
Forecast
Contracted
TEC72.2 79.6 78.8
Modelled
Best
ViewTEC
72.2 72.6 75.5
NGET: Forecast TNUoS Tariffs for 2018/19 June 2017 22
5.3. RPI
The RPI index for the components detailed below is derived as the percentage increase of the average May – October RPI for 2017/18 compared to 2016/17.
Expansion Constant The expansion constant has increased to £14.086345MWkm from £13.57449607/MWkm in the February tariffs, to reflect higher than previously forecast RPI. This has had a very small impact on tariffs in all zones, increasing the stretch of the system circuit lengths and so increasing the magnitude of locational tariffs, i.e. positive tariffs more positive and negative tariffs more negative.
Local substation and offshore substation tariffs Local onshore substation tariffs are indexed by May - October RPI as are offshore local circuit tariffs, so have been updated from the February forecast to reflect latest forecast RPI for ther period May 17 – October 17.
5.4. Allowed Revenues
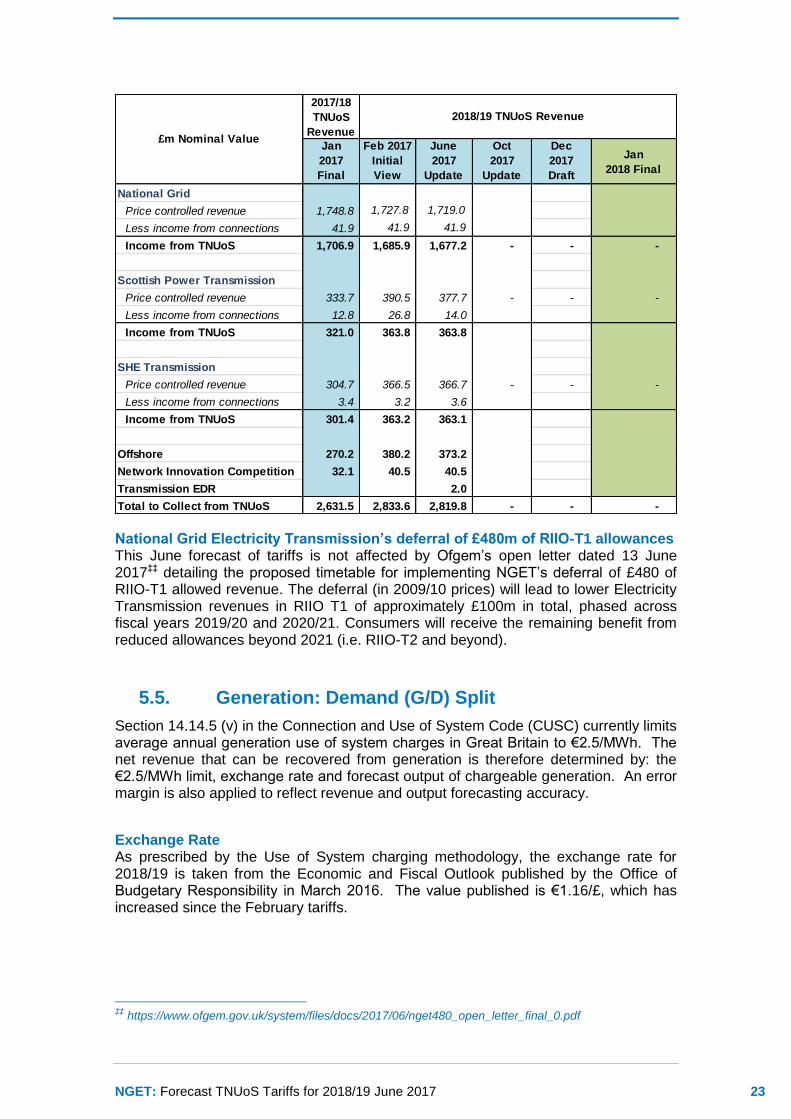
National Grid recovers revenue on behalf of all onshore and offshore Transmission Owners (TOs & OFTOs) in Great Britain. Table 12 shows the forecast 2018/19 revenues that have been used in calculating the June tariffs. The Scottish Hydro Electricity Transmission revenue and Scottish Power Transmission revenue have not changed since the February forecast. The OFTO revenue has reduced by £7m due to a delay to Race Bank. National Grid Electricity Transmission revenue has reduced by £8.7m. This is largely due to reductions in business rates and licence fees, offset slightly by increases in RPI. Tariffs have therefore been calculated to recover £2,819.8m of revenue. This is a reduction of £13m from the February forecast of £2,833.6m.
Table 12 – Allowed Revenues
Interconnector SiteInterconnected
System
Generation
Zone
Transport Model
(Generation
MW) Peak
Transport Model
(Generation MW)
Year Round
Charging Base
(Generation
MW)
IFA Interconnector Sellindge 400kV France 24 0 2000 0
ElecLink Sellindge 400kV France 24 0 1000 0
Britned Grain 400kV Netherlands 24 0 1200 0
East - West Deesside 400kV Republic of Ireland 16 0 505 0
Moyle Auchencrosh 275kV Northern Ireland 10 0 80 0
NGET: Forecast TNUoS Tariffs for 2018/19 June 2017 23
National Grid Electricity Transmission’s deferral of £480m of RIIO-T1 allowances This June forecast of tariffs is not affected by Ofgem’s open letter dated 13 June 2017‡‡ detailing the proposed timetable for implementing NGET’s deferral of £480 of RIIO-T1 allowed revenue. The deferral (in 2009/10 prices) will lead to lower Electricity Transmission revenues in RIIO T1 of approximately £100m in total, phased across fiscal years 2019/20 and 2020/21. Consumers will receive the remaining benefit from reduced allowances beyond 2021 (i.e. RIIO-T2 and beyond).
5.5. Generation: Demand (G/D) Split
Section 14.14.5 (v) in the Connection and Use of System Code (CUSC) currently limits average annual generation use of system charges in Great Britain to €2.5/MWh. The net revenue that can be recovered from generation is therefore determined by: the €2.5/MWh limit, exchange rate and forecast output of chargeable generation. An error margin is also applied to reflect revenue and output forecasting accuracy.
Exchange Rate As prescribed by the Use of System charging methodology, the exchange rate for 2018/19 is taken from the Economic and Fiscal Outlook published by the Office of Budgetary Responsibility in March 2016. The value published is €1.16/£, which has increased since the February tariffs.
‡‡
https://www.ofgem.gov.uk/system/files/docs/2017/06/nget480_open_letter_final_0.pdf
2017/18
TNUoS
Revenue
Jan
2017
Final
Feb 2017
Initial
View
June
2017
Update
Oct
2017
Update
Dec
2017
Draft
Jan
2018 Final
National Grid
Price controlled revenue 1,748.8 1,727.8 1,719.0
Less income from connections 41.9 41.9 41.9
Income from TNUoS 1,706.9 1,685.9 1,677.2 - - -
Scottish Power Transmission
Price controlled revenue 333.7 390.5 377.7 - - -
Less income from connections 12.8 26.8 14.0
Income from TNUoS 321.0 363.8 363.8
SHE Transmission
Price controlled revenue 304.7 366.5 366.7 - - -
Less income from connections 3.4 3.2 3.6
Income from TNUoS 301.4 363.2 363.1
Offshore 270.2 380.2 373.2
Network Innovation Competition 32.1 40.5 40.5
Transmission EDR 2.0
Total to Collect from TNUoS 2,631.5 2,833.6 2,819.8 - - -
£m Nominal Value
2018/19 TNUoS Revenue
NGET: Forecast TNUoS Tariffs for 2018/19 June 2017 24
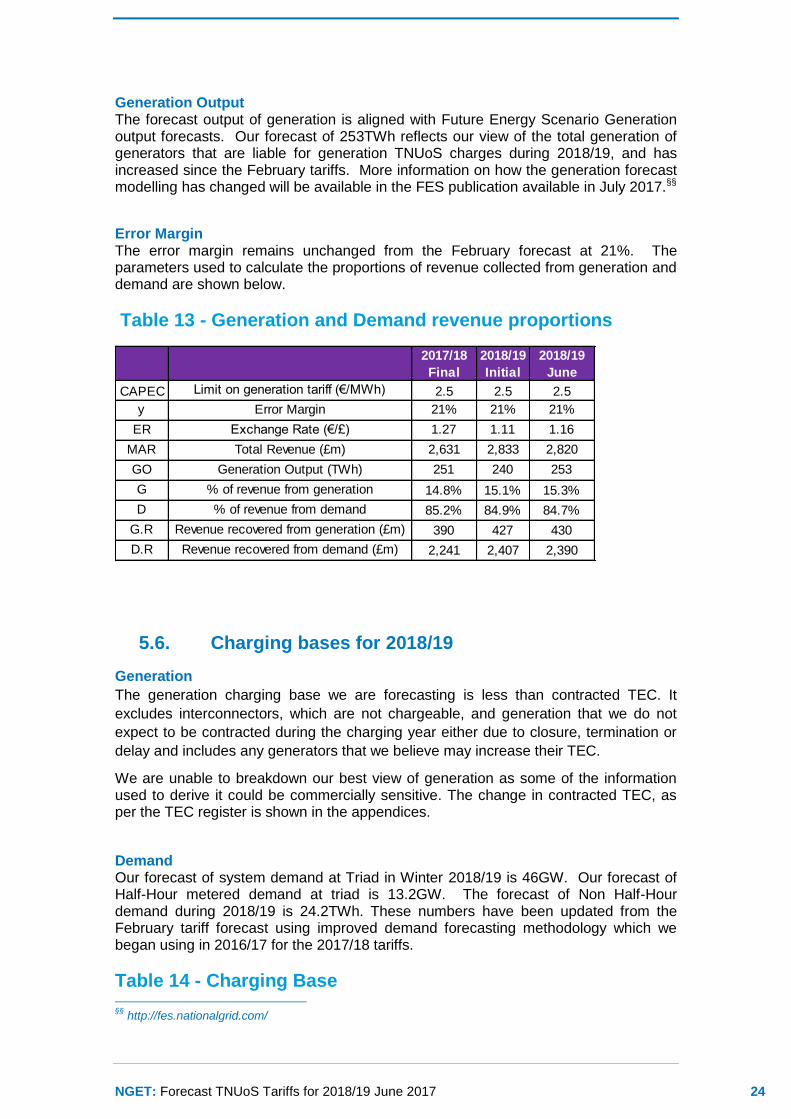
Generation Output The forecast output of generation is aligned with Future Energy Scenario Generation output forecasts. Our forecast of 253TWh reflects our view of the total generation of generators that are liable for generation TNUoS charges during 2018/19, and has increased since the February tariffs. More information on how the generation forecast modelling has changed will be available in the FES publication available in July 2017.§§
Error Margin The error margin remains unchanged from the February forecast at 21%. The parameters used to calculate the proportions of revenue collected from generation and demand are shown below.
Table 13 - Generation and Demand revenue proportions
5.6. Charging bases for 2018/19
Generation
The generation charging base we are forecasting is less than contracted TEC. It
excludes interconnectors, which are not chargeable, and generation that we do not
expect to be contracted during the charging year either due to closure, termination or
delay and includes any generators that we believe may increase their TEC.
We are unable to breakdown our best view of generation as some of the information used to derive it could be commercially sensitive. The change in contracted TEC, as per the TEC register is shown in the appendices.
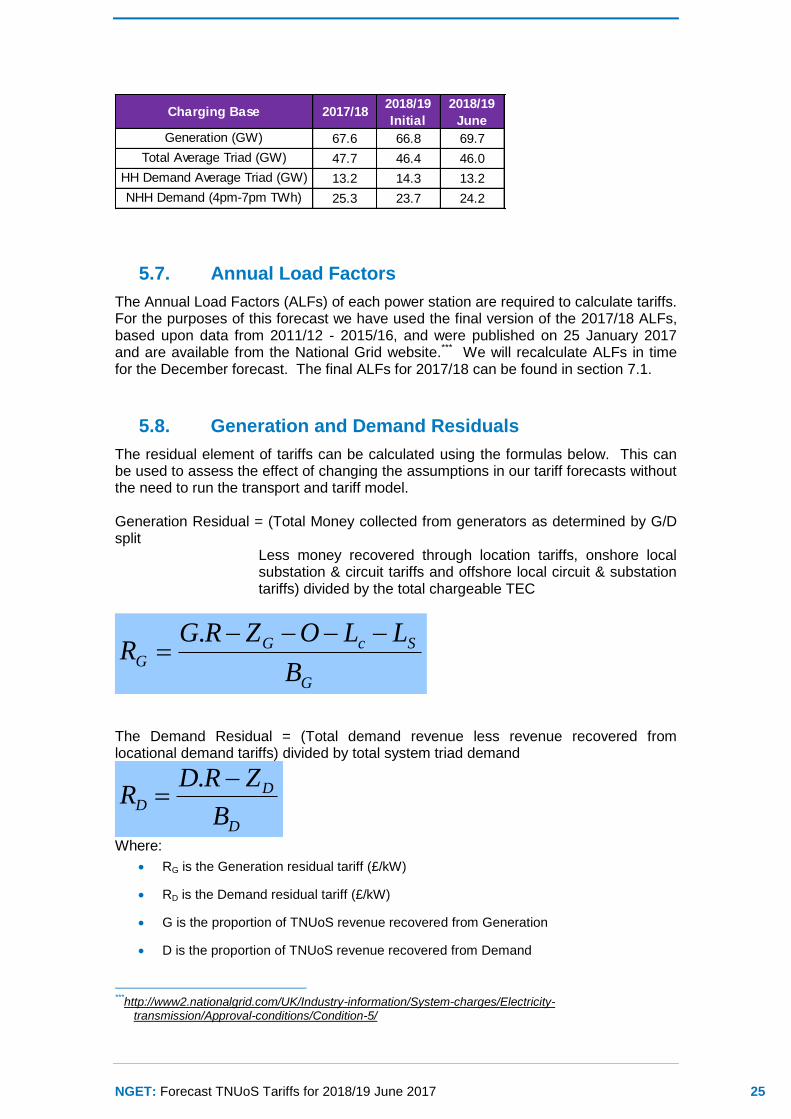
Demand Our forecast of system demand at Triad in Winter 2018/19 is 46GW. Our forecast of Half-Hour metered demand at triad is 13.2GW. The forecast of Non Half-Hour demand during 2018/19 is 24.2TWh. These numbers have been updated from the February tariff forecast using improved demand forecasting methodology which we began using in 2016/17 for the 2017/18 tariffs.
Table 14 - Charging Base §§
http://fes.nationalgrid.com/
2017/18
Final
2018/19
Initial
2018/19
June
CAPEC Limit on generation tariff (€/MWh) 2.5 2.5 2.5
y Error Margin 21% 21% 21%
ER Exchange Rate (€/£) 1.27 1.11 1.16
MAR Total Revenue (£m) 2,631 2,833 2,820
GO Generation Output (TWh) 251 240 253
G % of revenue from generation 14.8% 15.1% 15.3%
D % of revenue from demand 85.2% 84.9% 84.7%
G.R Revenue recovered from generation (£m) 390 427 430
D.R Revenue recovered from demand (£m) 2,241 2,407 2,390
NGET: Forecast TNUoS Tariffs for 2018/19 June 2017 25
5.7. Annual Load Factors
The Annual Load Factors (ALFs) of each power station are required to calculate tariffs. For the purposes of this forecast we have used the final version of the 2017/18 ALFs, based upon data from 2011/12 - 2015/16, and were published on 25 January 2017 and are available from the National Grid website.*** We will recalculate ALFs in time for the December forecast. The final ALFs for 2017/18 can be found in section 7.1.
5.8. Generation and Demand Residuals
The residual element of tariffs can be calculated using the formulas below. This can be used to assess the effect of changing the assumptions in our tariff forecasts without the need to run the transport and tariff model. Generation Residual = (Total Money collected from generators as determined by G/D split
Less money recovered through location tariffs, onshore local substation & circuit tariffs and offshore local circuit & substation tariffs) divided by the total chargeable TEC
G
ScGG
B
LLOZRGR
.
The Demand Residual = (Total demand revenue less revenue recovered from locational demand tariffs) divided by total system triad demand
D
DD
B
ZRDR
.
Where:
RG is the Generation residual tariff (£/kW)
RD is the Demand residual tariff (£/kW)
G is the proportion of TNUoS revenue recovered from Generation
D is the proportion of TNUoS revenue recovered from Demand
***
http://www2.nationalgrid.com/UK/Industry-information/System-charges/Electricity-transmission/Approval-conditions/Condition-5/
Charging Base 2017/182018/19
Initial
2018/19
June
Generation (GW) 67.6 66.8 69.7
Total Average Triad (GW) 47.7 46.4 46.0
HH Demand Average Triad (GW) 13.2 14.3 13.2
NHH Demand (4pm-7pm TWh) 25.3 23.7 24.2
NGET: Forecast TNUoS Tariffs for 2018/19 June 2017 26
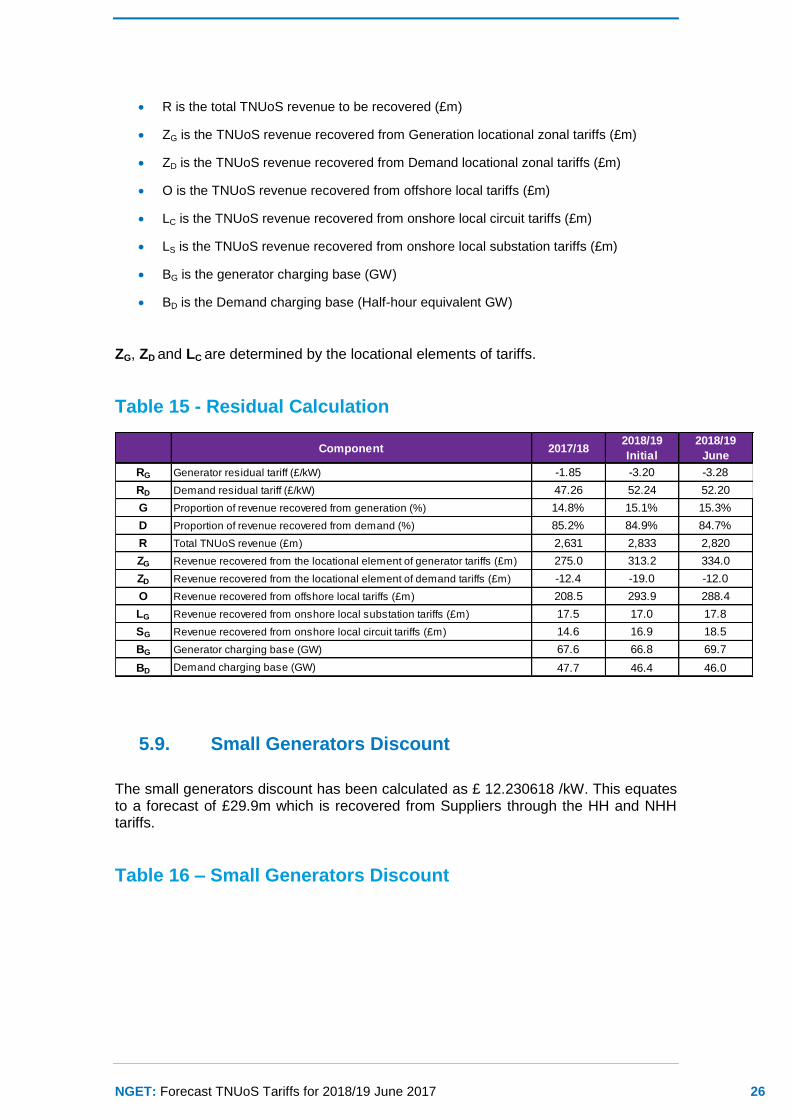
R is the total TNUoS revenue to be recovered (£m)
ZG is the TNUoS revenue recovered from Generation locational zonal tariffs (£m)
ZD is the TNUoS revenue recovered from Demand locational zonal tariffs (£m)
O is the TNUoS revenue recovered from offshore local tariffs (£m)
LC is the TNUoS revenue recovered from onshore local circuit tariffs (£m)
LS is the TNUoS revenue recovered from onshore local substation tariffs (£m)
BG is the generator charging base (GW)
BD is the Demand charging base (Half-hour equivalent GW)
ZG, ZD and LC are determined by the locational elements of tariffs.
Table 15 - Residual Calculation
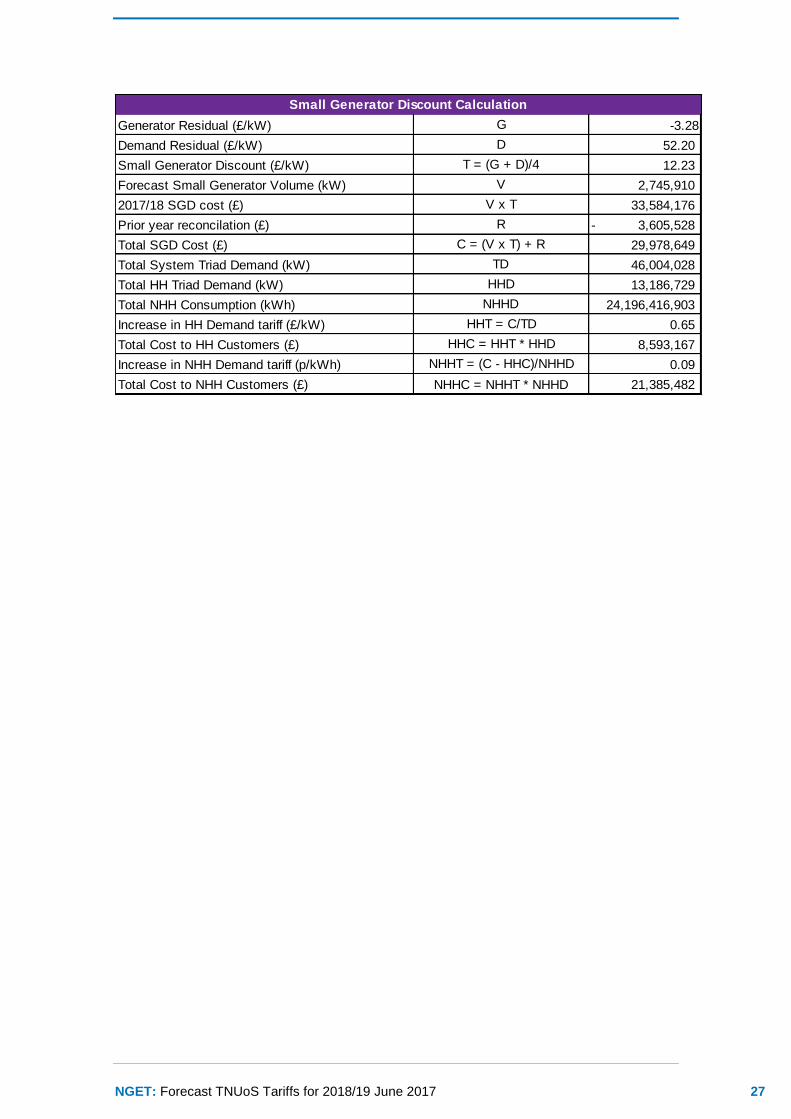
5.9. Small Generators Discount
The small generators discount has been calculated as £ 12.230618 /kW. This equates to a forecast of £29.9m which is recovered from Suppliers through the HH and NHH tariffs.
Table 16 – Small Generators Discount
Component 2017/182018/19
Initial
2018/19
June
RG Generator residual tariff (£/kW) -1.85 -3.20 -3.28
RD Demand residual tariff (£/kW) 47.26 52.24 52.20
G Proportion of revenue recovered from generation (%) 14.8% 15.1% 15.3%
D Proportion of revenue recovered from demand (%) 85.2% 84.9% 84.7%
R Total TNUoS revenue (£m) 2,631 2,833 2,820
ZG Revenue recovered from the locational element of generator tariffs (£m) 275.0 313.2 334.0
ZD Revenue recovered from the locational element of demand tariffs (£m) -12.4 -19.0 -12.0
O Revenue recovered from offshore local tariffs (£m) 208.5 293.9 288.4
LG Revenue recovered from onshore local substation tariffs (£m) 17.5 17.0 17.8
SG Revenue recovered from onshore local circuit tariffs (£m) 14.6 16.9 18.5
BG Generator charging base (GW) 67.6 66.8 69.7
BD Demand charging base (GW) 47.7 46.4 46.0
NGET: Forecast TNUoS Tariffs for 2018/19 June 2017 27
Generator Residual (£/kW) G -3.28
Demand Residual (£/kW) D 52.20
Small Generator Discount (£/kW) T = (G + D)/4 12.23
Forecast Small Generator Volume (kW) V 2,745,910
2017/18 SGD cost (£) V x T 33,584,176
Prior year reconcilation (£) R 3,605,528-
Total SGD Cost (£) C = (V x T) + R 29,978,649
Total System Triad Demand (kW) TD 46,004,028
Total HH Triad Demand (kW) HHD 13,186,729
Total NHH Consumption (kWh) NHHD 24,196,416,903
Increase in HH Demand tariff (£/kW) HHT = C/TD 0.65
Total Cost to HH Customers (£) HHC = HHT * HHD 8,593,167
Increase in NHH Demand tariff (p/kWh) NHHT = (C - HHC)/NHHD 0.09
Total Cost to NHH Customers (£) NHHC = NHHT * NHHD 21,385,482
Small Generator Discount Calculation

NGET: Forecast TNUoS Tariffs for 2018/19 June 2017 28
Tools and Supporting Information
Further information
We are keen to ensure that customers understand the current charging arrangements and the reason why tariffs change. If you have specific queries on this forecast please contact us using the details below. Feedback on the content and format of this forecast is also welcome. We are particularly interested to hear how accessible you find the report and if it provides the right level of detail.
Charging forums
We will hold a webinar for the June tariffs on Friday 7 July from 10:30 to 11:30. If you wish to join the webinar, please contact us using the details below. We always welcome questions and are happy to discuss specific aspects of the material contained in the June tariffs report should you wish to do so.
Charging models
We can provide a copy of our charging model. If you would like a copy of the model to be emailed to you, together with a user guide, please contact us using the details below. Please note that, while the model is available free of charge, it is provided under licence to restrict, among other things, its distribution and commercial use.
Numerical data
All tables in this document can be downloaded as an Excel spreadsheet from our website: http://www2.nationalgrid.com/UK/Industry-information/System-charges/Electricity-transmission/Approval-conditions/Condition-5/
Team Email & Phone [email protected] 01926 654633

NGET: Forecast TNUoS Tariffs for 2018/19 June 2017 29
Appendices
Appendix A: Locational Demand Charges
Appendix B: Breakdown of Demand Tariffs
Appendix C: Annual Load Factors
Appendix D: Transmission Company Revenues
Appendix E: Generation Zones Map
Appendix F: Demand Zone Map
NGET: Forecast TNUoS Tariffs for 2018/19 June 2017 30
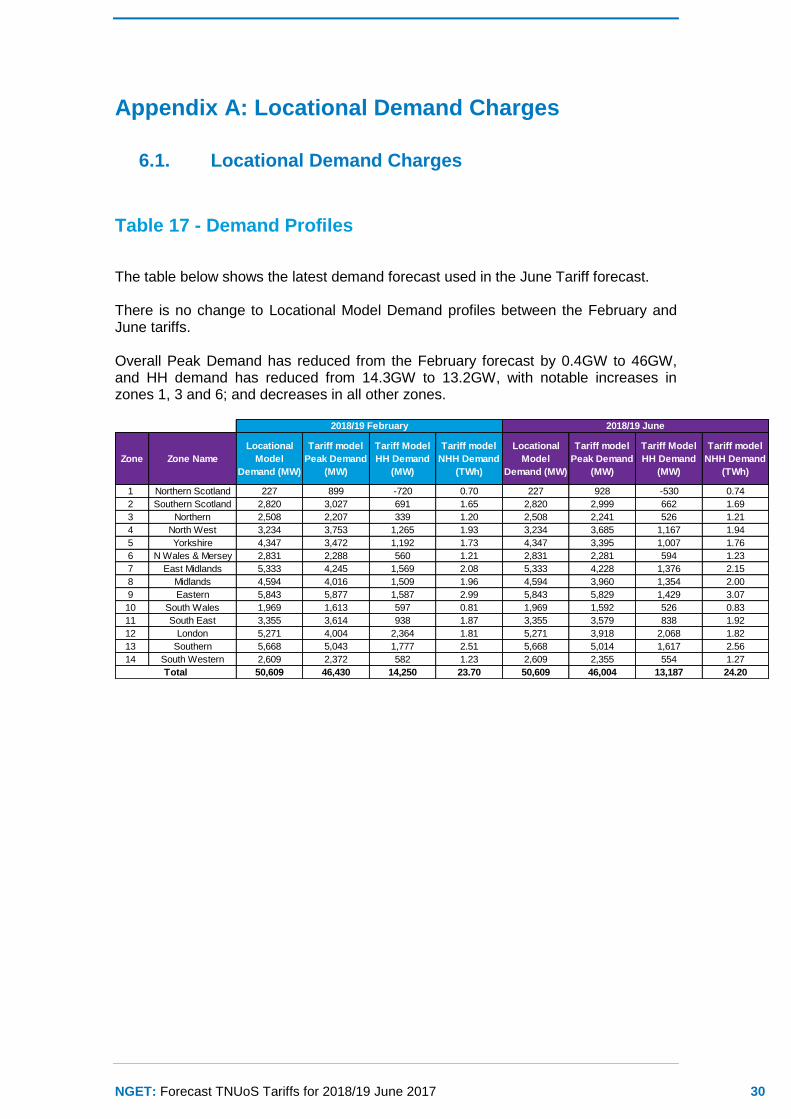
Appendix A: Locational Demand Charges
6.1. Locational Demand Charges
Table 17 - Demand Profiles
The table below shows the latest demand forecast used in the June Tariff forecast. There is no change to Locational Model Demand profiles between the February and June tariffs. Overall Peak Demand has reduced from the February forecast by 0.4GW to 46GW, and HH demand has reduced from 14.3GW to 13.2GW, with notable increases in zones 1, 3 and 6; and decreases in all other zones.
Zone Zone Name
Locational
Model
Demand (MW)
Tariff model
Peak Demand
(MW)
Tariff Model
HH Demand
(MW)
Tariff model
NHH Demand
(TWh)
Locational
Model
Demand (MW)
Tariff model
Peak Demand
(MW)
Tariff Model
HH Demand
(MW)
Tariff model
NHH Demand
(TWh)
1 Northern Scotland 227 899 -720 0.70 227 928 -530 0.74
2 Southern Scotland 2,820 3,027 691 1.65 2,820 2,999 662 1.69
3 Northern 2,508 2,207 339 1.20 2,508 2,241 526 1.21
4 North West 3,234 3,753 1,265 1.93 3,234 3,685 1,167 1.94
5 Yorkshire 4,347 3,472 1,192 1.73 4,347 3,395 1,007 1.76
6 N Wales & Mersey 2,831 2,288 560 1.21 2,831 2,281 594 1.23
7 East Midlands 5,333 4,245 1,569 2.08 5,333 4,228 1,376 2.15
8 Midlands 4,594 4,016 1,509 1.96 4,594 3,960 1,354 2.00
9 Eastern 5,843 5,877 1,587 2.99 5,843 5,829 1,429 3.07
10 South Wales 1,969 1,613 597 0.81 1,969 1,592 526 0.83
11 South East 3,355 3,614 938 1.87 3,355 3,579 838 1.92
12 London 5,271 4,004 2,364 1.81 5,271 3,918 2,068 1.82
13 Southern 5,668 5,043 1,777 2.51 5,668 5,014 1,617 2.56
14 South Western 2,609 2,372 582 1.23 2,609 2,355 554 1.27
50,609 46,430 14,250 23.70 50,609 46,004 13,187 24.20
2018/19 February 2018/19 June
Total
NGET: Forecast TNUoS Tariffs for 2018/19 June 2017 31
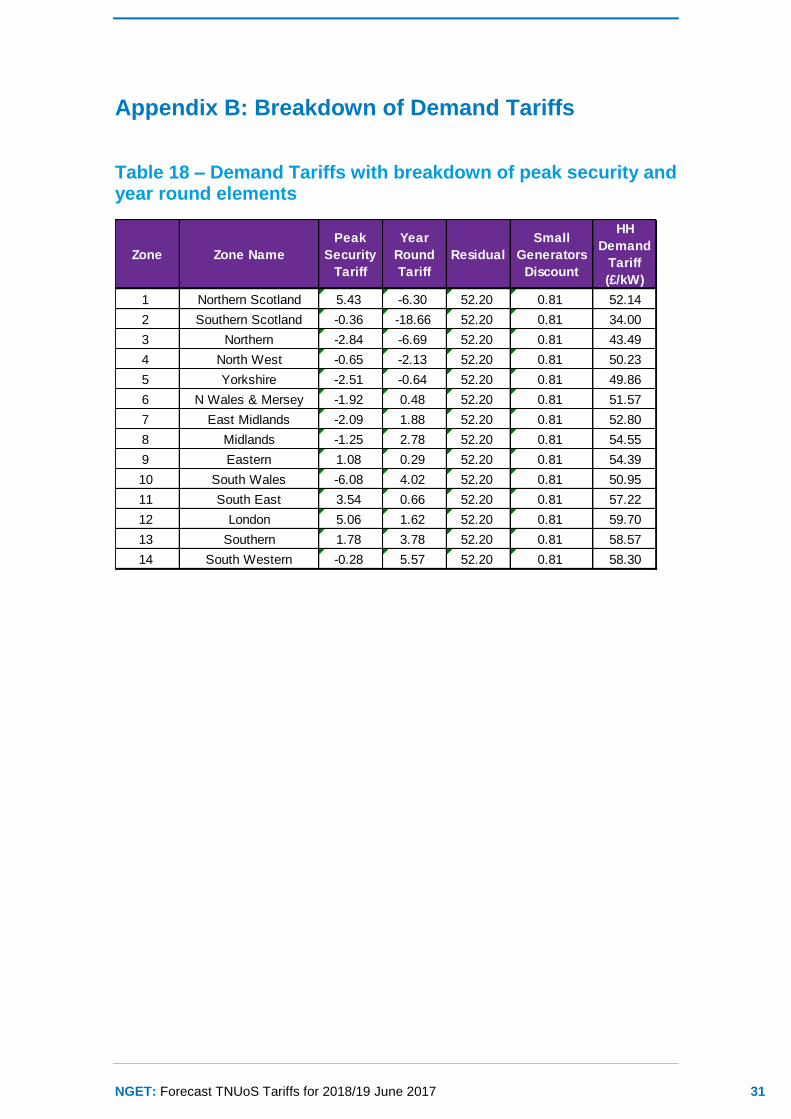
Appendix B: Breakdown of Demand Tariffs
Table 18 – Demand Tariffs with breakdown of peak security and year round elements
Zone Zone Name
Peak
Security
Tariff
Year
Round
Tariff
Residual
Small
Generators
Discount
HH
Demand
Tariff
(£/kW)
1 Northern Scotland 5.43 -6.30 52.20 0.81 52.14
2 Southern Scotland -0.36 -18.66 52.20 0.81 34.00
3 Northern -2.84 -6.69 52.20 0.81 43.49
4 North West -0.65 -2.13 52.20 0.81 50.23
5 Yorkshire -2.51 -0.64 52.20 0.81 49.86
6 N Wales & Mersey -1.92 0.48 52.20 0.81 51.57
7 East Midlands -2.09 1.88 52.20 0.81 52.80
8 Midlands -1.25 2.78 52.20 0.81 54.55
9 Eastern 1.08 0.29 52.20 0.81 54.39
10 South Wales -6.08 4.02 52.20 0.81 50.95
11 South East 3.54 0.66 52.20 0.81 57.22
12 London 5.06 1.62 52.20 0.81 59.70
13 Southern 1.78 3.78 52.20 0.81 58.57
14 South Western -0.28 5.57 52.20 0.81 58.30
NGET: Forecast TNUoS Tariffs for 2018/19 June 2017 32
Appendix C: Annual Load Factors
7.1. ALFs
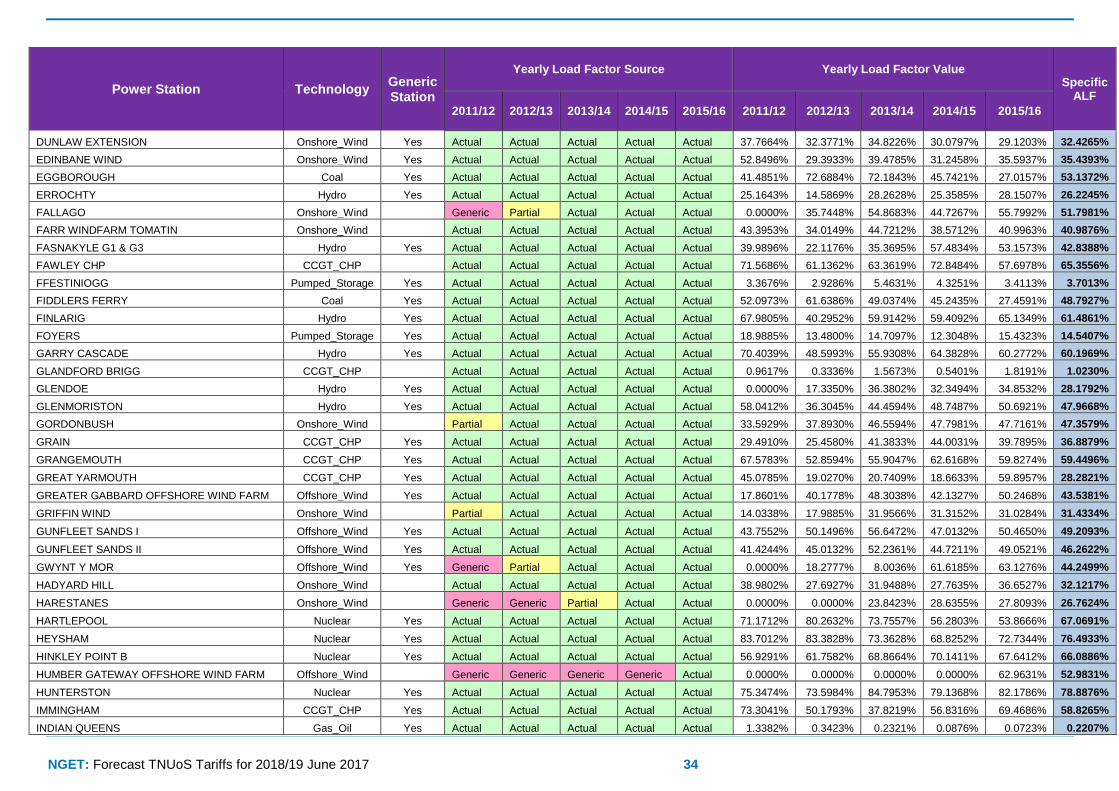
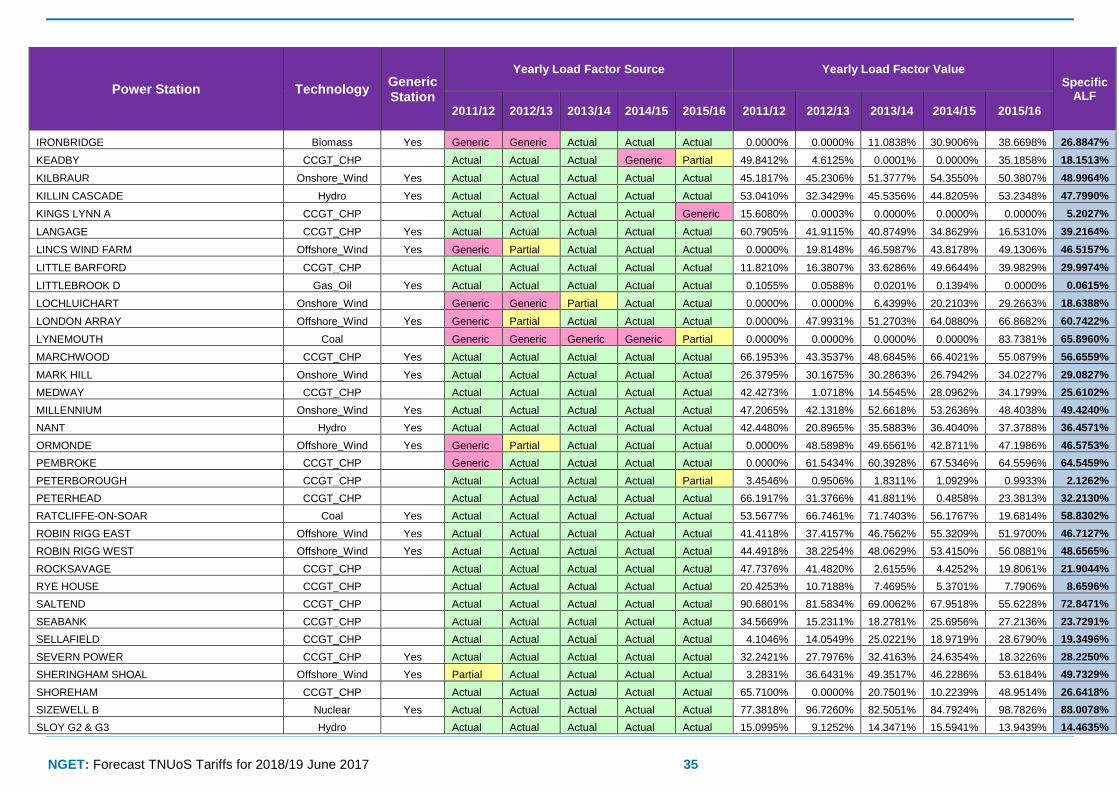
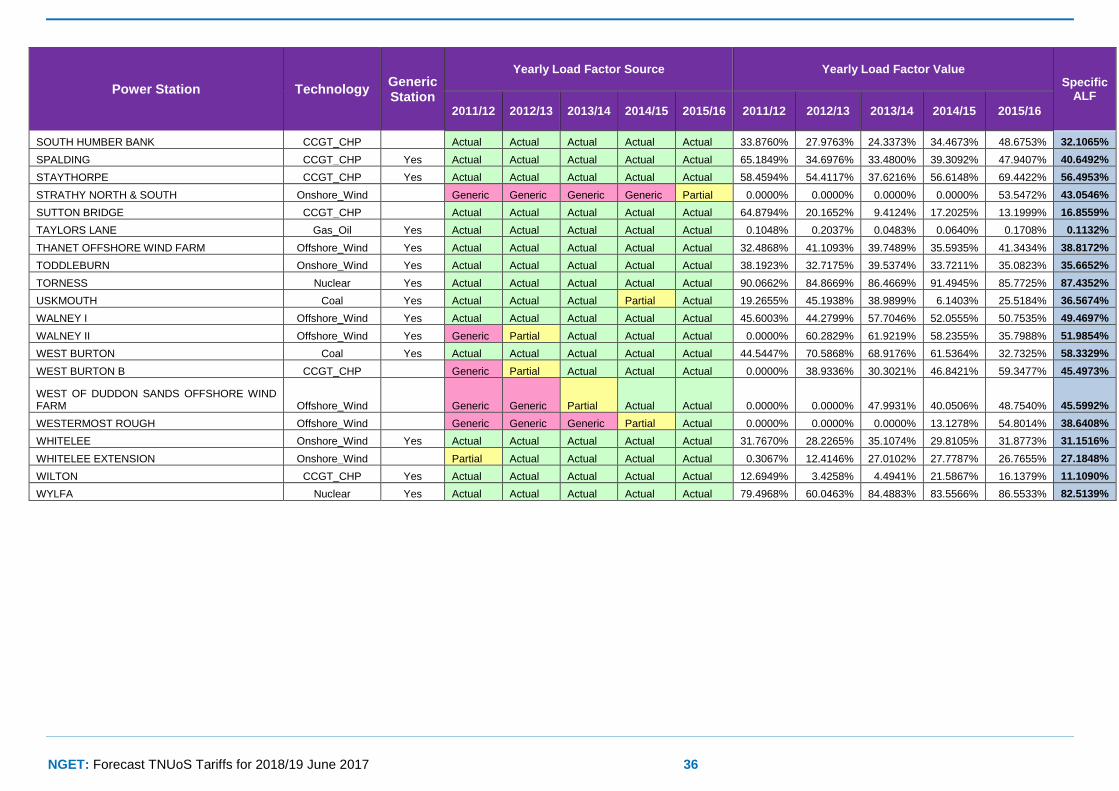
Table 19 lists the Annual Load Factors (ALF) of generators expected to be liable for generator charges during 2018/19. ALFs are used to scale the Shared Year Round element of tariffs so each generator has a tariff appropriate to its historical load factor. ALFs have been calculated using Transmission Entry Capacity, Metered Output and Final Physical Notifications from charging years 2011/12 to 2015/16. Generators which commissioned after 1 April 2013 will have fewer than three complete years of data so the Generic ALF listed below are added to create three complete years from which the ALF can be calculated. Generators expected to commission during 2018/19 also use the Generic ALF. These ALFs will be updated for the Draft and Final Tariffs published in December and January respectively.†††
Table 19: Specific Annual Load Factors
†††
The Final ALFs report for 2017-18 can be found here: http://www2.nationalgrid.com/UK/Industry-information/System-charges/Electricity-transmission/Approval-
conditions/Condition-5/
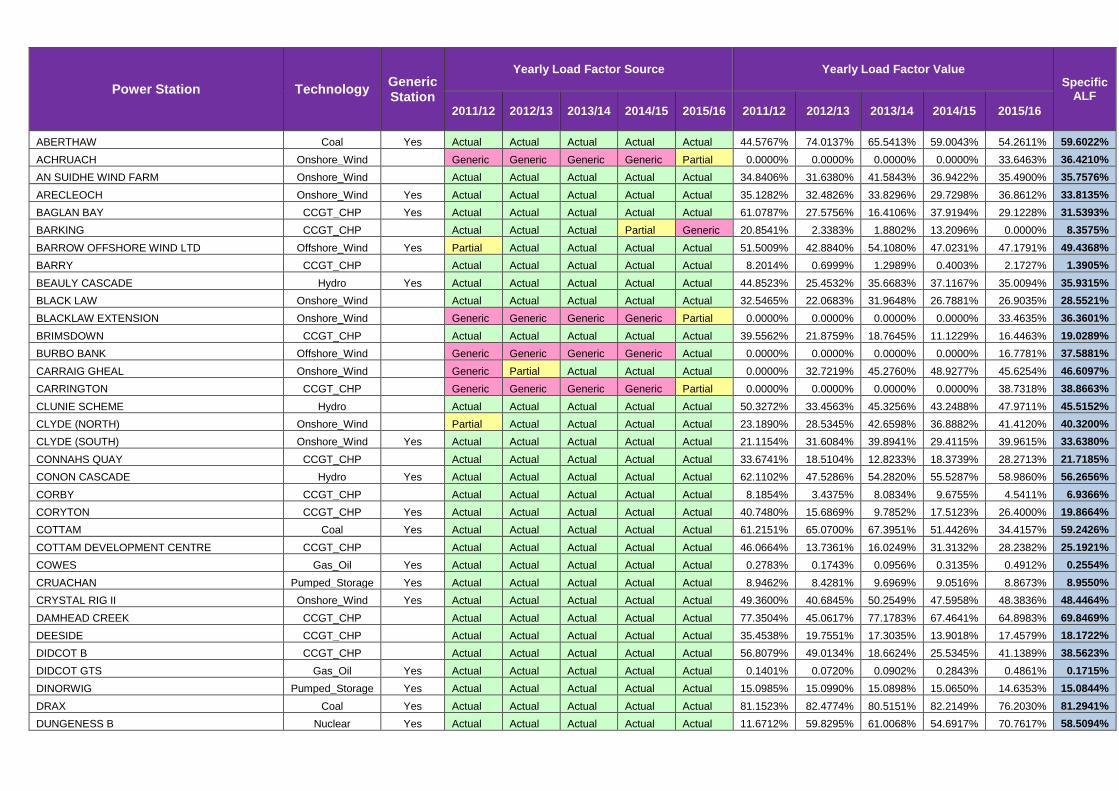
Power Station Technology Generic Station
Yearly Load Factor Source Yearly Load Factor Value Specific
ALF
2011/12 2012/13 2013/14 2014/15 2015/16 2011/12 2012/13 2013/14 2014/15 2015/16
ABERTHAW Coal Yes Actual Actual Actual Actual Actual 44.5767% 74.0137% 65.5413% 59.0043% 54.2611% 59.6022%
ACHRUACH Onshore_Wind Generic Generic Generic Generic Partial 0.0000% 0.0000% 0.0000% 0.0000% 33.6463% 36.4210%
AN SUIDHE WIND FARM Onshore_Wind Actual Actual Actual Actual Actual 34.8406% 31.6380% 41.5843% 36.9422% 35.4900% 35.7576%
ARECLEOCH Onshore_Wind Yes Actual Actual Actual Actual Actual 35.1282% 32.4826% 33.8296% 29.7298% 36.8612% 33.8135%
BAGLAN BAY CCGT_CHP Yes Actual Actual Actual Actual Actual 61.0787% 27.5756% 16.4106% 37.9194% 29.1228% 31.5393%
BARKING CCGT_CHP Actual Actual Actual Partial Generic 20.8541% 2.3383% 1.8802% 13.2096% 0.0000% 8.3575%
BARROW OFFSHORE WIND LTD Offshore_Wind Yes Partial Actual Actual Actual Actual 51.5009% 42.8840% 54.1080% 47.0231% 47.1791% 49.4368%
BARRY CCGT_CHP Actual Actual Actual Actual Actual 8.2014% 0.6999% 1.2989% 0.4003% 2.1727% 1.3905%
BEAULY CASCADE Hydro Yes Actual Actual Actual Actual Actual 44.8523% 25.4532% 35.6683% 37.1167% 35.0094% 35.9315%
BLACK LAW Onshore_Wind Actual Actual Actual Actual Actual 32.5465% 22.0683% 31.9648% 26.7881% 26.9035% 28.5521%
BLACKLAW EXTENSION Onshore_Wind Generic Generic Generic Generic Partial 0.0000% 0.0000% 0.0000% 0.0000% 33.4635% 36.3601%
BRIMSDOWN CCGT_CHP Actual Actual Actual Actual Actual 39.5562% 21.8759% 18.7645% 11.1229% 16.4463% 19.0289%
BURBO BANK Offshore_Wind Generic Generic Generic Generic Actual 0.0000% 0.0000% 0.0000% 0.0000% 16.7781% 37.5881%
CARRAIG GHEAL Onshore_Wind Generic Partial Actual Actual Actual 0.0000% 32.7219% 45.2760% 48.9277% 45.6254% 46.6097%
CARRINGTON CCGT_CHP Generic Generic Generic Generic Partial 0.0000% 0.0000% 0.0000% 0.0000% 38.7318% 38.8663%
CLUNIE SCHEME Hydro Actual Actual Actual Actual Actual 50.3272% 33.4563% 45.3256% 43.2488% 47.9711% 45.5152%
CLYDE (NORTH) Onshore_Wind Partial Actual Actual Actual Actual 23.1890% 28.5345% 42.6598% 36.8882% 41.4120% 40.3200%
CLYDE (SOUTH) Onshore_Wind Yes Actual Actual Actual Actual Actual 21.1154% 31.6084% 39.8941% 29.4115% 39.9615% 33.6380%
CONNAHS QUAY CCGT_CHP Actual Actual Actual Actual Actual 33.6741% 18.5104% 12.8233% 18.3739% 28.2713% 21.7185%
CONON CASCADE Hydro Yes Actual Actual Actual Actual Actual 62.1102% 47.5286% 54.2820% 55.5287% 58.9860% 56.2656%
CORBY CCGT_CHP Actual Actual Actual Actual Actual 8.1854% 3.4375% 8.0834% 9.6755% 4.5411% 6.9366%
CORYTON CCGT_CHP Yes Actual Actual Actual Actual Actual 40.7480% 15.6869% 9.7852% 17.5123% 26.4000% 19.8664%
COTTAM Coal Yes Actual Actual Actual Actual Actual 61.2151% 65.0700% 67.3951% 51.4426% 34.4157% 59.2426%
COTTAM DEVELOPMENT CENTRE CCGT_CHP Actual Actual Actual Actual Actual 46.0664% 13.7361% 16.0249% 31.3132% 28.2382% 25.1921%
COWES Gas_Oil Yes Actual Actual Actual Actual Actual 0.2783% 0.1743% 0.0956% 0.3135% 0.4912% 0.2554%
CRUACHAN Pumped_Storage Yes Actual Actual Actual Actual Actual 8.9462% 8.4281% 9.6969% 9.0516% 8.8673% 8.9550%
CRYSTAL RIG II Onshore_Wind Yes Actual Actual Actual Actual Actual 49.3600% 40.6845% 50.2549% 47.5958% 48.3836% 48.4464%
DAMHEAD CREEK CCGT_CHP Actual Actual Actual Actual Actual 77.3504% 45.0617% 77.1783% 67.4641% 64.8983% 69.8469%
DEESIDE CCGT_CHP Actual Actual Actual Actual Actual 35.4538% 19.7551% 17.3035% 13.9018% 17.4579% 18.1722%
DIDCOT B CCGT_CHP Actual Actual Actual Actual Actual 56.8079% 49.0134% 18.6624% 25.5345% 41.1389% 38.5623%
DIDCOT GTS Gas_Oil Yes Actual Actual Actual Actual Actual 0.1401% 0.0720% 0.0902% 0.2843% 0.4861% 0.1715%
DINORWIG Pumped_Storage Yes Actual Actual Actual Actual Actual 15.0985% 15.0990% 15.0898% 15.0650% 14.6353% 15.0844%
DRAX Coal Yes Actual Actual Actual Actual Actual 81.1523% 82.4774% 80.5151% 82.2149% 76.2030% 81.2941%
DUNGENESS B Nuclear Yes Actual Actual Actual Actual Actual 11.6712% 59.8295% 61.0068% 54.6917% 70.7617% 58.5094%
NGET: Forecast TNUoS Tariffs for 2018/19 June 2017 34
Power Station Technology Generic Station
Yearly Load Factor Source Yearly Load Factor Value Specific
ALF
2011/12 2012/13 2013/14 2014/15 2015/16 2011/12 2012/13 2013/14 2014/15 2015/16
DUNLAW EXTENSION Onshore_Wind Yes Actual Actual Actual Actual Actual 37.7664% 32.3771% 34.8226% 30.0797% 29.1203% 32.4265%
EDINBANE WIND Onshore_Wind Yes Actual Actual Actual Actual Actual 52.8496% 29.3933% 39.4785% 31.2458% 35.5937% 35.4393%
EGGBOROUGH Coal Yes Actual Actual Actual Actual Actual 41.4851% 72.6884% 72.1843% 45.7421% 27.0157% 53.1372%
ERROCHTY Hydro Yes Actual Actual Actual Actual Actual 25.1643% 14.5869% 28.2628% 25.3585% 28.1507% 26.2245%
FALLAGO Onshore_Wind Generic Partial Actual Actual Actual 0.0000% 35.7448% 54.8683% 44.7267% 55.7992% 51.7981%
FARR WINDFARM TOMATIN Onshore_Wind Actual Actual Actual Actual Actual 43.3953% 34.0149% 44.7212% 38.5712% 40.9963% 40.9876%
FASNAKYLE G1 & G3 Hydro Yes Actual Actual Actual Actual Actual 39.9896% 22.1176% 35.3695% 57.4834% 53.1573% 42.8388%
FAWLEY CHP CCGT_CHP Actual Actual Actual Actual Actual 71.5686% 61.1362% 63.3619% 72.8484% 57.6978% 65.3556%
FFESTINIOGG Pumped_Storage Yes Actual Actual Actual Actual Actual 3.3676% 2.9286% 5.4631% 4.3251% 3.4113% 3.7013%
FIDDLERS FERRY Coal Yes Actual Actual Actual Actual Actual 52.0973% 61.6386% 49.0374% 45.2435% 27.4591% 48.7927%
FINLARIG Hydro Yes Actual Actual Actual Actual Actual 67.9805% 40.2952% 59.9142% 59.4092% 65.1349% 61.4861%
FOYERS Pumped_Storage Yes Actual Actual Actual Actual Actual 18.9885% 13.4800% 14.7097% 12.3048% 15.4323% 14.5407%
GARRY CASCADE Hydro Yes Actual Actual Actual Actual Actual 70.4039% 48.5993% 55.9308% 64.3828% 60.2772% 60.1969%
GLANDFORD BRIGG CCGT_CHP Actual Actual Actual Actual Actual 0.9617% 0.3336% 1.5673% 0.5401% 1.8191% 1.0230%
GLENDOE Hydro Yes Actual Actual Actual Actual Actual 0.0000% 17.3350% 36.3802% 32.3494% 34.8532% 28.1792%
GLENMORISTON Hydro Yes Actual Actual Actual Actual Actual 58.0412% 36.3045% 44.4594% 48.7487% 50.6921% 47.9668%
GORDONBUSH Onshore_Wind Partial Actual Actual Actual Actual 33.5929% 37.8930% 46.5594% 47.7981% 47.7161% 47.3579%
GRAIN CCGT_CHP Yes Actual Actual Actual Actual Actual 29.4910% 25.4580% 41.3833% 44.0031% 39.7895% 36.8879%
GRANGEMOUTH CCGT_CHP Yes Actual Actual Actual Actual Actual 67.5783% 52.8594% 55.9047% 62.6168% 59.8274% 59.4496%
GREAT YARMOUTH CCGT_CHP Yes Actual Actual Actual Actual Actual 45.0785% 19.0270% 20.7409% 18.6633% 59.8957% 28.2821%
GREATER GABBARD OFFSHORE WIND FARM Offshore_Wind Yes Actual Actual Actual Actual Actual 17.8601% 40.1778% 48.3038% 42.1327% 50.2468% 43.5381%
GRIFFIN WIND Onshore_Wind Partial Actual Actual Actual Actual 14.0338% 17.9885% 31.9566% 31.3152% 31.0284% 31.4334%
GUNFLEET SANDS I Offshore_Wind Yes Actual Actual Actual Actual Actual 43.7552% 50.1496% 56.6472% 47.0132% 50.4650% 49.2093%
GUNFLEET SANDS II Offshore_Wind Yes Actual Actual Actual Actual Actual 41.4244% 45.0132% 52.2361% 44.7211% 49.0521% 46.2622%
GWYNT Y MOR Offshore_Wind Yes Generic Partial Actual Actual Actual 0.0000% 18.2777% 8.0036% 61.6185% 63.1276% 44.2499%
HADYARD HILL Onshore_Wind Actual Actual Actual Actual Actual 38.9802% 27.6927% 31.9488% 27.7635% 36.6527% 32.1217%
HARESTANES Onshore_Wind Generic Generic Partial Actual Actual 0.0000% 0.0000% 23.8423% 28.6355% 27.8093% 26.7624%
HARTLEPOOL Nuclear Yes Actual Actual Actual Actual Actual 71.1712% 80.2632% 73.7557% 56.2803% 53.8666% 67.0691%
HEYSHAM Nuclear Yes Actual Actual Actual Actual Actual 83.7012% 83.3828% 73.3628% 68.8252% 72.7344% 76.4933%
HINKLEY POINT B Nuclear Yes Actual Actual Actual Actual Actual 56.9291% 61.7582% 68.8664% 70.1411% 67.6412% 66.0886%
HUMBER GATEWAY OFFSHORE WIND FARM Offshore_Wind Generic Generic Generic Generic Actual 0.0000% 0.0000% 0.0000% 0.0000% 62.9631% 52.9831%
HUNTERSTON Nuclear Yes Actual Actual Actual Actual Actual 75.3474% 73.5984% 84.7953% 79.1368% 82.1786% 78.8876%
IMMINGHAM CCGT_CHP Yes Actual Actual Actual Actual Actual 73.3041% 50.1793% 37.8219% 56.8316% 69.4686% 58.8265%
INDIAN QUEENS Gas_Oil Yes Actual Actual Actual Actual Actual 1.3382% 0.3423% 0.2321% 0.0876% 0.0723% 0.2207%
NGET: Forecast TNUoS Tariffs for 2018/19 June 2017 35
Power Station Technology Generic Station
Yearly Load Factor Source Yearly Load Factor Value Specific
ALF
2011/12 2012/13 2013/14 2014/15 2015/16 2011/12 2012/13 2013/14 2014/15 2015/16
IRONBRIDGE Biomass Yes Generic Generic Actual Actual Actual 0.0000% 0.0000% 11.0838% 30.9006% 38.6698% 26.8847%
KEADBY CCGT_CHP Actual Actual Actual Generic Partial 49.8412% 4.6125% 0.0001% 0.0000% 35.1858% 18.1513%
KILBRAUR Onshore_Wind Yes Actual Actual Actual Actual Actual 45.1817% 45.2306% 51.3777% 54.3550% 50.3807% 48.9964%
KILLIN CASCADE Hydro Yes Actual Actual Actual Actual Actual 53.0410% 32.3429% 45.5356% 44.8205% 53.2348% 47.7990%
KINGS LYNN A CCGT_CHP Actual Actual Actual Actual Generic 15.6080% 0.0003% 0.0000% 0.0000% 0.0000% 5.2027%
LANGAGE CCGT_CHP Yes Actual Actual Actual Actual Actual 60.7905% 41.9115% 40.8749% 34.8629% 16.5310% 39.2164%
LINCS WIND FARM Offshore_Wind Yes Generic Partial Actual Actual Actual 0.0000% 19.8148% 46.5987% 43.8178% 49.1306% 46.5157%
LITTLE BARFORD CCGT_CHP Actual Actual Actual Actual Actual 11.8210% 16.3807% 33.6286% 49.6644% 39.9829% 29.9974%
LITTLEBROOK D Gas_Oil Yes Actual Actual Actual Actual Actual 0.1055% 0.0588% 0.0201% 0.1394% 0.0000% 0.0615%
LOCHLUICHART Onshore_Wind Generic Generic Partial Actual Actual 0.0000% 0.0000% 6.4399% 20.2103% 29.2663% 18.6388%
LONDON ARRAY Offshore_Wind Yes Generic Partial Actual Actual Actual 0.0000% 47.9931% 51.2703% 64.0880% 66.8682% 60.7422%
LYNEMOUTH Coal Generic Generic Generic Generic Partial 0.0000% 0.0000% 0.0000% 0.0000% 83.7381% 65.8960%
MARCHWOOD CCGT_CHP Yes Actual Actual Actual Actual Actual 66.1953% 43.3537% 48.6845% 66.4021% 55.0879% 56.6559%
MARK HILL Onshore_Wind Yes Actual Actual Actual Actual Actual 26.3795% 30.1675% 30.2863% 26.7942% 34.0227% 29.0827%
MEDWAY CCGT_CHP Actual Actual Actual Actual Actual 42.4273% 1.0718% 14.5545% 28.0962% 34.1799% 25.6102%
MILLENNIUM Onshore_Wind Yes Actual Actual Actual Actual Actual 47.2065% 42.1318% 52.6618% 53.2636% 48.4038% 49.4240%
NANT Hydro Yes Actual Actual Actual Actual Actual 42.4480% 20.8965% 35.5883% 36.4040% 37.3788% 36.4571%
ORMONDE Offshore_Wind Yes Generic Partial Actual Actual Actual 0.0000% 48.5898% 49.6561% 42.8711% 47.1986% 46.5753%
PEMBROKE CCGT_CHP Generic Actual Actual Actual Actual 0.0000% 61.5434% 60.3928% 67.5346% 64.5596% 64.5459%
PETERBOROUGH CCGT_CHP Actual Actual Actual Actual Partial 3.4546% 0.9506% 1.8311% 1.0929% 0.9933% 2.1262%
PETERHEAD CCGT_CHP Actual Actual Actual Actual Actual 66.1917% 31.3766% 41.8811% 0.4858% 23.3813% 32.2130%
RATCLIFFE-ON-SOAR Coal Yes Actual Actual Actual Actual Actual 53.5677% 66.7461% 71.7403% 56.1767% 19.6814% 58.8302%
ROBIN RIGG EAST Offshore_Wind Yes Actual Actual Actual Actual Actual 41.4118% 37.4157% 46.7562% 55.3209% 51.9700% 46.7127%
ROBIN RIGG WEST Offshore_Wind Yes Actual Actual Actual Actual Actual 44.4918% 38.2254% 48.0629% 53.4150% 56.0881% 48.6565%
ROCKSAVAGE CCGT_CHP Actual Actual Actual Actual Actual 47.7376% 41.4820% 2.6155% 4.4252% 19.8061% 21.9044%
RYE HOUSE CCGT_CHP Actual Actual Actual Actual Actual 20.4253% 10.7188% 7.4695% 5.3701% 7.7906% 8.6596%
SALTEND CCGT_CHP Actual Actual Actual Actual Actual 90.6801% 81.5834% 69.0062% 67.9518% 55.6228% 72.8471%
SEABANK CCGT_CHP Actual Actual Actual Actual Actual 34.5669% 15.2311% 18.2781% 25.6956% 27.2136% 23.7291%
SELLAFIELD CCGT_CHP Actual Actual Actual Actual Actual 4.1046% 14.0549% 25.0221% 18.9719% 28.6790% 19.3496%
SEVERN POWER CCGT_CHP Yes Actual Actual Actual Actual Actual 32.2421% 27.7976% 32.4163% 24.6354% 18.3226% 28.2250%
SHERINGHAM SHOAL Offshore_Wind Yes Partial Actual Actual Actual Actual 3.2831% 36.6431% 49.3517% 46.2286% 53.6184% 49.7329%
SHOREHAM CCGT_CHP Actual Actual Actual Actual Actual 65.7100% 0.0000% 20.7501% 10.2239% 48.9514% 26.6418%
SIZEWELL B Nuclear Yes Actual Actual Actual Actual Actual 77.3818% 96.7260% 82.5051% 84.7924% 98.7826% 88.0078%
SLOY G2 & G3 Hydro Actual Actual Actual Actual Actual 15.0995% 9.1252% 14.3471% 15.5941% 13.9439% 14.4635%
NGET: Forecast TNUoS Tariffs for 2018/19 June 2017 36
Power Station Technology Generic Station
Yearly Load Factor Source Yearly Load Factor Value Specific
ALF
2011/12 2012/13 2013/14 2014/15 2015/16 2011/12 2012/13 2013/14 2014/15 2015/16
SOUTH HUMBER BANK CCGT_CHP Actual Actual Actual Actual Actual 33.8760% 27.9763% 24.3373% 34.4673% 48.6753% 32.1065%
SPALDING CCGT_CHP Yes Actual Actual Actual Actual Actual 65.1849% 34.6976% 33.4800% 39.3092% 47.9407% 40.6492%
STAYTHORPE CCGT_CHP Yes Actual Actual Actual Actual Actual 58.4594% 54.4117% 37.6216% 56.6148% 69.4422% 56.4953%
STRATHY NORTH & SOUTH Onshore_Wind Generic Generic Generic Generic Partial 0.0000% 0.0000% 0.0000% 0.0000% 53.5472% 43.0546%
SUTTON BRIDGE CCGT_CHP Actual Actual Actual Actual Actual 64.8794% 20.1652% 9.4124% 17.2025% 13.1999% 16.8559%
TAYLORS LANE Gas_Oil Yes Actual Actual Actual Actual Actual 0.1048% 0.2037% 0.0483% 0.0640% 0.1708% 0.1132%
THANET OFFSHORE WIND FARM Offshore_Wind Yes Actual Actual Actual Actual Actual 32.4868% 41.1093% 39.7489% 35.5935% 41.3434% 38.8172%
TODDLEBURN Onshore_Wind Yes Actual Actual Actual Actual Actual 38.1923% 32.7175% 39.5374% 33.7211% 35.0823% 35.6652%
TORNESS Nuclear Yes Actual Actual Actual Actual Actual 90.0662% 84.8669% 86.4669% 91.4945% 85.7725% 87.4352%
USKMOUTH Coal Yes Actual Actual Actual Partial Actual 19.2655% 45.1938% 38.9899% 6.1403% 25.5184% 36.5674%
WALNEY I Offshore_Wind Yes Actual Actual Actual Actual Actual 45.6003% 44.2799% 57.7046% 52.0555% 50.7535% 49.4697%
WALNEY II Offshore_Wind Yes Generic Partial Actual Actual Actual 0.0000% 60.2829% 61.9219% 58.2355% 35.7988% 51.9854%
WEST BURTON Coal Yes Actual Actual Actual Actual Actual 44.5447% 70.5868% 68.9176% 61.5364% 32.7325% 58.3329%
WEST BURTON B CCGT_CHP Generic Partial Actual Actual Actual 0.0000% 38.9336% 30.3021% 46.8421% 59.3477% 45.4973%
WEST OF DUDDON SANDS OFFSHORE WIND FARM Offshore_Wind Generic Generic Partial Actual Actual 0.0000% 0.0000% 47.9931% 40.0506% 48.7540% 45.5992%
WESTERMOST ROUGH Offshore_Wind Generic Generic Generic Partial Actual 0.0000% 0.0000% 0.0000% 13.1278% 54.8014% 38.6408%
WHITELEE Onshore_Wind Yes Actual Actual Actual Actual Actual 31.7670% 28.2265% 35.1074% 29.8105% 31.8773% 31.1516%
WHITELEE EXTENSION Onshore_Wind Partial Actual Actual Actual Actual 0.3067% 12.4146% 27.0102% 27.7787% 26.7655% 27.1848%
WILTON CCGT_CHP Yes Actual Actual Actual Actual Actual 12.6949% 3.4258% 4.4941% 21.5867% 16.1379% 11.1090%
WYLFA Nuclear Yes Actual Actual Actual Actual Actual 79.4968% 60.0463% 84.4883% 83.5566% 86.5533% 82.5139%
NGET: Forecast TNUoS Tariffs for 2018/19 June 2017 37
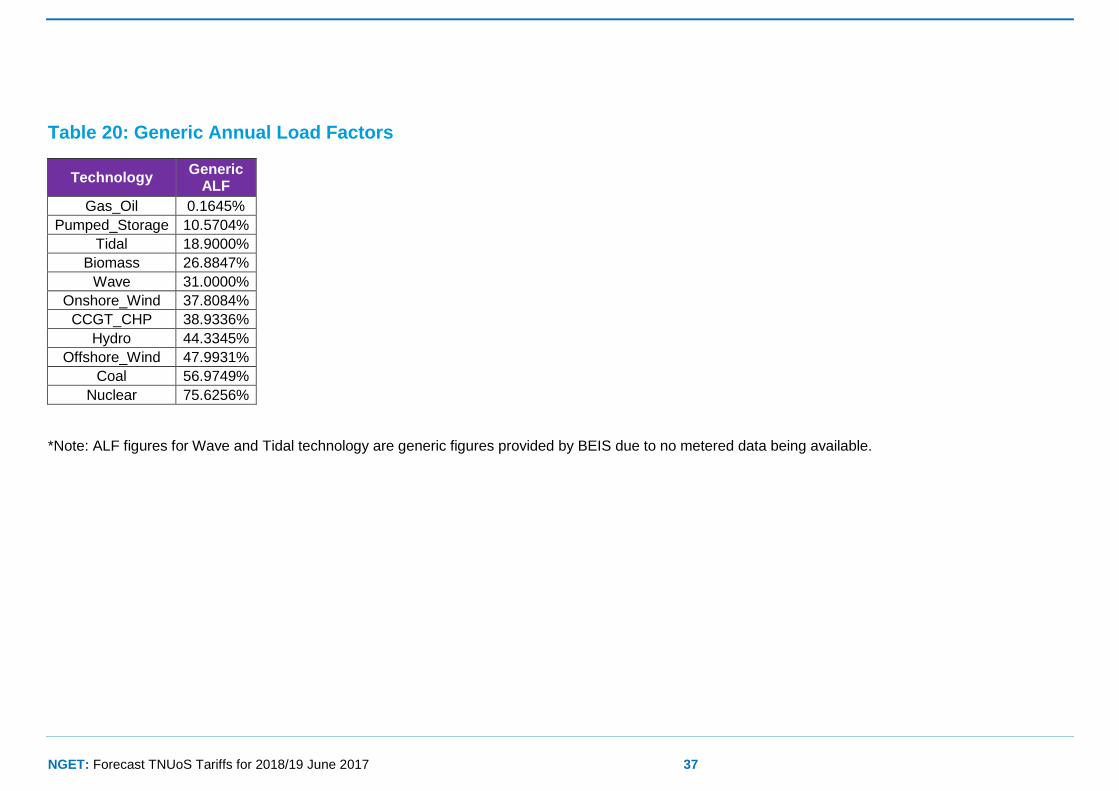
Table 20: Generic Annual Load Factors
Technology Generic
ALF
Gas_Oil 0.1645%
Pumped_Storage 10.5704%
Tidal 18.9000%
Biomass 26.8847%
Wave 31.0000%
Onshore_Wind 37.8084%
CCGT_CHP 38.9336%
Hydro 44.3345%
Offshore_Wind 47.9931%
Coal 56.9749%
Nuclear 75.6256%
*Note: ALF figures for Wave and Tidal technology are generic figures provided by BEIS due to no metered data being available.
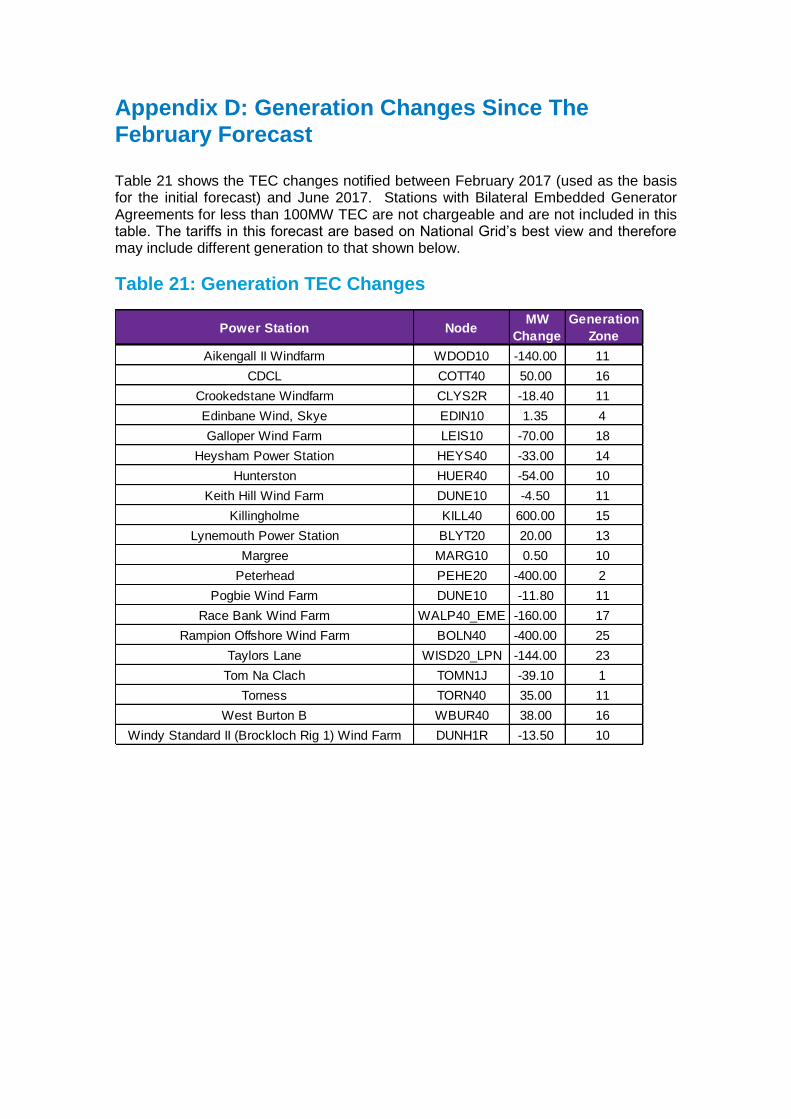
Appendix D: Generation Changes Since The
February Forecast
Table 21 shows the TEC changes notified between February 2017 (used as the basis for the initial forecast) and June 2017. Stations with Bilateral Embedded Generator Agreements for less than 100MW TEC are not chargeable and are not included in this table. The tariffs in this forecast are based on National Grid’s best view and therefore may include different generation to that shown below.
Table 21: Generation TEC Changes
Power Station NodeMW
Change
Generation
Zone
Aikengall II Windfarm WDOD10 -140.00 11
CDCL COTT40 50.00 16
Crookedstane Windfarm CLYS2R -18.40 11
Edinbane Wind, Skye EDIN10 1.35 4
Galloper Wind Farm LEIS10 -70.00 18
Heysham Power Station HEYS40 -33.00 14
Hunterston HUER40 -54.00 10
Keith Hill Wind Farm DUNE10 -4.50 11
Killingholme KILL40 600.00 15
Lynemouth Power Station BLYT20 20.00 13
Margree MARG10 0.50 10
Peterhead PEHE20 -400.00 2
Pogbie Wind Farm DUNE10 -11.80 11
Race Bank Wind Farm WALP40_EME -160.00 17
Rampion Offshore Wind Farm BOLN40 -400.00 25
Taylors Lane WISD20_LPN -144.00 23
Tom Na Clach TOMN1J -39.10 1
Torness TORN40 35.00 11
West Burton B WBUR40 38.00 16
Windy Standard II (Brockloch Rig 1) Wind Farm DUNH1R -13.50 10
NGET: Forecast TNUoS Tariffs for 2018/19 June 2017 39
Appendix E: Transmission Company Revenues
8.1. National Grid TO Revenue Forecast
We seek to provide the detail behind price control revenue forecasts for National Grid, Scottish Power Transmission and SHE Transmission, however, the contractual position between NGSO and TOs does not presently require a breakdown to the TO final position.
Revenue for offshore networks is included with forecasts by National Grid where the Offshore Transmission Owner has yet to be appointed.
Notes:
All monies are quoted in millions of pounds, accurate to one decimal place and are in nominal ‘money of the day’ prices unless stated otherwise.
Greyed out cells are either calculated or not applicable in the year concerned due to the way the licence formula are constructed.
Network Innovation Competition Funding is included in the National Grid price control but is additional to the price controls of onshore and offshore Transmission Owners who receive funding. NIC funding is therefore only shown in the National Grid table.
All reasonable care has been taken in the preparation of these illustrative tables and the data therein. National Grid and other Transmission Owners offer this data without prejudice and cannot be held responsible for any loss that might be attributed to the use of this data. Neither National Grid nor other Transmission Owners accept or assume responsibility for the use of this information by any person or any person to whom this information is shown or any person to whom this information otherwise becomes available.
The base revenue forecasts reflect the figures authorised by Ofgem in the RIIO-T1 or offshore price controls.
Within the bounds of commercial confidentiality these forecasts provide as much information as possible. Generally allowances determined by Ofgem are shown, whilst those for which Ofgem determinations are expected are not. This respects commercial confidentiality and disclosure considerations and actual revenues may vary for these forecasts.
It is assumed that there is only one set of price changes each year on 1 April.
NGET: Forecast TNUoS Tariffs for 2018/19 June 2017 40
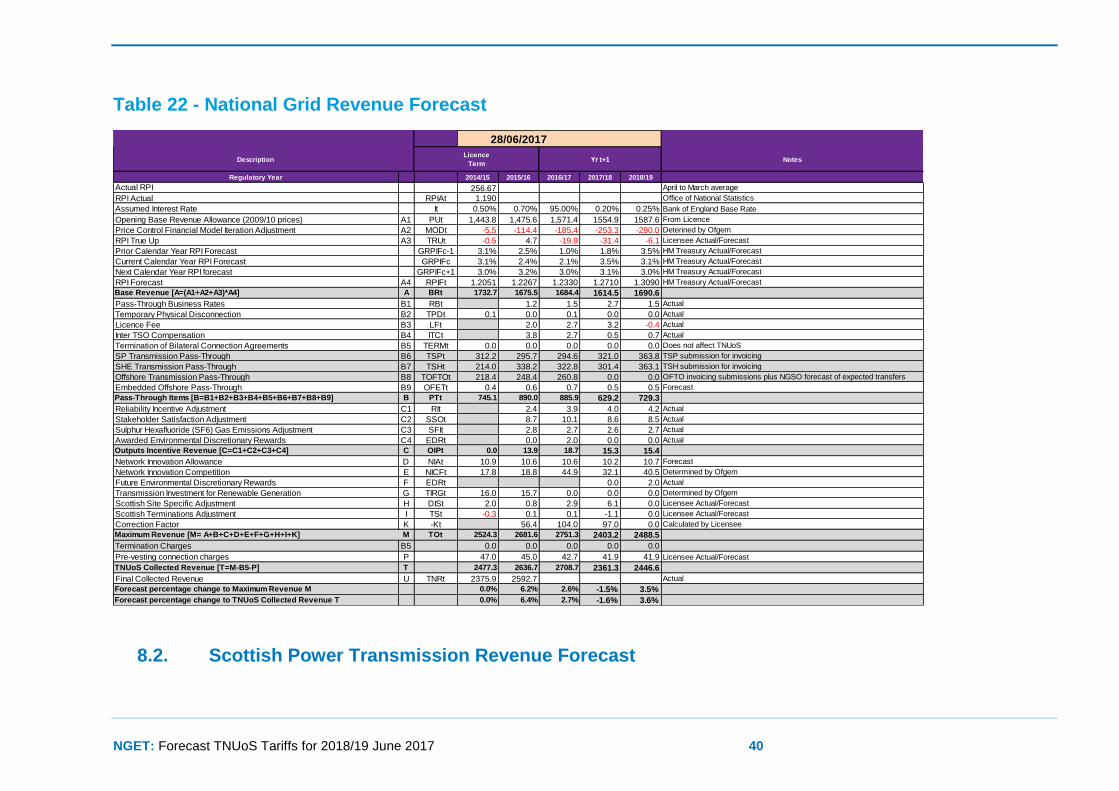
Table 22 - National Grid Revenue Forecast
8.2. Scottish Power Transmission Revenue Forecast
Description Notes
Regulatory Year 2014/15 2015/16 2016/17 2017/18 2018/19
Actual RPI 256.67 April to March average
RPI Actual RPIAt 1.190 Office of National Statistics
Assumed Interest Rate It 0.50% 0.70% 95.00% 0.20% 0.25% Bank of England Base Rate
Opening Base Revenue Allowance (2009/10 prices) A1 PUt 1,443.8 1,475.6 1,571.4 1554.9 1587.6 From Licence
Price Control Financial Model Iteration Adjustment A2 MODt -5.5 -114.4 -185.4 -253.3 -290.0 Deterined by Ofgem
RPI True Up A3 TRUt -0.5 4.7 -19.9 -31.4 -6.1 Licensee Actual/Forecast
Prior Calendar Year RPI Forecast GRPIFc-1 3.1% 2.5% 1.0% 1.8% 3.5% HM Treasury Actual/Forecast
Current Calendar Year RPI Forecast GRPIFc 3.1% 2.4% 2.1% 3.5% 3.1% HM Treasury Actual/Forecast
Next Calendar Year RPI forecast GRPIFc+1 3.0% 3.2% 3.0% 3.1% 3.0% HM Treasury Actual/Forecast
RPI Forecast A4 RPIFt 1.2051 1.2267 1.2330 1.2710 1.3090 HM Treasury Actual/Forecast
Base Revenue [A=(A1+A2+A3)*A4] A BRt 1732.7 1675.5 1684.4 1614.5 1690.6
Pass-Through Business Rates B1 RBt 1.2 1.5 2.7 1.5 Actual
Temporary Physical Disconnection B2 TPDt 0.1 0.0 0.1 0.0 0.0 Actual
Licence Fee B3 LFt 2.0 2.7 3.2 -0.4 Actual
Inter TSO Compensation B4 ITCt 3.8 2.7 0.5 0.7 Actual
Termination of Bilateral Connection Agreements B5 TERMt 0.0 0.0 0.0 0.0 0.0 Does not affect TNUoS
SP Transmission Pass-Through B6 TSPt 312.2 295.7 294.6 321.0 363.8 TSP submission for invoicing
SHE Transmission Pass-Through B7 TSHt 214.0 338.2 322.8 301.4 363.1 TSH submission for invoicing
Offshore Transmission Pass-Through B8 TOFTOt 218.4 248.4 260.8 0.0 0.0 OFTO invoicing submissions plus NGSO forecast of expected transfers
Embedded Offshore Pass-Through B9 OFETt 0.4 0.6 0.7 0.5 0.5 Forecast
Pass-Through Items [B=B1+B2+B3+B4+B5+B6+B7+B8+B9] B PTt 745.1 890.0 885.9 629.2 729.3
Reliability Incentive Adjustment C1 RIt 2.4 3.9 4.0 4.2 Actual
Stakeholder Satisfaction Adjustment C2 SSOt 8.7 10.1 8.6 8.5 Actual
Sulphur Hexafluoride (SF6) Gas Emissions Adjustment C3 SFIt 2.8 2.7 2.6 2.7 Actual
Awarded Environmental Discretionary Rewards C4 EDRt 0.0 2.0 0.0 0.0 Actual
Outputs Incentive Revenue [C=C1+C2+C3+C4] C OIPt 0.0 13.9 18.7 15.3 15.4
Network Innovation Allowance D NIAt 10.9 10.6 10.6 10.2 10.7 Forecast
Network Innovation Competition E NICFt 17.8 18.8 44.9 32.1 40.5 Determined by Ofgem
Future Environmental Discretionary Rewards F EDRt 0.0 2.0 Actual
Transmission Investment for Renewable Generation G TIRGt 16.0 15.7 0.0 0.0 0.0 Determined by Ofgem
Scottish Site Specific Adjustment H DISt 2.0 0.8 2.9 6.1 0.0 Licensee Actual/Forecast
Scottish Terminations Adjustment I TSt -0.3 0.1 0.1 -1.1 0.0 Licensee Actual/Forecast
Correction Factor K -Kt 56.4 104.0 97.0 0.0 Calculated by Licensee
Maximum Revenue [M= A+B+C+D+E+F+G+H+I+K] M TOt 2524.3 2681.6 2751.3 2403.2 2488.5
Termination Charges B5 0.0 0.0 0.0 0.0 0.0
Pre-vesting connection charges P 47.0 45.0 42.7 41.9 41.9 Licensee Actual/Forecast
TNUoS Collected Revenue [T=M-B5-P] T 2477.3 2636.7 2708.7 2361.3 2446.6
Final Collected Revenue U TNRt 2375.9 2592.7 Actual
Forecast percentage change to Maximum Revenue M 0.0% 6.2% 2.6% -1.5% 3.5%
Forecast percentage change to TNUoS Collected Revenue T 0.0% 6.4% 2.7% -1.6% 3.6%
28/06/2017
Licence
TermYr t+1
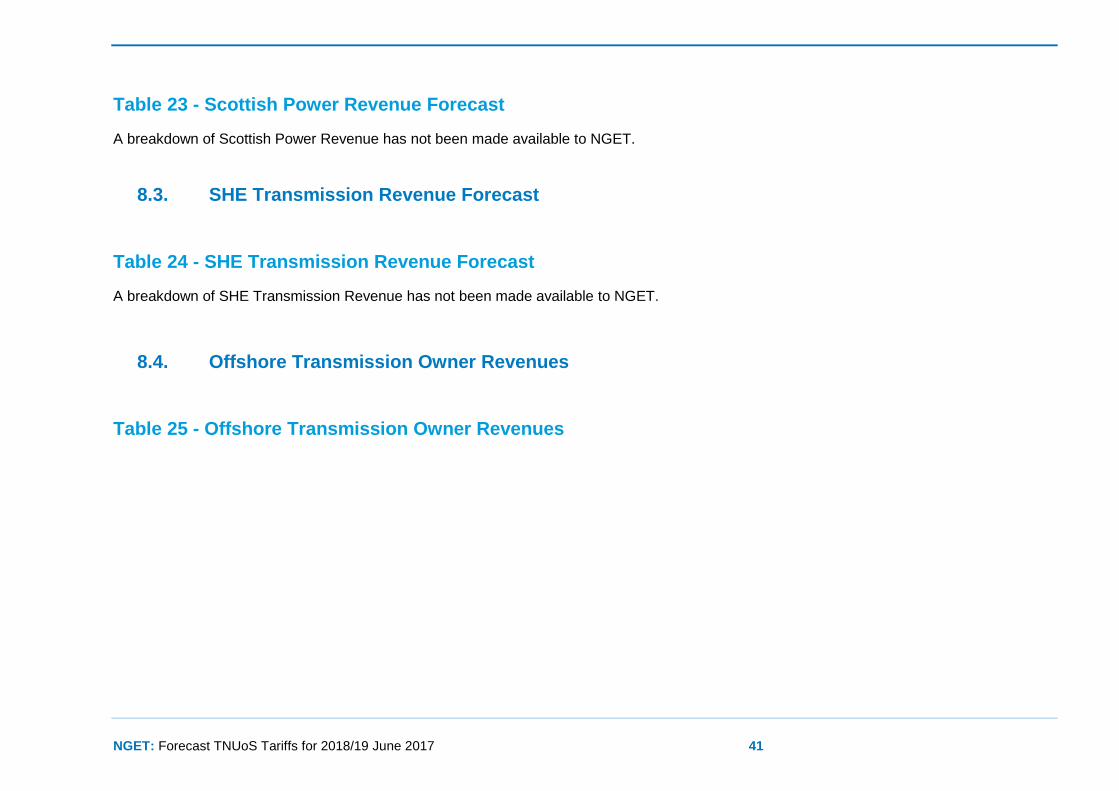
NGET: Forecast TNUoS Tariffs for 2018/19 June 2017 41
Table 23 - Scottish Power Revenue Forecast
A breakdown of Scottish Power Revenue has not been made available to NGET.
8.3. SHE Transmission Revenue Forecast
Table 24 - SHE Transmission Revenue Forecast
A breakdown of SHE Transmission Revenue has not been made available to NGET.
8.4. Offshore Transmission Owner Revenues
Table 25 - Offshore Transmission Owner Revenues
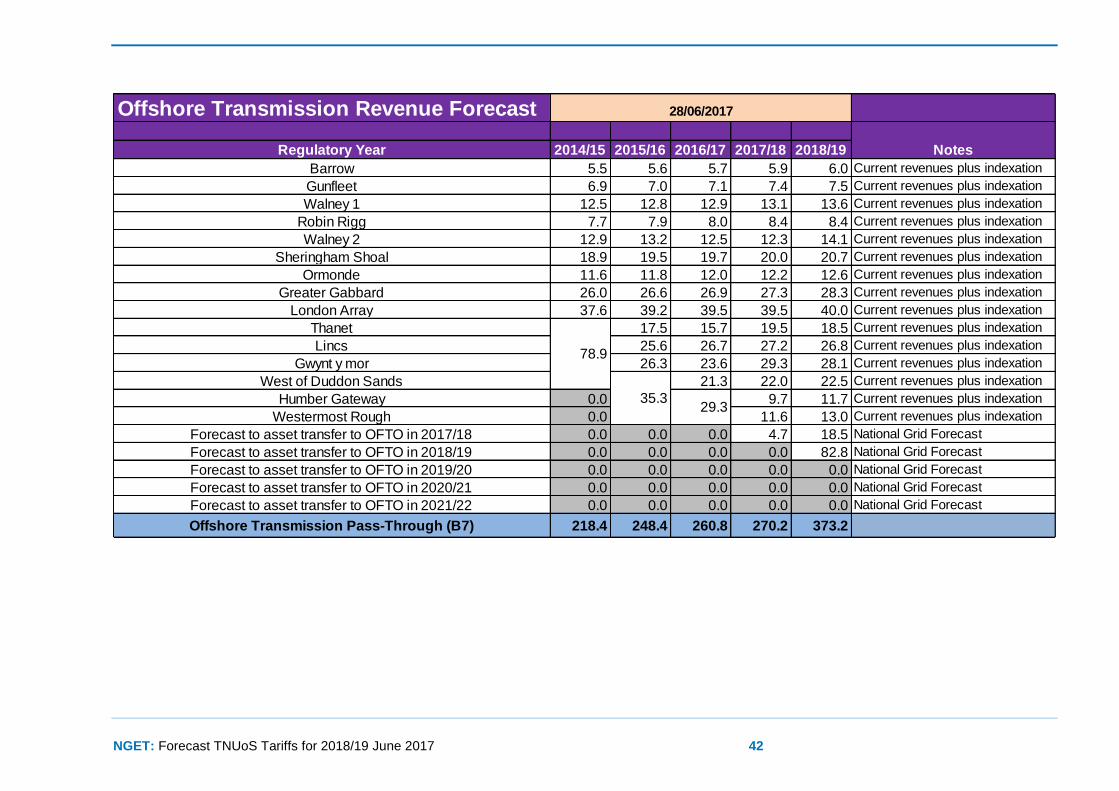
NGET: Forecast TNUoS Tariffs for 2018/19 June 2017 42
Offshore Transmission Revenue Forecast
Regulatory Year 2014/15 2015/16 2016/17 2017/18 2018/19
Barrow 5.5 5.6 5.7 5.9 6.0 Current revenues plus indexation
Gunfleet 6.9 7.0 7.1 7.4 7.5 Current revenues plus indexation
Walney 1 12.5 12.8 12.9 13.1 13.6 Current revenues plus indexation
Robin Rigg 7.7 7.9 8.0 8.4 8.4 Current revenues plus indexation
Walney 2 12.9 13.2 12.5 12.3 14.1 Current revenues plus indexation
Sheringham Shoal 18.9 19.5 19.7 20.0 20.7 Current revenues plus indexation
Ormonde 11.6 11.8 12.0 12.2 12.6 Current revenues plus indexation
Greater Gabbard 26.0 26.6 26.9 27.3 28.3 Current revenues plus indexation
London Array 37.6 39.2 39.5 39.5 40.0 Current revenues plus indexation
Thanet 17.5 15.7 19.5 18.5 Current revenues plus indexation
Lincs 25.6 26.7 27.2 26.8 Current revenues plus indexation
Gwynt y mor 26.3 23.6 29.3 28.1 Current revenues plus indexation
West of Duddon Sands 21.3 22.0 22.5 Current revenues plus indexation
Humber Gateway 0.0 9.7 11.7 Current revenues plus indexation
Westermost Rough 0.0 11.6 13.0 Current revenues plus indexation
Forecast to asset transfer to OFTO in 2017/18 0.0 0.0 0.0 4.7 18.5 National Grid Forecast
Forecast to asset transfer to OFTO in 2018/19 0.0 0.0 0.0 0.0 82.8 National Grid Forecast
Forecast to asset transfer to OFTO in 2019/20 0.0 0.0 0.0 0.0 0.0 National Grid Forecast
Forecast to asset transfer to OFTO in 2020/21 0.0 0.0 0.0 0.0 0.0 National Grid Forecast
Forecast to asset transfer to OFTO in 2021/22 0.0 0.0 0.0 0.0 0.0 National Grid Forecast
Offshore Transmission Pass-Through (B7) 218.4 248.4 260.8 270.2 373.2
Notes
29.3 35.3
78.9
28/06/2017
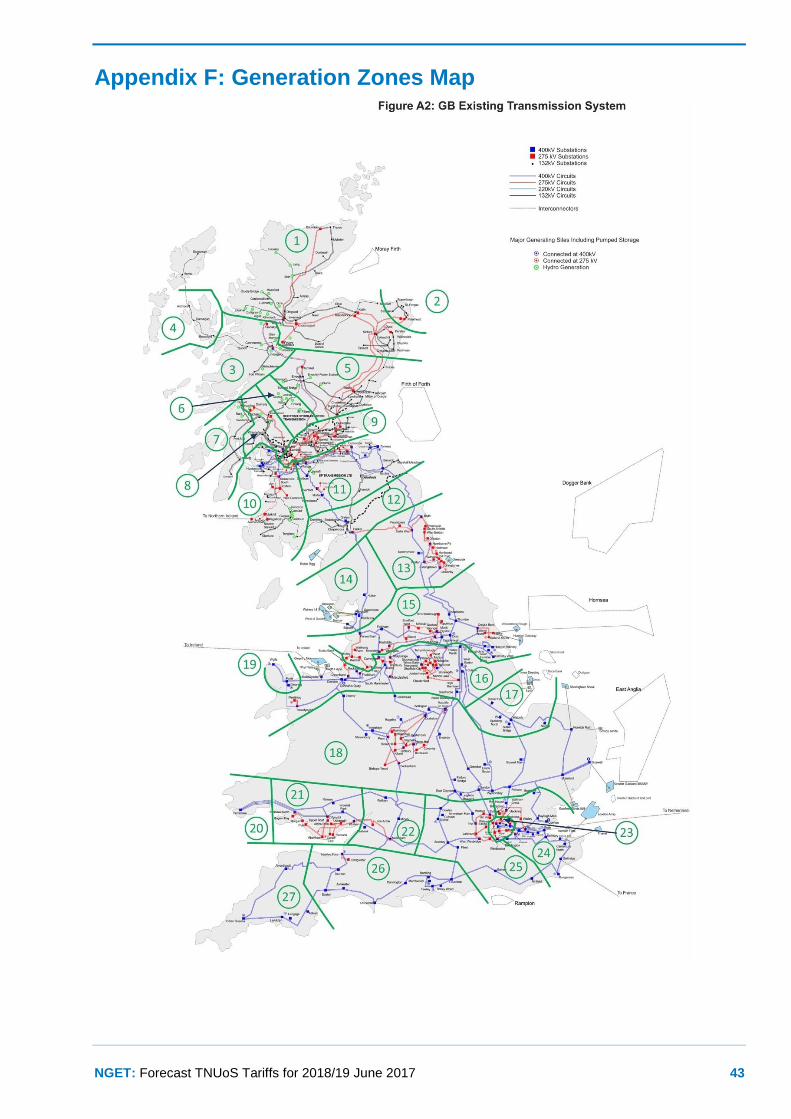
NGET: Forecast TNUoS Tariffs for 2018/19 June 2017 43
Appendix F: Generation Zones Map
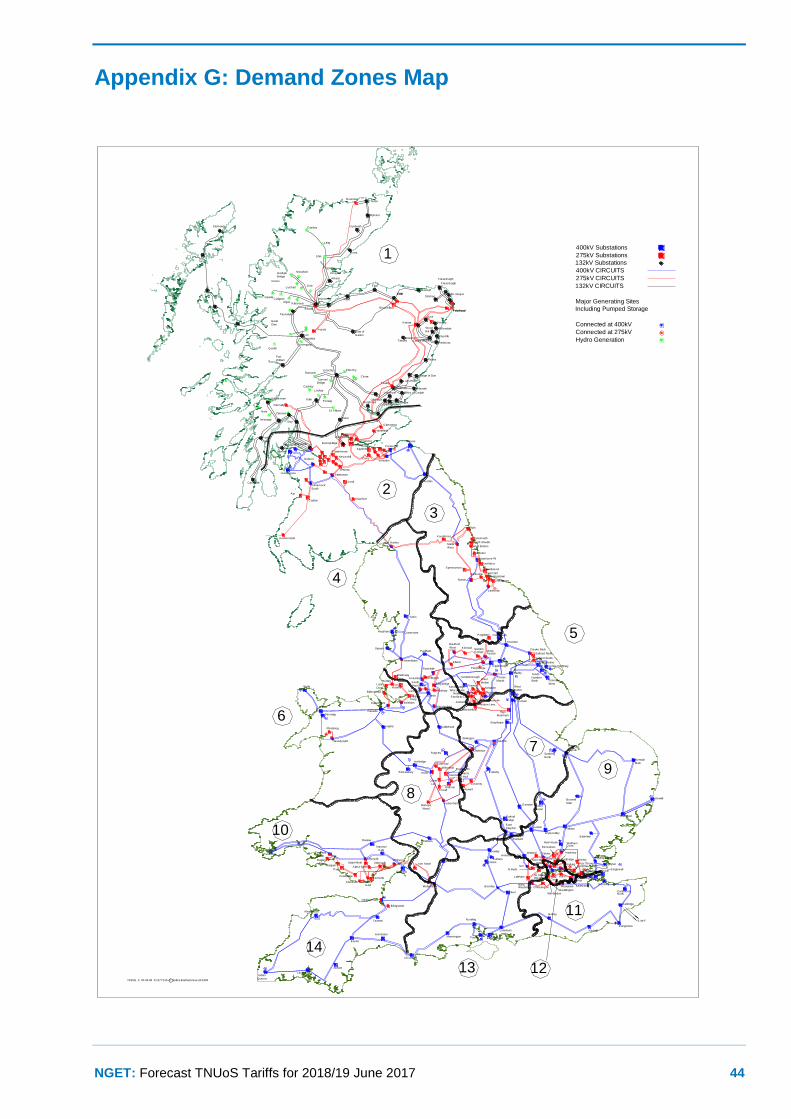
NGET: Forecast TNUoS Tariffs for 2018/19 June 2017 44
Appendix G: Demand Zones Map
Baglan
Bay
Leighton
Buzzard
Patford
Bridge
Northfleet EastS inglewell
Fourstones
Humber Refinery
Spald ing
North
West Thurrock
ISSUE A 04-03-05 41/177145 C Collins Bartholomew Ltd 1999
Dingwall
Dounreay
Newarthill
Easterhouse
Kincard ine
Wishaw
Strathaven
Kilmarnock
South
Ayr
Coylton
Saltend South
Hackney
Coryton
RatcliffeWillington
Drakelow
Shrewsbury
Cross
Weybridge
Cross
Wood
North
West
FrystonGrange
Ferry
Winco Bank
Norton Lees
Creyke Beck
Saltend North
Grimsby
West
Drax
Lackenby
Greystones
GrangetownSaltholme
Norton
Spennymoor
Tod Point
Hartlepool
Hart Moor
Hawthorne Pit
Offerton
West Boldon
South Shields
Tynemouth
Ste lla
West
Harker
Eccles
Blyth
Indian
Queens
Landulph
Abham
Exeter
Axminster
Chickerell
Mannington
Taunton
Alverdiscott
Hinkley Point
Bridgwater
Aberthaw
Cowbridge
Pyle
Margam
Swansea
North
Card iff
East
Tremorfa
Alpha Steel
UskmouthUpper Boat
Cilfynydd
Imperia l
Park
Rassau
Whitson
Seabank
Iron Acton
Walham
Melksham
Minety DidcotCulham
Cowley
Bramley
Fleet
Nursling
Fawley Botley Wood
Lovedean
Bolney
Ninfield
Dungeness
Sellindge
Canterbury
E de F
Kemsley
Grain
Kingsnorth
Rayle igh Main
Northfleet
L ittlebrook
Tilbury
Warley
Barking
Redbridge
W.HamCity Rd
Tottenham
Brimsdown
Waltham
Ealing
Mill HillWillesden
Watford
St Johns
Wimbledon
New Hurst
E lstree
Rye House
N.Hyde
Sundon
Laleham
Iver
Amersham Main
Wymondley
Pelham
Braintree
Burwell
Main
Bramford
Eaton
Socon
Grendon
East
Claydon
Enderby
Walpole
Norwich
Main
Coventry
Berkswell
Rugeley
Cellarhead
IronbridgeBushbury
Penn
Willenhall
Ocker
Hill
K itwellO ldbury
Bustleholm
NechellsHams
Hall
B ishops
Wood
Feckenham
Legacy
Trawsfynydd
Ffestin iog
Dinorwig
Pentir
Wylfa
Deeside
Capenhurst Frodsham
Fiddlers
Rainhill
K irkby
Lister
Drive
Birkenhead
Washway
Farm
Penwortham
Carrington
South
Manchester
Daines
Macclesfield
Bredbury
Sta lybridge
Rochdale
WhitegateKearsley
Elland
Stocksbridge
West
Melton
Aldwarke
Thurcroft
BrinsworthJordanthorpe
Chesterfield
Sheffie ld City
Neepsend
Pitsmoor
Templeborough Thorpe
Marsh
Keadby
West
Burton
Cottam
High
Marnham
Staythorpe
Stanah
Heysham
Padiham
Hutton
Bradford
West K irkstall Skelton
Poppleton
Thornton
Quernmore
Monk
EggboroughFerrybridge
Killingholme
South
Humber Bank
Sizewell
Pembroke
Osbaldwick
Rowdown
BeddingtonChessington
West
Inveraray
Auchencrosh
400kV Substations
275kV Substations
132kV Substations
400kV CIRCUITS
275kV CIRCUITS
132kV CIRCUITS
Major Generating Sites
Including Pumped Storage
Connected at 400kV
Connected at 275kV
Hydro Generation
11
12
Fasnakyle
Beauly
Deanie
Lairg
Shin
Nairn
Kintore
Blackhillock
Elg in
Keith
Peterhead
Persley
Fraserburgh
Invergarry
Quoich
CulligranAlgas
Kilmorack
Grudgie
Bridge
Mossford
OrrinLuichart
A lness
Brora
Cassley Dunbeath
Mybster
St. FergusStrichen
Macduff
Boat of
Garten
Redmoss
Willowdale
Clayhills
Dyce
Craig iebuckler
Wood
Hill
Tarland
Dalmally
K illin
Errochty
Tealing
Braco
GlenagnesDudhope
Milton of Cra ig ie
Dudhope
Lyndhurst
CharlstonBurghmuir
Arbroath
Fiddes
Bridge of Dun
Luna Head
St. Fillans
Fin larig
Lochay
Cashley
Rannoch
Tummel Bridge
Clunie
Kilchrennan
NantClachan
Port
Ann
Carradale
1
2
3
4
5
6
7
8
9
10
13
14
Windyhill
Dunoon
Inverkip
Devol
Moor
Hunterstone
Sloy
Fort
William
Bonnybridge
Neilson
Great
Glen
Conon
Fort
Augustus
Foyers
Inverness
Stornoway
Elvanfoot
Smeaton
Glenrothes
Westfie ld
Cume
Grangemouth
Longannet
L inmill
S ighthill
P itiochry
Torness
Cockenzie
Keith
Peterhead
Fraserburgh
Thurso