for richer for poorer
DESCRIPTION
Enterprise Institute studies how family structures economic successTRANSCRIPT
ForRicher,
ForPoorer
HOW FAMILY STRUCTURESECONOMIC SUCCESS
IN AMERICARobert I. Lerman and
W. Bradford Wilcox
Table of Contents
3
5
7
10
18
32
44
50
Executive Summary
Preface
Introduction
PART 1: The Shifting Economic Fortunes of American Families
PART 2: The Role of Childhood Family Structure in Future Economic Success
PART 3: A Marriage Premium for Men and Women
PART 4: The Family Premium
PART 5: Toward More Perfect Unions: Four Policy Ideas
For Richer, For Poorer: How Family Structures Economic Success in America 3
Executive Summary
The standard portrayals of economic life for ordinary Americans
and their families paint a picture of stagnancy, even decline,
amidst rising income inequality or joblessness. But rarely
does the public conversation about the changing economic fortunes of
Americans and their families look at questions of family structure. This is
an important oversight because, as this report shows, changes in family
formation and stability are central to the changing economic landscape
of American families, to the declining economic status of men, and to
worries about the health of the American dream.
This study documents five key findings about the relationships between family patterns and economic well-being in America.
1– The retreat from marriage—a retreat that has been concentrated among lower-income Americans—plays a key role in the changing economic fortunes of American family life. We estimate that the growth in median income of families with children would be 44 percent higher if the United States enjoyed 1980 levels of married parenthood today. Further, at least 32 percent of the growth in family-income inequality since 1979 among families with children and 37 percent of the decline in men’s employment rates during that time can be linked to the decreasing number of Americans who form and maintain stable, married families.
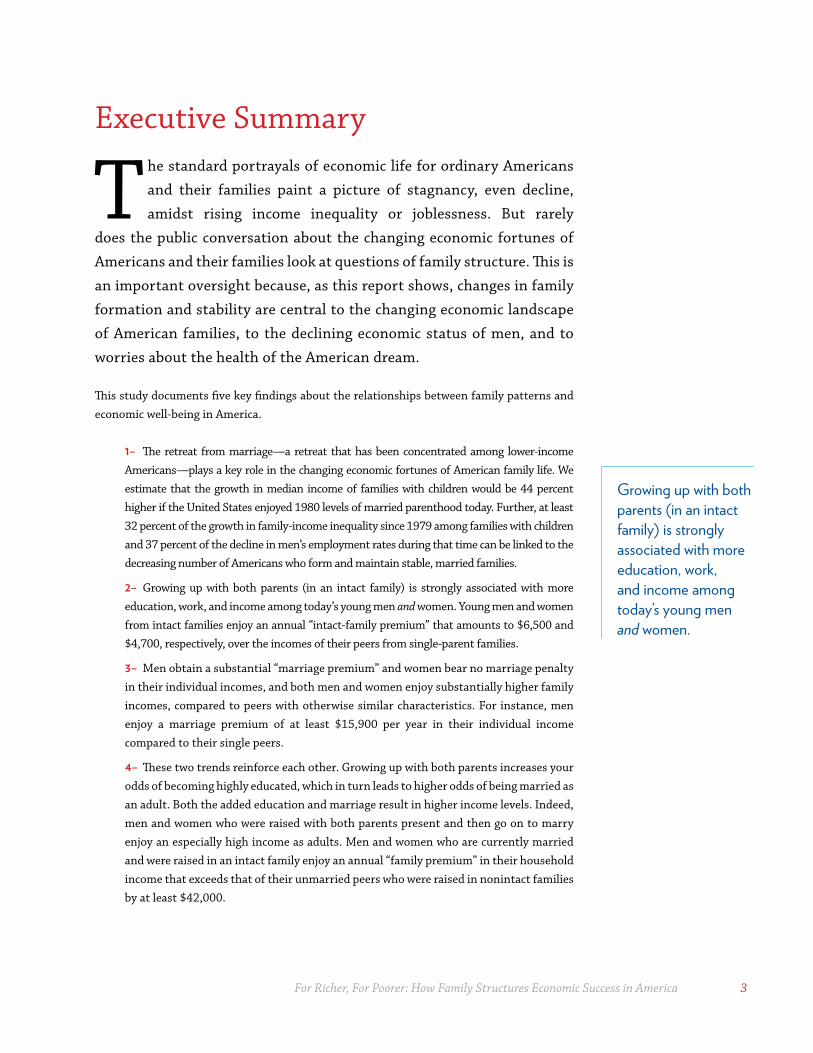
2– Growing up with both parents (in an intact family) is strongly associated with more education, work, and income among today’s young men and women. Young men and women from intact families enjoy an annual “intact-family premium” that amounts to $6,500 and $4,700, respectively, over the incomes of their peers from single-parent families.
3– Men obtain a substantial “marriage premium” and women bear no marriage penalty in their individual incomes, and both men and women enjoy substantially higher family incomes, compared to peers with otherwise similar characteristics. For instance, men enjoy a marriage premium of at least $15,900 per year in their individual income compared to their single peers.
4– These two trends reinforce each other. Growing up with both parents increases your odds of becoming highly educated, which in turn leads to higher odds of being married as an adult. Both the added education and marriage result in higher income levels. Indeed, men and women who were raised with both parents present and then go on to marry enjoy an especially high income as adults. Men and women who are currently married and were raised in an intact family enjoy an annual “family premium” in their household income that exceeds that of their unmarried peers who were raised in nonintact families by at least $42,000.
Growing up with both parents (in an intact family) is strongly associated with more education, work, and income among today’s young men and women.
4
5– The advantages of growing up in an intact family and being married extend across the population. They apply about as much to blacks and Hispanics as they do to whites. For instance, black men enjoy a marriage premium of at least $12,500 in their individual income compared to their single peers. The advantages also apply, for the most part, to men and women who are less educated. For instance, men with a high-school degree or less enjoy a marriage premium of at least $17,000 compared to their single peers.
Given the economic importance of strong and stable families, policy makers, business executives and owners, and civic leaders should experiment with a range of public and private policies to strengthen and stabilize marriage and family life in the United States. Such efforts should focus on poor and working-class Americans, who have been most affected by the nation’s retreat from marriage. Specifically:
1– Public policy should “do no harm” when it comes to marriage. Accordingly, policymakers should eliminate or reduce marriage penalties embedded in many of the nation’s tax and transfer policies designed to serve lower-income Americans and their families.
2– Federal and state policy should strengthen the economic foundations of middle- and lower-income family life in three ways: (a) increase the child credit to $3,000 and extend it to both income and payroll taxes; (b) expand the maximum earned income tax credit for single, childless adults to $1,000, increasing their marriageability; and (c) expand and improve vocational education and apprenticeship programs that would strengthen the job prospects of less-educated young adults.
3– Civic institutions—joined by a range of private and public partners, from businesses to state governments to public schools—should launch a national campaign around a “success sequence” that would encourage young adults to sequence schooling, work, marriage, and then parenthood. This campaign would stress the ways children are more likely to flourish when they are born to married parents with a secure economic foundation.
This report is part of the Home Economics Project, a research effort of the American Enterprise Institute and the Institute for Family Studies that explores whether and how strong and stable families advance the economic welfare of children, adults, and the nation as a whole. The project also examines the role, if any, that marriage and family play in increasing individual opportunity and strengthening free enterprise at home and abroad, as well as their implications for public policy.
© by the American Enterprise Institute and the Institute for Family Studies. All rights reserved. For more information, please contact [email protected] or [email protected].
For Richer, For Poorer: How Family Structures Economic Success in America 5
PrefaceHere’s a newsflash—marriage matters. All the latest evidence confirms the ancient wisdom: the institution of marriage is a key to productive adulthood, the cornerstone of a stable family, and the basic unit of a healthy community. Its effects go well beyond the married couple. It shapes our whole society, from workforce participation to economic inequality to the effectiveness of education. Children raised by married parents have better odds of succeeding in school, excelling at work, and building a stable relationship of their own. Unfortunately, public discourse on this critical issue can be lacking. Many economists and policy professionals talk about marriage as a purely financial decision. They fixate on laws and economic incentives, and are loathe to even contemplate the cultural foundation on which marriage rests. Meanwhile, many pundits and politicians on both sides make the opposite mistake. Only interested in moralizing, they neglect the empirical questions and dismiss the idea that public policy could have any impact. This important report takes a different approach. Instead of ignoring complexity, Robert Lerman and Brad Wilcox tackle it head-on. They present original, rigorous findings on how marriage affects adults and children alike. They propose tangible, concrete ideas for how government could stop discouraging marriage and perhaps begin to promote it. But just as importantly, they recognize that economics are only part of the story. The authors’ empirical work is infused with a real awareness of the deeper issues at play. This is precisely the kind of analysis that Washington needs. It is exactly the sort of scholarship to which we at the American Enterprise Institute are committed. I am proud that AEI helped make this research a reality, and I commend it to your interest.
Arthur C. Brooks President, American Enterprise Institute

6
For Richer, For Poorer: How Family Structures Economic Success in America 7
For Richer, For PoorerFamily Routes to Economic Success in America
In a major address last year, President Barack Obama called the “defining challenge of our time” the “growing inequality and lack of upward mobility that has jeopardized middle-class America’s basic bargain—that if you work hard, you have a chance to get ahead.”1 Obama is only the most prominent progressive to call attention to the increasingly unequal, and stagnant, character of much of the American economy. The Washington Center for Equitable Growth, the Economic Policy Institute, economists Alan Krueger and Lawrence Mishel, and many others have identified growing economic inequality and wage stagnation as major issues confronting middle- and lower-income Americans and their families.2
From conservatives, attention has focused not only on wage stagnation among middle- and lower-income families3 but also on the declining share of men in the labor force, especially less-educated men. This year, speaking at the American Enterprise Institute, Congressman Paul Ryan expressed concern about “very low labor force participation rates” among childless adults in their early 20s, adding “these are people who are in the prime of their lives that need to get into the workforce.”4 His perspective echoes the work of scholars like Nicholas Eberstadt and Charles Murray, who have highlighted the growing ranks of men without a college degree who do not have a job as what Eberstadt calls an “American flight from work.”5
The standard portrayals of economic life for ordinary Americans and their families paint a picture of stagnancy, even decline, amidst rising income inequality or joblessness. Progressives tend to apportion blame for this state of affairs to economic shifts—for example, the decline of stable, well-paying manufacturing jobs and the rise of a winner-take-all economy—whereas conservatives are more likely to finger poorly designed public policies—such as Social Security disability benefits—that undercut work.6
But how well do these narratives convey the whole story? Rarely does the public conversation about the changing economic fortunes of Americans and their families touch directly on questions of family structure. This is an important oversight, because changes in family
1. President Barack Obama, “Remarks by the President on Economic Mobility” (White House, December 4, 2013), www.whitehouse.gov/the-press-office/2013/12/04/remarks-president-economic-mobility.
2. See, for example, Lawrence Mishel et al., The State of Working America (Ithaca, NY: Cornell University Press, 2012).
3. Phil Gramm and Michael Solon, “Senate Democrats vs. the Middle Class,” Wall Street Journal (August 18, 2014): A13.
4. Paul Ryan, “Expanding Opportunity in America: A Conversation with House Budget Committee Chairman Paul Ryan” (speech, American Enterprise Institute, Washington, DC, July 24, 2014), www.aei.org/files/2014/07/25/-paul-ryan-event_175426104263.pdf.
5. Nicholas Eberstadt, “Yes, Mr. President, We Are a Nation of Takers,” Wall Street Journal, January 24, 2013, http://online.wsj.com/news/articles/SB10001424127887323539804578259940213918254.
6. For a progressive view, see Mishel et al., The State of Working America. For a conservative view, see Nicholas Eberstadt, A Nation of Takers: America’s Entitlement Epidemic (West Conshohocken, PA: Templeton Press, 2012).
8
formation and stability are central to the changing economic landscape of American families, the declining economic status of men, and worries about the health of the American dream. The interactions between the economy and patterns of family life are admittedly complex. Some see the causal chain connecting a bad economy (at least, for less-educated workers) to declines in stable married, two-parent families; to poverty and economic insecurity; and subsequently, to poor schooling, job, and family outcomes for children.7 From this perspective, the appropriate policy focus is on reducing poverty directly, through transfer programs, or indirectly, through enhanced job opportunities.
An alternative scenario is that declines in the propensity to marry, along with normative shifts in the acceptability of nonmarital births and fatherlessness, have led to major declines in stable two-parent families, which in turn have exacerbated problems of poverty, increased inequality, and weakened opportunities for economic mobility.8 From this perspective, approaches that encourage stable marriages and discourage nonmarital births can be effective in any economy and can lead to new pathways that raise incomes and upward mobility. We find both sets of causal and policy claims compelling.
In this report, we describe the role that family structure has played and is playing in the shifting contours of American economic life, both for the nation as a whole and for individual women and men and their families. We explore how the nation’s retreat from marriage is linked to growing family inequality, male joblessness, and economic stagnation, especially among the ranks of less-educated Americans. We find that men and women who hail from an intact family (where both parents are present) are more likely to flourish in the contemporary workplace and to enjoy an “intact-family premium.” Likewise, men who marry continue to obtain a “marriage premium” in their earnings. Finally, both men and women enjoy a “family premium” in midlife household income if they are raised in an intact family and go on to marry, compared to their unmarried peers from nonintact families who otherwise share a similar background and personal characteristics.
Notwithstanding this report’s extensive data analysis, we do not claim that the associations we find among family structure while growing up, marriage as an adult, and economic outcomes are definitively causal. The causal effect of marriage touches on many possible empirical questions, many of which are beyond the scope of this report. Some relate to the causes of higher or lower marriage rates. What happens to economic well-being when, for example, additional marriages are stimulated by financial incentives, attitudes and orientations toward marriage, improved matching, added earnings of men, increased parental responsibility, or changes in laws concerning divorce? Others relate to individual characteristics. Even after
7. June Carbone and Naomi Cahn, The Marriage Market: How Inequality Is Remaking the American Family (New York: Oxford University Press, 2014).
8. Kay Hymowitz, Marriage and Caste in America: Separate and Unequal Families in a Post-Marital Age (New York: Ivan Dee, 2006).
Men and women who hail from an
intact family are more likely to flourish in the contemporary
workplace.
For Richer, For Poorer: How Family Structures Economic Success in America 9
netting out the effects of many observed differences among individuals, both marriage and economic well-being may be the result of some third factor, such as unobserved differences in personality or character, like the capacity to delay gratification. While some of the analyses herein control for unobserved initial differences among people, they do not capture changes in a person’s overall orientation—say, a desire to settle down—that may lead to marriage and steadier employment. Moreover, most of the evidence in this report is descriptive and does not derive from a causal model. For all these reasons, this report cannot definitively assert that adolescent family structure and adult marital status have a causal impact on individual and family economic well-being.
Furthermore, for some Americans, marriage can be a drag on their family’s economic well-being, particularly in cases where a partner is consistently unemployed or when a marriage ends in divorce.9 This means that marriage and an intact family life are not always associated with better economic fortunes for women, men, children, and families in the United States.
Nevertheless, the evidence is widespread and consistent enough to suggest strong, causal positive roles for being raised in an intact family and for current marriage on a range of important economic outcomes for the average American. The rest of this report will detail these findings, and is structured as follows:
• PART 1 explores how trends in family income, family income inequality, and male employment diverge between those married and not married.
• PART 2 looks at the impact of childhood family structure on men’s and women’s educational attainment, family formation, work, and income.
• PART 3 examines the links between adult family structure and men’s and women’s work and income.
• PART 4 explores the cumulative impact of childhood and adult family structure on men’s and women’s individual and family incomes.
• PART 5 considers a set of policy recommendations for strengthening the economic, educational, and cultural foundations of middle- and lower-income families.
9. Carbone and Cahn, The Marriage Market.
10
PART 1
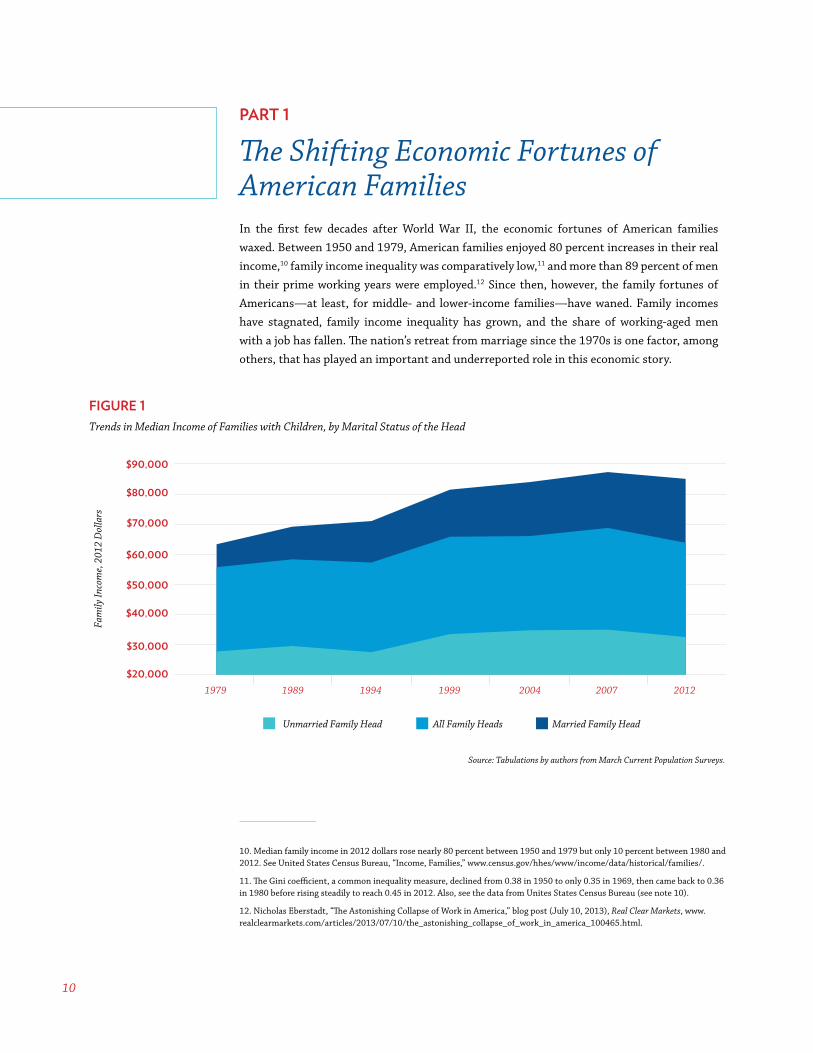
The Shifting Economic Fortunes ofAmerican Families In the first few decades after World War II, the economic fortunes of American families waxed. Between 1950 and 1979, American families enjoyed 80 percent increases in their real income,10 family income inequality was comparatively low,11 and more than 89 percent of men in their prime working years were employed.12 Since then, however, the family fortunes of Americans—at least, for middle- and lower-income families—have waned. Family incomes have stagnated, family income inequality has grown, and the share of working-aged men with a job has fallen. The nation’s retreat from marriage since the 1970s is one factor, among others, that has played an important and underreported role in this economic story.
10. Median family income in 2012 dollars rose nearly 80 percent between 1950 and 1979 but only 10 percent between 1980 and 2012. See United States Census Bureau, “Income, Families,” www.census.gov/hhes/www/income/data/historical/families/.
11. The Gini coefficient, a common inequality measure, declined from 0.38 in 1950 to only 0.35 in 1969, then came back to 0.36 in 1980 before rising steadily to reach 0.45 in 2012. Also, see the data from Unites States Census Bureau (see note 10).
12. Nicholas Eberstadt, “The Astonishing Collapse of Work in America,” blog post (July 10, 2013), Real Clear Markets, www.realclearmarkets.com/articles/2013/07/10/the_astonishing_collapse_of_work_in_america_100465.html.
FIGURE 1Trends in Median Income of Families with Children, by Marital Status of the Head
Source: Tabulations by authors from March Current Population Surveys.
$20,000
$30,000
$40,000
$50,000
$60,000
$70,000
$80,000
$90,000
1979 1989 1994 1999 2004 2007 2012
Fam
ily In
com
e, 2
012
Dol
lars
Married Family Head Unmarried Family Head All Family Heads
For Richer, For Poorer: How Family Structures Economic Success in America 11
Median Income Growth Slows
Take the income trends of families with children (see figure 1). The income measure is pretax cash income adjusted for inflation and thus excludes taxes, tax credits, and in-kind benefits such as food stamps and housing benefits.13 Though this measure is not comprehensive, it is commonly used and mostly captures market incomes. Between 1979 and 2012, this measure of median family income rose only 14 percent, or only 0.4 percent per year. However, among married parents, median family income increased by 30 percent.
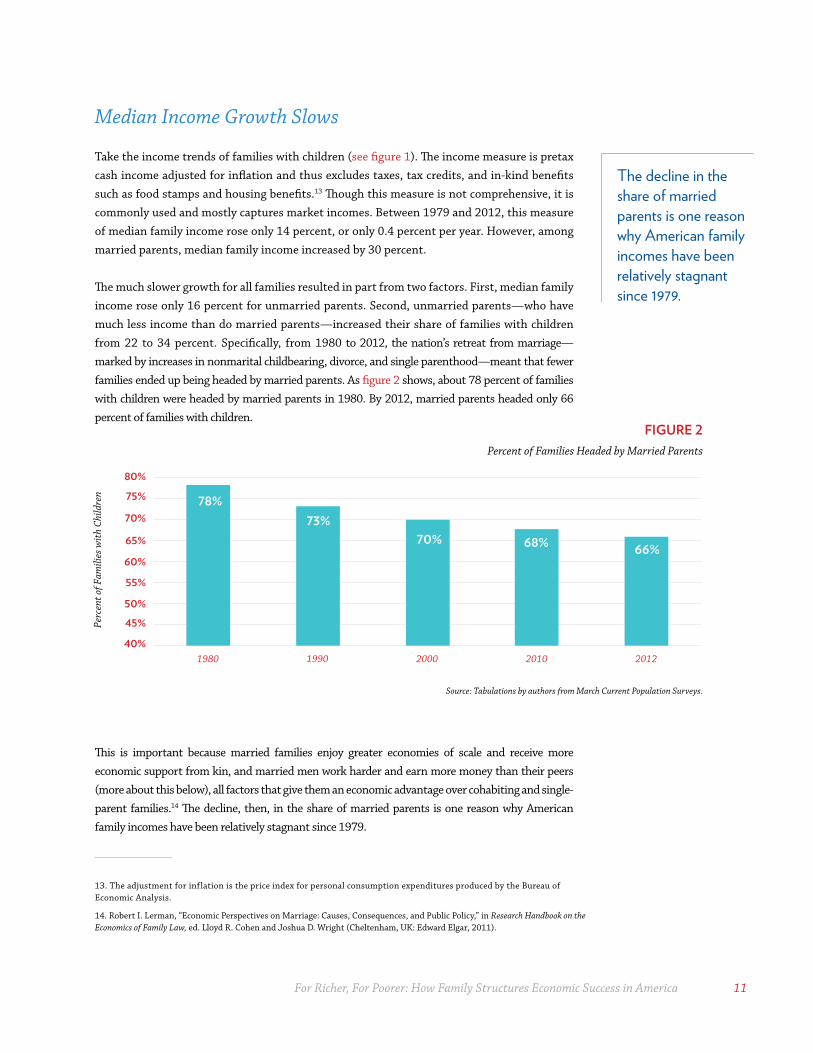
The much slower growth for all families resulted in part from two factors. First, median family income rose only 16 percent for unmarried parents. Second, unmarried parents—who have much less income than do married parents—increased their share of families with children from 22 to 34 percent. Specifically, from 1980 to 2012, the nation’s retreat from marriage—marked by increases in nonmarital childbearing, divorce, and single parenthood—meant that fewer families ended up being headed by married parents. As figure 2 shows, about 78 percent of families with children were headed by married parents in 1980. By 2012, married parents headed only 66 percent of families with children.
This is important because married families enjoy greater economies of scale and receive more economic support from kin, and married men work harder and earn more money than their peers (more about this below), all factors that give them an economic advantage over cohabiting and single-parent families.14 The decline, then, in the share of married parents is one reason why American family incomes have been relatively stagnant since 1979.
FIGURE 2Percent of Families Headed by Married Parents
Source: Tabulations by authors from March Current Population Surveys.
13. The adjustment for inflation is the price index for personal consumption expenditures produced by the Bureau of Economic Analysis.
14. Robert I. Lerman, “Economic Perspectives on Marriage: Causes, Consequences, and Public Policy,” in Research Handbook on the Economics of Family Law, ed. Lloyd R. Cohen and Joshua D. Wright (Cheltenham, UK: Edward Elgar, 2011).
78% 73%
70% 68% 66%
40%
45%
50%
55%
60%
65%
70%
75%
80%
1980 1990 2000 2010 2012
Perc
ent o
f Fam
ilies
wit
h Ch
ildre
n
The decline in the share of married parents is one reason why American family incomes have been relatively stagnant since 1979.
12
One objection to this argument is that married parents in 2012 were a more selective group with respect to education than were married parents in 1980. But even after adjusting for race, education, and Hispanic descent, had the share of married parents remained at 78 percent in 2012, the rise in the overall median income of parents would have been about 22 percent, substantially more than the actual growth of 14 percent. In fact, immigrants after 1979, who have low levels of education and came mostly from low-income countries, account for an increasing share of married-parent families; therefore, selectivity can also work against showing a positive marriage effect. If one leaves the post-1979 immigrants out of the 2012 population, the gain to the median income family, given 1980 marriage patterns, would have been 29 percent. But even by our conservative estimate, the growth in median family income would have been 44 percent higher in 2012 had the United States enjoyed 1980 levels of married parenthood. The decline, then, in the share of married-parent families with children partly explains the stagnancy in median family incomes in America since the late 1970s.15
Family Inequality Grows
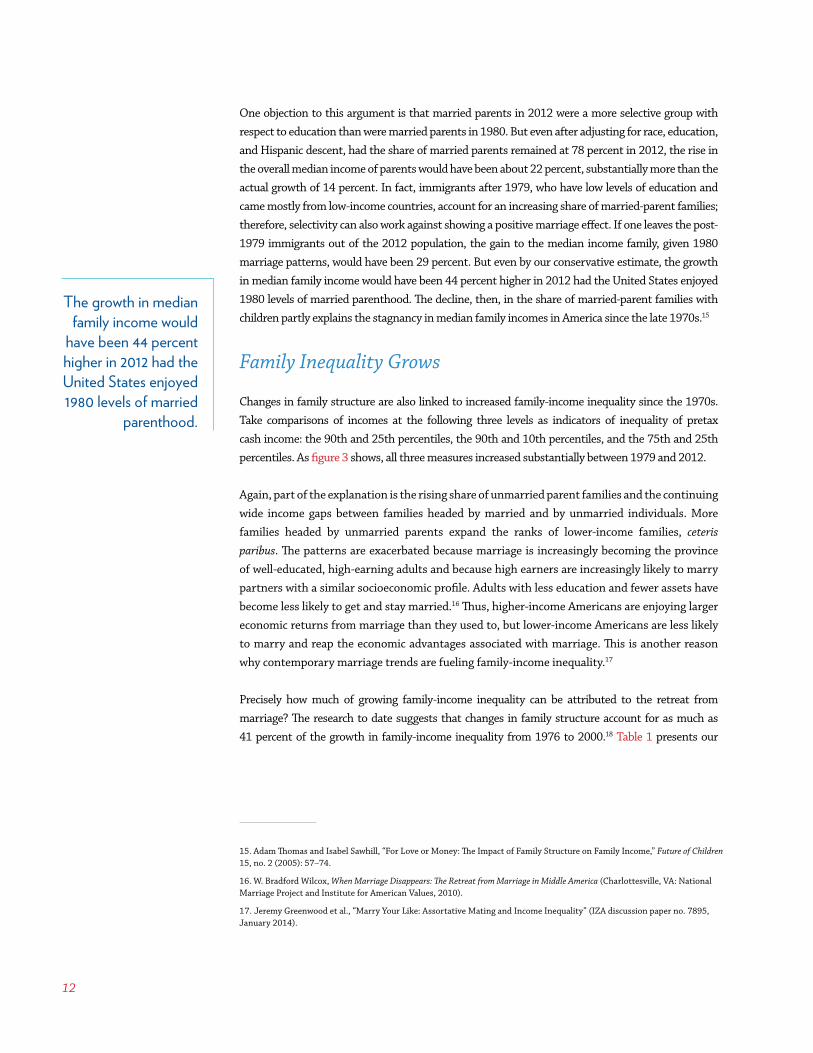
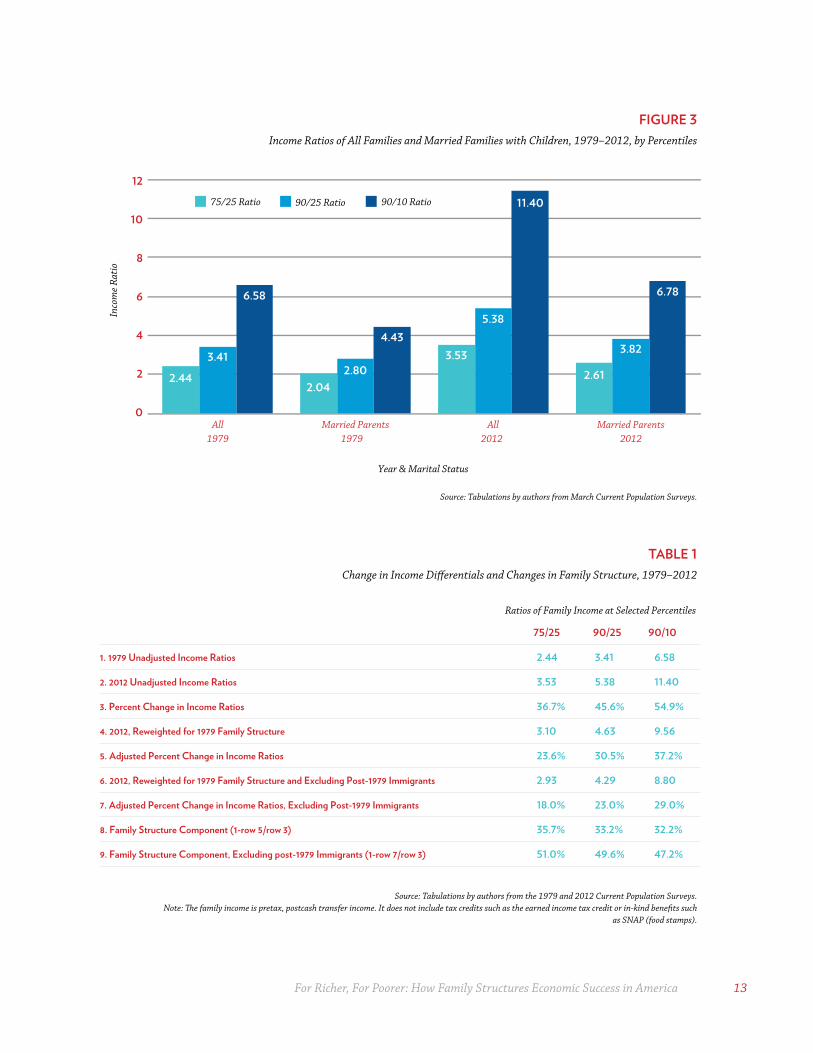
Changes in family structure are also linked to increased family-income inequality since the 1970s. Take comparisons of incomes at the following three levels as indicators of inequality of pretax cash income: the 90th and 25th percentiles, the 90th and 10th percentiles, and the 75th and 25th percentiles. As figure 3 shows, all three measures increased substantially between 1979 and 2012.
Again, part of the explanation is the rising share of unmarried parent families and the continuing wide income gaps between families headed by married and by unmarried individuals. More families headed by unmarried parents expand the ranks of lower-income families, ceteris paribus. The patterns are exacerbated because marriage is increasingly becoming the province of well-educated, high-earning adults and because high earners are increasingly likely to marry partners with a similar socioeconomic profile. Adults with less education and fewer assets have become less likely to get and stay married.16 Thus, higher-income Americans are enjoying larger economic returns from marriage than they used to, but lower-income Americans are less likely to marry and reap the economic advantages associated with marriage. This is another reason why contemporary marriage trends are fueling family-income inequality.17
Precisely how much of growing family-income inequality can be attributed to the retreat from marriage? The research to date suggests that changes in family structure account for as much as 41 percent of the growth in family-income inequality from 1976 to 2000.18 Table 1 presents our
15. Adam Thomas and Isabel Sawhill, “For Love or Money: The Impact of Family Structure on Family Income,” Future of Children 15, no. 2 (2005): 57–74.
16. W. Bradford Wilcox, When Marriage Disappears: The Retreat from Marriage in Middle America (Charlottesville, VA: National Marriage Project and Institute for American Values, 2010).
17. Jeremy Greenwood et al., “Marry Your Like: Assortative Mating and Income Inequality” (IZA discussion paper no. 7895, January 2014).
The growth in median family income would
have been 44 percent higher in 2012 had the United States enjoyed 1980 levels of married
parenthood.
For Richer, For Poorer: How Family Structures Economic Success in America 13
FIGURE 3Income Ratios of All Families and Married Families with Children, 1979–2012, by Percentiles
Source: Tabulations by authors from March Current Population Surveys.
TABLE 1Change in Income Differentials and Changes in Family Structure, 1979–2012
Source: Tabulations by authors from the 1979 and 2012 Current Population Surveys.Note: The family income is pretax, postcash transfer income. It does not include tax credits such as the earned income tax credit or in-kind benefits such
as SNAP (food stamps).
1. 1979 Unadjusted Income Ratios
2. 2012 Unadjusted Income Ratios
3. Percent Change in Income Ratios
4. 2012, Reweighted for 1979 Family Structure
5. Adjusted Percent Change in Income Ratios
6. 2012, Reweighted for 1979 Family Structure and Excluding Post-1979 Immigrants
7. Adjusted Percent Change in Income Ratios, Excluding Post-1979 Immigrants
8. Family Structure Component (1-row 5/row 3)
9. Family Structure Component, Excluding post-1979 Immigrants (1-row 7/row 3)
Ratios of Family Income at Selected Percentiles
75/25 90/1090/25
2.44
3.53
36.7%
3.10
23.6%
2.93
18.0%
35.7%
51.0%
6.58
11.40
54.9%
9.56
37.2%
8.80
29.0%
32.2%
47.2%
3.41
5.38
45.6%
4.63
30.5%
4.29
23.0%
33.2%
49.6%
2.44 2.04
3.53 2.61
3.41 2.80
5.38
3.82
6.58
4.43
11.40
6.78
12
10
8
6
4
2
0
2012 2012 Married Parents
All Married Parents All
1979 1979
Inco
me
Rati
o
Year & Marital Status
75/25 Ratio 90/25 Ratio 90/10 Ratio
14
decomposition of increases in inequality among families with children from 1979 to 2012. It assumes 1979 levels of married parenthood but adjusts for shifts over time in education, race, and ethnicity, with and without post-1979 immigrant families, many of whom have lower levels of education and income. The results suggest that about 32 percent of the growth in family-income inequality between 1979 and 2012 is associated with changes in family structure; about 50 percent is associated with changes in family structure when post-1979 immigrants are excluded from the sample.
The retreat from marriage contributed most to growing family-income inequality from the early 1970s through the early 1990s, when single parenthood grew at its fastest pace. Since then, the growth in family-income inequality has been driven largely by other factors.19 Still, the marked divergence in family incomes from the 1970s to the present can be understood in part as a consequence of the declining share of American families headed by married parents.
Less-Educated Men (Not) at Work
The weakening economic fortunes of middle- and lower-income families are also tied to the erosion of earnings and employment among adult men without college degrees, as economists David Autor and Melanie Wasserman have noted.20 In the contemporary service and information economy, men without college degrees have seen their wages decline in real terms and relative to women’s wages. Most important, the share of working-aged men who are employed has shrunk in recent decades, a decline that has been concentrated among less-educated men.
Today, the declining economic position of men is a leading explanation for the retreat from marriage. The underlying theory, articulated by sociologist William Julius Wilson, is that marriage is now less likely among less-educated Americans because those men have become less “marriageable.” As a result, marriage has become less financially attractive to women.21 Among Americans without college degrees, men are less able to earn the wages required to support a family, while women are increasingly able to combine adequate wages with income supplements to achieve financial independence without a male partner. Many policymakers and researchers blame the changing structure of the economy—which provides fewer stable, well-paying jobs to men without college degrees—as the primary cause of both the decline in men’s labor-market position and the ensuing retreat from marriage.22
But another possibility, raised by Nobel Laureate George Akerlof, is that changing mores since the 1960s related to sex, marriage, and parenthood have led fewer young men and women to
18. Robert I. Lerman, “The Impact of Changing U.S. Family Structure on Child Poverty and Income Inequality,” Economica 63 (1996): S119–39; Molly A. Martin, “Family Structure and Income Inequality in Families with Children, 1976 to 2000,” Demography 32, no. 3 (2006): 421–45.
19. Martin, “Family Structure and Income Inequality.”
20. David Autor and Melanie Wasserman, Wayward Sons: The Emerging Gap in Labor Markets and Education (Washington, DC: Third Way, 2013).
21. William Julius Wilson, The Truly Disadvantaged (Chicago: University of Chicago Press, 1987).
22. For example, Carbone and Cahn, Marriage Market.
About 32 percent of the growth in family-
income inequality between 1979 and 2012 is associated
with changes in family structure.
For Richer, For Poorer: How Family Structures Economic Success in America 15
tie the knot and have, in turn, dampened men’s commitment to work.23 When young men and women replace formal commitments with informal relationships or none at all, work becomes less urgent, especially for men, who have historically taken all kinds of jobs to support their families. With no wife or children to support, men become less focused on the job market. Thus, according to Akerlof, the “marriage shock” of the late 1960s and 1970s—when the marriage rate fell precipitously—made it less likely that men, especially less-educated men with fewer advantageous job opportunities, would seek out full-time work.24
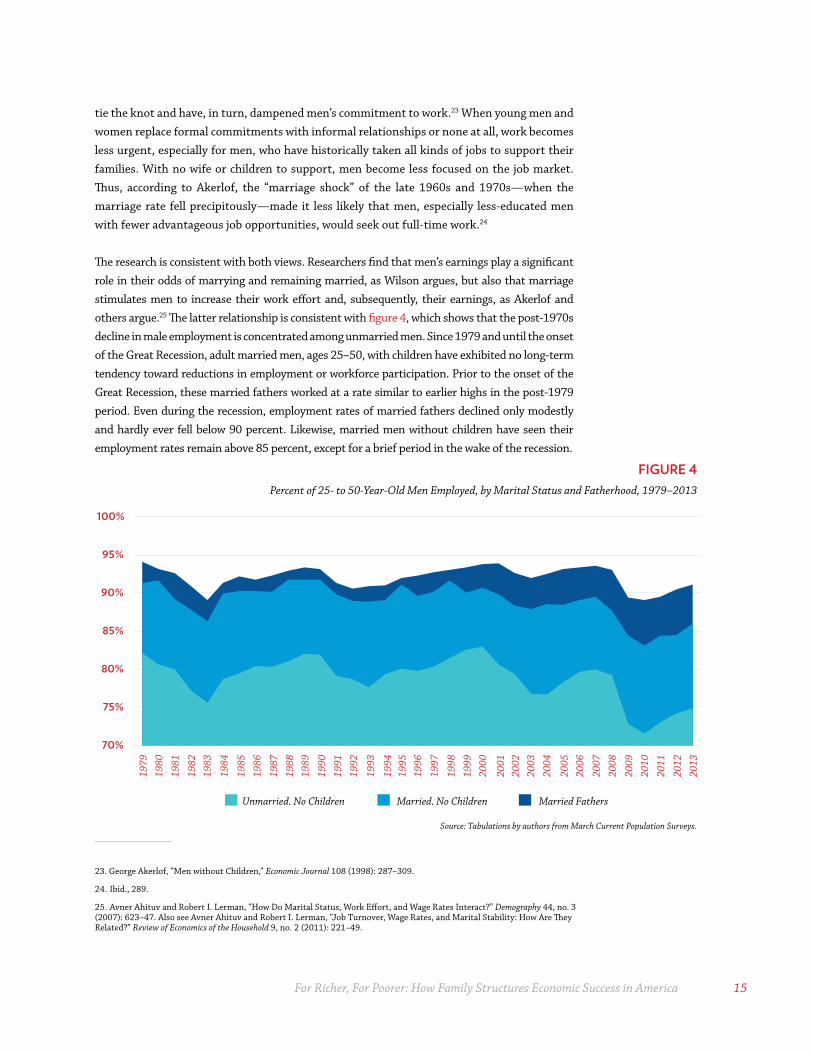
The research is consistent with both views. Researchers find that men’s earnings play a significant role in their odds of marrying and remaining married, as Wilson argues, but also that marriage stimulates men to increase their work effort and, subsequently, their earnings, as Akerlof and others argue.25 The latter relationship is consistent with figure 4, which shows that the post-1970s decline in male employment is concentrated among unmarried men. Since 1979 and until the onset of the Great Recession, adult married men, ages 25–50, with children have exhibited no long-term tendency toward reductions in employment or workforce participation. Prior to the onset of the Great Recession, these married fathers worked at a rate similar to earlier highs in the post-1979 period. Even during the recession, employment rates of married fathers declined only modestly and hardly ever fell below 90 percent. Likewise, married men without children have seen their employment rates remain above 85 percent, except for a brief period in the wake of the recession.
23. George Akerlof, “Men without Children,” Economic Journal 108 (1998): 287–309.
24. Ibid., 289.
25. Avner Ahituv and Robert I. Lerman, “How Do Marital Status, Work Effort, and Wage Rates Interact?” Demography 44, no. 3 (2007): 623–47. Also see Avner Ahituv and Robert I. Lerman, “Job Turnover, Wage Rates, and Marital Stability: How Are They Related?” Review of Economics of the Household 9, no. 2 (2011): 221–49.
FIGURE 4Percent of 25- to 50-Year-Old Men Employed, by Marital Status and Fatherhood, 1979–2013
Source: Tabulations by authors from March Current Population Surveys.
70%
75%
80%
85%
90%
95%
100%
1979
19
80
1981
1982
19
83
1984
1985
19
86
1987
19
88
1989
1990
19
91
1992
1993
1994
19
95
1996
1997
1998
19
99
2000
2001
20
02
2003
20
04
2005
20
06
2007
20
08
2009
20
10
2011
2012
20
13
Married Fathers Married, No Children Unmarried, No Children
16
In contrast, unmarried men have experienced declines in employment, especially since 2000. The share of employed, unmarried adult men peaked at nearly 85 percent around 2000, fell to about 80 percent at the last peak, and is now about 75 percent. As of March 2013, 90 percent of married 25- to 50-year-old men had a job or were serving in the armed forces; for unmarried men, the proportion was only 75 percent, implying that one in four unmarried adult men lacked employment. There is clearly a large and widening marriage gap in men’s employment.
This marriage gap in men’s employment is not simply an artifact of differences in education or race between married and unmarried men. In fact, it is found among less-educated men, as well as racial and ethnic minorities. As of March 2013, fully 84 percent of married men with no more than a high-school diploma held jobs while only 67 percent of unmarried men at this level of educational attainment were employed. For those with a high-school diploma or some college, marriage was associated with employment levels that were 21 points higher for African Americans, 11 points higher for Hispanics, and 17 points higher for non-Hispanic whites.26
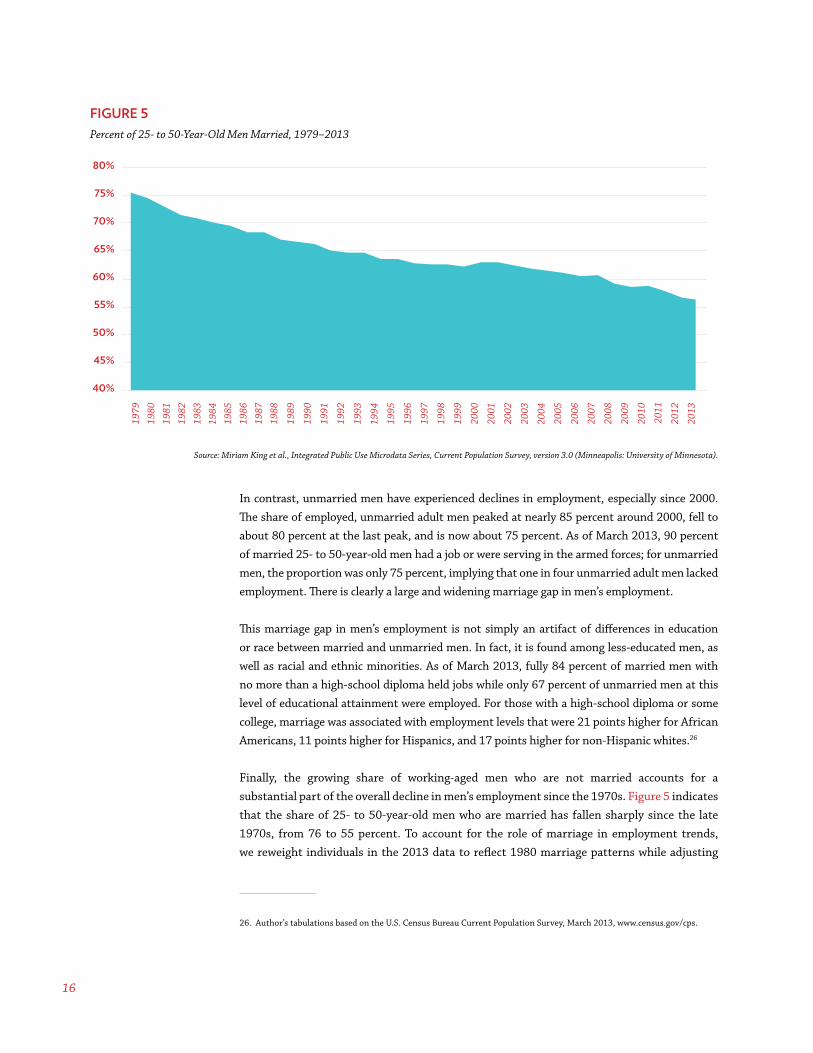
Finally, the growing share of working-aged men who are not married accounts for a substantial part of the overall decline in men’s employment since the 1970s. Figure 5 indicates that the share of 25- to 50-year-old men who are married has fallen sharply since the late 1970s, from 76 to 55 percent. To account for the role of marriage in employment trends, we reweight individuals in the 2013 data to reflect 1980 marriage patterns while adjusting
FIGURE 5Percent of 25- to 50-Year-Old Men Married, 1979–2013
Source: Miriam King et al., Integrated Public Use Microdata Series, Current Population Survey, version 3.0 (Minneapolis: University of Minnesota).
26. Author’s tabulations based on the U.S. Census Bureau Current Population Survey, March 2013, www.census.gov/cps.
45%
50%
55%
60%
65%
70%
75%
80%
40%
For Richer, For Poorer: How Family Structures Economic Success in America 17
for changes in education, race, and ethnicity. Based on this approach, about half (51 percent) of the 1980–2008 decline in men’s employment rates and 37 percent of the 1980–2013 decline is associated with the retreat from marriage. These parallel declines in employment and marriage may partly reflect the influence of a third factor—especially the changing opportunities available to less-skilled workers. Nevertheless, the close connection between marriage and men’s employment (documented below) suggests that what Akerlof calls the “marriage shock” seems to have played an important role in the declining rate of employment among working-aged men in the United States.
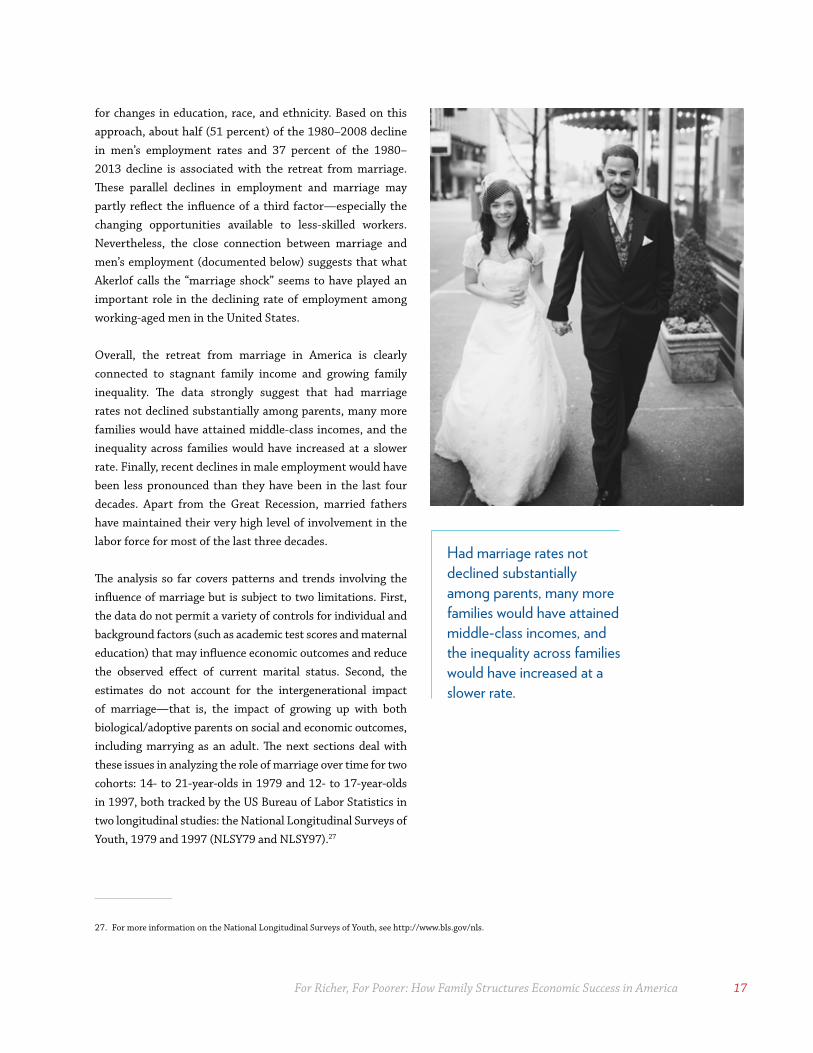
Overall, the retreat from marriage in America is clearly connected to stagnant family income and growing family inequality. The data strongly suggest that had marriage rates not declined substantially among parents, many more families would have attained middle-class incomes, and the inequality across families would have increased at a slower rate. Finally, recent declines in male employment would have been less pronounced than they have been in the last four decades. Apart from the Great Recession, married fathers have maintained their very high level of involvement in the labor force for most of the last three decades.
The analysis so far covers patterns and trends involving the influence of marriage but is subject to two limitations. First, the data do not permit a variety of controls for individual and background factors (such as academic test scores and maternal education) that may influence economic outcomes and reduce the observed effect of current marital status. Second, the estimates do not account for the intergenerational impact of marriage—that is, the impact of growing up with both biological/adoptive parents on social and economic outcomes, including marrying as an adult. The next sections deal with these issues in analyzing the role of marriage over time for two cohorts: 14- to 21-year-olds in 1979 and 12- to 17-year-olds in 1997, both tracked by the US Bureau of Labor Statistics in two longitudinal studies: the National Longitudinal Surveys of Youth, 1979 and 1997 (NLSY79 and NLSY97).27
27. For more information on the National Longitudinal Surveys of Youth, see http://www.bls.gov/nls.
Had marriage rates not declined substantially among parents, many more families would have attained middle-class incomes, and the inequality across families would have increased at a slower rate.
18
PART 2
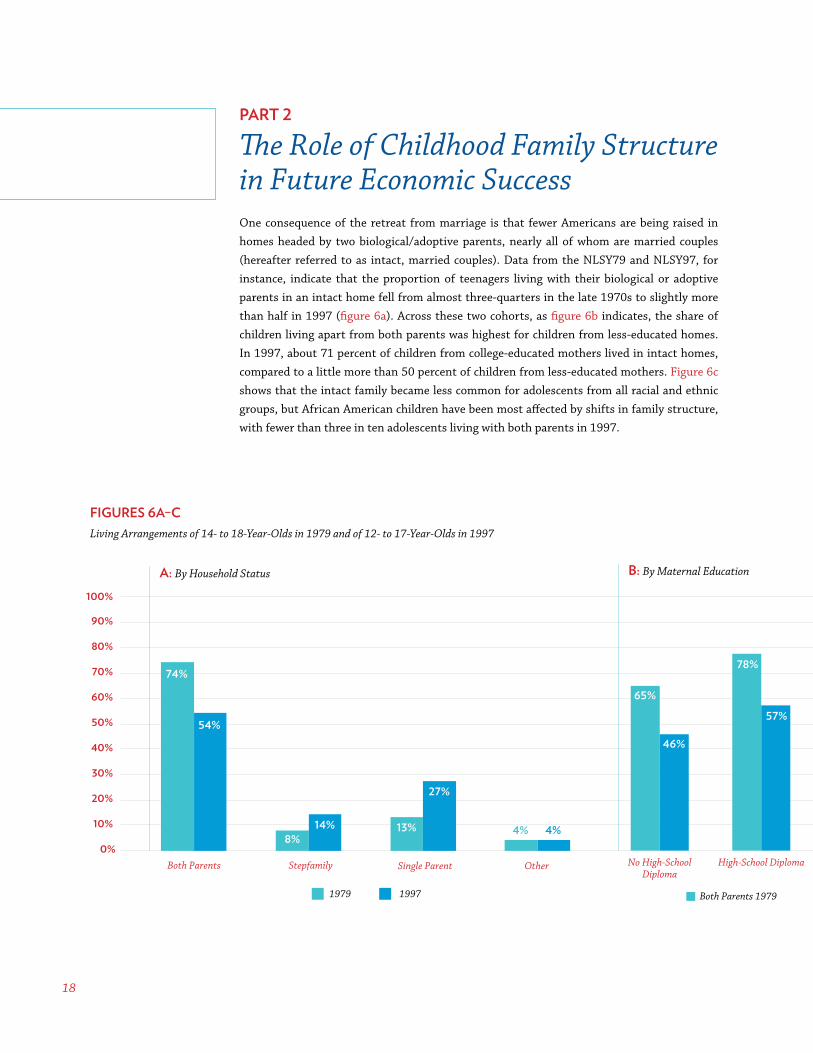
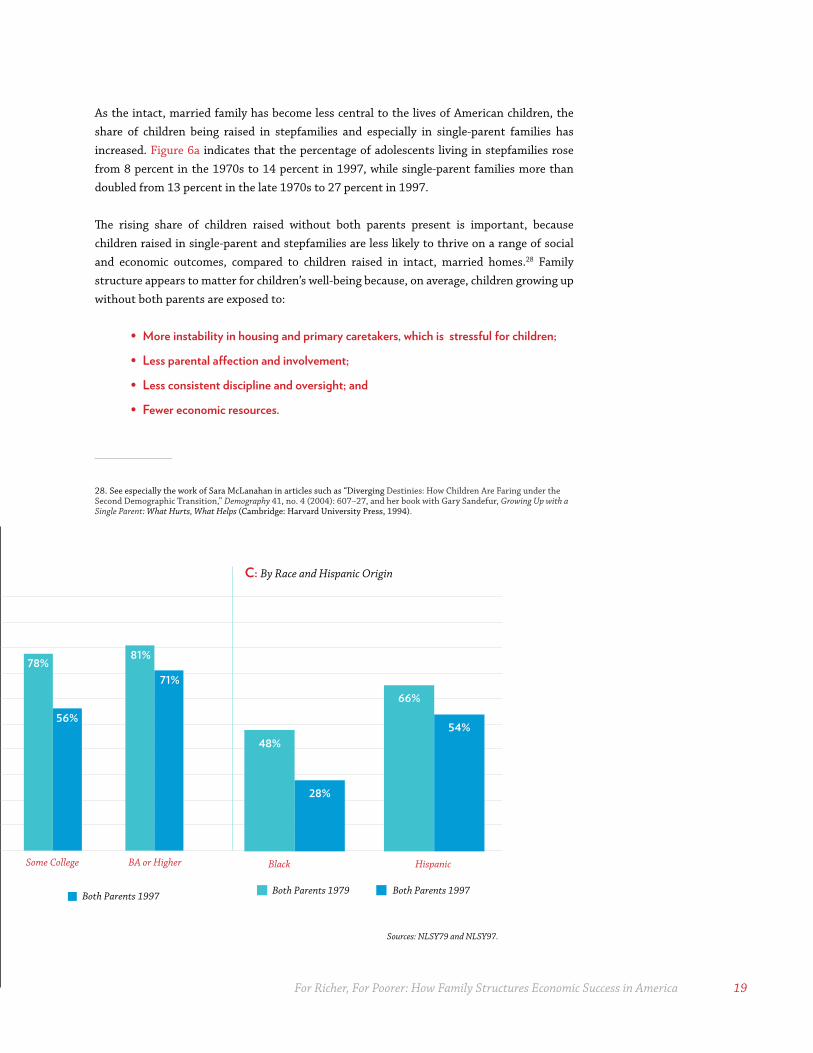
The Role of Childhood Family Structure in Future Economic SuccessOne consequence of the retreat from marriage is that fewer Americans are being raised in homes headed by two biological/adoptive parents, nearly all of whom are married couples (hereafter referred to as intact, married couples). Data from the NLSY79 and NLSY97, for instance, indicate that the proportion of teenagers living with their biological or adoptive parents in an intact home fell from almost three-quarters in the late 1970s to slightly more than half in 1997 (figure 6a). Across these two cohorts, as figure 6b indicates, the share of children living apart from both parents was highest for children from less-educated homes. In 1997, about 71 percent of children from college-educated mothers lived in intact homes, compared to a little more than 50 percent of children from less-educated mothers. Figure 6c shows that the intact family became less common for adolescents from all racial and ethnic groups, but African American children have been most affected by shifts in family structure, with fewer than three in ten adolescents living with both parents in 1997.
FIGURES 6A–CLiving Arrangements of 14- to 18-Year-Olds in 1979 and of 12- to 17-Year-Olds in 1997
A: By Household Status B: By Maternal Education
74%
8% 13% 4%
54%
14%
27%
4%
Both Parents Stepfamily Single Parent Other
1979 1997
48%
66%
28%
54%
Black Hispanic
Both Parents 1979 Both Parents 1997
65%
78% 78% 81%
46%
57% 56%
71%
0%
10%
20%
30%
40%
50%
60%
70%
80%
90%
100%
No High-School Diploma
High-School Diploma Some College BA or Higher
Both Parents 1979 Both Parents 1997
Sources: NLSY79 and NLSY97.
For Richer, For Poorer: How Family Structures Economic Success in America 19
B: By Maternal Education
74%
8% 13% 4%
54%
14%
27%
4%
Both Parents Stepfamily Single Parent Other
1979 1997
48%
66%
28%
54%
Black Hispanic
Both Parents 1979 Both Parents 1997
65%
78% 78% 81%
46%
57% 56%
71%
0%
10%
20%
30%
40%
50%
60%
70%
80%
90%
100%
No High-School Diploma
High-School Diploma Some College BA or Higher
Both Parents 1979 Both Parents 1997
As the intact, married family has become less central to the lives of American children, the share of children being raised in stepfamilies and especially in single-parent families has increased. Figure 6a indicates that the percentage of adolescents living in stepfamilies rose from 8 percent in the 1970s to 14 percent in 1997, while single-parent families more than doubled from 13 percent in the late 1970s to 27 percent in 1997.
The rising share of children raised without both parents present is important, because children raised in single-parent and stepfamilies are less likely to thrive on a range of social and economic outcomes, compared to children raised in intact, married homes.28 Family structure appears to matter for children’s well-being because, on average, children growing up without both parents are exposed to:
• More instability in housing and primary caretakers, which is stressful for children;
• Less parental affection and involvement;
• Less consistent discipline and oversight; and
• Fewer economic resources.
Sources: NLSY79 and NLSY97.
28. See especially the work of Sara McLanahan in articles such as “Diverging Destinies: How Children Are Faring under the Second Demographic Transition,” Demography 41, no. 4 (2004): 607–27, and her book with Gary Sandefur, Growing Up with a Single Parent: What Hurts, What Helps (Cambridge: Harvard University Press, 1994).
C: By Race and Hispanic Origin
20
To be sure, many children raised outside of an intact family turn out fine. However, the vulnerabilities associated with being raised in a nonintact family mean that children from single-parent and stepfamilies will find it harder to accumulate the human capital they need to thrive in today’s marketplace. They are also more likely to fall prey to adolescent and young-adult mistakes—such as a premarital pregnancy or an encounter with law enforcement—that can put their adult futures at risk.29
In summarizing their research on family structure, sociologists Sara McLanahan and Gary Sandefur put it this way:
If we were asked to design a system for making sure that children’s basic needs were met, we would probably come up with something quite similar to the two-parent ideal. Such a design, in theory, would not only ensure that children had access to the time and money of two adults; it also would provide a system of checks and balances that promoted quality parenting. The fact that both parents have a biological connection to the child would increase the likelihood that the parents would identify with the child and be willing to sacrifice for that child, and it would reduce the likelihood that either parent would abuse the child.30
The research to date leads us to hypothesize that children from intact, married families headed by biological or adoptive parents are more likely to enjoy stability, engaged parenting, and economic resources and to gain the education, life experiences, and motivation needed to flourish in the contemporary economy—and to avoid the detours that can put their adult futures at risk. We turn now to the empirical evidence on whether intact families provide a foundation for economic success.
How Robust Is the Relationship between Parent Presence and Educational, Social, and Economic Outcomes? This report relies on two data sets (the NLSY79 and NLSY97) that track adolescents over the course of their adult lives to understand the connections between family structure, human capital formation, family formation, work, and economic success in America. The NLSY97 is used to analyze outcomes for young adults who were aged 28–30 in 2008–2011; the NLYSY79 focuses on outcomes for middle-aged adults aged 44–46 in 2004–2010.31
29. For overviews of the research on child well-being, family instability, and family structure, see also Paul Amato, “The Impact of Family Formation Change on the Cognitive, Social, and Emotional Well-Being of the Next Generation,” Future of Children 15, no. 2 (2005): 75–96; Andrew Cherlin, The Marriage-Go-Round (New York: Vintage, 2009); Carolyn J. Hill, Harry J. Holzer, and Henry Chen, Against the Tide: Household Structure, Opportunities, and Outcomes among White and Minority Youth (Kalamazoo, MI: W.E. Upjohn Institute for Employment Research, 2009).
30. McLanahan and Sandefur, Growing Up with a Single Parent, 38.
31. For more on this report’s methodology, see www.family-studies.org/for-richer-for-poorer/NLSY.
For Richer, For Poorer: How Family Structures Economic Success in America 21
In this section, we examine six dependent variables:
1- High-school graduation, a basic requirement for most jobs;
2- Nonresident fatherhood for men and unmarried parenthood for women, two factors that limit people’s ability to maximize opportunities in adulthood;
3- Marriage, a status that generally is associated with more work effort by men and higher living standards for men and women;
4- Hours worked in the prior year, a comprehensive measure that takes account of weeks worked and hours per week;
5- Pretax individual earned income, an important measure of economic success; and
6- Pretax cash family income for adults (including income from the respondent and other members of the family), the primary indicator of living standards for American families.32
To explore the nature of the influence of family structure on these outcomes, we rely on regression models that control for age, race/ethnicity, mother’s age at birth, mother’s education, and respondents’ scores on the Armed Forces Qualifying Test (AFQT), which measures intelligence and knowledge of a range of subjects. In this section, we do not control for household income, because the higher income that children enjoy in a two-parent home is part of the benefit of being raised in an intact family. In the next sections, models investigating the influence of marital status also control for respondents’ education. For family income, we also control for household size and living with parents. The results show the net effects of family structure on important adolescent and adult outcomes.33
Education is central to success in the job market. How, then, is family structure associated with education? We focus on one indicator of education: dropping out of high school. To the extent it depends on the presence of parents, education’s effects on labor-market outcomes are in part the result of the structure of the individual’s family of origin.
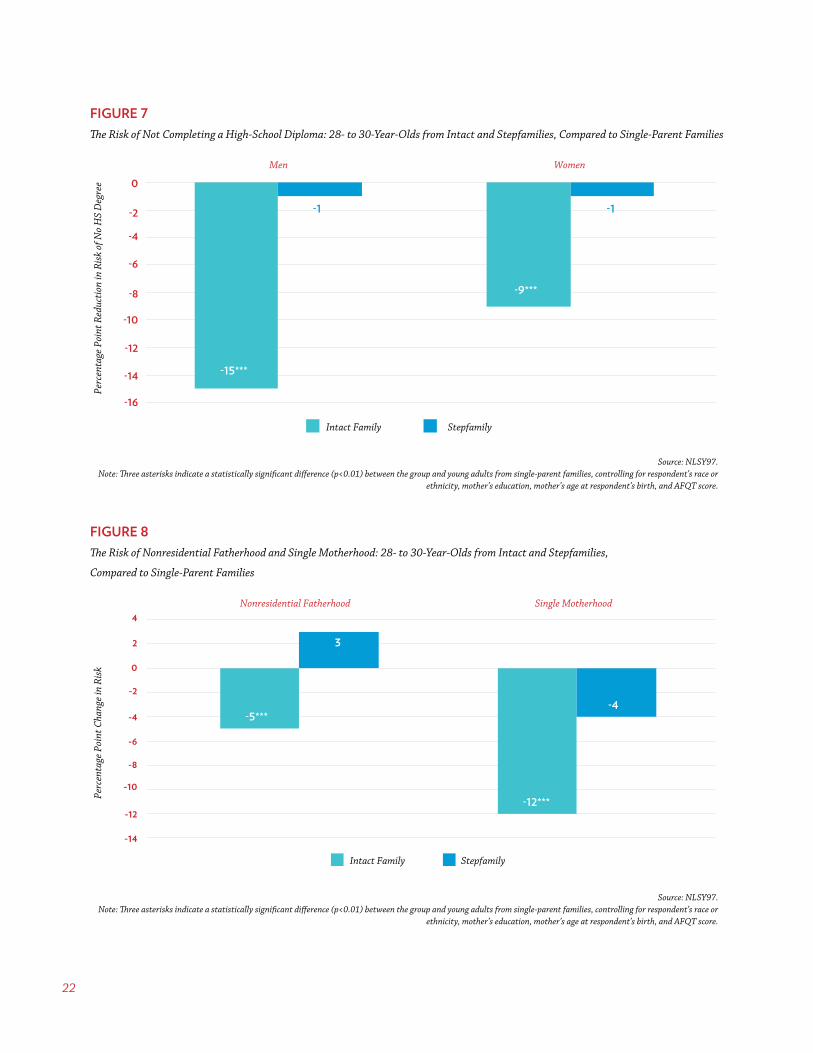
For the more recent cohort (based on data from the 1997 NLSY), growing up with both parents is associated with lower odds that 28- to 30-year-old young men and women do not earn a high-school diploma (figure 7). Net of controls, having lived with both parents as a teenager reduces the probability of leaving high school without a diploma by 15 percentage points for men and 9 points for women, compared to those who were raised by a single parent. (Young adults from stepfamilies fell in the middle, though the difference between them and
32. For single adults, family income is just the income of the respondent. Note that this measure excludes tax credits and transfers that increase the purchasing power of lower-income families.
33. For more details on the regression models for part 2, see http://ifstudies.org/for-richer-for-poorer-methods/.
22
FIGURE 7The Risk of Not Completing a High-School Diploma: 28- to 30-Year-Olds from Intact and Stepfamilies, Compared to Single-Parent Families
Source: NLSY97.Note: Three asterisks indicate a statistically significant difference (p<0.01) between the group and young adults from single-parent families, controlling for respondent’s race or
ethnicity, mother’s education, mother’s age at respondent’s birth, and AFQT score.
FIGURE 8The Risk of Nonresidential Fatherhood and Single Motherhood: 28- to 30-Year-Olds from Intact and Stepfamilies,
Compared to Single-Parent Families
Source: NLSY97.Note: Three asterisks indicate a statistically significant difference (p<0.01) between the group and young adults from single-parent families, controlling for respondent’s race or
ethnicity, mother’s education, mother’s age at respondent’s birth, and AFQT score.
-15***
-1 -1
-16
-14
-12
-10
-8
-6
-4
-2
0
Men Women
Perc
enta
ge P
oint
Red
ucti
on in
Ris
k of
No
HS
Deg
ree
Intact Family Stepfamily
-9***
-5***
-12***
3
-4
-14
-12
-10
-8
-6
-4
-2
0
2
4 Nonresidential Fatherhood Single Motherhood
Perc
enta
ge P
oint
Cha
nge
in R
isk
Intact Family Stepfamily
For Richer, For Poorer: How Family Structures Economic Success in America 23
their peers from single-parent families is not statistically significant.) The size of these effects is large, considering that the average rate of noncompletion is 22 percent for men and 17 percent for women.
Stable, two-parent families limit poverty, increase mobility, and are associated with a variety of positive social and health outcomes for children and adults alike. Two barriers to the formation of stable, two-parent families are having children outside marriage and becoming a noncustodial father. In 2011, 29 percent of 26- to 32-year-old women were unmarried parents. Figure 8 indicates that having grown up with both parents instead of in a single-parent family is associated with a 12 percentage point decline in women’s unmarried parenthood.
One in six men aged 26–32 was a noncustodial father in 2011. Again, parental presence exerted a statistically significant effect, lowering the probability of becoming a noncustodial father by 5 percentage points (figure 8). Clearly, young adults from intact families are less likely to form nonintact families of their own.
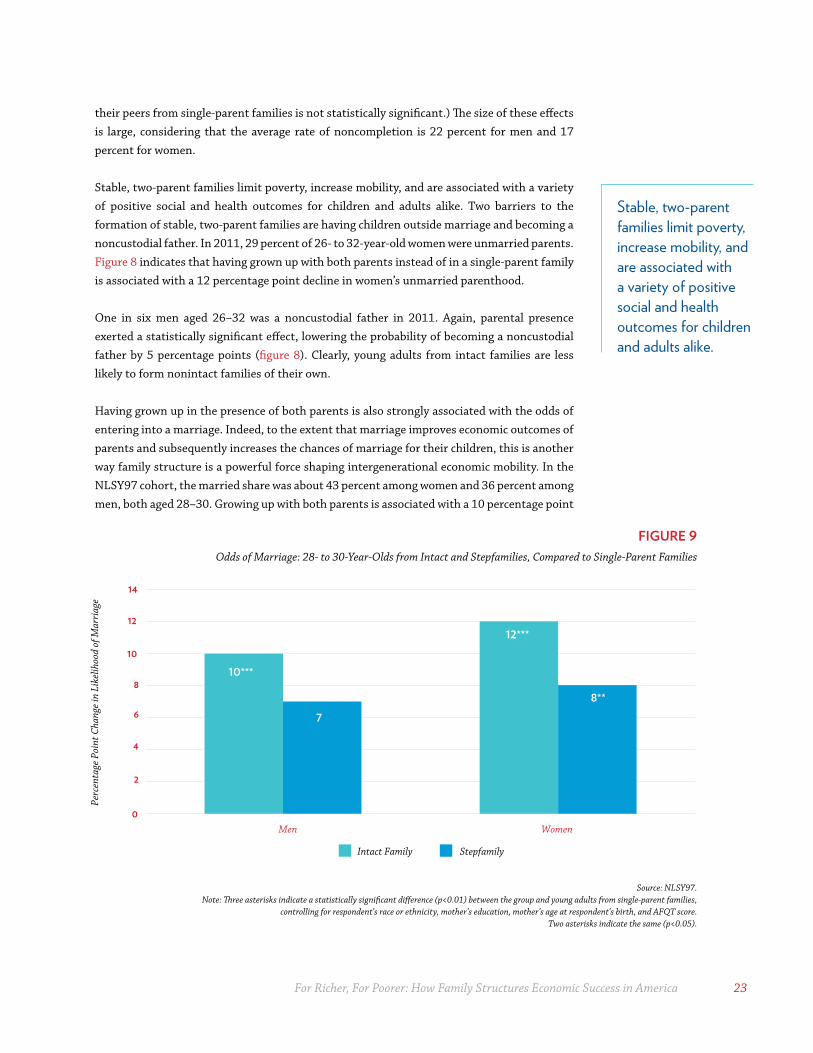
Having grown up in the presence of both parents is also strongly associated with the odds of entering into a marriage. Indeed, to the extent that marriage improves economic outcomes of parents and subsequently increases the chances of marriage for their children, this is another way family structure is a powerful force shaping intergenerational economic mobility. In the NLSY97 cohort, the married share was about 43 percent among women and 36 percent among men, both aged 28–30. Growing up with both parents is associated with a 10 percentage point
FIGURE 9Odds of Marriage: 28- to 30-Year-Olds from Intact and Stepfamilies, Compared to Single-Parent Families
Source: NLSY97.Note: Three asterisks indicate a statistically significant difference (p<0.01) between the group and young adults from single-parent families,
controlling for respondent’s race or ethnicity, mother’s education, mother’s age at respondent’s birth, and AFQT score. Two asterisks indicate the same (p<0.05).
10***
12***
7
8**
0
2
4
6
8
10
12
14
Men Women
Perc
enta
ge P
oint
Cha
nge
in L
ikel
ihoo
d of
Mar
riag
e
Intact Family Stepfamily
Stable, two-parent families limit poverty, increase mobility, and are associated with a variety of positive social and health outcomes for children and adults alike.
24
rise in the marriage rate for men and a 12 percentage point rise for women, over those who grew up in single-parent families (figure 9). At the same time, growing up with a stepparent instead of a single parent appears to exert a smaller, but insignificant for men, effect on marriage.
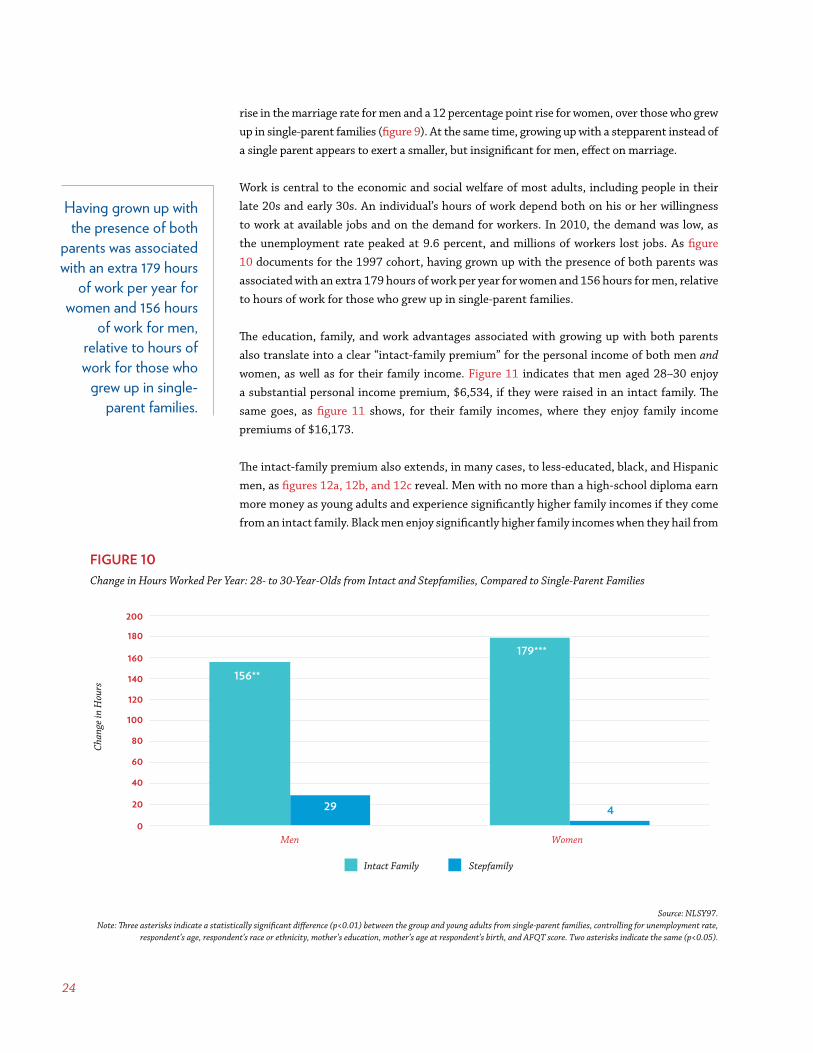
Work is central to the economic and social welfare of most adults, including people in their late 20s and early 30s. An individual’s hours of work depend both on his or her willingness to work at available jobs and on the demand for workers. In 2010, the demand was low, as the unemployment rate peaked at 9.6 percent, and millions of workers lost jobs. As figure 10 documents for the 1997 cohort, having grown up with the presence of both parents was associated with an extra 179 hours of work per year for women and 156 hours for men, relative to hours of work for those who grew up in single-parent families.
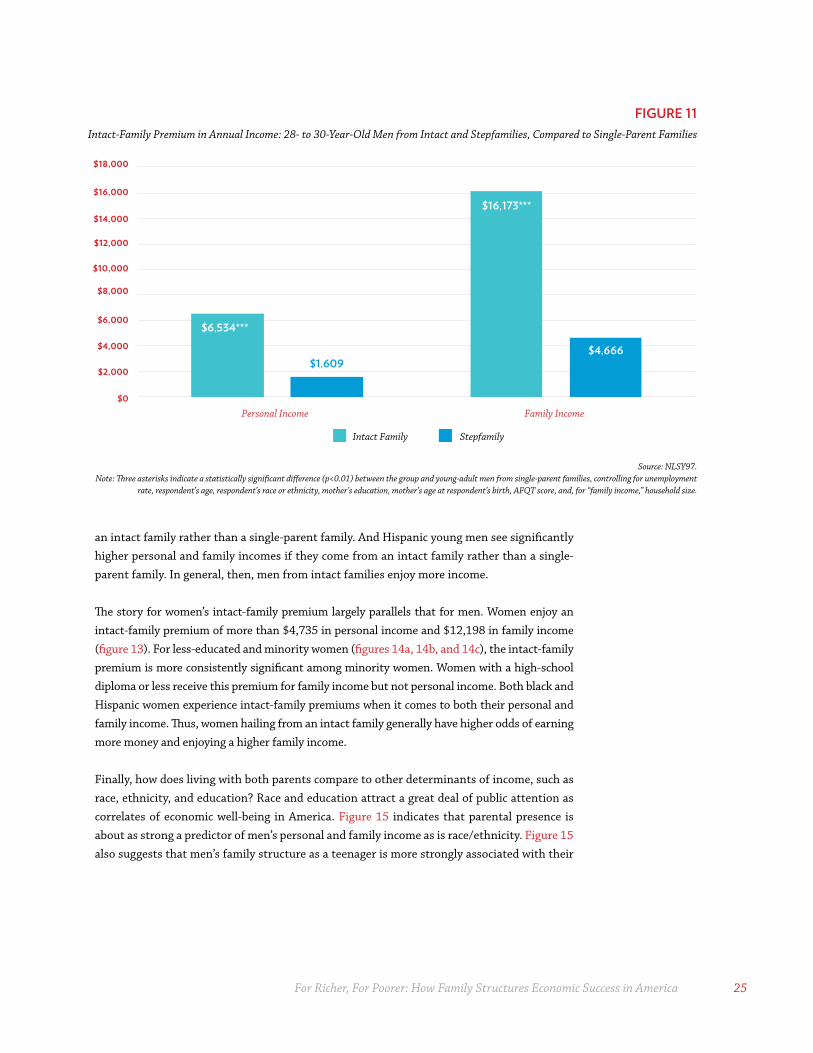
The education, family, and work advantages associated with growing up with both parents also translate into a clear “intact-family premium” for the personal income of both men and women, as well as for their family income. Figure 11 indicates that men aged 28–30 enjoy a substantial personal income premium, $6,534, if they were raised in an intact family. The same goes, as figure 11 shows, for their family incomes, where they enjoy family income premiums of $16,173.
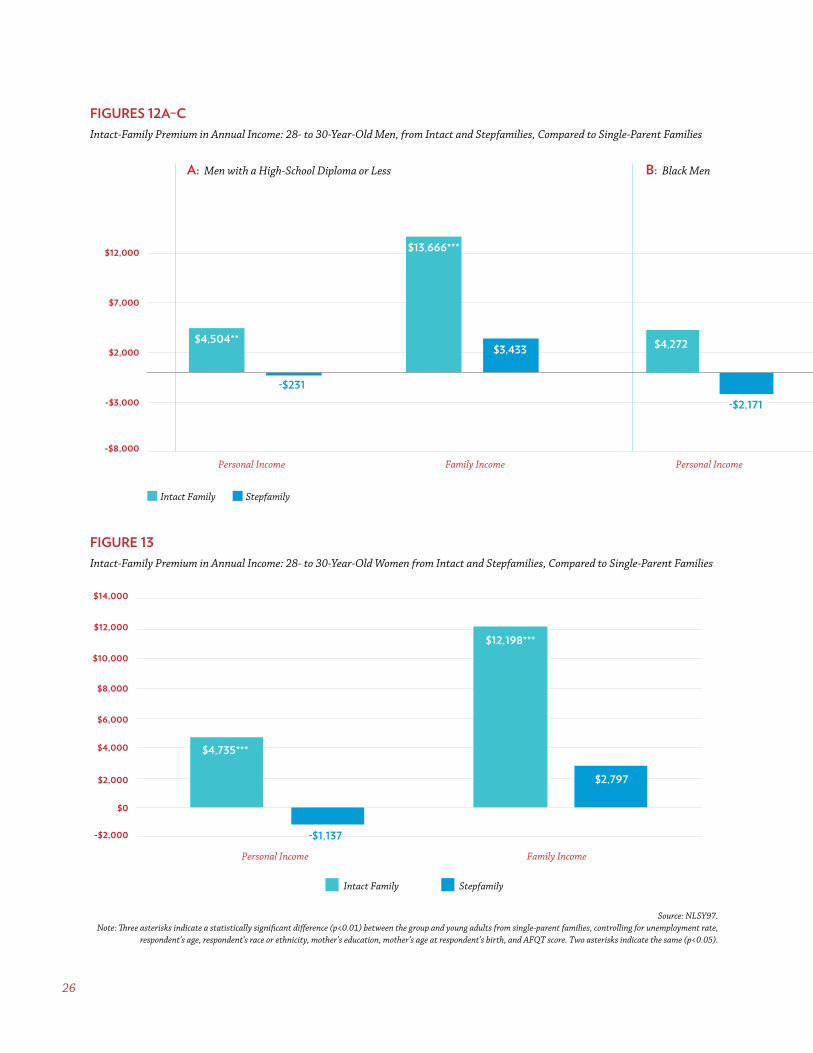
The intact-family premium also extends, in many cases, to less-educated, black, and Hispanic men, as figures 12a, 12b, and 12c reveal. Men with no more than a high-school diploma earn more money as young adults and experience significantly higher family incomes if they come from an intact family. Black men enjoy significantly higher family incomes when they hail from
FIGURE 10Change in Hours Worked Per Year: 28- to 30-Year-Olds from Intact and Stepfamilies, Compared to Single-Parent Families
Source: NLSY97.Note: Three asterisks indicate a statistically significant difference (p<0.01) between the group and young adults from single-parent families, controlling for unemployment rate,
respondent’s age, respondent’s race or ethnicity, mother’s education, mother’s age at respondent’s birth, and AFQT score. Two asterisks indicate the same (p<0.05).
156**
179***
29 4 0
20
40
60
80
100
120
140
160
180 200
Men Women
Chan
ge in
Hou
rs
Intact Family Stepfamily
Having grown up with the presence of both
parents was associated with an extra 179 hours
of work per year for women and 156 hours
of work for men, relative to hours of work for those who
grew up in single-parent families.
For Richer, For Poorer: How Family Structures Economic Success in America 25
an intact family rather than a single-parent family. And Hispanic young men see significantly higher personal and family incomes if they come from an intact family rather than a single-parent family. In general, then, men from intact families enjoy more income.
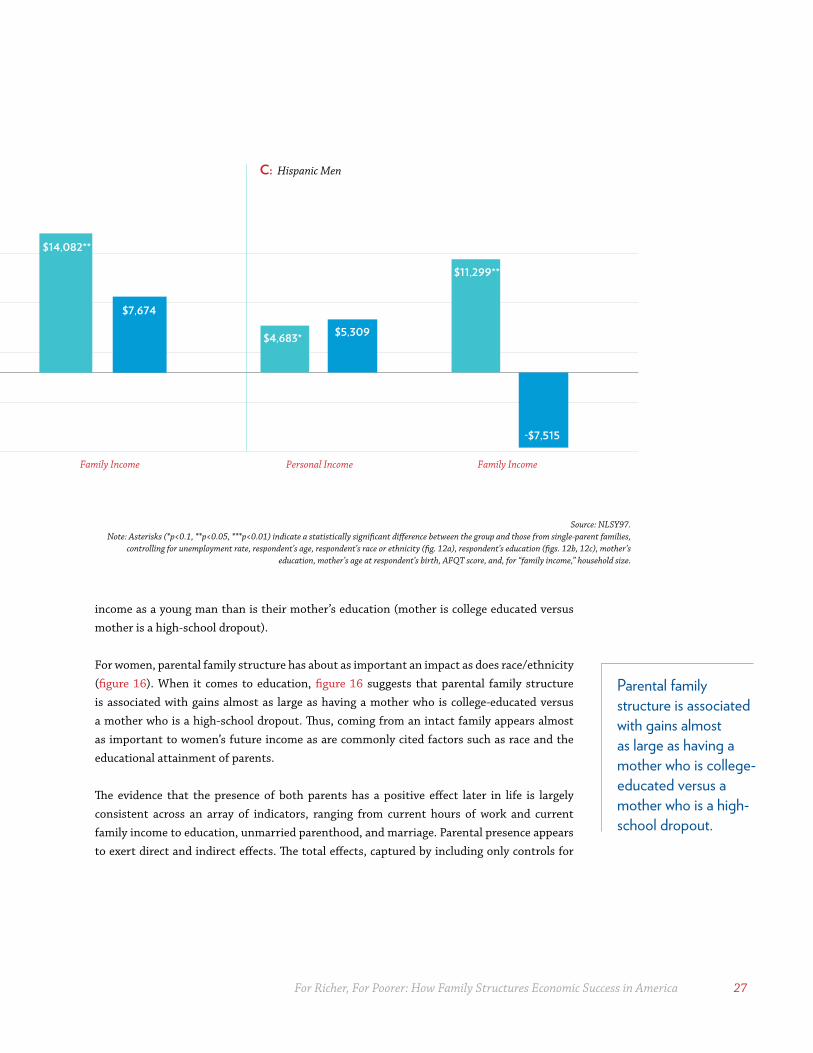
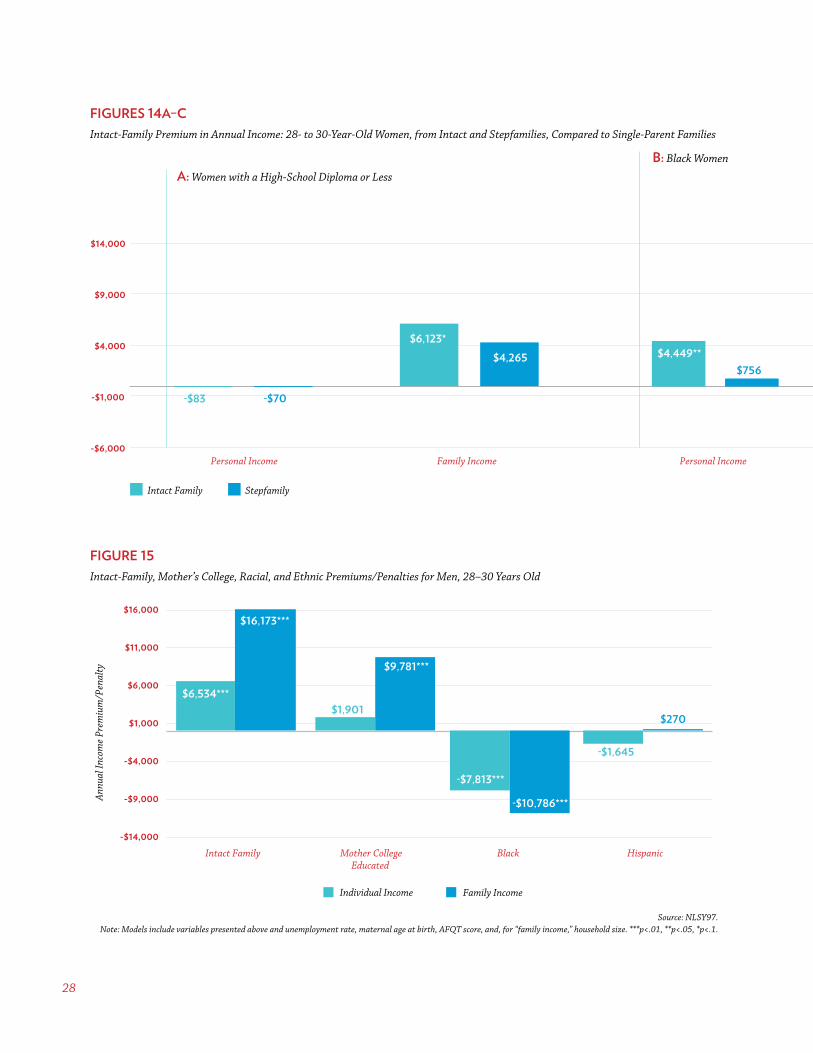
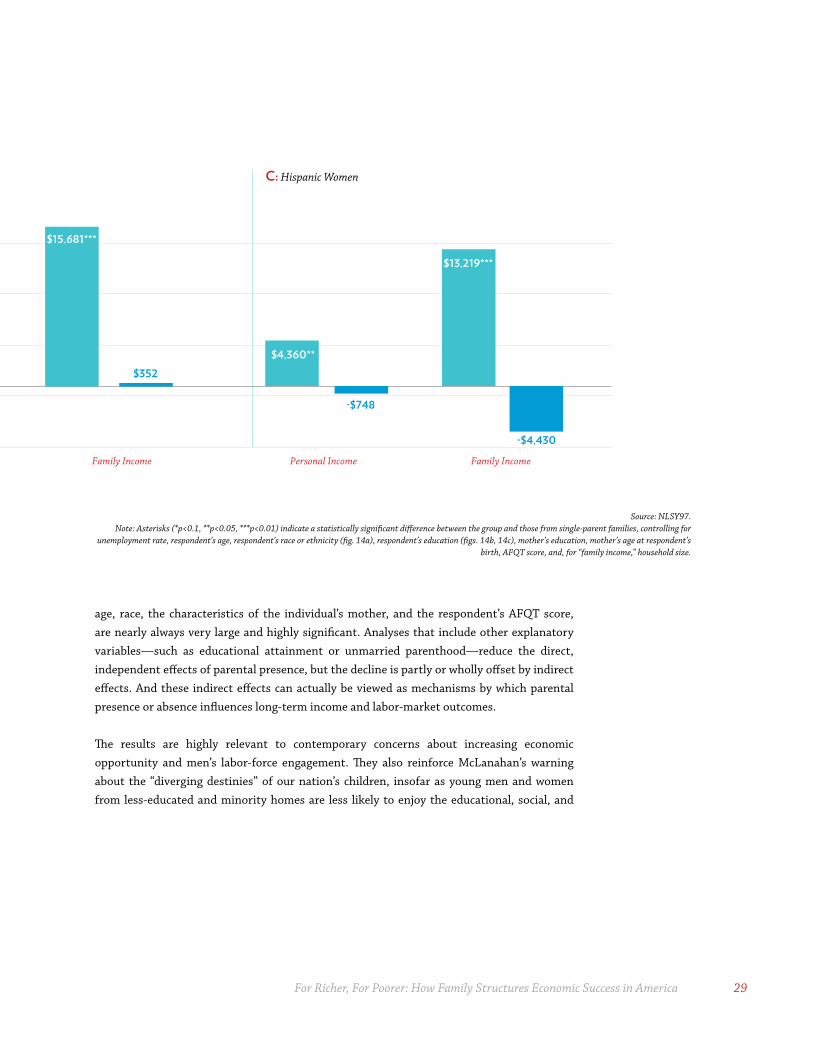
The story for women’s intact-family premium largely parallels that for men. Women enjoy an intact-family premium of more than $4,735 in personal income and $12,198 in family income (figure 13). For less-educated and minority women (figures 14a, 14b, and 14c), the intact-family premium is more consistently significant among minority women. Women with a high-school diploma or less receive this premium for family income but not personal income. Both black and Hispanic women experience intact-family premiums when it comes to both their personal and family income. Thus, women hailing from an intact family generally have higher odds of earning more money and enjoying a higher family income.
Finally, how does living with both parents compare to other determinants of income, such as race, ethnicity, and education? Race and education attract a great deal of public attention as correlates of economic well-being in America. Figure 15 indicates that parental presence is about as strong a predictor of men’s personal and family income as is race/ethnicity. Figure 15 also suggests that men’s family structure as a teenager is more strongly associated with their
FIGURE 11Intact-Family Premium in Annual Income: 28- to 30-Year-Old Men from Intact and Stepfamilies, Compared to Single-Parent Families
Source: NLSY97.Note: Three asterisks indicate a statistically significant difference (p<0.01) between the group and young-adult men from single-parent families, controlling for unemployment
rate, respondent’s age, respondent’s race or ethnicity, mother’s education, mother’s age at respondent’s birth, AFQT score, and, for “family income,” household size.
Intact Family Stepfamily
$6,534***
$16,173***
$1,609 $4,666
$0
$2,000
$4,000
$6,000
$8,000
$10,000
$12,000
$14,000
$16,000
$18,000
Personal Income Family Income
26
FIGURES 12A–CIntact-Family Premium in Annual Income: 28- to 30-Year-Old Men, from Intact and Stepfamilies, Compared to Single-Parent Families
FIGURE 13Intact-Family Premium in Annual Income: 28- to 30-Year-Old Women from Intact and Stepfamilies, Compared to Single-Parent Families
Source: NLSY97.Note: Three asterisks indicate a statistically significant difference (p<0.01) between the group and young adults from single-parent families, controlling for unemployment rate,
respondent’s age, respondent’s race or ethnicity, mother’s education, mother’s age at respondent’s birth, and AFQT score. Two asterisks indicate the same (p<0.05).
$4,735***
$12,198***
-$1,137
$2,797
-$2,000
$0
$2,000
$4,000
$6,000
$8,000
$10,000
$12,000
$14,000
Personal Income Family Income
Intact Family Stepfamily
A: Men with a High-School Diploma or Less B: Black Men
$4,504**
$13,666***
-$231
$3,433
-$3,000
-$8,000
$2,000
$7,000
$12,000
Personal Income Family Income Personal Income Family Income Personal Income Family Income
Intact Family Stepfamily
$4,272
$14,082**
-$2,171
$7,674
$4,683*
$11,299**
$5,309
-$7,515
For Richer, For Poorer: How Family Structures Economic Success in America 27
$4,504**
$13,666***
-$231
$3,433
-$3,000
-$8,000
$2,000
$7,000
$12,000
Personal Income Family Income Personal Income Family Income Personal Income Family Income
Intact Family Stepfamily
$4,272
$14,082**
-$2,171
$7,674
$4,683*
$11,299**
$5,309
-$7,515
income as a young man than is their mother’s education (mother is college educated versus mother is a high-school dropout). For women, parental family structure has about as important an impact as does race/ethnicity (figure 16). When it comes to education, figure 16 suggests that parental family structure is associated with gains almost as large as having a mother who is college-educated versus a mother who is a high-school dropout. Thus, coming from an intact family appears almost as important to women’s future income as are commonly cited factors such as race and the educational attainment of parents.
The evidence that the presence of both parents has a positive effect later in life is largely consistent across an array of indicators, ranging from current hours of work and current family income to education, unmarried parenthood, and marriage. Parental presence appears to exert direct and indirect effects. The total effects, captured by including only controls for
Source: NLSY97.Note: Asterisks (*p<0.1, **p<0.05, ***p<0.01) indicate a statistically significant difference between the group and those from single-parent families,
controlling for unemployment rate, respondent’s age, respondent’s race or ethnicity (fig. 12a), respondent’s education (figs. 12b, 12c), mother’s education, mother’s age at respondent’s birth, AFQT score, and, for “family income,” household size.
C: Hispanic Men
Parental family structure is associated with gains almost as large as having a mother who is college-educated versus a mother who is a high-school dropout.
28
FIGURES 14A–CIntact-Family Premium in Annual Income: 28- to 30-Year-Old Women, from Intact and Stepfamilies, Compared to Single-Parent Families
FIGURE 15Intact-Family, Mother’s College, Racial, and Ethnic Premiums/Penalties for Men, 28–30 Years Old
Source: NLSY97.Note: Models include variables presented above and unemployment rate, maternal age at birth, AFQT score, and, for “family income,” household size. ***p<.01, **p<.05, *p<.1.
Individual Income Family Income
$6,534*** $1,901
-$7,813***
-$1,645
$16,173***
$9,781***
-$10,786***
$270
-$14,000
-$9,000
-$4,000
$1,000
$6,000
$11,000
$16,000
Intact Family Mother College Educated
Black Hispanic
Annu
al In
com
e Pr
emiu
m/P
enal
ty
A: Women with a High-School Diploma or Less
B: Black Women
-$83
$6,123*
-$70
$4,265
-$6,000
-$1,000
$4,000
$9,000
$14,000
Personal Income Family Income Personal Income Family Income Personal Income Family Income
Intact Family Stepfamily
$4,449**
$15,681***
$756 $352 $4,360**
$13,219***
-$748
-$4,430
For Richer, For Poorer: How Family Structures Economic Success in America 29
-$83
$6,123*
-$70
$4,265
-$6,000
-$1,000
$4,000
$9,000
$14,000
Personal Income Family Income Personal Income Family Income Personal Income Family Income
Intact Family Stepfamily
$4,449**
$15,681***
$756 $352 $4,360**
$13,219***
-$748
-$4,430
age, race, the characteristics of the individual’s mother, and the respondent’s AFQT score, are nearly always very large and highly significant. Analyses that include other explanatory variables—such as educational attainment or unmarried parenthood—reduce the direct, independent effects of parental presence, but the decline is partly or wholly offset by indirect effects. And these indirect effects can actually be viewed as mechanisms by which parental presence or absence influences long-term income and labor-market outcomes.
The results are highly relevant to contemporary concerns about increasing economic opportunity and men’s labor-force engagement. They also reinforce McLanahan’s warning about the “diverging destinies” of our nation’s children, insofar as young men and women from less-educated and minority homes are less likely to enjoy the educational, social, and
Source: NLSY97.Note: Asterisks (*p<0.1, **p<0.05, ***p<0.01) indicate a statistically significant difference between the group and those from single-parent families, controlling for
unemployment rate, respondent’s age, respondent’s race or ethnicity (fig. 14a), respondent’s education (figs. 14b, 14c), mother’s education, mother’s age at respondent’s birth, AFQT score, and, for “family income,” household size.
C: Hispanic Women
30
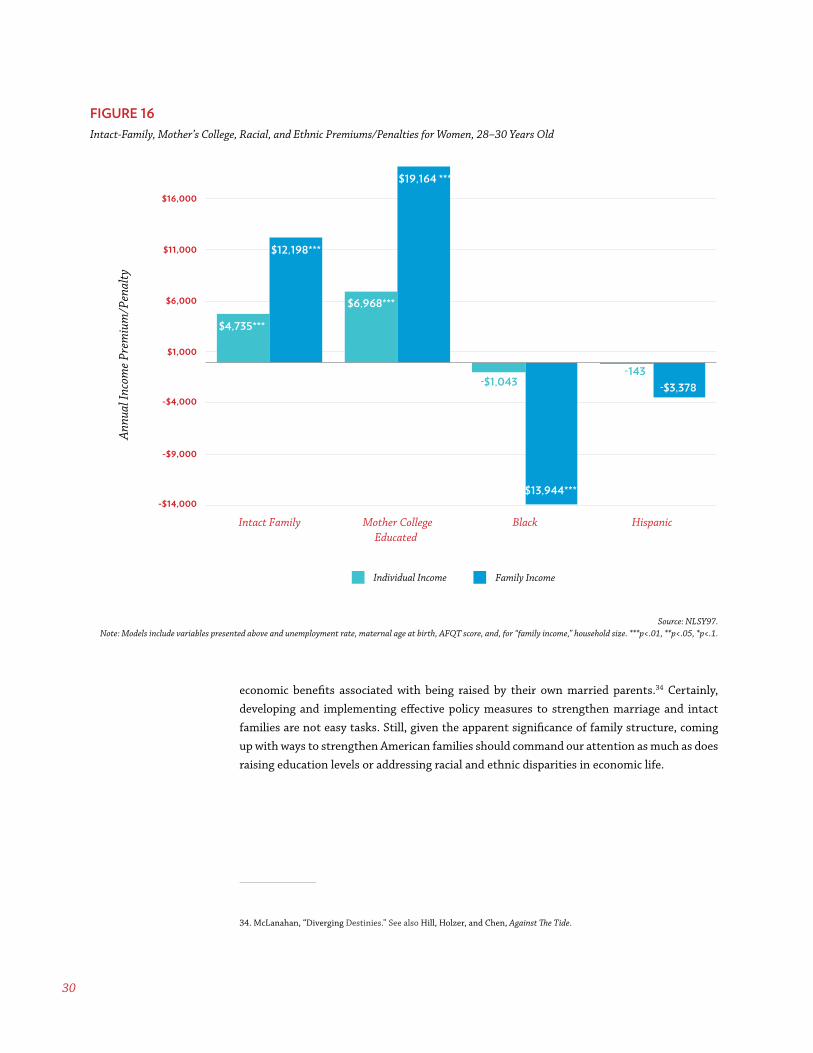
economic benefits associated with being raised by their own married parents.34 Certainly, developing and implementing effective policy measures to strengthen marriage and intact families are not easy tasks. Still, given the apparent significance of family structure, coming up with ways to strengthen American families should command our attention as much as does raising education levels or addressing racial and ethnic disparities in economic life.
FIGURE 16Intact-Family, Mother’s College, Racial, and Ethnic Premiums/Penalties for Women, 28–30 Years Old
Source: NLSY97.Note: Models include variables presented above and unemployment rate, maternal age at birth, AFQT score, and, for “family income,” household size. ***p<.01, **p<.05, *p<.1.
34. McLanahan, “Diverging Destinies.” See also Hill, Holzer, and Chen, Against The Tide.
$4,735***
$6,968***
-$1,043 -143
$12,198***
$19,164 ***
-$13,944***
-$3,378
-$14,000
-$9,000
-$4,000
$1,000
$6,000
$11,000
$16,000
Intact Family Mother College Educated
Black Hispanic
Annu
al In
com
e Pr
emiu
m/P
enal
ty
Individual Income Family Income

For Richer, For Poorer: How Family Structures Economic Success in America 31
Children who grow up in intact families have a greater chance of continuing further in their education, compared to their peers from stepfamilies and single-parent families. They also have a better chance of establishing an intact family themselves with a comfortable income. In fact, marriage is a better predictor of family income than is education, race, or ethnicity.
32
PART 3
A Marriage Premium for Menand WomenResearch indicates that marriage is associated with large gains in family living standards. But for individual earnings, the story varies markedly between men and women. Most research finds a marriage premium in individual earnings for men.35 But several studies estimate a marriage penalty in earnings for women, usually associated with motherhood.36 Given the increasingly egalitarian character of contemporary marriage, does marriage still deliver an individual premium to men, an individual penalty to women, and a large boost to family income?
In his economic theory of the family, Nobel Laureate Gary Becker argued in 1981 that men’s marriage premium and women’s marriage penalty in their earnings grow out of the specialization of labor in the household: men focus more on paid work because they have a spouse giving priority to housework and child care.37 In contrast, women who marry are able to devote less attention to paid work and undertake their substantial household responsibilities. This division of labor can increase the earnings of married men but decrease the earnings of married women. In today’s world, which is marked by more egalitarian marriages, Becker’s model looks less relevant. Indeed, new research suggests that married mothers may face only modest penalties from family life as men take up an increasing share of household responsibilities.38
Sociologists such as Steven Nock have focused on the ways marriage as an institution fosters responsible behavior by men, in particular. Marriage is associated with norms of maturity, providership, and self-control for men. Married men also benefit from the support and sage advice of a wife. All this is probably why men typically work harder, more strategically, and more successfully after they marry.39
In Akerlof’s memorable formulation, “Men settle down when they get married: if they fail to get married they fail to settle down.”40 From this perspective, even the increasingly egalitarian character of modern marriage—where spouses share work and household tasks more equally—need not diminish the effect of marriage on men’s work and income.
35. Ahituv and Lerman, “How Do Marital Status, Work Effort, and Wage Rates Interact?”
36. Michelle J. Budig and Paula England, “The Wage Penalty for Motherhood,” American Sociological Review 66, no. 2 (2001): 204–25; Linda Waite, “Does Marriage Matter?” Demography 32 (1995): 483–507; but see Ipshita Pal and Jane Waldfogel, “Re-Visiting the Family Gap in Pay in the United States” (working paper, Columbia University, New York, 2014).
37. Gary Becker, A Treatise on the Family (Cambridge: Harvard University Press, 1981).
38. Pal and Waldfogel, “Re-Visiting the Family Gap.”
39. Steven L. Nock, Marriage in Men’s Lives (New York: Oxford University Press, 1998); see also Elizabeth H. Gorman, “Bringing Home the Bacon: Marital Allocation of Income-Earning Responsibility, Job Shifts, and Men’s Wages,” Journal of Marriage and Family 61 (1999): 110–22; Alexandra Killewald
and Margaret Gough, “Does Specialization Explain Marriage Penalties and
Premiums?” American Sociological Review 78 (2013): 477–502.
40. Akerlof, “Men without Children,” 290.
For Richer, For Poorer: How Family Structures Economic Success in America 33
These different theoretical perspectives raise important questions about the impact of marriage on men’s and women’s work and income:
1- Do men continue to enjoy an earnings premium, even in a society that has moved in a more egalitarian direction?
2- Do women continue to experience an earnings penalty, or has the penalty disappeared in a society where they are more likely to share housework and child care with their husbands?
3- Do families still enjoy an income premium from marriage?
We answer these questions by using the NLSY79 and NLSY97 data to explore the association between marital status and work hours, personal income, and family income for young adults and middle-aged adults, controlling for a range of variables that might confound the association between marital status and these outcomes. The report also relies on fixed-effects models to explore how changes in individuals’ marital status might influence changes in men’s and women’s work hours and income.
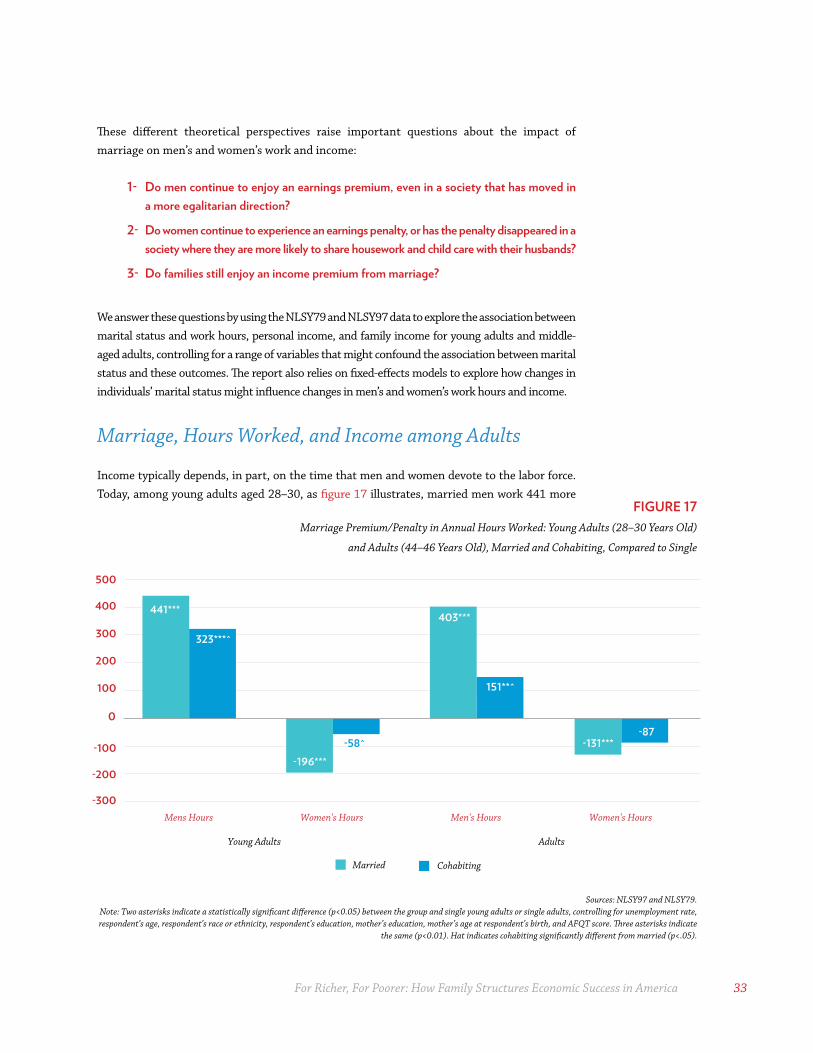
Marriage, Hours Worked, and Income among Adults
Income typically depends, in part, on the time that men and women devote to the labor force. Today, among young adults aged 28–30, as figure 17 illustrates, married men work 441 more
FIGURE 17Marriage Premium/Penalty in Annual Hours Worked: Young Adults (28–30 Years Old)
and Adults (44–46 Years Old), Married and Cohabiting, Compared to Single
Sources: NLSY97 and NLSY79.Note: Two asterisks indicate a statistically significant difference (p<0.05) between the group and single young adults or single adults, controlling for unemployment rate, respondent’s age, respondent’s race or ethnicity, respondent’s education, mother’s education, mother’s age at respondent’s birth, and AFQT score. Three asterisks indicate
the same (p<0.01). Hat indicates cohabiting significantly different from married (p<.05).
441***
-196***
403***
-131***
323***^
-58^
151**^
-87
-300
-200
-100
0
100
200
300
400
500
Married Cohabiting
Mens Hours Women's Hours Men's Hours Women's Hours
Young Adults Adults
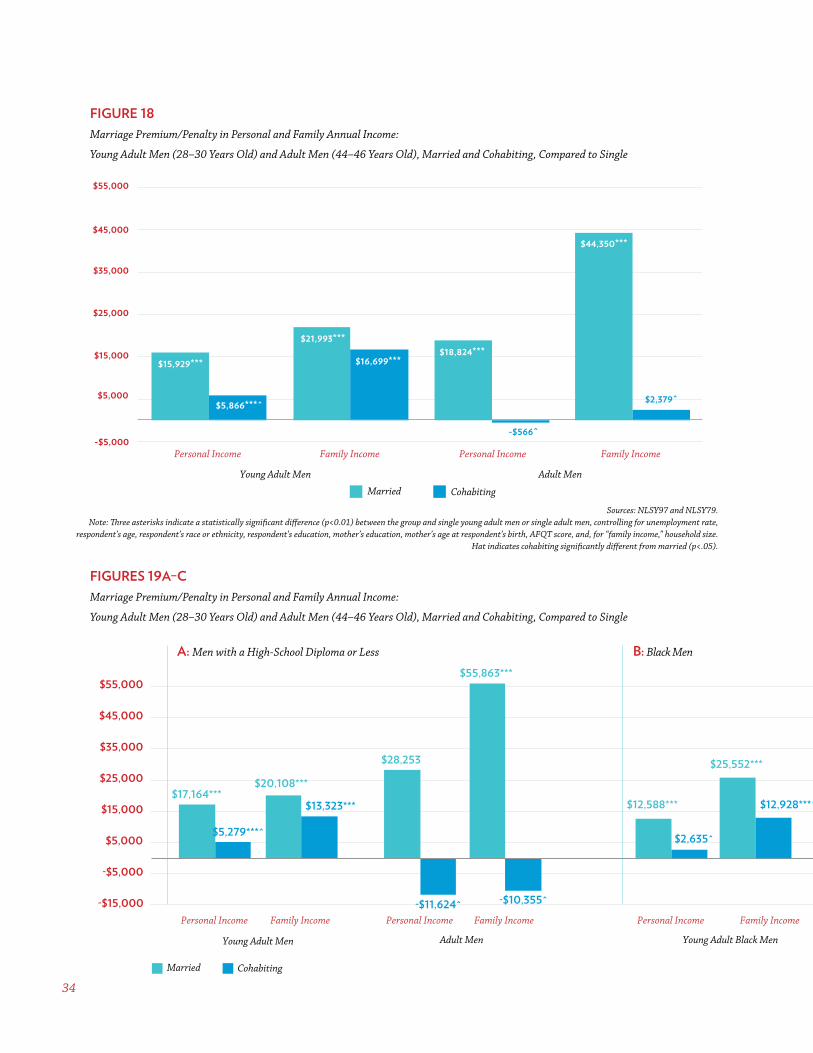
34
FIGURE 18Marriage Premium/Penalty in Personal and Family Annual Income:
Young Adult Men (28–30 Years Old) and Adult Men (44–46 Years Old), Married and Cohabiting, Compared to Single
Sources: NLSY97 and NLSY79.Note: Three asterisks indicate a statistically significant difference (p<0.01) between the group and single young adult men or single adult men, controlling for unemployment rate,
respondent’s age, respondent’s race or ethnicity, respondent’s education, mother’s education, mother’s age at respondent’s birth, AFQT score, and, for “family income,” household size. Hat indicates cohabiting significantly different from married (p<.05).
FIGURES 19A–CMarriage Premium/Penalty in Personal and Family Annual Income:
Young Adult Men (28–30 Years Old) and Adult Men (44–46 Years Old), Married and Cohabiting, Compared to Single
$15,929***
$21,993*** $18,824***
$44,350***
$5,866***^
$16,699***
-$566^
$2,379^
-$5,000
$5,000
$15,000
$25,000
$35,000
$45,000
$55,000
Personal Income Family Income Personal Income Family Income
Young Adult Men Adult Men
Married Cohabiting
A: Men with a High-School Diploma or Less B: Black Men
$17,164*** $20,108***
$28,253
$55,863***
$5,279***^
$13,323***
-$11,624^ -$10,355^-$15,000
-$5,000
$5,000
$15,000
$25,000
$35,000
$45,000
$55,000
Personal Income Family Income Personal Income Family Income
Young Adult Men Adult Men
Married Cohabiting
$12,588***
$25,552***
$14,497***
$39,075***
$2,635^
$12,928***^
$5,424 $6,315^
Personal Income Family Income Personal Income Family Income
Young Adult Black Men Adult Black Men
$16,004*** $15,040** $14,143***
$41,633***
$6,638***^ $2,711^
-$2,954^ -$1,399^
Personal Income Family Income Personal Income Family Income
Young Adult Hispanic Men Adult Hispanic Men
For Richer, For Poorer: How Family Structures Economic Success in America 35
$17,164*** $20,108***
$28,253
$55,863***
$5,279***^
$13,323***
-$11,624^ -$10,355^-$15,000
-$5,000
$5,000
$15,000
$25,000
$35,000
$45,000
$55,000
Personal Income Family Income Personal Income Family Income
Young Adult Men Adult Men
Married Cohabiting
$12,588***
$25,552***
$14,497***
$39,075***
$2,635^
$12,928***^
$5,424 $6,315^
Personal Income Family Income Personal Income Family Income
Young Adult Black Men Adult Black Men
$16,004*** $15,040** $14,143***
$41,633***
$6,638***^ $2,711^
-$2,954^ -$1,399^
Personal Income Family Income Personal Income Family Income
Young Adult Hispanic Men Adult Hispanic Men
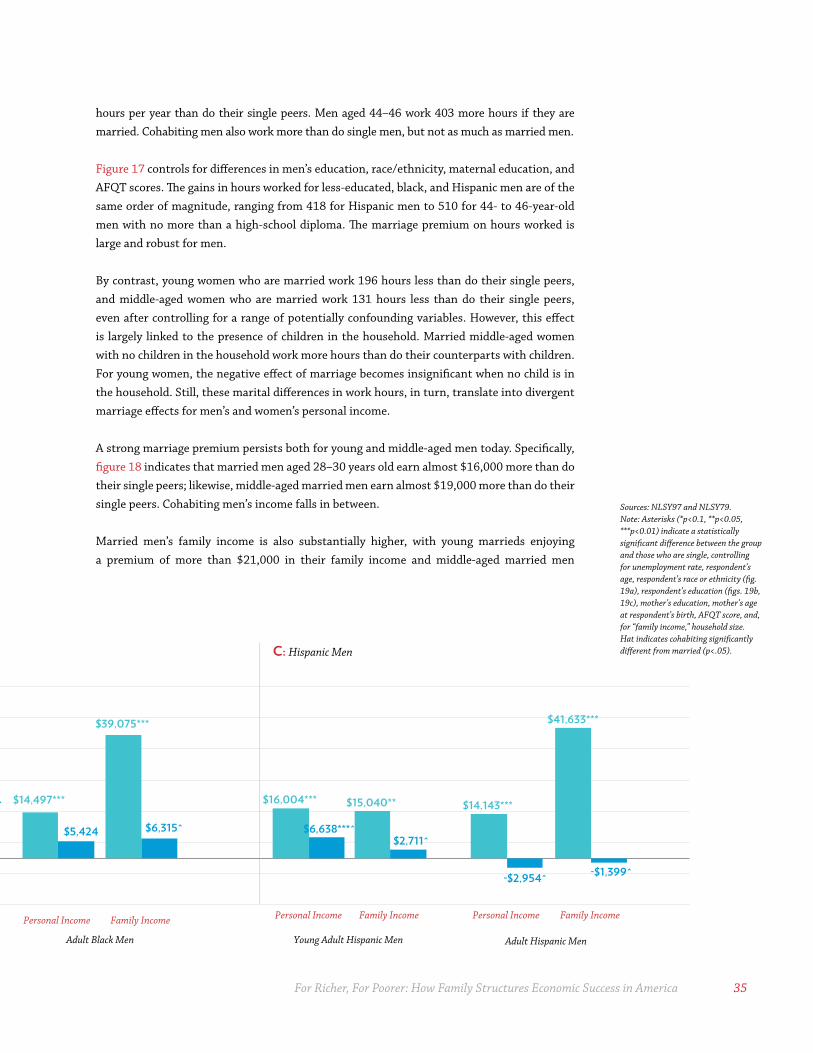
hours per year than do their single peers. Men aged 44–46 work 403 more hours if they are married. Cohabiting men also work more than do single men, but not as much as married men.
Figure 17 controls for differences in men’s education, race/ethnicity, maternal education, and AFQT scores. The gains in hours worked for less-educated, black, and Hispanic men are of the same order of magnitude, ranging from 418 for Hispanic men to 510 for 44- to 46-year-old men with no more than a high-school diploma. The marriage premium on hours worked is large and robust for men.
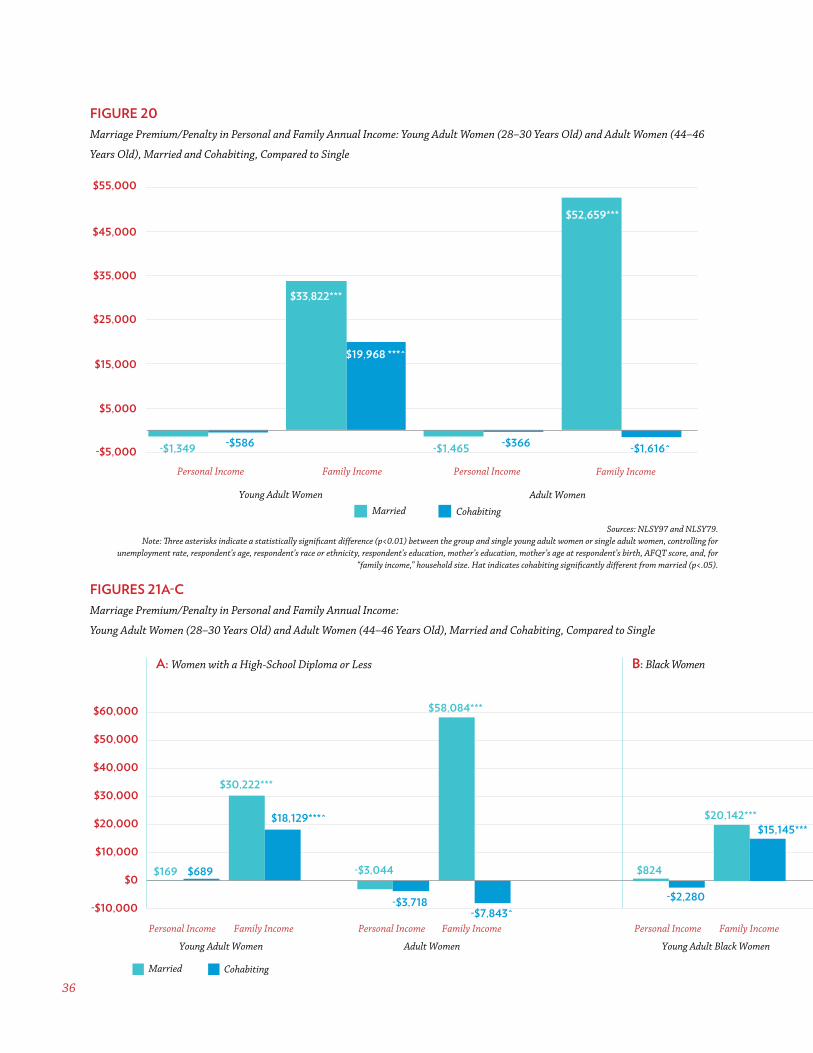
By contrast, young women who are married work 196 hours less than do their single peers, and middle-aged women who are married work 131 hours less than do their single peers, even after controlling for a range of potentially confounding variables. However, this effect is largely linked to the presence of children in the household. Married middle-aged women with no children in the household work more hours than do their counterparts with children. For young women, the negative effect of marriage becomes insignificant when no child is in the household. Still, these marital differences in work hours, in turn, translate into divergent marriage effects for men’s and women’s personal income.
A strong marriage premium persists both for young and middle-aged men today. Specifically, figure 18 indicates that married men aged 28–30 years old earn almost $16,000 more than do their single peers; likewise, middle-aged married men earn almost $19,000 more than do their single peers. Cohabiting men’s income falls in between.
Married men’s family income is also substantially higher, with young marrieds enjoying a premium of more than $21,000 in their family income and middle-aged married men
C: Hispanic Men
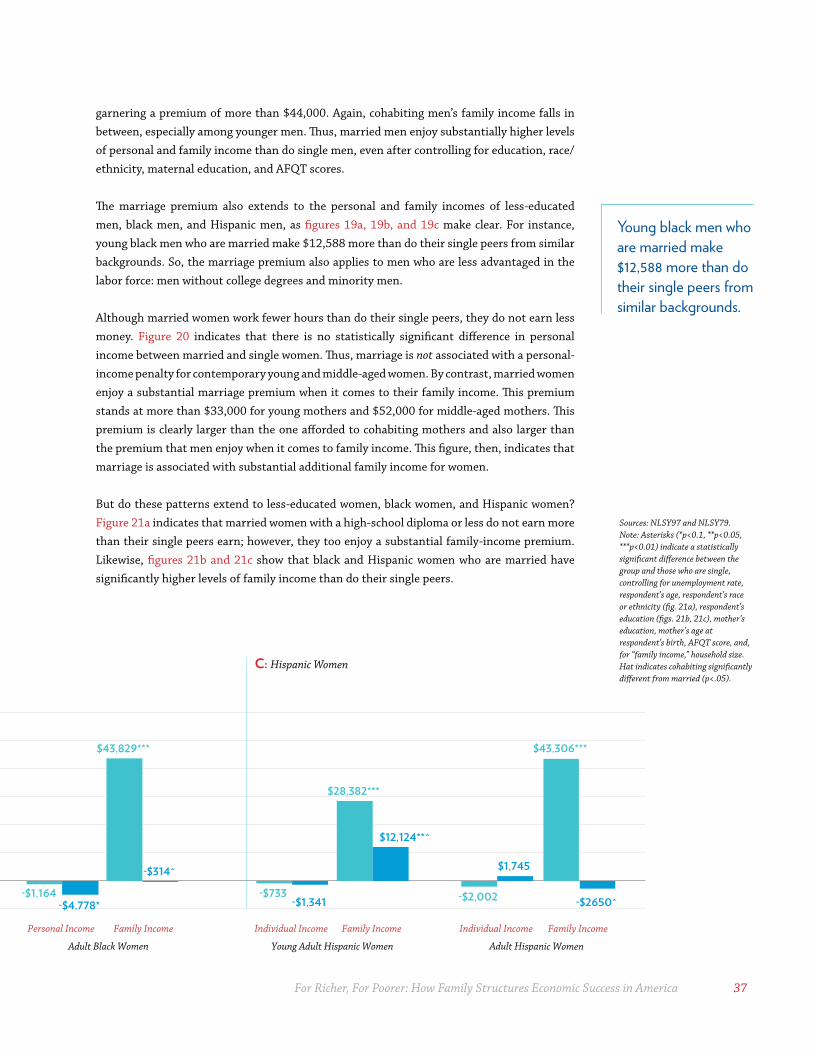
Sources: NLSY97 and NLSY79.Note: Asterisks (*p<0.1, **p<0.05, ***p<0.01) indicate a statistically significant difference between the group and those who are single, controlling for unemployment rate, respondent’s age, respondent’s race or ethnicity (fig. 19a), respondent’s education (figs. 19b, 19c), mother’s education, mother’s age at respondent’s birth, AFQT score, and, for “family income,” household size. Hat indicates cohabiting significantly different from married (p<.05).
36
FIGURE 20Marriage Premium/Penalty in Personal and Family Annual Income: Young Adult Women (28–30 Years Old) and Adult Women (44–46
Years Old), Married and Cohabiting, Compared to Single
Sources: NLSY97 and NLSY79.Note: Three asterisks indicate a statistically significant difference (p<0.01) between the group and single young adult women or single adult women, controlling for
unemployment rate, respondent’s age, respondent’s race or ethnicity, respondent’s education, mother’s education, mother’s age at respondent’s birth, AFQT score, and, for “family income,” household size. Hat indicates cohabiting significantly different from married (p<.05).
FIGURES 21A-CMarriage Premium/Penalty in Personal and Family Annual Income:
Young Adult Women (28–30 Years Old) and Adult Women (44–46 Years Old), Married and Cohabiting, Compared to Single
-$1,349
$33,822***
-$1,465
$52,659***
-$586
$19,968 ***^
-$366 -$1,616^-$5,000
$5,000
$15,000
$25,000
$35,000
$45,000
$55,000
Personal Income Family Income Personal Income Family Income
Young Adult Women Adult Women
Married Cohabiting
A: Women with a High-School Diploma or Less B: Black Women
$169
$30,222***
-$3,044
$58,084***
$689
$18,129***^
-$3,718 -$7,843^ -$10,000
$0
$10,000
$20,000
$30,000
$40,000
$50,000
$60,000
Personal Income Family Income Personal Income Family Income
Young Adult Women Adult Women
$824
$20,142***
-$1,164
$43,829***
-$2,280
$15,145***
-$4,778*
-$314^
Personal Income Family Income Personal Income Family Income
Young Adult Black Women Adult Black Women
-$733
$28,382***
-$2,002
$43,306***
-$1,341
$12,124**^
$1,745
-$2650^
Individual Income Family Income Individual Income Family Income
Young Adult Hispanic Women Adult Hispanic Women
Married Cohabiting
For Richer, For Poorer: How Family Structures Economic Success in America 37
$169
$30,222***
-$3,044
$58,084***
$689
$18,129***^
-$3,718 -$7,843^ -$10,000
$0
$10,000
$20,000
$30,000
$40,000
$50,000
$60,000
Personal Income Family Income Personal Income Family Income
Young Adult Women Adult Women
$824
$20,142***
-$1,164
$43,829***
-$2,280
$15,145***
-$4,778*
-$314^
Personal Income Family Income Personal Income Family Income
Young Adult Black Women Adult Black Women
-$733
$28,382***
-$2,002
$43,306***
-$1,341
$12,124**^
$1,745
-$2650^
Individual Income Family Income Individual Income Family Income
Young Adult Hispanic Women Adult Hispanic Women
Married Cohabiting
garnering a premium of more than $44,000. Again, cohabiting men’s family income falls in between, especially among younger men. Thus, married men enjoy substantially higher levels of personal and family income than do single men, even after controlling for education, race/ethnicity, maternal education, and AFQT scores.
The marriage premium also extends to the personal and family incomes of less-educated men, black men, and Hispanic men, as figures 19a, 19b, and 19c make clear. For instance, young black men who are married make $12,588 more than do their single peers from similar backgrounds. So, the marriage premium also applies to men who are less advantaged in the labor force: men without college degrees and minority men.
Although married women work fewer hours than do their single peers, they do not earn less money. Figure 20 indicates that there is no statistically significant difference in personal income between married and single women. Thus, marriage is not associated with a personal-income penalty for contemporary young and middle-aged women. By contrast, married women enjoy a substantial marriage premium when it comes to their family income. This premium stands at more than $33,000 for young mothers and $52,000 for middle-aged mothers. This premium is clearly larger than the one afforded to cohabiting mothers and also larger than the premium that men enjoy when it comes to family income. This figure, then, indicates that marriage is associated with substantial additional family income for women.
But do these patterns extend to less-educated women, black women, and Hispanic women? Figure 21a indicates that married women with a high-school diploma or less do not earn more than their single peers earn; however, they too enjoy a substantial family-income premium. Likewise, figures 21b and 21c show that black and Hispanic women who are married have significantly higher levels of family income than do their single peers.
Sources: NLSY97 and NLSY79.Note: Asterisks (*p<0.1, **p<0.05, ***p<0.01) indicate a statistically significant difference between the group and those who are single, controlling for unemployment rate, respondent’s age, respondent’s race or ethnicity (fig. 21a), respondent’s education (figs. 21b, 21c), mother’s education, mother’s age at respondent’s birth, AFQT score, and, for “family income,” household size. Hat indicates cohabiting significantly different from married (p<.05).
C: Hispanic Women
Young black men who are married make $12,588 more than do their single peers from similar backgrounds.
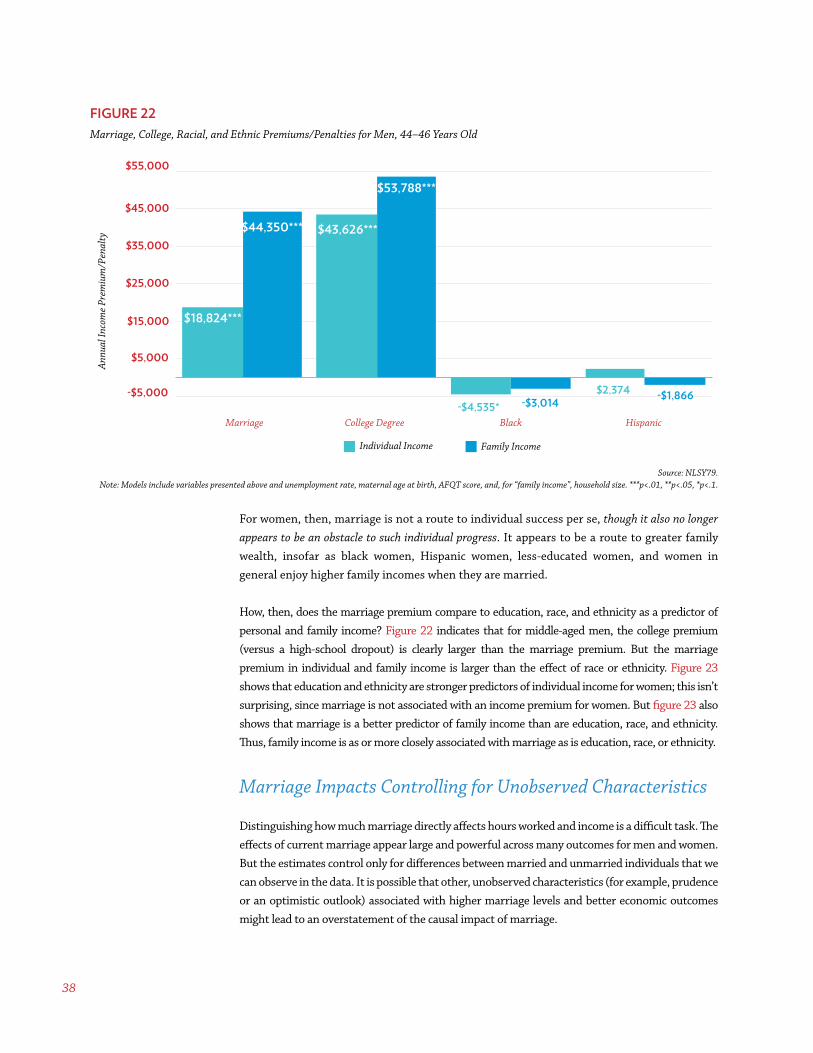
38
For women, then, marriage is not a route to individual success per se, though it also no longer appears to be an obstacle to such individual progress. It appears to be a route to greater family wealth, insofar as black women, Hispanic women, less-educated women, and women in general enjoy higher family incomes when they are married.
How, then, does the marriage premium compare to education, race, and ethnicity as a predictor of personal and family income? Figure 22 indicates that for middle-aged men, the college premium (versus a high-school dropout) is clearly larger than the marriage premium. But the marriage premium in individual and family income is larger than the effect of race or ethnicity. Figure 23 shows that education and ethnicity are stronger predictors of individual income for women; this isn’t surprising, since marriage is not associated with an income premium for women. But figure 23 also shows that marriage is a better predictor of family income than are education, race, and ethnicity. Thus, family income is as or more closely associated with marriage as is education, race, or ethnicity.
Marriage Impacts Controlling for Unobserved Characteristics
Distinguishing how much marriage directly affects hours worked and income is a difficult task. The effects of current marriage appear large and powerful across many outcomes for men and women. But the estimates control only for differences between married and unmarried individuals that we can observe in the data. It is possible that other, unobserved characteristics (for example, prudence or an optimistic outlook) associated with higher marriage levels and better economic outcomes might lead to an overstatement of the causal impact of marriage.
FIGURE 22Marriage, College, Racial, and Ethnic Premiums/Penalties for Men, 44–46 Years Old
Source: NLSY79.Note: Models include variables presented above and unemployment rate, maternal age at birth, AFQT score, and, for “family income”, household size. ***p<.01, **p<.05, *p<.1.
$18,824***
$43,626***
-$4,535* $2,374
$44,350***
$53,788***
-$3,014 -$1,866 -$5,000
$5,000
$15,000
$25,000
$35,000
$45,000
$55,000
Marriage College Degree Black Hispanic
Annu
al In
com
e Pr
emiu
m/P
enal
ty
Individual Income Family Income

For Richer, For Poorer: How Family Structures Economic Success in America 39
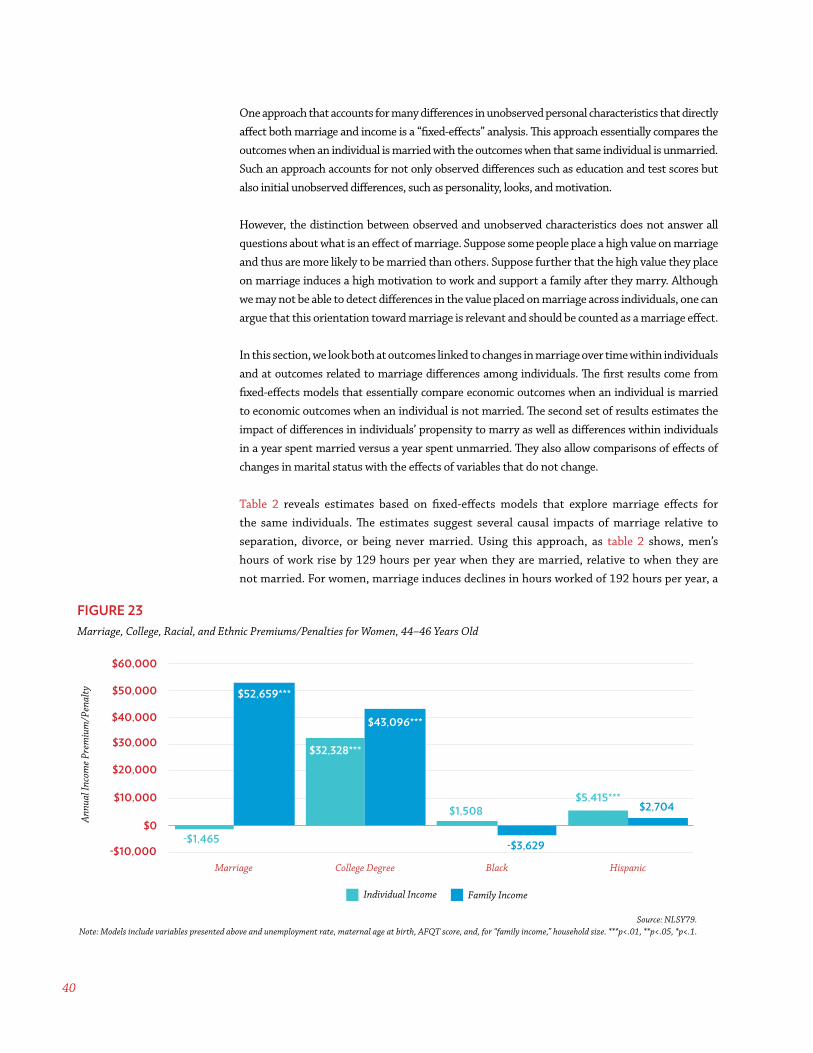
40
One approach that accounts for many differences in unobserved personal characteristics that directly affect both marriage and income is a “fixed-effects” analysis. This approach essentially compares the outcomes when an individual is married with the outcomes when that same individual is unmarried. Such an approach accounts for not only observed differences such as education and test scores but also initial unobserved differences, such as personality, looks, and motivation.
However, the distinction between observed and unobserved characteristics does not answer all questions about what is an effect of marriage. Suppose some people place a high value on marriage and thus are more likely to be married than others. Suppose further that the high value they place on marriage induces a high motivation to work and support a family after they marry. Although we may not be able to detect differences in the value placed on marriage across individuals, one can argue that this orientation toward marriage is relevant and should be counted as a marriage effect.
In this section, we look both at outcomes linked to changes in marriage over time within individuals and at outcomes related to marriage differences among individuals. The first results come from fixed-effects models that essentially compare economic outcomes when an individual is married to economic outcomes when an individual is not married. The second set of results estimates the impact of differences in individuals’ propensity to marry as well as differences within individuals in a year spent married versus a year spent unmarried. They also allow comparisons of effects of changes in marital status with the effects of variables that do not change. Table 2 reveals estimates based on fixed-effects models that explore marriage effects for the same individuals. The estimates suggest several causal impacts of marriage relative to separation, divorce, or being never married. Using this approach, as table 2 shows, men’s hours of work rise by 129 hours per year when they are married, relative to when they are not married. For women, marriage induces declines in hours worked of 192 hours per year, a
FIGURE 23Marriage, College, Racial, and Ethnic Premiums/Penalties for Women, 44–46 Years Old
Source: NLSY79.Note: Models include variables presented above and unemployment rate, maternal age at birth, AFQT score, and, for “family income,” household size. ***p<.01, **p<.05, *p<.1.
-$1,465
$32,328***
$1,508 $5,415***
$52,659***
$43,096***
-$3,629
$2,704
-$10,000
$0
$10,000
$20,000
$30,000
$40,000
$50,000
$60,000
Marriage College Degree Black Hispanic
Annu
al In
com
e Pr
emiu
m/P
enal
ty
Individual Income Family Income
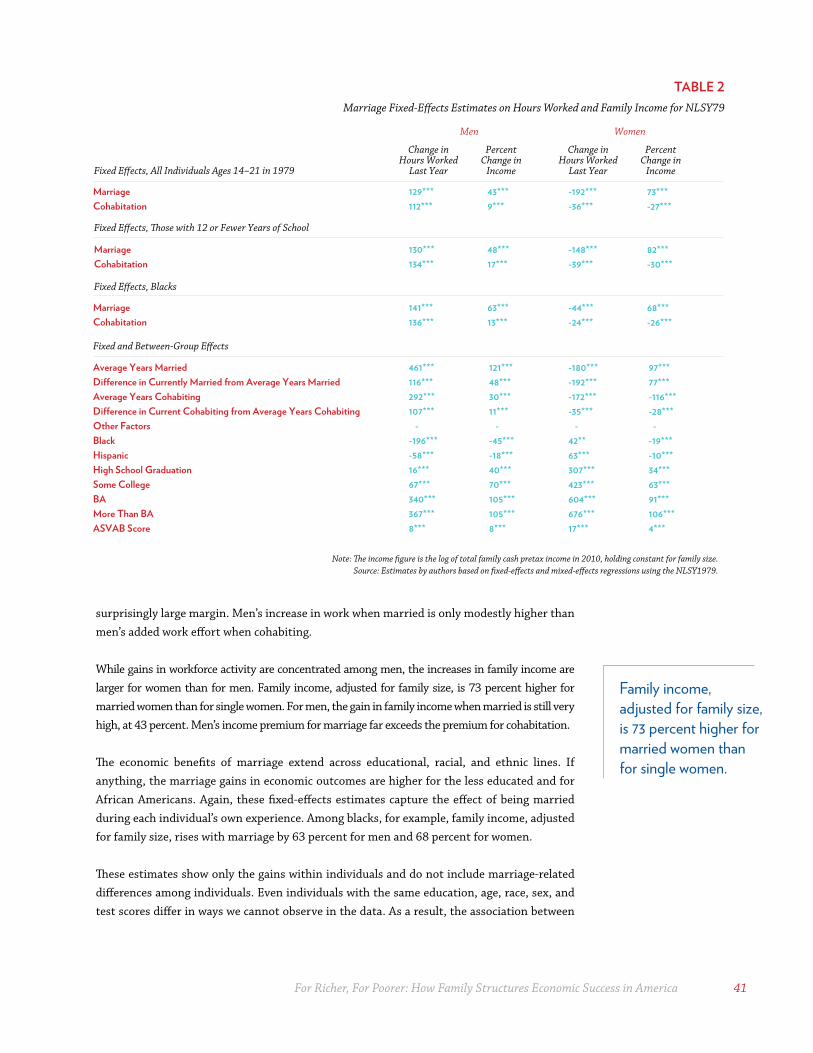
For Richer, For Poorer: How Family Structures Economic Success in America 41
surprisingly large margin. Men’s increase in work when married is only modestly higher than men’s added work effort when cohabiting.
While gains in workforce activity are concentrated among men, the increases in family income are larger for women than for men. Family income, adjusted for family size, is 73 percent higher for married women than for single women. For men, the gain in family income when married is still very high, at 43 percent. Men’s income premium for marriage far exceeds the premium for cohabitation. The economic benefits of marriage extend across educational, racial, and ethnic lines. If anything, the marriage gains in economic outcomes are higher for the less educated and for African Americans. Again, these fixed-effects estimates capture the effect of being married during each individual’s own experience. Among blacks, for example, family income, adjusted for family size, rises with marriage by 63 percent for men and 68 percent for women. These estimates show only the gains within individuals and do not include marriage-related differences among individuals. Even individuals with the same education, age, race, sex, and test scores differ in ways we cannot observe in the data. As a result, the association between
TABLE 2Marriage Fixed-Effects Estimates on Hours Worked and Family Income for NLSY79
MarriageCohabitation
Average Years Married Di�erence in Currently Married from Average Years MarriedAverage Years CohabitingDi�erence in Current Cohabiting from Average Years CohabitingOther FactorsBlack HispanicHigh School GraduationSome CollegeBA More Than BAASVAB Score
Change in Hours Worked
Last Year
Percent Change in
Income
Men
Fixed E�ects, All Individuals Ages 14–21 in 1979
Fixed and Between-Group E�ects
MarriageCohabitation
Fixed E�ects, �ose with 12 or Fewer Years of School
MarriageCohabitation
Fixed E�ects, Blacks
Change in Hours Worked
Last Year
Percent Change in
Income
Women
129***112***
130***134***
141***136***
461***116***292***107*** --196***-58***16***67***340***367***8***
121***48***30***11*** --45***-18***40***70***105***105***8***
43***9***
48***17***
63***13***
-192***-36***
-148***-39***
-44***-24***
-180***-192***-172***-35*** -42**63***307***423***604***676***17***
97***77***-116***-28*** --19***-10***34***63***91***106***4***
73***-27***
82***-30***
68***-26***
Note: The income figure is the log of total family cash pretax income in 2010, holding constant for family size. Source: Estimates by authors based on fixed-effects and mixed-effects regressions using the NLSY1979.
Family income, adjusted for family size, is 73 percent higher for married women than for single women.
42
marriage and economic outcomes across individuals could pick up some unobserved differences that cause both a higher probability of marriage and better performance in the labor market. On the other hand, the estimate may also be capturing differences in orientations toward marriage or other attitudes not related to economic outcomes. If so, differences in income and poverty between the married and unmarried may be part of a causal impact. Table 2 displays estimates based on a statistical model that incorporates effects within individuals, effects based on differences in years married between individuals, and other variables that are fixed over time (including age, age squared, race/ethnicity, educational attainment, and AFQT score). Note that even the fixed-effect estimate of marriage on income for men is as high as the racial differential and almost as high as the income gap between college-graduate and high-school-graduate men. For women, the marriage effect far exceeds race and ethnicity effects and is somewhat higher than the income differential between college and high-school graduates. The “average years married”
variable, which reflects the differences across individuals in their orientation toward marriage as well as other unobserved factors, show gains in family income of over 100 percent for men and 97 percent for women in a typical year. This means married men and women’s family income is about twice as high as their unmarried peers, net of family size, age, race, ethnicity, and test scores on various competencies. Although these results are worth noting, they are more likely to incorporate unobserved differences that directly affect marriage and income than are the fixed-effects estimates.
We cannot interpret all of the observed marriage effects between individuals as causal, just as we cannot do so when we observe income differences associated with education differences. However, even if only 25 percent of these estimates are the result of an orientation toward marriage that is not directly related to improved economic outcomes, the causal role of marriage in determining economic well-being is of an order of magnitude that rivals many other factors.
For Richer, For Poorer: How Family Structures Economic Success in America 43
Using a variety of techniques, then, we come to the following conclusions about marriage premiums and marriage penalties among contemporary men and women:
• Men who marry and stay married work more hours and earn more individual income than do their peers who are cohabiting or single. In nearly all cases, the positive differences between the gains associated with marriage and with cohabitation are statistically significant. This suggests that the institution of marriage continues to boost men’s commitment to work and the individual economic success they enjoy.
• Women who marry and stay married work fewer hours but earn about the same income as their peers who are cohabiting or single. Thus, we do not find a marriage penalty for contemporary women. This is important; it suggests that marriage is less a barrier to individual economic success for women than it used to be.
• Both men and especially women enjoy higher family incomes when they get and stay married.
• The marriage premiums in personal and family income generally extend to less-educated men and women, black men and women, and Hispanic men and women.
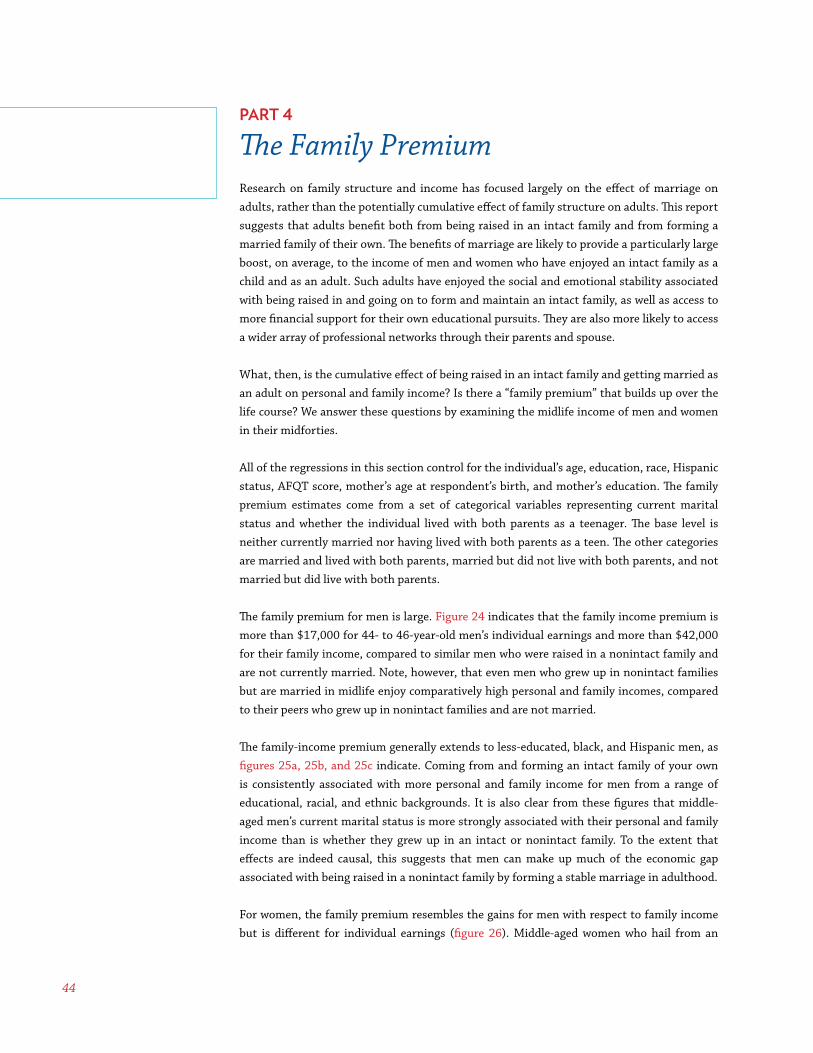
44
PART 4
The Family PremiumResearch on family structure and income has focused largely on the effect of marriage on adults, rather than the potentially cumulative effect of family structure on adults. This report suggests that adults benefit both from being raised in an intact family and from forming a married family of their own. The benefits of marriage are likely to provide a particularly large boost, on average, to the income of men and women who have enjoyed an intact family as a child and as an adult. Such adults have enjoyed the social and emotional stability associated with being raised in and going on to form and maintain an intact family, as well as access to more financial support for their own educational pursuits. They are also more likely to access a wider array of professional networks through their parents and spouse.
What, then, is the cumulative effect of being raised in an intact family and getting married as an adult on personal and family income? Is there a “family premium” that builds up over the life course? We answer these questions by examining the midlife income of men and women in their midforties.
All of the regressions in this section control for the individual’s age, education, race, Hispanic status, AFQT score, mother’s age at respondent’s birth, and mother’s education. The family premium estimates come from a set of categorical variables representing current marital status and whether the individual lived with both parents as a teenager. The base level is neither currently married nor having lived with both parents as a teen. The other categories are married and lived with both parents, married but did not live with both parents, and not married but did live with both parents.
The family premium for men is large. Figure 24 indicates that the family income premium is more than $17,000 for 44- to 46-year-old men’s individual earnings and more than $42,000 for their family income, compared to similar men who were raised in a nonintact family and are not currently married. Note, however, that even men who grew up in nonintact families but are married in midlife enjoy comparatively high personal and family incomes, compared to their peers who grew up in nonintact families and are not married.
The family-income premium generally extends to less-educated, black, and Hispanic men, as figures 25a, 25b, and 25c indicate. Coming from and forming an intact family of your own is consistently associated with more personal and family income for men from a range of educational, racial, and ethnic backgrounds. It is also clear from these figures that middle-aged men’s current marital status is more strongly associated with their personal and family income than is whether they grew up in an intact or nonintact family. To the extent that effects are indeed causal, this suggests that men can make up much of the economic gap associated with being raised in a nonintact family by forming a stable marriage in adulthood.
For women, the family premium resembles the gains for men with respect to family income but is different for individual earnings (figure 26). Middle-aged women who hail from an
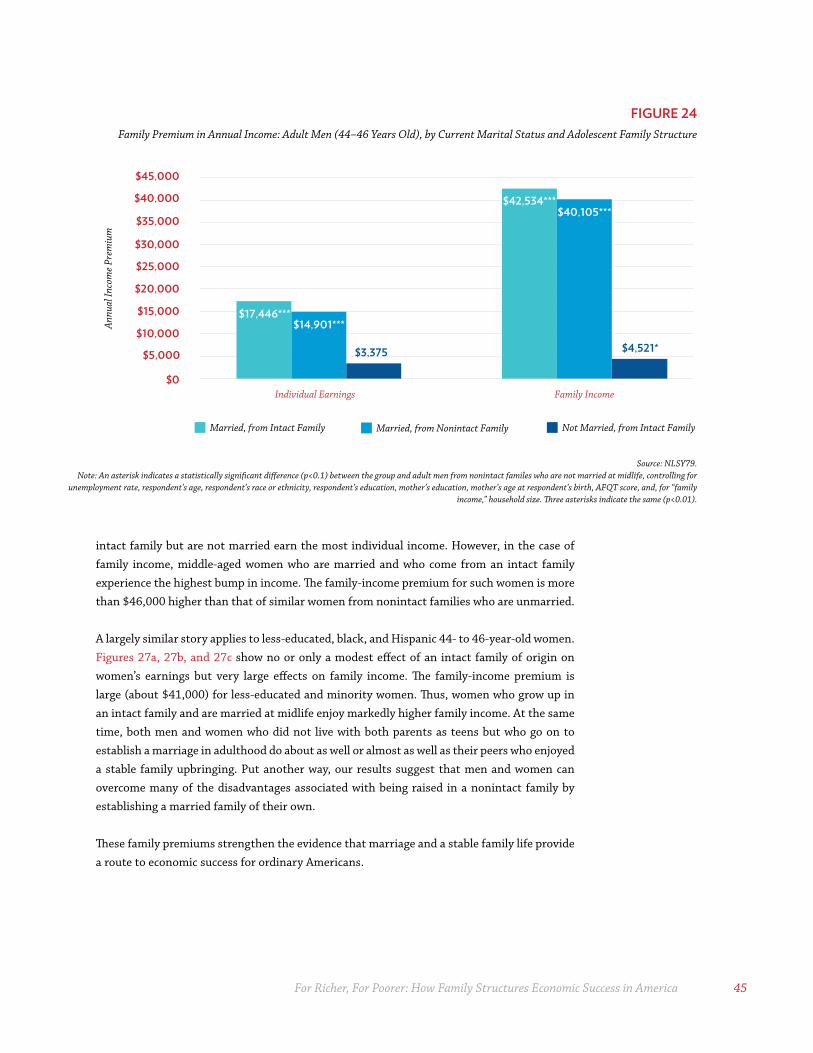
For Richer, For Poorer: How Family Structures Economic Success in America 45
intact family but are not married earn the most individual income. However, in the case of family income, middle-aged women who are married and who come from an intact family experience the highest bump in income. The family-income premium for such women is more than $46,000 higher than that of similar women from nonintact families who are unmarried.
A largely similar story applies to less-educated, black, and Hispanic 44- to 46-year-old women. Figures 27a, 27b, and 27c show no or only a modest effect of an intact family of origin on women’s earnings but very large effects on family income. The family-income premium is large (about $41,000) for less-educated and minority women. Thus, women who grow up in an intact family and are married at midlife enjoy markedly higher family income. At the same time, both men and women who did not live with both parents as teens but who go on to establish a marriage in adulthood do about as well or almost as well as their peers who enjoyed a stable family upbringing. Put another way, our results suggest that men and women can overcome many of the disadvantages associated with being raised in a nonintact family by establishing a married family of their own.
These family premiums strengthen the evidence that marriage and a stable family life provide a route to economic success for ordinary Americans.
FIGURE 24Family Premium in Annual Income: Adult Men (44–46 Years Old), by Current Marital Status and Adolescent Family Structure
Source: NLSY79.Note: An asterisk indicates a statistically significant difference (p<0.1) between the group and adult men from nonintact familes who are not married at midlife, controlling for
unemployment rate, respondent’s age, respondent’s race or ethnicity, respondent’s education, mother’s education, mother’s age at respondent’s birth, AFQT score, and, for “family income,” household size. Three asterisks indicate the same (p<0.01).
$17,446***
$42,534***
$14,901***
$40,105***
$3,375 $4,521*
$0
$5,000
$10,000
$15,000
$20,000
$25,000
$30,000
$35,000
$40,000
$45,000
Individual Earnings Family Income
Annu
al In
com
e Pr
emiu
m
Married, from Intact Family Married, from Nonintact Family Not Married, from Intact Family
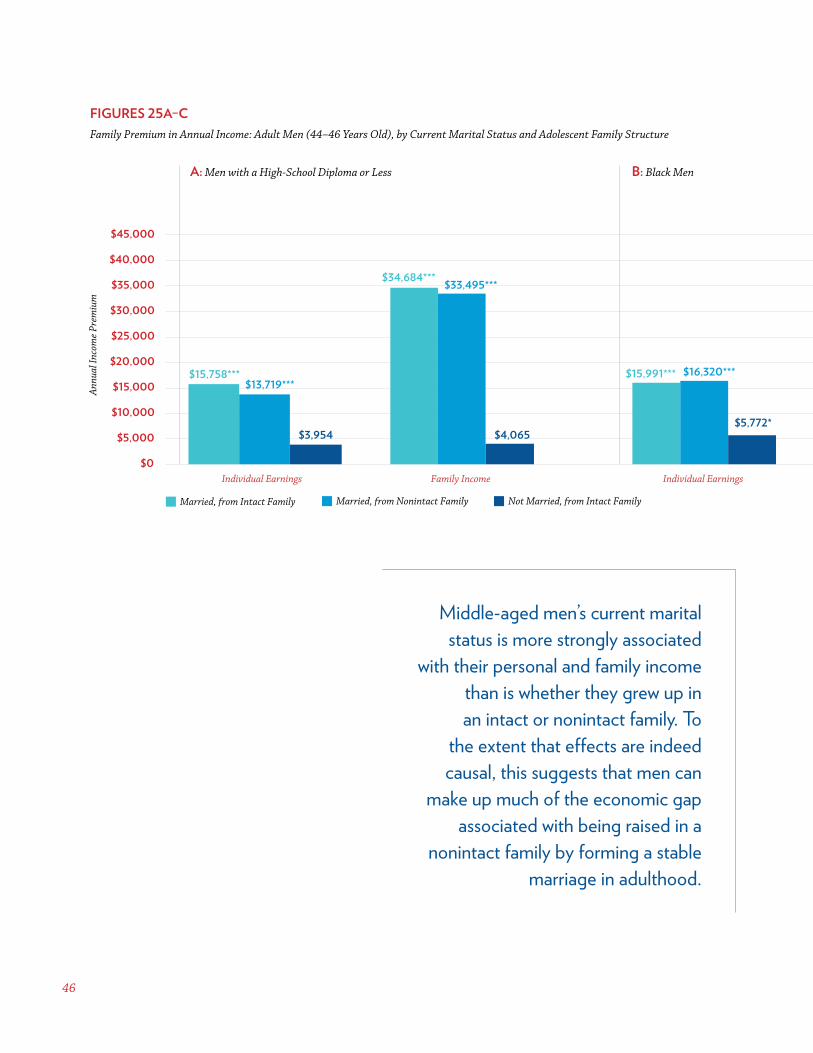
46
FIGURES 25A–CFamily Premium in Annual Income: Adult Men (44–46 Years Old), by Current Marital Status and Adolescent Family Structure
A: Men with a High-School Diploma or Less B: Black Men
$15,758***
$34,684***
$13,719***
$33,495***
$3,954 $4,065
$0
$5,000
$10,000
$15,000
$20,000
$25,000
$30,000
$35,000
$40,000
$45,000
Individual Earnings Family Income Individual Earnings Family Income
Individual Earnings Family Income
Annu
al In
com
e Pr
emiu
m
Married, from Intact Family Married, from Nonintact Family Not Married, from Intact Family
$15,991***
$40,328***
$16,320***
$39,136***
$5,772* $7,272*
$17,662***
$36,320***
$8,423
$28,453***
-$938.6 -$290.3
Middle-aged men’s current marital status is more strongly associated
with their personal and family income than is whether they grew up in an intact or nonintact family. To
the extent that effects are indeed causal, this suggests that men can
make up much of the economic gap associated with being raised in a
nonintact family by forming a stable marriage in adulthood.
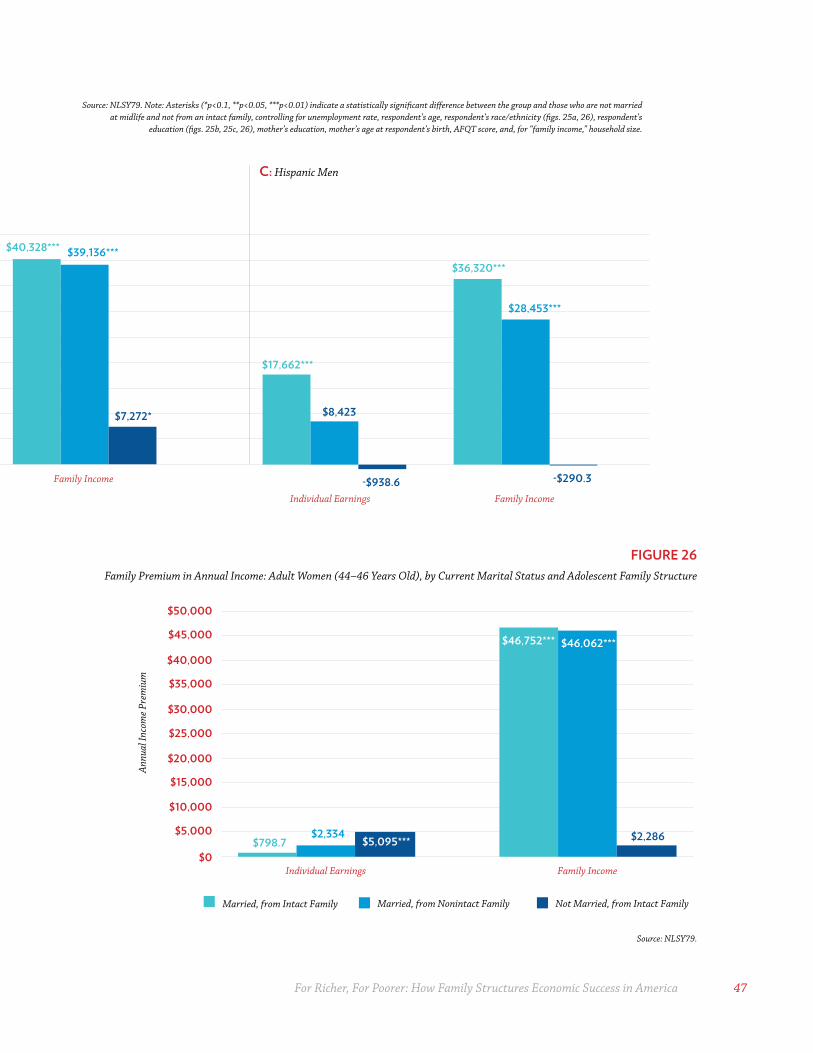
For Richer, For Poorer: How Family Structures Economic Success in America 47
$15,758***
$34,684***
$13,719***
$33,495***
$3,954 $4,065
$0
$5,000
$10,000
$15,000
$20,000
$25,000
$30,000
$35,000
$40,000
$45,000
Individual Earnings Family Income Individual Earnings Family Income
Individual Earnings Family Income
Annu
al In
com
e Pr
emiu
m
Married, from Intact Family Married, from Nonintact Family Not Married, from Intact Family
$15,991***
$40,328***
$16,320***
$39,136***
$5,772* $7,272*
$17,662***
$36,320***
$8,423
$28,453***
-$938.6 -$290.3
Source: NLSY79. Note: Asterisks (*p<0.1, **p<0.05, ***p<0.01) indicate a statistically significant difference between the group and those who are not married at midlife and not from an intact family, controlling for unemployment rate, respondent’s age, respondent’s race/ethnicity (figs. 25a, 26), respondent’s
education (figs. 25b, 25c, 26), mother’s education, mother’s age at respondent’s birth, AFQT score, and, for “family income,” household size.
FIGURE 26Family Premium in Annual Income: Adult Women (44–46 Years Old), by Current Marital Status and Adolescent Family Structure
Source: NLSY79.
$798.7
$46,752***
$2,334
$46,062***
$5,095*** $2,286
$0
$5,000
$10,000
$15,000
$20,000
$25,000
$30,000
$35,000
$40,000
$45,000
$50,000
Annu
al In
com
e Pr
emiu
m
Married, from Intact Family Married, from Nonintact Family Not Married, from Intact Family
Individual Earnings Family Income
C: Hispanic Men
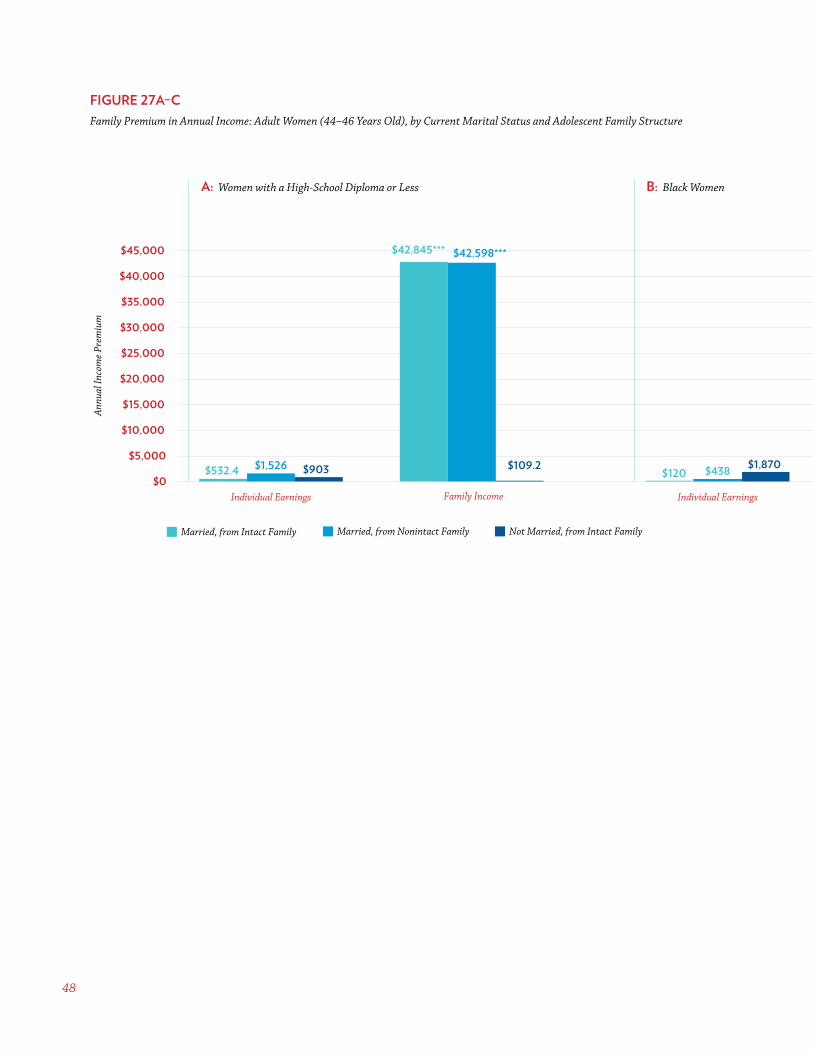
48
FIGURE 27A–CFamily Premium in Annual Income: Adult Women (44–46 Years Old), by Current Marital Status and Adolescent Family Structure
$532.4
$42,845***
$1,526
$42,598***
$903 $109.2 $0
$5,000
$10,000
$15,000
$20,000
$25,000
$30,000
$35,000
$40,000
$45,000
Annu
al In
com
e Pr
emiu
m
Individual Earnings Family Income Individual Earnings Family Income Individual Earnings Family Income
Married, from Intact Family Married, from Nonintact Family Not Married, from Intact Family
$120
$41,140***
$438
$37,251***
$1,870 $1,111 $1,924
$41,227***
$4,411
$43,207***
$7,814**
$1,190
A: Women with a High-School Diploma or Less B: Black Women
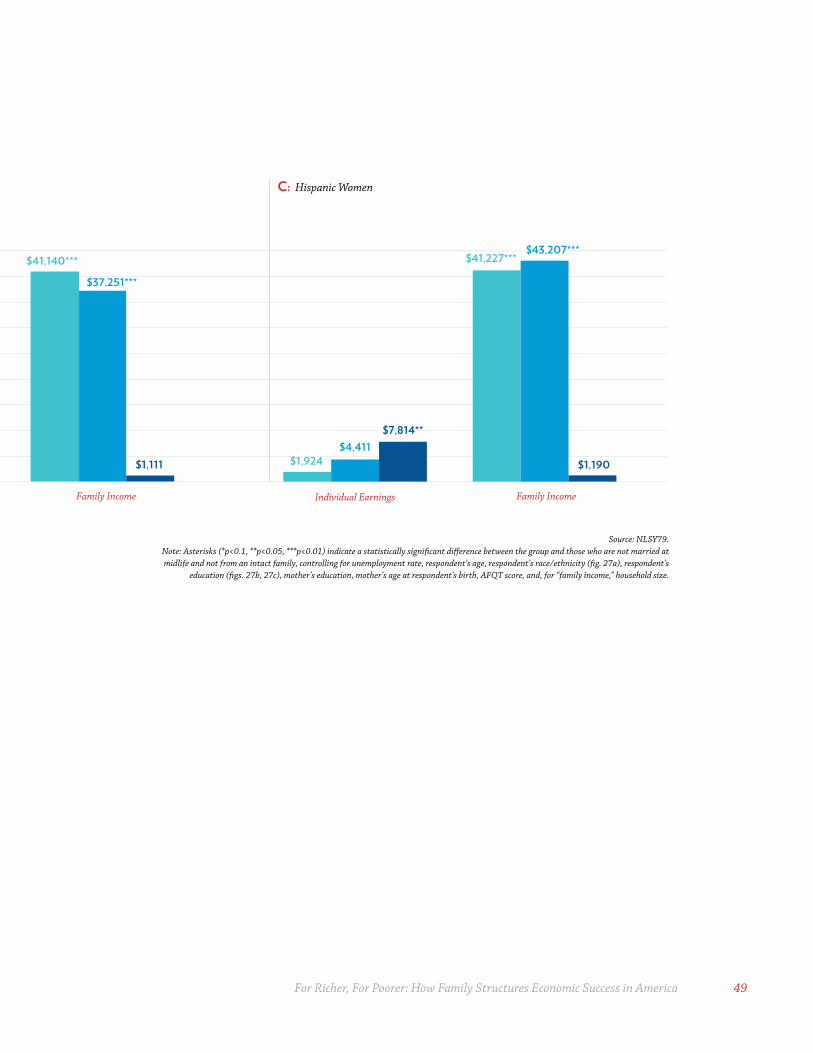
For Richer, For Poorer: How Family Structures Economic Success in America 49
$532.4
$42,845***
$1,526
$42,598***
$903 $109.2 $0
$5,000
$10,000
$15,000
$20,000
$25,000
$30,000
$35,000
$40,000
$45,000
Annu
al In
com
e Pr
emiu
m
Individual Earnings Family Income Individual Earnings Family Income Individual Earnings Family Income
Married, from Intact Family Married, from Nonintact Family Not Married, from Intact Family
$120
$41,140***
$438
$37,251***
$1,870 $1,111 $1,924
$41,227***
$4,411
$43,207***
$7,814**
$1,190
Source: NLSY79.Note: Asterisks (*p<0.1, **p<0.05, ***p<0.01) indicate a statistically significant difference between the group and those who are not married at midlife and not from an intact family, controlling for unemployment rate, respondent’s age, respondent’s race/ethnicity (fig. 27a), respondent’s
education (figs. 27b, 27c), mother’s education, mother’s age at respondent’s birth, AFQT score, and, for “family income,” household size.
C: Hispanic Women
50
PART 5
Toward More Perfect Unions:Four Policy IdeasAnyone concerned about family inequality, men’s declining labor-force participation, and the vitality of the American dream should worry about the nation’s retreat from marriage. This report documents five key sets of facts about the links between family and economics in America.
1- Growing up with both parents (in an intact family) is strongly associated with more education, more work, and more income among today’s young men and women.
2- Men obtain a substantial marriage premium in their individual income, women incur no marriage penalty, and both men and women enjoy substantially higher family incomes than peers with otherwise similar characteristics.
3- The trends reinforce each other. Growing up with both parents increases your odds of becoming highly educated, which in turn leads to higher odds of being married as an adult. Both the added education and marriage result in higher income levels. Indeed, men and women who were raised with both parents present and then go on to marry enjoy an especially high income as adults.
4- The advantages of growing up in an intact family and being married extend across the population. They apply about as much to blacks and Hispanics as they do to whites. They also apply to men and women who are less educated.
5- The retreat from marriage—a retreat that has been concentrated among lower-income Americans—plays a key role in the changing economic fortunes of ordinary American families.
Indeed, the retreat from marriage, which is concentrated among Americans without college degrees, is generating income deficits for individuals and families, family-income inequality, diminished labor-force engagement for men, and reduced economic mobility over the life course. So, the retreat from marriage is leaving working-class and poor Americans doubly disadvantaged; now they have fewer educational and family resources to rely on as they make their way in an increasingly competitive and insecure market economy.
In our view, the retreat from marriage is rooted in part in economic changes that have undercut the marriageability of less-educated men. But we follow economist Isabel Sawhill, the codirector of the Brookings Center on Children and Families, in stressing that economics cannot explain the retreat from marriage on its own: “A purely economic theory falls short as an explanation of the dramatic transformation of family life in the U.S. in recent decades. Social norms, women’s changing roles, and sexual liberation have to be factored into the
The retreat from marriage is leaving
working-class and poor Americans doubly
disadvantaged; now they have fewer educational
and family resources to rely on as they
make their way into an increasingly competitive
market economy.
For Richer, For Poorer: How Family Structures Economic Success in America 51
equation.”41 In addition to these cultural factors, legal and policy changes that have penalized or diminished the value of marriage have also played a role in diminishing marriage’s role as the anchor of American family life.42 Taken together, these trends have had a disparate impact on patterns of family formation and stability among working-class and poor Americans.
In light of the varied factors behind the nation’s retreat from marriage, no panacea exists that can singlehandedly strengthen marriage and bridge the growing class divide in American life. The first step toward this end is recognizing the central importance of family in explaining trends in the labor market and in the stagnancy and inequality of income. Making family patterns a central topic could itself alter the narratives that affect individual and policy decisions and thus limit the damage. Ideally, new policy options would also emerge. Governments, nonprofits, families, employers, and individuals should be open to ways of altering family trajectories away from unwed and single parenthood. Several policy ideas are worth pursuing to strengthen marriage and stabilize family life in working-class and poor families in America.
“First, do no harm” when it comes to marriage.Federal and state policies should refrain from harming or disadvantaging marriage. Although the marriage incentives embedded in the nation’s tax and transfer policies are complex, too many impose financial penalties on marriage. These penalties are particularly worrisome for their effects on marriage among low-income individuals; marriage is already weaker in their communities, and a spouse’s contribution to family income would likely be no greater than the government benefits they are eligible to receive as individuals, creating little economic incentive to marry.43
Today, according to the Urban Institute and Brookings Institution’s “Marriage Bonus and Penalty Tax Calculator,” government benefit programs add much more to the income of single parents than does a potential spouse working full-time at $11.00 per hour.44 Indeed, economists Adam Carasso and C. Eugene Steuerle have written, “Most transfer programs for low-income families with children contain mainly marriage penalties—the additional income introduced by a spouse generally reduces or even ends benefits received before the marriage.”45
41. Isabel V. Sawhill, “The Economics of Marriage, and Family Breakdown,” Brookings Institution, July 15, 2014, www.brookings.edu/research/opinions/2014/07/15-economics-of-marriage-family-breakdown-sawhill.
42. Amy C. Butler, “Welfare, Premarital Childbearing, and the Role of Normative Climate: 1968–1994,” Journal of Marriage and Family 64 (2002): 295–313; Irwin Garfinkel et al., “The Roles of Child Support Enforcement and Welfare in Nonmarital Childbearing,” Center for Research on Child Wellbeing Working Paper #00-06 (Princeton, NJ: Center for Research on Child Wellbeing, 2000); Shelly Lundberg and Robert Plotnick, “Adolescent Premarital Childbearing: Do Economic Incentives Matter?” Journal of Labor Economics 13 (1995): 177–200; W. Bradford Wilcox, “The Evolution of Divorce,” National Affairs 1 (Fall 2009), nationalaffairs.com/publications/detail/the-evolution-of-divorce.
43. Adam Carasso and C. Eugene Steuerle, “The Hefty Penalty on Marriage Facing Many Households with Children,” Future of Children 15, no. 2 (2005): 157–175.
44. Tax Policy Center (Urban Institute and Brookings Institution), “Marriage Bonus and Penalty Tax Calculator,” http://taxpolicycenter.org/taxfacts/marriagepenaltycalculator.cfm.
45. Carasso and Steuerle, “The Hefty Penalty on Marriage Facing Many Households with Children,” 159.
Federal and state policies should refrain from harming or disadvantaging marriage.
52
To avoid limiting the gains from marriage, government transfer programs could use separate schedules for married couples and single individuals. Already, the tax system uses two separate schedules, as does the earned income tax credit. To minimize the cost of providing a more generous schedule for married couples, the shift could be limited to the first three years of married life. Thereafter, many couples would see the economic benefits of marriage (documented in this report) offsetting any marriage penalties they faced in transfer programs. We strongly urge policymakers to lower marriage penalties associated with public policies targeting low-income families, especially in the first years of married life.
Strengthen the economic foundations of family life.Given declines in less-educated men’s labor-force participation and relatively stagnant growth in family income, public policy should seek to draw more men into the workforce and boost the economic fortunes of families.
Here, two strategies seem particularly promising. First, the earned income tax credit should be expanded for men who do not have children to as much as $1,000.46 This would increase their incentive to work and, hopefully, their employment rates. Increased work would also boost their income and their marriageability. Second, the child tax credit should be expanded from $1,000 to $3,000 and be extended to income and payroll taxes.47 This measure would provide working families with more take-home pay that they could dedicate to the considerable costs of rearing children—from child care to tutoring. It would also stabilize the economic foundations of middle- and lower-income families.
Expand apprenticeship and other vocational-education programs.Federal and state education policies devote a disproportionate amount of attention and money to college, given that only about 35 percent of American young adults get a bachelor’s degree. However, young men who do not have a college degree face the highest rates of unemployment and underemployment, which limits their marriageability.
Expanding vocational education and apprenticeship can play a key role in providing young adults with skills, confidence, and opportunities that will boost their employability and income. Vocational programs like Career Academies have been shown to boost the work hours, income, and marriage rates of young men from low-income families.48 Apprenticeship programs help young people gain mastery in an occupation as well as other workplace skills and supply employers with workers who achieve strong technical and employability levels.
46. Richard V. Reeves and Joanna Venator, “Are Obama and Ryan Proposals for an EITC Expansion Pro- or Anti-Mobility?” Social Mobility Memos (August 1, 2014), Brookings Institution, www.brookings.edu/blogs/social-mobility-memos/posts/2014/08/01-ryan-poverty-plan-eitc-reeves.
47. Robert Stein, “Taxes and the Family,” National Affairs 2 (Winter 2010), www.nationalaffairs.com/publications/detail/taxes-and-the-family.
48. James J. Kemple, “Career Academies: Long-Term Impacts on Work, Education, and Transitions to Adulthood,” MDRC, June 2008, www.mdrc.org/sites/default/files/full_50.pdf.

For Richer, For Poorer: How Family Structures Economic Success in America 53
54
Successful youth apprenticeship programs in South Carolina, Georgia, and Wisconsin indicate that such programs can substantially boost young adults’ work and income. And because these programs are cheaper than college, they could be scaled up dramatically. For about one-quarter of what the federal government is spending on the Pell Grant program ($8 billion), the government could stimulate a far more cost-effective system that would create four million apprenticeships and reach about one in three members of each age cohort. Completing apprenticeships is likely to help many young people mature and gain a sense of occupational pride and identity. In addition, it will greatly improve career prospects of young men and women, which, along with other initiatives, could begin to reverse the nation’s turn away from marriage and point the way to reduced inequality and increased economic mobility.49
Launch a national campaign on behalf of the “success sequence.”
The challenges facing marriage in America are not just economic or educational; they are also cultural and civic. The nation is not likely to strengthen and stabilize marriage and family life until the culture shifts in a more marriage-friendly direction and civic institutions provide more support to families. In our view, such efforts to strengthen marriage and family life should be directed primarily by private institutions—civic organizations, religious groups, businesses, and other organizations—that have the flexibility and freedom to offer creative strategies that speak to the behavioral and cultural issues playing a role in undercutting strong and stable families. Government might help fund some of these initiatives but should not direct cultural and civic initiatives focusing on family life.
One strategy would be to launch a national campaign on behalf of what Isabel Sawhill and Ron Haskins of the Brookings Institution call the “success sequence.”50 They are referring to the idea that adults who finish their education, get a job, get married, and then have children—in that order—are markedly less likely to be poor and much more likely to enjoy a middle-class income. Furthermore, adults who follow this sequence are also more likely to enjoy a stable and happy family life.51 Today, of course, almost half of first-time mothers (48 percent) in America do not follow this sequence; they put motherhood before marriage. A national campaign would encourage adolescents and young adults to follow the success sequence, for both their own welfare and the future welfare of their children.
Such a campaign could take as its model the National Campaign to Prevent Teen and Unplanned Pregnancy, which has probably played a key role in bringing down the teen pregnancy rate in the United States by more than 50 percent since 1990. Successful campaigns against drunk driving and smoking also suggest the power that a campaign like this could have in
49. Robert I. Lerman, “Expanding Apprenticeship Opportunities in the United States,” in Policies to Address Poverty in the United States, ed. Melissa Kearney and Benjamin Harris (Washington, DC: Brookings Institution, 2014).
50. Ron Haskins and Isabel Sawhill, Creating an Opportunity Society (Washington, DC: Brookings Institution, 2009).
51. Galena K. Rhoades and Scott M. Stanley, Before “I Do”: What Do Premarital Experiences Have to Do with Marital Quality among Today’s Young Adults? (Charlottesville, VA: National Marriage Project, 2014).
For Richer, For Poorer: How Family Structures Economic Success in America 55
steering social behavior in a more constructive direction. To succeed, a campaign to encourage adolescents and young adults to follow the success sequence would require a diverse coalition of civic organizations, businesses, schools, religious organizations, and popular-culture leaders to steer family behavior in a better direction.
We also favor further experimentation with teaching relationship skills in high schools and with providing classes and information about marriage to couples with children. Although experiments testing programs to teach marriage-related skills to low-income adults have yielded largely disappointing results, alternatives should be explored with respect to what is taught, where it is taught, and the timing of the instruction (for example, early or late in high school). In today’s polarized world, this will be a challenge, but it is one that ought to be surmounted on behalf of the next generation. The issues are too important to give up on approaches that might bear fruit.
These four policy ideas are emblematic of the kind of multipronged effort—focusing on economic, educational, and cultural strategies and bringing together a range of public and private actors—that has a chance of renewing marriage in the twenty-first century. Some will doubt the feasibility of such an effort, or its moral legitimacy. But the alternative to seeking strategies like these is to accept a country where college-educated Americans enjoy stable and strong families; everyone else faces increasingly unstable and fragile families; and high rates of economic inequality, male joblessness, and economic immobility are locked in by a marriage divide that puts working-class and poor Americans at a major family disadvantage. This unequal family alternative falls far short of the American dream and is reason enough to renew and repair the ties that bind.

ABOUT THE AUTHORS
Robert I. Lerman (MIT, PhD) is a professor of economics at American University, an institute fellow at the
Urban Institute, and a research fellow at the Institute for the Study of Labor (IZA) in Bonn, Germany. He
has published widely on economic and social-policy issues and was one of the first scholars to examine unwed
fatherhood and to propose a youth apprenticeship strategy in the United States.
W. Bradford Wilcox (Princeton University, PhD) is a senior fellow at the Institute for Family Studies, a
visiting scholar at the American Enterprise Institute, and the director of the National Marriage Project
at the University of Virginia. Wilcox has published widely on marriage, cohabitation, fatherhood, and the
welfare of children.
ACKNOWLEDGEMENTS
This report benefited from the programmatic leadership of Richard Brake and Brad Wassink, the editorial
assistance of Betsy Stokes, and the design work of Brad Uhl and Brandon Wooten at ID Company. We also
thank Irwin Garfinkel, Shoshana Grossbard, Steven Martin, Joseph Price, Isabel Sawhill, and Joanna Venator
for their substantive and methodological counsel regarding this report. Needless to say, they do not necessarily
agree with our conclusions and any errors are our own.