foot traffic report€¦ · *analysis of nearly 61,000 stations near interstates in q3, stations...
TRANSCRIPT

FOOT TRAFFIC REPORT& SUMMER DRIVING TRENDSfor the fuel & convenience store industry
Q3 2017
Between July 1 and September 30, GasBuddy and Cuebiq examined 33.4 million consumer trips to the pumps and convenience stores. This quarter saw some shifts in consumer behavior, with the summer season leading to road trips and frequent driving.
Summer Was a Time to Shop and TravelThe first three weeks of July were the most highly-trafficked, and the final week of September was the least. From Q2 to Q3, the top categories for uplift in foot traffic were 1) Leisure - 59%, 2) Gas Stations - 56%, and 3) Economy Hotels - 51%.
Good Restrooms are Good for BusinessWith drivers taking to the roads for summer trips, there was a strong correlation between restroom quality and foot traffic. Stations near interstates with above-average ratings on GasBuddy saw a 33% increase in foot traffic over those with below-average ratings.
Meijer Captures the Top SpotPreviously ranked second during Q2 2017 for the highest ratio of footfall per station, Meijer takes the top spot for Q3—with more than 4 times the industry average. The previous winner, Ricker’s, moves into a close second place.
The Highest Volume Retailers in Q3 OPIS tracks fuel transactions at gas stations throughout the United States each week and has compiled the most efficient players in the third quarter. The efficiency rankings are calculated by dividing market share by outlet share. A higher number indicates higher per store volumes. Brands that were at the top of the OPIS efficiency scorecard also scored high in overall ratings from GasBuddy users.
Less Repeat Visits, More Dwell TimeAs GasBuddy users traveled away from home, the percentage of users who visited stores once a week or more decreased 4.5% during Q3. With stops to get snacks, use restrooms, and refuel, dwell time increased slightly with 70% of users spending more than 5 minutes at a store.
1QUARTERLY FOOT TRAFFIC REPORT
FOOT TRAFFIC REPORT & SUMMERDRIVING TRENDS, Q3 2017
Highlights:

2.5 2.9 3.3 3.7 4.1 4.5
TOP 10
Which fuel brands captured the highest ratio of footfall per station?
Fuel brands with 30 or more locations were measured.
Footfall Ratio = Average footfall per station for brand / Average footfall for industry
Industry average = 1.0
Meijer(192 locations, IL, IN, KY, MI, OH, WI)
4.08
3.88
3.85
3.67
3.62
3.50
3.10
3.03
3.00
2.89
Ricker’s(49 locations measured, Indiana)
Family Express(68 locations, Indiana)
Costco(447 locations, national)
Thorntons(173 locations, FL, IL, IN, KY, OH, TN)
GetGo(198 locations, IN, WV, PA, OH, MD)
Pilot (420 locations, national)
Bell Stores(54 locations, Ohio)
Kroger(961 locations, 17 states)
1
2
3
4
5
6
7
8
9
10
United Dairy Farmers(161 locations, IN, KY, OH)
2QUARTERLY FOOT TRAFFIC REPORT
GasBuddy examined nearly 33.4 million consumer trips to gas stations and c-stores in Q3 2017.
Q2 Q3
4
3
9
2
8
1
6
New
5
7
Meijer captures the number-one spot and Ricker’s moves into second.The loyal GasBuddy customer base brought in more than 4x the industry average footfall per location in Q3.

Midwest
IL
IN
KY
MI
OH
WI
Thorntons
Pilot
Pilot
Meijer
Sheetz
Speedway
BRANDS WITH HIGHEST AVERAGE FOOTFALL, BY STATE
WestMidwest
Central
SoutheastSouth Central
Northeast
Results based on brands with a minimum of 20 stations per state; average footfall = total footfall/number of stations
3QUARTERLY FOOT TRAFFIC REPORT
South Central
AR
LA
NM
OK
TX
Kroger
Race Trac
7-Eleven
7-Eleven
Costco
Southeast
AL
FL
GA
MS
SC
TN
MAPCO
Costco
Pilot
Kroger
QuikTrip
Speedway
Central
CO
IA
KS
MN
MO
MT
ND
NE
SD
WY
King Soopers
Kum & Go
Dillon Stores
Kwik Trip
On The Run
Exxon
Casey’s
Bucky’s
Conoco
Maverik
West
AK
AZ
CA
HI
ID
NV
OR
UT
WA
Holiday
Fry’s
Costco
76
Maverik
Smith’s
Fred Meyer
Smith’s
Costco
CT
DC
DE
MA
MD
ME
NC
NH
NJ
NY
PA
RI
VA
VT
WV
Cumberland Farms
Exxon
Wawa
Speedway
Wawa
Cumberland Farms
Sheetz
Cumberland Farms
QuickChek
Speedway
Wawa
Cumberland Farms
Sheetz
Mobil
Sheetz
Northeast
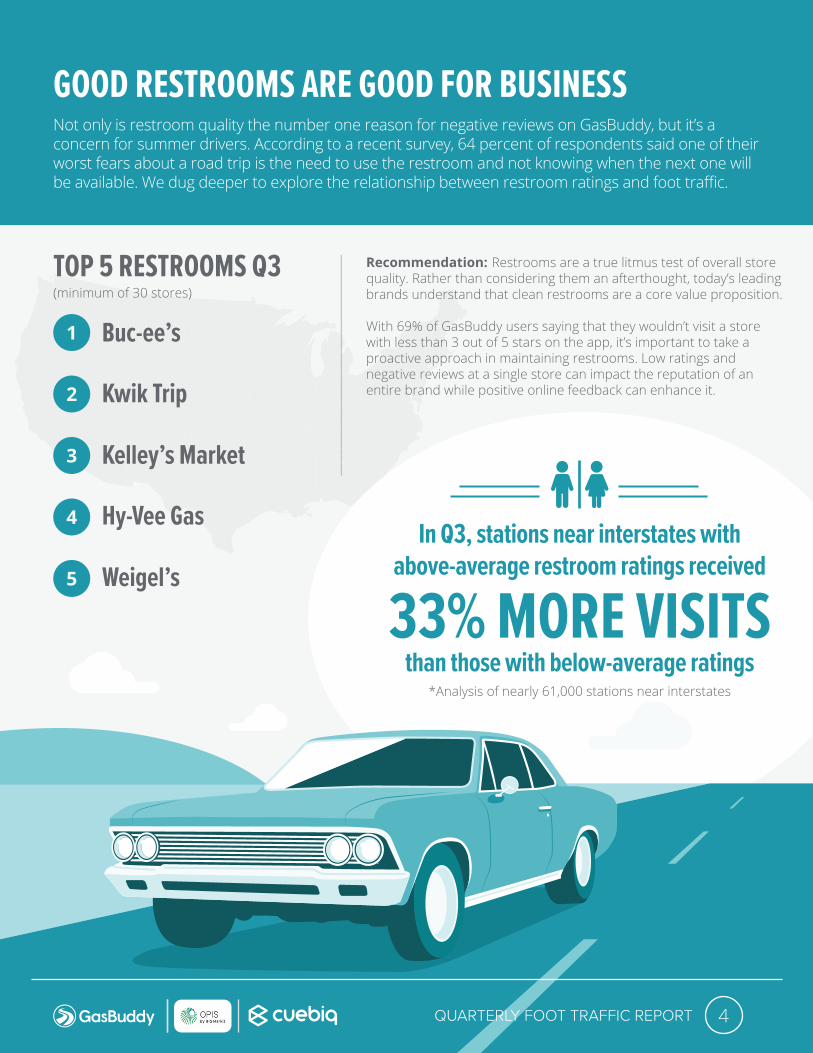
Recommendation: Restrooms are a true litmus test of overall store quality. Rather than considering them an afterthought, today’s leading brands understand that clean restrooms are a core value proposition.
With 69% of GasBuddy users saying that they wouldn’t visit a store with less than 3 out of 5 stars on the app, it’s important to take a proactive approach in maintaining restrooms. Low ratings and negative reviews at a single store can impact the reputation of an entire brand while positive online feedback can enhance it.
Not only is restroom quality the number one reason for negative reviews on GasBuddy, but it’s a concern for summer drivers. According to a recent survey, 64 percent of respondents said one of their worst fears about a road trip is the need to use the restroom and not knowing when the next one will be available. We dug deeper to explore the relationship between restroom ratings and foot traffic.
GOOD RESTROOMS ARE GOOD FOR BUSINESS
TOP 5 RESTROOMS Q3(minimum of 30 stores)
Buc-ee’s1
Kelley’s Market3
Kwik Trip2
Weigel’s5
Hy-Vee Gas4
4QUARTERLY FOOT TRAFFIC REPORT
*Analysis of nearly 61,000 stations near interstates
In Q3, stations near interstates with above-average restroom ratings received
than those with below-average ratings33% MORE VISITS
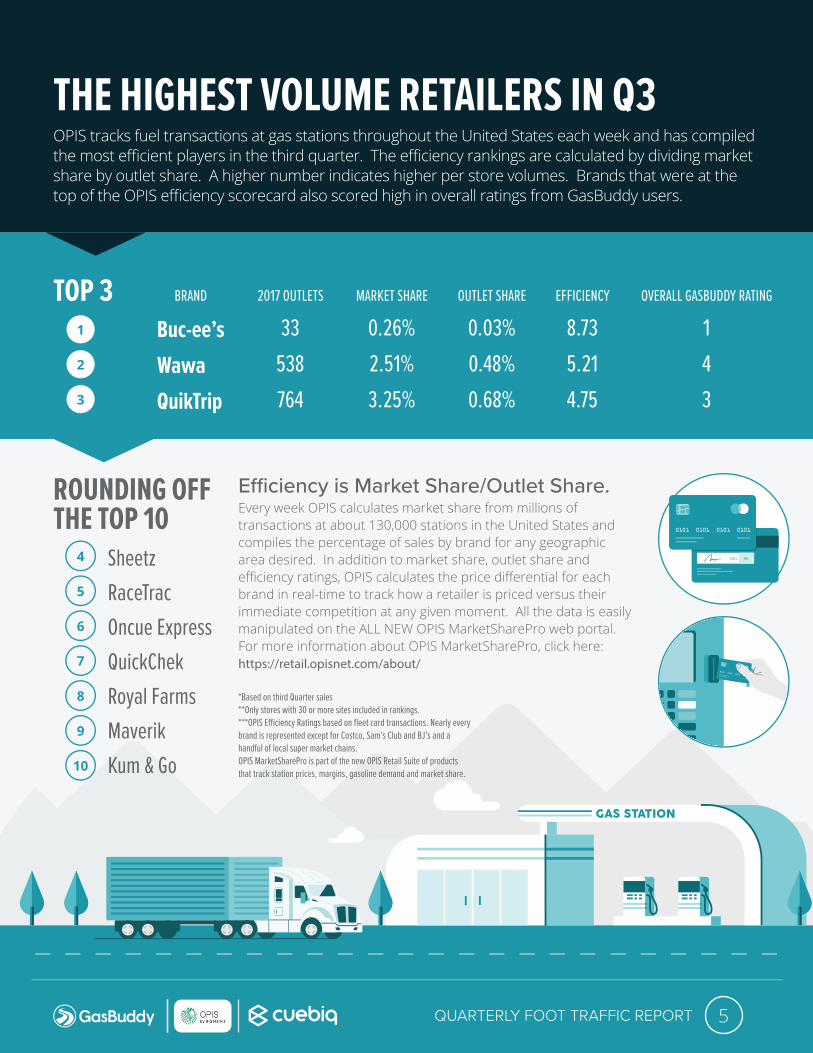
OPIS tracks fuel transactions at gas stations throughout the United States each week and has compiled the most efficient players in the third quarter. The efficiency rankings are calculated by dividing market share by outlet share. A higher number indicates higher per store volumes. Brands that were at the top of the OPIS efficiency scorecard also scored high in overall ratings from GasBuddy users.
THE HIGHEST VOLUME RETAILERS IN Q3
5QUARTERLY FOOT TRAFFIC REPORT
BRAND 2017 OUTLETS MARKET SHARE OUTLET SHARE EFFICIENCY OVERALL GASBUDDY RATING
1
2
3
4
5
6
7
8
9
10
33538764
SheetzRaceTracOncue ExpressQuickChekRoyal FarmsMaverikKum & Go
0.26%2.51%3.25%
Buc-ee’sWawaQuikTrip
0.03%0.48%0.68%
8.735.214.75
143
TOP 3
ROUNDING OFFTHE TOP 10
E�ciency is Market Share/Outlet Share.Every week OPIS calculates market share from millions of transactions at about 130,000 stations in the United States and compiles the percentage of sales by brand for any geographic area desired. In addition to market share, outlet share and efficiency ratings, OPIS calculates the price differential for each brand in real-time to track how a retailer is priced versus their immediate competition at any given moment. All the data is easily manipulated on the ALL NEW OPIS MarketSharePro web portal. For more information about OPIS MarketSharePro, click here:https://retail.opisnet.com/about/
*Based on third Quarter sales**Only stores with 30 or more sites included in rankings.***OPIS E�ciency Ratings based on fleet card transactions. Nearly every brand is represented except for Costco, Sam’s Club and BJ’s and a handful of local super market chains. OPIS MarketSharePro is part of the new OPIS Retail Suite of products that track station prices, margins, gasoline demand and market share.
6QUARTERLY FOOT TRAFFIC REPORT
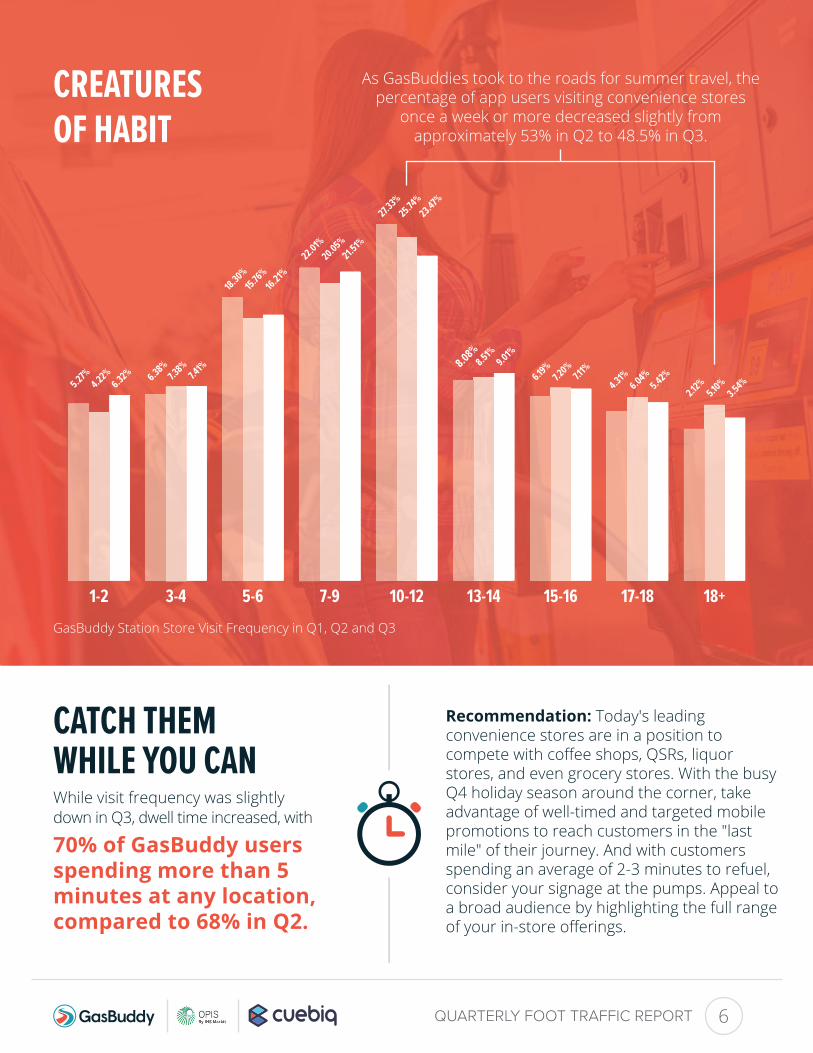
As GasBuddies took to the roads for summer travel, the percentage of app users visiting convenience stores
once a week or more decreased slightly from approximately 53% in Q2 to 48.5% in Q3.
CREATURESOF HABIT
While visit frequency was slightlydown in Q3, dwell time increased, with
70% of GasBuddy users spending more than 5 minutes at any location, compared to 68% in Q2.
Recommendation: Today's leading convenience stores are in a position to compete with coffee shops, QSRs, liquor stores, and even grocery stores. With the busy Q4 holiday season around the corner, take advantage of well-timed and targeted mobile promotions to reach customers in the "last mile" of their journey. And with customers spending an average of 2-3 minutes to refuel, consider your signage at the pumps. Appeal to a broad audience by highlighting the full range of your in-store offerings.
CATCH THEMWHILE YOU CAN
18+17-1815-1613-1410-127-95-63-41-2GasBuddy Station Store Visit Frequency in Q1, Q2 and Q3
2.12%4.31%6.19%8.08%
27.33%
22.01%
18.30%
6.38%
5.27%
5.10%3.54%6.04%
5.42%7.20%
7.11%8.51%9.01%
25.74%23.47%
20.05%21.51%
15.76%16.21%
7.38%
7.41%
4.22%6.32%
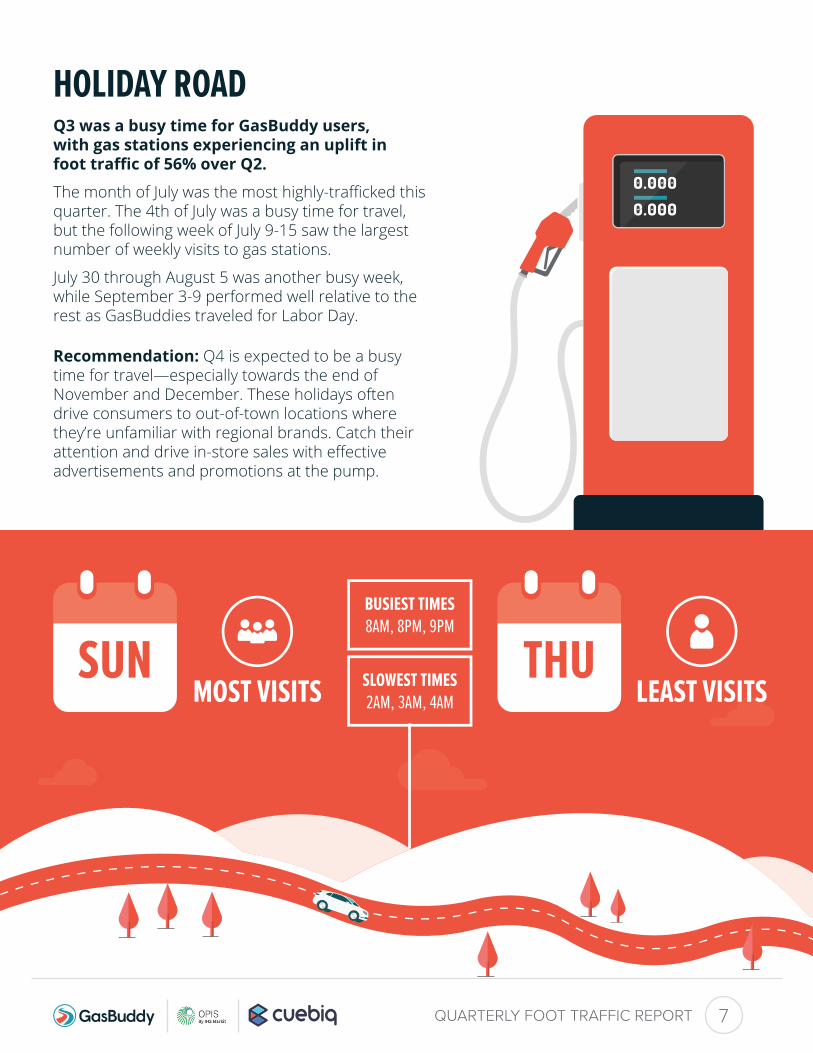
HOLIDAY ROADQ3 was a busy time for GasBuddy users,with gas stations experiencing an uplift infoot traffic of 56% over Q2.
The month of July was the most highly-trafficked this quarter. The 4th of July was a busy time for travel, but the following week of July 9-15 saw the largest number of weekly visits to gas stations.
July 30 through August 5 was another busy week, while September 3-9 performed well relative to the rest as GasBuddies traveled for Labor Day.
Recommendation: Q4 is expected to be a busy time for travel—especially towards the end of November and December. These holidays often drive consumers to out-of-town locations where they’re unfamiliar with regional brands. Catch their attention and drive in-store sales with effective advertisements and promotions at the pump.
MOST VISITSSUN THU
LEAST VISITS
7QUARTERLY FOOT TRAFFIC REPORT
LEAST VISITS
BUSIEST TIMES8AM, 8PM, 9PM
SLOWEST TIMES2AM, 3AM, 4AM

OUR SUMMER IN REVIEWGasBuddy users took to the road during Q3 2017 for a summer of shopping, vacations,
road trips, and holiday travel. Let’s take a closer look at our habits and preferences.
8QUARTERLY FOOT TRAFFIC REPORT
Most-Visited Big Box StoresWalmart Costco Big Lots
Most-Visited QSRsMcDonald’s Subway Taco Bell
Most-Visited Co�ee ShopsStarbucks Dunkin’ Donuts Tim Horton’s
Most-Visited Auto Repair RetailersAutozone Advance Auto Parts Ji�y Lube
GasBuddy users took to the roads and traveled this summer. These categories
saw the largest uplift in foot traffic.(shows % uplift from Q2 to Q3)
Summer Travel Season
Leisure
58.81%
Gas Stations
55.76%
Economy Hotels
51.34%
Other Top Performers
Auto Parts
41.25%QSRs
36.35%
Malls/Shopping Centers
48.46%Midscale Hotels
46.08%
Auto Dealers
29.77%Movie Theaters
26.31%
Insurance
35.99%Co�ee
32.11%
(shows % uplift from Q2 to Q3)
9QUARTERLY FOOT TRAFFIC REPORT
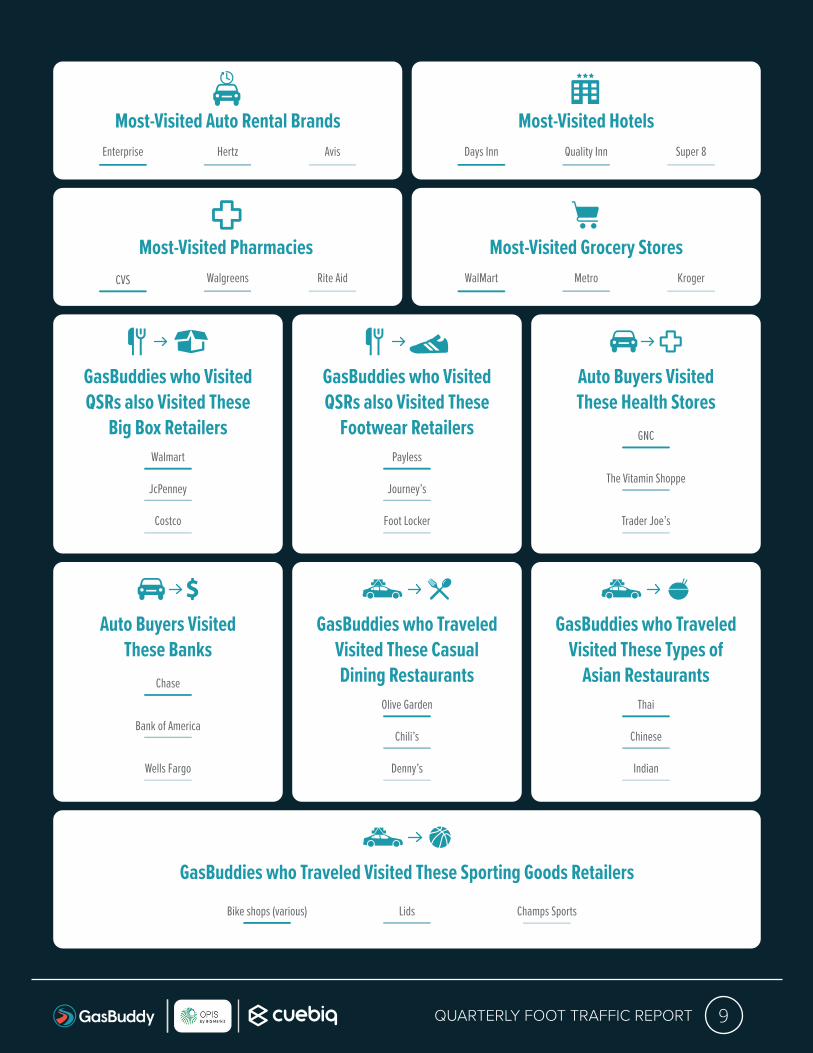
Most-Visited Auto Rental BrandsEnterprise Hertz Avis
Most-Visited HotelsDays Inn Quality Inn Super 8
Most-Visited Grocery StoresWalMart Metro Kroger
Most-Visited Pharmacies CVS Walgreens Rite Aid
GasBuddies who Traveled Visited These Sporting Goods Retailers
Bike shops (various) Lids Champs Sports
GasBuddies who VisitedQSRs also Visited These
Big Box RetailersWalmart
JcPenney
Costco
GasBuddies who VisitedQSRs also Visited These
Footwear RetailersPayless
Journey’s
Foot Locker
Auto Buyers VisitedThese Health Stores
GNC
The Vitamin Shoppe
Trader Joe’s
Auto Buyers VisitedThese Banks
GasBuddies who TraveledVisited These CasualDining Restaurants
Olive Garden
Chili’s
Denny’s
GasBuddies who TraveledVisited These Types of
Asian RestaurantsChase
Bank of America
Wells Fargo
Thai
Chinese
Indian

10QUARTERLY FOOT TRAFFIC REPORT
Visits to Starbucksduring Labor Day Weekend
Visits to McDonald’sduring Labor Day Weekend
Visits to WalMartduring Labor Day Weekend
118,228122,351 75,022
These QSRs saw the largest increases in foot traffic during
the 4th of July weekend.(shows % uplift during 4th of July
Weekend compared to prior weekend)
Quick and Delicious
Krystal | 35.22%Bojangles | 33.11%
Cici’s Pizza | 32.71%
These apparel retailers saw the largest increases in foot traffic during the 4th of July weekend.
(shows % uplift during 4th of JulyWeekend compared to prior weekend)
Looking Good for the 4thThese outdoor retailers saw the largest increases in foot traffic during the 4th of July weekend.
(shows % uplift during 4th of JulyWeekend compared to prior weekend)
The Great Outdoors
Tommy Hilfiger | 44.46%BonWorth | 43.87%
OshKosh B’gosh | 43.59%
Columbia | 38.77%REI | 34.68%
Eddie Bauer | 30.44%
Compared to previous weekends, some categories received large uplifts in foot traffic during the 4th of July weekend but experienced decreases during the Labor Day weekend.
(shows % change during holiday weekend compared to prior weekend)
Trading Places
Financial Services
-41%Insurance
-42.33%Auto Dealers
-26.17%
Labor Day Weekend
Financial Services
42.52%Insurance
38.02%Auto Dealers
27.14%
4th of July Weekend

About GasBuddyGasBuddy is a smartphone app connecting drivers with their Perfect Pit Stop™. With nearly 70 million downloads, GasBuddy is the leader in crowdsourced information to help drivers find the best gas prices, closest stations, friendliest service, cleanest restrooms, tastiest coffee and much more. GasBuddy is the leading source for the most accurate, real-time fuel prices at more than 140,000 gas stations in the U.S, Canada and Australia. The Company’s B2B Retailer Software-as-a-Service (SaaS), known as GasBuddy Business Pages, provide Fuel Marketers and Retailers their best opportunity to maintain their station information, manage their brand, and promote to their target consumer audience.
About CuebiqCuebiq is a next generation location intelligence company, leveraging the largest database of accurate and precise location data in the U.S. Its leading data intelligence platform analyzes location patterns of 61 million monthly active U.S. smartphone users on over 180 mobile apps and 2 in 5 smartphones globally, allowing businesses to glean actionable insights about real-world consumer behaviors and trends. Cuebiq provides clients geo-behavioral audiences for cross-platform ad targeting, the industry's only SaaS based real-time campaign optimization and footfall attribution tools, and offline location analytics. Cuebiq does not collect any personally identifiable information. Its privacy-sensitive methodology has earned the company membership status with the Network Advertising Initiative (NAI), the leading self-regulatory industry association dedicated to responsible data collection and its use for digital advertising. Cuebiq is headquartered in New York with offices in San Francisco, Chicago, Italy and China.
About OPISOPIS, an IHS Markit (Nasdaq: INFO) company, is one of the world's most comprehensive sources for petroleum, LPG/NGL, jet fuel and biofuels pricing and news information—with offices in the U.S., Europe and Singapore—and is the most widely accepted U.S. fuel price benchmark for supply contracts and competitive positioning.
MethodologyFrom July 1 to Septmber 30, 2017, GasBuddy and Cuebiq analyzed location visit data at more than 100 fuel and convenience store brands across the United States to understand foot traffic trends, provide geo-behavioral and consumer insights and identify the impact of key factors such as ratings and reviews on POI visits. To be considered a “visit,” a user must be within 30 meters of a fuel pump for between 2 and 15 minutes.
11QUARTERLY FOOT TRAFFIC REPORT