food security vs. food self- sufficiency: the case of … security vs. food self-sufficiency: the...
TRANSCRIPT
Food Security vs. Food Self-Sufficiency: The Case of the Philippine Goal of Self-Sufficient Rice Production Justin D. McKinley, Dr. Lanier Nalley, and Nate B. Lyman
Department of Agricultural Economics and Agribusiness University of Arkansas Presentation prepared for the 2013 WAEA meetings in Monterey, CA, June 26-28th
Outline
• Introduction – Current Situation – Why the Philippines imports Rice
• Stated Objective and Projection of the Philippines Food Self-Sufficiency Program (FSSP)
• Definition of Model • Results of Model • Conclusion
Introduction
• Importance of rice in the Philippines: – Staple food of the Philippines – Politically sensitive commodity – Supply disruption causes people distress – Philippines consumes about 33,000 tons of rice daily – Approximately 80% of the total population spends
almost 1/4 of their income on rice alone. – Slight increase in the price of this commodity will greatly
affect the standard of living for most Filipinos.
http://ateneoeconomics.wordpress.com/2008/05/31/analyzing-rice-crisis-in-the-philippines/
Introduction
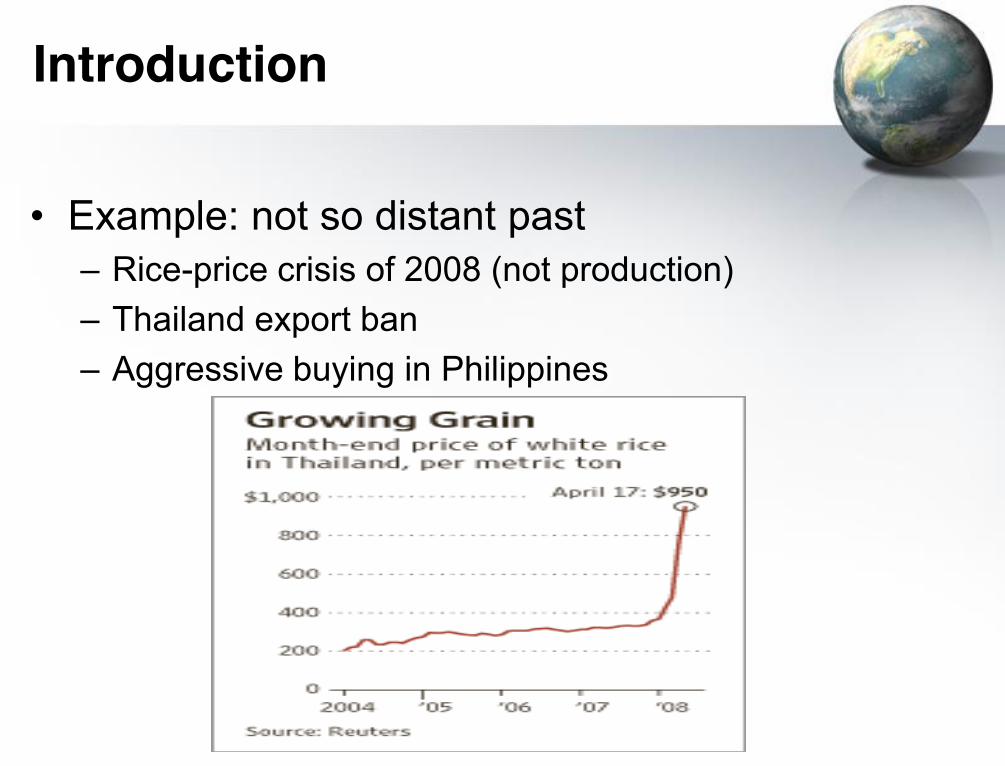
• Example: not so distant past – Rice-price crisis of 2008 (not production) – Thailand export ban – Aggressive buying in Philippines
Introduction
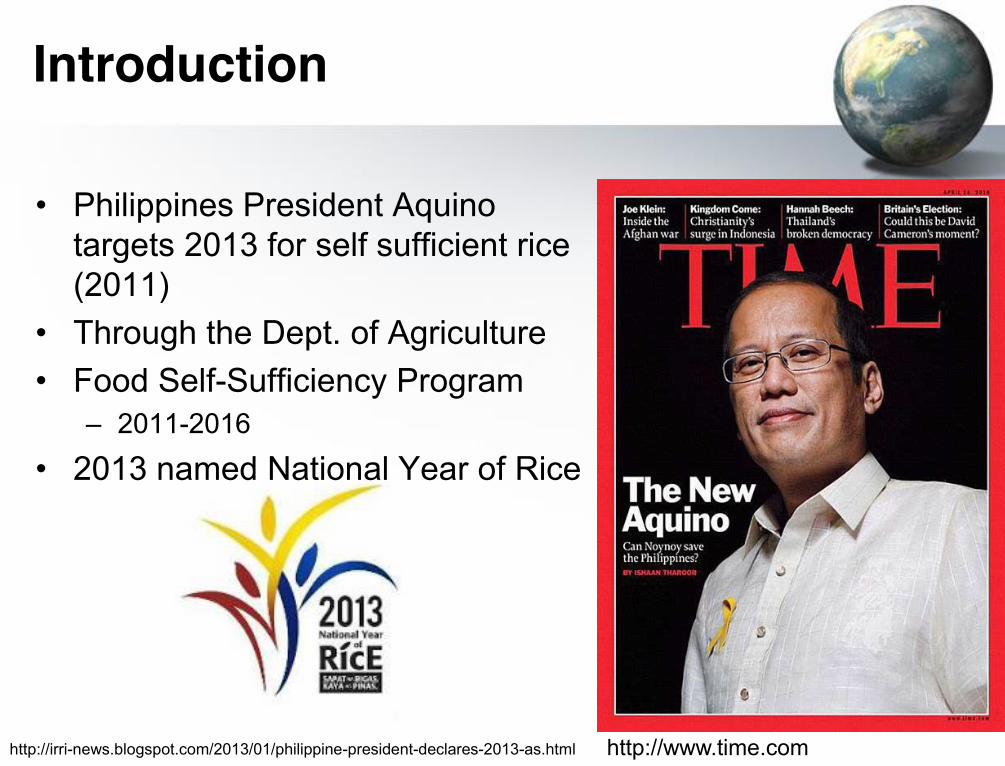
• Philippines President Aquino targets 2013 for self sufficient rice (2011)
• Through the Dept. of Agriculture • Food Self-Sufficiency Program
– 2011-2016
• 2013 named National Year of Rice
http://www.time.com http://irri-news.blogspot.com/2013/01/philippine-president-declares-2013-as.html
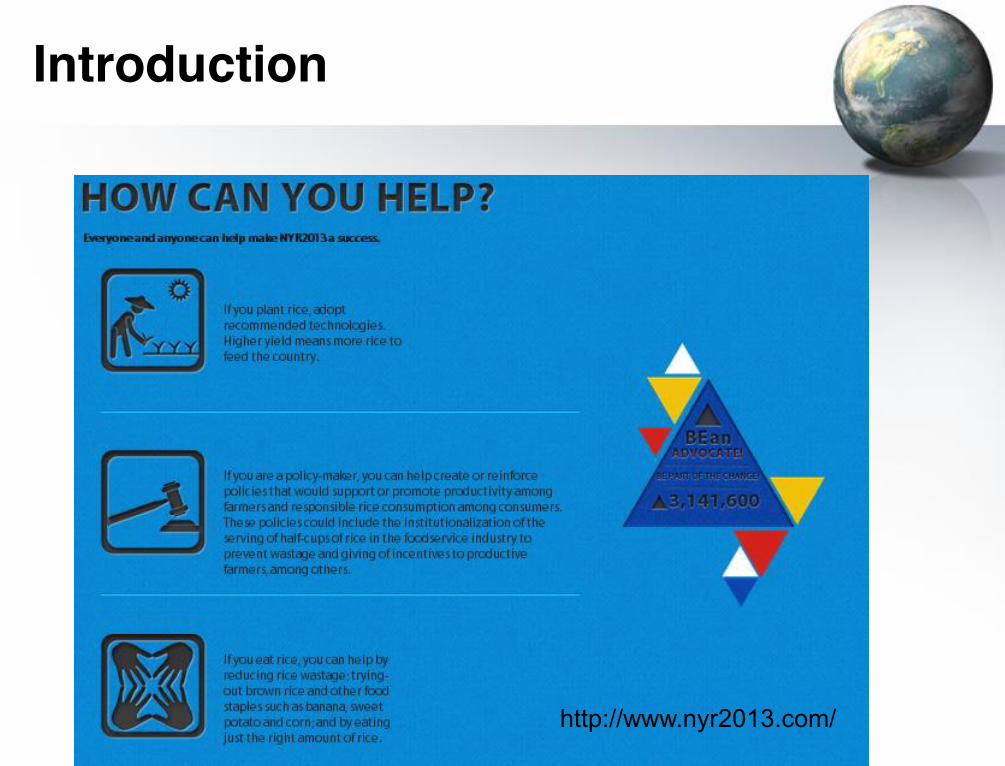
Introduction
http://www.nyr2013.com/
Current Situation
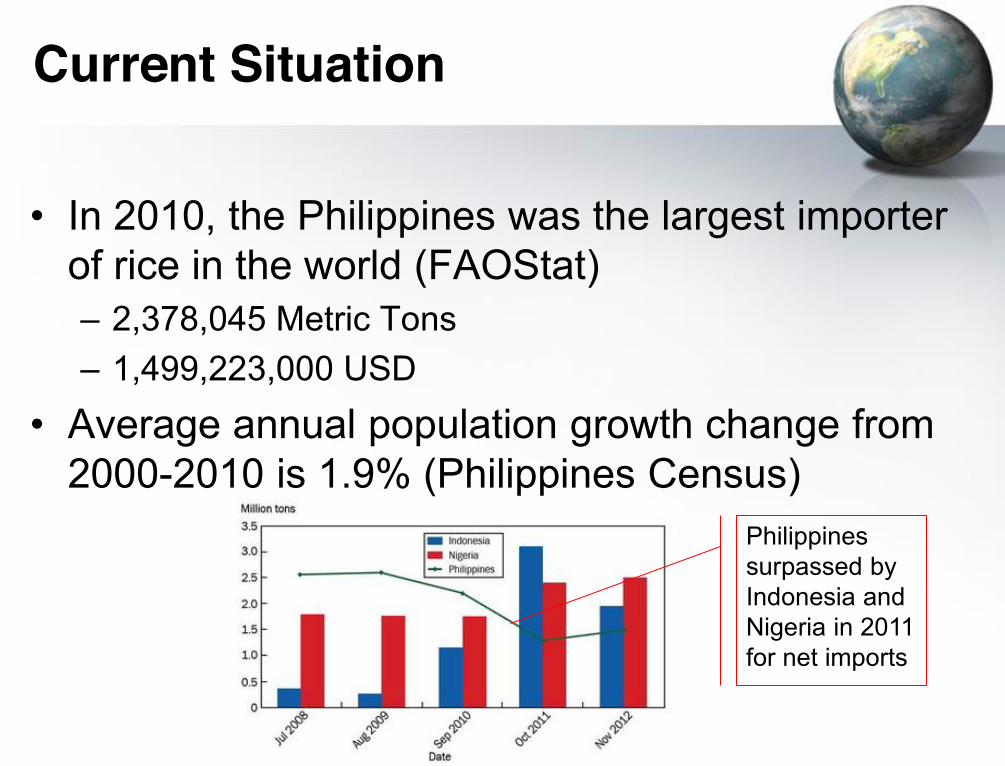
• In 2010, the Philippines was the largest importer of rice in the world (FAOStat) – 2,378,045 Metric Tons – 1,499,223,000 USD
• Average annual population growth change from 2000-2010 is 1.9% (Philippines Census)
Philippines surpassed by Indonesia and Nigeria in 2011 for net imports
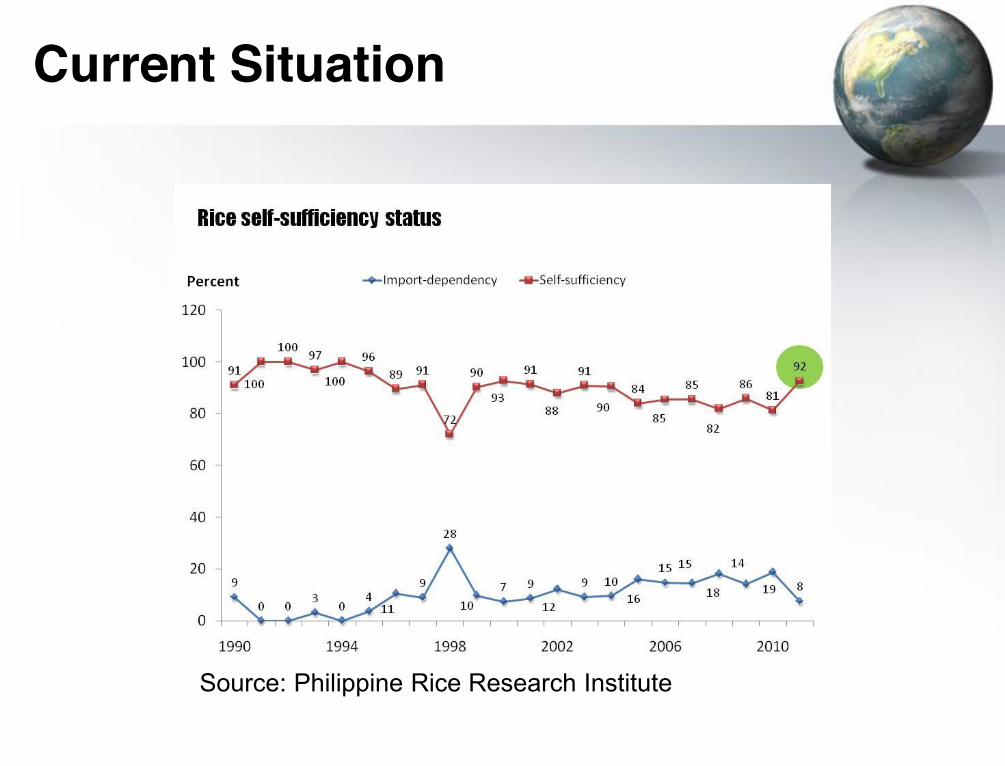
Current Situation
Source: Philippine Rice Research Institute
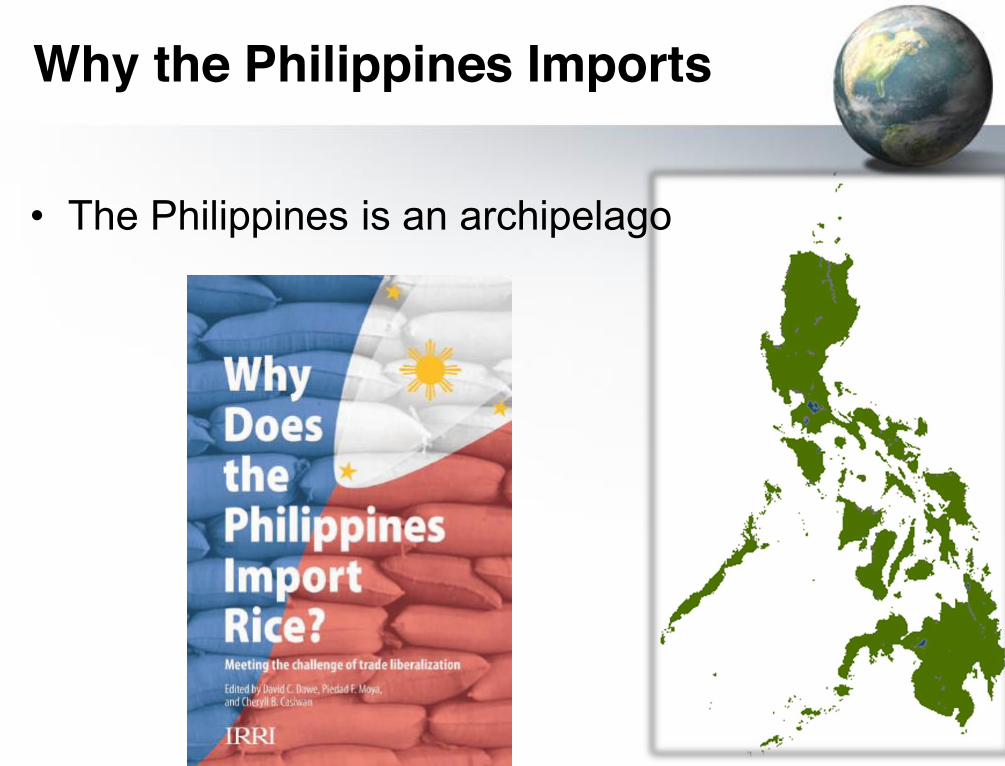
Why the Philippines Imports
• The Philippines is an archipelago
Why the Philippines Imports
• Historically there have been importers and exporters in Asia – Exporters
• Thailand • Vietnam • Cambodia • Myanmar
– Importers • Island Nations
Why the Philippines Imports
• Difference is largely attributed to arable land resulting from river deltas (Dawe, 2005)
• Thailand has four times the amount of arable land per capita as the Philippines
• The Philippines has imported rice almost every year since 1869
Why the Philippines Imports
• Beyond lack of deltas, the Philippines suffers from numerous typhoons each year
• Philippines was self-sufficient – 1970s – 1980s (even exported small amount)
• Result of Filipino farmers adopting green revolution technologies
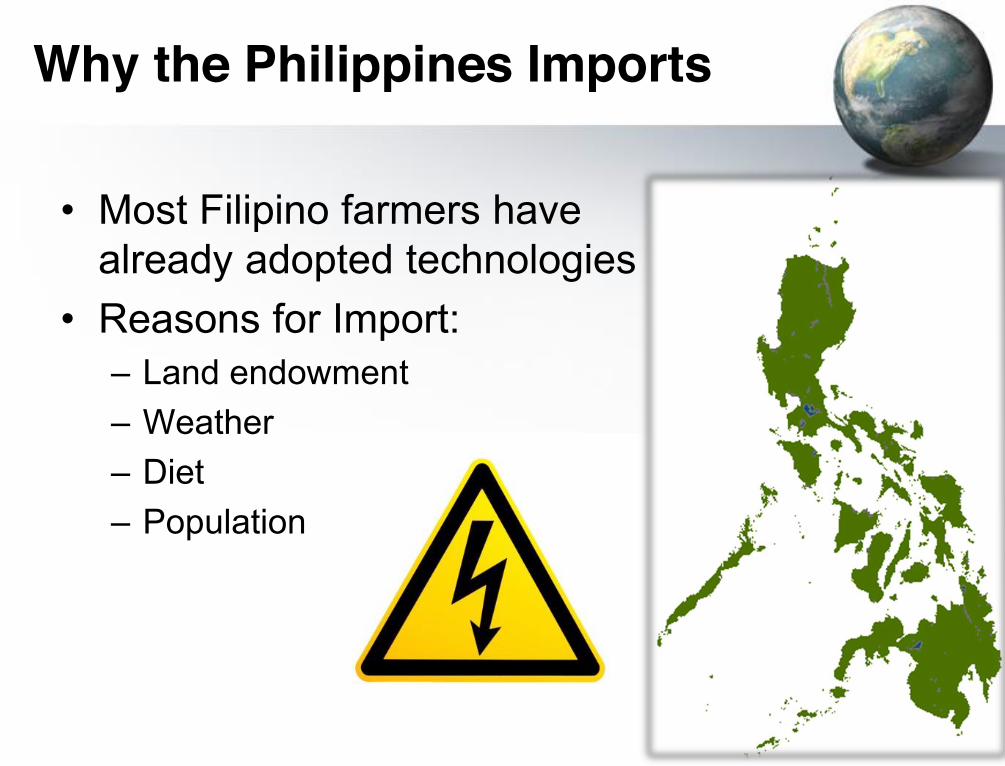
• Most Filipino farmers have already adopted technologies
• Reasons for Import: – Land endowment – Weather – Diet – Population
Why the Philippines Imports
Food Self Sufficiency Program Objectives
1. Raise farm productivity and competitiveness – Irrigation – Best management practices – R&D investment – Mechanization – Post-harvest management – Milling Quality

Food Self Sufficiency Program Objectives
2. Enhance economic incentives and enabling mechanisms – Free market – Reduced role of NFA – Improved credit – Crop Insurance
Food Self Sufficiency Program Objectives
3. Manage food staples consumption – Diversify consumed foods – Brown (unpolished) rice consumption
• Milling rates of 75% compared to 65% (FSSP) – Reduce food waste
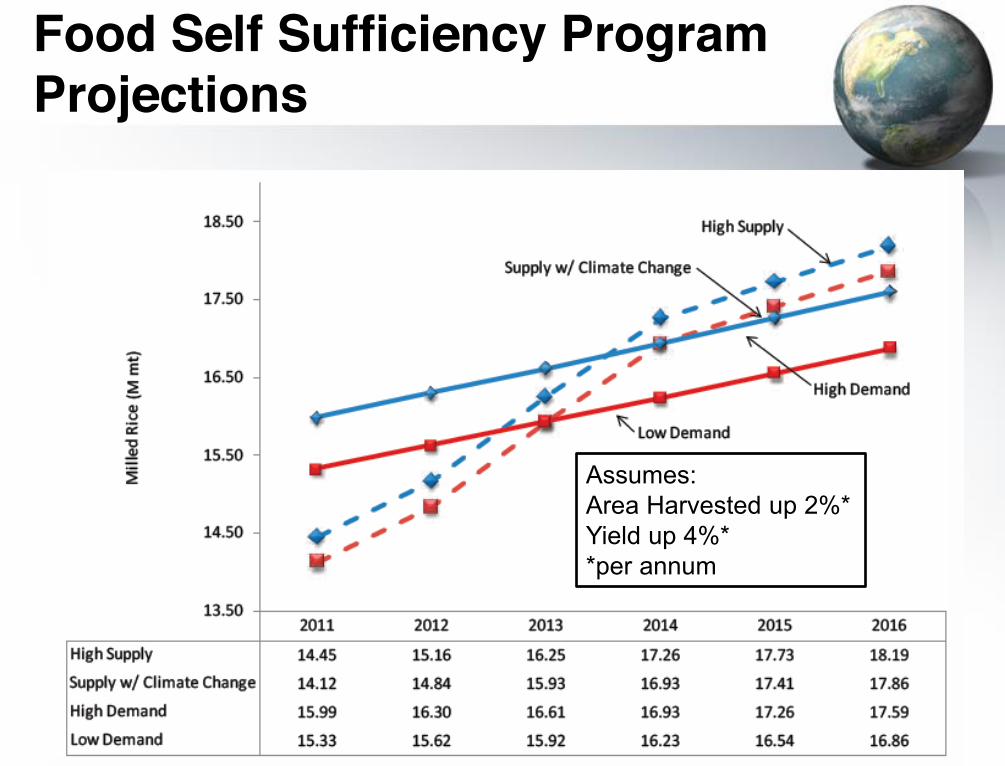
Food Self Sufficiency Program Projections
Assumes: Area Harvested up 2%* Yield up 4%* *per annum

THIS STUDY’S MODEL A different story…

Model Specifications
• Primarily addresses objective one of the FSSP, raise farm productivity and competitiveness – Irrigation – yes – Best management practices – yes – R&D investment – yes – Mechanization – no – Post-harvest management – yes – Milling Quality – yes
Model Specifications
• Based off of the Arkansas Global Rice Model – Dr. Eric Wailes and Dr. Eddie Chavez
• Constantly updated. Tracks and projects the world rice economy: production, consumption, stocks, trades, and prices
Model Specifications
• Solves for Production – Consumption = 0 – Three years
• 2013 • 2018 (+5) • 2023 (+10)
– Two milling rates • 63% Philippines current (Arkansas Global Rice Model) • 70% USA current (Arkansas Global Rice Model)
Model Specifications
– For three variables (one changes while other two are held constant) • Annual yield growth (agronomic and genetic) • Annual transformation from non-irrigated to irrigated • Annual rate of new lands to rice production
– Data comes from Philippines Bureau of Agricultural Statistics • Area harvested and production
– And the Arkansas Global Rice Model • Consumption
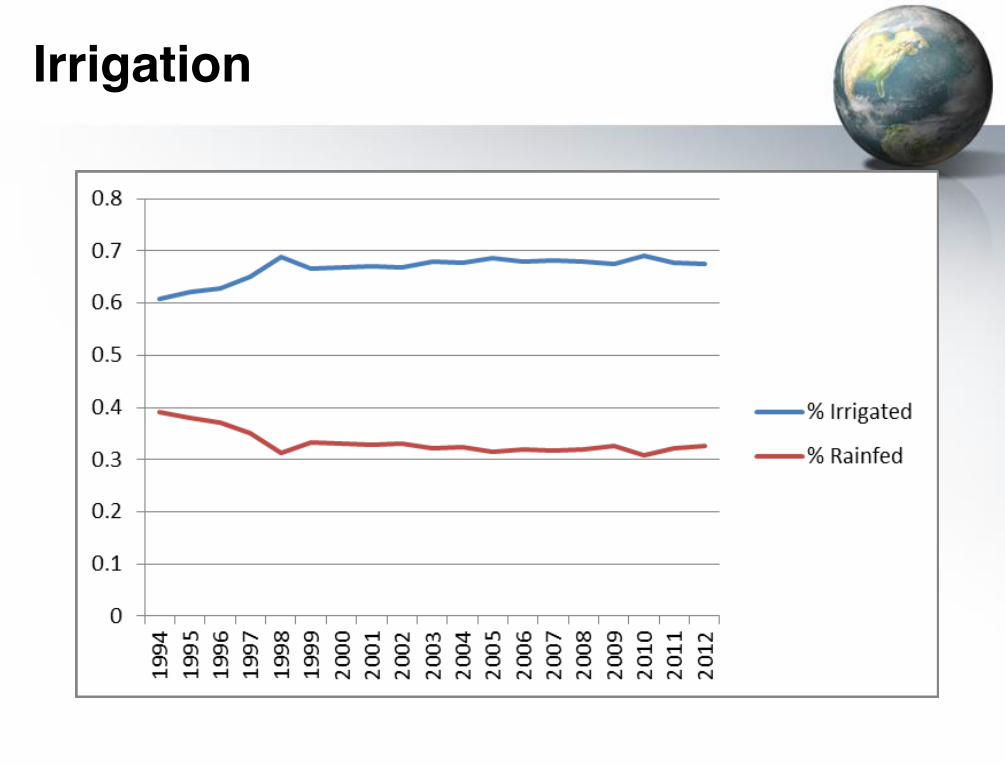
Irrigation
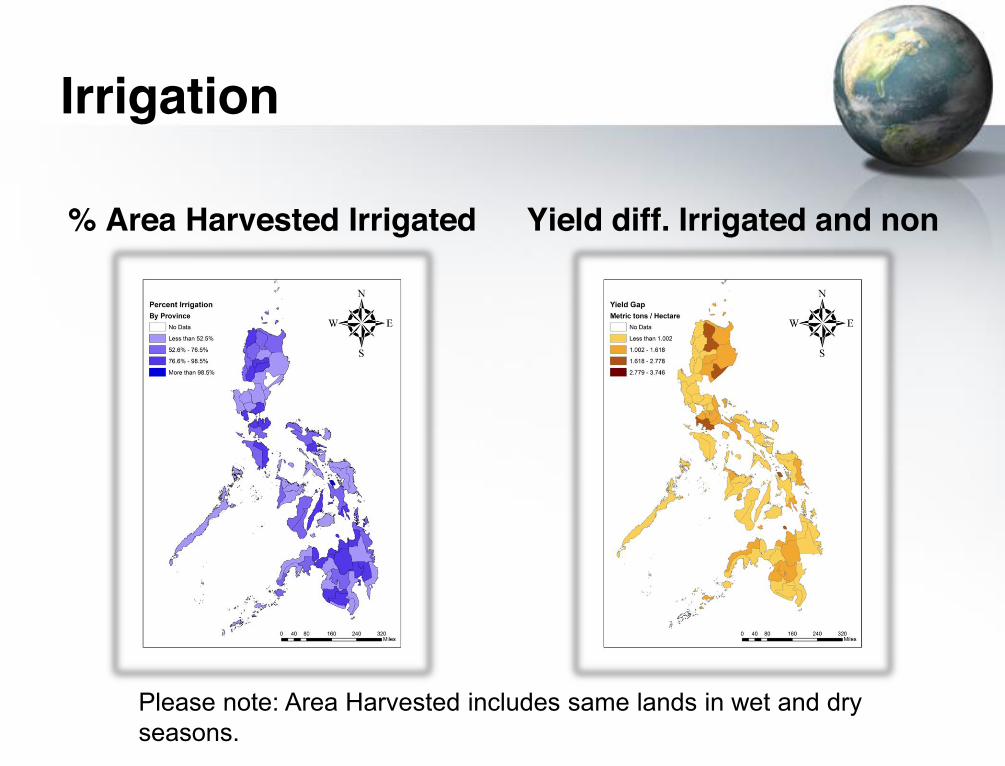
% Area Harvested Irrigated Yield diff. Irrigated and non
Please note: Area Harvested includes same lands in wet and dry seasons.
Irrigation
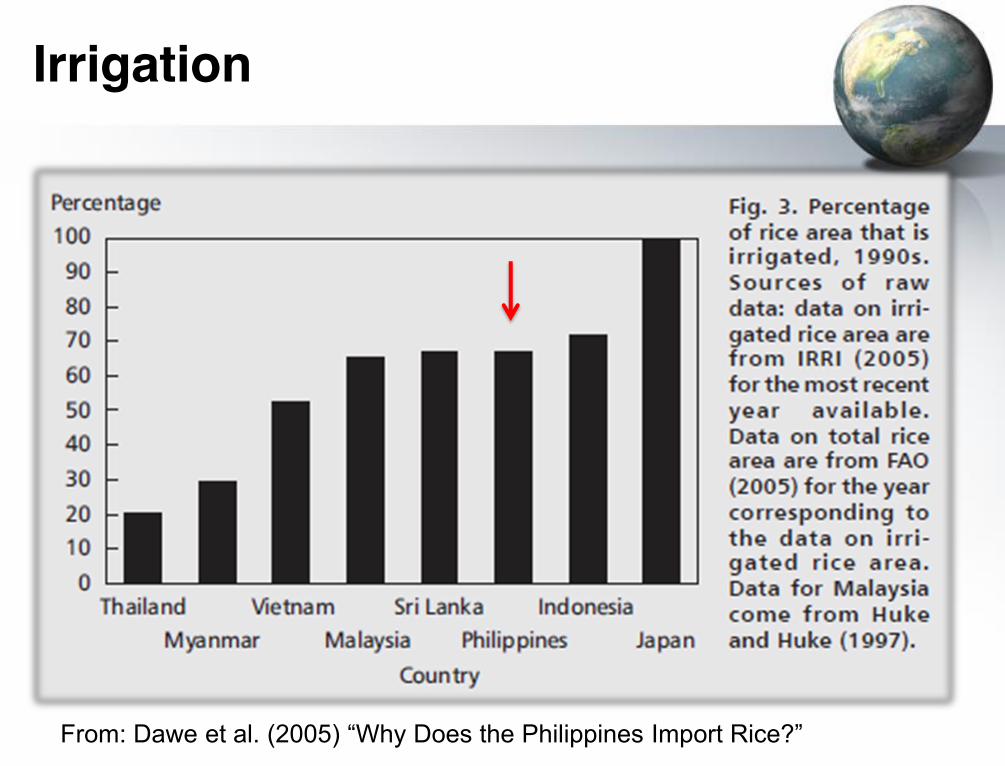
Irrigation
From: Dawe et al. (2005) “Why Does the Philippines Import Rice?”
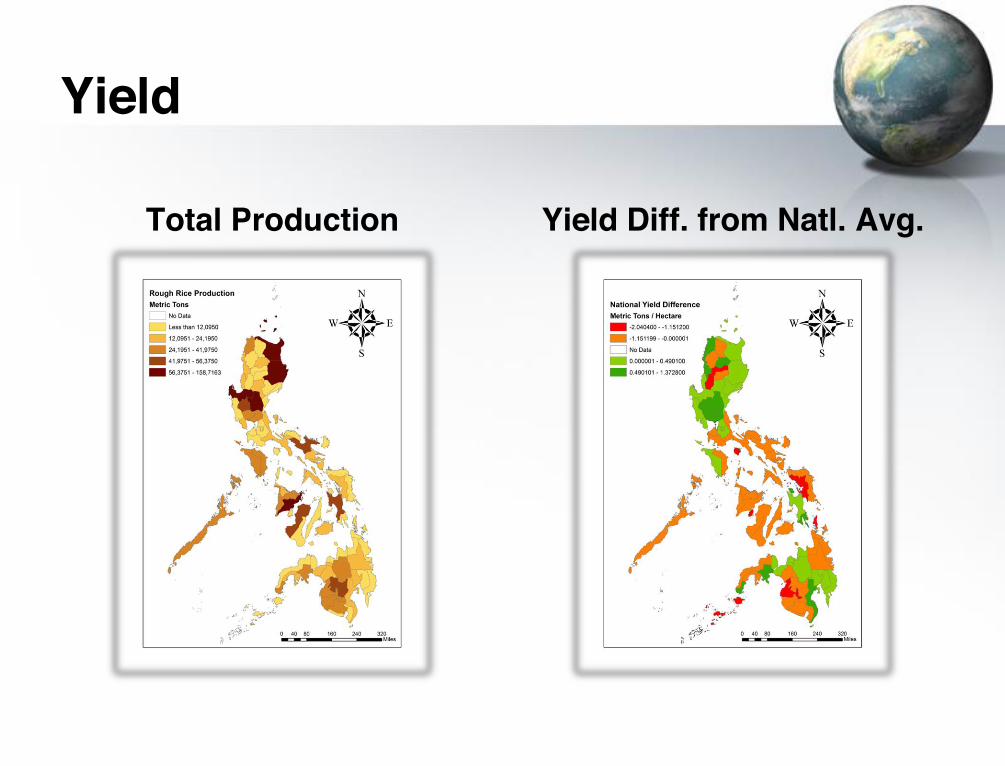
Yield
Total Production Yield Diff. from Natl. Avg.
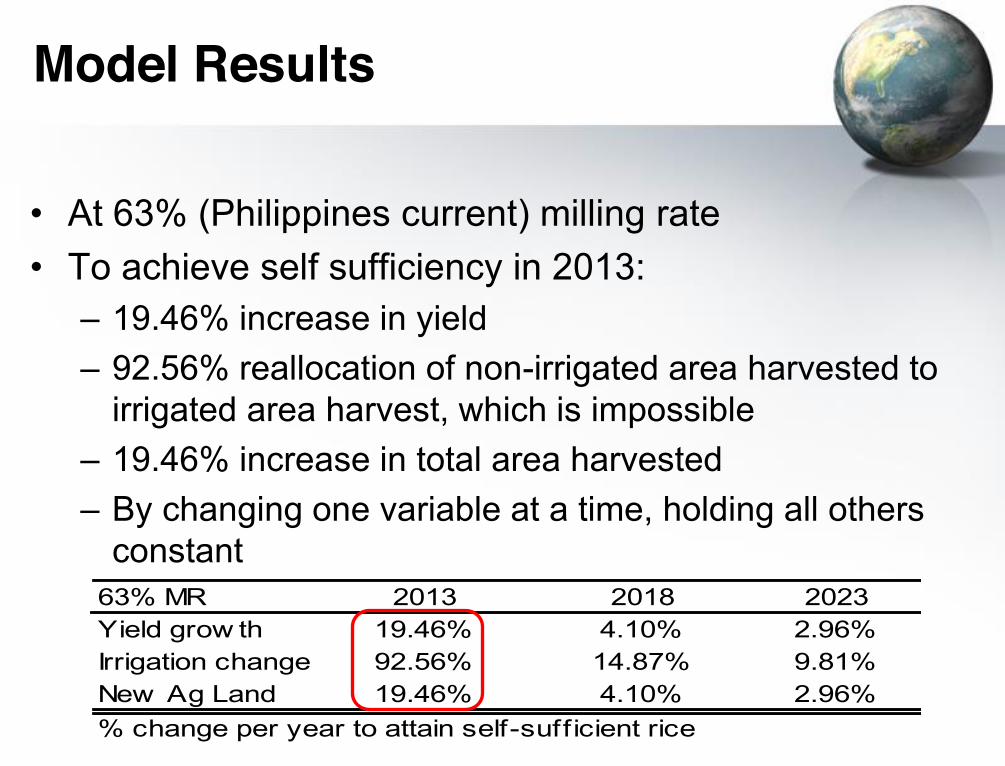
Model Results
• At 63% (Philippines current) milling rate • To achieve self sufficiency in 2013:
– 19.46% increase in yield – 92.56% reallocation of non-irrigated area harvested to
irrigated area harvest, which is impossible – 19.46% increase in total area harvested – By changing one variable at a time, holding all others
constant
63% MR 2013 2018 2023Yield grow th 19.46% 4.10% 2.96%Irrigation change 92.56% 14.87% 9.81%New Ag Land 19.46% 4.10% 2.96%% change per year to attain self-sufficient rice
Model Results
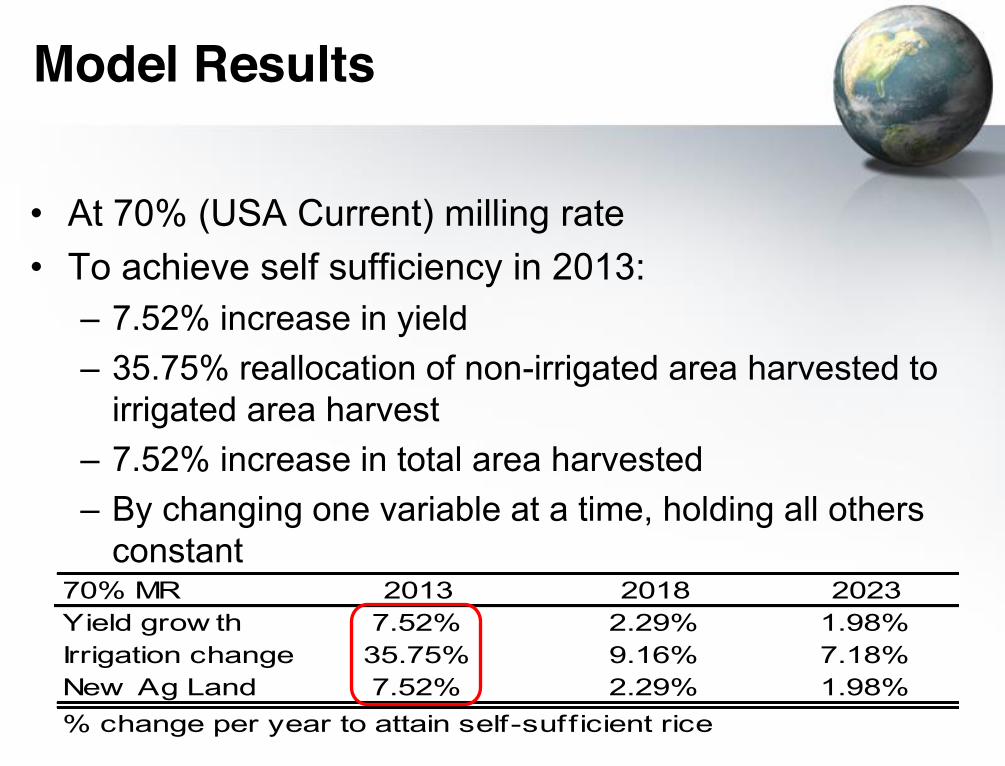
70% MR 2013 2018 2023Yield grow th 7.52% 2.29% 1.98%Irrigation change 35.75% 9.16% 7.18%New Ag Land 7.52% 2.29% 1.98%% change per year to attain self-sufficient rice
• At 70% (USA Current) milling rate • To achieve self sufficiency in 2013:
– 7.52% increase in yield – 35.75% reallocation of non-irrigated area harvested to
irrigated area harvest – 7.52% increase in total area harvested – By changing one variable at a time, holding all others
constant
Model Results
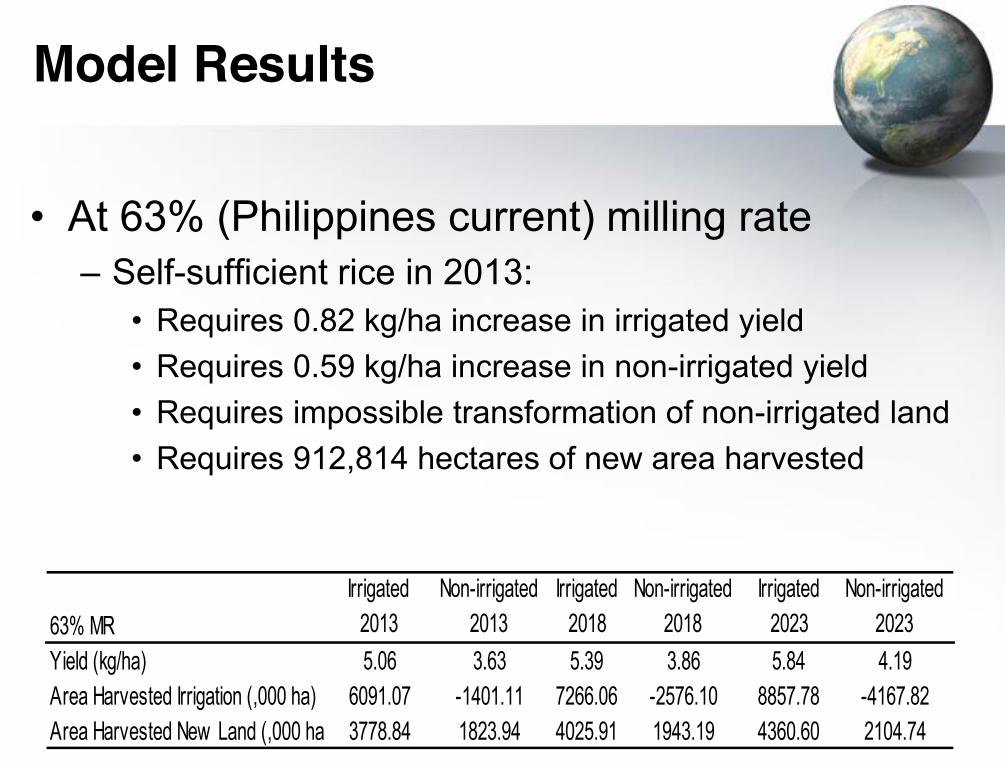
• At 63% (Philippines current) milling rate – Self-sufficient rice in 2013:
• Requires 0.82 kg/ha increase in irrigated yield • Requires 0.59 kg/ha increase in non-irrigated yield • Requires impossible transformation of non-irrigated land • Requires 912,814 hectares of new area harvested
63% MRIrrigated
2013Non-irrigated
2013Irrigated
2018Non-irrigated
2018Irrigated
2023Non-irrigated
2023Yield (kg/ha) 5.06 3.63 5.39 3.86 5.84 4.19Area Harvested Irrigation (,000 ha) 6091.07 -1401.11 7266.06 -2576.10 8857.78 -4167.82Area Harvested New Land (,000 ha) 3778.84 1823.94 4025.91 1943.19 4360.60 2104.74
Model Results
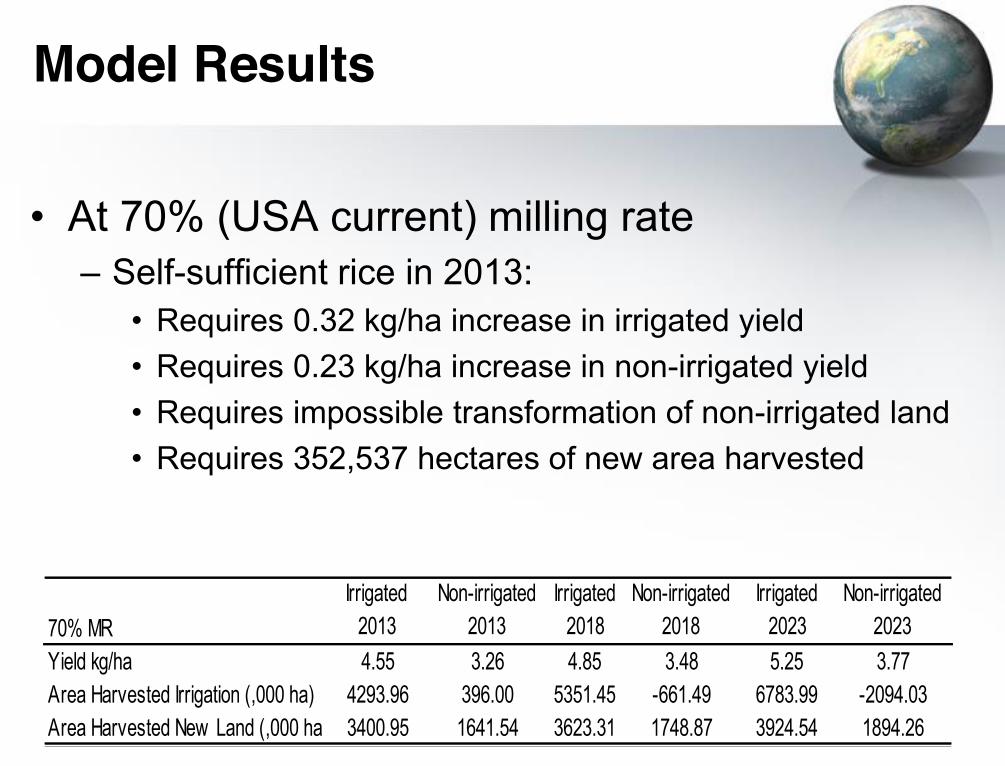
• At 70% (USA current) milling rate – Self-sufficient rice in 2013:
• Requires 0.32 kg/ha increase in irrigated yield • Requires 0.23 kg/ha increase in non-irrigated yield • Requires impossible transformation of non-irrigated land • Requires 352,537 hectares of new area harvested
70% MRIrrigated
2013Non-irrigated
2013Irrigated
2018Non-irrigated
2018Irrigated
2023Non-irrigated
2023Yield kg/ha 4.55 3.26 4.85 3.48 5.25 3.77Area Harvested Irrigation (,000 ha) 4293.96 396.00 5351.45 -661.49 6783.99 -2094.03Area Harvested New Land (,000 ha) 3400.95 1641.54 3623.31 1748.87 3924.54 1894.26
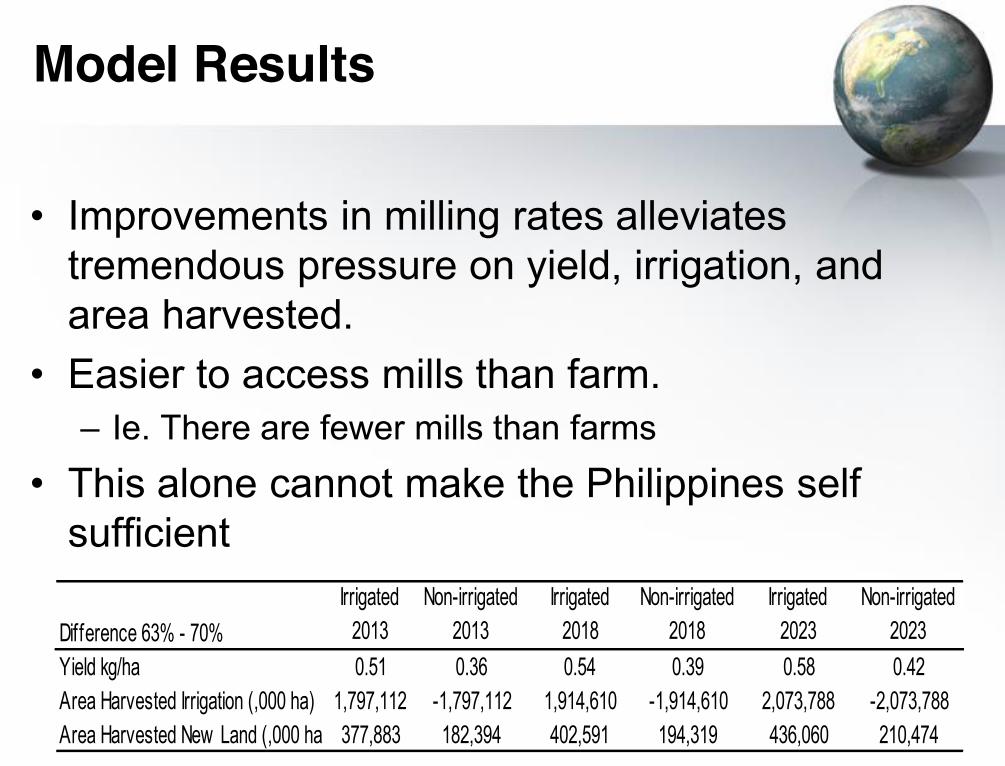
• Improvements in milling rates alleviates tremendous pressure on yield, irrigation, and area harvested.
• Easier to access mills than farm. – Ie. There are fewer mills than farms
• This alone cannot make the Philippines self sufficient
Model Results
Difference 63% - 70%Irrigated
2013Non-irrigated
2013Irrigated
2018Non-irrigated
2018Irrigated
2023Non-irrigated
2023Yield kg/ha 0.51 0.36 0.54 0.39 0.58 0.42Area Harvested Irrigation (,000 ha) 1,797,112 -1,797,112 1,914,610 -1,914,610 2,073,788 -2,073,788Area Harvested New Land (,000 ha) 377,883 182,394 402,591 194,319 436,060 210,474

Conclusions
• The potential dangers of self-sufficiency…
Conclusions
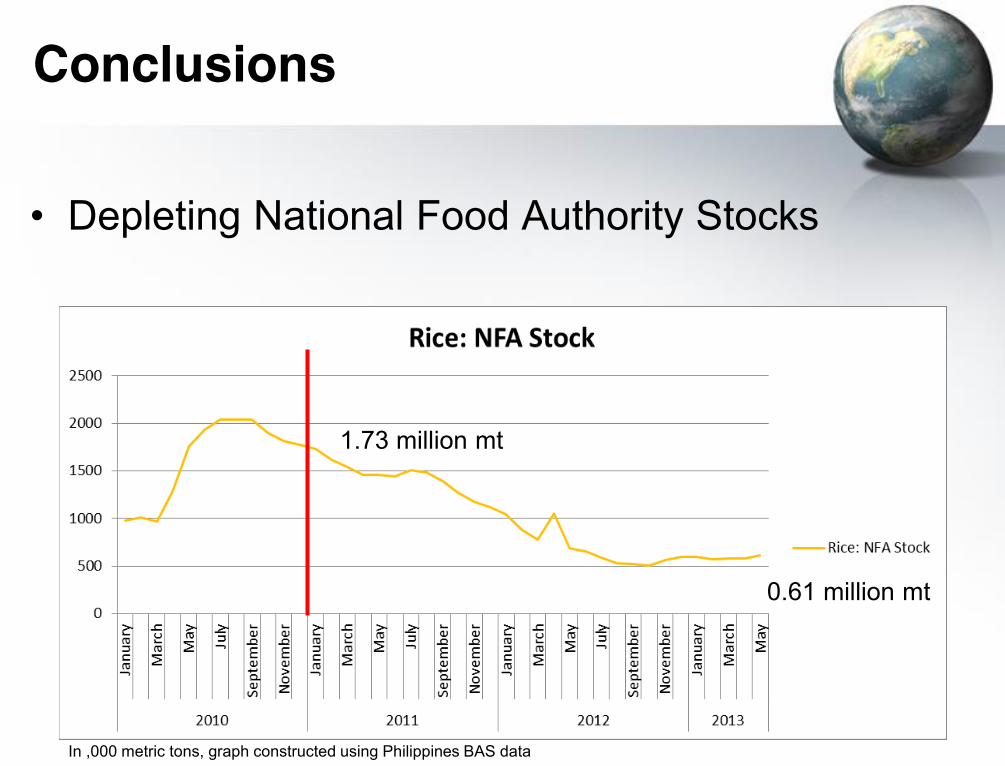
• Depleting National Food Authority Stocks
In ,000 metric tons, graph constructed using Philippines BAS data
1.73 million mt
0.61 million mt
Conclusions
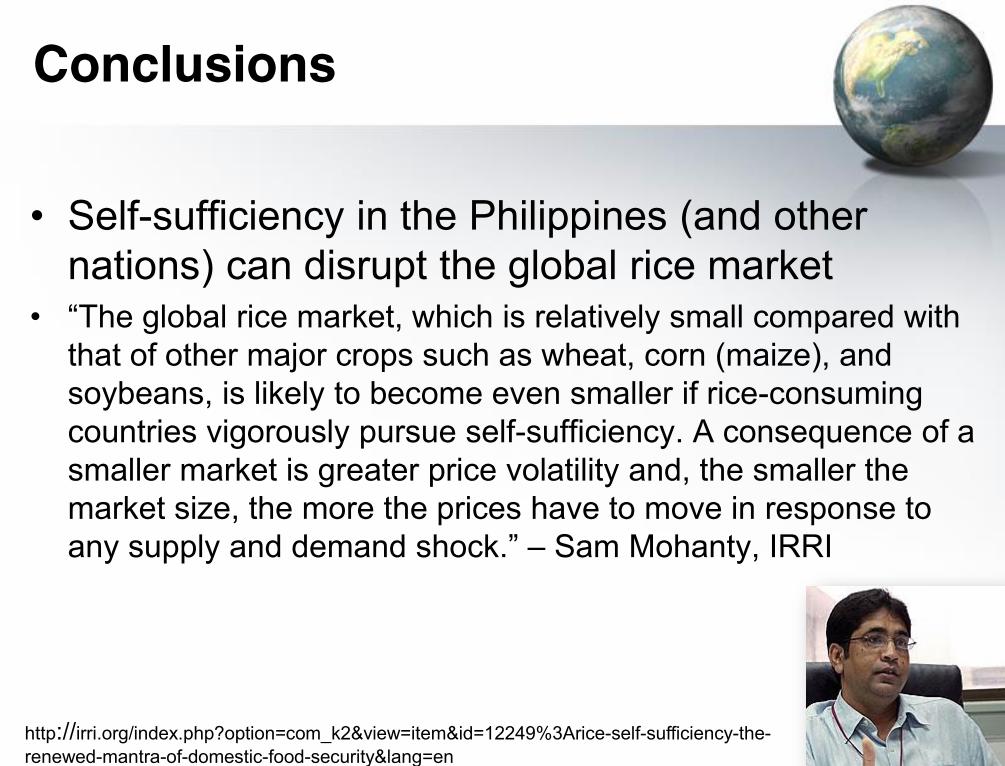
• Self-sufficiency in the Philippines (and other nations) can disrupt the global rice market
• “The global rice market, which is relatively small compared with that of other major crops such as wheat, corn (maize), and soybeans, is likely to become even smaller if rice-consuming countries vigorously pursue self-sufficiency. A consequence of a smaller market is greater price volatility and, the smaller the market size, the more the prices have to move in response to any supply and demand shock.” – Sam Mohanty, IRRI
http://irri.org/index.php?option=com_k2&view=item&id=12249%3Arice-self-sufficiency-the-renewed-mantra-of-domestic-food-security&lang=en
Conclusions
• More volatile domestic market – Smaller markets have to move more in response to any
supply and demand shock – Volatile weather = volatile supply
• Floods • Monsoons • Drought

Conclusions
• Potential for higher domestic prices – IRRI book, “Why does the Philippines Import Rice?”
calls for trade liberalization because: • Filipino farmers do not have a comparative advantage in rice
– Poor infrastructure and high interest rates cause prices to be higher than countries like Thailand and Vietnam
Conclusion
• Attainment of self-sufficient rice does not appear feasible in 2013.
• The current milling rate of 63% would require: – 19.46% yield increase this year – Impossible transformation of non-irrigated to irrigated – 19.46% increase in area harvested
• Investment into milling quality seems to be the, “lowest hanging fruit”
Conclusion
• More studies should be conducted to investigate: – Volatility of rice prices of the Philippines as a closed
rice-economy – Marginal costs associated with all investments
• Milling • Irrigation • Yield increases • Food waste reduction • Dietary changes
THANK YOU