food consumption patterns and nutritional status in pakistan
TRANSCRIPT

Food Consumption Patterns and Nutritional Status in Pakistan
By
Hina Nazli
Asma Shahzad
Amina Mehmood
October 2, 2014

Availability
Energy
Calories
Nutritional Status
Food Intake
Macro Nutrients
ProteinCarbohydrates
Fats
Micro Nutrients
VitaminsMineral
Production Imports
Accessibility Sustainability
Price Income
Food Intake (consumption patterns)
Accessibility Sustainability
Price Income
Nutritional Status
Energy
Calories
Macro Nutrients
ProteinCarbohydrates
Fats
Micro Nutrients
VitaminsMineral
Food Consumption and Nutrition: Plan of Presentation
• Inadequate maternal health or child care practices
• Inadequate access to health care services, safe water and sanitation

Motivation• PSSP (IFPRI) USAID funded set up to assist in building policy research capacity in Pakistan
• Agriculture, Rural Development, Poverty Reduction, Food Security and Nutrition are IFPRI areas of core competence globally and in Pakistan (1980s-90s)
• Analysis of existing data
• Generating own data
• Pakistan’s draft Agriculture and Food Security Policy aims to address the food and nutrition insecurities
• Pakistan Integrated Nutrition Strategy (PINS) aims to address the underlying causes of malnutrition (food diversification, WASH, school feeding, etc)
• Scaling Up Nutrition (SUN) program aims to identify the hurdles in access to food
• Issue of food security needs further research
• Little or no understanding in policy making of the determinants of food security and the relationship between food security, consumption behavior and nutritional outcomes
• Limited understanding and detailed analysis of nutritional status of the vulnerable and its variationacross gender and other demographic variables and other factors such as income and regional location etc

Data available to Examine Malnutrition in Pakistan• Conducted by GOP
• Micro-nutrient Survey 1976-77 (Nutrition Cell, Planning and Development Division)
• National Nutrition Surveys (1985-87, 1991-94, 2000-01, 2010-11) (Aga Khan University’s Division of Women and Child Health, Pakistan’s Ministry of Health and UNICEF)
• Demographic and health survey (1990-91, 2006-07, 2012-13) (National Institute of Population Studies)
• Household Integrated Economic Survey (PBS)
• Conducted by research institutions• IFPRI Panel Survey Years (1986-1991)
• World Bank/PIDE Pakistan Panel Household Survey (2001, 2004, 2010)
• PSSP (IFPRI) Rural Household Panel Survey (2012-2014)

Availability of Average Calories per capita per day based on Official Data
Source: GOP (2014), Economic Survey
1500
1700
1900
2100
2300
2500
2700
49-50 79-80 89-90 99-00 2003-04 2004-05 2005-06 2006-07 2007-08 2008-09 2009-10 2010-11 2011-12
Cal
ori
es/c
apit
a/d
ay
Calories per day Minimum

Available and Consumed Calories (per capita per day) From Official Sources
0
500
1000
1500
2000
2500
3000
2001-02 2004-05 2005-06 2007-08 2010-11
Cal
ori
es p
er c
apit
a p
er d
ay
Available Consumed
Source: GOP (2011)

Calorie Consumption Differs across Rural Urban Areas (based on Official Data)
1,950
2,000
2,050
2,100
2,150
2,200
2,250
2,300
2,350
2,400
Urban Rural Pakistan
CA
LOR
IES/
AE/
DA
Y
Source: HIES 2010-11

Low calorie consumption and high levels of poverty
Malik and Whitney (2014)
0
5
10
15
20
25
30
35
40
45
2001-02 2004-05 2005-06 2007-08 2010-11
PO
VER
TY H
EAD
CO
UN
T (%
)
Urban Rural Pakistan

Calorie Consumption Differs across Poverty Status (based on Official Data)
Source: HIES 2010-11
0
500
1,000
1,500
2,000
2,500
3,000
Poor Nonpoor
CA
LOR
IES/
AE/
DA
Y
Urban Rural Pakistan

70% of food expenditure is spent on energy dense food based on Official Data (2010-11)
0
5
10
15
20
25
30
Dairy Wheat Oils Sugars Meats
SHA
RE
OF
FOO
D E
XP
END
ITU
RE
(%)
Pakistan
Overall Non-poor Poor
0
5
10
15
20
25
30
Dairy Wheat Oils Sugars Meats
SHA
RE
OF
FOO
D E
XP
END
ITU
RE
(%)
Urban areas
Overall Non-poor Poor
0
5
10
15
20
25
30
Dairy Wheat Oils Sugars Meats
SHA
RE
OF
FOO
D E
XP
END
ITU
RE
(%)
Rural areas
Overall Non-poor Poor
Source: HIES 2010-11
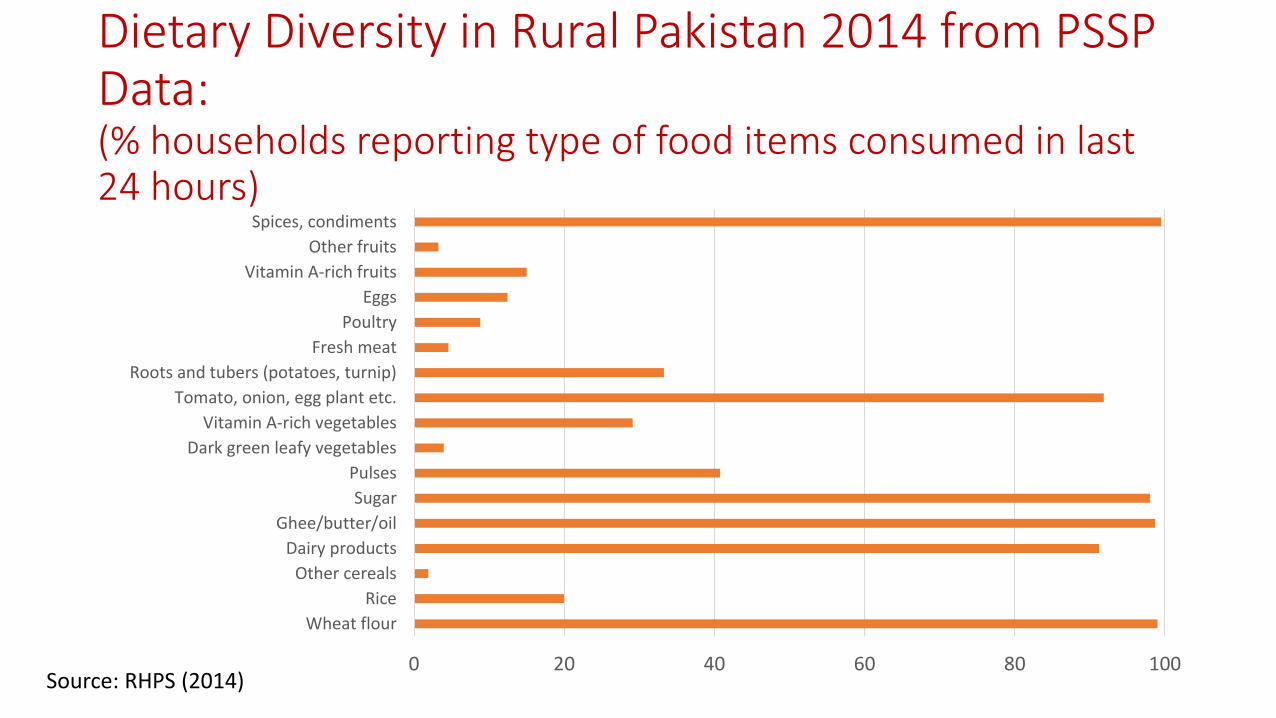
Dietary Diversity in Rural Pakistan 2014 from PSSP Data:(% households reporting type of food items consumed in last 24 hours)
0 20 40 60 80 100
Wheat flour
Rice
Other cereals
Dairy products
Ghee/butter/oil
Sugar
Pulses
Dark green leafy vegetables
Vitamin A-rich vegetables
Tomato, onion, egg plant etc.
Roots and tubers (potatoes, turnip)
Fresh meat
Poultry
Eggs
Vitamin A-rich fruits
Other fruits
Spices, condiments
Source: RHPS (2014)

Food Frequency last seven days based on PSSP Data
0 1 2 3 4 5 6 7
Wheat flour
Rice
Other cereals
Dairy products
Ghee/butter/oil
Sugar
Pulses
Dark green leafy vegetables
Vitamin A-rich vegetables
Tomato, onion, egg plant etc.
Roots and tubers (potatoes, turnip)
Fresh meat
Poultry
Eggs
Vitamin A-rich fruits
Other fruits
Spices, condiments
Source: RHPS (2014)

Wheat is the major source of energy
0
10
20
30
40
50
60
Wheat Oils Dairy Sugars Meats
% S
HA
RE
IN T
OTA
L C
ALO
RIE
S
Overall Non-Poor Poor
Source: HIES 2010-11

Per Capita Availability and Consumption of Wheat
Source: GOP (2011)
0
20
40
60
80
100
120
140
2001-02 2004-05 2005-06 2006-07 2010-11
KG/c
apit
a/ye
ar
Available Basket Consumption

Sharp Increase in the Price of Wheat since 2007-08
0
5
10
15
20
25
30
35
2000-01 2001-02 2002-03 2003-04 2004-05 2005-06 2006-07 2007-08 2008-09 2009-10 2010-11
Rs/
KG
Source: GOP (2014), Economic Survey 2013-14

The Kilograms of Wheat Flour that one Day’s Wages can Buy
0
5
10
15
20
25
30
35
2006 2007 2008 2009 2010 2011 2012
Kilo
gram
s o
f Fl
ou
r p
er d
aily
wag
e (K
gs)
Skilled Isamabad
Skilled Karachi
Skilled Lahore
Unskilled Islamabad
Unskilled Karachi
Unskilled Lahore

Calories consumed and the cost of calories –PSSP Study
Region or Population Group
Total Calories
(per AE/day)
Food Expenditure
(per AE/day) (Rs)
100 Calories cost Overall
Food (Rs)
Calories from wheat
(per AE/day)
Expenditure on Wheat
(per AE/day) (Rs)
100 Calories cost from
Wheat (Rs)
Rural Poor 1,882 36.8 1.95 1,007 8.2 0.81
Rural Non-Poor 2,664 67.0 2.52 1,208 7.7 0.64
Urban Poor 1,782 40.1 2.25 881 9.2 1.04
Urban Non-Poor 2,289 74.8 3.27 872 7.3 0.83
Pakistan 2,260 57.0 2.52 1,041 7.3 0.70
Source: Malik et al (2014), estimated from HIES (2010-11)

Change in Prices and Income and Demand for Wheat (2010-11): PSSP Study
Budget share on wheat
Expenditure elasticity
Own price uncompensated
elasticity
Own price Compensated
elasticityWheat-rice elasticity
Rural areas 18.6 0.79 -0.32 -0.209 0.006
Poor 22.9 0.84 -0.35 -0.165 -0.005
Non-poor 15.8 0.75 -0.35 -0.227 0.023
Urban areas 15.1 0.74 -0.31 -0.123 0.006
Poor 20.0 0.92 -0.36 -0.155 -0.001
Non-poor 11.8 0.67 -0.20 -0.107 -0.002
Pakistan 17.5 0.77 -0.32 -0.179 0.010
Poor 22.0 0.81 -0.21 -0.163 -0.012
Non-poor 14.5 0.76 -0.39 -0.173 0.021
Source: Malik et al (2014), estimated from HIES (2010-11)

Dietary patterns determine the nutritional status

Malnutrition among Women (BMI) based on official data
0
10
20
30
40
50
60
Underweight (<18.5) Normal (18.5-24.9) Overweight (25-29.9) Obese (>29.9)
% W
OM
EN (
15
-49
YEA
RS)
Pakistan Urban Rural
Source: NNS 2010-11

Micronutrient Deficiency among Women (2001-2011) official data
0
10
20
30
40
50
60
Prevalence of Anemia Vitamin A Deficiency Zinc Deficiency%
WO
MEN
(1
5-4
9 Y
EAR
S)
Pakistan
2001 2011
0
10
20
30
40
50
60
Prevalence of Anemia Vitamin A Deficiency Zinc Deficiency
% W
OM
EN (
15
-49
YEA
RS)
Urban areas
2001 2011
0
10
20
30
40
50
60
Prevalence of Anemia Vitamin A Deficiency Zinc Deficiency%
WO
MEN
(1
5-4
9 Y
EAR
S)
Rural areas2001 2011
Source: NNS 2010-11

Nutritional Intake among Women (24 hours food recall)
official data
0 500 1000 1500 2000 2500
Energy(K.cal)
Protein (gm)
Fats (gm)
Carbohydrate (gm)
Calcium (mg)
Phosphorus (mg)
Iron (mg)
Zn (mg)
Vit.C (mg)
Pakistan
Pakistan Recommended Allowance
0 500 1000 1500 2000 2500
Energy(K.cal)
Protein (gm)
Fats (gm)
Carbohydrate (gm)
Calcium (mg)
Phosphorus (mg)
Iron (mg)
Zn (mg)
Vit.C (mg)
Urban areas
0 500 1000 1500 2000 2500
Energy(K.cal)
Protein (gm)
Fats (gm)
Carbohydrate (gm)
Calcium (mg)
Phosphorus (mg)
Iron (mg)
Zn (mg)
Vit.C (mg)
Rural areas
Source: NNS 2010-11

Undernourished Females and Future Generation (World Bank, 2006)
• A malnourished woman is at higher risk of giving birth to an anemic or an underweight child (less than 2.5 kg)
• Such children have five times the risk of death in the first year and a high risk of growth failure during childhood
• Low birth weight may result in greater chronic diseases as an adult
• Severe iron deficiency anemia causes deaths during pregnancy and childbirth
• Iodine deficiency in pregnancy causes the birth of mentally impaired children
• Human and economic potential can be at risk by malnutrition

Results of Malnutrition
• Child mortality• Low birth-weight babies (31.6% of live births in 2007) rank 3rd in 183 countries• Under five mortality rate (89 per 1000 live births, 2008-2012)• Infant mortality rate (74 per 1000 live births, 2008-2012)• Neonatal mortality rate (55 per 1000 live births, 2008-2012)
• Disability • About 2.65 % population was disabled in 2012 (based on the projections on 1998
Census), 2.54% was in 1998• Of these, 43% are children (1-15 years)• Of total disabled, 8.2% are blind, 7.5% deaf, 14% mentally retarded, 8.3% have
multiple disabilities
• Probability of falling sick, loss in work days and income
Source: PDHS 2012-13Source: UNICEF, State of the World's Children, Childinfo, and Demographic and Health Surveys by ICF International Source: Helping Hands for Relief and Development (2012). Persons with Disabilities (PWDs) Statistics in Pakistan 2012

Protein-Energy Malnutrition among Children official data (< 5 years of age) official data
0
10
20
30
40
50
60
70
1977 1985-87 1990 1990-94 2001 2011
% c
hild
ren
Underweight Stunted Wasted
Source: NNS 2010-11

Micronutrient Deficiency among Children (2001-2011) official data
0
10
20
30
40
50
60
70
Prevalence of Anemia Vitamin A Deficiency Zinc Deficiency%
CH
ILD
REN
Pakistan
2001 2011
0
10
20
30
40
50
60
70
Prevalence of Anemia Vitamin A Deficiency Zinc Deficiency
% C
HIL
DR
EN
Urban areas
2001 2011
0
10
20
30
40
50
60
70
Prevalence of Anemia Vitamin A Deficiency Zinc Deficiency%
CH
ILD
REN
Rural areas
2001 2011
Source: NNS 2010-11

Nutritional Intake among Children 0-23 months(24 hours food recall) official data
0 200 400 600 800 1000 1200
Energy(K.cal)
Protein (gm)
Fats (gm)
Carbohydrate (gm)
Calcium (mg)
Phosphorus (mg)
Iron (mg)
Zn (mg)
Vit.C (mg)
Urban areas
0 200 400 600 800 1000 1200
Energy(K.cal)
Protein (gm)
Fats (gm)
Carbohydrate (gm)
Calcium (mg)
Phosphorus (mg)
Iron (mg)
Zn (mg)
Vit.C (mg)
Pakistan
Pakistan Recommended Allowance
0 200 400 600 800 1000 1200
Energy(K.cal)
Protein (gm)
Fats (gm)
Carbohydrate (gm)
Calcium (mg)
Phosphorus (mg)
Iron (mg)
Zn (mg)
Vit.C (mg)
Rural areas
Source: NNS 2010-11

Mothers’ Knowledge about Child Nutrition (PSSP data)
23.5925.59
14.06
0
5
10
15
20
25
30
Iron deficiency Iodine Rich Food Drinking Water Treatment
Pe
rce
nta
ge
Source: RHPS (2012)

Prevalence of Malnutrition (<–2SD) by Province and Rural Pakistan (2013) (PSSP Study)
40
46
23
35
41
22
52
59
2831
38
16
0
10
20
30
40
50
60
70
Underweight Stunting Wasting
% C
HIL
DR
EN
All Pakistan Punjab Sindh KPK
Source: Shahzad et al. (2013)

Comparison of malnourished children in NNS 2011 and RHPS 2013 (PSSP Study)
33
46
16
40
46
23
0
5
10
15
20
25
30
35
40
45
50
Underweight Stunted Wasted
% C
HIL
DR
EN
NNS 2011 RHPS 2013
Source: Shahzad et al. (2013)

Logistic Regression Analysis (PSSP Study)
• Dependent variables: HAZ, WAZ, WHZ=1 if malnourished (z-score <-2), 0 otherwise
• Child characteristics: age and gender
• Mother Characteristics: age at child birth, literacy
• Household characteristics: number of siblings, nuclear family, farm household, flush toilet, and poverty status
• Community characteristics: distance from BHU, LHV/LHW
• Location characteristics: Sindh and KPK

Results of Logistic Regression (PSSP Study)
• Incidence of malnutrition among children under five is highest in Sindh
• Improving hygienic conditions appear important to reduce long term malnutrition (toilet facility and safe drinking water)
• Access to health care services plays a significant role in reducing the short-term nutrition (LHW)
• Mother’s education improves the general state of nutrition among children under five
• No significant effect of poverty status on malnutrition

Why is there no significant relationship between malnutrition and poverty? Because Child malnutrition is high across all expenditure quintiles (PSSP Study)
0
10
20
30
40
50
60
Underweight Stunting Wasting
% C
HIL
DR
EN
1st quintile 2nd quintile 3rd quintile 4th quintile 5th quintile
Source: Shahzad et al. (2013)

PSSP Study: Poverty and malnutrition synonymous
• Overall levels of poverty are so high and calorie consumption is so low across the board that children in all expenditure categories are equally affected
• The data of RHPS (2013) shows that the average calories intake of 80 percent households (bottom 4 quintiles) is 2211 that is less than the recommended allowance of 2350 calories
• Poverty and malnutrition are determined by the same variables
• In fact malnutrition indicators are often used as a proxy for poverty in international studies (Reinhard and Wijayaratne, 2002; Setboonsarng, 2005; Heltberg, 2009; Klaver. 2010)
• The United Nation’s Millennium Development Goals conflate hunger and poverty in its first goal to “eradicate extreme poverty and hunger.” Undernourishment and malnutrition are among the indicators for this goal

Summing up• Cereals, fats, sugars, and dairy products are the main sources of calories and
macro-nutrients
• The consumption of micronutrient rich foods (vegetables and fruits) is very low
• Despite calorie-dense diet, average calorie consumption is lower than the recommended amount of 2350 or 2150 and is unbalanced in terms of micro-nutrients
• Wheat is the main source of calories, carbohydrate and fiber
• Little effect on the consumption of wheat with rising prices but at what cost (education, health care, etc.?)
• Focus of policies is on ensuring availability of wheat tonnage through production and import – limited action to other aspects such accessibility, sustainability and safety. That is why very little diversification away from four major crops.

Summing up
• Two main reasons of high prevalence of malnutrition in the country:• Lack of resources at the household level to maintain the minimum daily allowance of
essential nutrients; and
• Lack of awareness about balanced diet and maintaining good health
• Focus of previous research on estimating the numbers
• All the elements of Food Security not fully understood or integrated into policies
• Little work on understanding the linkages between food security, consumption behavior and nutritional outcomes and variations across socio-economic groups and regions
• Vey little prioritization or impact evaluation of any previous programs

Summing up
• Nutritional outcomes represent economic, health, education,
demographic and cultural factors
• Nutritional Status is the most direct measure of the welfare of a
people
• It can be measured directly and in physical terms
• not indirectly and through assumption based analysis such as those for
money-metric measures of poverty which have proved very controversial in
Pakistan

Some Recommendations
• Identification of malnourished population based on scientific method (mapping exercise)• Strong and accessible database for analysis; consistency in measuring indicators
• Moving towards nutrition-sensitive agriculture• Agricultural value chain
• Kitchen gardening
• Better storage facilities/techniques for agricultural products
• Improved infrastructure and well functioning institutions (credit, marketing, etc)
• Fortification and biofortification
• Creating awareness about nutritious diet (in schools, through media)
• Role of local institutions (e.g., LHW)
• Strengthen PINS and SUN through appropriate monitoring and evaluation

There is an urgent need for sound policy research and action
I was hungry,
and you formed a committee to investigate my hunger;
I was homeless,
and you filed a report on my plight;
I was sick,
and you held a seminar on the situation of the under-privileged;
You investigated all aspects of my plight
and yet I am still hungry, homeless and sick.

Thank you so much