food & beverage processing industry growth pathways · pdf filefood & beverage...
TRANSCRIPT

RuRal Development InstItute
Food & Beverage Processing Industry Growth Pathways to 2020
rDi researchersWilliam Ashton (Director) • Gillian Richards (Project Lead)Eleni Galatsanou (Research Assistant) • Ray Bollman (Research Affiliate) Copyright © April 2014

rural Development institute, Brandon universityBrandon University established the Rural Development Institute in 1989 as an academic research centre and a leading source of information on issues affecting rural communities in Western Canada and elsewhere.
RDI functions as a not-for-profit research and development organization designed to promote, facilitate, coordinate, initiate and conduct multi-disciplinary academic and applied research on rural issues. The Institute provides an interface between academic research efforts and the community by acting as a conduit of rural research information and by facilitating community involvement in rural development. RDI projects are characterized by cooperative and collaborative efforts of multi-stakeholders.
The Institute has diverse research affiliations, and multiple community and government linkages related to its rural development mandate. RDI disseminates information to a variety of constituents and stakeholders and makes research information and results widely available to the public either in printed form or by means of public lectures, seminars, workshops and conferences.
For more information, please visit www.brandonu.ca/rdi.
This applied research project answers a simple question: how big will the Manitoba food and beverage processing industry be in 2020? Given the current, considerable size of the sector, finding that answer requires some effort.
The food and beverage processing (FBP) industry is a major economic contributor, representing 28% of all manufacturing revenue1 in the province and 15% of all exports2. This industry employees more than 12,000 people1, representing nearly one of every four persons (22%) employed in manufacturing. Nationally, Manitoba’s FBP represents 5% of sales2 within the national industry and 7% of international exports.2
Reviewing existing food and beverage sales data, we find that the recent growth in sales could form a basis for estimating sales in 2020. Cognizant that the industry’s many sectors may grow or decline independent of one another, this project will need to examine all parts to understand the industry as a whole.
An important consideration is the proportion of large companies to small businesses, and their resulting shares of sales. Equally important is how the various sectors grow. One may add another shift of workers within an existing manufacturing facility, enabling a relatively fast spike in sales. Another may require significant investment - building a new plant and recruiting a significant number of new employees - to achieve measured growth though a longer series of stages. Still another sector’s sales may parallel population growth.
At best, detailed data contributes a snapshot of the past and present sales and related exports. To create a data base, we will validate estimates of projected sales to 2020 with industry , the working knowledge held by experts in the various sectors and for the entire industry. These considerations of growth are essential in estimating food and beverage industry sales for the future.
Within the scope of this project, four objectives are pursued:
• Identifying trends in sales and distinguishing key drivers of the FBP industry;
• Envisioning two to three scenarios for industry growth to 2020;
• Identifying opportunities and challenges across the various industry sectors; and
• Noting public policy implications related to any issues which may inhibit growth.
This report describes the research methods, findings and concludes with growth pathways for the FBP industry to 2020.
Introduction
Food and Beverage Processing Industry Growth Pathways to 2020 1
1. Stats Canada, Annual Survey of Manufactures and Logging – 2103,Table 301-0006 Principal statistics for manufacturing industries (2011)2. Industry Canada, Industry Canada Canadian Trade Data Online, Canadian Total Exports (2012)
This research was supported and funded by Manitoba Agriculture, Food and Rural Development
(MAFRD)
Acknowledgements
All the industry stakeholders who participated in this research.

Research Methods
2 Food and Beverage Processing Industry Growth Pathways to 2020
A mixed method approach enabled the collection and analysis of quantitative and qualitative data from available sources and industry experts or stakeholders.
Data CollectionData was collected in two ways: via publicly available information from Statistics Canada, based on North American Industry Classification System - NAICS; and from stakeholders.
See Table 1. Sectors and Sub-sectors of the Food and Beverage Processing Industry NAICS Codes located to the right.
As noted in Table 1, each industry sector contains sub-sectors. For example, pork is the major business within ‘Meat Product Manufacturing’ but poultry, beef, and other meats are listed industries. Under ‘Grains and Oilseed Milling’, canola is the dominant industry. For ‘Fruit and Vegetable Manufacturing’, the potato industry is tops in sales.
To ensure reasonable estimated sales data, and fill in the data gaps regarding growth potential to 2020, corroborating data was collected. Industry-related opinion leaders were interviewed from all sizes of companies (large, medium, and small), a range of sectors, the industry as a whole, and sectors in different developmental stages (early start-up to mature and well-established). In total, 25 in-depth interviews were completed, 17 in-person and eight by phone. Those interviewed represent companies, associations, affiliates, government and academics, and a purposeful sampling strategy ensured participants from the following categories:
• Dominant sub-sectors of pork, canola, and potato;
• Existing companies currently operating in Manitoba across 9 NAICS codes sectors excluding pork, canola, and potato; and
• New start-up companies from NAICS code sectors including ‘Meat’, ‘Fruit and Vegetable’, ‘Dairy’, ‘Grains’, and ‘Beverage’, recommended by opinion leaders.
Data AnalysisQuantitative and qualitative data were analyzed using different methods.
QuAntitAtive DAtA AnAlysis
Numeric data required a five step analysis:
step 1 The research team, with assistance from Statistics Canada (Ottawa), created a sales profile of the ten NAICS sectors from 1992 to 2011, despite sparse data in some sectors.
step 2 Regression analysis was used to estimate 2011 sales and calculate the linear projection of sales for the sectors to 2020. The regression coefficient (R2) value was low for sectors with limited data, thus reducing confidence in the straight-line projection. Please see Appendix A for the projections.
step 3 The estimated 2011 sales for each sector were combined to give an overall FBP industry sales volume, as noted in Figure 1.
step 4 The projections for each of the ten sectors were combined to form a linear projection for the FBP industry. These projections were revised during interviews with industry opinion leaders.
step 5 Individual sales estimates for 2011 and the projections to 2020 were combined from all the sectors to portray the overall sales for the FBP industry.
See Figure 1. Sector Estimates of the Manitoba Food and Beverage Processing Industry (2011) located to the right.
QuAlitAtive DAtA AnAlysis
Thematic analysis of interview data involved two steps:
step 1 Interview data was organized in relation to the projections to 2020 for each sector and the industry as a whole, including two possible outcomes for the pork and potato sub-sectors. Elsewhere, 2020 sales were generally given
3
table 1. sectors and sub-sectors of the Food and Beverage processing industry nAiCs CodesnAiCs seCtor suB-seCtors3111 Animal Food Manufacturing Animal feed, dog and cat food 3112 Grain and Oilseed Milling Oilseed processing, Flour milling 3113 Sugar and Confectionery
Product ManufacturingSugar, chocolate
3114 Fruit and Vegetable Manufacturing
Frozen food, canning, pickling
3115 Dairy Product Manufacturing
Fluid milk, cheese, butter, ice cream
3116 Meat Product Manufacturing
Pork, poultry, beef, lamb
3117* Seafood Product Preparation and Packaging
Canning seafood, smoking, drying
3118 Bakeries and Tortilla Manufacturing
Retail and commercial bakeries, cookie, pasta, flour mixes, tortilla
3119 Other Food Manufacturing Eggs, snack food, coffee, seasoning 3121 Beverage Product
ManufacturingSoft drinks, breweries, wineries, water
Source: Statistics Canada: Catalogue #12-501-X, North American Industry Classification System (NAICS) Canada 2012*Seafood 3117 was not examined in this research but was included in overall numbers.
as estimates based on the trends in each sector. The data and projections were used to form scenarios, with only the industry projection reported in detail to maintain confidentiality.
step 2 Interview data was organized in main themes and sub-themes related to drivers for outlook and opportunities.
limitAtions
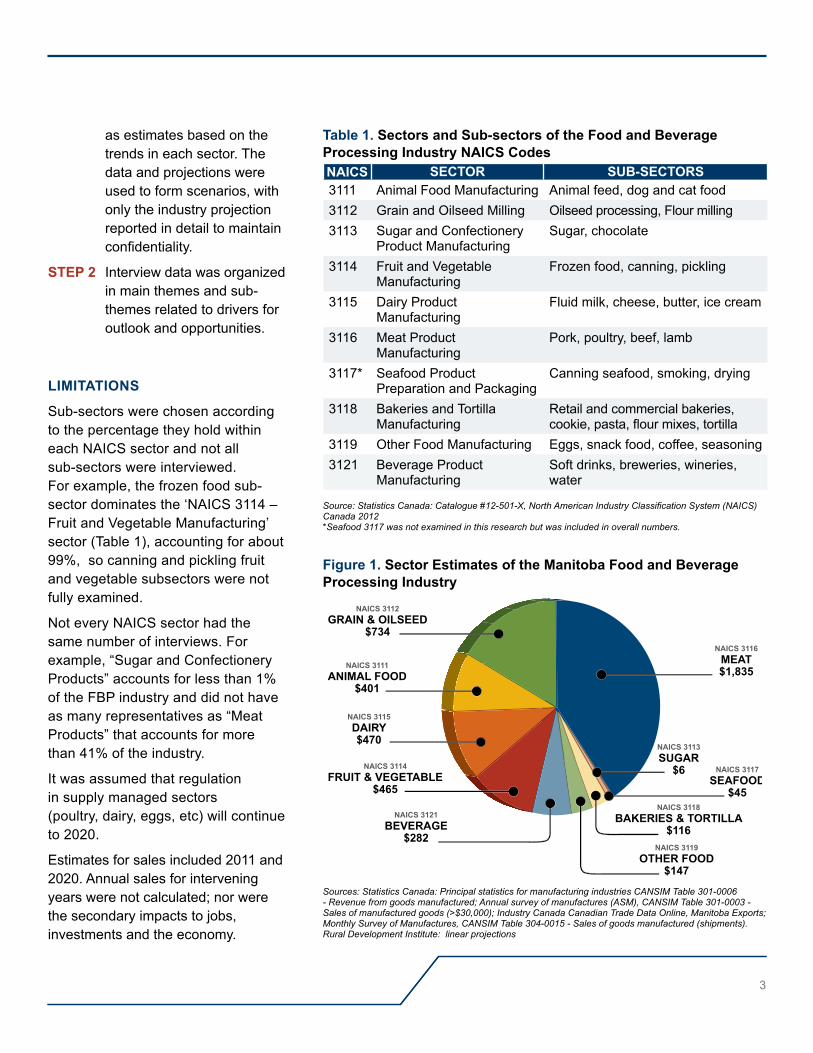
Sub-sectors were chosen according to the percentage they hold within each NAICS sector and not all sub-sectors were interviewed. For example, the frozen food sub-sector dominates the ‘NAICS 3114 – Fruit and Vegetable Manufacturing’ sector (Table 1), accounting for about 99%, so canning and pickling fruit and vegetable subsectors were not fully examined.
Not every NAICS sector had the same number of interviews. For example, “Sugar and Confectionery Products” accounts for less than 1% of the FBP industry and did not have as many representatives as “Meat Products” that accounts for more than 41% of the industry.
It was assumed that regulation in supply managed sectors (poultry, dairy, eggs, etc) will continue to 2020.
Estimates for sales included 2011 and 2020. Annual sales for intervening years were not calculated; nor were the secondary impacts to jobs, investments and the economy.
Figure 1. sector estimates of the manitoba Food and Beverage processing industry
Sources: Statistics Canada: Principal statistics for manufacturing industries CANSIM Table 301-0006 - Revenue from goods manufactured; Annual survey of manufactures (ASM), CANSIM Table 301-0003 - Sales of manufactured goods (>$30,000); Industry Canada Canadian Trade Data Online, Manitoba Exports; Monthly Survey of Manufactures, CANSIM Table 304-0015 - Sales of goods manufactured (shipments). Rural Development Institute: linear projections
NAICS 3112GRAIN & OILSEED
$734
NAICS 3114FRUIT & VEGETABLE
$465
NAICS 3111ANIMAL FOOD
$401
NAICS 3115DAIRY$470
NAICS 3116MEAT$1,835
NAICS 3113SUGAR
$6
NAICS 3118BAKERIES & TORTILLA
$116NAICS 3121
BEVERAGE$282
NAICS 3119OTHER FOOD
$147
NAICS 3117SEAFOOD
$45

4 Food and Beverage Processing Industry Growth Pathways to 2020
This section serves to answer our research question, “How big will the Manitoba food processing and beverage industry be in 2020?”
industry profile and Future outlookGiven the many sectors and sub-sectors, coupled with a general lack of data, a detailed answer with high accuracy and confidence is not possible. Instead, the future is best described by dividing Manitoba’s FBP industry into certain definable groups and examining the opportunities evident for those groups.
The first group contains the largest sub-sectors of pork, canola, and potatoes. The second group includes other established companies. A third group is comprised of new and emerging companies.
Group 1 lArGest suB-seCtors pork, Canola, and potatoes
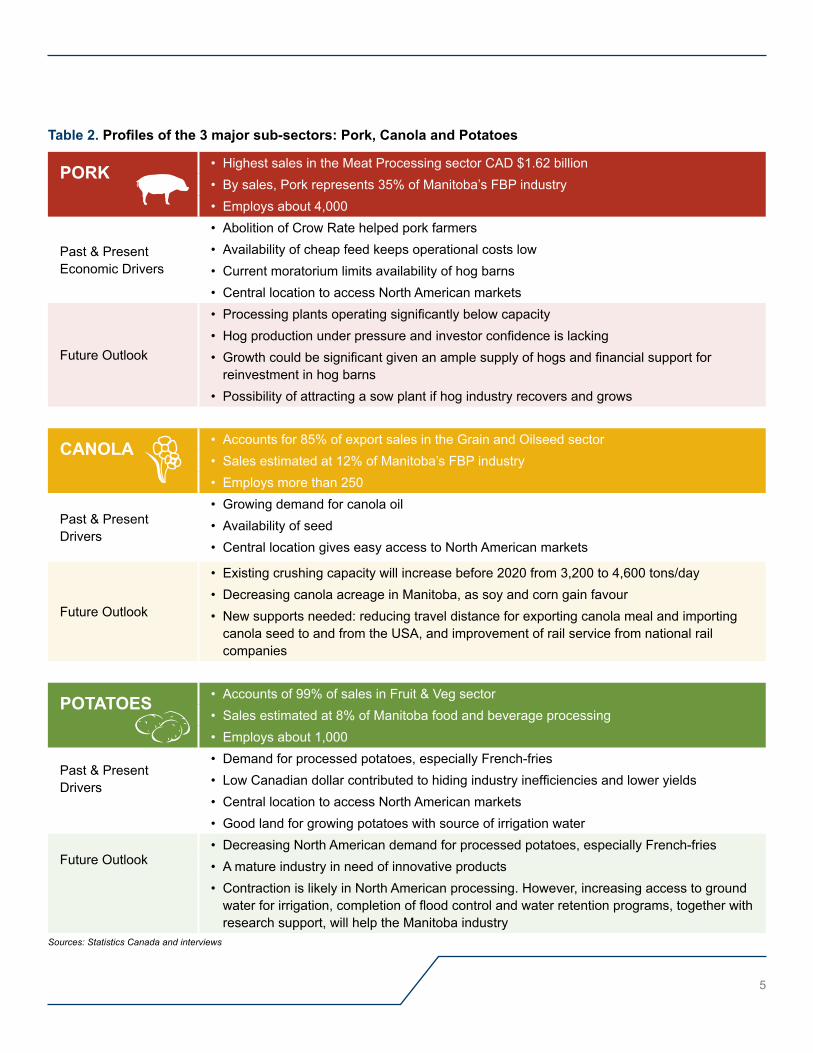
These three sub-sectors produce 55% of sales in the food and beverage industry with an estimated value of CAD $2.578 billion in 2011. Combined, they operate about 10 plants and employ around 5,250 people. Most of their production is exported, so their main reasons for doing business in Manitoba are the availability and low cost of raw product. Other important drivers are exchange rates, a central location for exporting and transferring product, the low cost of production, and access to quality water for processing. These sub-sectors are profiled in Table 2.
See Table 2. Profiles of the 3 major sub-sectors: Pork, Canola and Potatoes located to the right.
Research Findings
5
table 2. Profiles of the 3 major sub-sectors: Pork, Canola and Potatoes
porK • Highest sales in the Meat Processing sector CAD $1.62 billion• By sales, Pork represents 35% of Manitoba’s FBP industry• Employs about 4,000
Past & Present Economic Drivers
• Abolition of Crow Rate helped pork farmers • Availability of cheap feed keeps operational costs low• Current moratorium limits availability of hog barns• Central location to access North American markets
Future Outlook
• Processing plants operating significantly below capacity• Hog production under pressure and investor confidence is lacking• Growth could be significant given an ample supply of hogs and financial support for
reinvestment in hog barns• Possibility of attracting a sow plant if hog industry recovers and grows
CAnolA
• Accounts for 85% of export sales in the Grain and Oilseed sector • Sales estimated at 12% of Manitoba’s FBP industry• Employs more than 250
Past & Present Drivers
• Growing demand for canola oil• Availability of seed• Central location gives easy access to North American markets
Future Outlook
• Existing crushing capacity will increase before 2020 from 3,200 to 4,600 tons/day• Decreasing canola acreage in Manitoba, as soy and corn gain favour• New supports needed: reducing travel distance for exporting canola meal and importing
canola seed to and from the USA, and improvement of rail service from national rail companies
potAtoes
• Accounts of 99% of sales in Fruit & Veg sector• Sales estimated at 8% of Manitoba food and beverage processing• Employs about 1,000
Past & Present Drivers
• Demand for processed potatoes, especially French-fries • Low Canadian dollar contributed to hiding industry inefficiencies and lower yields• Central location to access North American markets• Good land for growing potatoes with source of irrigation water
Future Outlook
• Decreasing North American demand for processed potatoes, especially French-fries• A mature industry in need of innovative products• Contraction is likely in North American processing. However, increasing access to ground
water for irrigation, completion of flood control and water retention programs, together with research support, will help the Manitoba industry
Sources: Statistics Canada and interviews
Source: interviews

6 Food and Beverage Processing Industry Growth Pathways to 2020
Group 2 other- existinG CompAnies established Companies Currently operating in manitoba
Even without the three major sub-sectors from Group 1, the companies in this Group represent each of the ten NAICS sectors. All told in 2011, Existing Companies generated 45% of sales (CAD $2.115 billion) in the FBP industry (Table 3 and Figure 2) and employed some 6,800 people. This group exported 20% of its production; the remaining 80% of sales served the Manitoba market. About 35% of sales were from supply-managed sectors (dairy, chicken, eggs), and the remaining 45% from other sectors, including ‘Bakeries’ and ‘Animal Food’.
table 3. estimated numbers of employees and sales for existing Companies, 2011
existinG CompAnies estimAteD employees
sAles estimAtes For 2011
other meat (without pork) 2294 $335
Other Grain & Oilseeds (without canola) 379 $293
other Fruit & vegetables (without potatoes) N/A $4.2
Animal Food 572 $415.6
Dairy product N/A $470
Bakeries & tortilla N/A $116.5
sugar & Confectionery 64 $6.2
other Food N/A $147.2
Beverage 1035 $282.2
seafood N/A $44.7
totAl 6780 $2,115
Figure 2. estimates of sales for 2011 for pork, Canola, potatoes and existing Companies ($2012m)
NAICS 3116PORK$1,620
NAICS 3114OTHER VEGETABLES
$4
NAICS 3121BEVERAGE
$282
NAICS 3114POTATO
$413
NAICS 3112CANOLA
$545
NAICS 3112OTHER GRAINS
& OILSEED$293
NAICS 3116OTHER MEAT
$335
NAICS 3115DAIRY PRODUCT
$470
NAICS 3111ANIMAL FOOD
$416NAICS 3119
OTHER FOOD$147
NAICS 3117SEAFOOD
$45
NAICS 3118BAKERIES &
TORTILLA$116
NAICS 3113SUGAR &
CONFECTIONERY$6
Sources: CANSIM Table 301-0006, Revenue from Goods Manufactured; RDI linear projections; interviews

7
The main driver for Other Existing Companies is demand from Manitoba. Commodity, transportation, and labour costs are other important considerations, as 11% of this Group’s sales target international export markets. The outlook for Other Existing Companies in most sectors is stable growth towards 2020, largely based on population increase, and changes in demographics and eating habits. Growth also depends on expanding “Buy Manitoba” programs, simplification and modernization of regulations, commercialization support, ease of access to and quick approval of financial support. Rationalization of taxes, including payroll tax, to ensure that they do not discourage business expansion, would also help growth.
Group 3 new CompAny opportunities start-up Companies or new Companies to manitoba
Start-up companies and new, companies expanding into Manitoba represent the two categories of New Company Opportunities in the FBP industry.
Start-ups are defined as companies that did not register sales in 2011, from across all FBP industry sectors. These companies are mainly driven by market trends and the availability, variety, and low cost of raw product. Low production cost in Manitoba and good quality of raw products are two important drivers. The majority of these companies target markets described by opinion leaders in terms of “Buy local – Buy Manitoba”, “made with natural ingredients”, and “specialty and niche markets”.
The future outlook of start-up companies, as described by opinion leaders, could contribute an estimated CAD $74 million in annual sales by 2020, mainly from ‘Meat’ (67%),’ Fruit and Vegetable’ (27%), and other sectors including ‘Dairy’ and ‘Beverage’ (6%). Research centers in Manitoba can provide a source of potential ideas for these start-ups with other supports assisting the rapid commercialization of products destined for processing plants.
Image Source: Manitoba Food Processors Association

8 Food and Beverage Processing Industry Growth Pathways to 2020
New companies could be either large corporations currently operating outside Manitoba with potential to establish a new business in the province, or companies already established in the province with the potential to build new processing plants here. New, big companies are mainly driven by the availability and low cost of raw product, combined with economical production. Timely completion of studies and infrastructure (e.g., environmental studies, building permits, and water management), a pro-business attitude from government, and a stable and effective regulatory environment are main drivers for these companies to establish here instead of other provinces.
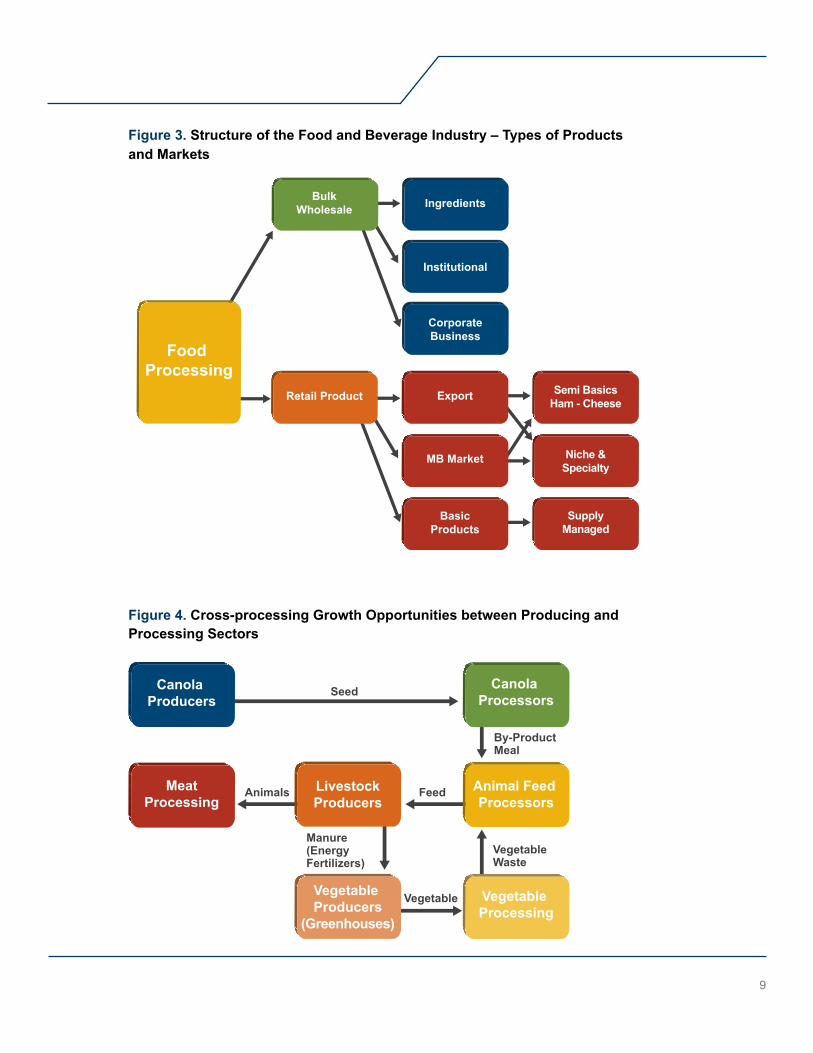
While the future is difficult to predict, a more certain opportunity regarding new companies is adding processing to produce bulk ingredients. Possibilities in the ‘Meat’, ‘Grains and Oilseeds’, and ‘Dairy’ sectors were identified by opinion leaders, with the caveat that 2020 projections are difficult given the lack of available details. In general, the bulk ingredient market is illustrated in Figure 3.
See Figure 3. Structure of the Food and Beverage Industry – Types of Products and Markets located to the right.
In Figure 3, ‘Bulk - Wholesale’ represents processed ingredients but not finished products. Typically finished product manufacturing requires a nearby market with a large populations which Manitoba does not have. Bulk wholesale processing involves large volumes and business to business transactions; avoiding the complications of the retail market, such as consumer labeling and retail shelf space. Opportunities for ‘Niche and Specialty’ retail products exist for export markets and domestic shelves.
Another growth opportunity in the FBP industry takes advantage of the symbiotic linkages among various industry sectors. An example is given in Figure 4, where a healthy livestock industry benefits meat processors by providing raw product; animal feed processors by
creating a market; canola processors because of the need for canola meal. “Waste” manure could provide power and fertilizer for green houses, triggering vegetable production and processing. Figure 4 conceptually points to possible synergies in the FBP industry, if examined as a holistic system.
See Figure 4. Cross-processing Growth Opportunities between Producing and Processing Sectors located to the right.
summAry oF inDustry Drivers AnD outlooK
To recap, pork, canola, and potatoes are the largest of sub-sectors as measured in exports and jobs, accounting for 55% (CAD $2.58 billion) of annual sales in Manitoba’s FBP industry. Their importance cannot be underestimated nor ignored when plotting the future.
The companies in the remaining sectors and sub-sectors are many, tallying 45% (CAD $2.11 billion) of industry sales in 2011. For most of these companies, their growth largely depends on an increasing population in Manitoba. Significant growth depends on increasing exports. One industry opinion leader summed up future growth: “… our growth will be in the ingredient side of things, further processed but not finished products. We should get any niche that we can but we should not expect them to grow into large businesses...”
9
Figure 3. structure of the Food and Beverage industry – types of products and markets
Figure 4. Cross-processing Growth opportunities between producing and processing sectors
Institutional
CorporateBusiness
Ingredients
Semi BasicsHam - Cheese
Niche &Specialty
SupplyManaged
BulkWholesale
Retail Product
MB Market
BasicProducts
Export
Food Processing
Seed
By-ProductMeal
VegetableWaste
Manure(Energy Fertilizers)
Animals Feed
Vegetable
Canola Producers
Animal Feed Processors
Vegetable Producers
(Greenhouses)
Vegetable Processing
Canola Processors
MeatProcessing
LivestockProducers

10 Food and Beverage Processing Industry Growth Pathways to 2020
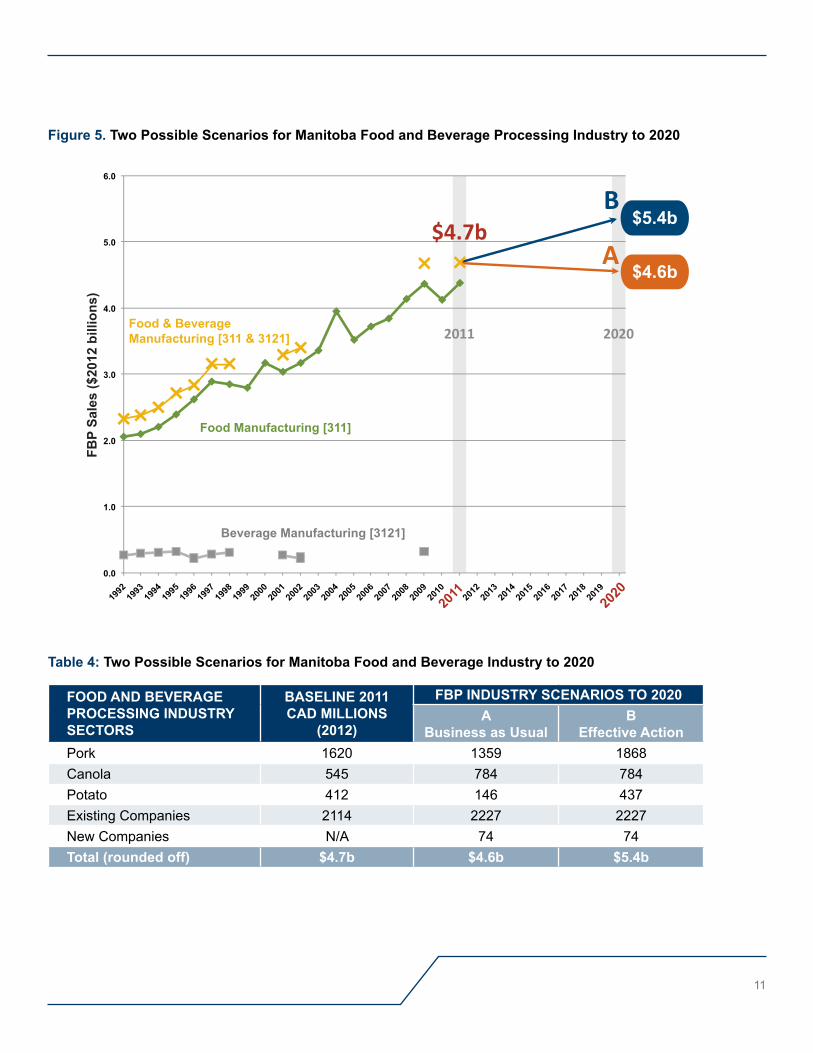
2020 scenarios for Food and Beverage industry in manitoba“How big will the Manitoba FBP industry be in 2020?” To answer, we establish a credible estimate for 2011 called the “base line”, with limited available sales data from across the ten industry sectors. Using that, sales estimates to 2020 are projected and validated by industry opinion leaders, resulting in two outlooks. Scenario A foreshadows business as usual with little-to-no-changes in the current business environment. Scenario B explores effective action, that improves supply of raw product, plants in full operation, synergies across sectors realizing revenues, and reducing costs.
Scenarios A and B are presented in Figure 5 and Table 4, and further described below. The pork and potato sub-sectors are dominant in explaining the differences in the annual sales in the FBP industry. There is also significant growth expected in canola and the other sub-sectors.
BAse line 2011
The base line estimates annual sales in 2011 for three groupings of sectors and sub-sectors. As noted above in Figure 2, the three major sub-sectors of pork (CAD $1.6 billion), canola (CAD $0.54 billion), and potatoes (CAD $0.41 billion) account for 55% of sales or an estimated CAD $2.58 billion. All the other existing companies account for 45% or CAD $2.11 billion in annual sales. Overall, sales in 2011 are estimated to total CAD $4.69 billion.
See Figure 5. Two Possible Scenarios for Manitoba Food and Beverage Processing Industry to 2020 located to the right.
See Table 4: Two Possible Scenarios for Manitoba Food and Beverage Industry to 2020 located to the right.
sCenArio A - Business As usuAl
The “Business as Usual” Scenario A depicts shrinkage from 2011 to 2020, as pork and potato sub-sectors continue to operate at less than optimal production. Overall, the FBP industry shrinks from CAD $4.7 billion annual sales in 2011 to CAD $4.6 billion by 2020, a decrease of CAD $100 million or 2.2%, with an associated reduction in jobs and investments.
For the pork sub-sector, existing processing plants were operating under-capacity in 2011 with estimated annual sales of CAD $1.6 billion. In order for the plants to remain efficient and competitive, operation at a minimum of 97% capacity is required. The lack of hogs which pushed processing below capacity continues today. By 2020, a continued shortage would mean the processing plants operating below 80% capacity, reflected in lower annual sales estimated at CAD $1.4 billion by 2020. This is a decrease of CAD $260 million in annual sales from 2011.
For the potato sub-sector, existing processing plants are currently operating under capacity and have reduced potato contracts with growers. Opinion leaders flagged two key points: an anticipated contraction in the North American potato processing capacity and that Manitoba plants are currently not as cost efficient as plants in other jurisdictions. This is mainly due to the high cost of raw product (potatoes) compared to the USA. Low yields, in combination with a relatively high Canadian dollar, may precipitate reduced sales by 63% to CAD $150 million, and a resulting reduction of approximately CAD $270 million per year in annual sales in 2020. There would also be an expected loss in the agricultural industry, jobs, local economy, and re-investment.
11
Figure 5. two possible scenarios for manitoba Food and Beverage processing industry to 2020
B
A$4.7b
2011 2020
FBP
Sale
s ($
2012
bill
ions
)
FooD AnD BeverAGe proCessinG inDustry seCtors
BAseline 2011CAD millions
(2012)
FBp inDustry sCenArios to 2020A
Business as usualB
effective ActionPork 1620 1359 1868Canola 545 784 784Potato 412 146 437Existing Companies 2114 2227 2227New Companies N/A 74 74total (rounded off) $4.7b $4.6b $5.4b
Table 4: two possible scenarios for manitoba Food and Beverage industry to 2020
12 Food and Beverage Processing Industry Growth Pathways to 2020
SCenario B: effeCTive aCTion
Many opinion leaders expect significant growth in the FBP industry, which requires effective action by many within industry and government. Scenario B depicts growth in the pork sub-sector and retention of capacity in the potato sub-sector. Overall, the FBP industry grows from CAD $4.7 billion in 2011 annual sales to CAD $5.4 billion by 2020, an increase of CAD $700 million in annual sales or 15%, with expected increases in jobs and investments.
For the pork sub-sector, ‘Effective Action’ by industry and government would utilize existing plant capacity in response to increased demand for pork in Asia and entry into the European market. Growth will result from investment that expands barn capacity, increasing hog supply and driving processing plants to 100% capacity, with a Saturday shift also being added. By 2020, the pork sector would be contributing CAD $1.9 billion, an increase of CAD $250 million in annual sales.
‘Effective Action’ for the potato sub-sector would result in retention of the industry in Manitoba with potential opportunities for growth of export markets. In this mature industry, past growth trends are unlikely to repeat in the future but increases in potato yields in the coming years will help restore competitiveness of the Manitoba plants (in comparison to their North American and global competitors). To regain competitiveness, the cost of potatoes needs to be reduced by increasing potato yields from the current 320 to 365 hundredweight per acre. This can be achieved by improving research and application of “best practices” among producers, coupled with enhancing the availability of water for irrigation. As a result, the potato sector by 2020 can be contributing CAD $437 million, an increase in annual sales of CAD $24 million from the 2011 value.
summAry oF sCenArios to 2020
The ‘Business as Usual’ Scenario A reveals a decrease in annual sales from 2011 to 2020, estimated at CAD $100 million. ‘Effective Action’ Scenario B requires activation of growth, with particular emphasis on pork and potato sub-sectors. In both Scenarios, the canola sub-sector and other Existing Businesses continue to experience modest growth. With no change by industry or government, the ‘Business as Usual’ Scenario A will not only lose an estimated CAD $100 million in annual sales from 2011 but represent a lost opportunity reaching as much as CAD $700 million a year by 2020 in unrealized sales when compared with ‘Effective Action’ Scenario B. Both scenarios indicate a significant opportunity for industry and government to initiate immediate planning, decision making and collaborative action.
The main pathway to growth in the FPB industry means all sectors growing in Manitoba with effective action by industry and government. The pork and potato sub-sectors need different actions to ensure growth, as does canola. Along with immediate collaborative action between industry and government for both pork and potato, a strategic action plan would help coordinate the specific actions, resources, and timing necessary for growth in the other industry sectors and sub-sectors.
The FBP industry in Manitoba is strong and diverse, from small, ma-and-pa bakeries to multi-national, billion dollar companies. Continued healthy growth in the sector depends on retaining and expanding Manitoba’s strengths: a supply of high quality pork, potato, and canola products; good transportation links; adequate power and water supplies; and support for start-up and existing companies. A jointly-developed strategic plan would provide common vision, give direction, and improve the investment climate. Opinion leaders across many sectors spoke of the need for a more effective, efficient regulatory system, and easier access to expert support in supply-chain management and marketing, including access to “local markets”.
Primary processing of agricultural products in Manitoba, directed to bulk ingredients markets, takes advantage of the province’s ability to create high quality agricultural products and it’s central geographic location in the continent. Maintaining the supply of quality, competitively priced raw product for processing is an important ingredient for growth, as is the support for existing and developing companies, and attracting new processors for Manitoba’s raw agricultural products. Opportunities for producers and processors are realized when they work together to take advantage of cross-processing efficiencies and new revenue opportunities among different sectors.
13
Food & Beverage Processing Pathways
Niche and specialty products also represent opportunities for growth in Manitoba’s FBP industry. Small and medium-sized companies can expand their service to the provincial market or grow with exports into specialized markets. Manitoba’s strengths are quality agricultural products and strong research institutions. With a long-term commitment to support innovation and foster new companies in niche and specialty products or ingredients, growth will occur in small and medium enterprises across many sub-sectors in the FBP industry.

14 Food and Beverage Processing Industry Growth Pathways to 2020
• In-depth study of major sub-sectors (pork, canola & potatoes), Existing companies, New companies (attracting new companies to the province and supporting innovation and start-ups)
• Examine ways that public policy can improve the regulatory system and its enforcement collaboration with industry and government. Interviewees suggested:
Revise regulations in a way that ensures regulations are based on logic and science, harmonized with Federal regulatory system, transparent, and stable. Create “One point access” to regulatory navigation.
• Study the obstacles and recommend options for improving the access of local processors to the retail market; through expansion of the Buy Manitoba program or other initiatives.
Further Research
15
Background data for interviews with opinion leaders in the Food and Beverage processing (FBp) industry in manitobaThe information in Appendix A was provided to FBP industry opinion leaders who were interviewed for this research. The materials consist of three parts: a brief introduction to the research project; a general profile of the current FBP industry in Manitoba with overviews of the various sectors and their sales based on estimates from Statistics Canada data (Figure 1); and a specific graphic depiciting the available data for each sector and a linear regression projection to 2020.
The linear projections given in this appendix are not reliable due to limited data. The 2020 estimated dollar values reflect the insights of opinion leaders, but are still estimates.
Food and Beverage processing industry in manitobareseArCh ACtivities
This research is funded by Manitoba Agriculture, Food and Rural Development (MAFRD) and the research is completed by the Rural Development Institute (RDI).
The purpose of this research is to analyze Manitoba’s Food & Beverage Processing Industry, identify key trends, and envision progress of the industry to 2020. In addition, this research will attempt to identify key opportunities for public policy to positively impact the growth of the Food Processing sector.
The project team will conduct semi-structured interviews with participants to identify opportunities and innovation but also barriers and challenges. Participants and stakeholders will also validate the research findings. One of the outcomes of the research will be to illustrate pathways that can assist the Food Processing industry to drive growth.
reseArCh pArtiCipAnts
The participants for this research consist of food producers and food processing associations and processors, industry and government representatives operating in Manitoba.
• A minimum of 2 participants in each major sub-sector of the food processing industry will be engaged in the research.
• Leaders with a knowledge of each industry or sub-sector will be the target sample for each sub-sector.
mAnitoBA FooD AnD BeverAGe proCessinG inDustry
MB sales - CAD $4.6 billion in 2011
MB international exports - CAD $1.5 billion in 2011
5.3% of Canada’s food processing sales, 3.6% in 1992
Meat processing sector has: 19% of Establishments 57% of Employees
Honey is a CAD $21.4 million industry in MB (2012), 14.5% of Canada’s production (3rd largest province)
MB’s international Oat exports ($45 million) represent 58.5% of Canada’s total.
Food processing is a major contributor to Manitoba’s economy, representing 28% of Manitoba’s manufacturing output and 15% of its total provincial exports. (2012)
Appendix
16 Food and Beverage Processing Industry Growth Pathways to 2020
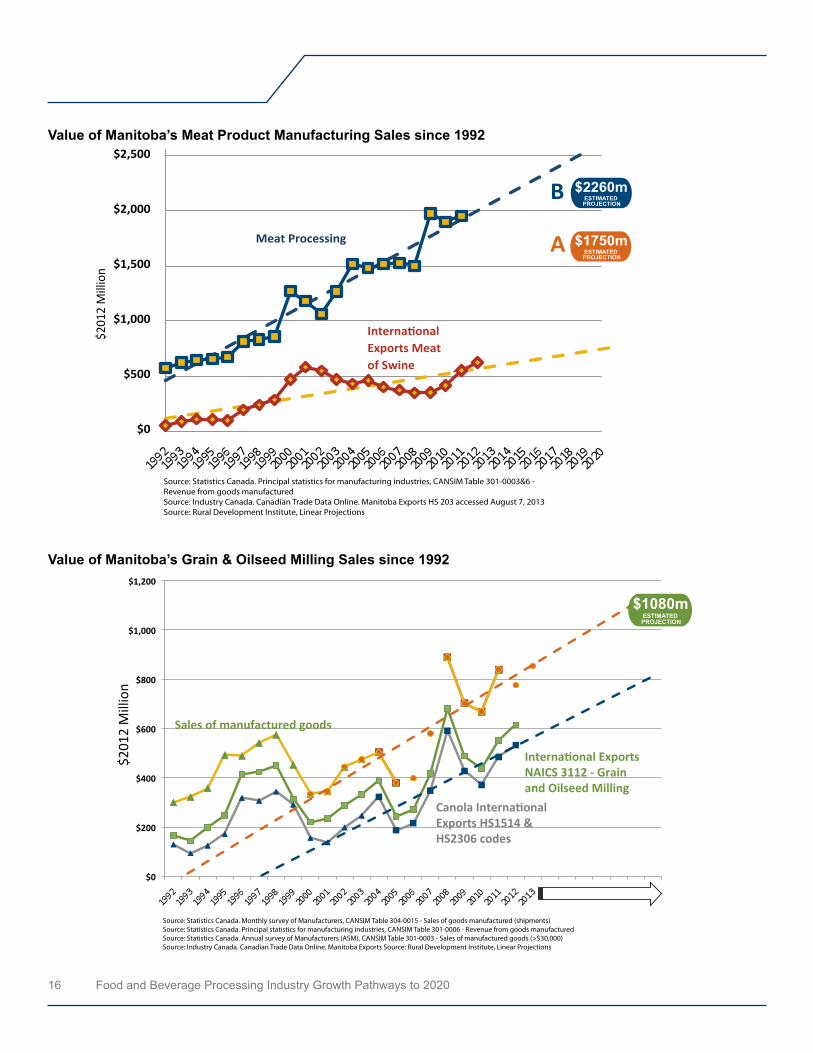
value of manitoba’s meat product manufacturing sales since 1992
value of manitoba’s Grain & oilseed milling sales since 1992
$0
$200
$400
$600
$800
$1,000
$1,200
Sales of manufactured goods
International ExportsNAICS 3112 - Grainand Oilseed Milling
Canola InternationalExports HS1514 & HS2306 codes
$201
2 M
illio
n
Source: Statistics Canada. Monthly survey of Manufacturers, CANSIM Table 304-0015 - Sales of goods manufactured (shipments)Source: Statistics Canada. Principal statistics for manufacturing industries, CANSIM Table 301-0006 - Revenue from goods manufacturedSource: Statistics Canada. Annual survey of Manufacturers (ASM), CANSIM Table 301-0003 - Sales of manufactured goods (>$30,000)Source: Industry Canada. Canadian Trade Data Online. Manitoba Exports Source: Rural Development Institute, Linear Projections
ESTIMATED PROJECTION
$1080m
$0
$500
$1,000
$1,500
$2,000
$2,500
Meat Processing
International Exports Meatof Swine .
$201
2 M
illio
n
Source: Statistics Canada. Principal statistics for manufacturing industries, CANSIM Table 301-0003&6 - Revenue from goods manufacturedSource: Industry Canada. Canadian Trade Data Online. Manitoba Exports HS 203 accessed August 7, 2013Source: Rural Development Institute, Linear Projections
B
A
ESTIMATED PROJECTION
$2260m
ESTIMATED PROJECTION
$1750m

17
value of manitoba’s Fruit & vegetable manufactured sales and exports since 1992
value of manitoba’s Dairy product manufacturing sales since 1992
$0
$100
$200
$300
$400
$500
$600
$201
2 M
illio
n
International exports
Sales frommanufactured goods
#############################################%"%"#
Source: Statistics Canada. Principal statistics for manufacturing industries, CANSIM Table 301-00003 & 6 - Revenue from goods manufacturedSource: Industry Canada. Canadian Trade data Online. Manitoba ExportsSource: Rural Development Institute, Linear Projection
A ESTIMATED PROJECTION
$170m
B ESTIMATED PROJECTION
$461mPoints used in linear projection
$0
$100
$200
$300
$400
$500
$600
Dairy sales 301-0003&6
International Exports
Sales of goods manufactured(shipments) 304-0015
$201
2 M
illio
n
Source: Statistics Canada. Monthly survey of Manufacturers, CANSIM Table 304-0015 - Sales of goods manufactured (shipments)Source: Statistics Canada. Principal statistics for manufacturing industries, CANSIM Table 301-0003&6 - Revenue from goods manufacturedSource: Industry Canada. Canadian Trade Data Online. Manitoba Exports Source: Rural Development Institute, Linear Projections
ESTIMATED PROJECTION
$537m
18 Food and Beverage Processing Industry Growth Pathways to 2020
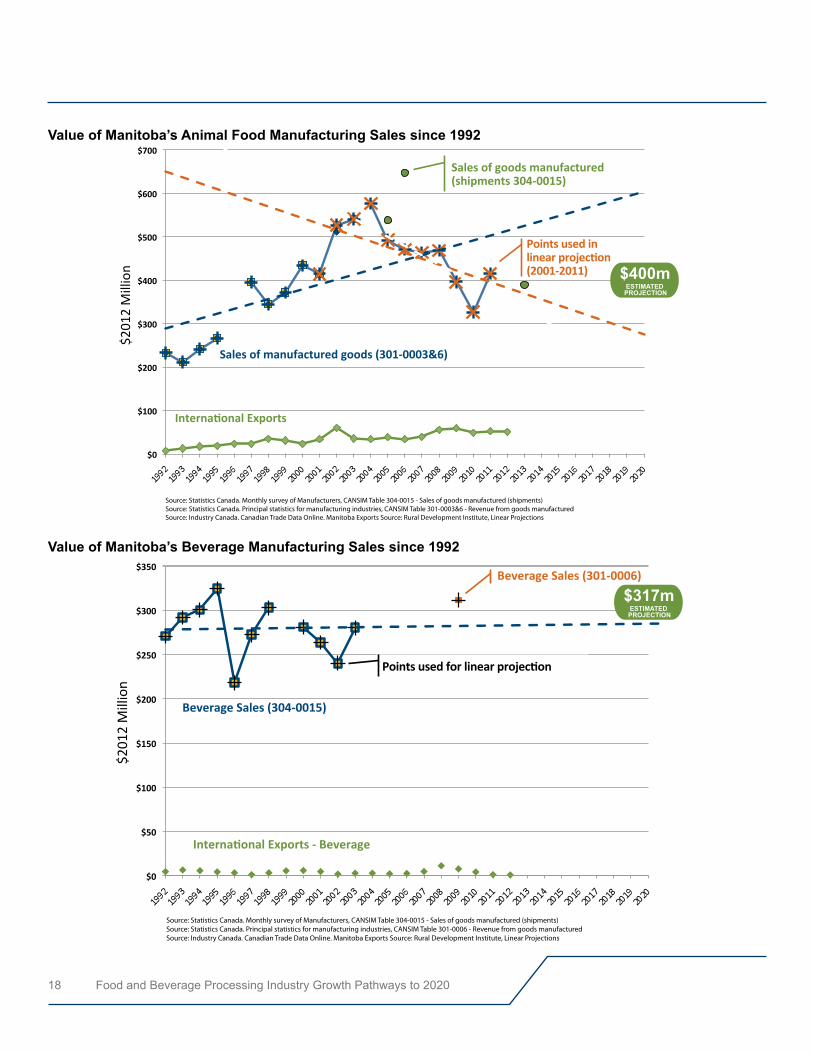
value of manitoba’s Animal Food manufacturing sales since 1992
value of manitoba’s Beverage manufacturing sales since 1992
$0
$50
$100
$150
$200
$250
$300
$350
$201
2 M
illio
n
Beverage Sales (304-0015)
International Exports - Beverage
Points used for linear projection
Beverage Sales (301-0006)
Source: Statistics Canada. Monthly survey of Manufacturers, CANSIM Table 304-0015 - Sales of goods manufactured (shipments)Source: Statistics Canada. Principal statistics for manufacturing industries, CANSIM Table 301-0006 - Revenue from goods manufacturedSource: Industry Canada. Canadian Trade Data Online. Manitoba Exports Source: Rural Development Institute, Linear Projections
ESTIMATED PROJECTION
$317m
$0
$100
$200
$300
$400
$500
$600
$700
$201
2 M
illio
n
Sales of manufactured goods (301-0003&6)
International Exports
Sales of goods manufactured(shipments 304-0015)
Points used in linear projection(2001-2011)
Source: Statistics Canada. Monthly survey of Manufacturers, CANSIM Table 304-0015 - Sales of goods manufactured (shipments)Source: Statistics Canada. Principal statistics for manufacturing industries, CANSIM Table 301-0003&6 - Revenue from goods manufacturedSource: Industry Canada. Canadian Trade Data Online. Manitoba Exports Source: Rural Development Institute, Linear Projections
ESTIMATED PROJECTION
$400m
19
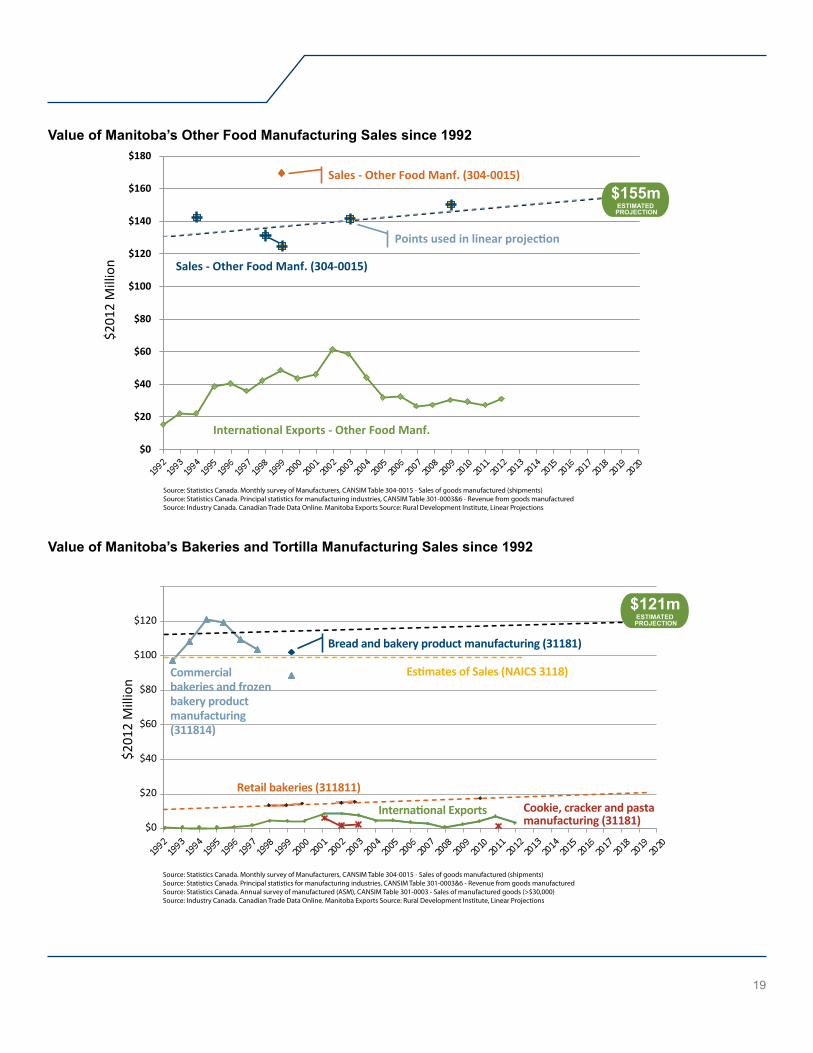
value of manitoba’s other Food manufacturing sales since 1992
value of manitoba’s Bakeries and tortilla manufacturing sales since 1992
$100
$80
$60
$40
$20
$0
$120
$201
2 M
illio
n
Estimates of Sales (NAICS 3118)
International Exports
Retail bakeries (311811)
Commercialbakeries and frozenbakery productmanufacturing(311814)
Bread and bakery product manufacturing (31181)
Cookie, cracker and pastamanufacturing (31181)
Source: Statistics Canada. Monthly survey of Manufacturers, CANSIM Table 304-0015 - Sales of goods manufactured (shipments)Source: Statistics Canada. Principal statistics for manufacturing industries, CANSIM Table 301-0003&6 - Revenue from goods manufacturedSource: Statistics Canada. Annual survey of manufactured (ASM), CANSIM Table 301-0003 - Sales of manufactured goods (>$30,000)Source: Industry Canada. Canadian Trade Data Online. Manitoba Exports Source: Rural Development Institute, Linear Projections
ESTIMATED PROJECTION
$121m
$0
$20
$40
$60
$80
$100
$120
$140
$160
$180
$201
2 M
illio
n
Sales - Other Food Manf. (304-0015)
Sales - Other Food Manf. (304-0015)
Points used in linear projection
International Exports - Other Food Manf.
Source: Statistics Canada. Monthly survey of Manufacturers, CANSIM Table 304-0015 - Sales of goods manufactured (shipments)Source: Statistics Canada. Principal statistics for manufacturing industries, CANSIM Table 301-0003&6 - Revenue from goods manufacturedSource: Industry Canada. Canadian Trade Data Online. Manitoba Exports Source: Rural Development Institute, Linear Projections
ESTIMATED PROJECTION
$155m
20 Food and Beverage Processing Industry Growth Pathways to 2020
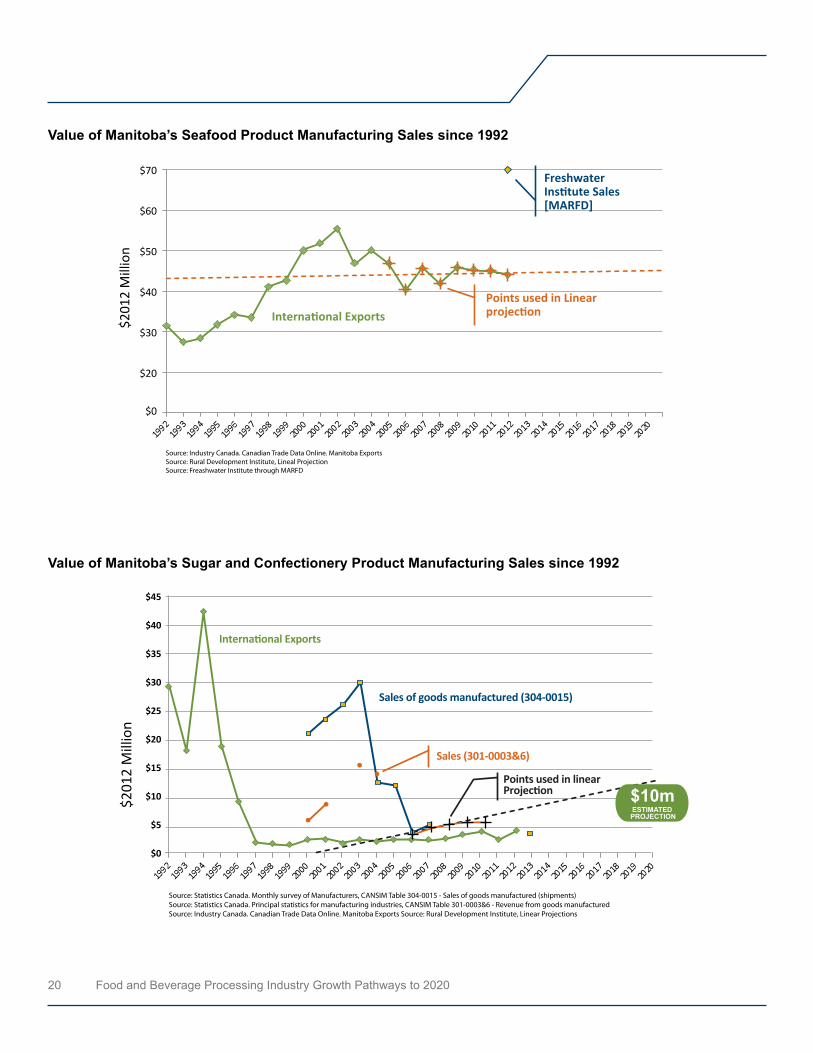
value of manitoba’s seafood product manufacturing sales since 1992
value of manitoba’s sugar and Confectionery product manufacturing sales since 1992
$201
2 M
illio
n
Source: Statistics Canada. Monthly survey of Manufacturers, CANSIM Table 304-0015 - Sales of goods manufactured (shipments)Source: Statistics Canada. Principal statistics for manufacturing industries, CANSIM Table 301-0003&6 - Revenue from goods manufacturedSource: Industry Canada. Canadian Trade Data Online. Manitoba Exports Source: Rural Development Institute, Linear Projections
$45
$40
$35
$30
$25
$20
$15
$10
$5
$0
International Exports
Sales of goods manufactured (304-0015)
Sales (301-0003&6)
Points used in linearProjection
ESTIMATED PROJECTION
$10m
$0
$20
$30
$40
$50
$60
$70
$201
2 M
illio
n
International Exports
Source: Industry Canada. Canadian Trade Data Online. Manitoba ExportsSource: Rural Development Institute, Lineal ProjectionSource: Freashwater Institute through MARFD
FreshwaterInstitute Sales[MARFD]
Points used in Linearprojection

2014 - Prepared for Rural Development Institute, Brandon University
Lower Concourse, McMaster Hall Complex 270-18th Street, Brandon, MB R7A 6A9