food access, security & health - mapc · food access, security & health massachusetts food...
TRANSCRIPT
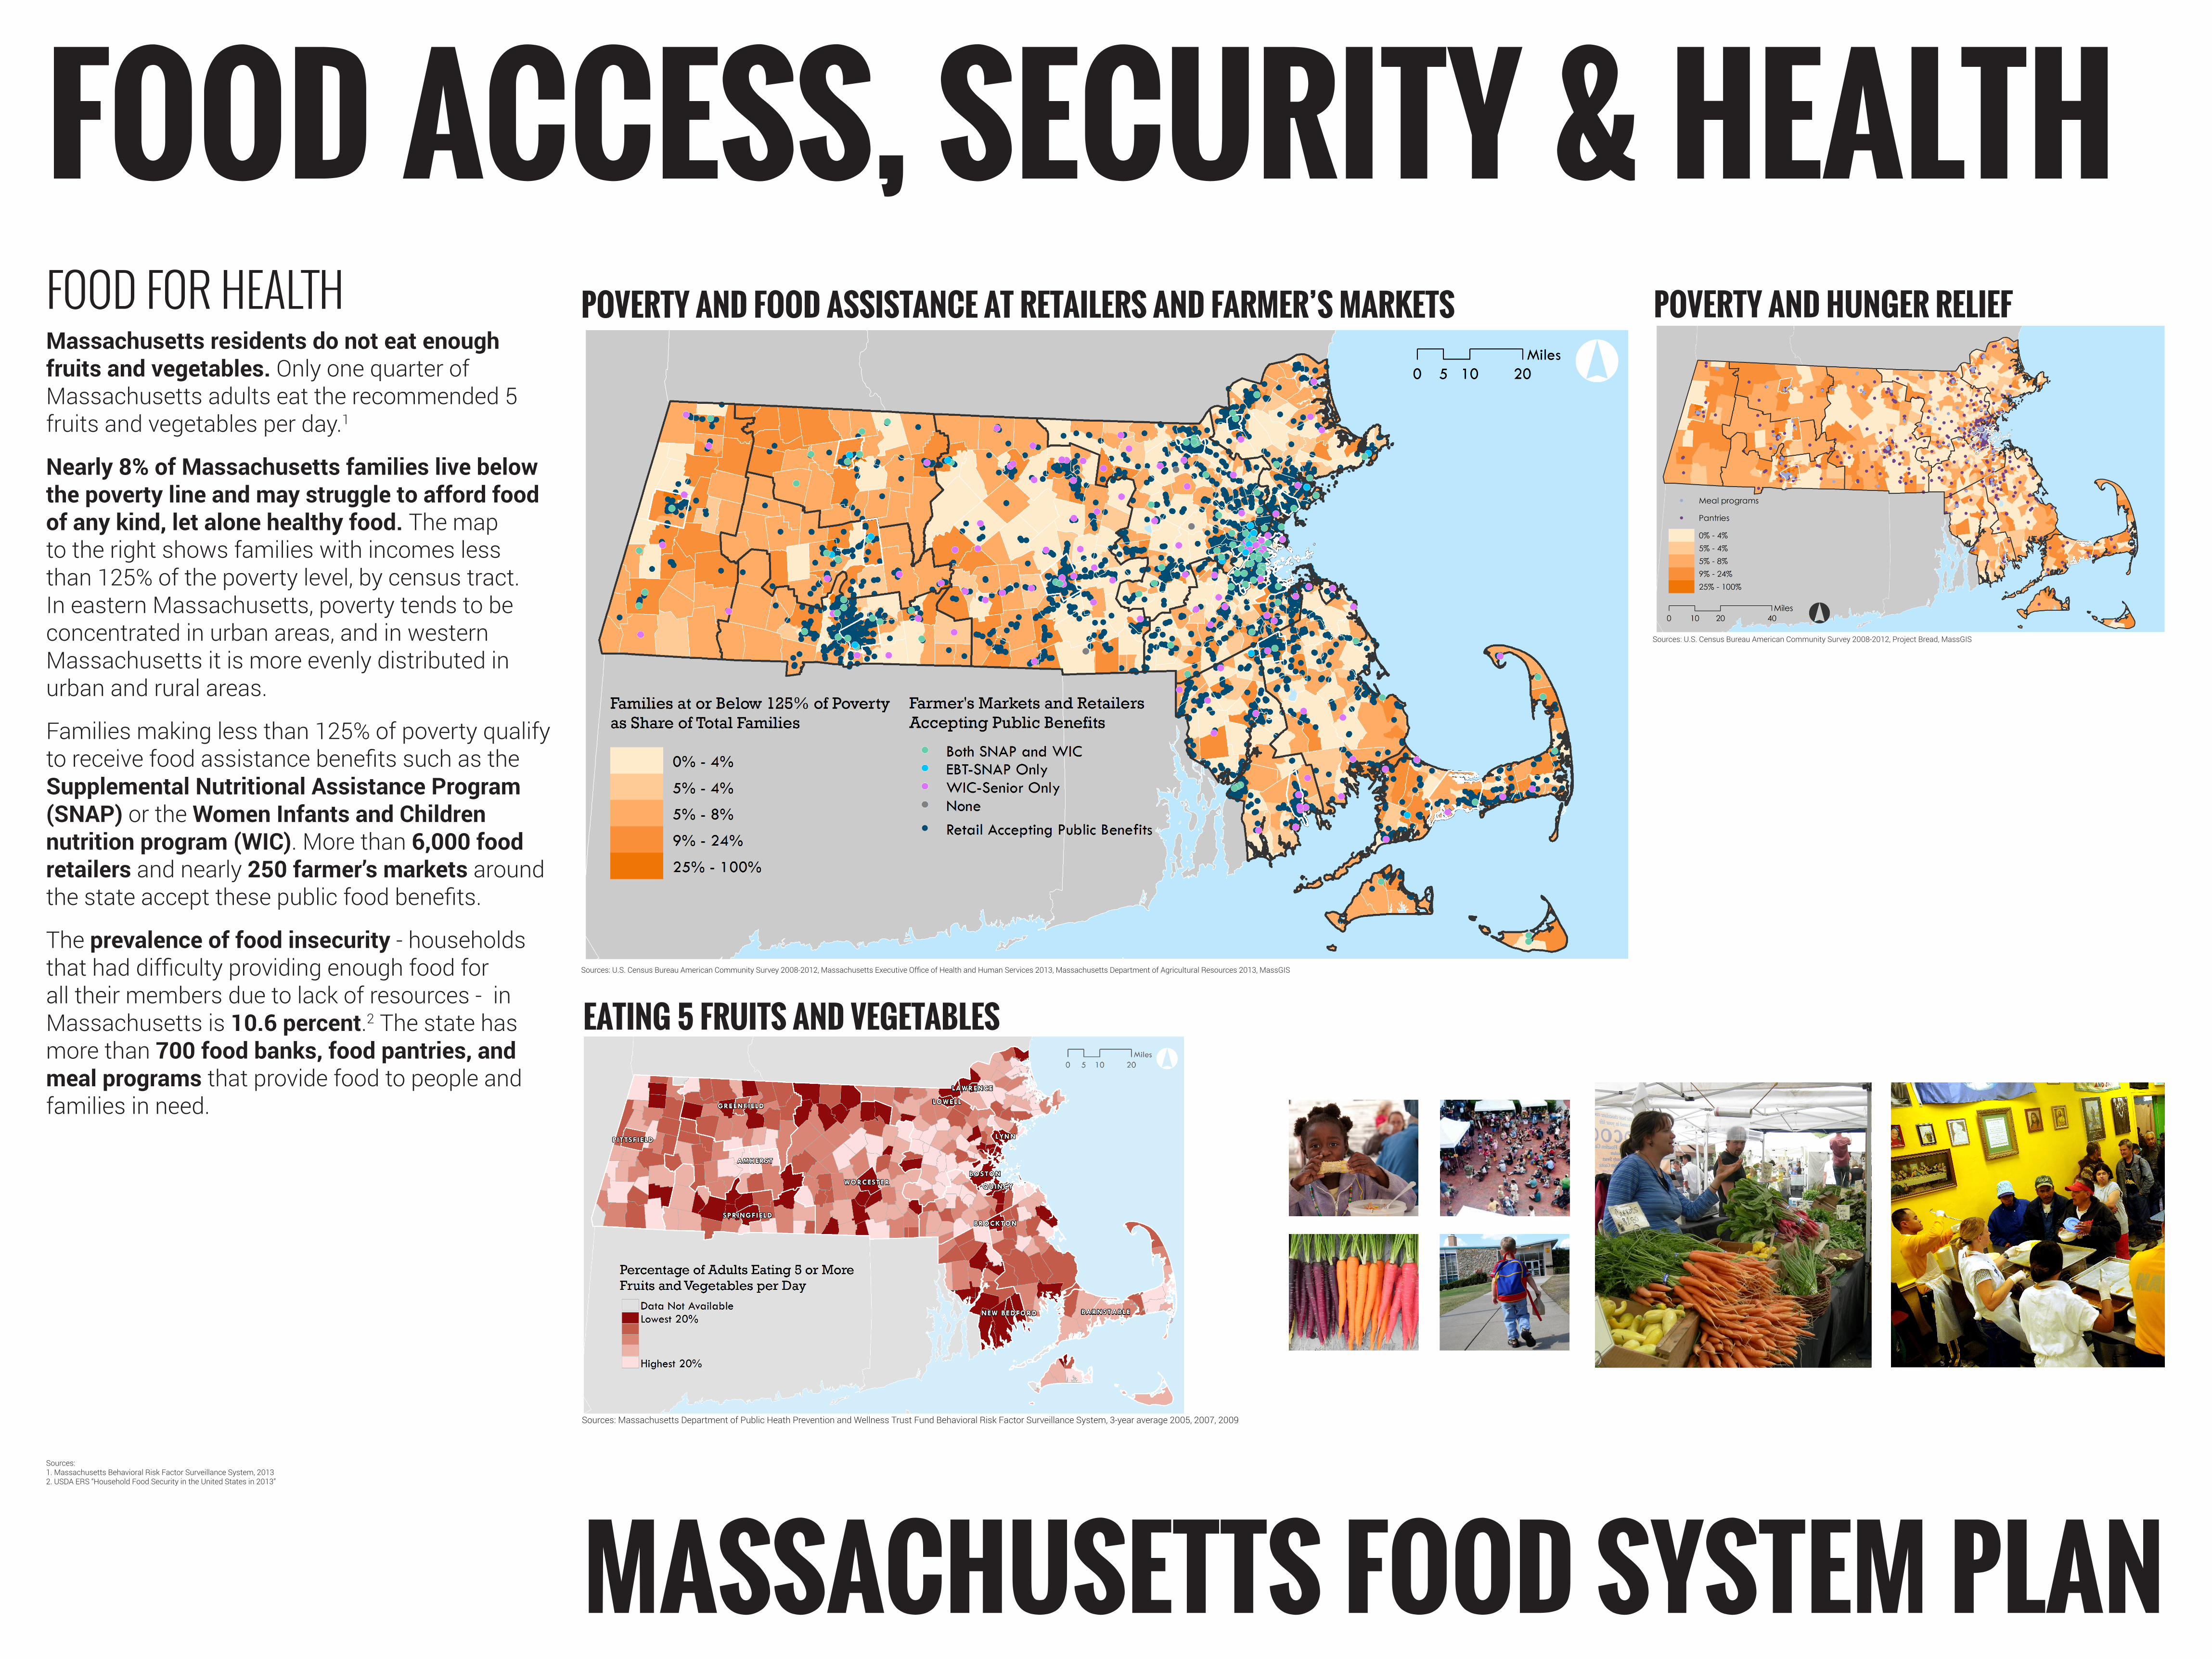
FOOD ACCESS, SECURITY & HEALTH
MASSACHUSETTS FOOD SYSTEM PLAN
Massachusetts residents do not eat enough fruits and vegetables. Only one quarter of Massachusetts adults eat the recommended 5 fruits and vegetables per day.1
Nearly 8% of Massachusetts families live below the poverty line and may struggle to afford food of any kind, let alone healthy food. The map to the right shows families with incomes less than 125% of the poverty level, by census tract. In eastern Massachusetts, poverty tends to be concentrated in urban areas, and in western Massachusetts it is more evenly distributed in urban and rural areas.
Families making less than 125% of poverty qualify to receive food assistance benefits such as the Supplemental Nutritional Assistance Program (SNAP) or the Women Infants and Children nutrition program (WIC). More than 6,000 food retailers and nearly 250 farmer’s markets around the state accept these public food benefits.
The prevalence of food insecurity - households that had difficulty providing enough food for all their members due to lack of resources - in Massachusetts is 10.6 percent.2 The state has more than 700 food banks, food pantries, and meal programs that provide food to people and families in need.
EATING 5 FRUITS AND VEGETABLES
FOOD FOR HEALTH POVERTY AND FOOD ASSISTANCE AT RETAILERS AND FARMER’S MARKETS POVERTY AND HUNGER RELIEF
Sources:1. Massachusetts Behavioral Risk Factor Surveillance System, 20132. USDA ERS “Household Food Security in the United States in 2013”
Sources: U.S. Census Bureau American Community Survey 2008-2012, Massachusetts Executive Office of Health and Human Services 2013, Massachusetts Department of Agricultural Resources 2013, MassGIS
Sources: U.S. Census Bureau American Community Survey 2008-2012, Project Bread, MassGIS
Sources: Massachusetts Department of Public Heath Prevention and Wellness Trust Fund Behavioral Risk Factor Surveillance System, 3-year average 2005, 2007, 2009