focused disciplined striving - e.on...focused disciplined striving european energy & utilities...
TRANSCRIPT
Focused Disciplined Striving
European Energy & Utilities Credit Conference 2016 Henryk Wuppermann, Head of Corporate Finance, E.ON SE London, 24 November 2016
1
Disclaimer (I/II)
This document and the presentation to which it relates contains information relating to E.ON SE ("E.ON") that must not be relied upon for any purpose and may not be redistributed, reproduced, published, or passed on to any other person or used in whole or in part for any other purpose. By accessing this document you agree to abide by the limitations set out in this document. This document is being presented solely for informational purposes and should not be treated as giving investment advice. The information contained in this presentation comprise financial and similar information (e.g. pro-forma financial results). This information is neither audited nor reviewed and should be considered preliminary and subject to change. In particular the presentation of pro-forma financial results may be different compared to the final presentation within the E.ON consolidated financial statements. Certain information in this presentation is based on management estimates. Such estimates have been made in good faith and represent the current beliefs of applicable members of management. Estimates may not be correct or complete. Accordingly, no representation or warranty (express or implied) is given that such estimates are correct or complete. We advise you that some of the information presented herein is based on statements by third parties, and that no representation or warranty, express or implied, is made as to, and no reliance should be placed on, the fairness, accuracy, completeness or correctness of this information or any other information or opinions contained herein, for any purpose whatsoever. Certain statements contained herein may be statements of future expectations and other forward-looking statements that are based on the E.ON’s current views and assumptions and involve known and unknown risks and uncertainties that may cause actual results, performance or events to differ materially from those expressed or implied in such statements. No one undertakes to publicly update or revise any such forward-looking statement. Neither E.ON or any of their respective officers, employees or affiliates nor any other person shall assume or accept any responsibility, obligation or liability whatsoever (in negligence or otherwise) for any loss howsoever arising from any use of this presentation or the statements contained herein as to third person statements, any statements of future expectations and other forward-looking statements, or the fairness, accuracy, completeness or correctness of statements contained herein. In giving this presentation, none of E.ON or their respective agents undertake any obligation to provide the recipient with access to any additional information or to update this presentation or any information or to correct any inaccuracies in any such information.
2
Disclaimer (II/II)
This presentation is not intended to provide the basis for any evaluation or any securities and should not be considered as a recommendation that any person should purchase any shares or other securities. This presentation contains certain financial measures (including forward-looking measures) that are not calculated in accordance with IFRS and are therefore considered as "Non-IFRS financial measures". The Management of E.ON believes that the Non-IFRS financial measures used by E.ON, when considered in conjunction with (but not in lieu of) other measures that are computed in accordance with IFRS, enhance an understanding of EON's results of operations, financial position or cash flows. A number of these Non-IFRS financial measures are also commonly used by securities analysts, credit rating agencies and investors to evaluate and compare the periodic and future operating performance and value of E.ON and other companies with which E.ON competes. These Non-IFRS financial measures should not be considered in isolation as a measure of E.ON's profitability or liquidity, and should be considered in addition to, rather than as a substitute for, net income and the other income or cash flow data prepared in accordance with IFRS. In particular, there are material limitations associated with our use of Non-IFRS financial measures, including the limitations inherent in our determination of each of the relevant adjustments. The Non-IFRS financial measures used by E.ON may differ from, and not be comparable to, similarly-titled measures used by other companies. Certain numerical data, financial information and market data (including percentages) in this presentation have been rounded according to established commercial standards. As a result, the aggregate amounts (sum totals or interim totals or differences or if numbers are put in relation) in this presentation may not correspond in all cases to the amounts contained in the underlying (unrounded) figures appearing in the consolidated financial statements. Furthermore, in tables and charts, these rounded figures may not add up exactly to the totals contained in the respective tables and charts.
3
Agenda
New E.ON and strategic update
Financial and operating update
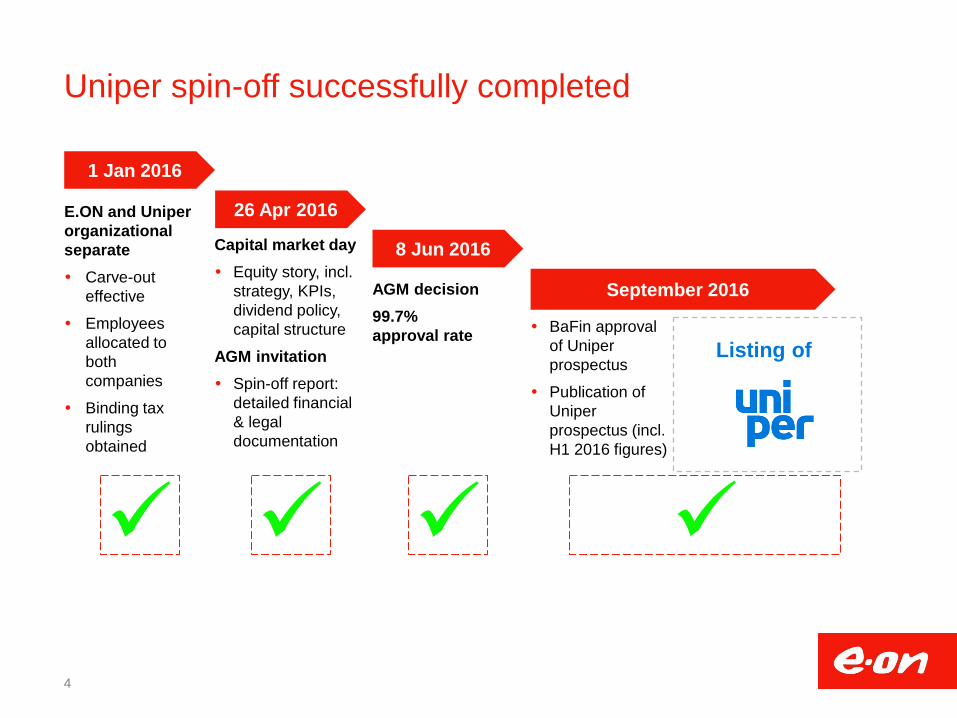
Uniper spin-off successfully completed
1 Jan 2016
E.ON and Uniper organizational separate Carve-out
effective
Employees allocated to both companies
Binding tax rulings obtained
26 Apr 2016
8 Jun 2016
September 2016 AGM decision 99.7% approval rate
Capital market day Equity story, incl.
strategy, KPIs, dividend policy, capital structure
AGM invitation Spin-off report:
detailed financial & legal documentation
4
Listing of BaFin approval
of Uniper prospectus
Publication of Uniper prospectus (incl. H1 2016 figures)
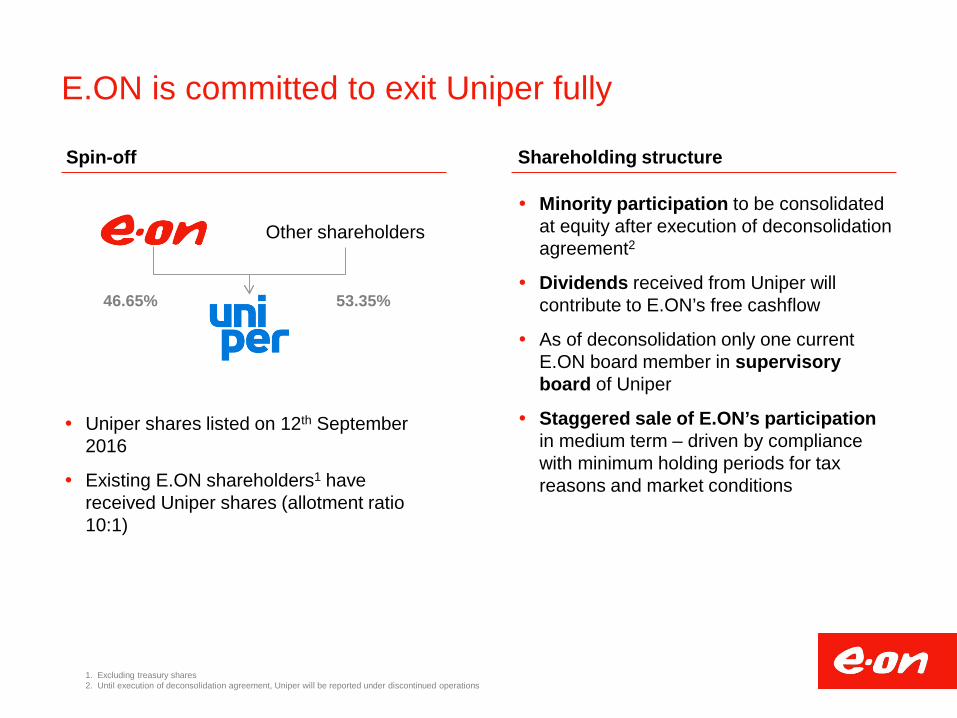
E.ON is committed to exit Uniper fully
Minority participation to be consolidated at equity after execution of deconsolidation agreement2
Dividends received from Uniper will contribute to E.ON’s free cashflow
As of deconsolidation only one current E.ON board member in supervisory board of Uniper
Staggered sale of E.ON’s participation in medium term – driven by compliance with minimum holding periods for tax reasons and market conditions
Other shareholders
46.65% 53.35%
Uniper shares listed on 12th September 2016
Existing E.ON shareholders1 have received Uniper shares (allotment ratio 10:1)
Spin-off Shareholding structure
1. Excluding treasury shares 2. Until execution of deconsolidation agreement, Uniper will be reported under discontinued operations
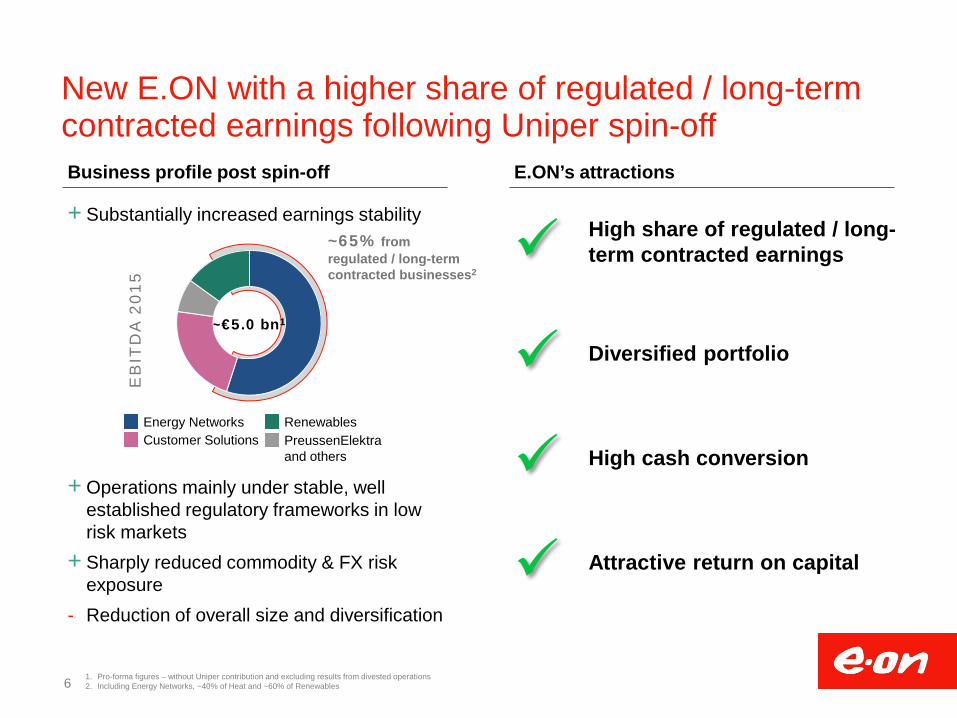
+ Substantially increased earnings stability
+ Operations mainly under stable, well
established regulatory frameworks in low risk markets
+ Sharply reduced commodity & FX risk exposure
- Reduction of overall size and diversification
New E.ON with a higher share of regulated / long-term contracted earnings following Uniper spin-off
High share of regulated / long-term contracted earnings
High cash conversion
Diversified portfolio
E.ON’s attractions
Attractive return on capital
Business profile post spin-off
1. Pro-forma figures – without Uniper contribution and excluding results from divested operations 2. Including Energy Networks, ~40% of Heat and ~60% of Renewables
EB
ITD
A 2
01
5
Renewables Customer Solutions
PreussenElektra and others
Energy Networks
~€5.0 bn1
~65% from regulated / long-term contracted businesses2
6
62% 18%
20%
7
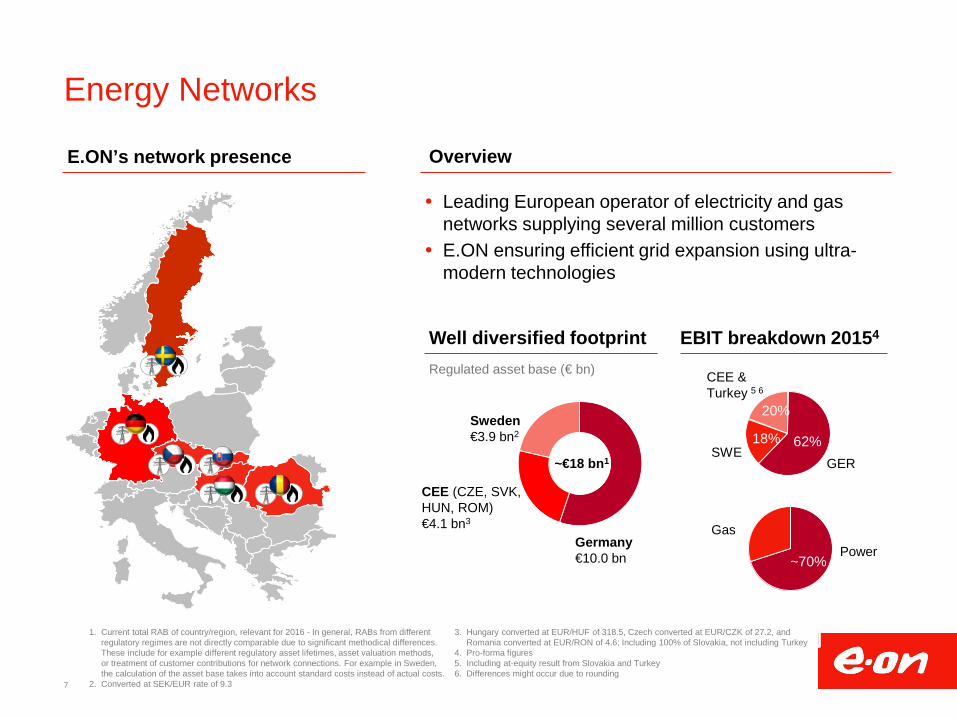
Overview
EBIT breakdown 20154
Leading European operator of electricity and gas networks supplying several million customers E.ON ensuring efficient grid expansion using ultra-
modern technologies
Energy Networks
E.ON’s network presence
GER SWE
CEE & Turkey 5 6
Power Gas
1. Current total RAB of country/region, relevant for 2016 - In general, RABs from different regulatory regimes are not directly comparable due to significant methodical differences. These include for example different regulatory asset lifetimes, asset valuation methods, or treatment of customer contributions for network connections. For example in Sweden, the calculation of the asset base takes into account standard costs instead of actual costs.
2. Converted at SEK/EUR rate of 9.3
3. Hungary converted at EUR/HUF of 318.5, Czech converted at EUR/CZK of 27.2, and Romania converted at EUR/RON of 4.6; Including 100% of Slovakia, not including Turkey
4. Pro-forma figures 5. Including at-equity result from Slovakia and Turkey 6. Differences might occur due to rounding
~70%
Well diversified footprint
Regulated asset base (€ bn)
CEE (CZE, SVK, HUN, ROM)
€4.1 bn3
~€18 bn1
Germany €10.0 bn
Sweden €3.9 bn2
8
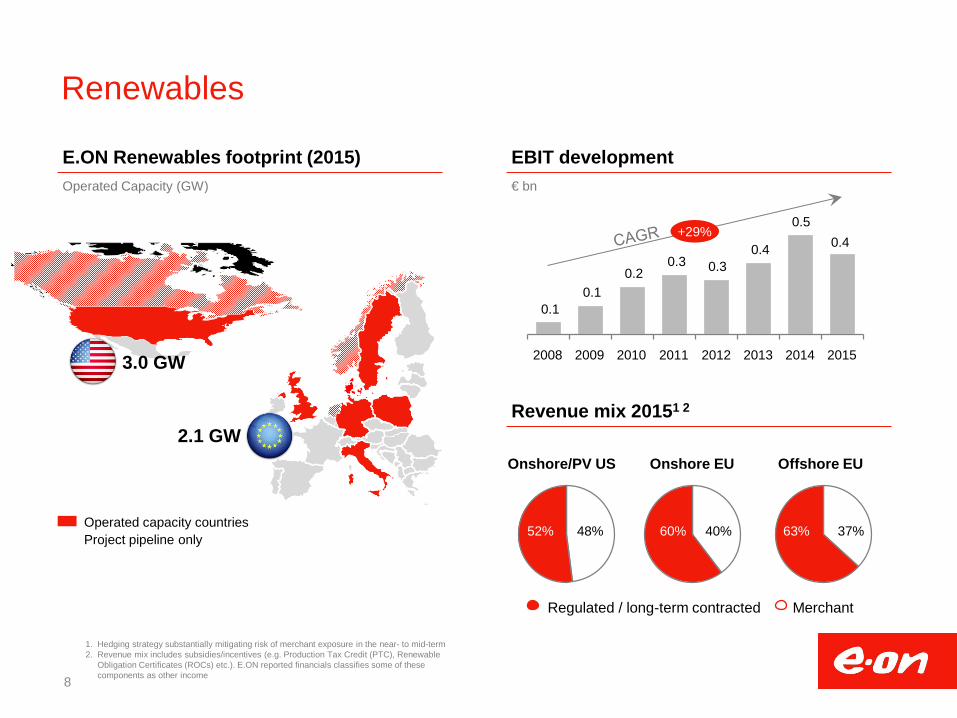
Renewables
Operated capacity countries Project pipeline only
1. Hedging strategy substantially mitigating risk of merchant exposure in the near- to mid-term 2. Revenue mix includes subsidies/incentives (e.g. Production Tax Credit (PTC), Renewable
Obligation Certificates (ROCs) etc.). E.ON reported financials classifies some of these components as other income
E.ON Renewables footprint (2015)
2.1 GW
3.0 GW
Operated Capacity (GW)
Onshore/PV US Onshore EU Offshore EU
Regulated / long-term contracted Merchant
0.1 0.1
0.2 0.3 0.3
0.4
0.5 +29%
2015
0.4
2014 2013 2012 2011 2010 2009 2008
52% 48% 60% 40% 63% 37%
Revenue mix 20151 2
EBIT development € bn
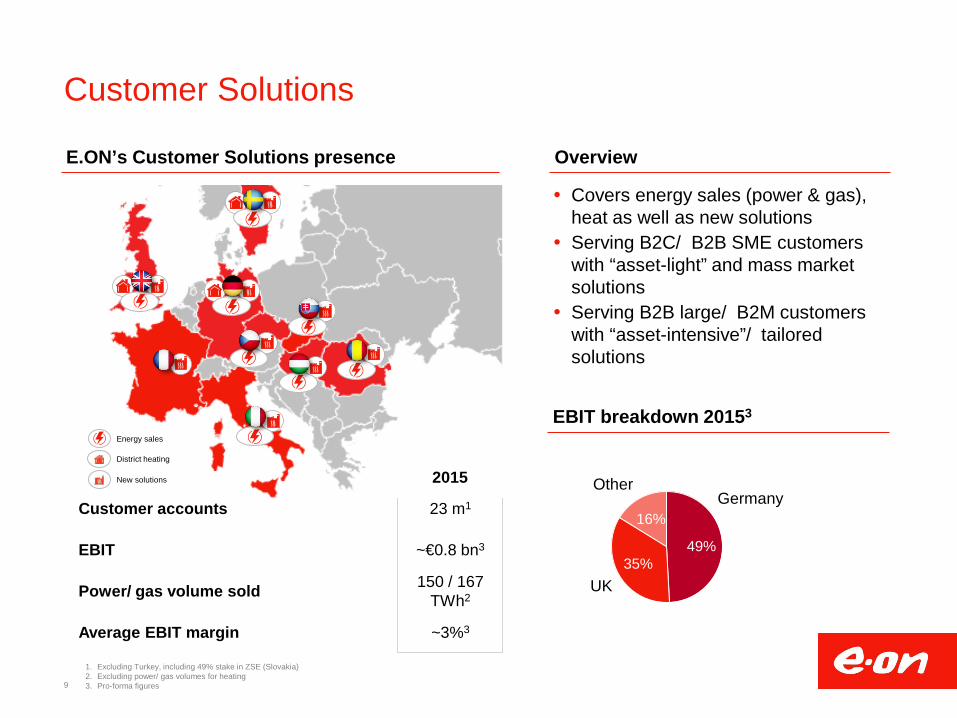
Customer Solutions
49% 35%
16% Germany
UK
Other
1. Excluding Turkey, including 49% stake in ZSE (Slovakia) 2. Excluding power/ gas volumes for heating 3. Pro-forma figures 9
EBIT
Power/ gas volume sold
Average EBIT margin
~€0.8 bn3
150 / 167 TWh2
~3%3
Customer accounts 23 m1
E.ON’s Customer Solutions presence
EBIT breakdown 20153
2015
Energy sales
District heating
New solutions
Covers energy sales (power & gas), heat as well as new solutions Serving B2C/ B2B SME customers
with “asset-light” and mass market solutions Serving B2B large/ B2M customers
with “asset-intensive”/ tailored solutions
Overview
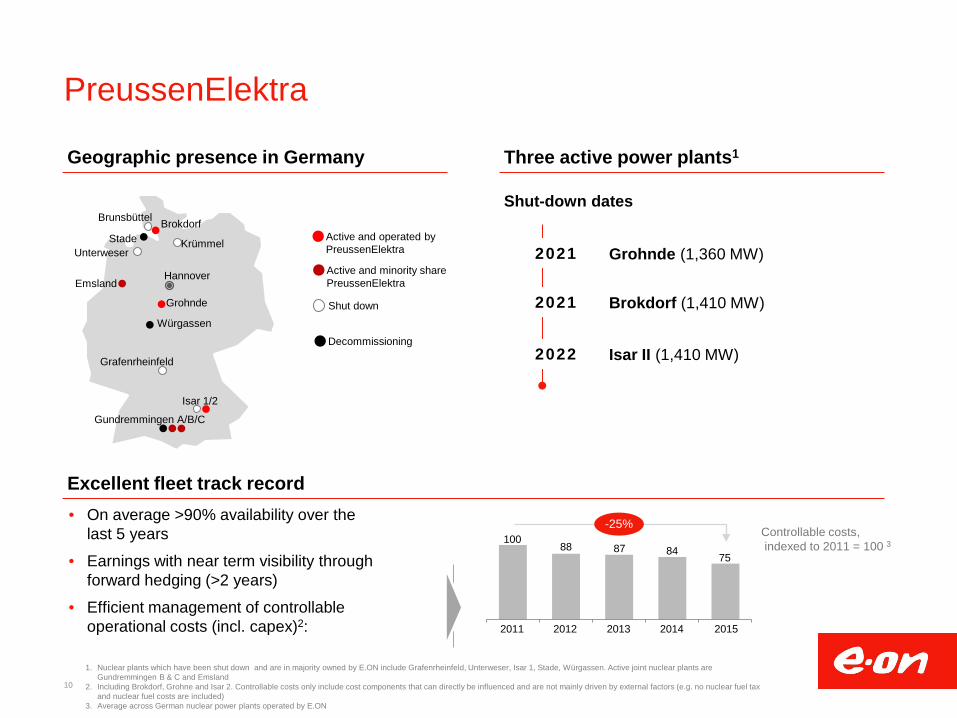
PreussenElektra
Decommissioning
Shut down
Active and operated by PreussenElektra
Active and minority share PreussenElektra
Brunsbüttel Brokdorf Stade
Unterweser Krümmel
Hannover Emsland
Grohnde
Würgassen
Grafenrheinfeld
Isar 1/2
Gundremmingen A/B/C
Geographic presence in Germany
10
Three active power plants1
Shut-down dates
Grohnde (1,360 MW) 2021
Brokdorf (1,410 MW) 2021
Isar II (1,410 MW) 2022
Excellent fleet track record • On average >90% availability over the
last 5 years
• Earnings with near term visibility through forward hedging (>2 years)
• Efficient management of controllable operational costs (incl. capex)2:
100 88 87 84 75
2015 2014 2013 2012 2011
Controllable costs, indexed to 2011 = 100 3
-25%
1. Nuclear plants which have been shut down and are in majority owned by E.ON include Grafenrheinfeld, Unterweser, Isar 1, Stade, Würgassen. Active joint nuclear plants are Gundremmingen B & C and Emsland
2. Including Brokdorf, Grohne and Isar 2. Controllable costs only include cost components that can directly be influenced and are not mainly driven by external factors (e.g. no nuclear fuel tax and nuclear fuel costs are included)
3. Average across German nuclear power plants operated by E.ON
11
Agenda
New E.ON and strategic update
Financial and operating update
12
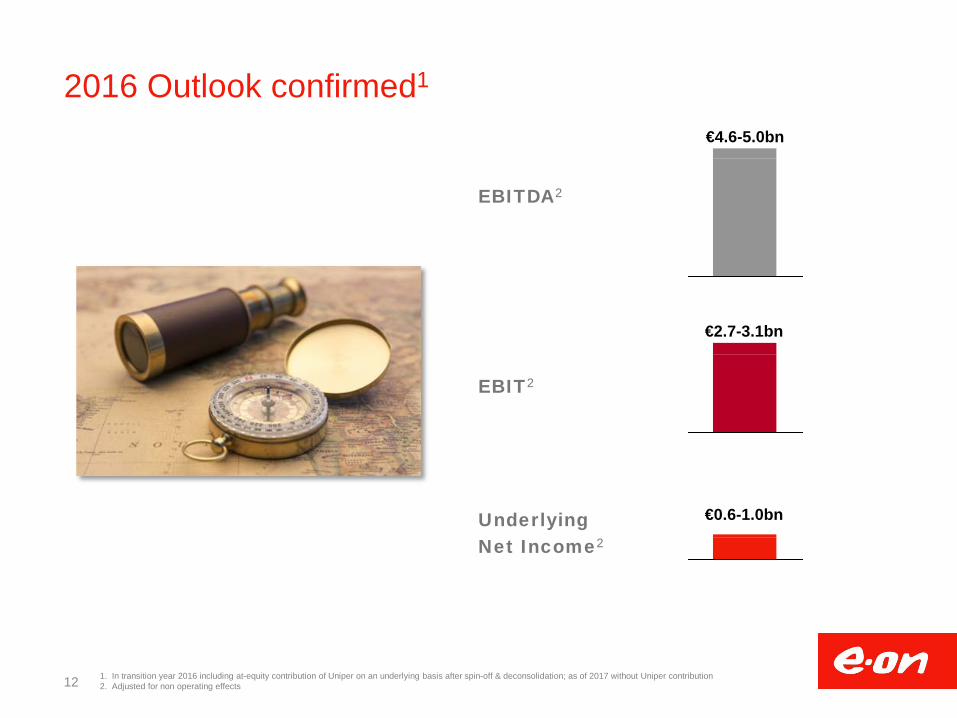
2016 Outlook confirmed1
€0.6-1.0bn
€4.6-5.0bn
EBITDA2
EBIT2
Underlying Net Income2
€2.7-3.1bn
1. In transition year 2016 including at-equity contribution of Uniper on an underlying basis after spin-off & deconsolidation; as of 2017 without Uniper contribution 2. Adjusted for non operating effects
13
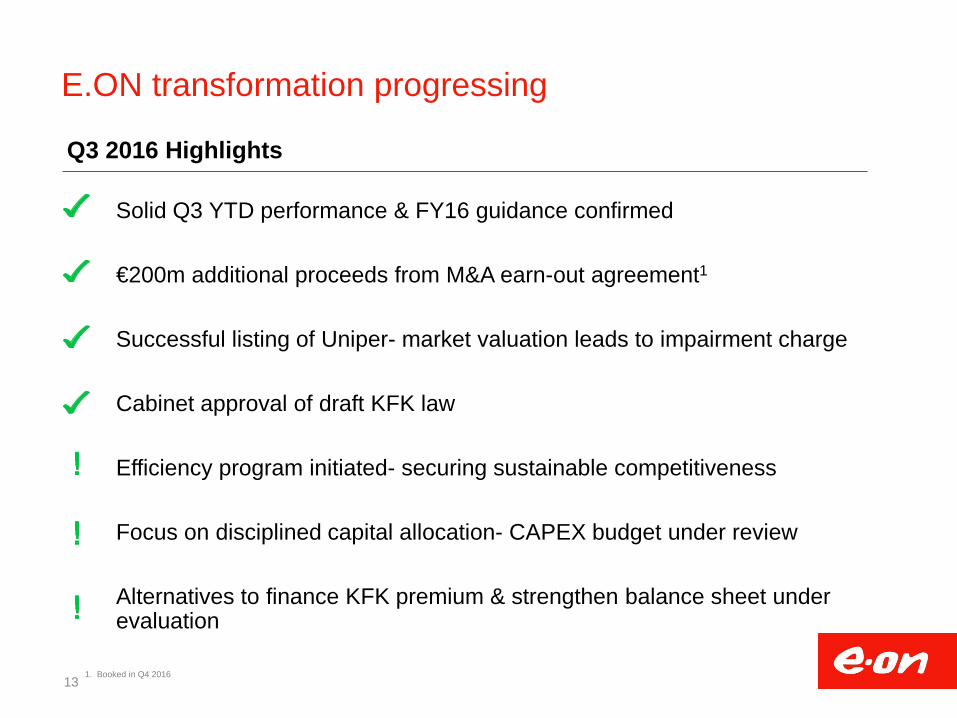
E.ON transformation progressing
Solid Q3 YTD performance & FY16 guidance confirmed
€200m additional proceeds from M&A earn-out agreement1
Successful listing of Uniper- market valuation leads to impairment charge
Cabinet approval of draft KFK law
Efficiency program initiated- securing sustainable competitiveness
Focus on disciplined capital allocation- CAPEX budget under review
Alternatives to finance KFK premium & strengthen balance sheet under evaluation
Q3 2016 Highlights
1. Booked in Q4 2016
14
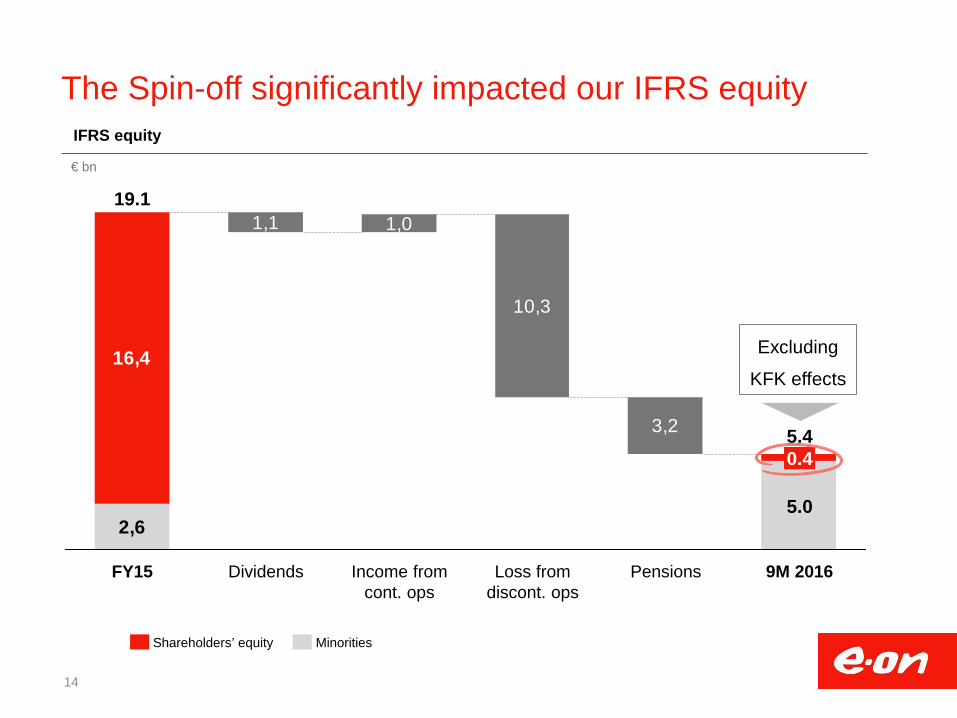
The Spin-off significantly impacted our IFRS equity
1,1 1,0
10,3
3,2
2,6
16,4
9M 2016
5.4
5.0
0.4
Pensions Loss from discont. ops
Income from cont. ops
Dividends FY15
19.1
IFRS equity
€ bn
Shareholders’ equity Minorities
Excluding
KFK effects
15
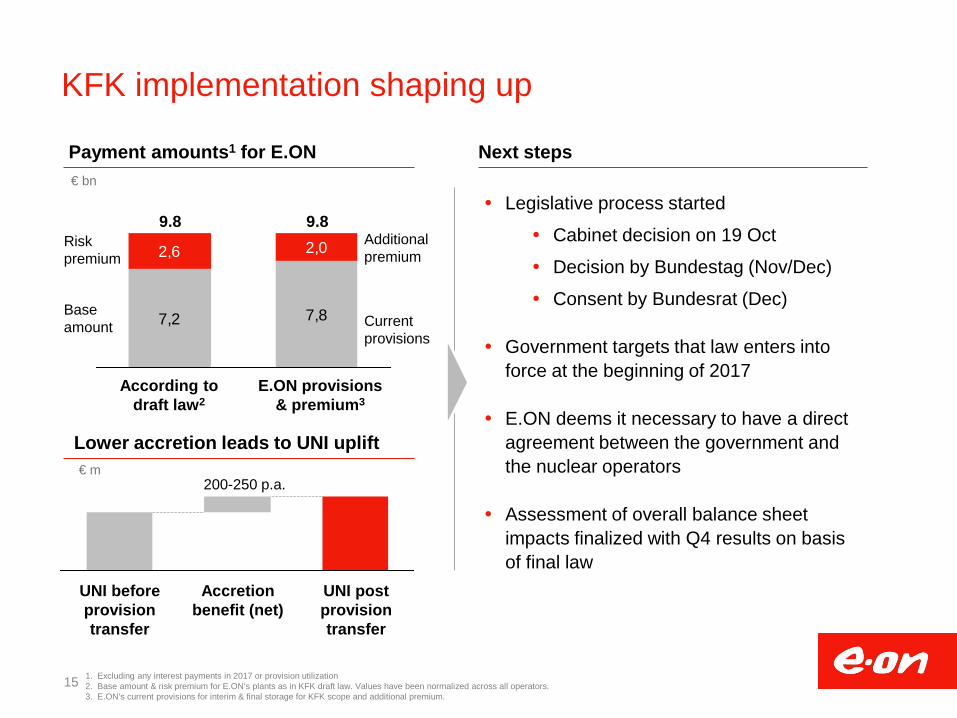
KFK implementation shaping up
Next steps Payment amounts1 for E.ON
1. Excluding any interest payments in 2017 or provision utilization 2. Base amount & risk premium for E.ON‘s plants as in KFK draft law. Values have been normalized across all operators. 3. E.ON’s current provisions for interim & final storage for KFK scope and additional premium.
€ bn
Legislative process started
Cabinet decision on 19 Oct
Decision by Bundestag (Nov/Dec)
Consent by Bundesrat (Dec)
Government targets that law enters into force at the beginning of 2017
E.ON deems it necessary to have a direct agreement between the government and the nuclear operators
Assessment of overall balance sheet impacts finalized with Q4 results on basis of final law
7,2 7,8
2,02,6
9.8 9.8
Lower accretion leads to UNI uplift
UNI post provision transfer
Accretion benefit (net)
UNI before provision transfer
€ m
200-250 p.a.
Base amount
Risk premium
Current provisions
Additional premium
According to draft law2
E.ON provisions & premium3
16
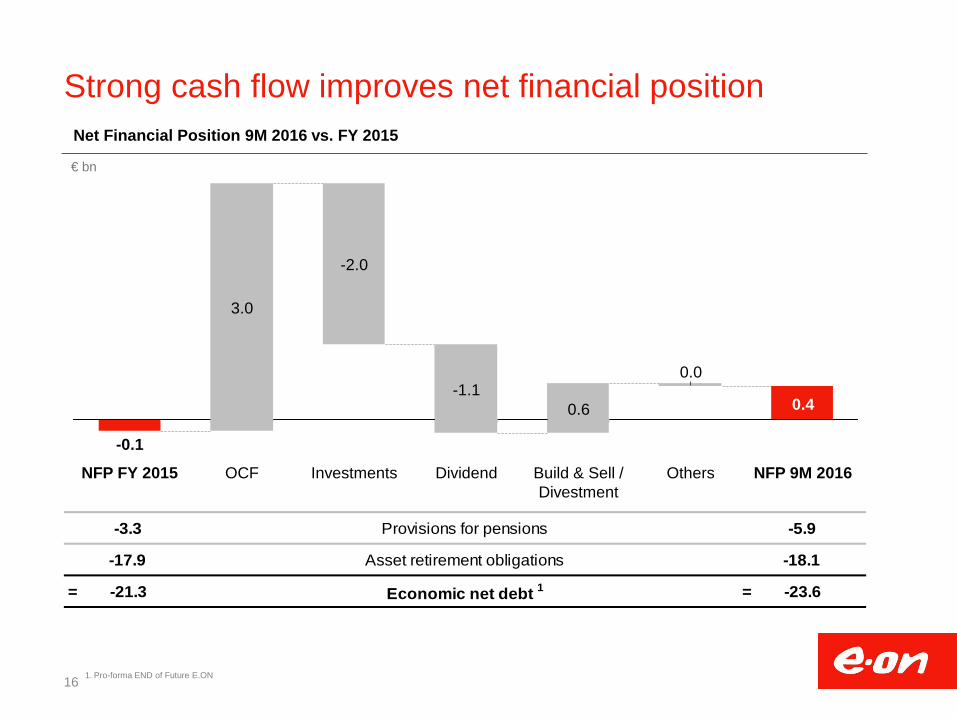
Strong cash flow improves net financial position
Others
0.4
NFP 9M 2016
0.0
Build & Sell / Divestment
0.6
Dividend
-1.1
Investments
-2.0
OCF
3.0
NFP FY 2015
-0.1
€ bn
Net Financial Position 9M 2016 vs. FY 2015
-3.3 -5.9
-17.9 -18.1
= -21.3 = -23.6Economic net debt 1Asset retirement obligations
Provisions for pensions
1. Pro-forma END of Future E.ON
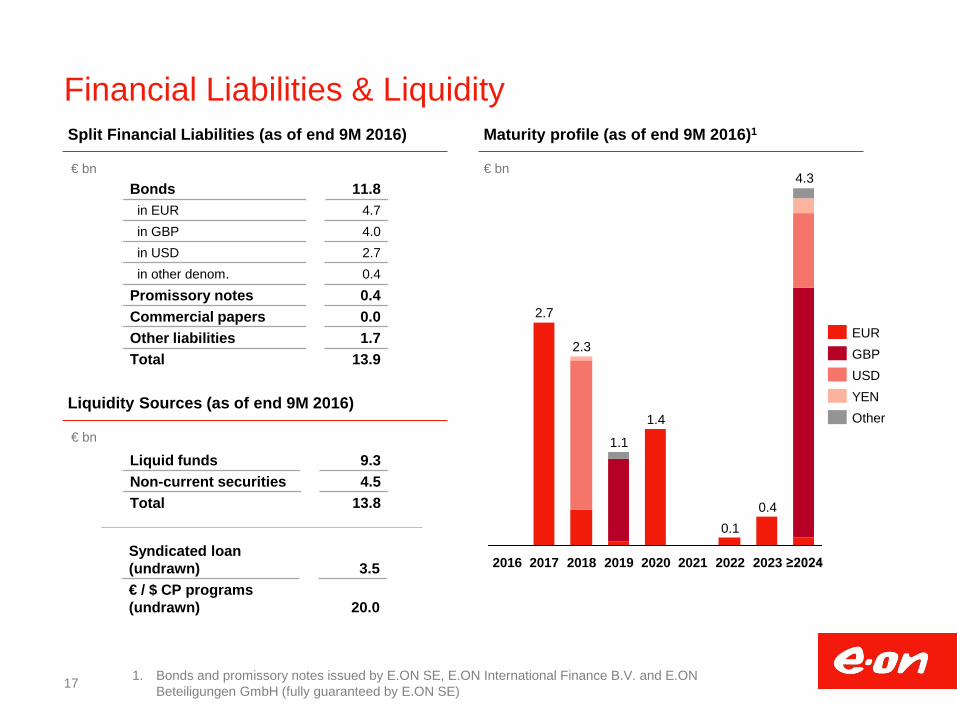
Financial Liabilities & Liquidity
17
Split Financial Liabilities (as of end 9M 2016) Maturity profile (as of end 9M 2016)1
1. Bonds and promissory notes issued by E.ON SE, E.ON International Finance B.V. and E.ON Beteiligungen GmbH (fully guaranteed by E.ON SE)
€ bn
2018
4.3
0.4
1.4
1.1
2.7
2017
0.1
2016 2020 2019 2021 2022 ≥2024 2023
2.3
€ bn
GBP USD
EUR
YEN Other
Bonds 11.8 in EUR 4.7 in GBP 4.0 in USD 2.7 in other denom. 0.4 Promissory notes 0.4 Commercial papers 0.0 Other liabilities 1.7 Total 13.9
Liquidity Sources (as of end 9M 2016)
€ bn
Liquid funds 9.3 Non-current securities 4.5 Total 13.8
Syndicated loan (undrawn) 3.5 € / $ CP programs (undrawn) 20.0
Backup
Financials
Economic net debt
Operations
Spin-off
Reporting calendar & Important links
18
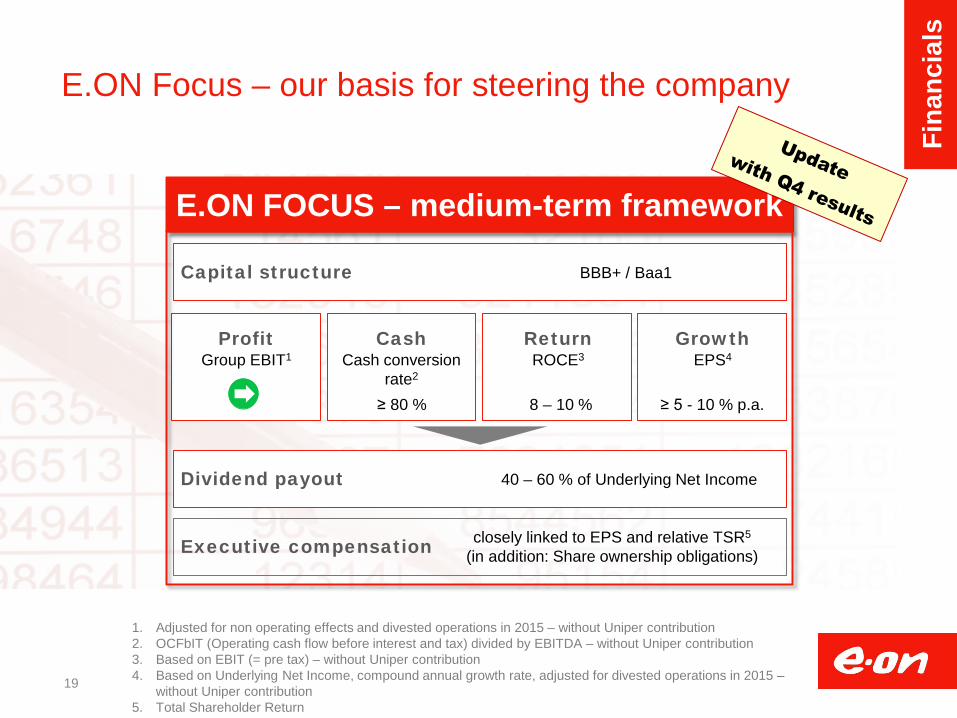
E.ON Focus – our basis for steering the company
Executive compensation
Profit Group EBIT1
Cash Cash conversion
rate2 ≥ 80 %
Return ROCE3
8 – 10 %
Growth EPS4
Capital structure BBB+ / Baa1
Dividend payout 40 – 60 % of Underlying Net Income
E.ON FOCUS – medium-term framework
closely linked to EPS and relative TSR5
(in addition: Share ownership obligations)
≥ 5 - 10 % p.a.
19
1. Adjusted for non operating effects and divested operations in 2015 – without Uniper contribution 2. OCFbIT (Operating cash flow before interest and tax) divided by EBITDA – without Uniper contribution 3. Based on EBIT (= pre tax) – without Uniper contribution 4. Based on Underlying Net Income, compound annual growth rate, adjusted for divested operations in 2015 –
without Uniper contribution 5. Total Shareholder Return
Fina
ncia
ls
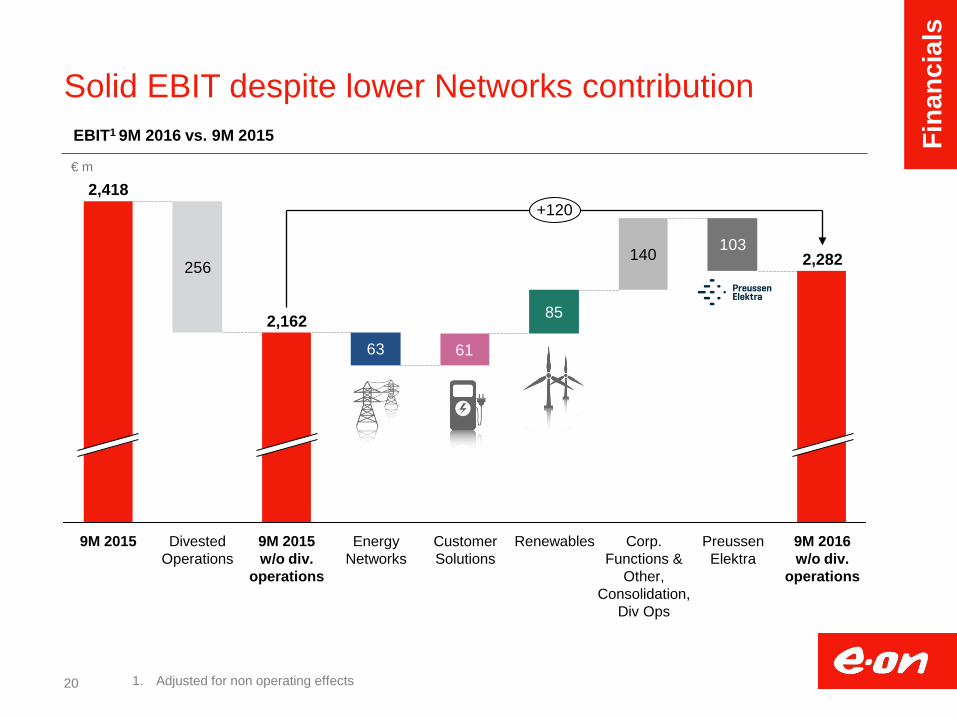
Solid EBIT despite lower Networks contribution
20 1. Adjusted for non operating effects
63 61
85
103140256
Preussen Elektra
2,282
9M 2016 w/o div.
operations
+120
Renewables Corp. Functions &
Other, Consolidation,
Div Ops
Customer Solutions
Energy Networks
9M 2015 w/o div.
operations
2,162
Divested Operations
9M 2015
2,418
EBIT1 9M 2016 vs. 9M 2015
€ m
Fina
ncia
ls
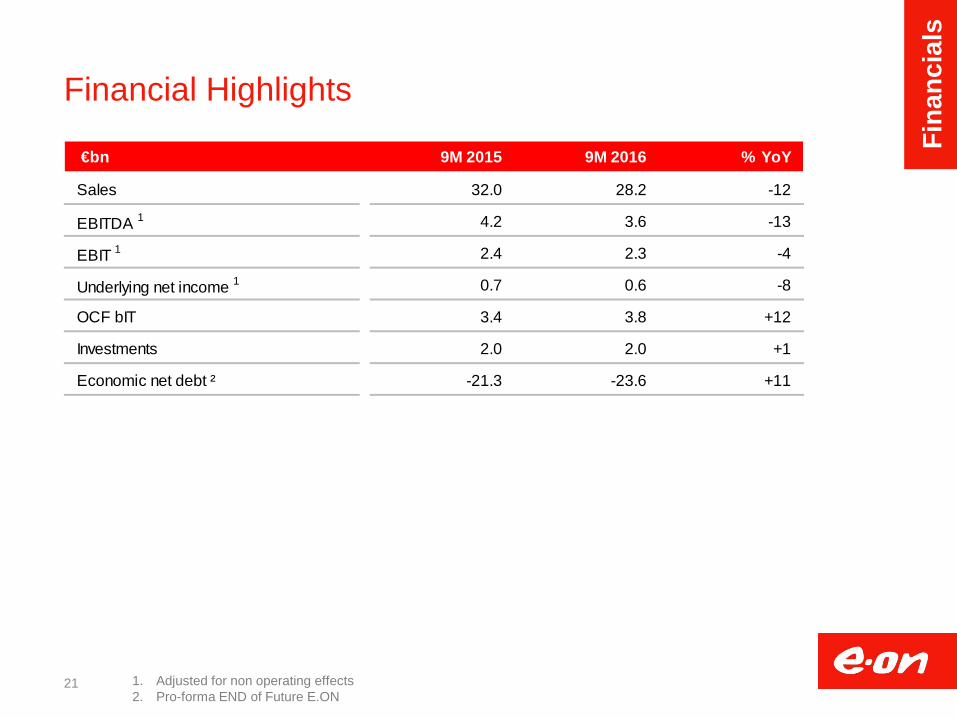
Financial Highlights
21 1. Adjusted for non operating effects 2. Pro-forma END of Future E.ON
€bn 9M 2015 9M 2016 % YoY
Sales 32.0 28.2 -12
EBITDA 1 4.2 3.6 -13
EBIT 1 2.4 2.3 -4
Underlying net income 1 0.7 0.6 -8
OCF bIT 3.4 3.8 +12
Investments 2.0 2.0 +1
Economic net debt ² -21.3 -23.6 +11
Fina
ncia
ls
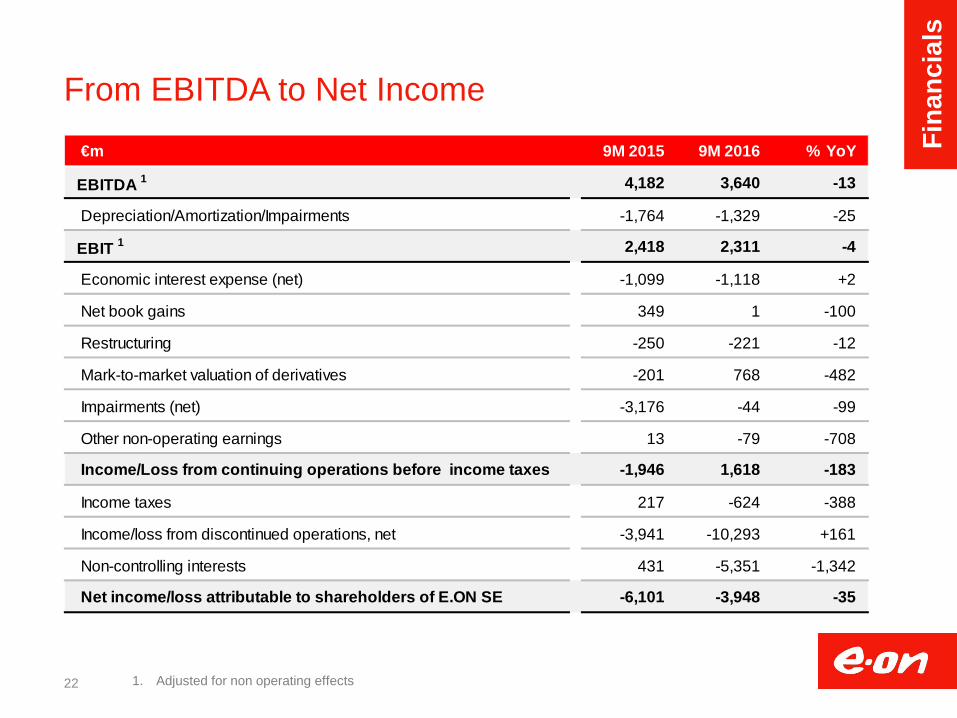
From EBITDA to Net Income
22 1. Adjusted for non operating effects
€m 9M 2015 9M 2016 % YoY
EBITDA 1 4,182 3,640 -13
Depreciation/Amortization/Impairments -1,764 -1,329 -25
EBIT 1 2,418 2,311 -4
Economic interest expense (net) -1,099 -1,118 +2
Net book gains 349 1 -100
Restructuring -250 -221 -12
Mark-to-market valuation of derivatives -201 768 -482
Impairments (net) -3,176 -44 -99
Other non-operating earnings 13 -79 -708
Income/Loss from continuing operations before income taxes -1,946 1,618 -183
Income taxes 217 -624 -388
Income/loss from discontinued operations, net -3,941 -10,293 +161
Non-controlling interests 431 -5,351 -1,342
Net income/loss attributable to shareholders of E.ON SE -6,101 -3,948 -35
Fina
ncia
ls
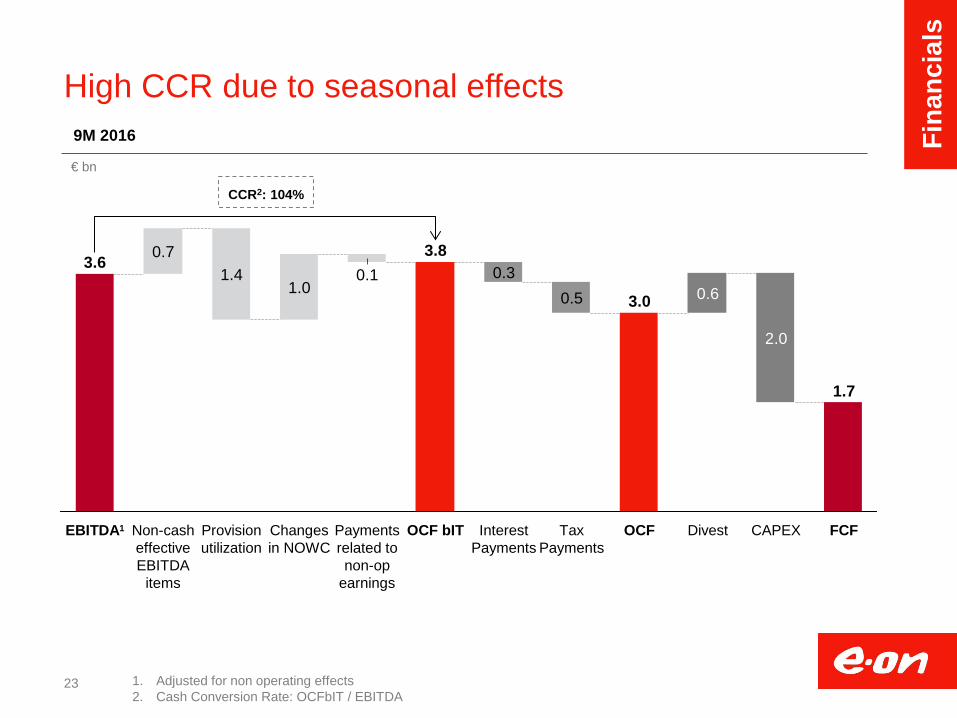
High CCR due to seasonal effects
23
9M 2016
€ bn
Payments related to non-op
earnings
Changes in NOWC
Non-cash effective EBITDA
items
EBITDA1
3.6
Provision utilization
0.7
FCF
2.0
1.7
OCF
3.0
Tax Payments
Interest Payments
OCF bIT
3.8 1.4
1.0 0.1
CAPEX
0.3
Divest
0.5 0.6
1. Adjusted for non operating effects 2. Cash Conversion Rate: OCFbIT / EBITDA
CCR2: 104%
Fina
ncia
ls
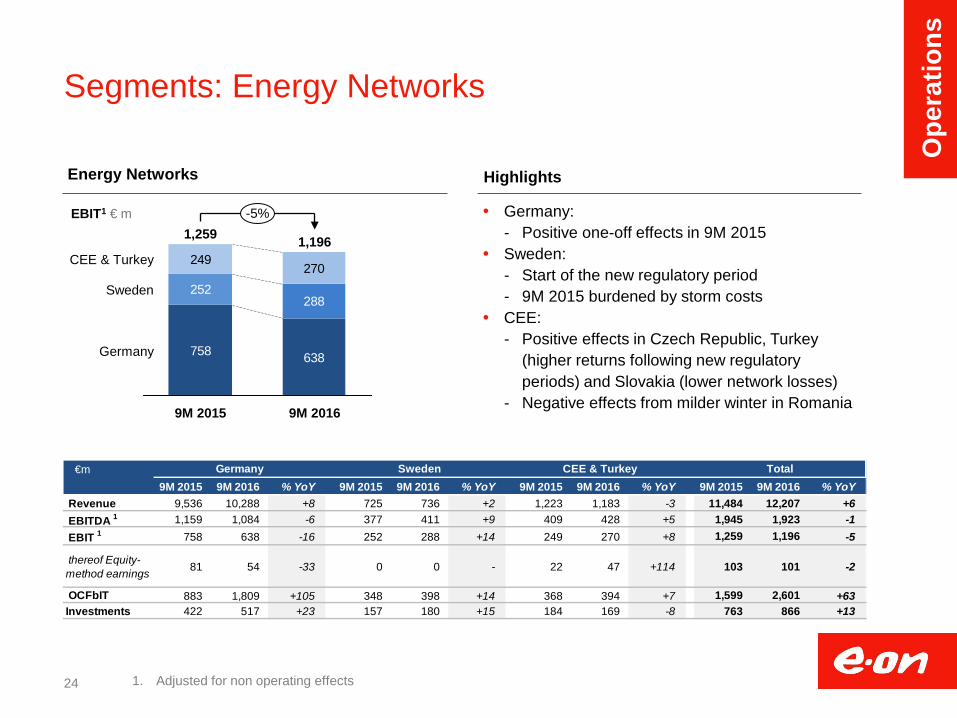
Segments: Energy Networks
Germany: - Positive one-off effects in 9M 2015
Sweden: - Start of the new regulatory period - 9M 2015 burdened by storm costs
CEE: - Positive effects in Czech Republic, Turkey
(higher returns following new regulatory periods) and Slovakia (lower network losses)
- Negative effects from milder winter in Romania
Energy Networks Highlights
EBIT1 € m
758 638
252288
249270
9M 2016 9M 2015
1,196
Germany
1,259 -5%
Sweden
CEE & Turkey
1. Adjusted for non operating effects 24
€m 9M 2015 9M 2016 % YoY 9M 2015 9M 2016 % YoY 9M 2015 9M 2016 % YoY 9M 2015 9M 2016 % YoY
Revenue 9,536 10,288 +8 725 736 +2 1,223 1,183 -3 11,484 12,207 +6 EBITDA 1 1,159 1,084 -6 377 411 +9 409 428 +5 1,945 1,923 -1 EBIT 1 758 638 -16 252 288 +14 249 270 +8 1,259 1,196 -5
thereof Equity-method earnings 81 54 -33 0 0 - 22 47 +114 103 101 -2
OCFbIT 883 1,809 +105 348 398 +14 368 394 +7 1,599 2,601 +63 Investments 422 517 +23 157 180 +15 184 169 -8 763 866 +13
Germany Sweden CEE & Turkey Total
Ope
ratio
ns
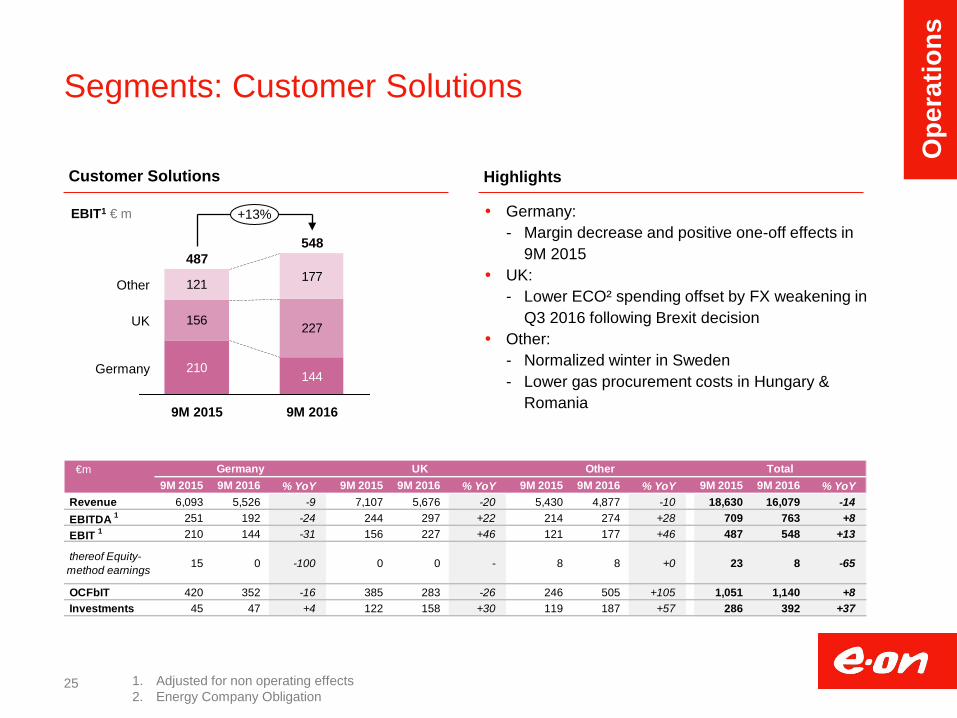
Segments: Customer Solutions
Customer Solutions Highlights
Germany: - Margin decrease and positive one-off effects in
9M 2015 UK:
- Lower ECO² spending offset by FX weakening in Q3 2016 following Brexit decision
Other: - Normalized winter in Sweden - Lower gas procurement costs in Hungary &
Romania
210144
156 227
121 177
UK
+13%
548
Other
Germany
9M 2016 9M 2015
487
1. Adjusted for non operating effects 2. Energy Company Obligation
25
€m 9M 2015 9M 2016 % YoY 9M 2015 9M 2016 % YoY 9M 2015 9M 2016 % YoY 9M 2015 9M 2016 % YoY
Revenue 6,093 5,526 -9 7,107 5,676 -20 5,430 4,877 -10 18,630 16,079 -14 EBITDA 1 251 192 -24 244 297 +22 214 274 +28 709 763 +8 EBIT 1 210 144 -31 156 227 +46 121 177 +46 487 548 +13
thereof Equity-method earnings 15 0 -100 0 0 - 8 8 +0 23 8 -65
OCFbIT 420 352 -16 385 283 -26 246 505 +105 1,051 1,140 +8 Investments 45 47 +4 122 158 +30 119 187 +57 286 392 +37
TotalUKGermany Other
EBIT1 € m
Ope
ratio
ns
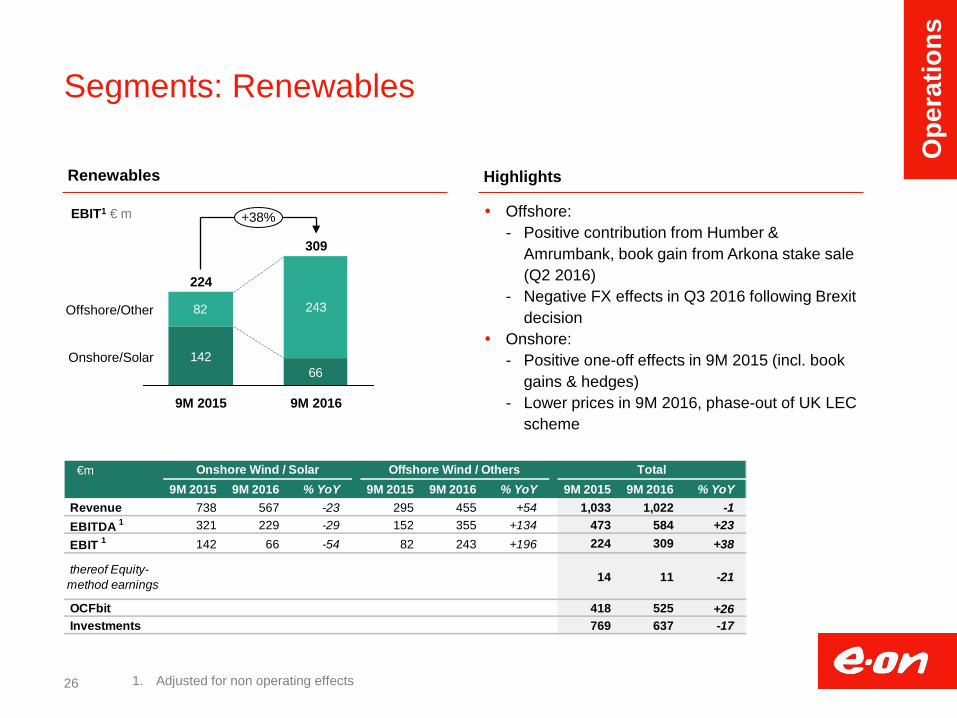
Segments: Renewables
Renewables Highlights
1. Adjusted for non operating effects
14266
82 243Offshore/Other
+38%
9M 2016
309
9M 2015
224
Onshore/Solar
Offshore: - Positive contribution from Humber &
Amrumbank, book gain from Arkona stake sale (Q2 2016)
- Negative FX effects in Q3 2016 following Brexit decision
Onshore: - Positive one-off effects in 9M 2015 (incl. book
gains & hedges) - Lower prices in 9M 2016, phase-out of UK LEC
scheme
26
€m 9M 2015 9M 2016 % YoY 9M 2015 9M 2016 % YoY 9M 2015 9M 2016 % YoY
Revenue 738 567 -23 295 455 +54 1,033 1,022 -1 EBITDA 1 321 229 -29 152 355 +134 473 584 +23 EBIT 1 142 66 -54 82 243 +196 224 309 +38
thereof Equity-method earnings 14 11 -21
OCFbit 418 525 +26 Investments 769 637 -17
Offshore Wind / Others TotalOnshore Wind / Solar
EBIT1 € m
Ope
ratio
ns
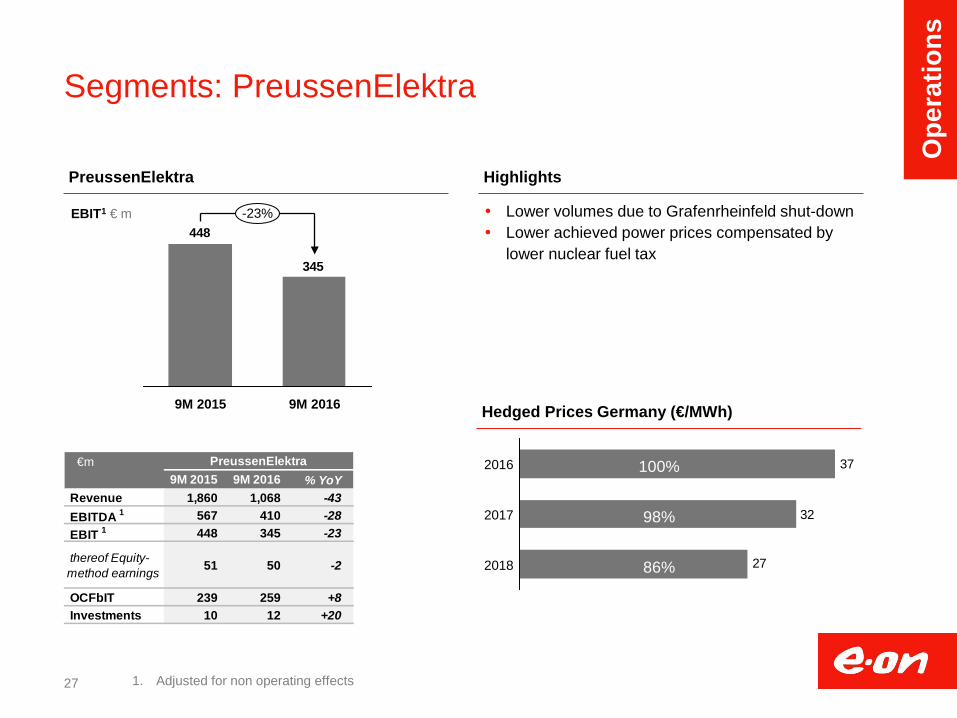
Segments: PreussenElektra
PreussenElektra Highlights
1. Adjusted for non operating effects
345
448-23%
9M 2016 9M 2015
Lower volumes due to Grafenrheinfeld shut-down Lower achieved power prices compensated by
lower nuclear fuel tax
27
€m 9M 2015 9M 2016 % YoY
Revenue 1,860 1,068 -43 EBITDA 1 567 410 -28 EBIT 1 448 345 -23
thereof Equity-method earnings 51 50 -2
OCFbIT 239 259 +8 Investments 10 12 +20
PreussenElektra
32
27
37
2018
2017
2016
Hedged Prices Germany (€/MWh)
100%
98%
86%
EBIT1 € m
Ope
ratio
ns
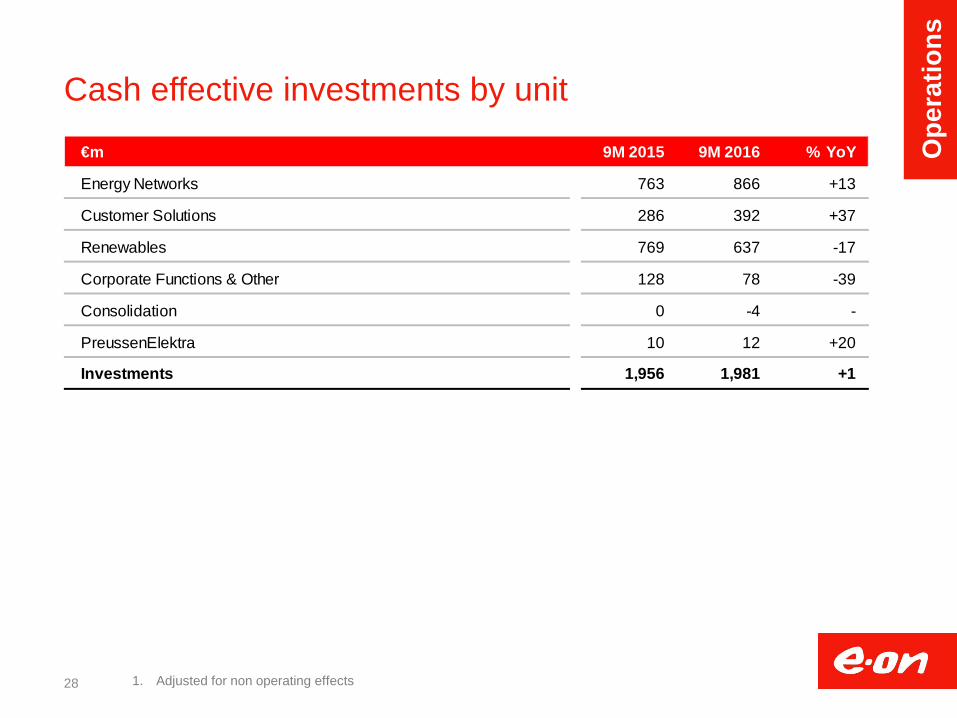
Cash effective investments by unit
28 1. Adjusted for non operating effects
€m 9M 2015 9M 2016 % YoY
Energy Networks 763 866 +13
Customer Solutions 286 392 +37
Renewables 769 637 -17
Corporate Functions & Other 128 78 -39
Consolidation 0 -4 -
PreussenElektra 10 12 +20
Investments 1,956 1,981 +1
Ope
ratio
ns
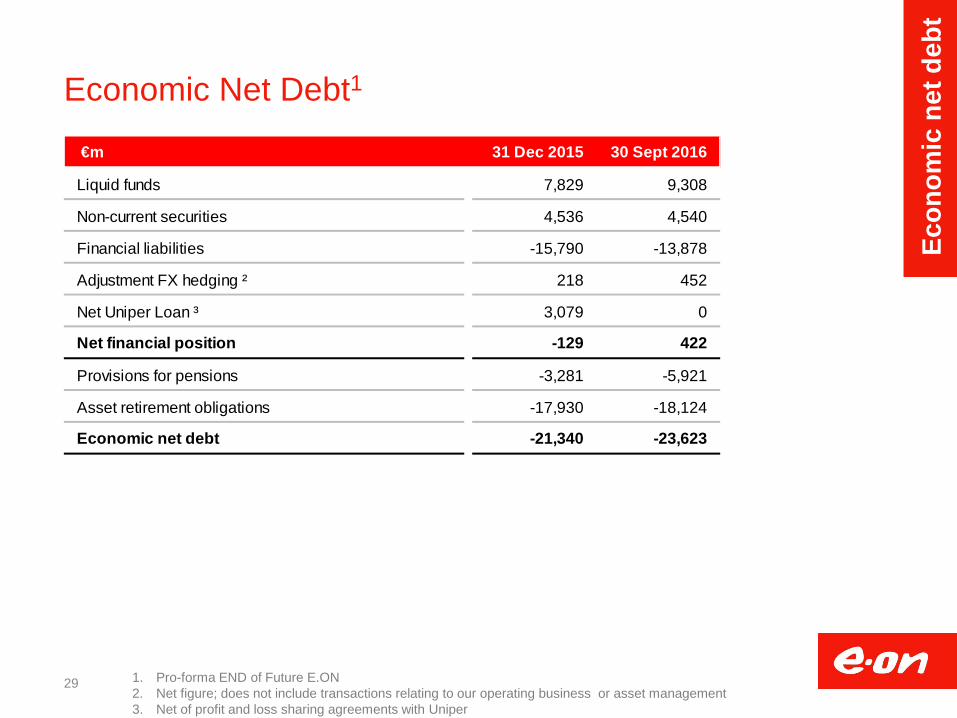
Economic Net Debt1
29 1. Pro-forma END of Future E.ON 2. Net figure; does not include transactions relating to our operating business or asset management 3. Net of profit and loss sharing agreements with Uniper
€m 31 Dec 2015 30 Sept 2016
Liquid funds 7,829 9,308
Non-current securities 4,536 4,540
Financial liabilities -15,790 -13,878
Adjustment FX hedging ² 218 452
Net Uniper Loan ³ 3,079 0
Net financial position -129 422
Provisions for pensions -3,281 -5,921
Asset retirement obligations -17,930 -18,124
Economic net debt -21,340 -23,623
Econ
omic
net
deb
t
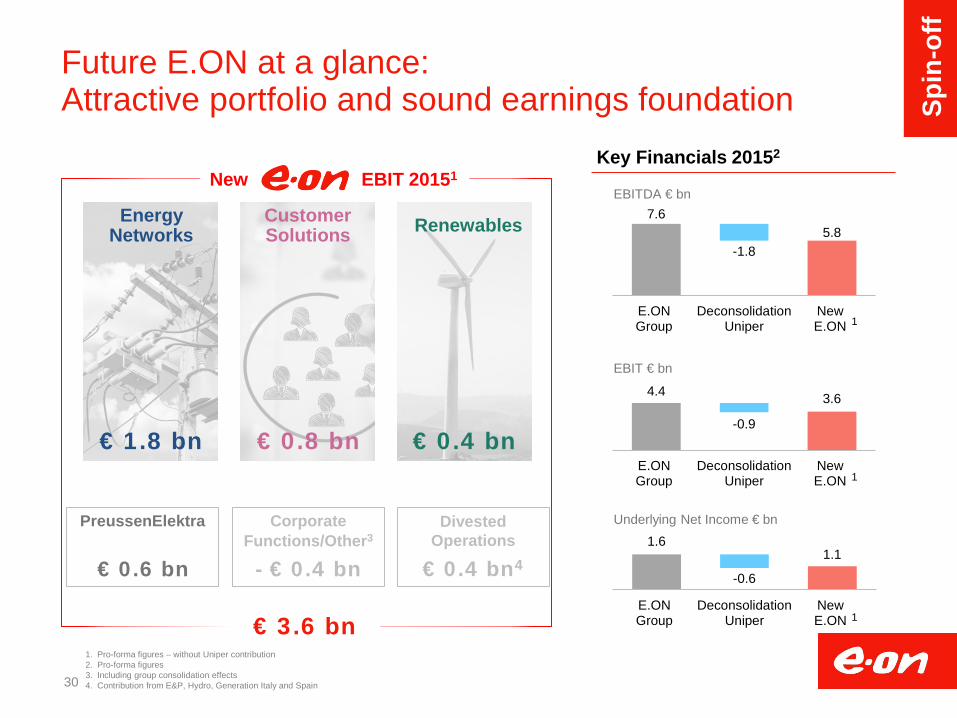
30
1.1 1.6
-0.6
E.ONGroup
DeconsolidationUniper
NewE.ON
Future E.ON at a glance: Attractive portfolio and sound earnings foundation
Corporate Functions/Other3
PreussenElektra
Energy Networks
€ 1.8 bn € 0.4 bn
- € 0.4 bn € 0.6 bn
Renewables
Key Financials 20152
EBITDA € bn
EBIT € bn
Underlying Net Income € bn
5.8 7.6
-1.8
E.ONGroup
DeconsolidationUniper
NewE.ON
3.6 4.4
-0.9
E.ONGroup
DeconsolidationUniper
NewE.ON
Divested Operations
€ 0.4 bn4
1. Pro-forma figures – without Uniper contribution 2. Pro-forma figures 3. Including group consolidation effects 4. Contribution from E&P, Hydro, Generation Italy and Spain
€ 0.8 bn
Customer Solutions
1
1
1
New EBIT 20151
€ 3.6 bn
Spin
-off
31
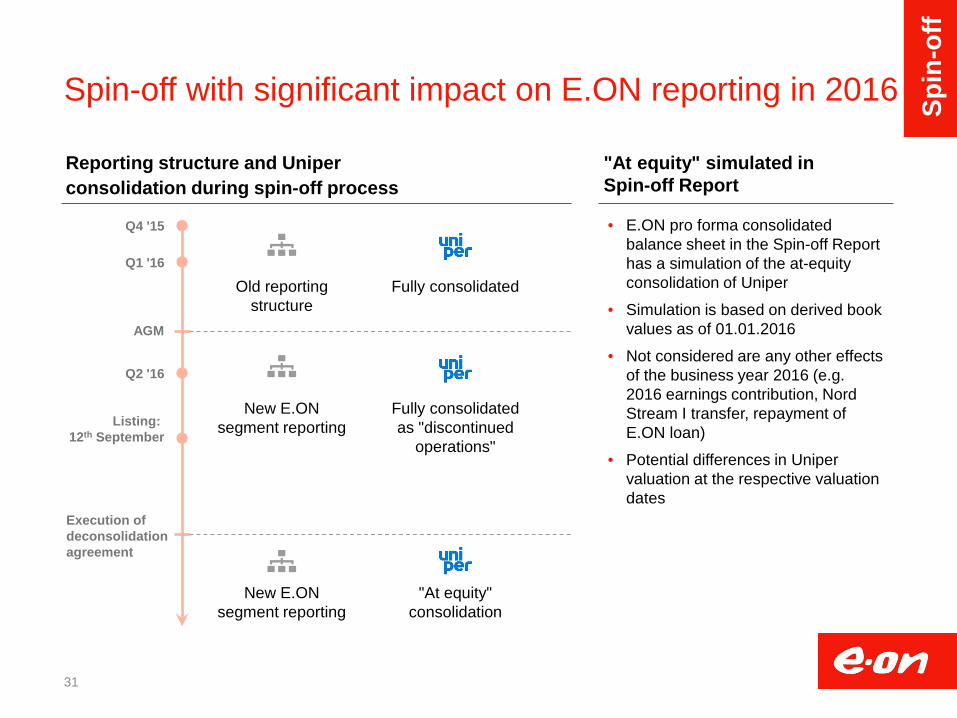
Spin-off with significant impact on E.ON reporting in 2016
AGM
Execution of deconsolidation agreement
Old reporting structure
New E.ON segment reporting
• E.ON pro forma consolidated balance sheet in the Spin-off Report has a simulation of the at-equity consolidation of Uniper
• Simulation is based on derived book values as of 01.01.2016
• Not considered are any other effects of the business year 2016 (e.g. 2016 earnings contribution, Nord Stream I transfer, repayment of E.ON loan)
• Potential differences in Uniper valuation at the respective valuation dates
Fully consolidated
New E.ON segment reporting
Fully consolidated as "discontinued
operations"
"At equity" consolidation
Q4 '15
Q1 '16
Q2 '16
Listing: 12th September
Reporting structure and Uniper consolidation during spin-off process
"At equity" simulated in Spin-off Report
Spin
-off
32
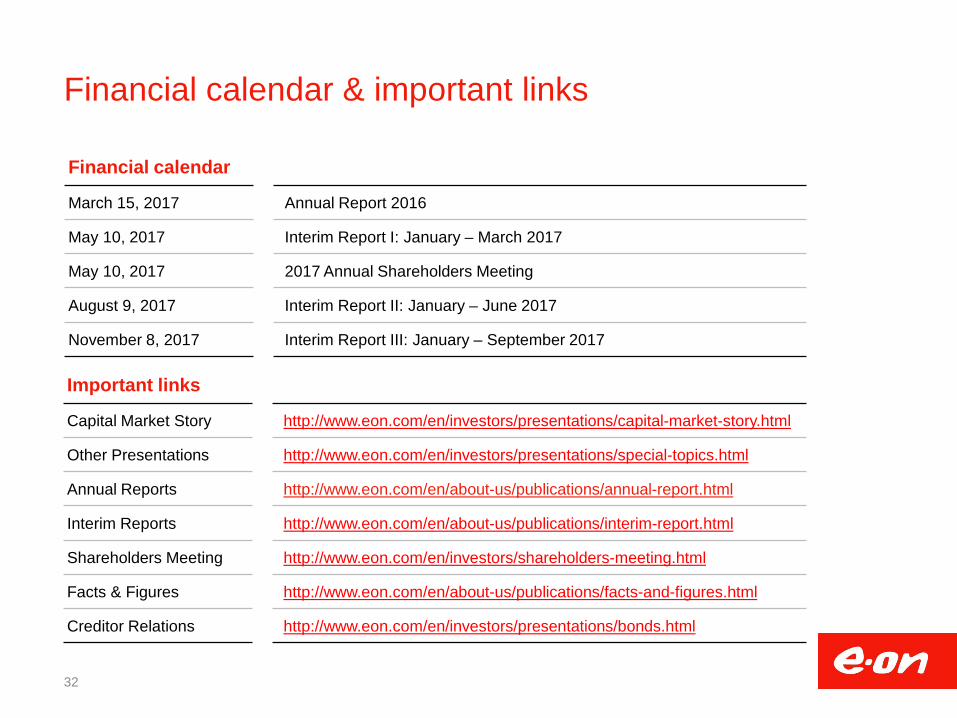
Financial calendar & important links
Important links
Capital Market Story http://www.eon.com/en/investors/presentations/capital-market-story.html
Other Presentations http://www.eon.com/en/investors/presentations/special-topics.html
Annual Reports http://www.eon.com/en/about-us/publications/annual-report.html
Interim Reports http://www.eon.com/en/about-us/publications/interim-report.html
Shareholders Meeting http://www.eon.com/en/investors/shareholders-meeting.html
Facts & Figures http://www.eon.com/en/about-us/publications/facts-and-figures.html
Creditor Relations http://www.eon.com/en/investors/presentations/bonds.html
Financial calendar
March 15, 2017 Annual Report 2016
May 10, 2017 Interim Report I: January – March 2017
May 10, 2017 2017 Annual Shareholders Meeting
August 9, 2017 Interim Report II: January – June 2017
November 8, 2017 Interim Report III: January – September 2017