fluxes and distribution of dissolved iron in the … · fluxes and distribution of dissolved iron...
TRANSCRIPT
Fluxes and distribution of dissolved iron in the eastern (sub-)tropical North Atlantic Ocean
Micha J. A. Rijkenberg,1,2 Sebastian Steigenberger,1 Claire F. Powell,3 Hans van Haren,2
Matthew D. Patey,1 Alex R. Baker,3 and Eric P. Achterberg1
Received 6 December 2011; revised 16 May 2012; accepted 10 June 2012; published 21 July 2012.
[1] Aeolian dust transport from the Saharan/Sahel desert regions is considered thedominant external input of iron (Fe) to the surface waters of the eastern (sub-) tropical NorthAtlantic Ocean. To test this hypothesis, we investigated the sources of dissolved Fe (DFe)and quantified DFe fluxes to the surface ocean in this region. In winter 2008, surfacewater DFe concentrations varied between <0.1 nM and 0.37 nM, with an average of0.13 � 0.07 nM DFe (n = 194). A strong correlation between mixed layer averagedconcentrations of dissolved aluminum (DAl), a proxy for dust input, and DFe indicated dustas a source of DFe to the surface ocean. The importance of Aeolian nutrient input wasfurther confirmed by an increase of 0.1 nM DFe and 0.05 mM phosphate during a repeattransect before and after a dust event. An exponential decrease of DFe with increasingdistance from the African continent, suggested that continental shelf waters were a sourceof DFe to the northern part of our study area. Relatively high Fe:C ratios of up to 3 � 10�5
(C derived from apparent oxygen utilization (AOU)) indicated an external source of Fe tothese African continental shelf waters. Below the wind mixed layer along 12�N, enhancedDFe concentrations (>1.5 nM) correlated positively with apparent oxygen utilization (AOU)and showed the importance of organic matter remineralization as an DFe source. As aconsequence, vertical diffusive mixing formed an important Fe flux to the surface ocean inthis region, even surpassing that of a major dust event.
Citation: Rijkenberg, M. J. A., S. Steigenberger, C. F. Powell, H. van Haren, M. D. Patey, A. R. Baker, and E. P. Achterberg(2012), Fluxes and distribution of dissolved iron in the eastern (sub-) tropical North Atlantic Ocean, Global Biogeochem. Cycles,26, GB3004, doi:10.1029/2011GB004264.
1. Introduction
[2] Iron (Fe) is a key element for marine phytoplanktonand, due to its low concentrations, controls primary pro-ductivity and dinitrogen fixation in large parts of theworld’s oceans [de Baar et al., 1990; Martin and Fitzwater,1988; Moore et al., 2009]. In general, dissolved Fe (DFe)concentrations in surface oceans are very low as a conse-quence of the low solubility of the thermodynamicallyfavored Fe(III) redox state [Liu and Millero, 2002]. Dueto its low solubility, Fe(III) in seawater either rapidlyforms colloidal and particulate phases or is scavenged bythese phases [Wu and Luther, 1994]. However, organiccomplexation enhances the solubility of Fe over its inorganic
solubility of 0.08–0.2 nM at 20�C [Kuma et al., 1996; Liuand Millero, 2002]. With more than 99% of DFe in seawa-ter being organically complexed, the concentration of ligandsoften exceeds the DFe concentration [Gledhill and van denBerg, 1994]. As a result, organic Fe-binding ligands deter-mine the DFe distribution in dust impacted surface waters byfacilitating the dissolution and stabilization of aerosolderived Fe [Rijkenberg et al., 2008b; Wagener et al., 2008].In addition, the organic complexation of Fe influences itsavailability for biological uptake [Hassler and Schoemann,2009; Maldonado et al., 2005; Rijkenberg et al., 2008a].[3] Aeolian dust transport forms an important supply route
of Fe to remote open ocean environments [Jickells et al.,2005]. The North Atlantic Ocean receives about 43% of theglobal oceanic dust inputs, and its main sources are theSaharan desert and the Sahel region [Duce et al., 1991; Jickellset al., 2005]. Maximum dust deposition in the (sub-) tropicalNortheast Atlantic Ocean occurs in winter when the InterTropical Convergence Zone (ITCZ) is located south of 5�Nand dust is transported in the lower air masses by thenortheasterly trade winds [Chiapello et al., 1995]. Inputs ofaerosol derived DFe not only depend on Aeolian supply butalso on the dissolution of Fe which is determined by aerosolsource/mineralogy, atmospheric (photo-) chemical processing,
1School of Ocean and Earth Science, National Oceanography CentreSouthampton, University of Southampton, Southampton, UK.
2Royal Netherlands Institute for Sea Research, Den Burg, Netherlands.3Laboratory for Global Marine and Atmospheric Chemistry, School of
Environmental Sciences, University of East Anglia, Norwich, UK.
Corresponding author: M. J. A. Rijkenberg, Royal Netherlands Institutefor Sea Research, Den Burg NL-1790 AB, Netherlands.([email protected])
©2012. American Geophysical Union. All Rights Reserved.0886-6236/12/2011GB004264
GLOBAL BIOGEOCHEMICAL CYCLES, VOL. 26, GB3004, doi:10.1029/2011GB004264, 2012
GB3004 1 of 15
aerosol size, conditions in the receiving seawater includingambient DFe concentration and dissolved organic Fe-bindingligand characteristics, dust loading (e.g., influencing scav-enging), and the influence of biology on the aerosol particlesfollowing deposition [Baker and Croot, 2010].[4] Continental shelves form another important source of
DFe to the open ocean [Johnson et al., 1997]. Ussher et al.[2010] observed a negative relationship between surfaceDFe concentrations and distance from the North West Afri-can coast, illustrating the role of the continental shelf as asource of DFe to the Canary Basin. Oxidation of organicmaterial in the shelf sediments may lead to suboxic or anoxicconditions with reductive Fe-oxyhydroxide dissolution andsubsequent release of DFe to the overlying water column[Elrod et al., 2004]. In addition, upwelling of deep watersenhanced in DFe or release of Fe from upwelled biogenicand lithogenic particles along the North West African coast[Neuer et al., 2002] may explain the gradient of surface DFeconcentration with distance from the African continent.Horizontal transport of dissolved and particulate ironderived from continental shelf regions determined DFe dis-tributions off the Californian coast [Johnson et al., 1997], inthe subarctic North Pacific [Lam et al., 2006; Nishioka et al.,2007], in the vicinity of the Crozet and Kerguelen Islands[Blain et al., 2008; Planquette et al., 2007] and in thepolynyas of Pine Island Bay and the Amundsen Sea in theSouthern Ocean [Gerringa et al., 2012].[5] A pronounced oxygen minimum zone (OMZ) is posi-
tioned south of the North Equatorial Current (NEC) and northof the North Equatorial Countercurrent (NECC) in the NorthAtlantic Ocean. The oxygen minimum is strongest at a depthof 400 to 500 m immediately above the boundary betweenthe Central Water and Antarctic Intermediate Water (AAIW)[Stramma et al., 2008]. Oxygen minimum zones are theresult of a weak ocean ventilation preventing the supply ofatmospheric oxygen, combined with enhanced organic mat-ter respiration which consumes oxygen, in often highly pro-ductive oceanic regions [Karstensen et al., 2008]. DissolvedFe released due to organic matter remineralization is stabi-lized in solution by simultaneously released Fe-bindingligands, allowing for enhanced DFe concentrations in OMZs[Boyd et al., 2010; Hopkinson and Barbeau, 2007; Witteret al., 2000]. Furthermore, the low redox potential in OMZsmay prevent oxidation of highly soluble Fe(II), as evidencedby relatively high Fe(II) concentrations in OMZs [Hopkinsonand Barbeau, 2007; Santana-Casiano et al., 2005].[6] In recent years, the tropical North Atlantic Ocean has
become a focus for research on the biogeochemical effects ofSaharan dust inputs [Dall’Osto et al., 2010; Hill et al., 2010;Rijkenberg et al., 2008b; Ye et al., 2009]. Quantification ofthe various sources of DFe to the surface ocean is required toestablish the relative importance of Aeolian Fe inputs. Thisstudy presents the distribution of DFe and the quantificationof its various sources to the surface ocean of the eastern(sub-) tropical North Atlantic Ocean.
2. Materials and Methods
2.1. Sampling
[7] During a cruise in the tropical and subtropical North-east Atlantic Ocean (5 January to 5 February 2008) on boardthe research vessel RRS Discovery (cruise D326), near-
surface seawater was pumped into a trace metal clean labo-ratory container using a Teflon diaphragm pump (AlmatecA-15, Germany) connected by an acid-washed braided PVCtubing to a towed fish positioned at approximately 3 m depthalongside the ship. Samples for DFe, dissolved aluminum(DAl), and nanomolar phosphate and nitrate were filtered in-line using a filter capsule (Sartorius, Sartobran 300) with a0.2 mm filtration cut-off, and stored in acid-cleaned low-density polyethylene bottles (250 mL, Nalgene) [Achterberget al., 2001].[8] Water column samples were collected with a trace-
metal clean titanium CTD rosette system using 10-L OceanTest Equipment (OTE) bottles modified for trace metalsampling. CTDs were in general deployed to 300 m, how-ever, at 4 stations to 1800 m and at 2 stations to near theseafloor. Samples were processed on board in the trace metalclean laboratory container. The OTE bottles were pressur-ized with filtered high-purity nitrogen gas (BOC Gases), andseawater samples were directly filtered using a filter capsule(Sartorius, Sartobran 300) with a 0.2 mm filtration cut-off.Samples for DFe and DAl were acidified to pH 1.9 byaddition of 1 mL of 12M HCl (Romil UHPgrade) per 1 L ofsample.[9] Oxygen was determined using a Seabird SBE 43
oxygen sensor on the CTD frame, calibrated using Winklertitrations on discretely collected samples from the CTDrosette. Underway seawater temperature and salinity weredetermined using the ship’s thermosalinograph. Underwayand CTD salinity measurements were calibrated using dis-cretely collected salinity samples, analyzed at sea using asalinometer (Autosal, Guildline).
2.2. Nutrients, Trace Metals and Environmental Data
[10] Shipboard measurement of DFe (<0.2 mm) wasperformed by flow injection analysis with in-line pre-concentration on a column of immobilized 8-hydroxyquinoline(8-HQ) [Landing et al., 1986] and detection by chemilumi-nescence [de Jong et al., 1998; Obata et al., 1993]. At leasthalf an hour prior to analysis, hydrogen peroxide (Romil SpA)was added to the samples (40 mL 0.03% H2O2 (v/v) stocksolution to 40 mL sample) to oxidize any Fe(II) present.Samples were buffered in-line by addition of 2 M trace metalclean ammonium acetate buffer (Romil UHP ammonia andRomil SpA acetic acid) to obtain a final pH of�4.0. DissolvedFe was eluted from the column with 0.3 M HCl (Romil SpA).Chemiluminescence was induced by mixing the eluent witha 0.5 M hydrogen peroxide (Romil SpA) solution, a 0.8 Mammonia (Romil SpA) solution and last with the luminolsolution consisting of 0.3 mM luminol (Sigma, used asreceived), 0.38 mM sodium carbonate (Sigma, gradeSigmaUltra) and 0.7 mM triethylenetetramine (Sigma).All solutions were prepared using 18.2 MW cm de-ionizedwater (MQ, Millipore).[11] The analytical blank was on average 0.042 �
0.018 nMDFe (n = 31) and the average detection limit (3s ofthe blank) was 0.022 � 0.017 nM DFe. An average con-centration of 0.60� 0.06 nMDFe (n = 7) was obtained for anFe reference material from the IRONAGES intercomparisonexercise (bottle 91), while the reported intercomparison valuewas 0.59 � 0.21 nM DFe [Bowie et al., 2006]. Analysis ofSAFE reference samples for surface waters gave 0.084 �0.007 nM and 0.086 � 0.005 nM DFe for SAFE-148s and
RIJKENBERG ET AL.: FLUXES AND DISTRIBUTION OF DISSOLVED Fe GB3004GB3004
2 of 15
SAFE-165s, respectively, and 0.92 � 0.01 nM and 0.95 �0.02 nM DFe for the deep samples SAFE-336d and SAFE-458d, respectively. Reported consensus concentrations of theSAFE surface and deep samples are 0.097 � 0.043 nM and0.91 � 0.17 nM DFe, respectively (http://www.geotraces.org/science/intercalibration).[12] Dissolved Al was determined using a flow-injection
fluorescence method with lumogallion as the fluorescentreagent [Brown and Bruland, 2008]. Apparent oxygen uti-lization (AOU) was calculated by subtracting the measuredoxygen content from the oxygen saturation value [Fofonoffand Millard, 1983]. Phosphate was determined colorimetri-cally using the molybdenum blue method achieving adetection limit of 0.8 nM [Patey et al., 2008]. Silicate wasmeasured on a Skalar Sanplus segmented-flow autoanalyzeraccording to Kirkwood [1996].
2.3. Aerosol Sampling and Analysis
[13] Aerosols were collected on the RRS Discovery usinga high volume (1 m3 min�1) aerosol sampler equipped with aSierra-type cascade impactor for separation of particles intocoarse (>1 mm diameter) and fine (<1 mm diameter) frac-tions. The soluble Fe and Al fraction of these samples weredetermined in a land-based laboratory by an ammoniumacetate leach (pH 4.7, 1–2 h). The sampling and analysismethods employed have previously been described in detail[Baker et al., 2006; Sarthou et al., 2003]. Depositionvelocities were based on a model by Ganzeveld et al. [1998]
that takes into account the particle mass median diameter(MMD), wind speed, and values for the overall oceanic meanhumidity and whitecapping [Ganzeveld et al., 1998]. MMDsof 0.6 mm, for the fine fraction, and 5 mm, for the coarsefraction, were used based on data obtained from a Saharandust aerosol sample that was segregated into 7 different sizefractions during cruise ANT18-I [Sarthou et al., 2003],according to the method of Arimoto and Duce [1986]. Detailsof this procedure can be found in Powell [2011].
2.4. Vertical Eddy Diffusivity Determinations UsingCTD Data
[14] The Thorpe scale, a vertical length scale of turbulentmixing in a stratified flow [Thorpe, 1977], was used tocalculate the vertical turbulent eddy diffusivity (Kz) from0.5 m binned CTD data. Rearrangement of an observedpotential density profile, which may contain inversionsassociated with turbulent overturns, into a stable profilewithout inversions provided the vertical displacement nec-essary for generating a stable profile and is defined as theThorpe displacement. Occasional T-S loopings due to sen-sor mismatch of the temperature-conductivity sensor wereremoved [Galbraith and Kelley, 1996]. With dT as the rootmean square of the Thorpe displacements within eachoverturn, the eddy diffusivity (m2 s�1) is defined as,
Kz ¼ 0:128 dT2N ð1Þ
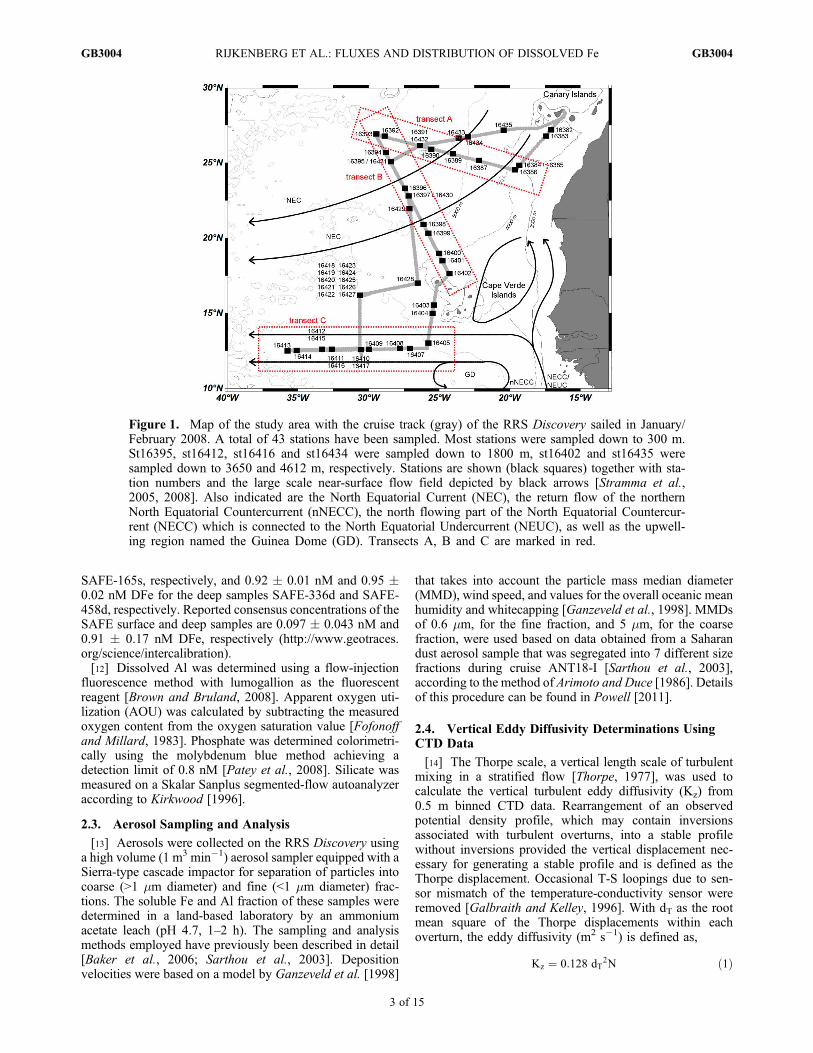
Figure 1. Map of the study area with the cruise track (gray) of the RRS Discovery sailed in January/February 2008. A total of 43 stations have been sampled. Most stations were sampled down to 300 m.St16395, st16412, st16416 and st16434 were sampled down to 1800 m, st16402 and st16435 weresampled down to 3650 and 4612 m, respectively. Stations are shown (black squares) together with sta-tion numbers and the large scale near-surface flow field depicted by black arrows [Stramma et al.,2005, 2008]. Also indicated are the North Equatorial Current (NEC), the return flow of the northernNorth Equatorial Countercurrent (nNECC), the north flowing part of the North Equatorial Countercur-rent (NECC) which is connected to the North Equatorial Undercurrent (NEUC), as well as the upwell-ing region named the Guinea Dome (GD). Transects A, B and C are marked in red.
RIJKENBERG ET AL.: FLUXES AND DISTRIBUTION OF DISSOLVED Fe GB3004GB3004
3 of 15
where N denotes the buoyancy frequency and the constant0.128 follows from an empirical relation with the Ozmidovscale using a mixing efficiency of 0.2 [Dillon, 1982]. Themethod of overturn displacements provides an estimate ofvertical turbulent eddy diffusivity and dissipation rate towithin a factor of two compared with free-falling micro-structure data [e.g., Hosegood et al., 2005]. From the rawKz(z) profiles determined between the near-surface mixedlayer depth (MLD) and MLD-50 m, a mean value wascalculated and used to estimate fluxes for DFe.
3. Results and Discussion
3.1. Hydrography
[15] The study area is characterized by a complex currentsystem in the upper 100 m of the water column [Strammaand Schott, 1999]. The Canary Current (CC) is a surface
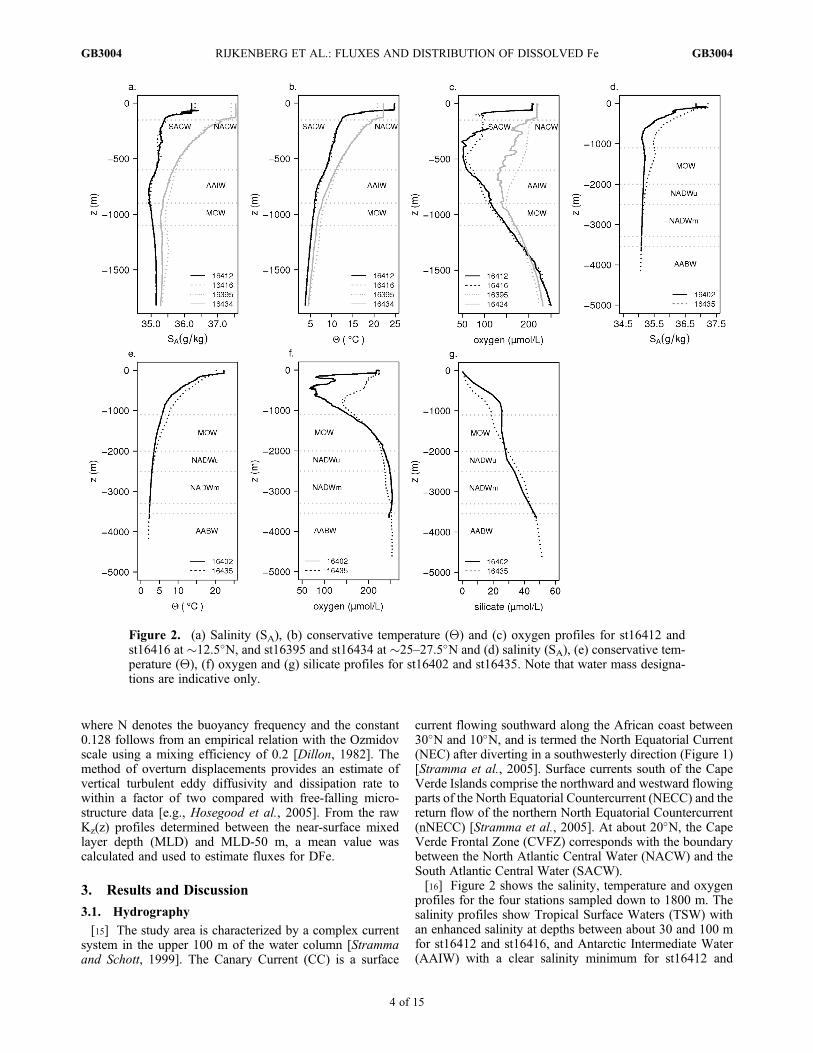
current flowing southward along the African coast between30�N and 10�N, and is termed the North Equatorial Current(NEC) after diverting in a southwesterly direction (Figure 1)[Stramma et al., 2005]. Surface currents south of the CapeVerde Islands comprise the northward and westward flowingparts of the North Equatorial Countercurrent (NECC) and thereturn flow of the northern North Equatorial Countercurrent(nNECC) [Stramma et al., 2005]. At about 20�N, the CapeVerde Frontal Zone (CVFZ) corresponds with the boundarybetween the North Atlantic Central Water (NACW) and theSouth Atlantic Central Water (SACW).[16] Figure 2 shows the salinity, temperature and oxygen
profiles for the four stations sampled down to 1800 m. Thesalinity profiles show Tropical Surface Waters (TSW) withan enhanced salinity at depths between about 30 and 100 mfor st16412 and st16416, and Antarctic Intermediate Water(AAIW) with a clear salinity minimum for st16412 and
Figure 2. (a) Salinity (SA), (b) conservative temperature (Q) and (c) oxygen profiles for st16412 andst16416 at �12.5�N, and st16395 and st16434 at �25–27.5�N and (d) salinity (SA), (e) conservative tem-perature (Q), (f) oxygen and (g) silicate profiles for st16402 and st16435. Note that water mass designa-tions are indicative only.
RIJKENBERG ET AL.: FLUXES AND DISTRIBUTION OF DISSOLVED Fe GB3004GB3004
4 of 15
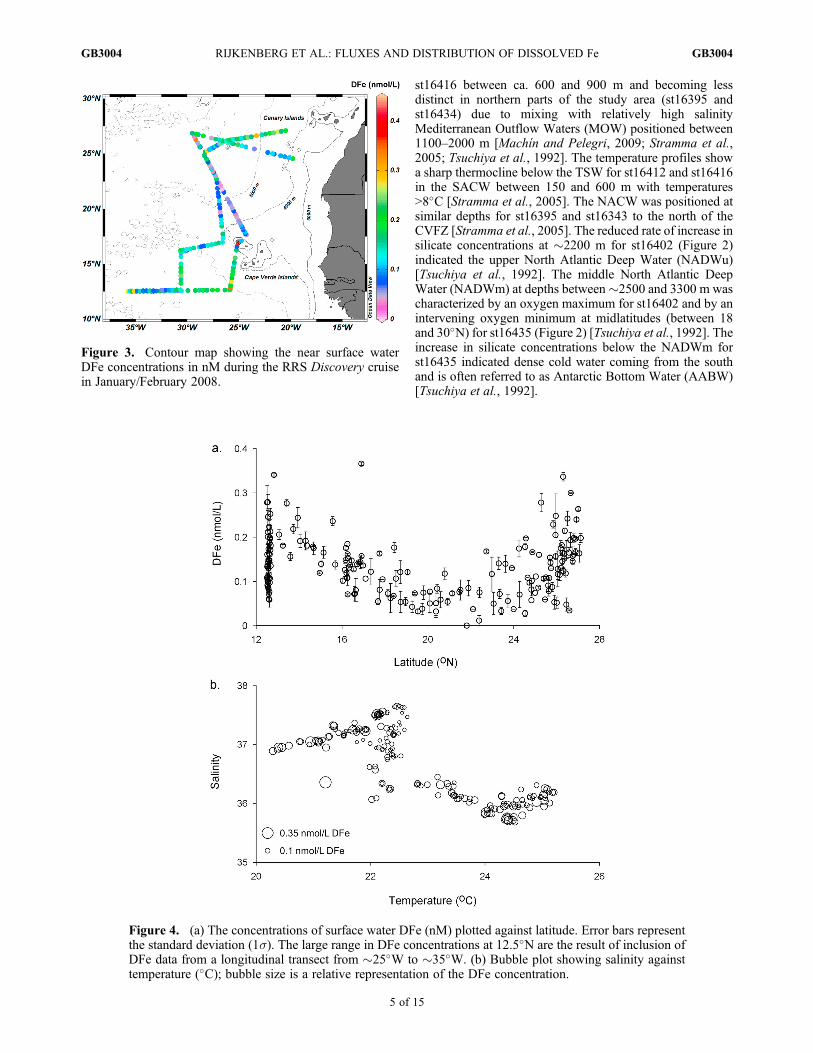
st16416 between ca. 600 and 900 m and becoming lessdistinct in northern parts of the study area (st16395 andst16434) due to mixing with relatively high salinityMediterranean Outflow Waters (MOW) positioned between1100–2000 m [Machín and Pelegri, 2009; Stramma et al.,2005; Tsuchiya et al., 1992]. The temperature profiles showa sharp thermocline below the TSW for st16412 and st16416in the SACW between 150 and 600 m with temperatures>8�C [Stramma et al., 2005]. The NACW was positioned atsimilar depths for st16395 and st16343 to the north of theCVFZ [Stramma et al., 2005]. The reduced rate of increase insilicate concentrations at �2200 m for st16402 (Figure 2)indicated the upper North Atlantic Deep Water (NADWu)[Tsuchiya et al., 1992]. The middle North Atlantic DeepWater (NADWm) at depths between�2500 and 3300 m wascharacterized by an oxygen maximum for st16402 and by anintervening oxygen minimum at midlatitudes (between 18and 30�N) for st16435 (Figure 2) [Tsuchiya et al., 1992]. Theincrease in silicate concentrations below the NADWm forst16435 indicated dense cold water coming from the southand is often referred to as Antarctic Bottom Water (AABW)[Tsuchiya et al., 1992].
Figure 3. Contour map showing the near surface waterDFe concentrations in nM during the RRS Discovery cruisein January/February 2008.
Figure 4. (a) The concentrations of surface water DFe (nM) plotted against latitude. Error bars representthe standard deviation (1s). The large range in DFe concentrations at 12.5�N are the result of inclusion ofDFe data from a longitudinal transect from �25�W to �35�W. (b) Bubble plot showing salinity againsttemperature (�C); bubble size is a relative representation of the DFe concentration.
RIJKENBERG ET AL.: FLUXES AND DISTRIBUTION OF DISSOLVED Fe GB3004GB3004
5 of 15
3.2. Distribution of Surface Water Dissolved Fe
[17] The surface water DFe concentrations ranged between<0.1 nM and 0.37 nM, with an average of 0.13 � 0.07 nMDFe (1s, n = 194) (Figure 3). A similar range, with DFeconcentrations between 0.1 and 0.4 nM, was observed in2006 in the vicinity of the Cape Verde islands [Rijkenberget al., 2008b]. Furthermore, DFe concentrations were repor-ted to range between �0.2 and 0.55 nM along a meridionaltransect along �19�W [Sarthou et al., 2003]. In contrastto the distribution of surface DFe concentrations in 2006[Rijkenberg et al., 2008b], the DFe concentrations in thislarger scale study of 2008 showed a clear latitudinal pat-tern (Figure 4a). The observed low DFe concentrations in2008 coincided with a complex temperature-salinity pat-tern in the vicinity of the CVFZ (Figure 4b).[18] In 2008, strong atmospheric dust events were encoun-
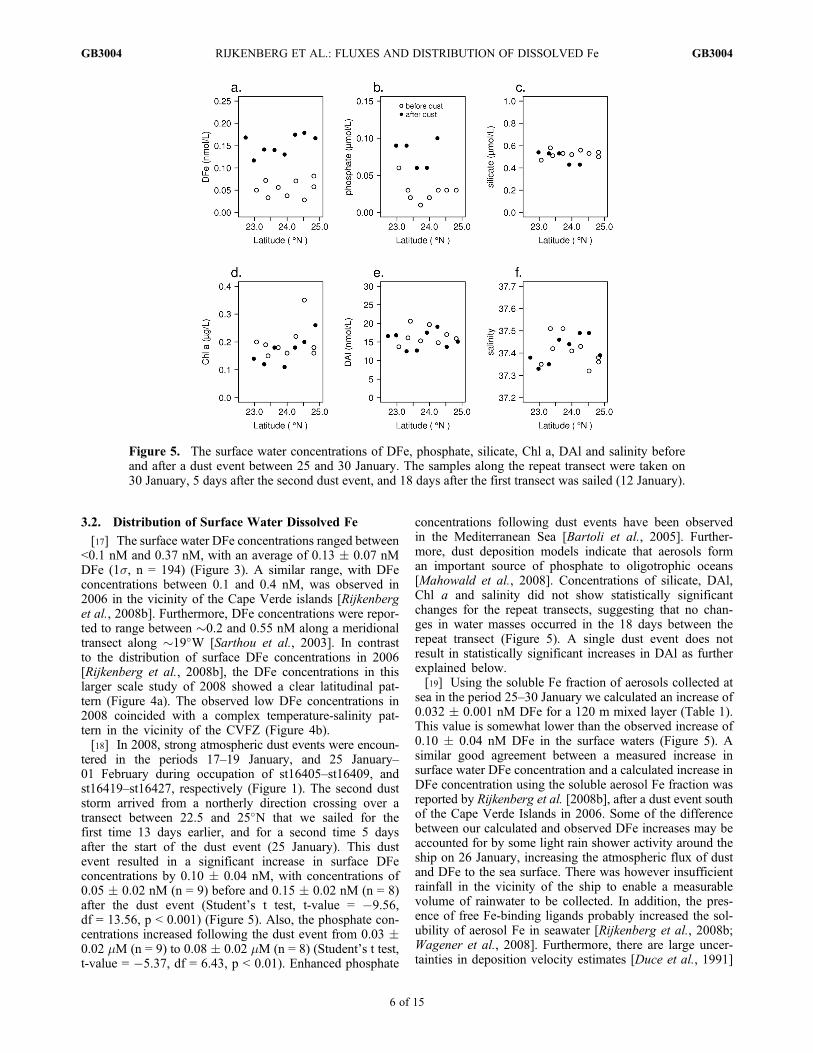
tered in the periods 17–19 January, and 25 January–01 February during occupation of st16405–st16409, andst16419–st16427, respectively (Figure 1). The second duststorm arrived from a northerly direction crossing over atransect between 22.5 and 25�N that we sailed for thefirst time 13 days earlier, and for a second time 5 daysafter the start of the dust event (25 January). This dustevent resulted in a significant increase in surface DFeconcentrations by 0.10 � 0.04 nM, with concentrations of0.05 � 0.02 nM (n = 9) before and 0.15 � 0.02 nM (n = 8)after the dust event (Student’s t test, t-value = �9.56,df = 13.56, p < 0.001) (Figure 5). Also, the phosphate con-centrations increased following the dust event from 0.03 �0.02 mM (n = 9) to 0.08 � 0.02 mM (n = 8) (Student’s t test,t-value = �5.37, df = 6.43, p < 0.01). Enhanced phosphate
concentrations following dust events have been observedin the Mediterranean Sea [Bartoli et al., 2005]. Further-more, dust deposition models indicate that aerosols forman important source of phosphate to oligotrophic oceans[Mahowald et al., 2008]. Concentrations of silicate, DAl,Chl a and salinity did not show statistically significantchanges for the repeat transects, suggesting that no chan-ges in water masses occurred in the 18 days between therepeat transect (Figure 5). A single dust event does notresult in statistically significant increases in DAl as furtherexplained below.[19] Using the soluble Fe fraction of aerosols collected at
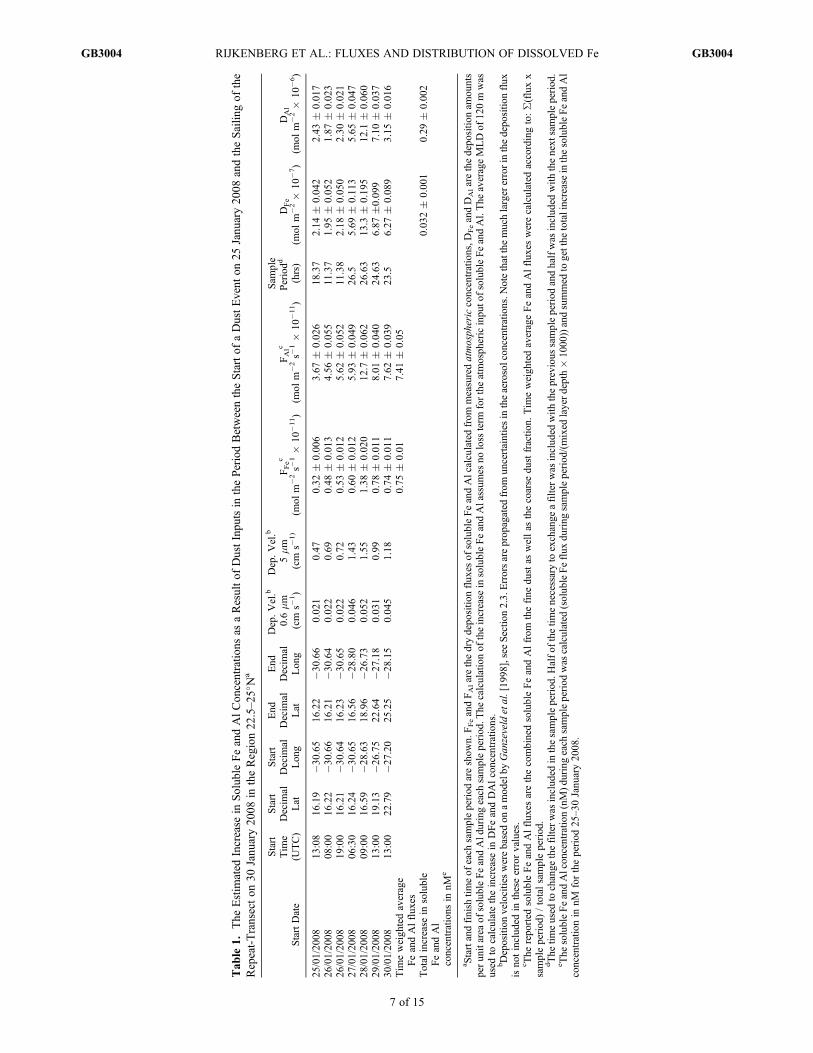
sea in the period 25–30 January we calculated an increase of0.032 � 0.001 nM DFe for a 120 m mixed layer (Table 1).This value is somewhat lower than the observed increase of0.10 � 0.04 nM DFe in the surface waters (Figure 5). Asimilar good agreement between a measured increase insurface water DFe concentration and a calculated increase inDFe concentration using the soluble aerosol Fe fraction wasreported by Rijkenberg et al. [2008b], after a dust event southof the Cape Verde Islands in 2006. Some of the differencebetween our calculated and observed DFe increases may beaccounted for by some light rain shower activity around theship on 26 January, increasing the atmospheric flux of dustand DFe to the sea surface. There was however insufficientrainfall in the vicinity of the ship to enable a measurablevolume of rainwater to be collected. In addition, the pres-ence of free Fe-binding ligands probably increased the sol-ubility of aerosol Fe in seawater [Rijkenberg et al., 2008b;Wagener et al., 2008]. Furthermore, there are large uncer-tainties in deposition velocity estimates [Duce et al., 1991]
Figure 5. The surface water concentrations of DFe, phosphate, silicate, Chl a, DAl and salinity beforeand after a dust event between 25 and 30 January. The samples along the repeat transect were taken on30 January, 5 days after the second dust event, and 18 days after the first transect was sailed (12 January).
RIJKENBERG ET AL.: FLUXES AND DISTRIBUTION OF DISSOLVED Fe GB3004GB3004
6 of 15
Tab
le1.
The
Estim
ated
Increase
inSolub
leFeandAlCon
centratio
nsas
aResultof
DustInpu
tsin
thePeriodBetweentheStartof
aDustEvent
on25
Janu
ary20
08andtheSailin
gof
the
Repeat-Transecton
30Janu
ary20
08in
theRegion22
.5–25�Na
StartDate
Start
Tim
e(U
TC)
Start
Decim
alLat
Start
Decim
alLon
g
End
Decim
alLat
End
Decim
alLon
g
Dep.Vel.b
0.6mm
(cm
s�1)
Dep.Vel.b
5mm
(cm
s�1)
FFec
(mol
m�2s�
1�
10�11)
FAlc
(mol
m�2s�
1�
10�11)
Sam
ple
Periodd
(hrs)
DFe
(mol
m�2�
10�7)
DAl
(mol
m�2�
10�6)
25/01/20
0813
:08
16.19
�30.65
16.22
�30.66
0.02
10.47
0.32
�0.00
63.67
�0.02
618
.37
2.14
�0.04
22.43
�0.01
726
/01/20
0808
:00
16.22
�30.66
16.21
�30.64
0.02
20.69
0.48
�0.01
34.56
�0.05
511
.37
1.95
�0.05
21.87
�0.02
326
/01/20
0819
:00
16.21
�30.64
16.23
�30.65
0.02
20.72
0.53
�0.01
25.62
�0.05
211
.38
2.18
�0.05
02.30
�0.02
127
/01/20
0806
:30
16.24
�30.65
16.56
�28.80
0.04
61.43
0.60
�0.01
25.93
�0.04
926
.55.69
�0.11
35.65
�0.04
728
/01/20
0809
:00
16.59
�28.63
18.96
�26.73
0.05
21.55
1.38
�0.02
012
.7�
0.06
226
.63
13.3
�0.19
512
.1�
0.06
029
/01/20
0813
:00
19.13
�26.75
22.64
�27.18
0.03
10.99
0.78
�0.01
18.01
�0.04
024
.63
6.87
�0.099
7.10
�0.03
730
/01/20
0813
:00
22.79
�27.20
25.25
�28.15
0.04
51.18
0.74
�0.01
17.62
�0.03
923
.56.27
�0.08
93.15
�0.01
6Tim
eweigh
tedaverage
FeandAlflux
es0.75
�0.01
7.41
�0.05
Total
increase
insoluble
FeandAl
concentrations
innM
e
0.03
2�
0.00
10.29
�0.00
2
a Startandfinish
timeof
each
sampleperiod
areshow
n.FFeandFAlarethedrydepo
sitio
nflux
esof
solubleFeandAlcalculatedfrom
measuredatmosph
ericconcentrations,D
FeandDAlarethedepo
sitio
nam
ounts
perun
itarea
ofsolubleFeandAld
uringeach
sampleperiod
.The
calculationof
theincrease
insolubleFeandAlassum
esno
loss
term
fortheatmosph
ericinpu
tofsolubleFeandAl.The
averageMLDof
120m
was
used
tocalculatetheincrease
inDFeandDAlconcentrations.
bDeposition
velocitieswerebasedon
amod
elby
Gan
zeveld
etal.[19
98],seeSectio
n2.3.Errorsareprop
agated
from
uncertaintiesin
theaerosolcon
centratio
ns.N
otethatthemuchlargererrorin
thedepo
sitio
nflux
isno
tinclud
edin
theseerrorvalues.
c The
repo
rted
solubleFeandAlflux
esarethecombinedsolubleFeandAlfrom
thefine
dustas
wellas
thecoarse
dustfractio
n.Tim
eweigh
tedaverageFeandAlflux
eswerecalculated
accordingto:S(fluxx
sampleperiod
)/totalsampleperiod
.dThe
timeused
tochange
thefilterwas
includ
edinthesampleperiod
.Halfof
thetim
enecessaryto
exchange
afilterwas
includ
edwith
theprevious
sampleperiod
andhalfwas
includ
edwith
thenext
sampleperiod
.e The
solubleFeandAlcon
centratio
n(nM)d
uringeach
sampleperiod
was
calculated
(solub
leFeflux
during
sampleperiod
/(mixed
layerdepth�10
00))andsummed
togetthe
totalincreaseinthesolubleFeandAl
concentrationin
nMfortheperiod
25–30Janu
ary20
08.
RIJKENBERG ET AL.: FLUXES AND DISTRIBUTION OF DISSOLVED Fe GB3004GB3004
7 of 15
and the deposition of dust can be quite variable in space andtime potentially resulting in differences between the mea-sured and the calculated increase in DFe.[20] Although DAl is often used as a proxy of dust input
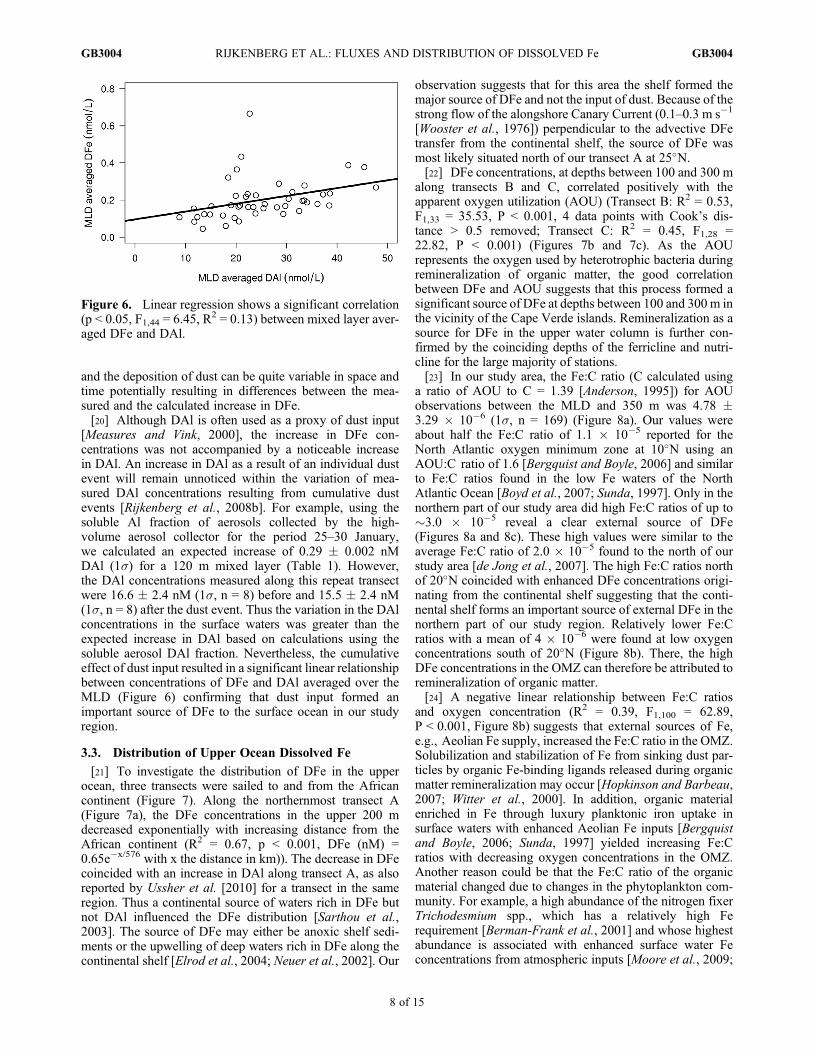
[Measures and Vink, 2000], the increase in DFe con-centrations was not accompanied by a noticeable increasein DAl. An increase in DAl as a result of an individual dustevent will remain unnoticed within the variation of mea-sured DAl concentrations resulting from cumulative dustevents [Rijkenberg et al., 2008b]. For example, using thesoluble Al fraction of aerosols collected by the high-volume aerosol collector for the period 25–30 January,we calculated an expected increase of 0.29 � 0.002 nMDAl (1s) for a 120 m mixed layer (Table 1). However,the DAl concentrations measured along this repeat transectwere 16.6 � 2.4 nM (1s, n = 8) before and 15.5 � 2.4 nM(1s, n = 8) after the dust event. Thus the variation in the DAlconcentrations in the surface waters was greater than theexpected increase in DAl based on calculations using thesoluble aerosol DAl fraction. Nevertheless, the cumulativeeffect of dust input resulted in a significant linear relationshipbetween concentrations of DFe and DAl averaged over theMLD (Figure 6) confirming that dust input formed animportant source of DFe to the surface ocean in our studyregion.
3.3. Distribution of Upper Ocean Dissolved Fe
[21] To investigate the distribution of DFe in the upperocean, three transects were sailed to and from the Africancontinent (Figure 7). Along the northernmost transect A(Figure 7a), the DFe concentrations in the upper 200 mdecreased exponentially with increasing distance from theAfrican continent (R2 = 0.67, p < 0.001, DFe (nM) =0.65e�x/576 with x the distance in km)). The decrease in DFecoincided with an increase in DAl along transect A, as alsoreported by Ussher et al. [2010] for a transect in the sameregion. Thus a continental source of waters rich in DFe butnot DAl influenced the DFe distribution [Sarthou et al.,2003]. The source of DFe may either be anoxic shelf sedi-ments or the upwelling of deep waters rich in DFe along thecontinental shelf [Elrod et al., 2004; Neuer et al., 2002]. Our
observation suggests that for this area the shelf formed themajor source of DFe and not the input of dust. Because of thestrong flow of the alongshore Canary Current (0.1–0.3 m s�1
[Wooster et al., 1976]) perpendicular to the advective DFetransfer from the continental shelf, the source of DFe wasmost likely situated north of our transect A at 25�N.[22] DFe concentrations, at depths between 100 and 300 m
along transects B and C, correlated positively with theapparent oxygen utilization (AOU) (Transect B: R2 = 0.53,F1,33 = 35.53, P < 0.001, 4 data points with Cook’s dis-tance > 0.5 removed; Transect C: R2 = 0.45, F1,28 =22.82, P < 0.001) (Figures 7b and 7c). As the AOUrepresents the oxygen used by heterotrophic bacteria duringremineralization of organic matter, the good correlationbetween DFe and AOU suggests that this process formed asignificant source of DFe at depths between 100 and 300 m inthe vicinity of the Cape Verde islands. Remineralization as asource for DFe in the upper water column is further con-firmed by the coinciding depths of the ferricline and nutri-cline for the large majority of stations.[23] In our study area, the Fe:C ratio (C calculated using
a ratio of AOU to C = 1.39 [Anderson, 1995]) for AOUobservations between the MLD and 350 m was 4.78 �3.29 � 10�6 (1s, n = 169) (Figure 8a). Our values wereabout half the Fe:C ratio of 1.1 � 10�5 reported for theNorth Atlantic oxygen minimum zone at 10�N using anAOU:C ratio of 1.6 [Bergquist and Boyle, 2006] and similarto Fe:C ratios found in the low Fe waters of the NorthAtlantic Ocean [Boyd et al., 2007; Sunda, 1997]. Only in thenorthern part of our study area did high Fe:C ratios of up to�3.0 � 10�5 reveal a clear external source of DFe(Figures 8a and 8c). These high values were similar to theaverage Fe:C ratio of 2.0 � 10�5 found to the north of ourstudy area [de Jong et al., 2007]. The high Fe:C ratios northof 20�N coincided with enhanced DFe concentrations origi-nating from the continental shelf suggesting that the conti-nental shelf forms an important source of external DFe in thenorthern part of our study region. Relatively lower Fe:Cratios with a mean of 4 � 10�6 were found at low oxygenconcentrations south of 20�N (Figure 8b). There, the highDFe concentrations in the OMZ can therefore be attributed toremineralization of organic matter.[24] A negative linear relationship between Fe:C ratios
and oxygen concentration (R2 = 0.39, F1,100 = 62.89,P < 0.001, Figure 8b) suggests that external sources of Fe,e.g., Aeolian Fe supply, increased the Fe:C ratio in the OMZ.Solubilization and stabilization of Fe from sinking dust par-ticles by organic Fe-binding ligands released during organicmatter remineralization may occur [Hopkinson and Barbeau,2007; Witter et al., 2000]. In addition, organic materialenriched in Fe through luxury planktonic iron uptake insurface waters with enhanced Aeolian Fe inputs [Bergquistand Boyle, 2006; Sunda, 1997] yielded increasing Fe:Cratios with decreasing oxygen concentrations in the OMZ.Another reason could be that the Fe:C ratio of the organicmaterial changed due to changes in the phytoplankton com-munity. For example, a high abundance of the nitrogen fixerTrichodesmium spp., which has a relatively high Ferequirement [Berman-Frank et al., 2001] and whose highestabundance is associated with enhanced surface water Feconcentrations from atmospheric inputs [Moore et al., 2009;
Figure 6. Linear regression shows a significant correlation(p < 0.05, F1,44 = 6.45, R2 = 0.13) between mixed layer aver-aged DFe and DAl.
RIJKENBERG ET AL.: FLUXES AND DISTRIBUTION OF DISSOLVED Fe GB3004GB3004
8 of 15
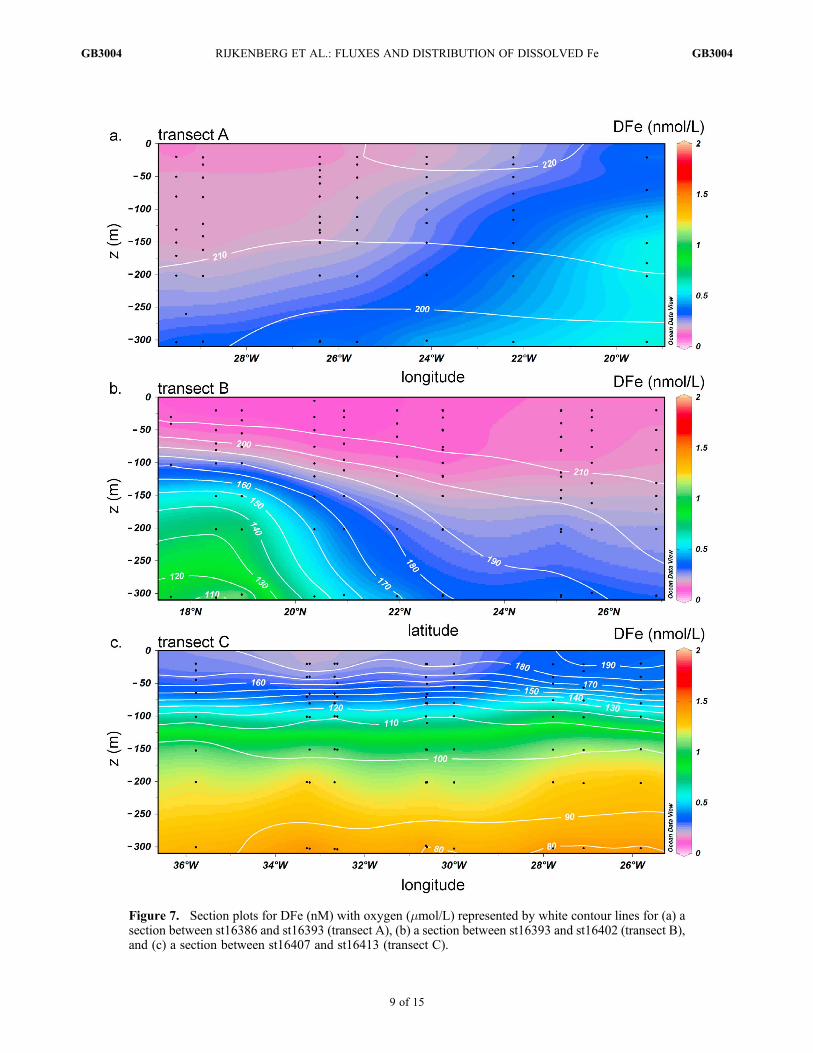
Figure 7. Section plots for DFe (nM) with oxygen (mmol/L) represented by white contour lines for (a) asection between st16386 and st16393 (transect A), (b) a section between st16393 and st16402 (transect B),and (c) a section between st16407 and st16413 (transect C).
RIJKENBERG ET AL.: FLUXES AND DISTRIBUTION OF DISSOLVED Fe GB3004GB3004
9 of 15
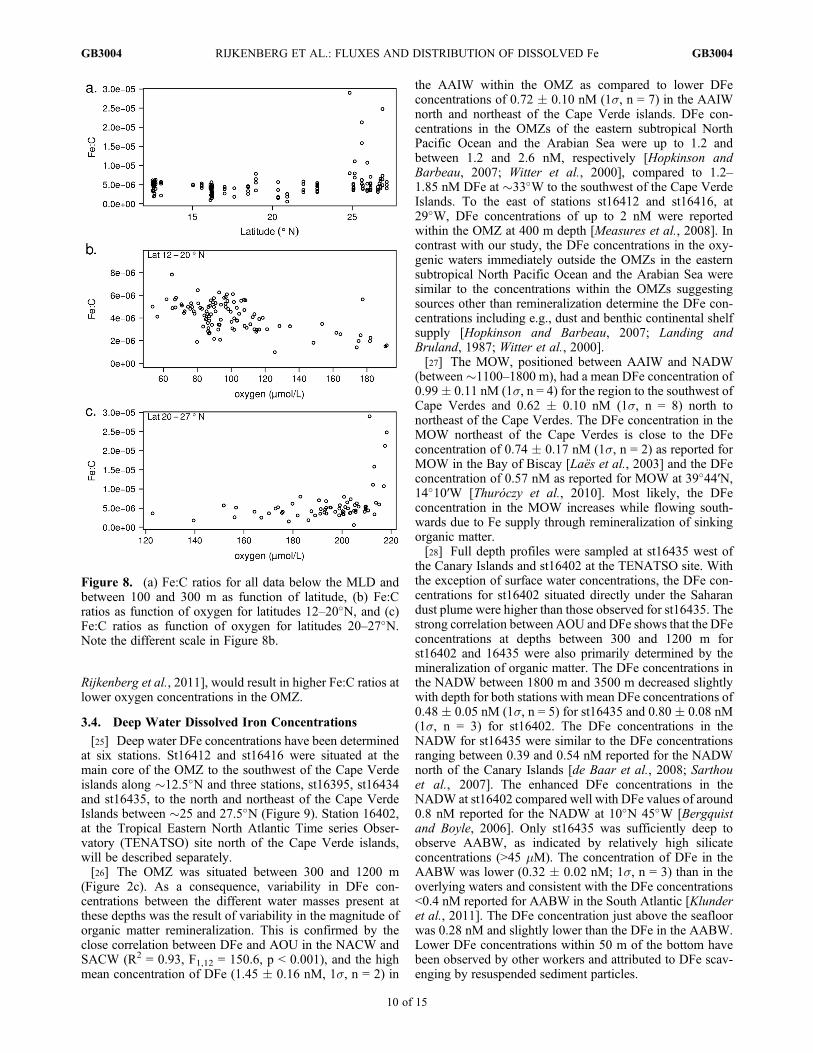
Rijkenberg et al., 2011], would result in higher Fe:C ratios atlower oxygen concentrations in the OMZ.
3.4. Deep Water Dissolved Iron Concentrations
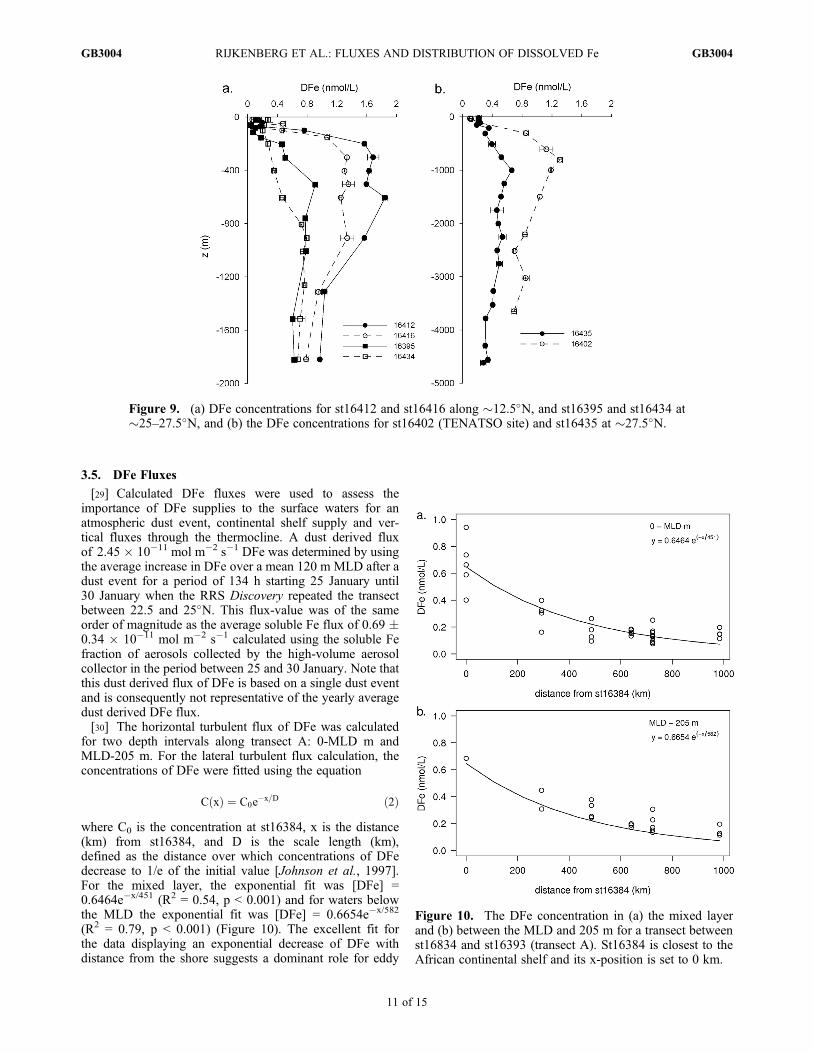
[25] Deep water DFe concentrations have been determinedat six stations. St16412 and st16416 were situated at themain core of the OMZ to the southwest of the Cape Verdeislands along �12.5�N and three stations, st16395, st16434and st16435, to the north and northeast of the Cape VerdeIslands between �25 and 27.5�N (Figure 9). Station 16402,at the Tropical Eastern North Atlantic Time series Obser-vatory (TENATSO) site north of the Cape Verde islands,will be described separately.[26] The OMZ was situated between 300 and 1200 m
(Figure 2c). As a consequence, variability in DFe con-centrations between the different water masses present atthese depths was the result of variability in the magnitude oforganic matter remineralization. This is confirmed by theclose correlation between DFe and AOU in the NACW andSACW (R2 = 0.93, F1,12 = 150.6, p < 0.001), and the highmean concentration of DFe (1.45 � 0.16 nM, 1s, n = 2) in
the AAIW within the OMZ as compared to lower DFeconcentrations of 0.72 � 0.10 nM (1s, n = 7) in the AAIWnorth and northeast of the Cape Verde islands. DFe con-centrations in the OMZs of the eastern subtropical NorthPacific Ocean and the Arabian Sea were up to 1.2 andbetween 1.2 and 2.6 nM, respectively [Hopkinson andBarbeau, 2007; Witter et al., 2000], compared to 1.2–1.85 nM DFe at �33�W to the southwest of the Cape VerdeIslands. To the east of stations st16412 and st16416, at29�W, DFe concentrations of up to 2 nM were reportedwithin the OMZ at 400 m depth [Measures et al., 2008]. Incontrast with our study, the DFe concentrations in the oxy-genic waters immediately outside the OMZs in the easternsubtropical North Pacific Ocean and the Arabian Sea weresimilar to the concentrations within the OMZs suggestingsources other than remineralization determine the DFe con-centrations including e.g., dust and benthic continental shelfsupply [Hopkinson and Barbeau, 2007; Landing andBruland, 1987; Witter et al., 2000].[27] The MOW, positioned between AAIW and NADW
(between �1100–1800 m), had a mean DFe concentration of0.99� 0.11 nM (1s, n = 4) for the region to the southwest ofCape Verdes and 0.62 � 0.10 nM (1s, n = 8) north tonortheast of the Cape Verdes. The DFe concentration in theMOW northeast of the Cape Verdes is close to the DFeconcentration of 0.74 � 0.17 nM (1s, n = 2) as reported forMOW in the Bay of Biscay [Laës et al., 2003] and the DFeconcentration of 0.57 nM as reported for MOW at 39�44′N,14�10′W [Thuróczy et al., 2010]. Most likely, the DFeconcentration in the MOW increases while flowing south-wards due to Fe supply through remineralization of sinkingorganic matter.[28] Full depth profiles were sampled at st16435 west of
the Canary Islands and st16402 at the TENATSO site. Withthe exception of surface water concentrations, the DFe con-centrations for st16402 situated directly under the Saharandust plume were higher than those observed for st16435. Thestrong correlation between AOU and DFe shows that the DFeconcentrations at depths between 300 and 1200 m forst16402 and 16435 were also primarily determined by themineralization of organic matter. The DFe concentrations inthe NADW between 1800 m and 3500 m decreased slightlywith depth for both stations with mean DFe concentrations of0.48 � 0.05 nM (1s, n = 5) for st16435 and 0.80 � 0.08 nM(1s, n = 3) for st16402. The DFe concentrations in theNADW for st16435 were similar to the DFe concentrationsranging between 0.39 and 0.54 nM reported for the NADWnorth of the Canary Islands [de Baar et al., 2008; Sarthouet al., 2007]. The enhanced DFe concentrations in theNADW at st16402 compared well with DFe values of around0.8 nM reported for the NADW at 10�N 45�W [Bergquistand Boyle, 2006]. Only st16435 was sufficiently deep toobserve AABW, as indicated by relatively high silicateconcentrations (>45 mM). The concentration of DFe in theAABW was lower (0.32 � 0.02 nM; 1s, n = 3) than in theoverlying waters and consistent with the DFe concentrations<0.4 nM reported for AABW in the South Atlantic [Klunderet al., 2011]. The DFe concentration just above the seafloorwas 0.28 nM and slightly lower than the DFe in the AABW.Lower DFe concentrations within 50 m of the bottom havebeen observed by other workers and attributed to DFe scav-enging by resuspended sediment particles.
Figure 8. (a) Fe:C ratios for all data below the MLD andbetween 100 and 300 m as function of latitude, (b) Fe:Cratios as function of oxygen for latitudes 12–20�N, and (c)Fe:C ratios as function of oxygen for latitudes 20–27�N.Note the different scale in Figure 8b.
RIJKENBERG ET AL.: FLUXES AND DISTRIBUTION OF DISSOLVED Fe GB3004GB3004
10 of 15
3.5. DFe Fluxes
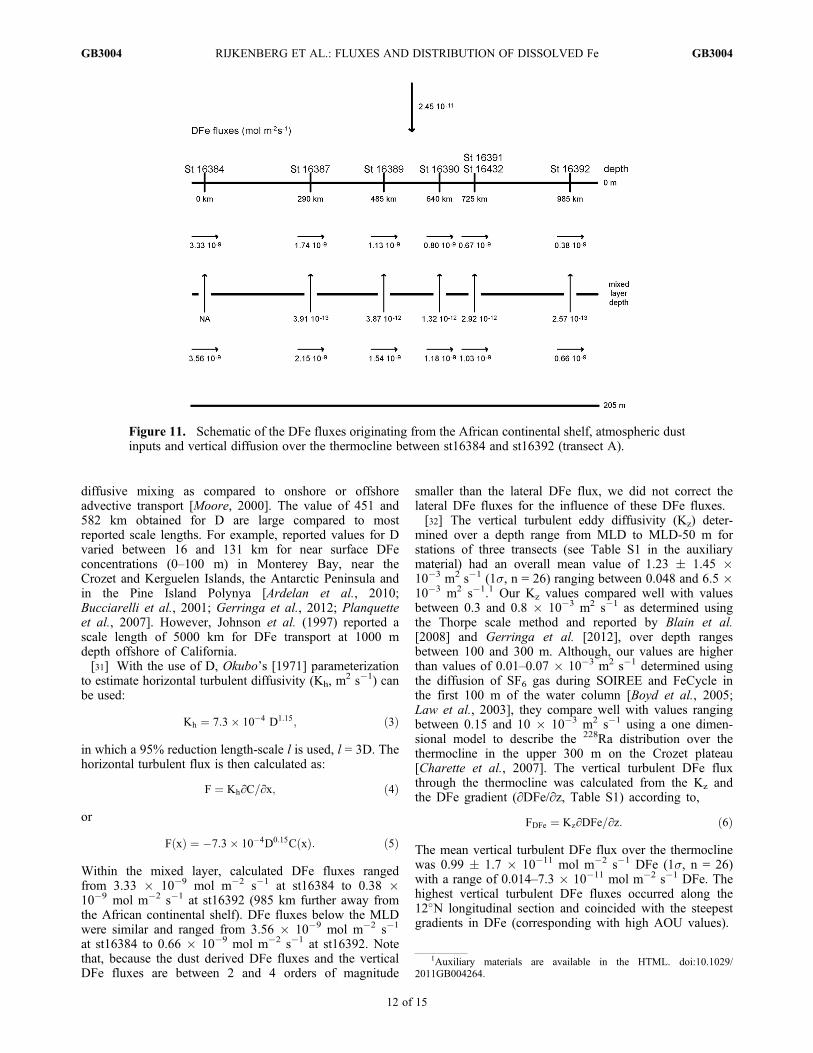
[29] Calculated DFe fluxes were used to assess theimportance of DFe supplies to the surface waters for anatmospheric dust event, continental shelf supply and ver-tical fluxes through the thermocline. A dust derived fluxof 2.45 � 10�11 mol m�2 s�1 DFe was determined by usingthe average increase in DFe over a mean 120 m MLD after adust event for a period of 134 h starting 25 January until30 January when the RRS Discovery repeated the transectbetween 22.5 and 25�N. This flux-value was of the sameorder of magnitude as the average soluble Fe flux of 0.69 �0.34 � 10�11 mol m�2 s�1 calculated using the soluble Fefraction of aerosols collected by the high-volume aerosolcollector in the period between 25 and 30 January. Note thatthis dust derived flux of DFe is based on a single dust eventand is consequently not representative of the yearly averagedust derived DFe flux.[30] The horizontal turbulent flux of DFe was calculated
for two depth intervals along transect A: 0-MLD m andMLD-205 m. For the lateral turbulent flux calculation, theconcentrations of DFe were fitted using the equation
C xð Þ ¼ C0e�x=D ð2Þ
where C0 is the concentration at st16384, x is the distance(km) from st16384, and D is the scale length (km),defined as the distance over which concentrations of DFedecrease to 1/e of the initial value [Johnson et al., 1997].For the mixed layer, the exponential fit was [DFe] =0.6464e�x/451 (R2 = 0.54, p < 0.001) and for waters belowthe MLD the exponential fit was [DFe] = 0.6654e�x/582
(R2 = 0.79, p < 0.001) (Figure 10). The excellent fit forthe data displaying an exponential decrease of DFe withdistance from the shore suggests a dominant role for eddy
Figure 9. (a) DFe concentrations for st16412 and st16416 along �12.5�N, and st16395 and st16434 at�25–27.5�N, and (b) the DFe concentrations for st16402 (TENATSO site) and st16435 at �27.5�N.
Figure 10. The DFe concentration in (a) the mixed layerand (b) between the MLD and 205 m for a transect betweenst16834 and st16393 (transect A). St16384 is closest to theAfrican continental shelf and its x-position is set to 0 km.
RIJKENBERG ET AL.: FLUXES AND DISTRIBUTION OF DISSOLVED Fe GB3004GB3004
11 of 15
diffusive mixing as compared to onshore or offshoreadvective transport [Moore, 2000]. The value of 451 and582 km obtained for D are large compared to mostreported scale lengths. For example, reported values for Dvaried between 16 and 131 km for near surface DFeconcentrations (0–100 m) in Monterey Bay, near theCrozet and Kerguelen Islands, the Antarctic Peninsula andin the Pine Island Polynya [Ardelan et al., 2010;Bucciarelli et al., 2001; Gerringa et al., 2012; Planquetteet al., 2007]. However, Johnson et al. (1997) reported ascale length of 5000 km for DFe transport at 1000 mdepth offshore of California.[31] With the use of D, Okubo’s [1971] parameterization
to estimate horizontal turbulent diffusivity (Kh, m2 s�1) can
be used:
Kh ¼ 7:3� 10�4 D1:15; ð3Þ
in which a 95% reduction length-scale l is used, l = 3D. Thehorizontal turbulent flux is then calculated as:
F ¼ Kh∂C=∂x; ð4Þ
or
F xð Þ ¼ �7:3� 10�4D0:15C xð Þ: ð5Þ
Within the mixed layer, calculated DFe fluxes rangedfrom 3.33 � 10�9 mol m�2 s�1 at st16384 to 0.38 �10�9 mol m�2 s�1 at st16392 (985 km further away fromthe African continental shelf). DFe fluxes below the MLDwere similar and ranged from 3.56 � 10�9 mol m�2 s�1
at st16384 to 0.66 � 10�9 mol m�2 s�1 at st16392. Notethat, because the dust derived DFe fluxes and the verticalDFe fluxes are between 2 and 4 orders of magnitude
smaller than the lateral DFe flux, we did not correct thelateral DFe fluxes for the influence of these DFe fluxes.[32] The vertical turbulent eddy diffusivity (Kz) deter-
mined over a depth range from MLD to MLD-50 m forstations of three transects (see Table S1 in the auxiliarymaterial) had an overall mean value of 1.23 � 1.45 �10�3 m2 s�1 (1s, n = 26) ranging between 0.048 and 6.5 �10�3 m2 s�1.1 Our Kz values compared well with valuesbetween 0.3 and 0.8 � 10�3 m2 s�1 as determined usingthe Thorpe scale method and reported by Blain et al.[2008] and Gerringa et al. [2012], over depth rangesbetween 100 and 300 m. Although, our values are higherthan values of 0.01–0.07 � 10�3 m2 s�1 determined usingthe diffusion of SF6 gas during SOIREE and FeCycle inthe first 100 m of the water column [Boyd et al., 2005;Law et al., 2003], they compare well with values rangingbetween 0.15 and 10 � 10�3 m2 s�1 using a one dimen-sional model to describe the 228Ra distribution over thethermocline in the upper 300 m on the Crozet plateau[Charette et al., 2007]. The vertical turbulent DFe fluxthrough the thermocline was calculated from the Kz andthe DFe gradient (∂DFe/∂z, Table S1) according to,
FDFe ¼ Kz∂DFe=∂z: ð6Þ
The mean vertical turbulent DFe flux over the thermoclinewas 0.99 � 1.7 � 10�11 mol m�2 s�1 DFe (1s, n = 26)with a range of 0.014–7.3 � 10�11 mol m�2 s�1 DFe. Thehighest vertical turbulent DFe fluxes occurred along the12�N longitudinal section and coincided with the steepestgradients in DFe (corresponding with high AOU values).
1Auxiliary materials are available in the HTML. doi:10.1029/2011GB004264.
Figure 11. Schematic of the DFe fluxes originating from the African continental shelf, atmospheric dustinputs and vertical diffusion over the thermocline between st16384 and st16392 (transect A).
RIJKENBERG ET AL.: FLUXES AND DISTRIBUTION OF DISSOLVED Fe GB3004GB3004
12 of 15
[33] Along transect A, three fluxes of DFe to the surfaceocean could be distinguished including i) lateral diffusionfrom the continental shelf, ii) atmospheric dust deposition,and iii) vertical diffusion from below the thermocline.Figure 11 visualizes the fluxes and shows that lateral diffu-sion of DFe from the African continental shelf was thedominant flux of DFe along transect A. Assuming the sameAeolian flux of DFe (2.45 � 10�11 mol m�2 s�1) for thewhole study area during this dust event, dust was a moreimportant source of DFe to the latitudinal transect alongtransect B than vertical diffusion (mean of 2.57 � 2.10 �10�12 mol m�2 s�1 (1s, n = 10, range of 0.143–5.53 �10�12 mol m�2 s�1). However, along transect C the flux ofAeolian DFe was similar and at some places even lower thanthe vertical diffusion of DFe over the thermocline (mean of2.19 � 2.36 � 10�11 mol m�2 s�1 (1s, n = 10, range of0.322–7.3 � 10�11 mol m�2 s�1). Although vertical fluxesof DFe from below the thermocline were similar to theAeolian DFe flux it is noted that the DFe below the mixedlayer may be the result of Aeolian DFe input over time eitherdirectly via the solubilization and stabilization of Fe fromdust or with organic material settling from the surface ocean.Because transect B was a latitudinal transect we were unableto investigate a continental shelf derived lateral DFe flux.Furthermore, any potential lateral DFe flux originating fromthe continental shelf along the longitudinal transect C wastoo small to result in a measurable gradient in DFe and as aconsequence was not further considered here. An extensionof transect C along 12�N in the direction of the continentalshelf would allow us to calculate a lateral DFe flux forthis region.
4. Conclusion
[34] Some of the highest N2 fixation rates and diazotrophabundances have been reported for the heavily dust impactedeastern (sub-) tropical North Atlantic Ocean [Langlois et al.,2008; Voss et al., 2004] and especially south of the CapeVerde islands [Rijkenberg et al., 2011; Staal et al., 2007]. AsFe may limit N2 fixation [Mills et al., 2004], here Fe inputshave been suggested to determine the large scale distributionof diazotrophs [Moore et al., 2009]. We have now shownthat although Aeolian dust transport from the Saharan/Saheldesert regions is considered the dominant external input ofiron to the surface waters of the eastern (sub-) tropical NorthAtlantic Ocean, it can be exceeded by other DFe sources inour study region. Offshore advective transport from Africancontinental shelf waters formed an important input of DFe tothe open ocean in the northern part of our study area. Inaddition, vertical diffusive mixing formed an importantsource of DFe to the surface ocean where enhanced con-centrations of DFe existed below the wind mixed layer, e.g.,as generally in OMZs. In the south of our study area in theOMZ, vertical diffusive mixing as a source of DFe was equalto or even surpassed that of a major dust event. As themaintenance of OMZs may depend on N2 fixation drivenexport [Moore and Doney, 2007] a feedback loop may existwhere Fe from below forms a significant contribution to N2
fixation driven export enhancing remineralization andstrengthening the OMZ.
[35] Acknowledgments. We want to express our gratitude to theMaster and crew of RRS Discovery for support during the cruise. We
further want to thank Peter Statham and Alex Xylouri for all their help withsampling of the trace metals and Brian Dickie for his help with the measure-ment of DAl. Excellent support for the trace metal clean casts and shipboardunderway measurements was provided by Chris Barnard, Allen Davies,John Wynar and John Short of NMF-SS. Furthermore, we want to thankMark Stinchcombe for handling the logistics of the cruise and for mea-suring silicate. We thank Loes Gerringa for comments and advice. Thisresearch is funded by NERC as part of the UKSOLAS program, projectgrant NE/C001931/1.
ReferencesAchterberg, E. P., T. W. Holland, A. R. Bowie, R. F. C. Mantoura, and P. J.Worsfold (2001), Determination of iron in seawater, Anal. Chim. Acta,442(1), 1–14, doi:10.1016/S0003-2670(01)01091-1.
Anderson, L. A. (1995), On the hydrogen and oxygen content of marinephytoplankton, Deep Sea Res., Part I, 42(9), 1675–1680, doi:10.1016/0967-0637(95)00072-E.
Ardelan, M. V., O. Holm-Hansen, C. D. Hewes, C. S. Reiss, N. S. Silva,H. Dulaiova, E. Steinnes, and E. Sakshaug (2010), Natural iron enrich-ment around the Antarctic Peninsula in the Southern Ocean, Biogeos-ciences, 7(1), 11–25, doi:10.5194/bg-7-11-2010.
Arimoto, R., and R. A. Duce (1986), Dry deposition models and the air seaexchange of trace elements, J. Geophys. Res., 91(D2), 2787–2792,doi:10.1029/JD091iD02p02787.
Baker, A. R., and P. L. Croot (2010), Atmospheric and marine controls onaerosol iron solubility in seawater, Mar. Chem., 120(1–4), 4–13,doi:10.1016/j.marchem.2008.09.003.
Baker, A. R., T. D. Jickells, K. F. Biswas, K. Weston, and M. French(2006), Nutrients in atmospheric aerosol particles along the AtlanticMeridional Transect, Deep Sea Res., Part II, 53(14–16), 1706–1719,doi:10.1016/j.dsr2.2006.05.012.
Bartoli, G., C. Migon, and R. Losno (2005), Atmospheric input of dissolvedinorganic phosphorus and silicon to the coastal northwestern Mediterra-nean Sea: Fluxes, variability and possible impact on phytoplanktondynamics, Deep Sea Res., Part I, 52(11), 2005–2016, doi:10.1016/j.dsr.2005.06.006.
Bergquist, B. A., and E. A. Boyle (2006), Dissolved iron in the tropical andsubtropical Atlantic Ocean, Global Biogeochem. Cycles, 20, GB1015,doi:10.1029/2005GB002505.
Berman-Frank, I., J. T. Cullen, Y. Shaked, R. M. Sherrell, and P. G.Falkowski (2001), Iron availability, cellular iron quotas, and nitrogenfixation in Trichodesmium, Limnol. Oceanogr., 46(6), 1249–1260,doi:10.4319/lo.2001.46.6.1249.
Blain, S., G. Sarthou, and P. Laan (2008), Distribution of dissolved ironduring the natural iron-fertilization experiment KEOPS (KerguelenPlateau, Southern Ocean), Deep Sea Res., Part II, 55(5–7), 594–605,doi:10.1016/j.dsr2.2007.12.028.
Bowie, A. R., E. P. Achterberg, P. L. Croot, H. J. W. de Baar, P. Laan, J. W.Moffett, S. Ussher, and P. J. Worsfold (2006), A community-wide inter-comparison exercise for the determination of dissolved iron in seawater,Mar. Chem., 98(1), 81–99, doi:10.1016/j.marchem.2005.07.002.
Boyd, P. W., et al. (2005), FeCycle: Attempting an iron biogeochemicalbudget from a mesoscale SF6 tracer experiment in unperturbed lowiron waters, Global Biogeochem. Cycles, 19, GB4S20, doi:10.1029/2005GB002494.
Boyd, P. W., et al. (2007), Mesoscale iron enrichment experiments 1993–2005: Synthesis and future directions, Science, 315(5812), 612–617,doi:10.1126/science.1131669.
Boyd, P. W., E. Ibisanmi, S. G. Sander, K. A. Hunter, and G. A. Jackson(2010), Remineralization of upper ocean particles: Implications for ironbiogeochemistry, Limnol. Oceanogr., 55(3), 1271–1288, doi:10.4319/lo.2010.55.3.1271.
Brown, M. T., and K. W. Bruland (2008), An improved flow-injection anal-ysis method for the determination of dissolved aluminum in seawater,Limnol. Oceanogr. Methods, 6, 87–95, doi:10.4319/lom.2008.6.87.
Bucciarelli, E., S. Blain, and P. Treguer (2001), Iron and manganese in thewake of the Kerguelen Islands (Southern Ocean), Mar. Chem., 73(1),21–36, doi:10.1016/S0304-4203(00)00070-0.
Charette, M. A., M. E. Gonneea, P. J. Morris, P. Statham, G. Fones,H. Planquette, I. Salter, and A. N. Garabato (2007), Radium isotopesas tracers of iron sources fueling a Southern Ocean phytoplanktonbloom, Deep Sea Res., Part II, 54(18–20), 1989–1998, doi:10.1016/j.dsr2.2007.06.003.
Chiapello, I., G. Bergametti, L. Gomes, B. Chatenet, F. Dulac, J. Pimenta,and E. S. Suares (1995), An additional low layer transport of Sahelianand Saharan dust over the north-eastern tropical Atlantic, Geophys. Res.Lett., 22(23), 3191–3194, doi:10.1029/95GL03313.
Dall’Osto, M., R. M. Harrison, E. J. Highwood, C. O’Dowd, D. Ceburnis,X. Querol, and E. P. Achterberg (2010), Variation of the mixing state
RIJKENBERG ET AL.: FLUXES AND DISTRIBUTION OF DISSOLVED Fe GB3004GB3004
13 of 15
of Saharan dust particles with atmospheric transport, Atmos. Environ.,44(26), 3135–3146, doi:10.1016/j.atmosenv.2010.05.030.
de Baar, H. J. W., A. G. J. Buma, R. F. Nolting, G. C. Cadee, G. Jacques,and P. J. Treguer (1990), On iron limitation of the Southern Ocean:Experimental observation in the Weddell and Scotia Seas, Mar. Ecol.Prog. Ser., 65(2), 105–122, doi:10.3354/meps065105.
de Baar, H. J. W., et al. (2008), Titan: A new facility for ultraclean samplingof trace elements and isotopes in the deep oceans in the internationalGeotraces program, Mar. Chem., 111(1–2), 4–21, doi:10.1016/j.marchem.2007.07.009.
de Jong, J. T. M., J. den Das, U. Bathmann, M. H. C. Stoll, G. Kattner, R. F.Nolting, and H. J. W. de Baar (1998), Dissolved iron at subnanomolarlevels in the Southern Ocean as determined by ship-board analysis, Anal.Chim. Acta, 377(2–3), 113–124, doi:10.1016/S0003-2670(98)00427-9.
de Jong, J. T. M., M. Boye, M. D. Gelado-Caballero, K. R. Timmermans,M. J. W. Veldhuis, R. F. Nolting, C. M. G. van den Berg, and H. J. W.de Baar (2007), Inputs of iron, manganese and aluminium to surfacewaters of the Northeast Atlantic Ocean and the European continentalshelf, Mar. Chem., 107, 120–142, doi:10.1016/j.marchem.2007.05.007.
Dillon, T. M. (1982), Vertical overturns: A comparison of Thorpe andOzmidov length scales, J. Geophys. Res., 87, 9601–9613, doi:10.1029/JC087iC12p09601.
Duce, R. A., et al. (1991), The atmospheric input of trace species to theworld ocean, Global Biogeochem. Cycles, 5(3), 193–259, doi:10.1029/91GB01778.
Elrod, V. A., W. M. Berelson, K. H. Coale, and K. S. Johnson (2004), Theflux of iron from continental shelf sediments: A missing source for globalbudgets, Geophys. Res. Lett., 31, L12307, doi:10.1029/2004GL020216.
Fofonoff, N. P., and R. C. Millard (1983), Algorithms for computation offundamental properties of seawater, UNESCO Tech. Pap. Mar. Sci., 44,U.S. Educ., Sci. and Cult. Organ., Paris.
Galbraith, P. S., and D. E. Kelley (1996), Identifying overturns in CTD pro-files, J. Atmos. Oceanic Technol., 13(3), 688–702, doi:10.1175/1520-0426(1996)013<0688:IOICP>2.0.CO;2.
Ganzeveld, L., J. Lelieveld, and G. J. Roelofs (1998), A dry depositionparameterization for sulfur oxides in a chemistry and general circulationmodel, J. Geophys. Res., 103(D5), 5679–5694, doi:10.1029/97JD03077.
Gerringa, L. J. A., A.-C. Alderkamp, P. Laan, C.-E. Thuróczy, H. J. W. deBaar, M. M. Mills, G. L. van Dijken, H. van Haren, and K. R. Arrigo(2012), Iron from melting glaciers fuels the phytoplankton blooms inAmundsen Sea (Southern Ocean): Iron biogeochemistry, Deep SeaRes., Part II, 71–76, 16–31, doi:10.1016/j.dsr2.2012.03.007.
Gledhill, M., and C. M. G. van den Berg (1994), Determination of complex-ation of iron(III) with natural organic complexing ligands in seawaterusing cathodic stripping voltammetry, Mar. Chem., 47(1), 41–54,doi:10.1016/0304-4203(94)90012-4.
Hassler, C. S., and V. Schoemann (2009), Bioavailability of organicallybound Fe to model phytoplankton of the Southern Ocean, Biogeos-ciences, 6(10), 2281–2296, doi:10.5194/bg-6-2281-2009.
Hill, P. G., M. V. Zubkov, and D. A. Purdie (2010), Differential responsesof Prochlorococcus and SAR11-dominated bacterioplankton groups toatmospheric dust inputs in the tropical Northeast Atlantic Ocean, FEMSMicrobiol. Lett., 306(1), 82–89, doi:10.1111/j.1574-6968.2010.01940.x.
Hopkinson, B. M., and K. A. Barbeau (2007), Organic and redox speciationof iron in the eastern tropical North Pacific suboxic zone, Mar. Chem.,106, 2–17, doi:10.1016/j.marchem.2006.02.008.
Hosegood, P., H. van Haren, and C. Veth (2005), Mixing within the interiorof the Faeroe-Shetland Channel, J. Mar. Res., 63(3), 529–561,doi:10.1357/0022240054307902.
Jickells, T. D., et al. (2005), Global iron connections between desertdust, ocean biogeochemistry, and climate, Science, 308(5718), 67–71,doi:10.1126/science.1105959.
Johnson, K. S., R. M. Gordon, and K. H. Coale (1997), What controls dis-solved iron concentrations in the world ocean?, Mar. Chem., 57(3–4),137–161, doi:10.1016/S0304-4203(97)00043-1.
Karstensen, J., L. Stramma, and M. Visbeck (2008), Oxygen minimumzones in the eastern tropical Atlantic and Pacific oceans, Prog. Ocea-nogr., 77(4), 331–350, doi:10.1016/j.pocean.2007.05.009.
Kirkwood, D. (1996), Nutrients: Practical notes on their determinationin sea water, ICES Tech. in Mar. Environ. Sci., 17, Int. Counc. for theExplor. of the Sea, Copenhagen.
Klunder, M. B., P. Laan, R. Middag, H. J. W. De Baar, and J. V. Ooijen(2011), Dissolved iron in the Southern Ocean (Atlantic sector), DeepSea Res., 58, 2678–2694, doi:10.1016/j.dsr2.2010.10.042.
Kuma, K., J. Nishioka, and K. Matsunaga (1996), Controls on iron(III)hydroxide solubility in seawater: The influence of pH and naturalorganic chelators, Limnol. Oceanogr., 41(3), 396–407, doi:10.4319/lo.1996.41.3.0396.
Laës, A., S. Blain, P. Laan, E. P. Achterberg, G. Sarthou, and H. J. W. deBaar (2003), Deep dissolved iron profiles in the eastern North Atlanticin relation to water masses, Geophys. Res. Lett., 30(17), 1902,doi:10.1029/2003GL017902.
Lam, P. J., J. K. B. Bishop, C. C. Henning, M. A. Marcus, G. A.Waychunas,and I. Y. Fung (2006), Wintertime phytoplankton bloom in the subarcticPacific supported by continental margin iron,Global Biogeochem. Cycles,20, GB1006, doi:10.1029/2005GB002557.
Landing, W. M., and K. W. Bruland (1987), The contrasting biogeochem-istry of iron and manganese in the Pacific Ocean, Geochim. Cosmochim.Acta, 51(1), 29–43, doi:10.1016/0016-7037(87)90004-4.
Landing, W. M., C. Haraldsson, and N. Paxeus (1986), Vinyl polymeragglomerate based transition-metal cation chelating ion-exchange resincontaining the 8-hydroxyquinoline functional-group, Anal. Chem.,58(14), 3031–3035, doi:10.1021/ac00127a029.
Langlois, R. J., D. Hummer, and J. LaRoche (2008), Abundances anddistributions of the dominant nifH phylotypes in the northern AtlanticOcean, Appl. Environ. Microbiol., 74(6), 1922–1931, doi:10.1128/AEM.01720-07.
Law, C. S., E. R. Abraham, A. J. Watson, and M. I. Liddicoat (2003), Ver-tical eddy diffusion and nutrient supply to the surface mixed layer of theAntarctic Circumpolar Current, J. Geophys. Res., 108(C8), 3272,doi:10.1029/2002JC001604.
Liu, X. W., and F. J. Millero (2002), The solubility of iron in seawater,Mar.Chem., 77(1), 43–54, doi:10.1016/S0304-4203(01)00074-3.
Machín, F., and J. L. Pelegri (2009), Northward penetration of AntarcticIntermediate Water off northwest Africa, J. Phys. Oceanogr., 39(3),512–535, doi:10.1175/2008JPO3825.1.
Mahowald, N., et al. (2008), Global distribution of atmospheric phosphorussources, concentrations and deposition rates, and anthropogenic impacts,Global Biogeochem. Cycles, 22, GB4026, doi:10.1029/2008GB003240.
Maldonado, M. T., R. F. Strzepek, S. Sander, and P. W. Boyd (2005),Acquisition of iron bound to strong organic complexes, with differentFe binding groups and photochemical reactivities, by plankton communi-ties in Fe-limited subantarctic waters, Global Biogeochem. Cycles, 19,GB4S23, doi:10.1029/2005GB002481.
Martin, J. H., and S. E. Fitzwater (1988), Iron-deficiency limits phyto-plankton growth in the northeast Pacific Subarctic, Nature, 331(6154),341–343, doi:10.1038/331341a0.
Measures, C. I., and S. Vink (2000), On the use of dissolved aluminum insurface waters to estimate dust deposition to the ocean, Global Biogeo-chem. Cycles, 14(1), 317–327, doi:10.1029/1999GB001188.
Measures, C. I., W. M. Landing, M. T. Brown, and C. S. Buck (2008),High-resolution Al and Fe data from the Atlantic Ocean CLIVAR-CO2repeat hydrography A16N transect: Extensive linkages between atmo-spheric dust and upper ocean geochemistry, Global Biogeochem. Cycles,22, GB1005, doi:10.1029/2007GB003042.
Mills, M. M., C. Ridame, M. Davey, J. La Roche, and R. J. Geider (2004),Iron and phosphorus co-limit nitrogen fixation in the eastern tropicalNorth Atlantic, Nature, 429(6989), 292–294, doi:10.1038/nature02550.
Moore, C. M., et al. (2009), Large-scale distribution of Atlantic nitrogenfixation controlled by iron availability, Nat. Geosci., 2(12), 867–871,doi:10.1038/ngeo667.
Moore, J. K., and S. C. Doney (2007), Iron availability limits the oceannitrogen inventory stabilizing feedbacks between marine denitrificationand nitrogen fixation, Global Biogeochem. Cycles, 21, GB2001,doi:10.1029/2006GB002762.
Moore, W. S. (2000), Determining coastal mixing rates using radium iso-topes, Cont. Shelf Res., 20(15), 1993–2007, doi:10.1016/S0278-4343(00)00054-6.
Neuer, S., T. Freudenthal, R. Davenport, O. Llinas, and M. J. Rueda (2002),Seasonality of surface water properties and particle flux along a pro-ductivity gradient off NW Africa, Deep Sea Res., Part II, 49(17),3561–3576, doi:10.1016/S0967-0645(02)00098-X.
Nishioka, J., et al. (2007), Iron supply to the western subarctic Pacific:Importance of iron export from the Sea of Okhotsk, J. Geophys. Res.,112, C10012, doi:10.1029/2006JC004055.
Obata, H., H. Karatani, and E. Nakayama (1993), Automated-determinationof iron in seawater by chelating resin concentration and chemilumi-nescence detection, Anal. Chem., 65(11), 1524–1528, doi:10.1021/ac00059a007.
Okubo, A. (1971), Oceanic diffusion diagrams, Deep Sea Res., 18(8),789–802, doi:10.1016/0011-7471(71)90046-5.
Patey, M. D., M. J. A. Rijkenberg, P. J. Statham, M. C. Stinchcombe, E. P.Achterberg, and M. Mowlem (2008), Determination of nitrate and phos-phate in seawater at nanomolar concentrations, TrAC Trends Anal.Chem., 27(2), 169–182, doi:10.1016/j.trac.2007.12.006.
RIJKENBERG ET AL.: FLUXES AND DISTRIBUTION OF DISSOLVED Fe GB3004GB3004
14 of 15
Planquette, H., et al. (2007), Dissolved iron in the vicinity of the CrozetIslands, Southern Ocean, Deep Sea Res., Part II, 54(18–20), 1999–2019,doi:10.1016/j.dsr2.2007.06.019.
Powell, C. F. (2011), Atmospheric inputs of iron and other key nutri-ents to the tropical North Atlantic, PhD thesis, Univ. of East Anglia,Norwich, U. K.
Rijkenberg, M. J. A., L. J. A. Gerringa, K. R. Timmermans, A. C. Fischer,K. J. Kroon, A. G. J. Buma, B. T. Wolterbeek, and H. J. W. de Baar(2008a), Enhancement of the reactive iron pool by marine diatoms,Mar. Chem., 109(1–2), 29–44, doi:10.1016/j.marchem.2007.12.001.
Rijkenberg, M. J. A., C. F. Powell, M. Dall’Osto, M. C. Nielsdottir, M. D.Patey, P. G. Hill, A. R. Baker, T. D. Jickells, R. M. Harrison, and E. P.Achterberg (2008b), Changes in iron speciation following a Saharan dustevent in the tropical North Atlantic Ocean,Mar. Chem., 110(1–2), 56–67,doi:10.1016/j.marchem.2008.02.006.
Rijkenberg, M. J. A., R. J. Langlois, M. M. Mills, M. D. Patey, P. G. Hill,M. C. Nielsdóttir, T. J. Compton, J. LaRoche, and E. P. Achterberg(2011), Environmental forcing of nitrogen fixation in the eastern tropicaland sub-tropical North Atlantic Ocean, PLoS ONE, 6(12), e28989,doi:10.1371/journal.pone.0028989.
Santana-Casiano, J. M., M. Gonzaalez-Davila, and F. J. Millero (2005),Oxidation of nanomolar levels of Fe(II) with oxygen in natural waters,Environ. Sci. Technol., 39(7), 2073–2079, doi:10.1021/es049748y.
Sarthou, G., et al. (2003), Atmospheric iron deposition and sea-surface dis-solved iron concentrations in the eastern Atlantic Ocean, Deep Sea Res.,Part I, 50(10–11), 1339–1352, doi:10.1016/S0967-0637(03)00126-2.
Sarthou, G., A. R. Baker, J. Kramer, P. Laan, A. Laës, S. Ussher, E. P.Achterberg, H. J. W. de Baar, K. R. Timmermans, and S. Blain (2007),Influence of atmospheric inputs on the iron distribution in the subtropicalnorth-east Atlantic Ocean, Mar. Chem., 104, 186–202, doi:10.1016/j.marchem.2006.11.004.
Staal, M., S. T. Hekkert, G. J. Brummer, M. Veldhuis, C. Sikkens,S. Persijn, and L. J. Stal (2007), Nitrogen fixation along a north-south tran-sect in the eastern Atlantic Ocean, Limnol. Oceanogr., 52(4), 1305–1316,doi:10.4319/lo.2007.52.4.1305.
Stramma, L., and F. Schott (1999), The mean flow field of the tropicalAtlantic Ocean, Deep Sea Res., Part II, 46(1–2), 279–303, doi:10.1016/S0967-0645(98)00109-X.
Stramma, L., S. Huttl, and J. Schafstall (2005), Water masses and currentsin the upper tropical northeast Atlantic off northwest Africa, J. Geophys.Res., 110, C12006, doi:10.1029/2005JC002939.
Stramma, L., P. Brandt, J. Schafstall, F. Schott, J. Fischer, and A. Körtzinger(2008), Oxygen minimum zone in the North Atlantic south and east of theCape Verde Islands, J. Geophys. Res., 113, C04014, doi:10.1029/2007JC004369.
Sunda, W. G. (1997), Control of dissolved iron concentrations in the worldocean: A comment, Mar. Chem., 57(3–4), 169–172, doi:10.1016/S0304-4203(97)00045-5.
Thorpe, S. A. (1977), Turbulence and mixing in a Scottish loch, Philos.Trans. R. Soc. London, Ser. A, 286(1334), 125–181, doi:10.1098/rsta.1977.0112.
Thuróczy, C. E., L. J. A. Gerringa, M. B. Klunder, R. Middag, P. Laan,K. R. Timmermans, and H. J. W. de Baar (2010), Speciation of Fe inthe eastern North Atlantic Ocean, Deep Sea Res., Part I, 57(11),1444–1453, doi:10.1016/j.dsr.2010.08.004.
Tsuchiya, M., L. D. Talley, and M. S. McCartney (1992), An easternAtlantic section from Iceland southward across the equator, Deep SeaRes., 39(11–12), 1885–1917.
Ussher, S. J., E. P. Achterberg, G. Sarthou, P. Laan, H. J. W. de Baar,and P. J. Worsfold (2010), Distribution of size fractionated dissolved ironin the Canary Basin, Mar. Environ. Res., 70(1), 46–55, doi:10.1016/j.marenvres.2010.03.001.
Voss, M., P. Croot, K. Lochte, M. Mills, and I. Peeken (2004), Patterns ofnitrogen fixation along 10�N in the tropical Atlantic, Geophys. Res. Lett.,31, L23S09, doi:10.1029/2004GL020127.
Wagener, T., E. Pulido-Villena, and C. Guieu (2008), Dust iron dissolutionin seawater: Results from a one-year time-series in the MediterraneanSea, Geophys. Res. Lett., 35, L16601, doi:10.1029/2008GL034581.
Witter, A. E., B. L. Lewis, and G. W. Luther (2000), Iron speciation in theArabian Sea, Deep Sea Res., Part II, 47(7–8), 1517–1539, doi:10.1016/S0967-0645(99)00152-6.
Wooster, W. S., A. Bakun, and D. R. McLain (1976), Seasonal upwellingcycle along eastern boundary of North Atlantic, J. Mar. Res., 34(2),131–141.
Wu, J. F., and G. W. Luther (1994), Size-fractionated iron concentrations inthe water column of the western North Atlantic Ocean, Limnol. Ocea-nogr., 39(5), 1119–1129, doi:10.4319/lo.1994.39.5.1119.
Ye, Y., C. Volker, and D. A. Wolf-Gladrow (2009), A model of Fespeciation and biogeochemistry at the Tropical Eastern North AtlanticTime-Series Observatory site, Biogeosciences, 6(10), 2041–2061,doi:10.5194/bg-6-2041-2009.
RIJKENBERG ET AL.: FLUXES AND DISTRIBUTION OF DISSOLVED Fe GB3004GB3004
15 of 15