florida's refugee and entrant arrivals...florida's refugee and entrant arrivals...
TRANSCRIPT

Florida's Refugee and Entrant Arrivals Statistical Report
October 1st, 2014 – September 30th , 2015
Federal Fiscal Year 2015
Photo of painting by Cuban Refugee Enrique Rafael Ermus Forgas the Artist
Prepared By:
Florida Department of Children & Families
Refugee Services Program
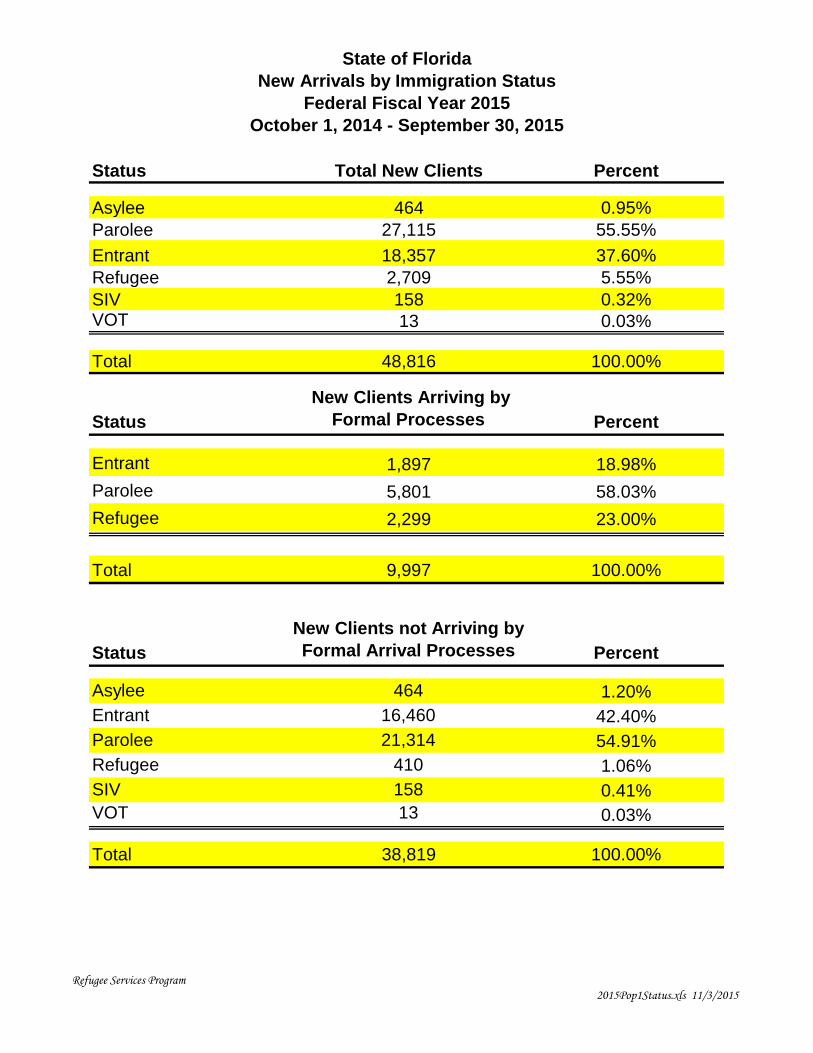
State of Florida
New Arrivals by Immigration Status
Federal Fiscal Year 2015
October 1, 2014 - September 30, 2015
Status Total New Clients Percent
Asylee 464 0.95%
Parolee 27,115 55.55%
Entrant 18,357 37.60%
Refugee 2,709 5.55%
SIV 158 0.32%VOT 13 0.03%
Total 48,816 100.00%
Status
New Clients Arriving by
Formal Processes Percent
Entrant 1,897 18.98%
Parolee 5,801 58.03%
Refugee 2,299 23.00%
Total 9,997 100.00%
Status
New Clients not Arriving by
Formal Arrival Processes Percent
Asylee 464 1.20%
Entrant 16,460 42.40%
Parolee 21,314 54.91%
Refugee 410 1.06%
SIV 158 0.41%
VOT 13 0.03%
Total 38,819 100.00%
Refugee Services Program
2015Pop1Status.xls 11/3/2015
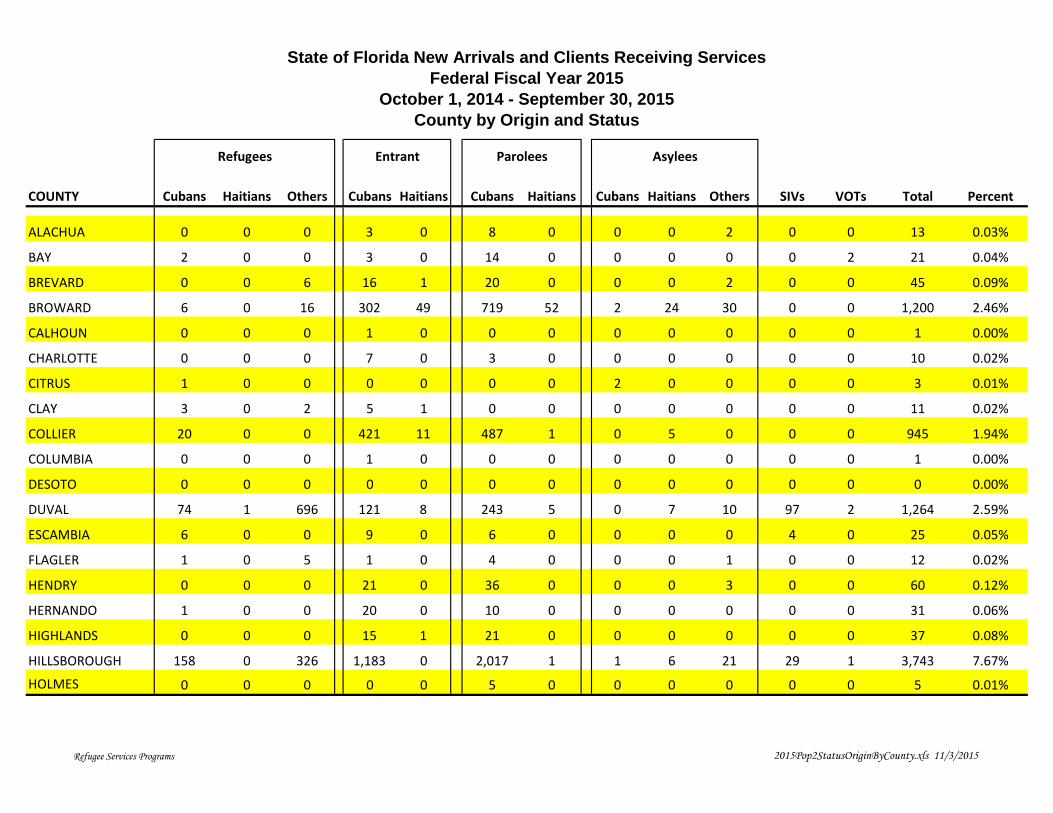
State of Florida New Arrivals and Clients Receiving Services
Federal Fiscal Year 2015
October 1, 2014 - September 30, 2015
County by Origin and Status
COUNTY Cubans Haitians Others Cubans Haitians Cubans Haitians Cubans Haitians Others SIVs VOTs Total Percent
ALACHUA 0 0 0 3 0 8 0 0 0 2 0 0 13 0.03%
BAY 2 0 0 3 0 14 0 0 0 0 0 2 21 0.04%
BREVARD 0 0 6 16 1 20 0 0 0 2 0 0 45 0.09%
BROWARD 6 0 16 302 49 719 52 2 24 30 0 0 1,200 2.46%
CALHOUN 0 0 0 1 0 0 0 0 0 0 0 0 1 0.00%
CHARLOTTE 0 0 0 7 0 3 0 0 0 0 0 0 10 0.02%
CITRUS 1 0 0 0 0 0 0 2 0 0 0 0 3 0.01%
CLAY 3 0 2 5 1 0 0 0 0 0 0 0 11 0.02%
COLLIER 20 0 0 421 11 487 1 0 5 0 0 0 945 1.94%
COLUMBIA 0 0 0 1 0 0 0 0 0 0 0 0 1 0.00%
DESOTO 0 0 0 0 0 0 0 0 0 0 0 0 0 0.00%
DUVAL 74 1 696 121 8 243 5 0 7 10 97 2 1,264 2.59%
ESCAMBIA 6 0 0 9 0 6 0 0 0 0 4 0 25 0.05%
FLAGLER 1 0 5 1 0 4 0 0 0 1 0 0 12 0.02%
HENDRY 0 0 0 21 0 36 0 0 0 3 0 0 60 0.12%
HERNANDO 1 0 0 20 0 10 0 0 0 0 0 0 31 0.06%
HIGHLANDS 0 0 0 15 1 21 0 0 0 0 0 0 37 0.08%
HILLSBOROUGH 158 0 326 1,183 0 2,017 1 1 6 21 29 1 3,743 7.67%
HOLMES 0 0 0 0 0 5 0 0 0 0 0 0 5 0.01%
Refugees Entrant AsyleesParolees
Refugee Services Programs 2015Pop2StatusOriginByCounty.xls 11/3/2015
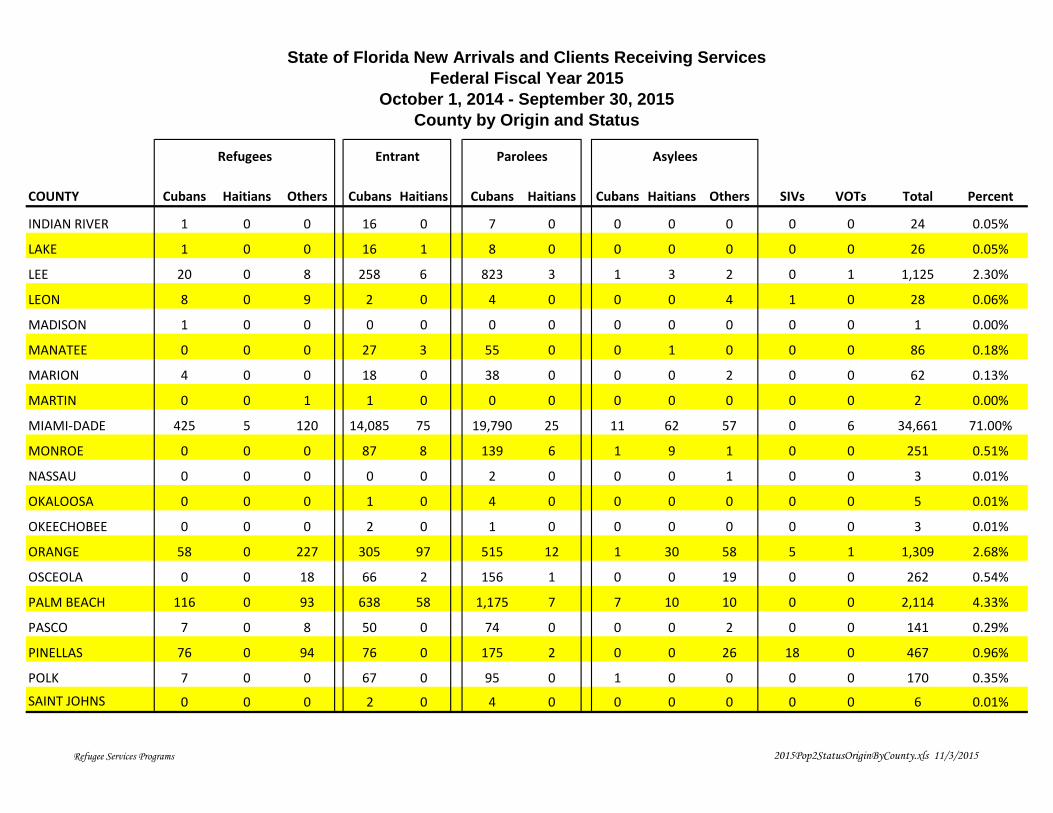
State of Florida New Arrivals and Clients Receiving Services
Federal Fiscal Year 2015
October 1, 2014 - September 30, 2015
County by Origin and Status
COUNTY Cubans Haitians Others Cubans Haitians Cubans Haitians Cubans Haitians Others SIVs VOTs Total Percent
Refugees Entrant AsyleesParolees
INDIAN RIVER 1 0 0 16 0 7 0 0 0 0 0 0 24 0.05%
LAKE 1 0 0 16 1 8 0 0 0 0 0 0 26 0.05%
LEE 20 0 8 258 6 823 3 1 3 2 0 1 1,125 2.30%
LEON 8 0 9 2 0 4 0 0 0 4 1 0 28 0.06%
MADISON 1 0 0 0 0 0 0 0 0 0 0 0 1 0.00%
MANATEE 0 0 0 27 3 55 0 0 1 0 0 0 86 0.18%
MARION 4 0 0 18 0 38 0 0 0 2 0 0 62 0.13%
MARTIN 0 0 1 1 0 0 0 0 0 0 0 0 2 0.00%
MIAMI-DADE 425 5 120 14,085 75 19,790 25 11 62 57 0 6 34,661 71.00%
MONROE 0 0 0 87 8 139 6 1 9 1 0 0 251 0.51%
NASSAU 0 0 0 0 0 2 0 0 0 1 0 0 3 0.01%
OKALOOSA 0 0 0 1 0 4 0 0 0 0 0 0 5 0.01%
OKEECHOBEE 0 0 0 2 0 1 0 0 0 0 0 0 3 0.01%
ORANGE 58 0 227 305 97 515 12 1 30 58 5 1 1,309 2.68%
OSCEOLA 0 0 18 66 2 156 1 0 0 19 0 0 262 0.54%
PALM BEACH 116 0 93 638 58 1,175 7 7 10 10 0 0 2,114 4.33%
PASCO 7 0 8 50 0 74 0 0 0 2 0 0 141 0.29%
PINELLAS 76 0 94 76 0 175 2 0 0 26 18 0 467 0.96%
POLK 7 0 0 67 0 95 0 1 0 0 0 0 170 0.35%
SAINT JOHNS 0 0 0 2 0 4 0 0 0 0 0 0 6 0.01%
Refugee Services Programs 2015Pop2StatusOriginByCounty.xls 11/3/2015
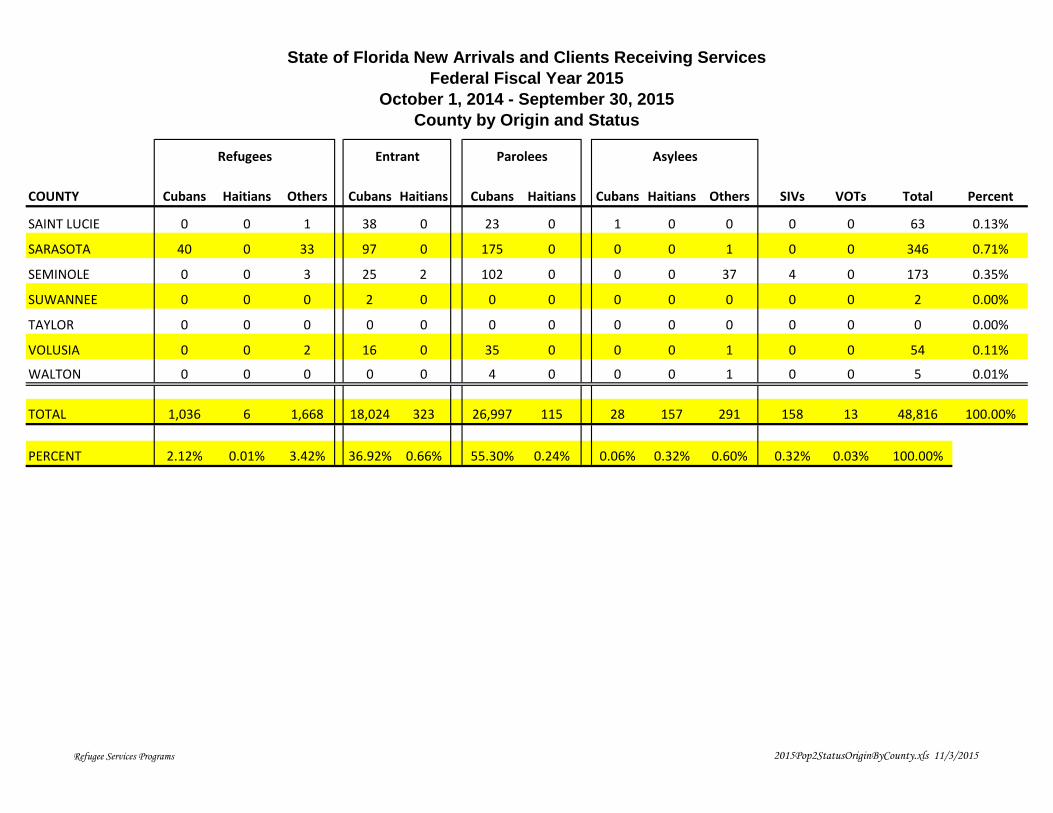
State of Florida New Arrivals and Clients Receiving Services
Federal Fiscal Year 2015
October 1, 2014 - September 30, 2015
County by Origin and Status
COUNTY Cubans Haitians Others Cubans Haitians Cubans Haitians Cubans Haitians Others SIVs VOTs Total Percent
Refugees Entrant AsyleesParolees
SAINT LUCIE 0 0 1 38 0 23 0 1 0 0 0 0 63 0.13%
SARASOTA 40 0 33 97 0 175 0 0 0 1 0 0 346 0.71%
SEMINOLE 0 0 3 25 2 102 0 0 0 37 4 0 173 0.35%
SUWANNEE 0 0 0 2 0 0 0 0 0 0 0 0 2 0.00%
TAYLOR 0 0 0 0 0 0 0 0 0 0 0 0 0 0.00%
VOLUSIA 0 0 2 16 0 35 0 0 0 1 0 0 54 0.11%
WALTON 0 0 0 0 0 4 0 0 0 1 0 0 5 0.01%
TOTAL 1,036 6 1,668 18,024 323 26,997 115 28 157 291 158 13 48,816 100.00%
PERCENT 2.12% 0.01% 3.42% 36.92% 0.66% 55.30% 0.24% 0.06% 0.32% 0.60% 0.32% 0.03% 100.00%
Refugee Services Programs 2015Pop2StatusOriginByCounty.xls 11/3/2015
State of Florida New Arrivals and Clients Receiving Services
Federal Fiscal Year 2015
October 1, 2014 - September 30, 2015
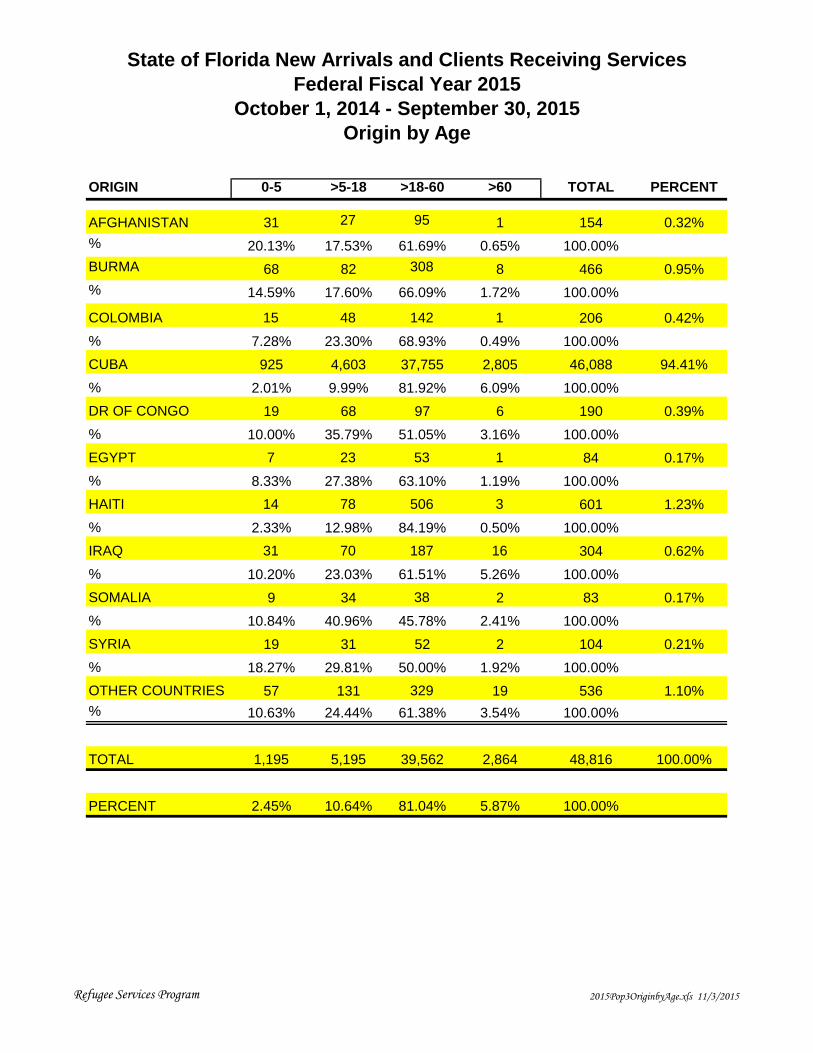
Origin by Age
ORIGIN 0-5 >5-18 >18-60 >60 TOTAL PERCENT
AFGHANISTAN 31 27 95 1 154 0.32%
% 20.13% 17.53% 61.69% 0.65% 100.00%
BURMA 68 82 308 8 466 0.95%
% 14.59% 17.60% 66.09% 1.72% 100.00%
COLOMBIA 15 48 142 1 206 0.42%
% 7.28% 23.30% 68.93% 0.49% 100.00%
CUBA 925 4,603 37,755 2,805 46,088 94.41%
% 2.01% 9.99% 81.92% 6.09% 100.00%
DR OF CONGO 19 68 97 6 190 0.39%
% 10.00% 35.79% 51.05% 3.16% 100.00%
EGYPT 7 23 53 1 84 0.17%
% 8.33% 27.38% 63.10% 1.19% 100.00%
HAITI 14 78 506 3 601 1.23%
% 2.33% 12.98% 84.19% 0.50% 100.00%
IRAQ 31 70 187 16 304 0.62%
% 10.20% 23.03% 61.51% 5.26% 100.00%
SOMALIA 9 34 38 2 83 0.17%
% 10.84% 40.96% 45.78% 2.41% 100.00%
SYRIA 19 31 52 2 104 0.21%
% 18.27% 29.81% 50.00% 1.92% 100.00%
OTHER COUNTRIES 57 131 329 19 536 1.10%
% 10.63% 24.44% 61.38% 3.54% 100.00%
TOTAL 1,195 5,195 39,562 2,864 48,816 100.00%
PERCENT 2.45% 10.64% 81.04% 5.87% 100.00%
Refugee Services Program 2015Pop3OriginbyAge.xls 11/3/2015
State of Florida New Arrivals and Clients Receiving Services
Federal Fiscal Year 2015
October 1, 2014 - September 30, 2015
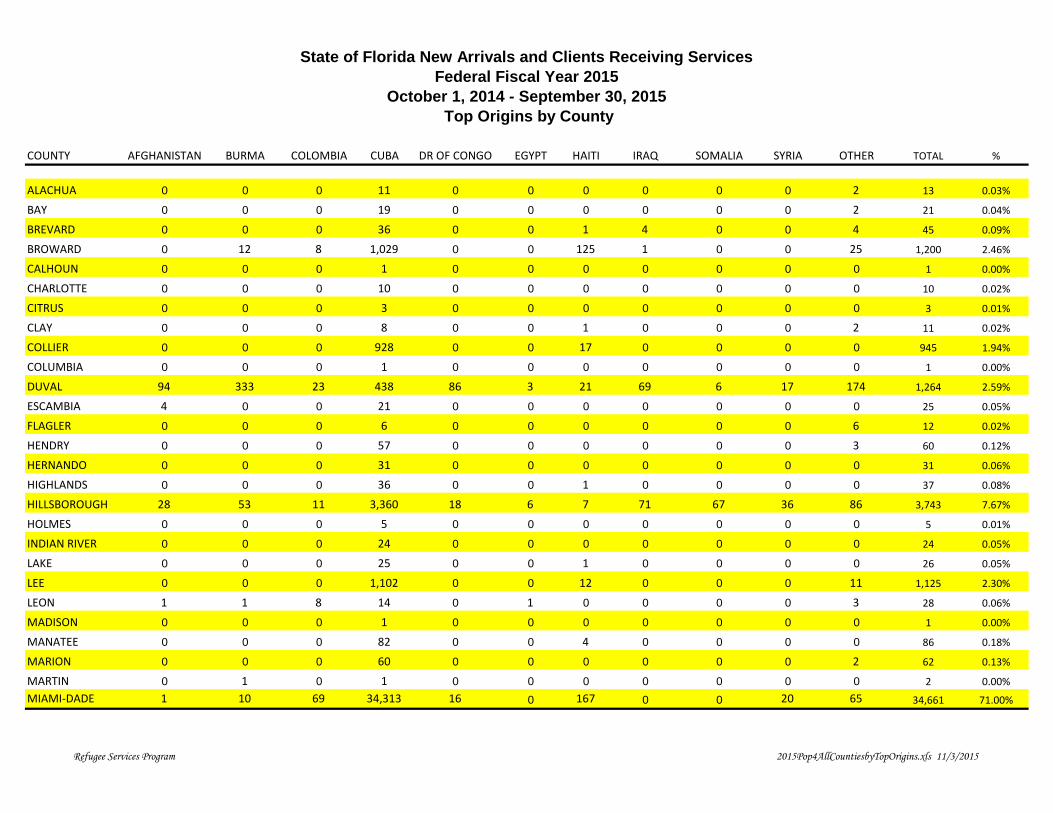
Top Origins by County
COUNTY AFGHANISTAN BURMA COLOMBIA CUBA DR OF CONGO EGYPT HAITI IRAQ SOMALIA SYRIA OTHER TOTAL %
ALACHUA 0 0 0 11 0 0 0 0 0 0 2 13 0.03%
BAY 0 0 0 19 0 0 0 0 0 0 2 21 0.04%
BREVARD 0 0 0 36 0 0 1 4 0 0 4 45 0.09%
BROWARD 0 12 8 1,029 0 0 125 1 0 0 25 1,200 2.46%
CALHOUN 0 0 0 1 0 0 0 0 0 0 0 1 0.00%
CHARLOTTE 0 0 0 10 0 0 0 0 0 0 0 10 0.02%
CITRUS 0 0 0 3 0 0 0 0 0 0 0 3 0.01%
CLAY 0 0 0 8 0 0 1 0 0 0 2 11 0.02%
COLLIER 0 0 0 928 0 0 17 0 0 0 0 945 1.94%
COLUMBIA 0 0 0 1 0 0 0 0 0 0 0 1 0.00%
DUVAL 94 333 23 438 86 3 21 69 6 17 174 1,264 2.59%
ESCAMBIA 4 0 0 21 0 0 0 0 0 0 0 25 0.05%
FLAGLER 0 0 0 6 0 0 0 0 0 0 6 12 0.02%
HENDRY 0 0 0 57 0 0 0 0 0 0 3 60 0.12%
HERNANDO 0 0 0 31 0 0 0 0 0 0 0 31 0.06%
HIGHLANDS 0 0 0 36 0 0 1 0 0 0 0 37 0.08%
HILLSBOROUGH 28 53 11 3,360 18 6 7 71 67 36 86 3,743 7.67%
HOLMES 0 0 0 5 0 0 0 0 0 0 0 5 0.01%
INDIAN RIVER 0 0 0 24 0 0 0 0 0 0 0 24 0.05%
LAKE 0 0 0 25 0 0 1 0 0 0 0 26 0.05%
LEE 0 0 0 1,102 0 0 12 0 0 0 11 1,125 2.30%
LEON 1 1 8 14 0 1 0 0 0 0 3 28 0.06%
MADISON 0 0 0 1 0 0 0 0 0 0 0 1 0.00%
MANATEE 0 0 0 82 0 0 4 0 0 0 0 86 0.18%
MARION 0 0 0 60 0 0 0 0 0 0 2 62 0.13%
MARTIN 0 1 0 1 0 0 0 0 0 0 0 2 0.00%
MIAMI-DADE 1 10 69 34,313 16 0 167 0 0 20 65 34,661 71.00%
Refugee Services Program 2015Pop4AllCountiesbyTopOrigins.xls 11/3/2015
State of Florida New Arrivals and Clients Receiving Services
Federal Fiscal Year 2015
October 1, 2014 - September 30, 2015
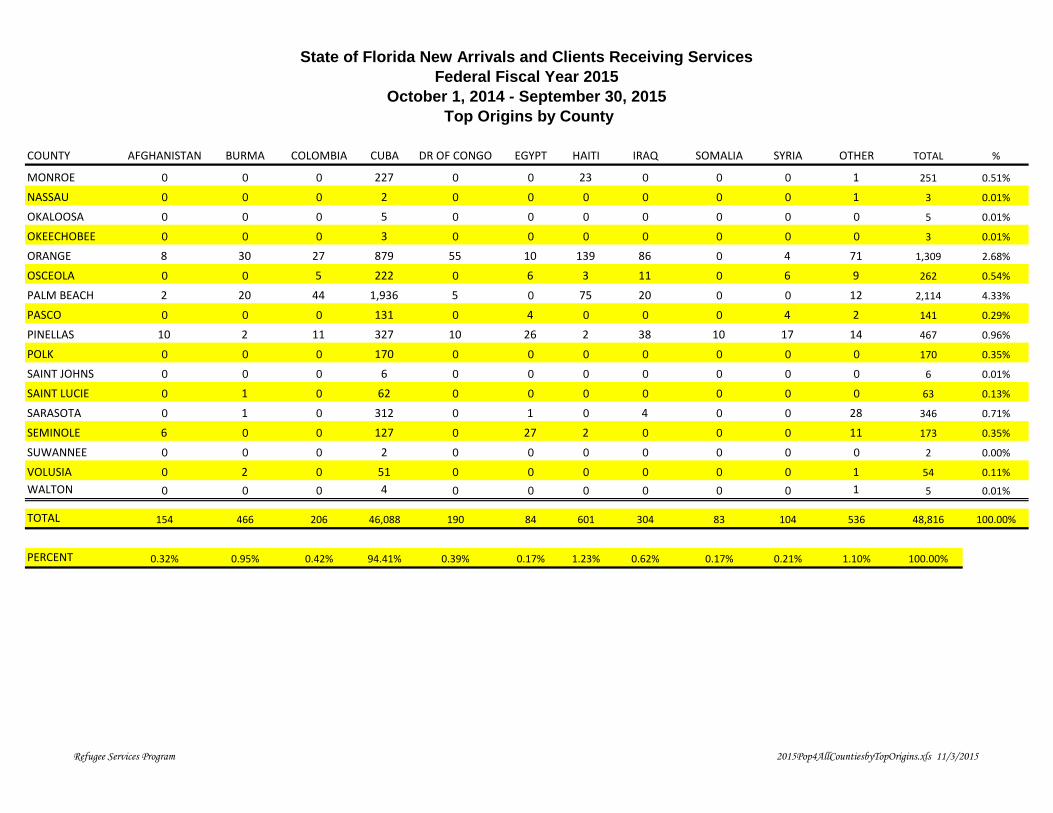
Top Origins by County
COUNTY AFGHANISTAN BURMA COLOMBIA CUBA DR OF CONGO EGYPT HAITI IRAQ SOMALIA SYRIA OTHER TOTAL %
MONROE 0 0 0 227 0 0 23 0 0 0 1 251 0.51%
NASSAU 0 0 0 2 0 0 0 0 0 0 1 3 0.01%
OKALOOSA 0 0 0 5 0 0 0 0 0 0 0 5 0.01%
OKEECHOBEE 0 0 0 3 0 0 0 0 0 0 0 3 0.01%
ORANGE 8 30 27 879 55 10 139 86 0 4 71 1,309 2.68%
OSCEOLA 0 0 5 222 0 6 3 11 0 6 9 262 0.54%
PALM BEACH 2 20 44 1,936 5 0 75 20 0 0 12 2,114 4.33%
PASCO 0 0 0 131 0 4 0 0 0 4 2 141 0.29%
PINELLAS 10 2 11 327 10 26 2 38 10 17 14 467 0.96%
POLK 0 0 0 170 0 0 0 0 0 0 0 170 0.35%
SAINT JOHNS 0 0 0 6 0 0 0 0 0 0 0 6 0.01%
SAINT LUCIE 0 1 0 62 0 0 0 0 0 0 0 63 0.13%
SARASOTA 0 1 0 312 0 1 0 4 0 0 28 346 0.71%
SEMINOLE 6 0 0 127 0 27 2 0 0 0 11 173 0.35%
SUWANNEE 0 0 0 2 0 0 0 0 0 0 0 2 0.00%
VOLUSIA 0 2 0 51 0 0 0 0 0 0 1 54 0.11%
WALTON 0 0 0 4 0 0 0 0 0 0 1 5 0.01%
TOTAL 154 466 206 46,088 190 84 601 304 83 104 536 48,816 100.00%
PERCENT 0.32% 0.95% 0.42% 94.41% 0.39% 0.17% 1.23% 0.62% 0.17% 0.21% 1.10% 100.00%
Refugee Services Program 2015Pop4AllCountiesbyTopOrigins.xls 11/3/2015
State of Florida New Arrivals and Clients Receiving services
Federal Fiscal Year 2015
October 1, 2014 - September 30, 2015
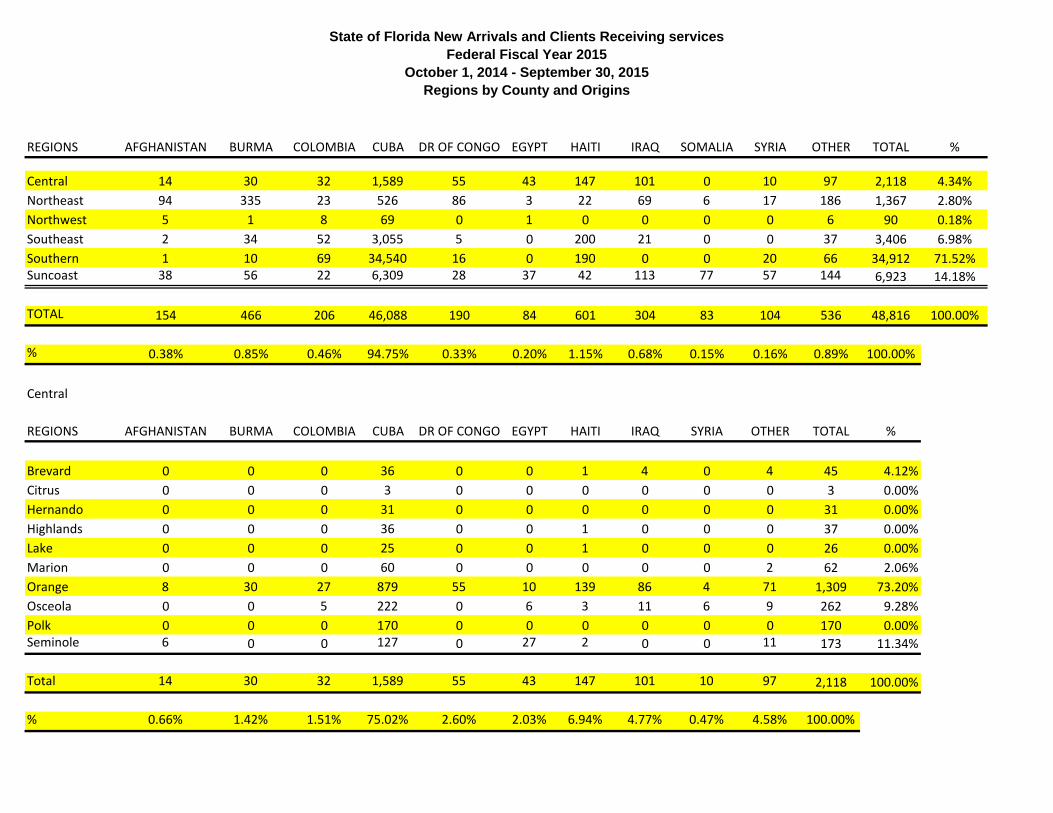
Regions by County and Origins
REGIONS AFGHANISTAN BURMA COLOMBIA CUBA DR OF CONGO EGYPT HAITI IRAQ SOMALIA SYRIA OTHER TOTAL %
Central 14 30 32 1,589 55 43 147 101 0 10 97 2,118 4.34%
Northeast 94 335 23 526 86 3 22 69 6 17 186 1,367 2.80%
Northwest 5 1 8 69 0 1 0 0 0 0 6 90 0.18%
Southeast 2 34 52 3,055 5 0 200 21 0 0 37 3,406 6.98%
Southern 1 10 69 34,540 16 0 190 0 0 20 66 34,912 71.52%Suncoast 38 56 22 6,309 28 37 42 113 77 57 144 6,923 14.18%
TOTAL 154 466 206 46,088 190 84 601 304 83 104 536 48,816 100.00%
% 0.38% 0.85% 0.46% 94.75% 0.33% 0.20% 1.15% 0.68% 0.15% 0.16% 0.89% 100.00%
Central
REGIONS AFGHANISTAN BURMA COLOMBIA CUBA DR OF CONGO EGYPT HAITI IRAQ SYRIA OTHER TOTAL %
Brevard 0 0 0 36 0 0 1 4 0 4 45 4.12%
Citrus 0 0 0 3 0 0 0 0 0 0 3 0.00%
Hernando 0 0 0 31 0 0 0 0 0 0 31 0.00%
Highlands 0 0 0 36 0 0 1 0 0 0 37 0.00%
Lake 0 0 0 25 0 0 1 0 0 0 26 0.00%
Marion 0 0 0 60 0 0 0 0 0 2 62 2.06%
Orange 8 30 27 879 55 10 139 86 4 71 1,309 73.20%
Osceola 0 0 5 222 0 6 3 11 6 9 262 9.28%
Polk 0 0 0 170 0 0 0 0 0 0 170 0.00%Seminole 6 0 0 127 0 27 2 0 0 11 173 11.34%
Total 14 30 32 1,589 55 43 147 101 10 97 2,118 100.00%
% 0.66% 1.42% 1.51% 75.02% 2.60% 2.03% 6.94% 4.77% 0.47% 4.58% 100.00%
State of Florida New Arrivals and Clients Receiving services
Federal Fiscal Year 2015
October 1, 2014 - September 30, 2015
Regions by County and Origins
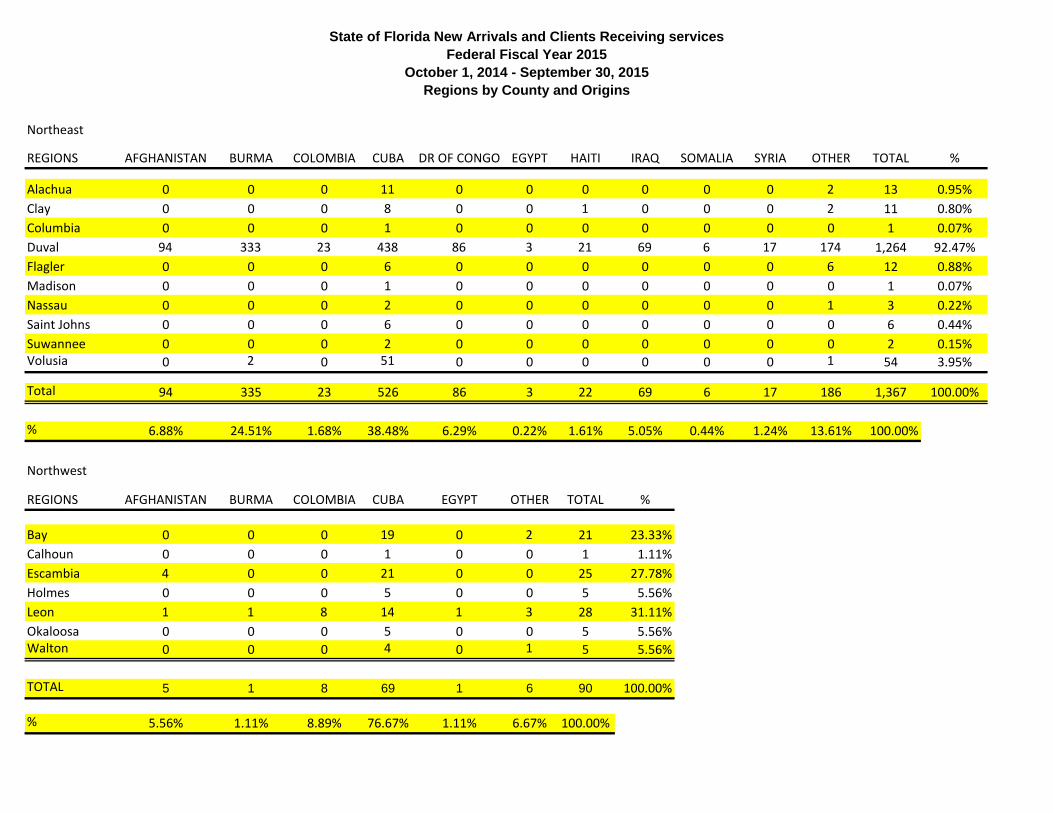
Northeast
REGIONS AFGHANISTAN BURMA COLOMBIA CUBA DR OF CONGO EGYPT HAITI IRAQ SOMALIA SYRIA OTHER TOTAL %
Alachua 0 0 0 11 0 0 0 0 0 0 2 13 0.95%
Clay 0 0 0 8 0 0 1 0 0 0 2 11 0.80%
Columbia 0 0 0 1 0 0 0 0 0 0 0 1 0.07%
Duval 94 333 23 438 86 3 21 69 6 17 174 1,264 92.47%
Flagler 0 0 0 6 0 0 0 0 0 0 6 12 0.88%
Madison 0 0 0 1 0 0 0 0 0 0 0 1 0.07%
Nassau 0 0 0 2 0 0 0 0 0 0 1 3 0.22%
Saint Johns 0 0 0 6 0 0 0 0 0 0 0 6 0.44%
Suwannee 0 0 0 2 0 0 0 0 0 0 0 2 0.15%Volusia 0 2 0 51 0 0 0 0 0 0 1 54 3.95%
Total 94 335 23 526 86 3 22 69 6 17 186 1,367 100.00%
% 6.88% 24.51% 1.68% 38.48% 6.29% 0.22% 1.61% 5.05% 0.44% 1.24% 13.61% 100.00%
Northwest
REGIONS AFGHANISTAN BURMA COLOMBIA CUBA EGYPT OTHER TOTAL %
Bay 0 0 0 19 0 2 21 23.33%
Calhoun 0 0 0 1 0 0 1 1.11%
Escambia 4 0 0 21 0 0 25 27.78%
Holmes 0 0 0 5 0 0 5 5.56%
Leon 1 1 8 14 1 3 28 31.11%
Okaloosa 0 0 0 5 0 0 5 5.56%Walton 0 0 0 4 0 1 5 5.56%
TOTAL 5 1 8 69 1 6 90 100.00%
% 5.56% 1.11% 8.89% 76.67% 1.11% 6.67% 100.00%
State of Florida New Arrivals and Clients Receiving services
Federal Fiscal Year 2015
October 1, 2014 - September 30, 2015
Regions by County and Origins
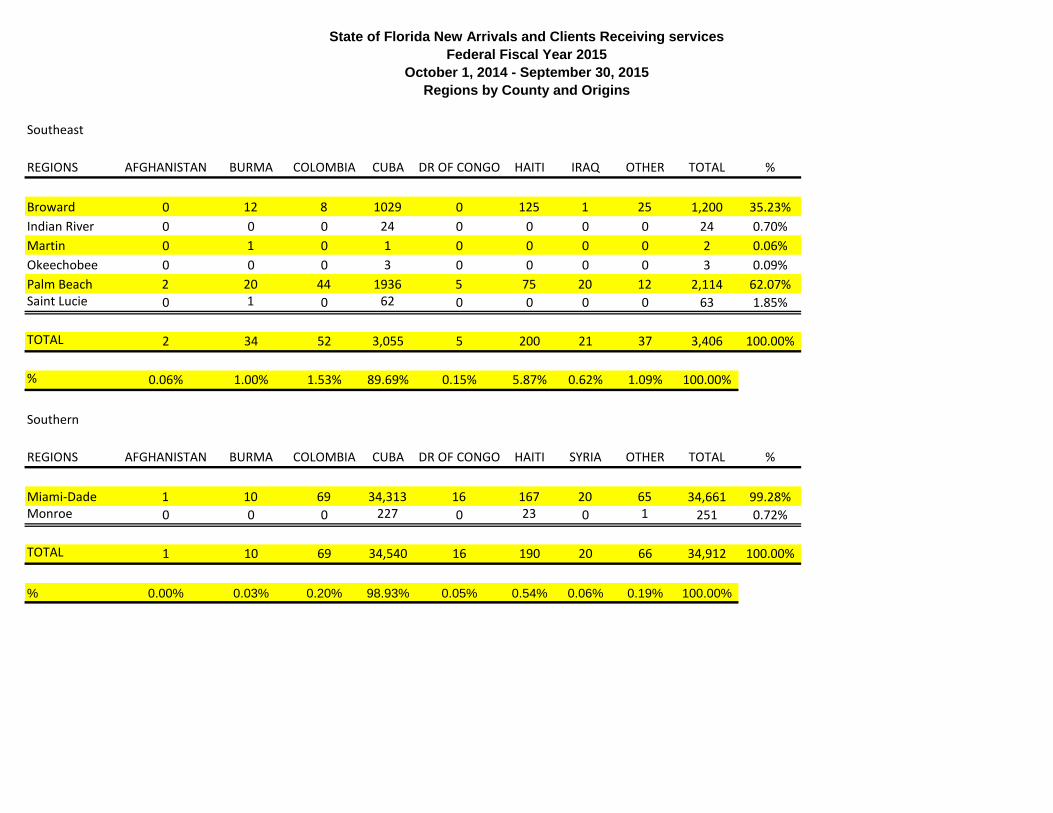
Southeast
REGIONS AFGHANISTAN BURMA COLOMBIA CUBA DR OF CONGO HAITI IRAQ OTHER TOTAL %
Broward 0 12 8 1029 0 125 1 25 1,200 35.23%
Indian River 0 0 0 24 0 0 0 0 24 0.70%
Martin 0 1 0 1 0 0 0 0 2 0.06%
Okeechobee 0 0 0 3 0 0 0 0 3 0.09%
Palm Beach 2 20 44 1936 5 75 20 12 2,114 62.07%Saint Lucie 0 1 0 62 0 0 0 0 63 1.85%
TOTAL 2 34 52 3,055 5 200 21 37 3,406 100.00%
% 0.06% 1.00% 1.53% 89.69% 0.15% 5.87% 0.62% 1.09% 100.00%
Southern
REGIONS AFGHANISTAN BURMA COLOMBIA CUBA DR OF CONGO HAITI SYRIA OTHER TOTAL %
Miami-Dade 1 10 69 34,313 16 167 20 65 34,661 99.28%Monroe 0 0 0 227 0 23 0 1 251 0.72%
TOTAL 1 10 69 34,540 16 190 20 66 34,912 100.00%
% 0.00% 0.03% 0.20% 98.93% 0.05% 0.54% 0.06% 0.19% 100.00%
State of Florida New Arrivals and Clients Receiving services
Federal Fiscal Year 2015
October 1, 2014 - September 30, 2015
Regions by County and Origins
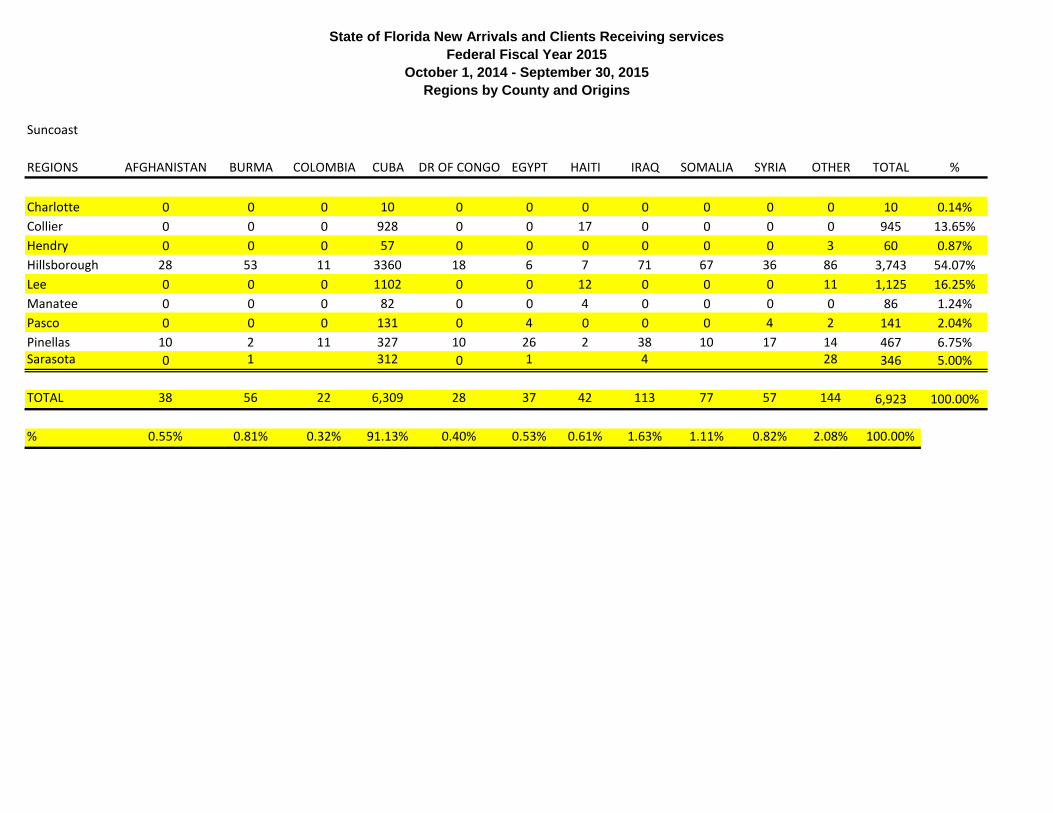
Suncoast
REGIONS AFGHANISTAN BURMA COLOMBIA CUBA DR OF CONGO EGYPT HAITI IRAQ SOMALIA SYRIA OTHER TOTAL %
Charlotte 0 0 0 10 0 0 0 0 0 0 0 10 0.14%
Collier 0 0 0 928 0 0 17 0 0 0 0 945 13.65%
Hendry 0 0 0 57 0 0 0 0 0 0 3 60 0.87%
Hillsborough 28 53 11 3360 18 6 7 71 67 36 86 3,743 54.07%
Lee 0 0 0 1102 0 0 12 0 0 0 11 1,125 16.25%
Manatee 0 0 0 82 0 0 4 0 0 0 0 86 1.24%
Pasco 0 0 0 131 0 4 0 0 0 4 2 141 2.04%
Pinellas 10 2 11 327 10 26 2 38 10 17 14 467 6.75%Sarasota 0 1 312 0 1 4 28 346 5.00%
TOTAL 38 56 22 6,309 28 37 42 113 77 57 144 6,923 100.00%
% 0.55% 0.81% 0.32% 91.13% 0.40% 0.53% 0.61% 1.63% 1.11% 0.82% 2.08% 100.00%
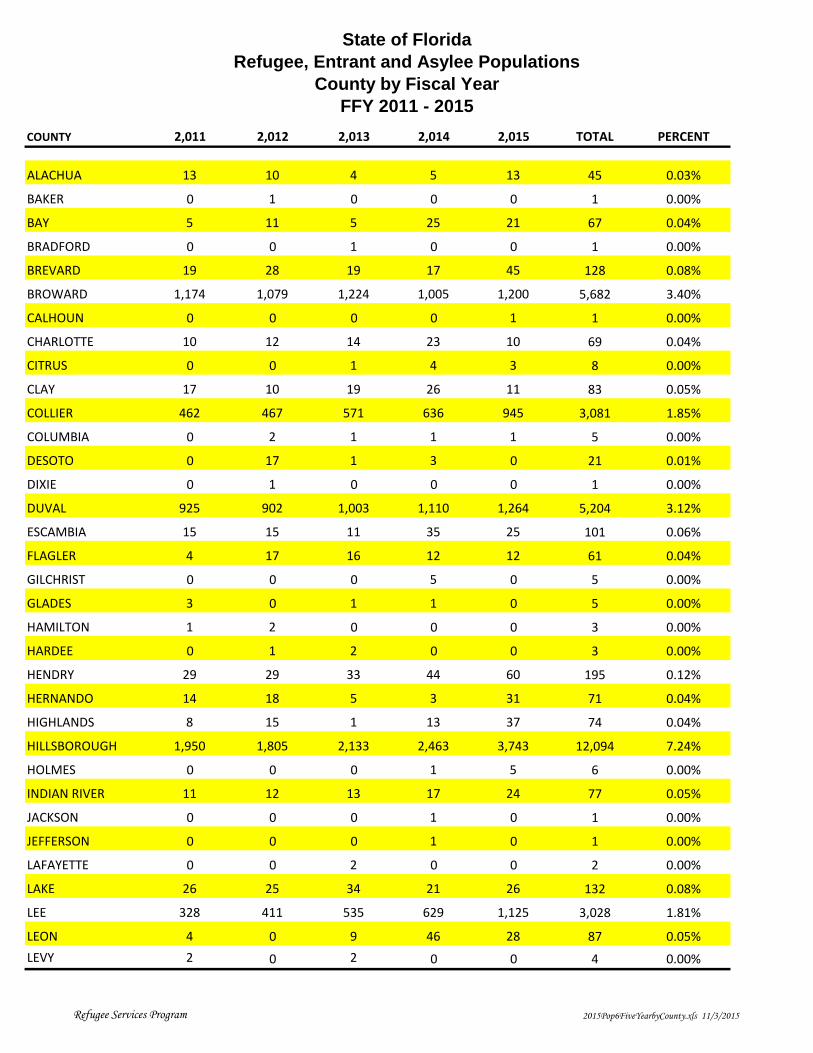
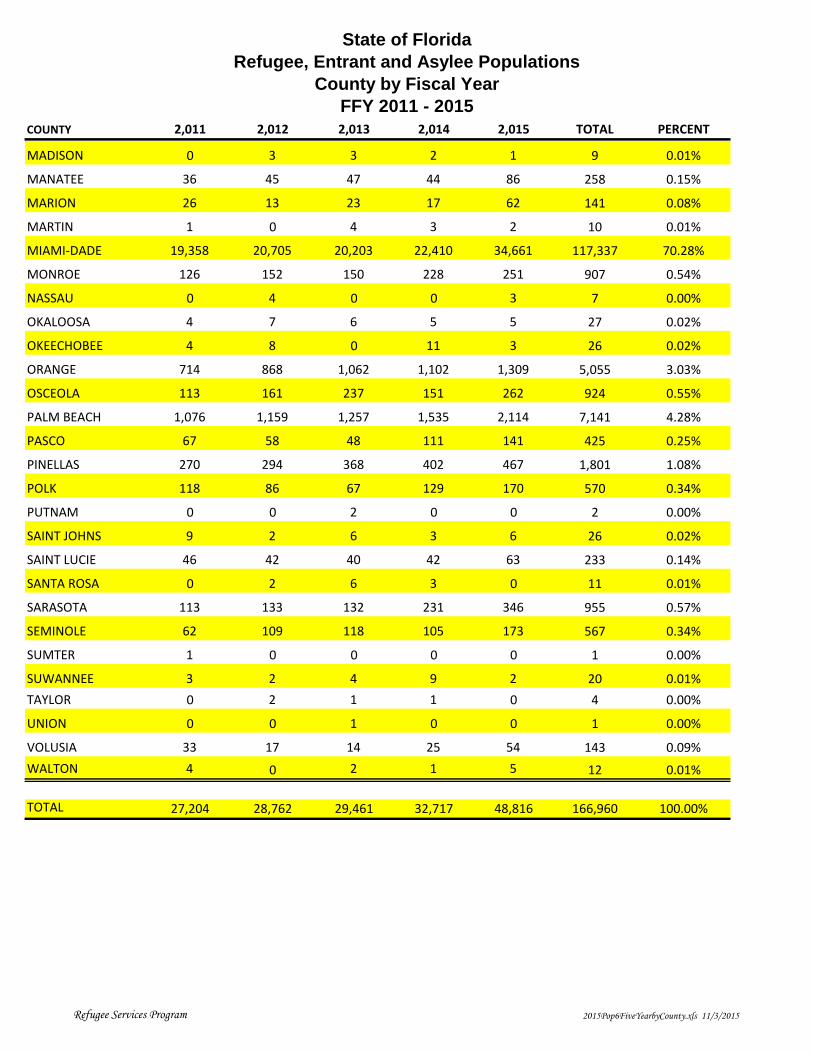
State of Florida
Refugee, Entrant and Asylee Populations
County by Fiscal Year
FFY 2011 - 2015
COUNTY 2,011 2,012 2,013 2,014 2,015 TOTAL PERCENT
ALACHUA 13 10 4 5 13 45 0.03%
BAKER 0 1 0 0 0 1 0.00%
BAY 5 11 5 25 21 67 0.04%
BRADFORD 0 0 1 0 0 1 0.00%
BREVARD 19 28 19 17 45 128 0.08%
BROWARD 1,174 1,079 1,224 1,005 1,200 5,682 3.40%
CALHOUN 0 0 0 0 1 1 0.00%
CHARLOTTE 10 12 14 23 10 69 0.04%
CITRUS 0 0 1 4 3 8 0.00%
CLAY 17 10 19 26 11 83 0.05%
COLLIER 462 467 571 636 945 3,081 1.85%
COLUMBIA 0 2 1 1 1 5 0.00%
DESOTO 0 17 1 3 0 21 0.01%
DIXIE 0 1 0 0 0 1 0.00%
DUVAL 925 902 1,003 1,110 1,264 5,204 3.12%
ESCAMBIA 15 15 11 35 25 101 0.06%
FLAGLER 4 17 16 12 12 61 0.04%
GILCHRIST 0 0 0 5 0 5 0.00%
GLADES 3 0 1 1 0 5 0.00%
HAMILTON 1 2 0 0 0 3 0.00%
HARDEE 0 1 2 0 0 3 0.00%
HENDRY 29 29 33 44 60 195 0.12%
HERNANDO 14 18 5 3 31 71 0.04%
HIGHLANDS 8 15 1 13 37 74 0.04%
HILLSBOROUGH 1,950 1,805 2,133 2,463 3,743 12,094 7.24%
HOLMES 0 0 0 1 5 6 0.00%
INDIAN RIVER 11 12 13 17 24 77 0.05%
JACKSON 0 0 0 1 0 1 0.00%
JEFFERSON 0 0 0 1 0 1 0.00%
LAFAYETTE 0 0 2 0 0 2 0.00%
LAKE 26 25 34 21 26 132 0.08%
LEE 328 411 535 629 1,125 3,028 1.81%
LEON 4 0 9 46 28 87 0.05%
LEVY 2 0 2 0 0 4 0.00%
Refugee Services Program 2015Pop6FiveYearbyCounty.xls 11/3/2015
State of Florida
Refugee, Entrant and Asylee Populations
County by Fiscal Year
FFY 2011 - 2015
COUNTY 2,011 2,012 2,013 2,014 2,015 TOTAL PERCENT
MADISON 0 3 3 2 1 9 0.01%
MANATEE 36 45 47 44 86 258 0.15%
MARION 26 13 23 17 62 141 0.08%
MARTIN 1 0 4 3 2 10 0.01%
MIAMI-DADE 19,358 20,705 20,203 22,410 34,661 117,337 70.28%
MONROE 126 152 150 228 251 907 0.54%
NASSAU 0 4 0 0 3 7 0.00%
OKALOOSA 4 7 6 5 5 27 0.02%
OKEECHOBEE 4 8 0 11 3 26 0.02%
ORANGE 714 868 1,062 1,102 1,309 5,055 3.03%
OSCEOLA 113 161 237 151 262 924 0.55%
PALM BEACH 1,076 1,159 1,257 1,535 2,114 7,141 4.28%
PASCO 67 58 48 111 141 425 0.25%
PINELLAS 270 294 368 402 467 1,801 1.08%
POLK 118 86 67 129 170 570 0.34%
PUTNAM 0 0 2 0 0 2 0.00%
SAINT JOHNS 9 2 6 3 6 26 0.02%
SAINT LUCIE 46 42 40 42 63 233 0.14%
SANTA ROSA 0 2 6 3 0 11 0.01%
SARASOTA 113 133 132 231 346 955 0.57%
SEMINOLE 62 109 118 105 173 567 0.34%
SUMTER 1 0 0 0 0 1 0.00%
SUWANNEE 3 2 4 9 2 20 0.01%
TAYLOR 0 2 1 1 0 4 0.00%
UNION 0 0 1 0 0 1 0.00%
VOLUSIA 33 17 14 25 54 143 0.09%
WALTON 4 0 2 1 5 12 0.01%
TOTAL 27,204 28,762 29,461 32,717 48,816 166,960 100.00%
Refugee Services Program 2015Pop6FiveYearbyCounty.xls 11/3/2015
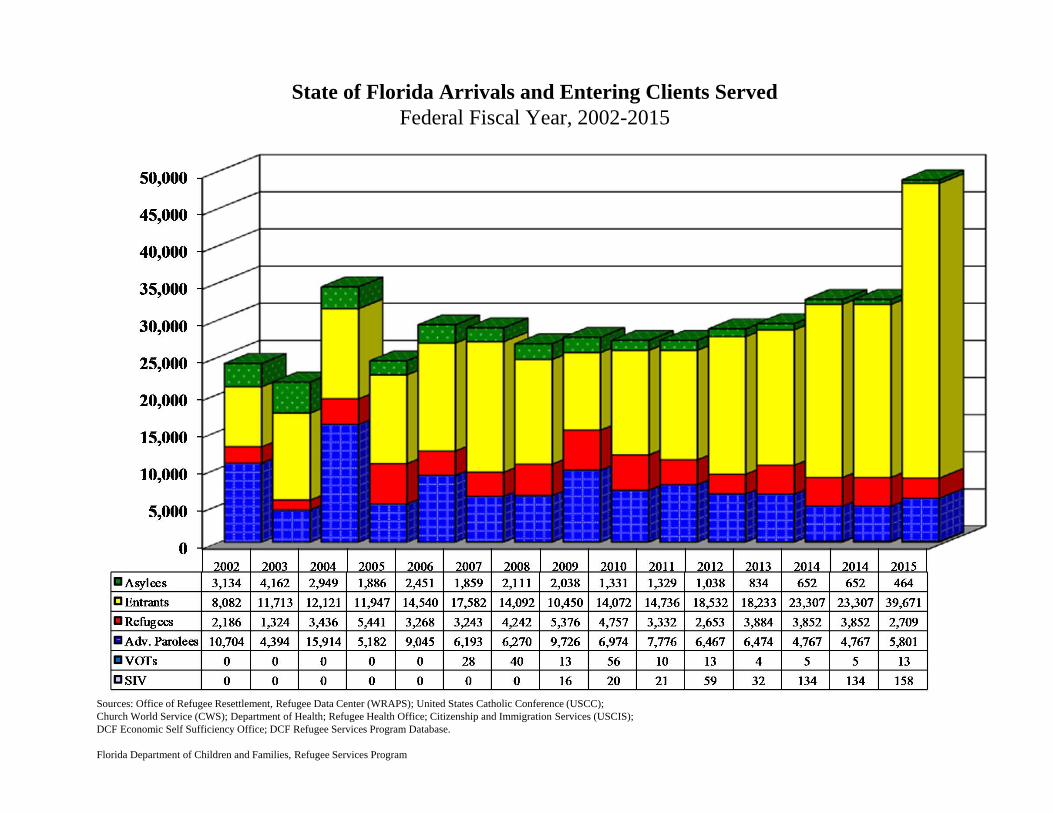
State of Florida Arrivals and Entering Clients ServedFederal Fiscal Year, 2002-2015
Sources: Office of Refugee Resettlement, Refugee Data Center (WRAPS); United States Catholic Conference (USCC); Church World Service (CWS); Department of Health; Refugee Health Office; Citizenship and Immigration Services (USCIS); DCF Economic Self Sufficiency Office; DCF Refugee Services Program Database.
Florida Department of Children and Families, Refugee Services Program
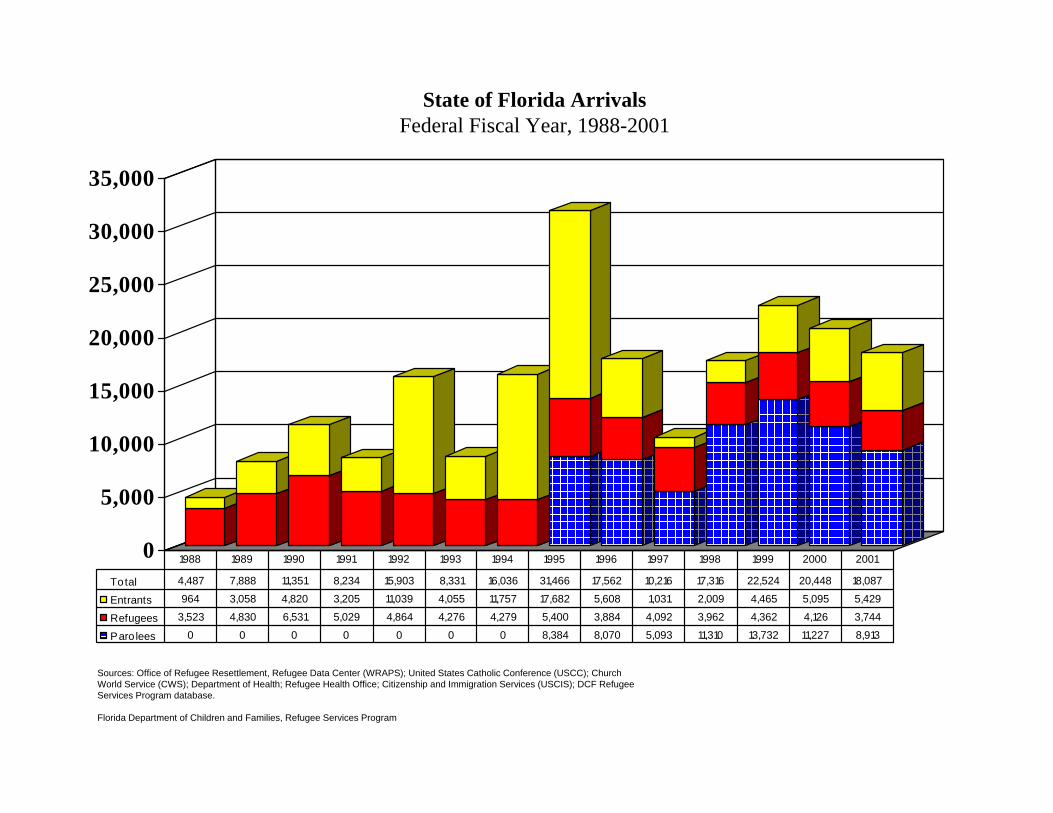
State of Florida ArrivalsFederal Fiscal Year, 1988-2001
0
5,000
10,000
15,000
20,000
25,000
30,000
35,000
Total 4,487 7,888 11,351 8,234 15,903 8,331 16,036 31,466 17,562 10,216 17,316 22,524 20,448 18,087
Entrants 964 3,058 4,820 3,205 11,039 4,055 11,757 17,682 5,608 1,031 2,009 4,465 5,095 5,429
Refugees 3,523 4,830 6,531 5,029 4,864 4,276 4,279 5,400 3,884 4,092 3,962 4,362 4,126 3,744
Paro lees 0 0 0 0 0 0 0 8,384 8,070 5,093 11,310 13,732 11,227 8,913
1988 1989 1990 1991 1992 1993 1994 1995 1996 1997 1998 1999 2000 2001
Sources: Office of Refugee Resettlement, Refugee Data Center (WRAPS); United States Catholic Conference (USCC); Church World Service (CWS); Department of Health; Refugee Health Office; Citizenship and Immigration Services (USCIS); DCF Refugee Services Program database.
Florida Department of Children and Families, Refugee Services Program
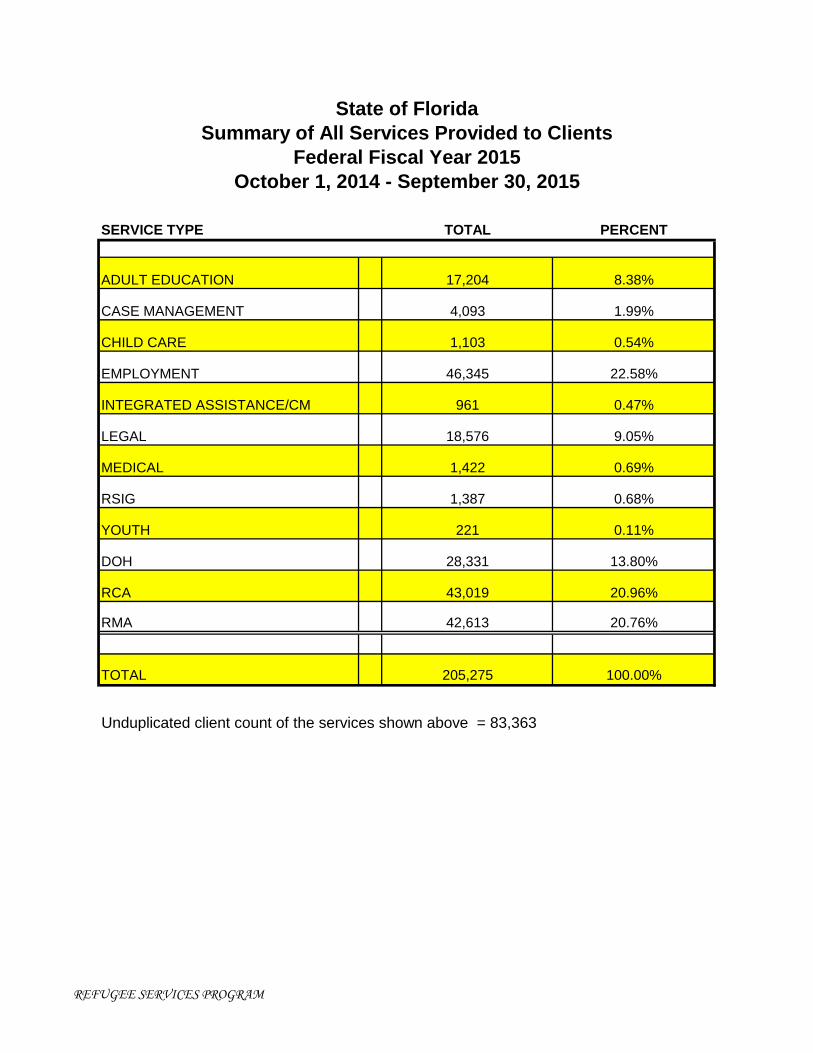
SERVICE TYPE TOTAL PERCENT
ADULT EDUCATION 17,204 8.38%
CASE MANAGEMENT 4,093 1.99%
CHILD CARE 1,103 0.54%
EMPLOYMENT 46,345 22.58%
INTEGRATED ASSISTANCE/CM 961 0.47%
LEGAL 18,576 9.05%
MEDICAL 1,422 0.69%
RSIG 1,387 0.68%
YOUTH 221 0.11%
DOH 28,331 13.80%
RCA 43,019 20.96%
RMA 42,613 20.76%
TOTAL 205,275 100.00%
Unduplicated client count of the services shown above = 83,363
Federal Fiscal Year 2015
State of Florida
Summary of All Services Provided to Clients
October 1, 2014 - September 30, 2015
REFUGEE SERVICES PROGRAM
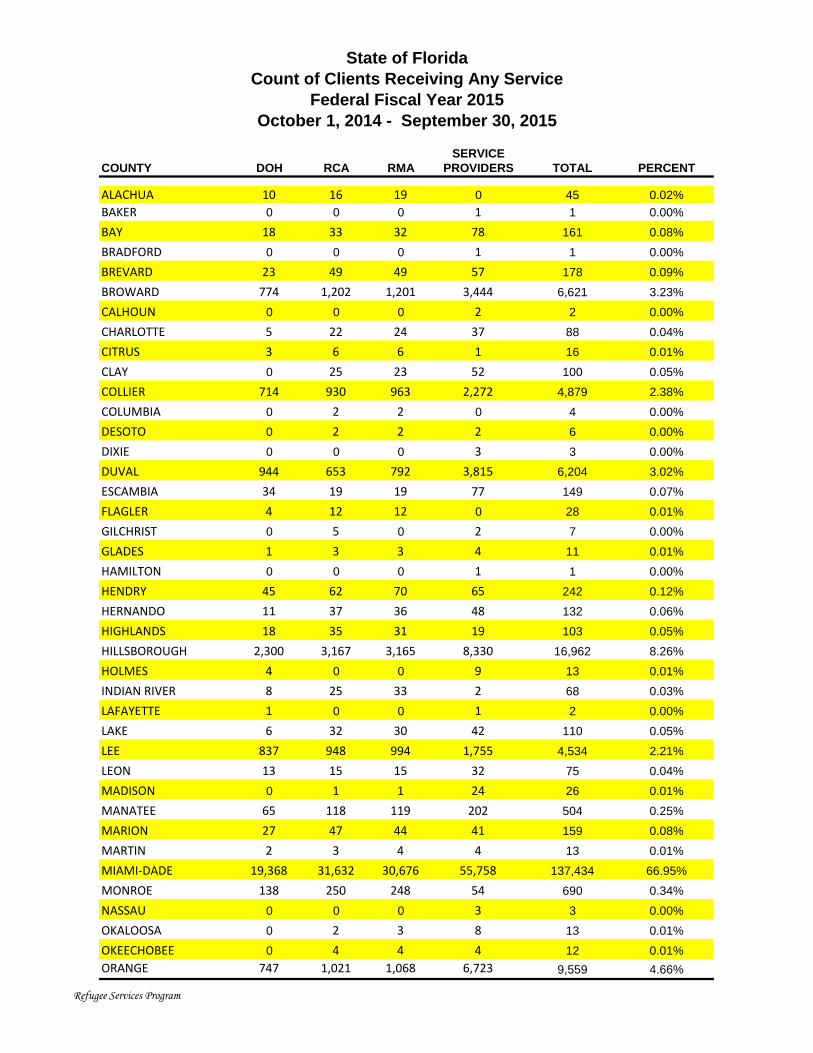
State of Florida
Count of Clients Receiving Any Service
Federal Fiscal Year 2015
October 1, 2014 - September 30, 2015
SERVICE
COUNTY DOH RCA RMA PROVIDERS TOTAL PERCENT
ALACHUA 10 16 19 0 45 0.02%
BAKER 0 0 0 1 1 0.00%
BAY 18 33 32 78 161 0.08%
BRADFORD 0 0 0 1 1 0.00%
BREVARD 23 49 49 57 178 0.09%
BROWARD 774 1,202 1,201 3,444 6,621 3.23%
CALHOUN 0 0 0 2 2 0.00%
CHARLOTTE 5 22 24 37 88 0.04%
CITRUS 3 6 6 1 16 0.01%
CLAY 0 25 23 52 100 0.05%
COLLIER 714 930 963 2,272 4,879 2.38%
COLUMBIA 0 2 2 0 4 0.00%
DESOTO 0 2 2 2 6 0.00%
DIXIE 0 0 0 3 3 0.00%
DUVAL 944 653 792 3,815 6,204 3.02%
ESCAMBIA 34 19 19 77 149 0.07%
FLAGLER 4 12 12 0 28 0.01%
GILCHRIST 0 5 0 2 7 0.00%
GLADES 1 3 3 4 11 0.01%
HAMILTON 0 0 0 1 1 0.00%
HENDRY 45 62 70 65 242 0.12%
HERNANDO 11 37 36 48 132 0.06%
HIGHLANDS 18 35 31 19 103 0.05%
HILLSBOROUGH 2,300 3,167 3,165 8,330 16,962 8.26%
HOLMES 4 0 0 9 13 0.01%
INDIAN RIVER 8 25 33 2 68 0.03%
LAFAYETTE 1 0 0 1 2 0.00%
LAKE 6 32 30 42 110 0.05%
LEE 837 948 994 1,755 4,534 2.21%
LEON 13 15 15 32 75 0.04%
MADISON 0 1 1 24 26 0.01%
MANATEE 65 118 119 202 504 0.25%
MARION 27 47 44 41 159 0.08%
MARTIN 2 3 4 4 13 0.01%
MIAMI-DADE 19,368 31,632 30,676 55,758 137,434 66.95%
MONROE 138 250 248 54 690 0.34%
NASSAU 0 0 0 3 3 0.00%
OKALOOSA 0 2 3 8 13 0.01%
OKEECHOBEE 0 4 4 4 12 0.01%
ORANGE 747 1,021 1,068 6,723 9,559 4.66%
Refugee Services Program
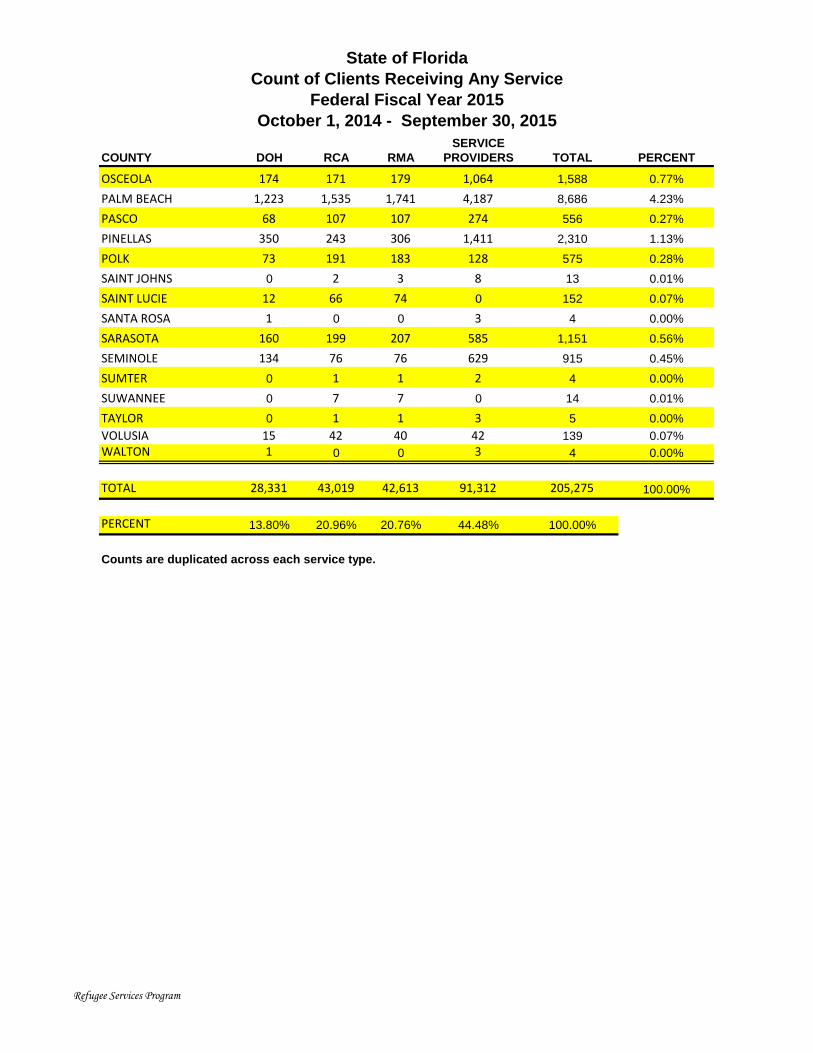
State of Florida
Count of Clients Receiving Any Service
Federal Fiscal Year 2015
October 1, 2014 - September 30, 2015
SERVICE
COUNTY DOH RCA RMA PROVIDERS TOTAL PERCENT
OSCEOLA 174 171 179 1,064 1,588 0.77%
PALM BEACH 1,223 1,535 1,741 4,187 8,686 4.23%
PASCO 68 107 107 274 556 0.27%
PINELLAS 350 243 306 1,411 2,310 1.13%
POLK 73 191 183 128 575 0.28%
SAINT JOHNS 0 2 3 8 13 0.01%
SAINT LUCIE 12 66 74 0 152 0.07%
SANTA ROSA 1 0 0 3 4 0.00%
SARASOTA 160 199 207 585 1,151 0.56%
SEMINOLE 134 76 76 629 915 0.45%
SUMTER 0 1 1 2 4 0.00%
SUWANNEE 0 7 7 0 14 0.01%
TAYLOR 0 1 1 3 5 0.00%
VOLUSIA 15 42 40 42 139 0.07%
WALTON 1 0 0 3 4 0.00%
TOTAL 28,331 43,019 42,613 91,312 205,275 100.00%
PERCENT 13.80% 20.96% 20.76% 44.48% 100.00%
Counts are duplicated across each service type.
Refugee Services Program
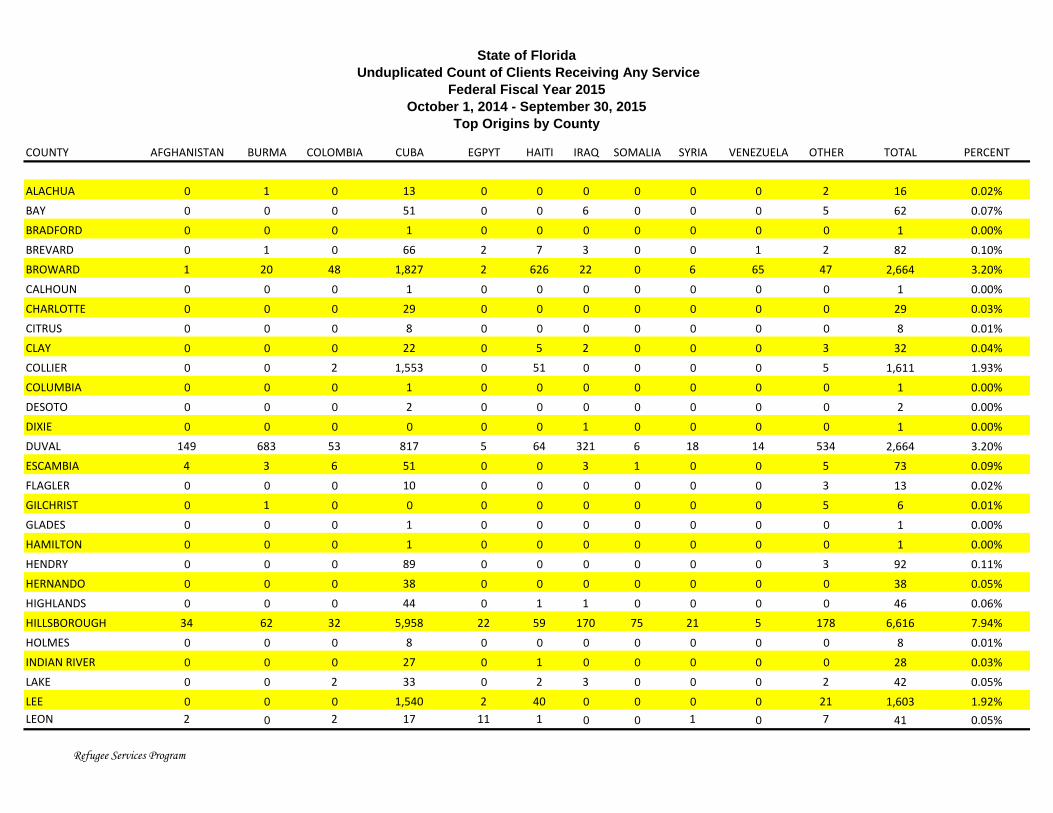
State of Florida
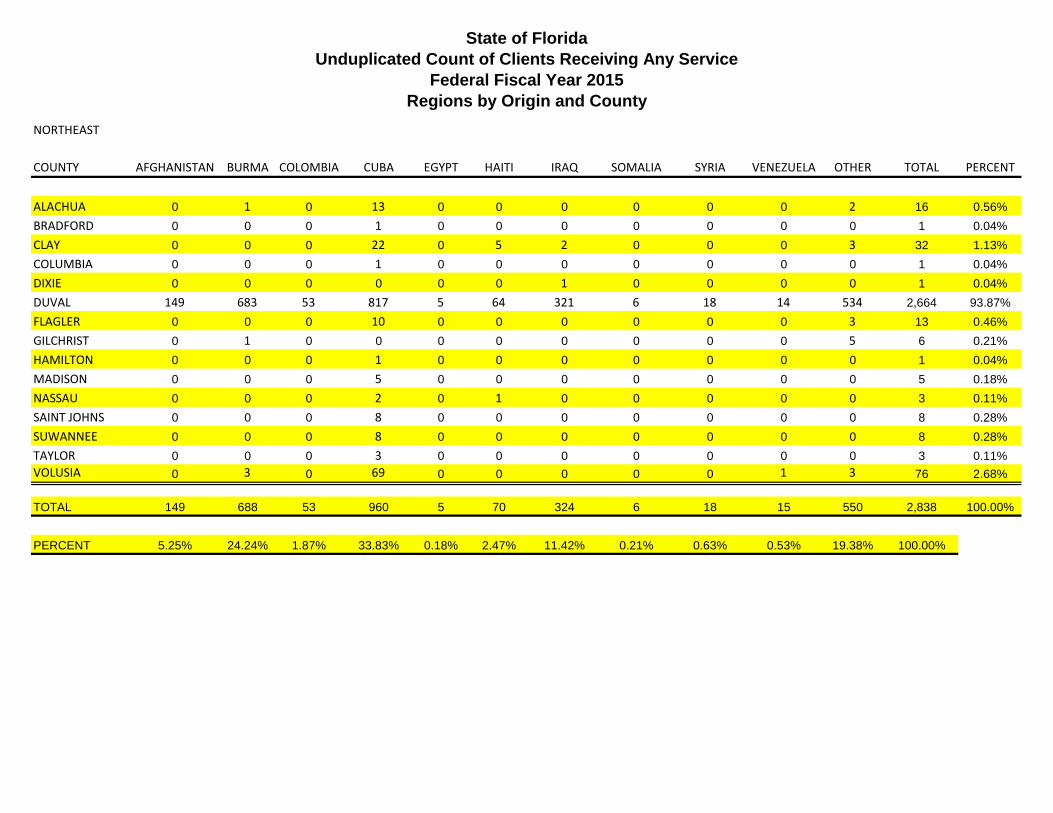
Unduplicated Count of Clients Receiving Any Service
Federal Fiscal Year 2015
October 1, 2014 - September 30, 2015
Top Origins by County
COUNTY AFGHANISTAN BURMA COLOMBIA CUBA EGPYT HAITI IRAQ SOMALIA SYRIA VENEZUELA OTHER TOTAL PERCENT
ALACHUA 0 1 0 13 0 0 0 0 0 0 2 16 0.02%
BAY 0 0 0 51 0 0 6 0 0 0 5 62 0.07%
BRADFORD 0 0 0 1 0 0 0 0 0 0 0 1 0.00%
BREVARD 0 1 0 66 2 7 3 0 0 1 2 82 0.10%
BROWARD 1 20 48 1,827 2 626 22 0 6 65 47 2,664 3.20%
CALHOUN 0 0 0 1 0 0 0 0 0 0 0 1 0.00%
CHARLOTTE 0 0 0 29 0 0 0 0 0 0 0 29 0.03%
CITRUS 0 0 0 8 0 0 0 0 0 0 0 8 0.01%
CLAY 0 0 0 22 0 5 2 0 0 0 3 32 0.04%
COLLIER 0 0 2 1,553 0 51 0 0 0 0 5 1,611 1.93%
COLUMBIA 0 0 0 1 0 0 0 0 0 0 0 1 0.00%
DESOTO 0 0 0 2 0 0 0 0 0 0 0 2 0.00%
DIXIE 0 0 0 0 0 0 1 0 0 0 0 1 0.00%
DUVAL 149 683 53 817 5 64 321 6 18 14 534 2,664 3.20%
ESCAMBIA 4 3 6 51 0 0 3 1 0 0 5 73 0.09%
FLAGLER 0 0 0 10 0 0 0 0 0 0 3 13 0.02%
GILCHRIST 0 1 0 0 0 0 0 0 0 0 5 6 0.01%
GLADES 0 0 0 1 0 0 0 0 0 0 0 1 0.00%
HAMILTON 0 0 0 1 0 0 0 0 0 0 0 1 0.00%
HENDRY 0 0 0 89 0 0 0 0 0 0 3 92 0.11%
HERNANDO 0 0 0 38 0 0 0 0 0 0 0 38 0.05%
HIGHLANDS 0 0 0 44 0 1 1 0 0 0 0 46 0.06%
HILLSBOROUGH 34 62 32 5,958 22 59 170 75 21 5 178 6,616 7.94%
HOLMES 0 0 0 8 0 0 0 0 0 0 0 8 0.01%
INDIAN RIVER 0 0 0 27 0 1 0 0 0 0 0 28 0.03%
LAKE 0 0 2 33 0 2 3 0 0 0 2 42 0.05%
LEE 0 0 0 1,540 2 40 0 0 0 0 21 1,603 1.92%
LEON 2 0 2 17 11 1 0 0 1 0 7 41 0.05%
Refugee Services Program
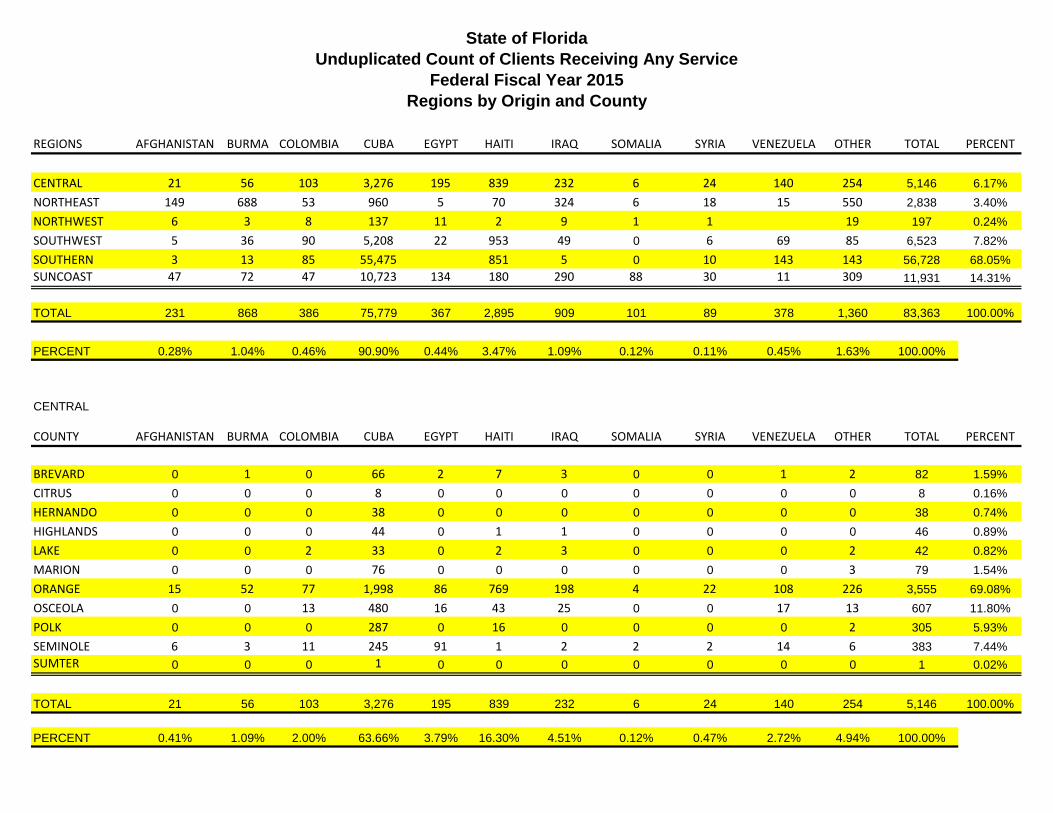
State of Florida
Unduplicated Count of Clients Receiving Any Service
Federal Fiscal Year 2015
Regions by Origin and County
REGIONS AFGHANISTAN BURMA COLOMBIA CUBA EGYPT HAITI IRAQ SOMALIA SYRIA VENEZUELA OTHER TOTAL PERCENT
CENTRAL 21 56 103 3,276 195 839 232 6 24 140 254 5,146 6.17%
NORTHEAST 149 688 53 960 5 70 324 6 18 15 550 2,838 3.40%
NORTHWEST 6 3 8 137 11 2 9 1 1 19 197 0.24%
SOUTHWEST 5 36 90 5,208 22 953 49 0 6 69 85 6,523 7.82%
SOUTHERN 3 13 85 55,475 851 5 0 10 143 143 56,728 68.05%
SUNCOAST 47 72 47 10,723 134 180 290 88 30 11 309 11,931 14.31%
TOTAL 231 868 386 75,779 367 2,895 909 101 89 378 1,360 83,363 100.00%
PERCENT 0.28% 1.04% 0.46% 90.90% 0.44% 3.47% 1.09% 0.12% 0.11% 0.45% 1.63% 100.00%
CENTRAL
COUNTY AFGHANISTAN BURMA COLOMBIA CUBA EGYPT HAITI IRAQ SOMALIA SYRIA VENEZUELA OTHER TOTAL PERCENT
BREVARD 0 1 0 66 2 7 3 0 0 1 2 82 1.59%
CITRUS 0 0 0 8 0 0 0 0 0 0 0 8 0.16%
HERNANDO 0 0 0 38 0 0 0 0 0 0 0 38 0.74%
HIGHLANDS 0 0 0 44 0 1 1 0 0 0 0 46 0.89%
LAKE 0 0 2 33 0 2 3 0 0 0 2 42 0.82%
MARION 0 0 0 76 0 0 0 0 0 0 3 79 1.54%
ORANGE 15 52 77 1,998 86 769 198 4 22 108 226 3,555 69.08%
OSCEOLA 0 0 13 480 16 43 25 0 0 17 13 607 11.80%
POLK 0 0 0 287 0 16 0 0 0 0 2 305 5.93%
SEMINOLE 6 3 11 245 91 1 2 2 2 14 6 383 7.44%
SUMTER 0 0 0 1 0 0 0 0 0 0 0 1 0.02%
TOTAL 21 56 103 3,276 195 839 232 6 24 140 254 5,146 100.00%
PERCENT 0.41% 1.09% 2.00% 63.66% 3.79% 16.30% 4.51% 0.12% 0.47% 2.72% 4.94% 100.00%
State of Florida
Unduplicated Count of Clients Receiving Any Service
Federal Fiscal Year 2015
Regions by Origin and County
NORTHEAST
COUNTY AFGHANISTAN BURMA COLOMBIA CUBA EGYPT HAITI IRAQ SOMALIA SYRIA VENEZUELA OTHER TOTAL PERCENT
ALACHUA 0 1 0 13 0 0 0 0 0 0 2 16 0.56%
BRADFORD 0 0 0 1 0 0 0 0 0 0 0 1 0.04%
CLAY 0 0 0 22 0 5 2 0 0 0 3 32 1.13%
COLUMBIA 0 0 0 1 0 0 0 0 0 0 0 1 0.04%
DIXIE 0 0 0 0 0 0 1 0 0 0 0 1 0.04%
DUVAL 149 683 53 817 5 64 321 6 18 14 534 2,664 93.87%
FLAGLER 0 0 0 10 0 0 0 0 0 0 3 13 0.46%
GILCHRIST 0 1 0 0 0 0 0 0 0 0 5 6 0.21%
HAMILTON 0 0 0 1 0 0 0 0 0 0 0 1 0.04%
MADISON 0 0 0 5 0 0 0 0 0 0 0 5 0.18%
NASSAU 0 0 0 2 0 1 0 0 0 0 0 3 0.11%
SAINT JOHNS 0 0 0 8 0 0 0 0 0 0 0 8 0.28%
SUWANNEE 0 0 0 8 0 0 0 0 0 0 0 8 0.28%
TAYLOR 0 0 0 3 0 0 0 0 0 0 0 3 0.11%
VOLUSIA 0 3 0 69 0 0 0 0 0 1 3 76 2.68%
TOTAL 149 688 53 960 5 70 324 6 18 15 550 2,838 100.00%
PERCENT 5.25% 24.24% 1.87% 33.83% 0.18% 2.47% 11.42% 0.21% 0.63% 0.53% 19.38% 100.00%
State of Florida
Unduplicated Count of Clients Receiving Any Service
Federal Fiscal Year 2015
Regions by Origin and County
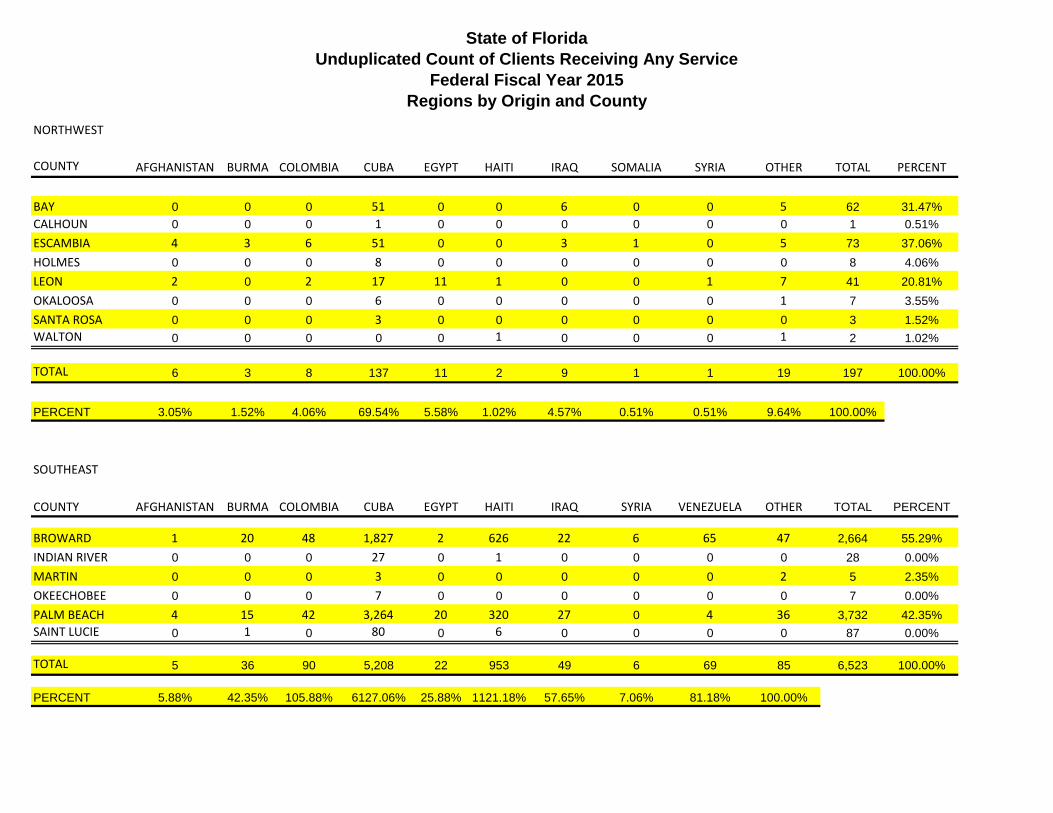
NORTHWEST
COUNTY AFGHANISTAN BURMA COLOMBIA CUBA EGYPT HAITI IRAQ SOMALIA SYRIA OTHER TOTAL PERCENT
BAY 0 0 0 51 0 0 6 0 0 5 62 31.47%
CALHOUN 0 0 0 1 0 0 0 0 0 0 1 0.51%
ESCAMBIA 4 3 6 51 0 0 3 1 0 5 73 37.06%
HOLMES 0 0 0 8 0 0 0 0 0 0 8 4.06%
LEON 2 0 2 17 11 1 0 0 1 7 41 20.81%
OKALOOSA 0 0 0 6 0 0 0 0 0 1 7 3.55%
SANTA ROSA 0 0 0 3 0 0 0 0 0 0 3 1.52%
WALTON 0 0 0 0 0 1 0 0 0 1 2 1.02%
TOTAL 6 3 8 137 11 2 9 1 1 19 197 100.00%
PERCENT 3.05% 1.52% 4.06% 69.54% 5.58% 1.02% 4.57% 0.51% 0.51% 9.64% 100.00%
SOUTHEAST
COUNTY AFGHANISTAN BURMA COLOMBIA CUBA EGYPT HAITI IRAQ SYRIA VENEZUELA OTHER TOTAL PERCENT
BROWARD 1 20 48 1,827 2 626 22 6 65 47 2,664 55.29%
INDIAN RIVER 0 0 0 27 0 1 0 0 0 0 28 0.00%
MARTIN 0 0 0 3 0 0 0 0 0 2 5 2.35%
OKEECHOBEE 0 0 0 7 0 0 0 0 0 0 7 0.00%
PALM BEACH 4 15 42 3,264 20 320 27 0 4 36 3,732 42.35%
SAINT LUCIE 0 1 0 80 0 6 0 0 0 0 87 0.00%
TOTAL 5 36 90 5,208 22 953 49 6 69 85 6,523 100.00%
PERCENT 5.88% 42.35% 105.88% 6127.06% 25.88% 1121.18% 57.65% 7.06% 81.18% 100.00%
State of Florida
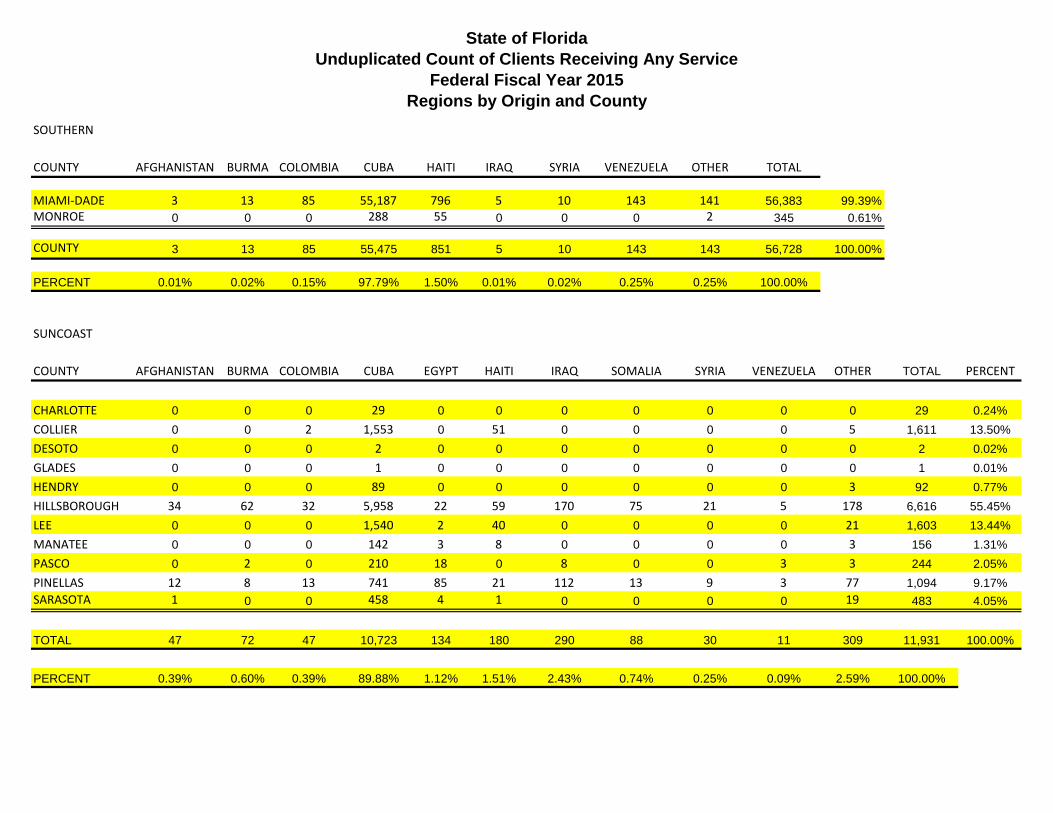
Unduplicated Count of Clients Receiving Any Service
Federal Fiscal Year 2015
Regions by Origin and County
SOUTHERN
COUNTY AFGHANISTAN BURMA COLOMBIA CUBA HAITI IRAQ SYRIA VENEZUELA OTHER TOTAL
MIAMI-DADE 3 13 85 55,187 796 5 10 143 141 56,383 99.39%
MONROE 0 0 0 288 55 0 0 0 2 345 0.61%
COUNTY 3 13 85 55,475 851 5 10 143 143 56,728 100.00%
PERCENT 0.01% 0.02% 0.15% 97.79% 1.50% 0.01% 0.02% 0.25% 0.25% 100.00%
SUNCOAST
COUNTY AFGHANISTAN BURMA COLOMBIA CUBA EGYPT HAITI IRAQ SOMALIA SYRIA VENEZUELA OTHER TOTAL PERCENT
CHARLOTTE 0 0 0 29 0 0 0 0 0 0 0 29 0.24%
COLLIER 0 0 2 1,553 0 51 0 0 0 0 5 1,611 13.50%
DESOTO 0 0 0 2 0 0 0 0 0 0 0 2 0.02%
GLADES 0 0 0 1 0 0 0 0 0 0 0 1 0.01%
HENDRY 0 0 0 89 0 0 0 0 0 0 3 92 0.77%
HILLSBOROUGH 34 62 32 5,958 22 59 170 75 21 5 178 6,616 55.45%
LEE 0 0 0 1,540 2 40 0 0 0 0 21 1,603 13.44%
MANATEE 0 0 0 142 3 8 0 0 0 0 3 156 1.31%
PASCO 0 2 0 210 18 0 8 0 0 3 3 244 2.05%
PINELLAS 12 8 13 741 85 21 112 13 9 3 77 1,094 9.17%
SARASOTA 1 0 0 458 4 1 0 0 0 0 19 483 4.05%
TOTAL 47 72 47 10,723 134 180 290 88 30 11 309 11,931 100.00%
PERCENT 0.39% 0.60% 0.39% 89.88% 1.12% 1.51% 2.43% 0.74% 0.25% 0.09% 2.59% 100.00%