florida’s gifted student population grew faster … · florida’s gifted student population grew...
TRANSCRIPT
Office of Program Policy Analysis & Government Accountability an office of the Florida Legislature
January 2008 Report No. 08-01
Florida’s Gifted Student Population Grew Faster Than the Overall School Enrollment at a glance Although the number of students attending Florida’s public K-12 schools declined in 2006-07, students identified as gifted grew almost 7% to 124,491 full-time students. The state provided approximately $276 million in funding for gifted students through the Exceptional Student Education program in addition to the basic funding provided for all students. Districts were unable to identify their expenditures for gifted students.
Florida’s school districts identified almost 17,000 new gifted students in 2006-07, including approximately 1,000 students identified through alternative identification provisions which do not require the same minimum IQ for underrepresented groups. However, this understates the number of gifted students identified under alternative provisions as 19 districts could not report these data. Districts also reported providing more services for gifted students in 2006-07; the largest increase occurred in gifted consultation services, in which a gifted endorsed specialist works with gifted students and their teachers to ensure the student’s educational needs are met. However, high school gifted students do not tend to take high school elective courses that are designed for gifted students. Rather, honors and other advanced courses constitute 46% of their courses.
Florida is 1 of only 16 states that classifies gifted programs as part of exceptional student education. School districts generally believe that funding gifted students through the guaranteed allocation provides stability in funding and planning, although it can result in increased paperwork. Parents of gifted students report that their children benefit from Exceptional Student Education protections, although some parents report that they did not initially understand these protections.
Scope _______________ As directed by the Florida Legislature, this report provides information about Florida’s K-12 gifted program. The report addresses five questions.
How much funding does the state provide school districts for gifted services, and how do districts account for these expenditures?
How do other states fund services for gifted students?
How do school districts identify gifted students, and how many have been identified in the last two years?
What types of services and programs do school districts provide to gifted students?
What are the advantages and disadvantages of classifying gifted students as exceptional students?
To research these questions, we interviewed school district staff and finance officers, conducted focus groups of parents, students and teachers, obtained information from the 67 school districts, examined Department of Education data on courses in which gifted students enroll and the certifications of their teachers, and interviewed gifted education directors in other states.
OPPAGA Report Report No. 08-01
Background _____________ In Florida, a gifted student is defined as one who has superior intellectual development and is capable of high performance. Gifted students have an exceptional ability to acquire and process information and may not be adequately served by the standard school curriculum. Florida is 1 of 26 states that require identification and services for gifted students. Florida law classifies gifted students as exceptional students. 1
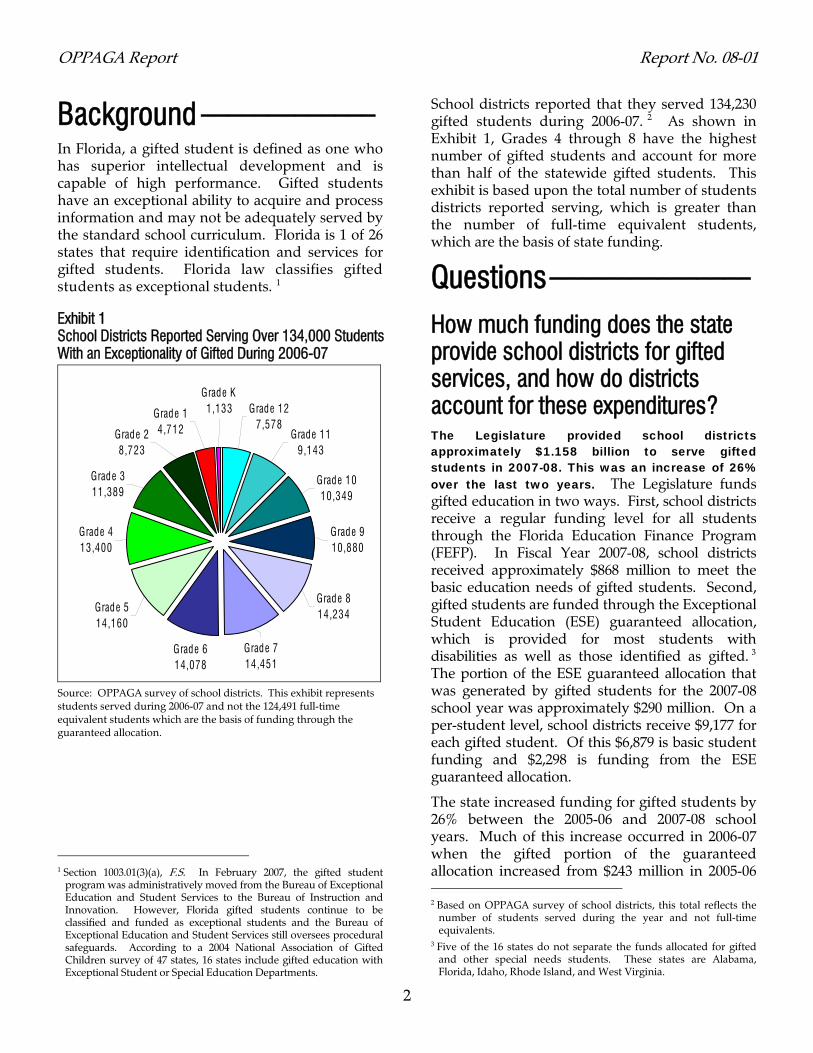
Exhibit 1 School Districts Reported Serving Over 134,000 Students With an Exceptionality of Gifted During 2006-07
Grade 714,451
Grade 614,078
Grade 814,234
Grade 1010,349
Grade 910,880
Grade 14,712 Grade 11
9,143
Grade 127,578
Grade K1,133
Grade 28,723
Grade 514,160
Grade 311,389
Grade 413,400
Source: OPPAGA survey of school districts. This exhibit represents students served during 2006-07 and not the 124,491 full-time equivalent students which are the basis of funding through the guaranteed allocation.
2
1 Section 1003.01(3)(a), F.S. In February 2007, the gifted student
program was administratively moved from the Bureau of Exceptional Education and Student Services to the Bureau of Instruction and Innovation. However, Florida gifted students continue to be classified and funded as exceptional students and the Bureau of Exceptional Education and Student Services still oversees procedural safeguards. According to a 2004 National Association of Gifted Children survey of 47 states, 16 states include gifted education with Exceptional Student or Special Education Departments.
School districts reported that they served 134,230 gifted students during 2006-07. 2 As shown in Exhibit 1, Grades 4 through 8 have the highest number of gifted students and account for more than half of the statewide gifted students. This exhibit is based upon the total number of students districts reported serving, which is greater than the number of full-time equivalent students, which are the basis of state funding.
Questions_______________
How much funding does the state provide school districts for gifted services, and how do districts account for these expenditures? The Legislature provided school districts approximately $1.158 billion to serve gifted students in 2007-08. This was an increase of 26% over the last two years. The Legislature funds gifted education in two ways. First, school districts receive a regular funding level for all students through the Florida Education Finance Program (FEFP). In Fiscal Year 2007-08, school districts received approximately $868 million to meet the basic education needs of gifted students. Second, gifted students are funded through the Exceptional Student Education (ESE) guaranteed allocation, which is provided for most students with disabilities as well as those identified as gifted. 3 The portion of the ESE guaranteed allocation that was generated by gifted students for the 2007-08 school year was approximately $290 million. On a per-student level, school districts receive $9,177 for each gifted student. Of this $6,879 is basic student funding and $2,298 is funding from the ESE guaranteed allocation.
The state increased funding for gifted students by 26% between the 2005-06 and 2007-08 school years. Much of this increase occurred in 2006-07 when the gifted portion of the guaranteed allocation increased from $243 million in 2005-06
2 Based on OPPAGA survey of school districts, this total reflects the
number of students served during the year and not full-time equivalents.
3 Five of the 16 states do not separate the funds allocated for gifted and other special needs students. These states are Alabama, Florida, Idaho, Rhode Island, and West Virginia.
Report No. 08-01 OPPAGA Report
3
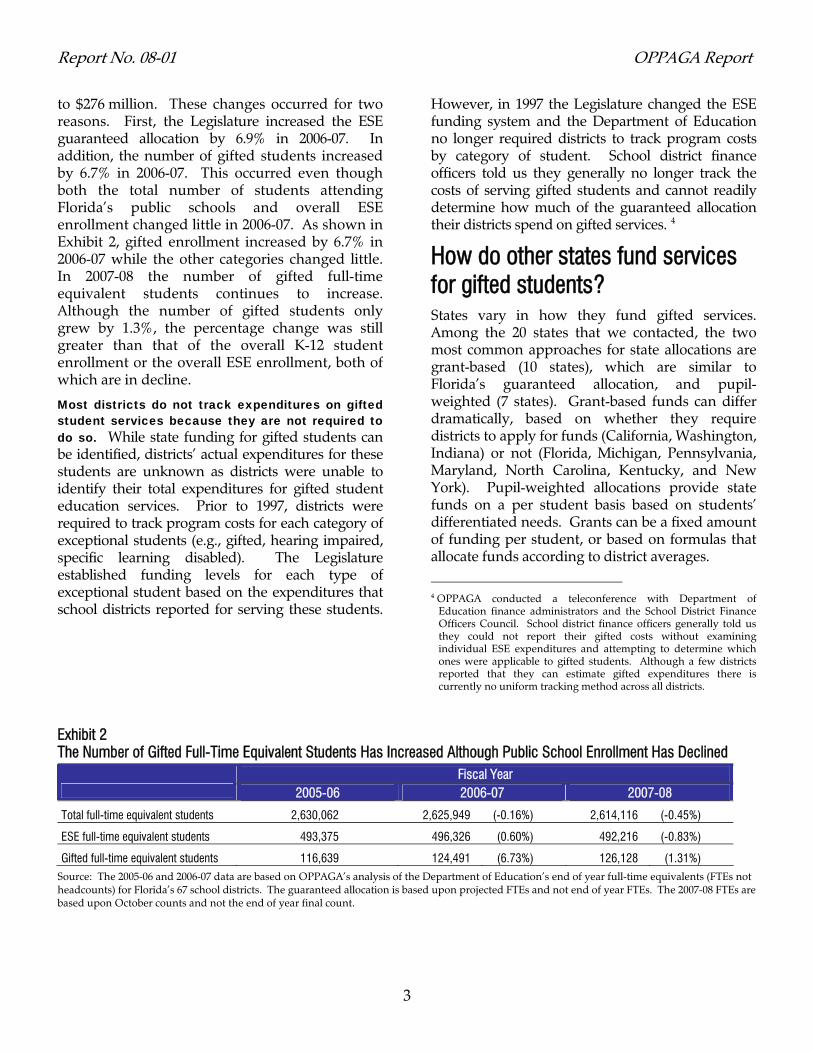
to $276 million. These changes occurred for two reasons. First, the Legislature increased the ESE guaranteed allocation by 6.9% in 2006-07. In addition, the number of gifted students increased by 6.7% in 2006-07. This occurred even though both the total number of students attending Florida’s public schools and overall ESE enrollment changed little in 2006-07. As shown in Exhibit 2, gifted enrollment increased by 6.7% in 2006-07 while the other categories changed little. In 2007-08 the number of gifted full-time equivalent students continues to increase. Although the number of gifted students only grew by 1.3%, the percentage change was still greater than that of the overall K-12 student enrollment or the overall ESE enrollment, both of which are in decline.
Most districts do not track expenditures on gifted student services because they are not required to do so. While state funding for gifted students can be identified, districts’ actual expenditures for these students are unknown as districts were unable to identify their total expenditures for gifted student education services. Prior to 1997, districts were required to track program costs for each category of exceptional students (e.g., gifted, hearing impaired, specific learning disabled). The Legislature established funding levels for each type of exceptional student based on the expenditures that school districts reported for serving these students.
However, in 1997 the Legislature changed the ESE funding system and the Department of Education no longer required districts to track program costs by category of student. School district finance officers told us they generally no longer track the costs of serving gifted students and cannot readily determine how much of the guaranteed allocation their districts spend on gifted services. 4
How do other states fund services for gifted students? States vary in how they fund gifted services. Among the 20 states that we contacted, the two most common approaches for state allocations are grant-based (10 states), which are similar to Florida’s guaranteed allocation, and pupil-weighted (7 states). Grant-based funds can differ dramatically, based on whether they require districts to apply for funds (California, Washington, Indiana) or not (Florida, Michigan, Pennsylvania, Maryland, North Carolina, Kentucky, and New York). Pupil-weighted allocations provide state funds on a per student basis based on students’ differentiated needs. Grants can be a fixed amount of funding per student, or based on formulas that allocate funds according to district averages.
4 OPPAGA conducted a teleconference with Department of
Education finance administrators and the School District Finance Officers Council. School district finance officers generally told us they could not report their gifted costs without examining individual ESE expenditures and attempting to determine which ones were applicable to gifted students. Although a few districts reported that they can estimate gifted expenditures there is currently no uniform tracking method across all districts.
Exhibit 2 The Number of Gifted Full-Time Equivalent Students Has Increased Although Public School Enrollment Has Declined
Fiscal Year 2005-06 2006-07 2007-08
Total full-time equivalent students 2,630,062 2,625,949 (-0.16%) 2,614,116 (-0.45%)
ESE full-time equivalent students 493,375 496,326 (0.60%) 492,216 (-0.83%)
Gifted full-time equivalent students 116,639 124,491 (6.73%) 126,128 (1.31%) Source: The 2005-06 and 2006-07 data are based on OPPAGA’s analysis of the Department of Education’s end of year full-time equivalents (FTEs not headcounts) for Florida’s 67 school districts. The guaranteed allocation is based upon projected FTEs and not end of year FTEs. The 2007-08 FTEs are based upon October counts and not the end of year final count.
OPPAGA Report Report No. 08-01
4
To identify how other states structure and fund their programs for gifted students, we conducted structured telephone interviews with state gifted education directors from 10 Southern Regional Education Board member states and the 10 remaining states that had the highest K-12 enrollment. 5
Many states cap funding for gifted services. Ten of the 20 states we contacted use a funding mechanism that caps the allocation districts receive for gifted services to a set percentage of each district’s average daily attendance. 6 Florida historically had not used a similar funding cap. However, the Florida Legislature capped the expenditures for gifted high school services in 2007-08 at the 2006-07 amount.
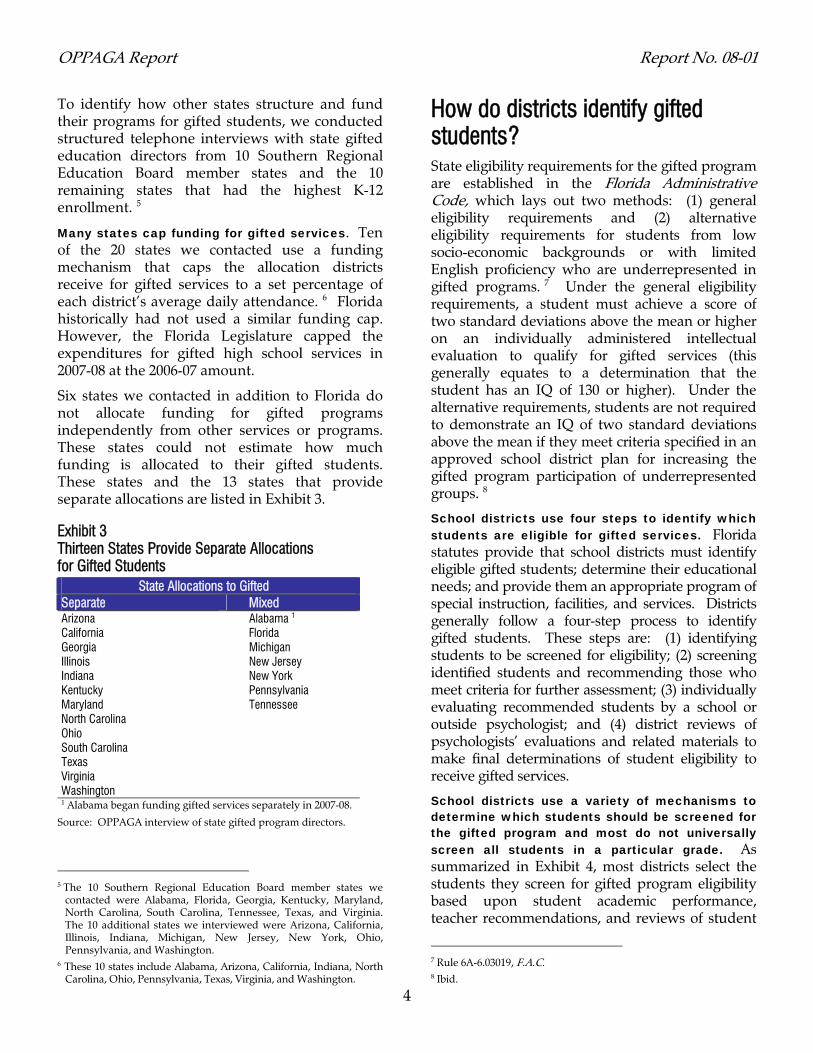
Six states we contacted in addition to Florida do not allocate funding for gifted programs independently from other services or programs. These states could not estimate how much funding is allocated to their gifted students. These states and the 13 states that provide separate allocations are listed in Exhibit 3.
Exhibit 3 Thirteen States Provide Separate Allocations for Gifted Students
State Allocations to Gifted Separate Mixed Arizona Alabama 1
California Florida Georgia Michigan Illinois New Jersey Indiana New York Kentucky Pennsylvania Maryland Tennessee North Carolina Ohio South Carolina Texas Virginia Washington 1 Alabama began funding gifted services separately in 2007-08.
Source: OPPAGA interview of state gifted program directors.
5 The 10 Southern Regional Education Board member states we contacted were Alabama, Florida, Georgia, Kentucky, Maryland, North Carolina, South Carolina, Tennessee, Texas, and Virginia. The 10 additional states we interviewed were Arizona, California, Illinois, Indiana, Michigan, New Jersey, New York, Ohio, Pennsylvania, and Washington.
6 These 10 states include Alabama, Arizona, California, Indiana, North Carolina, Ohio, Pennsylvania, Texas, Virginia, and Washington.
How do districts identify gifted students? State eligibility requirements for the gifted program are established in the Florida Administrative Code, which lays out two methods: (1) general eligibility requirements and (2) alternative eligibility requirements for students from low socio-economic backgrounds or with limited English proficiency who are underrepresented in gifted programs. 7 Under the general eligibility requirements, a student must achieve a score of two standard deviations above the mean or higher on an individually administered intellectual evaluation to qualify for gifted services (this generally equates to a determination that the student has an IQ of 130 or higher). Under the alternative requirements, students are not required to demonstrate an IQ of two standard deviations above the mean if they meet criteria specified in an approved school district plan for increasing the gifted program participation of underrepresented groups. 8
School districts use four steps to identify which students are eligible for gifted services. Florida statutes provide that school districts must identify eligible gifted students; determine their educational needs; and provide them an appropriate program of special instruction, facilities, and services. Districts generally follow a four-step process to identify gifted students. These steps are: (1) identifying students to be screened for eligibility; (2) screening identified students and recommending those who meet criteria for further assessment; (3) individually evaluating recommended students by a school or outside psychologist; and (4) district reviews of psychologists’ evaluations and related materials to make final determinations of student eligibility to receive gifted services.
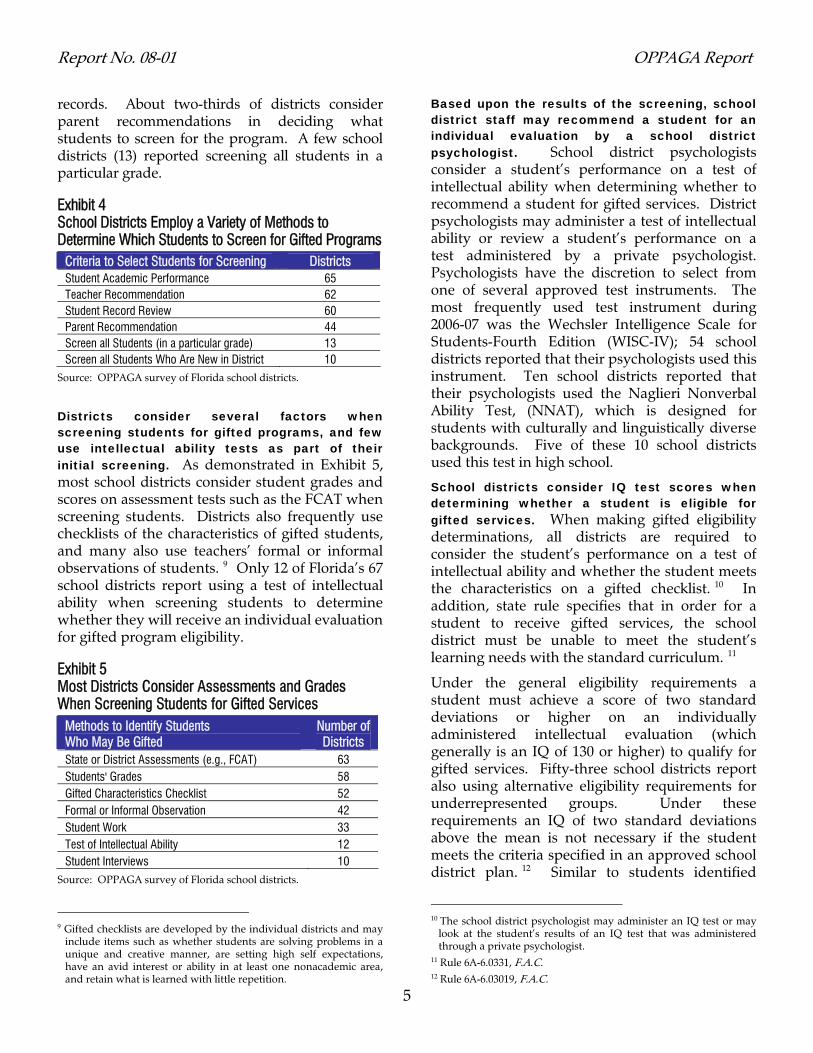
School districts use a variety of mechanisms to determine which students should be screened for the gifted program and most do not universally screen all students in a particular grade. As summarized in Exhibit 4, most districts select the students they screen for gifted program eligibility based upon student academic performance, teacher recommendations, and reviews of student
7 Rule 6A-6.03019, F.A.C. 8 Ibid.
Report No. 08-01 OPPAGA Report
5
records. About two-thirds of districts consider parent recommendations in deciding what students to screen for the program. A few school districts (13) reported screening all students in a particular grade.
Exhibit 4 School Districts Employ a Variety of Methods to Determine Which Students to Screen for Gifted Programs
Criteria to Select Students for Screening Districts Student Academic Performance 65 Teacher Recommendation 62 Student Record Review 60 Parent Recommendation 44 Screen all Students (in a particular grade) 13 Screen all Students Who Are New in District 10
Source: OPPAGA survey of Florida school districts.
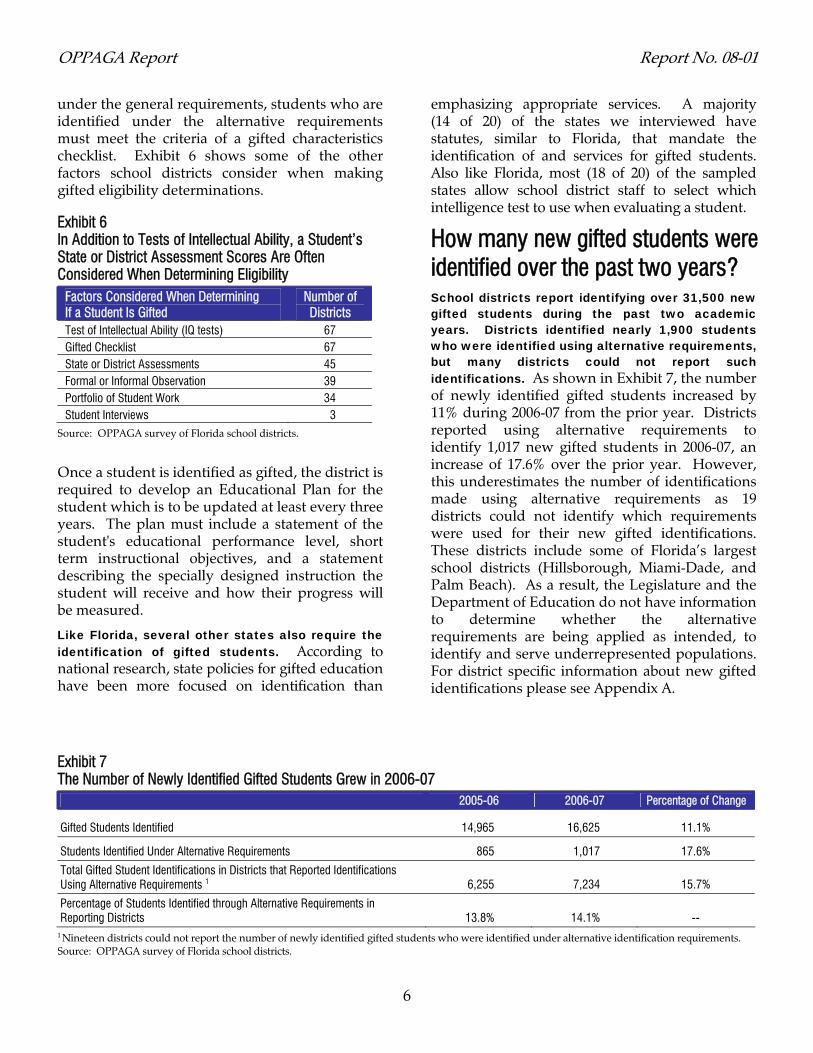
Districts consider several factors when screening students for gifted programs, and few use intellectual ability tests as part of their initial screening. As demonstrated in Exhibit 5, most school districts consider student grades and scores on assessment tests such as the FCAT when screening students. Districts also frequently use checklists of the characteristics of gifted students, and many also use teachers’ formal or informal observations of students. 9 Only 12 of Florida’s 67 school districts report using a test of intellectual ability when screening students to determine whether they will receive an individual evaluation for gifted program eligibility.
Exhibit 5 Most Districts Consider Assessments and Grades When Screening Students for Gifted Services
Methods to Identify Students Who May Be Gifted
Number of Districts
State or District Assessments (e.g., FCAT) 63 Students' Grades 58 Gifted Characteristics Checklist 52 Formal or Informal Observation 42 Student Work 33 Test of Intellectual Ability 12 Student Interviews 10
Source: OPPAGA survey of Florida school districts.
9 Gifted checklists are developed by the individual districts and may
include items such as whether students are solving problems in a unique and creative manner, are setting high self expectations, have an avid interest or ability in at least one nonacademic area, and retain what is learned with little repetition.
Based upon the results of the screening, school district staff may recommend a student for an individual evaluation by a school district psychologist. School district psychologists consider a student’s performance on a test of intellectual ability when determining whether to recommend a student for gifted services. District psychologists may administer a test of intellectual ability or review a student’s performance on a test administered by a private psychologist. Psychologists have the discretion to select from one of several approved test instruments. The most frequently used test instrument during 2006-07 was the Wechsler Intelligence Scale for Students-Fourth Edition (WISC-IV); 54 school districts reported that their psychologists used this instrument. Ten school districts reported that their psychologists used the Naglieri Nonverbal Ability Test, (NNAT), which is designed for students with culturally and linguistically diverse backgrounds. Five of these 10 school districts used this test in high school.
School districts consider IQ test scores when determining whether a student is eligible for gifted services. When making gifted eligibility determinations, all districts are required to consider the student’s performance on a test of intellectual ability and whether the student meets the characteristics on a gifted checklist. 10 In addition, state rule specifies that in order for a student to receive gifted services, the school district must be unable to meet the student’s learning needs with the standard curriculum. 11
Under the general eligibility requirements a student must achieve a score of two standard deviations or higher on an individually administered intellectual evaluation (which generally is an IQ of 130 or higher) to qualify for gifted services. Fifty-three school districts report also using alternative eligibility requirements for underrepresented groups. Under these requirements an IQ of two standard deviations above the mean is not necessary if the student meets the criteria specified in an approved school district plan. 12 Similar to students identified
10 The school district psychologist may administer an IQ test or may
look at the student’s results of an IQ test that was administered through a private psychologist.
11 Rule 6A-6.0331, F.A.C. 12 Rule 6A-6.03019, F.A.C.
OPPAGA Report Report No. 08-01
6
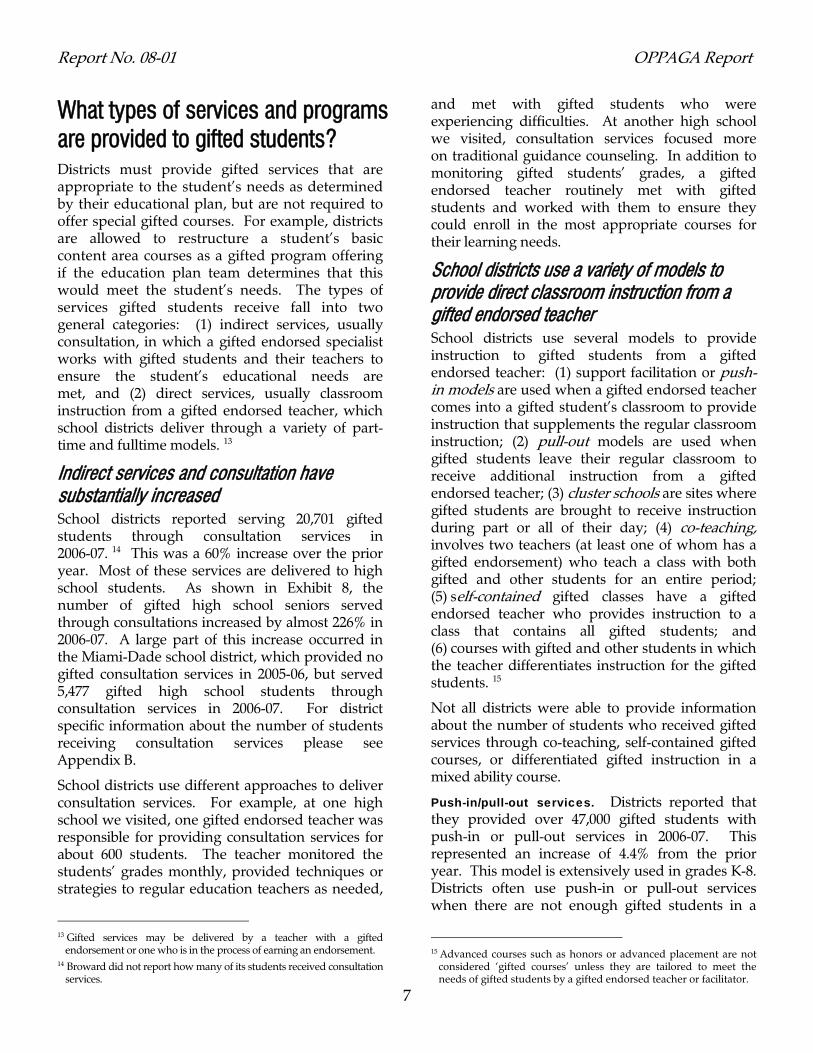
under the general requirements, students who are identified under the alternative requirements must meet the criteria of a gifted characteristics checklist. Exhibit 6 shows some of the other factors school districts consider when making gifted eligibility determinations.
Exhibit 6 In Addition to Tests of Intellectual Ability, a Student’s State or District Assessment Scores Are Often Considered When Determining Eligibility
Factors Considered When Determining If a Student Is Gifted
Number of Districts
Test of Intellectual Ability (IQ tests) 67 Gifted Checklist 67 State or District Assessments 45 Formal or Informal Observation 39 Portfolio of Student Work 34 Student Interviews 3
Source: OPPAGA survey of Florida school districts.
Once a student is identified as gifted, the district is required to develop an Educational Plan for the student which is to be updated at least every three years. The plan must include a statement of the student's educational performance level, short term instructional objectives, and a statement describing the specially designed instruction the student will receive and how their progress will be measured.
Like Florida, several other states also require the identification of gifted students. According to national research, state policies for gifted education have been more focused on identification than
emphasizing appropriate services. A majority (14 of 20) of the states we interviewed have statutes, similar to Florida, that mandate the identification of and services for gifted students. Also like Florida, most (18 of 20) of the sampled states allow school district staff to select which intelligence test to use when evaluating a student.
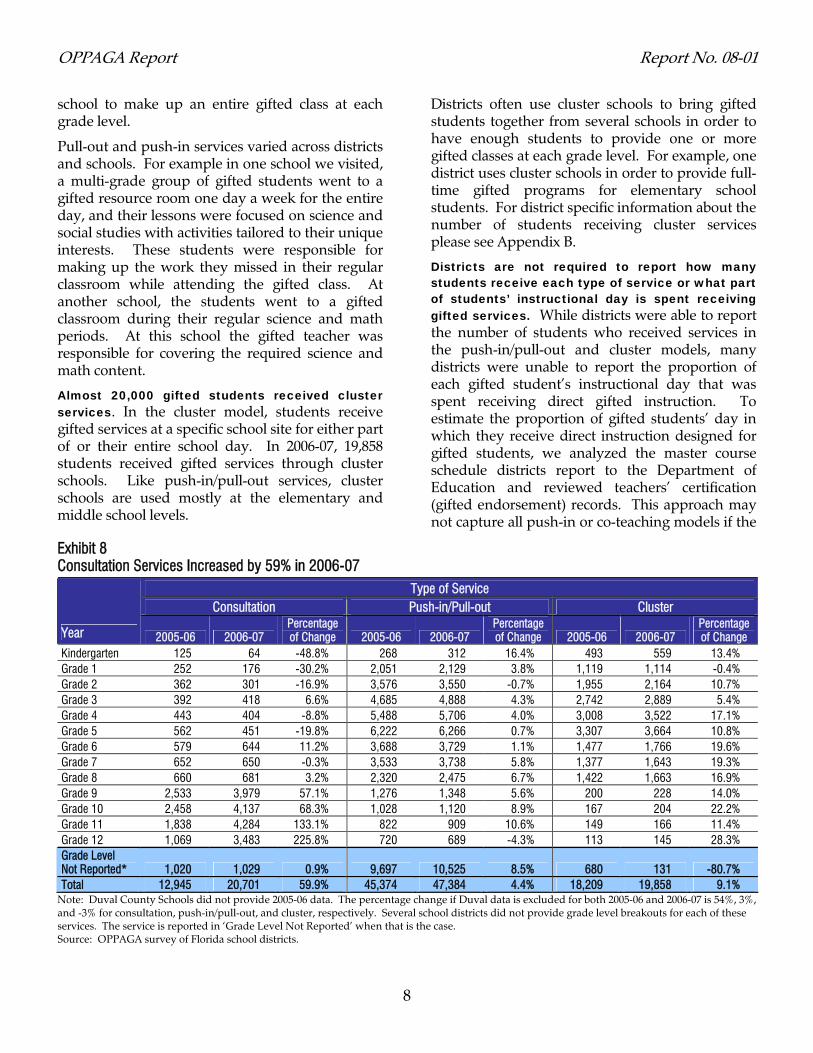
How many new gifted students were identified over the past two years? School districts report identifying over 31,500 new gifted students during the past two academic years. Districts identified nearly 1,900 students who were identified using alternative requirements, but many districts could not report such identifications. As shown in Exhibit 7, the number of newly identified gifted students increased by 11% during 2006-07 from the prior year. Districts reported using alternative requirements to identify 1,017 new gifted students in 2006-07, an increase of 17.6% over the prior year. However, this underestimates the number of identifications made using alternative requirements as 19 districts could not identify which requirements were used for their new gifted identifications. These districts include some of Florida’s largest school districts (Hillsborough, Miami-Dade, and Palm Beach). As a result, the Legislature and the Department of Education do not have information to determine whether the alternative requirements are being applied as intended, to identify and serve underrepresented populations. For district specific information about new gifted identifications please see Appendix A.
Exhibit 7 The Number of Newly Identified Gifted Students Grew in 2006-07 2005-06 2006-07 Percentage of Change
Gifted Students Identified 14,965 16,625 11.1%
Students Identified Under Alternative Requirements 865 1,017 17.6%
Total Gifted Student Identifications in Districts that Reported Identifications Using Alternative Requirements 1 6,255 7,234 15.7%
Percentage of Students Identified through Alternative Requirements in Reporting Districts 13.8% 14.1% --
1 Nineteen districts could not report the number of newly identified gifted students who were identified under alternative identification requirements. Source: OPPAGA survey of Florida school districts.
Report No. 08-01 OPPAGA Report
7
What types of services and programs are provided to gifted students? Districts must provide gifted services that are appropriate to the student’s needs as determined by their educational plan, but are not required to offer special gifted courses. For example, districts are allowed to restructure a student’s basic content area courses as a gifted program offering if the education plan team determines that this would meet the student’s needs. The types of services gifted students receive fall into two general categories: (1) indirect services, usually consultation, in which a gifted endorsed specialist works with gifted students and their teachers to ensure the student’s educational needs are met, and (2) direct services, usually classroom instruction from a gifted endorsed teacher, which school districts deliver through a variety of part-time and fulltime models. 13
Indirect services and consultation have substantially increased School districts reported serving 20,701 gifted students through consultation services in 2006-07. 14 This was a 60% increase over the prior year. Most of these services are delivered to high school students. As shown in Exhibit 8, the number of gifted high school seniors served through consultations increased by almost 226% in 2006-07. A large part of this increase occurred in the Miami-Dade school district, which provided no gifted consultation services in 2005-06, but served 5,477 gifted high school students through consultation services in 2006-07. For district specific information about the number of students receiving consultation services please see Appendix B.
School districts use different approaches to deliver consultation services. For example, at one high school we visited, one gifted endorsed teacher was responsible for providing consultation services for about 600 students. The teacher monitored the students’ grades monthly, provided techniques or strategies to regular education teachers as needed,
13 Gifted services may be delivered by a teacher with a gifted
endorsement or one who is in the process of earning an endorsement. 14 Broward did not report how many of its students received consultation
services.
and met with gifted students who were experiencing difficulties. At another high school we visited, consultation services focused more on traditional guidance counseling. In addition to monitoring gifted students’ grades, a gifted endorsed teacher routinely met with gifted students and worked with them to ensure they could enroll in the most appropriate courses for their learning needs.
School districts use a variety of models to provide direct classroom instruction from a gifted endorsed teacher School districts use several models to provide instruction to gifted students from a gifted endorsed teacher: (1) support facilitation or push-in models are used when a gifted endorsed teacher comes into a gifted student’s classroom to provide instruction that supplements the regular classroom instruction; (2) pull-out models are used when gifted students leave their regular classroom to receive additional instruction from a gifted endorsed teacher; (3) cluster schools are sites where gifted students are brought to receive instruction during part or all of their day; (4) co-teaching, involves two teachers (at least one of whom has a gifted endorsement) who teach a class with both gifted and other students for an entire period; (5) self-contained gifted classes have a gifted endorsed teacher who provides instruction to a class that contains all gifted students; and (6) courses with gifted and other students in which the teacher differentiates instruction for the gifted students. 15
Not all districts were able to provide information about the number of students who received gifted services through co-teaching, self-contained gifted courses, or differentiated gifted instruction in a mixed ability course.
Push-in/pull-out services. Districts reported that they provided over 47,000 gifted students with push-in or pull-out services in 2006-07. This represented an increase of 4.4% from the prior year. This model is extensively used in grades K-8. Districts often use push-in or pull-out services when there are not enough gifted students in a
15 Advanced courses such as honors or advanced placement are not
considered ‘gifted courses’ unless they are tailored to meet the needs of gifted students by a gifted endorsed teacher or facilitator.
OPPAGA Report Report No. 08-01
8
school to make up an entire gifted class at each grade level.
Pull-out and push-in services varied across districts and schools. For example in one school we visited, a multi-grade group of gifted students went to a gifted resource room one day a week for the entire day, and their lessons were focused on science and social studies with activities tailored to their unique interests. These students were responsible for making up the work they missed in their regular classroom while attending the gifted class. At another school, the students went to a gifted classroom during their regular science and math periods. At this school the gifted teacher was responsible for covering the required science and math content.
Almost 20,000 gifted students received cluster services. In the cluster model, students receive gifted services at a specific school site for either part of or their entire school day. In 2006-07, 19,858 students received gifted services through cluster schools. Like push-in/pull-out services, cluster schools are used mostly at the elementary and middle school levels.
Districts often use cluster schools to bring gifted students together from several schools in order to have enough students to provide one or more gifted classes at each grade level. For example, one district uses cluster schools in order to provide full-time gifted programs for elementary school students. For district specific information about the number of students receiving cluster services please see Appendix B.
Districts are not required to report how many students receive each type of service or what part of students’ instructional day is spent receiving gifted services. While districts were able to report the number of students who received services in the push-in/pull-out and cluster models, many districts were unable to report the proportion of each gifted student’s instructional day that was spent receiving direct gifted instruction. To estimate the proportion of gifted students’ day in which they receive direct instruction designed for gifted students, we analyzed the master course schedule districts report to the Department of Education and reviewed teachers’ certification (gifted endorsement) records. This approach may not capture all push-in or co-teaching models if the
Exhibit 8 Consultation Services Increased by 59% in 2006-07
Type of Service Consultation Push-in/Pull-out Cluster
Year 2005-06 2006-07 Percentage of Change 2005-06 2006-07
Percentage of Change 2005-06 2006-07
Percentage of Change
Kindergarten 125 64 -48.8% 268 312 16.4% 493 559 13.4% Grade 1 252 176 -30.2% 2,051 2,129 3.8% 1,119 1,114 -0.4% Grade 2 362 301 -16.9% 3,576 3,550 -0.7% 1,955 2,164 10.7% Grade 3 392 418 6.6% 4,685 4,888 4.3% 2,742 2,889 5.4% Grade 4 443 404 -8.8% 5,488 5,706 4.0% 3,008 3,522 17.1% Grade 5 562 451 -19.8% 6,222 6,266 0.7% 3,307 3,664 10.8% Grade 6 579 644 11.2% 3,688 3,729 1.1% 1,477 1,766 19.6% Grade 7 652 650 -0.3% 3,533 3,738 5.8% 1,377 1,643 19.3% Grade 8 660 681 3.2% 2,320 2,475 6.7% 1,422 1,663 16.9% Grade 9 2,533 3,979 57.1% 1,276 1,348 5.6% 200 228 14.0% Grade 10 2,458 4,137 68.3% 1,028 1,120 8.9% 167 204 22.2% Grade 11 1,838 4,284 133.1% 822 909 10.6% 149 166 11.4% Grade 12 1,069 3,483 225.8% 720 689 -4.3% 113 145 28.3% Grade Level Not Reported* 1,020 1,029 0.9% 9,697 10,525 8.5% 680 131 -80.7% Total 12,945 20,701 59.9% 45,374 47,384 4.4% 18,209 19,858 9.1%
Note: Duval County Schools did not provide 2005-06 data. The percentage change if Duval data is excluded for both 2005-06 and 2006-07 is 54%, 3%, and -3% for consultation, push-in/pull-out, and cluster, respectively. Several school districts did not provide grade level breakouts for each of these services. The service is reported in ‘Grade Level Not Reported’ when that is the case. Source: OPPAGA survey of Florida school districts.
Report No. 08-01 OPPAGA Report
9
district did not report the gifted endorsed teacher as the teacher of record. In addition, teachers who are in the process of earning their gifted endorsement may provide gifted instruction, but they are not recorded in the department’s data as gifted endorsed.
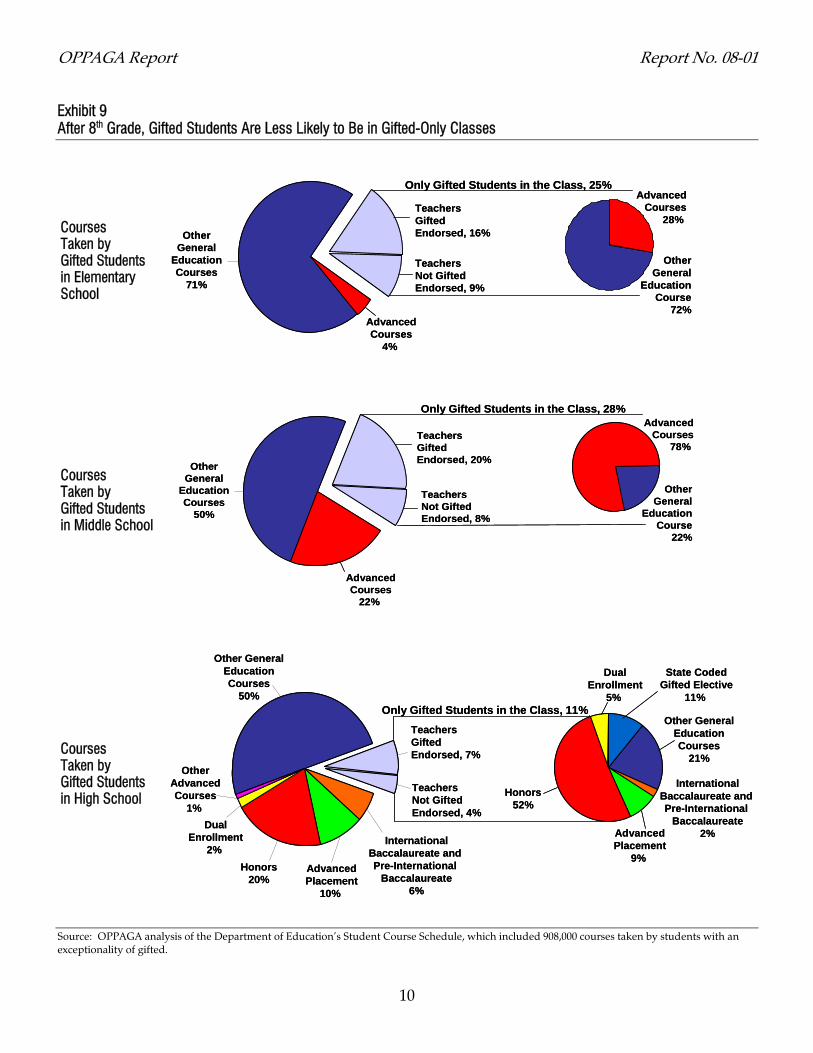
Gifted students take fewer self-contained gifted courses during high school than in elementary and middle school. As shown in Exhibit 9, self-contained gifted courses are more common in middle and elementary schools than in high schools. Slightly over a quarter (28%) of the courses taken by Florida’s gifted middle school students are classes serving only gifted students. In elementary schools, 25% of the courses taken by gifted students are in self-contained classrooms; however, in high schools this percentage is only 11%. Exhibit 9 also shows that the majority of the teachers of these classes had a gifted endorsed teaching certificate. However, teachers who are in the process of earning their endorsement are also permitted to teach gifted courses.
For elementary students, 12% of their courses are with a gifted endorsed teacher in a mixed ability classroom. For middle and high school students these percentages are 10% and 6%, respectively. We could not determine if instruction in these courses is differentiated for gifted students, as this would require reviewing each class’ lesson plan.
Many of the self-contained gifted courses taken by middle and high school students are advanced courses. As shown in Exhibit 9, most (78%) of the self-contained gifted courses taken by gifted middle school students and 79% of those taken by high school students were advanced courses. These included honors, advanced placement, and dual enrollment courses in high school. For middle and elementary students, these courses included advanced academics as well as other advanced courses such as Middle/Junior High Advanced Comprehensive Science 3.
Gifted student’s enrollment in advanced courses provided as self-contained gifted courses with a gifted endorsed teacher differs by district and school. Schools in 30 districts provide advanced middle school self-contained gifted courses with
gifted endorsed teachers. However in high school, only 16 districts provide advanced self-contained gifted courses with gifted endorsed teachers. Most of these courses (83%) are honors courses. Many of these courses (72%) are taken by students in either Miami-Dade or Sarasota. Some school districts we visited, including Miami-Dade, provided advanced placement and honors courses that were restricted to gifted students because they believed that these students need separate courses to meet their needs. However, other schools we visited believed that gifted students’ needs were met through regular advanced placement and honors courses and they did not provide special gifted only versions of these courses.
Most gifted courses that high school students take are not listed as a gifted course in the state course code directory. The state course code directory does not accurately reflect the range of gifted courses offered to high school students. The directory currently lists only four high school course codes for gifted students, which account for only 11% of the gifted courses that high school students take. This occurs because districts may designate specific sections of courses not designated in the course code directory as a gifted course. This flexibility allows districts to offer the gifted courses that they believe their gifted students need. For example, a district could decide to offer English Honors I or American History as a gifted course, enroll only gifted students in that course and use a gifted endorsed teacher to teach the class. These types of courses are not reflected in the state course code directly but account for most of the gifted courses school districts offer to gifted students at the high school level.
Districts and schools use different means to meet gifted students’ needs. While districts and schools we visited varied greatly in the way they served gifted students, they consistently believed they were meeting the needs of their gifted students. Generally, the gifted students and parents who participated in our focus groups also believed that the students’ needs were being met.
OPPAGA Report Report No. 08-01
Exhibit 9 After 8th Grade, Gifted Students Are Less Likely to Be in Gifted-Only Classes
Courses Taken by Gifted Students in Elementary School
AdvancedCourses
4%
Only Gifted Students in the Class, 25%Advanced
Courses28%
OtherGeneral
EducationCourse
72%
TeachersNot GiftedEndorsed, 9%
OtherGeneral
EducationCourses
71%
TeachersGiftedEndorsed, 16%
AdvancedCourses
4%
Only Gifted Students in the Class, 25%Advanced
Courses28%
OtherGeneral
EducationCourse
72%
TeachersNot GiftedEndorsed, 9%
OtherGeneral
EducationCourses
71%
TeachersGiftedEndorsed, 16%
Courses Taken by Gifted Students in Middle School
AdvancedCourses
78%
OtherGeneral
EducationCourse
22%
AdvancedCourses
22%
TeachersNot GiftedEndorsed, 8%
OtherGeneral
EducationCourses
50%
TeachersGiftedEndorsed, 20%
Only Gifted Students in the Class, 28%Advanced
Courses78%
OtherGeneral
EducationCourse
22%
AdvancedCourses
22%
TeachersNot GiftedEndorsed, 8%
OtherGeneral
EducationCourses
50%
TeachersGiftedEndorsed, 20%
Only Gifted Students in the Class, 28%
Courses Taken by Gifted Students in High School
InternationalBaccalaureate and Pre-International
Baccalaureate6%
DualEnrollment
2%
OtherAdvancedCourses
1%
Honors20%
AdvancedPlacement
10%
Other GeneralEducationCourses
50%
TeachersNot Gifted Endorsed, 4%
TeachersGifted Endorsed, 7%
InternationalBaccalaureate and Pre-International
Baccalaureate2%
DualEnrollment
5%
Honors52%
AdvancedPlacement
9%
Other GeneralEducationCourses
21%
Only Gifted Students in the Class, 11%
State CodedGifted Elective
11%
InternationalBaccalaureate and Pre-International
Baccalaureate6%
DualEnrollment
2%
OtherAdvancedCourses
1%
Honors20%
AdvancedPlacement
10%
Other GeneralEducationCourses
50%
TeachersNot Gifted Endorsed, 4%
TeachersGifted Endorsed, 7%
InternationalBaccalaureate and Pre-International
Baccalaureate2%
DualEnrollment
5%
Honors52%
AdvancedPlacement
9%
Other GeneralEducationCourses
21%
Only Gifted Students in the Class, 11%
State CodedGifted Elective
11%
Source: OPPAGA analysis of the Department of Education’s Student Course Schedule, which included 908,000 courses taken by students with an exceptionality of gifted.
10
Report No. 08-01 OPPAGA Report
11
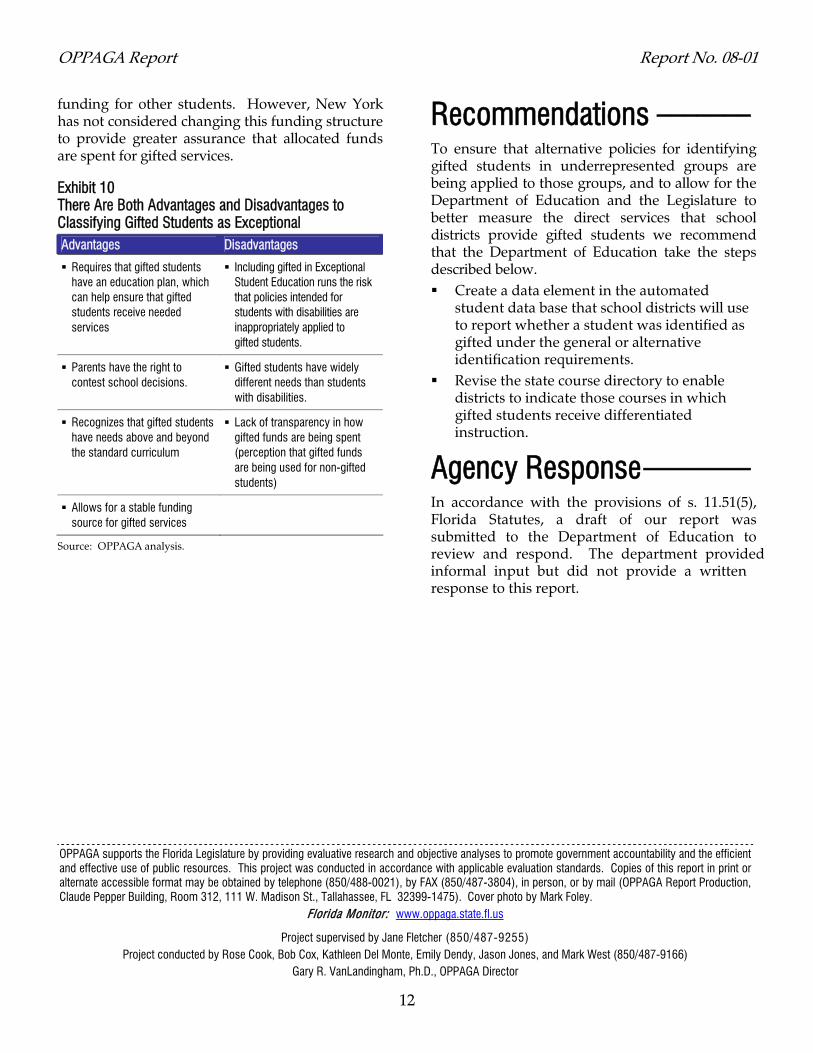
What are the advantages and disadvantages of classifying gifted students as exceptional students? An issue in the gifted program has been whether it should continue to be part of the Exceptional Student Education (ESE) program or should be established as a separate stand-alone program. We identified advantages and disadvantages of classifying gifted students as exceptional students by reviewing available research and holding focus group discussions with parents, gifted students, teachers, and district administrators. Overall, this issue centers on the statutory protections that apply to Exceptional Student Education and the funding of gifted services through the guaranteed allocation. Exhibit 10 summarizes the advantages and disadvantages of classifying gifted students as exceptional students.
Advantages. Our research identified four primary advantages of serving gifted children as part of the ESE program. First, parents in our focus groups indicated that the program’s current placement was beneficial because federal and state laws required that gifted students, like all ESE students, must receive education plans. These plans can help ensure that gifted students receive educational services that meet their needs. Second, parents noted that they have the right to contest school decisions made about their gifted children’s education programs; this right is ensured for all ESE students. However, some parents told us they only fully understood these rights after their child had been identified as gifted for several years.
Third, teachers in our focus groups noted that including gifted programs in the ESE program recognizes that these students have different needs. The teachers indicated that they focus on critical thinking skills and creative projects when teaching gifted students, compared to ensuring that all students learned basic material when teaching in standard classrooms. Finally, some school district officials, as well as parents and teachers, indicated that serving gifted students in the ESE program provides a stable funding source because there are federal and state mandates to fund the ESE program.
Disadvantages. We identified three primary disadvantages to categorizing gifted students as exceptional. First, because gifted is part of Exceptional Student Education, there is a risk that any time federal or state policies for exceptional students are changed, such changes, meant primarily for students with disabilities, could also be applied to gifted students, creating additional paperwork for school districts. For example, the Florida Department of Education includes the gifted program as part of its focused monitoring activities of districts’ exceptional student education services. However, some district personnel have told us that this requires unnecessary additional work for them and it is not clear to them why gifted should be included in these monitoring efforts, which are primarily intended to ensure districts are in compliance with federal and state laws governing students with disabilities.
Second, some parents and teachers assert that gifted students should not be included with students with disabilities because of their widely differing needs. While gifted students generally need enrichment services above and beyond the standard curriculum, students with disabilities are more likely to require accommodations or modifications to access the regular curriculum.
Third, because school districts report the cost of all basic exceptional student education programs in one sum and the gifted education program costs are not separately reported, there is a lack of transparency about how much money school districts spend for gifted services. Several parents told us that it was unclear how much funding was available for their child’s gifted services and how much was being spent on those services.
In part due to these concerns, at least one state, Tennessee, recently considered moving its gifted programs out of the ESE program. However, the state decided not to take this step because parents of gifted students were concerned that this would remove the mandate for funding gifted education and that funding for gifted services would be more likely to be cut once they were no longer part of the umbrella of special education. An official of the state of New York reported concerns with a lack of transparency because the state, like Florida, appropriated gifted program funds together with
OPPAGA Report Report No. 08-01
Recommendations _______ funding for other students. However, New York has not considered changing this funding structure to provide greater assurance that allocated funds are spent for gifted services. To ensure that alternative policies for identifying
gifted students in underrepresented groups are being applied to those groups, and to allow for the Department of Education and the Legislature to better measure the direct services that school districts provide gifted students we recommend that the Department of Education take the steps described below.
Exhibit 10 There Are Both Advantages and Disadvantages to Classifying Gifted Students as Exceptional Advantages Disadvantages
Requires that gifted students have an education plan, which can help ensure that gifted students receive needed services
Including gifted in Exceptional Student Education runs the risk that policies intended for students with disabilities are inappropriately applied to gifted students.
Parents have the right to contest school decisions.
Gifted students have widely different needs than students with disabilities.
Recognizes that gifted students have needs above and beyond the standard curriculum
Lack of transparency in how gifted funds are being spent (perception that gifted funds are being used for non-gifted students)
Allows for a stable funding source for gifted services
Create a data element in the automated student data base that school districts will use to report whether a student was identified as gifted under the general or alternative identification requirements.
Revise the state course directory to enable districts to indicate those courses in which gifted students receive differentiated instruction.
Agency Response________ In accordance with the provisions of s. 11.51(5), Florida Statutes, a draft of our report was submitted to the Department of Education to review and respond. The department providedinformal input but did not provide a written response to this report.
Source: OPPAGA analysis.
12
OPPAGA supports the Florida Legislature by providing evaluative research and objective analyses to promote government accountability and the efficient and effective use of public resources. This project was conducted in accordance with applicable evaluation standards. Copies of this report in print or alternate accessible format may be obtained by telephone (850/488-0021), by FAX (850/487-3804), in person, or by mail (OPPAGA Report Production, Claude Pepper Building, Room 312, 111 W. Madison St., Tallahassee, FL 32399-1475). Cover photo by Mark Foley.
Florida Monitor: www.oppaga.state.fl.us
Project supervised by Jane Fletcher (850/487-9255) Project conducted by Rose Cook, Bob Cox, Kathleen Del Monte, Emily Dendy, Jason Jones, and Mark West (850/487-9166)
Gary R. VanLandingham, Ph.D., OPPAGA Director
Report No. 08-01 OPPAGA Report
13
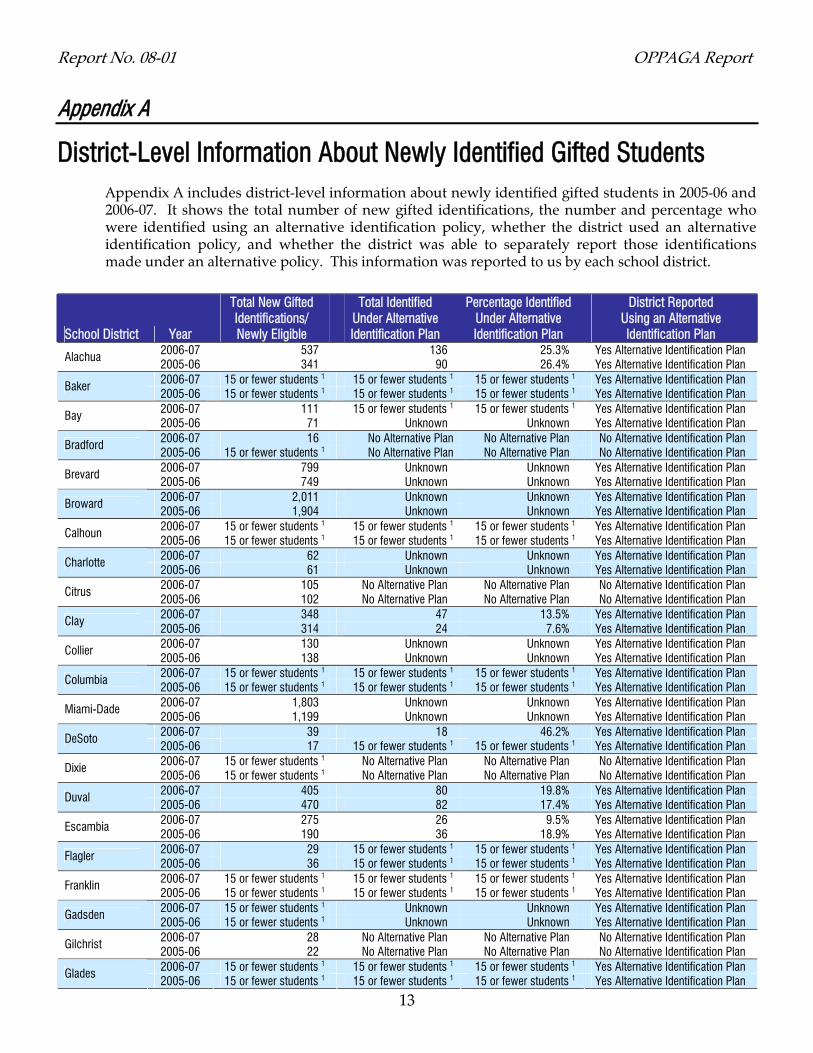
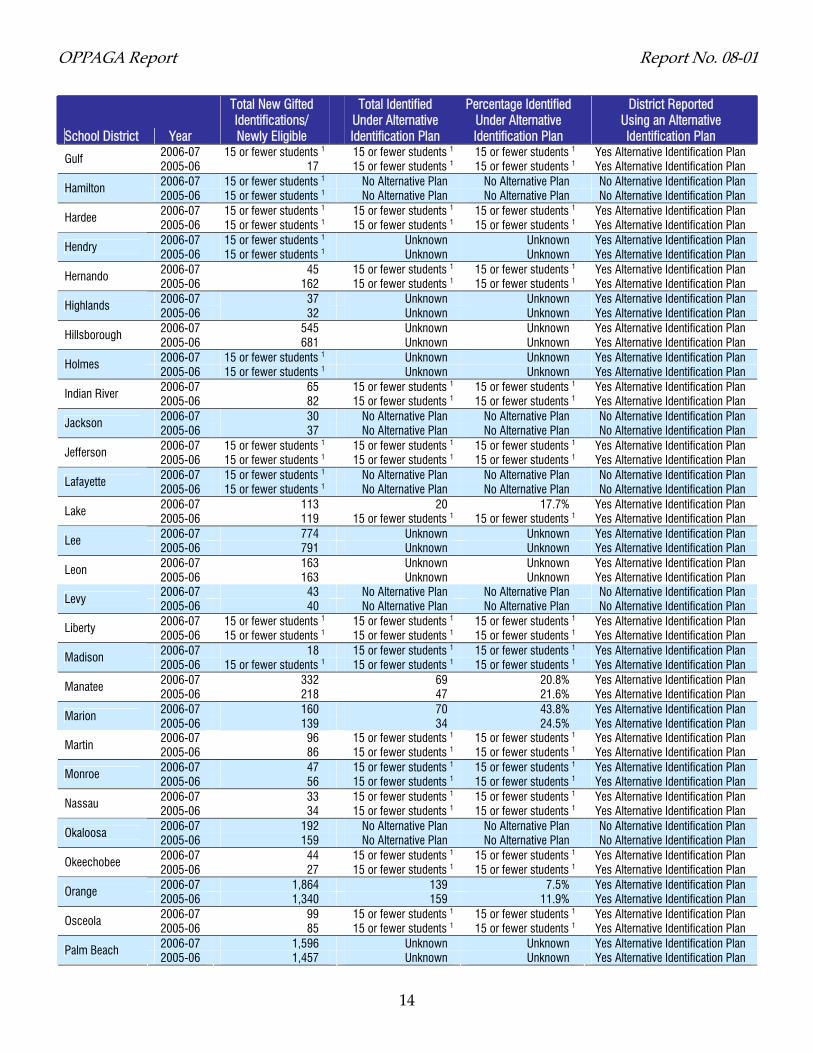
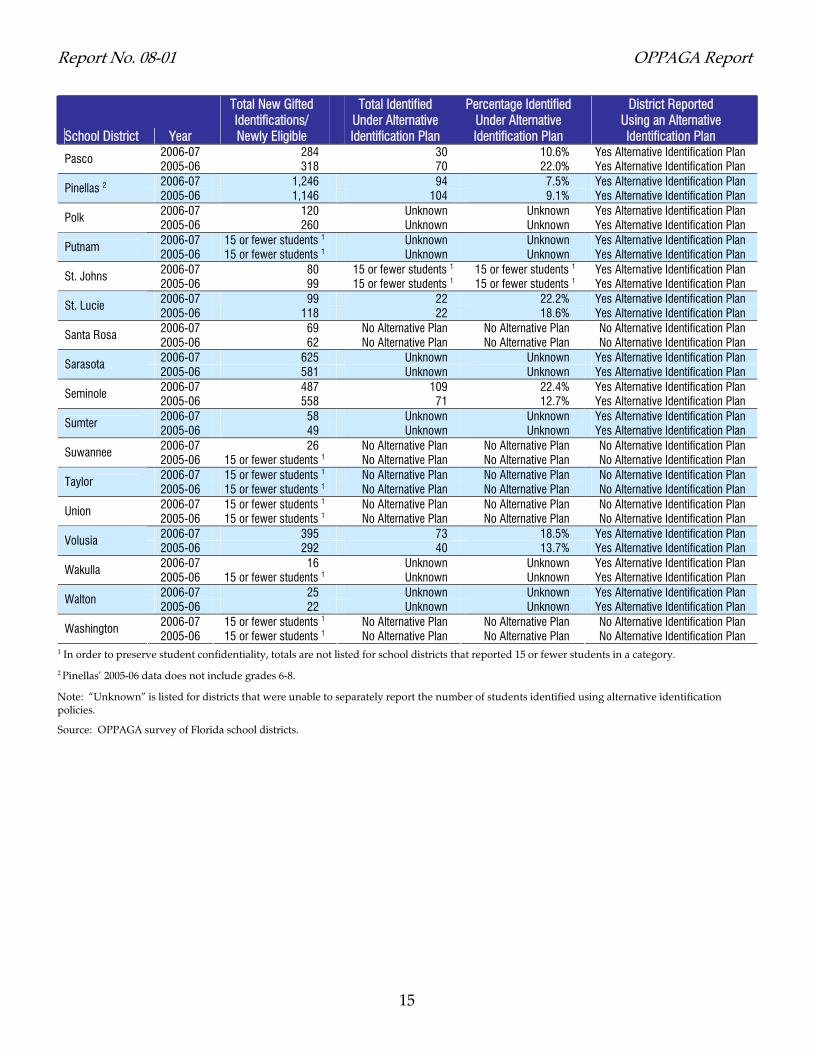
Appendix A
District-Level Information About Newly Identified Gifted Students Appendix A includes district-level information about newly identified gifted students in 2005-06 and 2006-07. It shows the total number of new gifted identifications, the number and percentage who were identified using an alternative identification policy, whether the district used an alternative identification policy, and whether the district was able to separately report those identifications made under an alternative policy. This information was reported to us by each school district.
School District Year
Total New Gifted Identifications/ Newly Eligible
Total Identified Under Alternative Identification Plan
Percentage Identified Under Alternative Identification Plan
District Reported Using an Alternative Identification Plan
2006-07 537 136 25.3% Yes Alternative Identification Plan Alachua 2005-06 341 90 26.4% Yes Alternative Identification Plan 2006-07 15 or fewer students 1 15 or fewer students 1 15 or fewer students 1 Yes Alternative Identification Plan Baker 2005-06 15 or fewer students 1 15 or fewer students 1 15 or fewer students 1 Yes Alternative Identification Plan 2006-07 111 15 or fewer students 1 15 or fewer students 1 Yes Alternative Identification Plan Bay 2005-06 71 Unknown Unknown Yes Alternative Identification Plan 2006-07 16 No Alternative Plan No Alternative Plan No Alternative Identification Plan Bradford 2005-06 15 or fewer students 1 No Alternative Plan No Alternative Plan No Alternative Identification Plan 2006-07 799 Unknown Unknown Yes Alternative Identification Plan Brevard 2005-06 749 Unknown Unknown Yes Alternative Identification Plan 2006-07 2,011 Unknown Unknown Yes Alternative Identification Plan Broward 2005-06 1,904 Unknown Unknown Yes Alternative Identification Plan 2006-07 15 or fewer students 1 15 or fewer students 1 15 or fewer students 1 Yes Alternative Identification Plan Calhoun 2005-06 15 or fewer students 1 15 or fewer students 1 15 or fewer students 1 Yes Alternative Identification Plan 2006-07 62 Unknown Unknown Yes Alternative Identification Plan Charlotte 2005-06 61 Unknown Unknown Yes Alternative Identification Plan 2006-07 105 No Alternative Plan No Alternative Plan No Alternative Identification Plan Citrus 2005-06 102 No Alternative Plan No Alternative Plan No Alternative Identification Plan 2006-07 348 47 13.5% Yes Alternative Identification Plan Clay 2005-06 314 24 7.6% Yes Alternative Identification Plan 2006-07 130 Unknown Unknown Yes Alternative Identification Plan Collier 2005-06 138 Unknown Unknown Yes Alternative Identification Plan 2006-07 15 or fewer students 1 15 or fewer students 1 15 or fewer students 1 Yes Alternative Identification Plan Columbia 2005-06 15 or fewer students 1 15 or fewer students 1 15 or fewer students 1 Yes Alternative Identification Plan 2006-07 1,803 Unknown Unknown Yes Alternative Identification Plan Miami-Dade 2005-06 1,199 Unknown Unknown Yes Alternative Identification Plan 2006-07 39 18 46.2% Yes Alternative Identification Plan DeSoto 2005-06 17 15 or fewer students 1 15 or fewer students 1 Yes Alternative Identification Plan 2006-07 15 or fewer students 1 No Alternative Plan No Alternative Plan No Alternative Identification Plan Dixie 2005-06 15 or fewer students 1 No Alternative Plan No Alternative Plan No Alternative Identification Plan 2006-07 405 80 19.8% Yes Alternative Identification Plan Duval 2005-06 470 82 17.4% Yes Alternative Identification Plan 2006-07 275 26 9.5% Yes Alternative Identification Plan Escambia 2005-06 190 36 18.9% Yes Alternative Identification Plan 2006-07 29 15 or fewer students 1 15 or fewer students 1 Yes Alternative Identification Plan Flagler 2005-06 36 15 or fewer students 1 15 or fewer students 1 Yes Alternative Identification Plan 2006-07 15 or fewer students 1 15 or fewer students 1 15 or fewer students 1 Yes Alternative Identification Plan Franklin 2005-06 15 or fewer students 1 15 or fewer students 1 15 or fewer students 1 Yes Alternative Identification Plan 2006-07 15 or fewer students 1 Unknown Unknown Yes Alternative Identification Plan Gadsden 2005-06 15 or fewer students 1 Unknown Unknown Yes Alternative Identification Plan 2006-07 28 No Alternative Plan No Alternative Plan No Alternative Identification Plan Gilchrist 2005-06 22 No Alternative Plan No Alternative Plan No Alternative Identification Plan 2006-07 15 or fewer students 1 15 or fewer students 1 15 or fewer students 1 Yes Alternative Identification Plan Glades 2005-06 15 or fewer students 1 15 or fewer students 1 15 or fewer students 1 Yes Alternative Identification Plan
OPPAGA Report Report No. 08-01
14
School District Year
Total New Gifted Identifications/ Newly Eligible
Total Identified Under Alternative Identification Plan
Percentage Identified Under Alternative Identification Plan
District Reported Using an Alternative Identification Plan
2006-07 15 or fewer students 1 15 or fewer students 1 15 or fewer students 1 Yes Alternative Identification Plan Gulf 2005-06 17 15 or fewer students 1 15 or fewer students 1 Yes Alternative Identification Plan 2006-07 15 or fewer students 1 No Alternative Plan No Alternative Plan No Alternative Identification Plan Hamilton 2005-06 15 or fewer students 1 No Alternative Plan No Alternative Plan No Alternative Identification Plan 2006-07 15 or fewer students 1 15 or fewer students 1 15 or fewer students 1 Yes Alternative Identification Plan Hardee 2005-06 15 or fewer students 1 15 or fewer students 1 15 or fewer students 1 Yes Alternative Identification Plan 2006-07 15 or fewer students 1 Unknown Unknown Yes Alternative Identification Plan Hendry 2005-06 15 or fewer students 1 Unknown Unknown Yes Alternative Identification Plan 2006-07 45 15 or fewer students 1 15 or fewer students 1 Yes Alternative Identification Plan Hernando 2005-06 162 15 or fewer students 1 15 or fewer students 1 Yes Alternative Identification Plan 2006-07 37 Unknown Unknown Yes Alternative Identification Plan Highlands 2005-06 32 Unknown Unknown Yes Alternative Identification Plan 2006-07 545 Unknown Unknown Yes Alternative Identification Plan Hillsborough 2005-06 681 Unknown Unknown Yes Alternative Identification Plan 2006-07 15 or fewer students 1 Unknown Unknown Yes Alternative Identification Plan Holmes 2005-06 15 or fewer students 1 Unknown Unknown Yes Alternative Identification Plan 2006-07 65 15 or fewer students 1 15 or fewer students 1 Yes Alternative Identification Plan Indian River 2005-06 82 15 or fewer students 1 15 or fewer students 1 Yes Alternative Identification Plan 2006-07 30 No Alternative Plan No Alternative Plan No Alternative Identification Plan Jackson 2005-06 37 No Alternative Plan No Alternative Plan No Alternative Identification Plan 2006-07 15 or fewer students 1 15 or fewer students 1 15 or fewer students 1 Yes Alternative Identification Plan Jefferson 2005-06 15 or fewer students 1 15 or fewer students 1 15 or fewer students 1 Yes Alternative Identification Plan 2006-07 15 or fewer students 1 No Alternative Plan No Alternative Plan No Alternative Identification Plan Lafayette 2005-06 15 or fewer students 1 No Alternative Plan No Alternative Plan No Alternative Identification Plan 2006-07 113 20 17.7% Yes Alternative Identification Plan Lake 2005-06 119 15 or fewer students 1 15 or fewer students 1 Yes Alternative Identification Plan 2006-07 774 Unknown Unknown Yes Alternative Identification Plan Lee 2005-06 791 Unknown Unknown Yes Alternative Identification Plan 2006-07 163 Unknown Unknown Yes Alternative Identification Plan Leon 2005-06 163 Unknown Unknown Yes Alternative Identification Plan 2006-07 43 No Alternative Plan No Alternative Plan No Alternative Identification Plan
Levy 2005-06 40 No Alternative Plan No Alternative Plan No Alternative Identification Plan 2006-07 15 or fewer students 1 15 or fewer students 1 15 or fewer students 1 Yes Alternative Identification Plan Liberty 2005-06 15 or fewer students 1 15 or fewer students 1 15 or fewer students 1 Yes Alternative Identification Plan 2006-07 18 15 or fewer students 1 15 or fewer students 1 Yes Alternative Identification Plan Madison 2005-06 15 or fewer students 1 15 or fewer students 1 15 or fewer students 1 Yes Alternative Identification Plan 2006-07 332 69 20.8% Yes Alternative Identification Plan Manatee 2005-06 218 47 21.6% Yes Alternative Identification Plan 2006-07 160 70 43.8% Yes Alternative Identification Plan Marion 2005-06 139 34 24.5% Yes Alternative Identification Plan 2006-07 96 15 or fewer students 1 15 or fewer students 1 Yes Alternative Identification Plan
Martin 2005-06 86 15 or fewer students 1 15 or fewer students 1 Yes Alternative Identification Plan 2006-07 47 15 or fewer students 1 15 or fewer students 1 Yes Alternative Identification Plan Monroe 2005-06 56 15 or fewer students 1 15 or fewer students 1 Yes Alternative Identification Plan 2006-07 33 15 or fewer students 1 15 or fewer students 1 Yes Alternative Identification Plan Nassau 2005-06 34 15 or fewer students 1 15 or fewer students 1 Yes Alternative Identification Plan 2006-07 192 No Alternative Plan No Alternative Plan No Alternative Identification Plan Okaloosa 2005-06 159 No Alternative Plan No Alternative Plan No Alternative Identification Plan 2006-07 44 15 or fewer students 1 15 or fewer students 1 Yes Alternative Identification Plan Okeechobee 2005-06 27 15 or fewer students 1 15 or fewer students 1 Yes Alternative Identification Plan 2006-07 1,864 139 7.5% Yes Alternative Identification Plan Orange 2005-06 1,340 159 11.9% Yes Alternative Identification Plan 2006-07 99 15 or fewer students 1 15 or fewer students 1 Yes Alternative Identification Plan Osceola 2005-06 85 15 or fewer students 1 15 or fewer students 1 Yes Alternative Identification Plan 2006-07 1,596 Unknown Unknown Yes Alternative Identification Plan Palm Beach 2005-06 1,457 Unknown Unknown Yes Alternative Identification Plan
Report No. 08-01 OPPAGA Report
15
School District Year
Total New Gifted Identifications/ Newly Eligible
Total Identified Under Alternative Identification Plan
Percentage Identified Under Alternative Identification Plan
District Reported Using an Alternative Identification Plan
2006-07 284 30 10.6% Yes Alternative Identification Plan Pasco 2005-06 318 70 22.0% Yes Alternative Identification Plan 2006-07 1,246 94 7.5% Yes Alternative Identification Plan Pinellas 22005-06 1,146 104 9.1% Yes Alternative Identification Plan 2006-07 120 Unknown Unknown Yes Alternative Identification Plan Polk 2005-06 260 Unknown Unknown Yes Alternative Identification Plan 2006-07 15 or fewer students 1 Unknown Unknown Yes Alternative Identification Plan Putnam 2005-06 15 or fewer students 1 Unknown Unknown Yes Alternative Identification Plan 2006-07 80 15 or fewer students 1 15 or fewer students 1 Yes Alternative Identification Plan St. Johns 2005-06 99 15 or fewer students 1 15 or fewer students 1 Yes Alternative Identification Plan 2006-07 99 22 22.2% Yes Alternative Identification Plan St. Lucie 2005-06 118 22 18.6% Yes Alternative Identification Plan 2006-07 69 No Alternative Plan No Alternative Plan No Alternative Identification Plan Santa Rosa 2005-06 62 No Alternative Plan No Alternative Plan No Alternative Identification Plan 2006-07 625 Unknown Unknown Yes Alternative Identification Plan Sarasota 2005-06 581 Unknown Unknown Yes Alternative Identification Plan 2006-07 487 109 22.4% Yes Alternative Identification Plan Seminole 2005-06 558 71 12.7% Yes Alternative Identification Plan 2006-07 58 Unknown Unknown Yes Alternative Identification Plan Sumter 2005-06 49 Unknown Unknown Yes Alternative Identification Plan 2006-07 26 No Alternative Plan No Alternative Plan No Alternative Identification Plan Suwannee 2005-06 15 or fewer students 1 No Alternative Plan No Alternative Plan No Alternative Identification Plan 2006-07 15 or fewer students 1 No Alternative Plan No Alternative Plan No Alternative Identification Plan Taylor 2005-06 15 or fewer students 1 No Alternative Plan No Alternative Plan No Alternative Identification Plan 2006-07 15 or fewer students 1 No Alternative Plan No Alternative Plan No Alternative Identification Plan Union 2005-06 15 or fewer students 1 No Alternative Plan No Alternative Plan No Alternative Identification Plan 2006-07 395 73 18.5% Yes Alternative Identification Plan Volusia 2005-06 292 40 13.7% Yes Alternative Identification Plan 2006-07 16 Unknown Unknown Yes Alternative Identification Plan Wakulla 2005-06 15 or fewer students 1 Unknown Unknown Yes Alternative Identification Plan 2006-07 25 Unknown Unknown Yes Alternative Identification Plan Walton 2005-06 22 Unknown Unknown Yes Alternative Identification Plan 2006-07 15 or fewer students 1 No Alternative Plan No Alternative Plan No Alternative Identification Plan Washington 2005-06 15 or fewer students 1 No Alternative Plan No Alternative Plan No Alternative Identification Plan
1 In order to preserve student confidentiality, totals are not listed for school districts that reported 15 or fewer students in a category.
2 Pinellas’ 2005-06 data does not include grades 6-8.
Note: “Unknown” is listed for districts that were unable to separately report the number of students identified using alternative identification policies.
Source: OPPAGA survey of Florida school districts.
OPPAGA Report Report No. 08-01
16
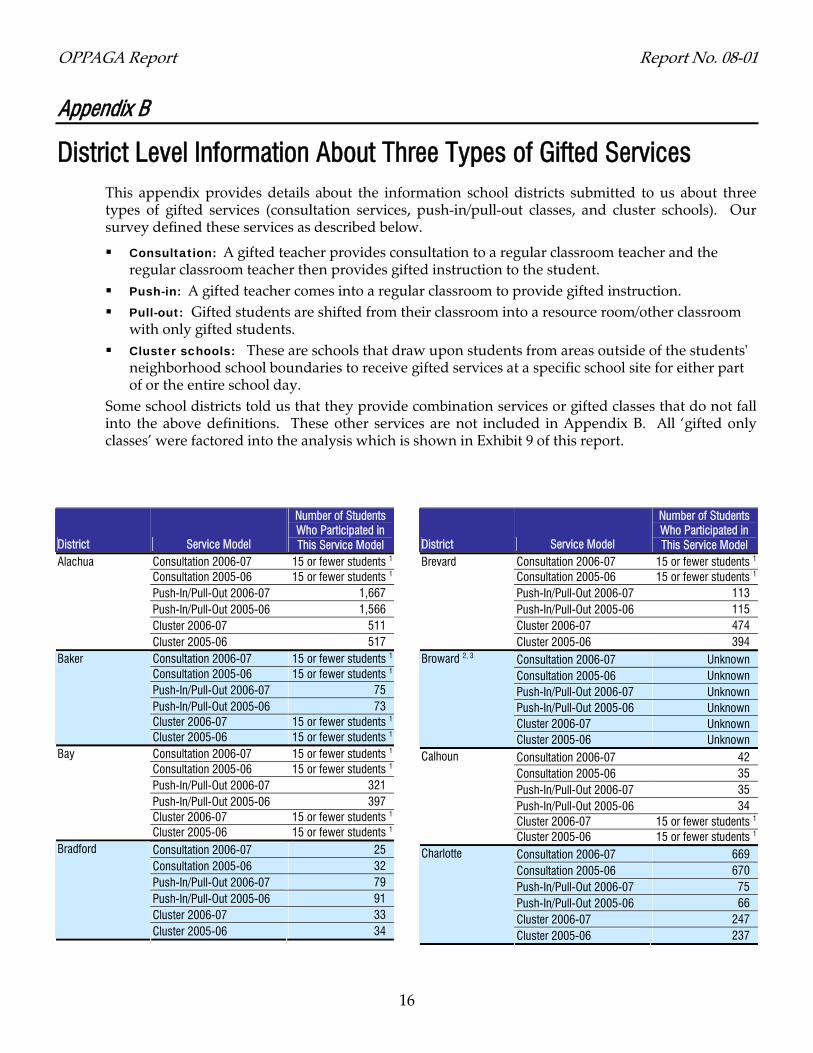
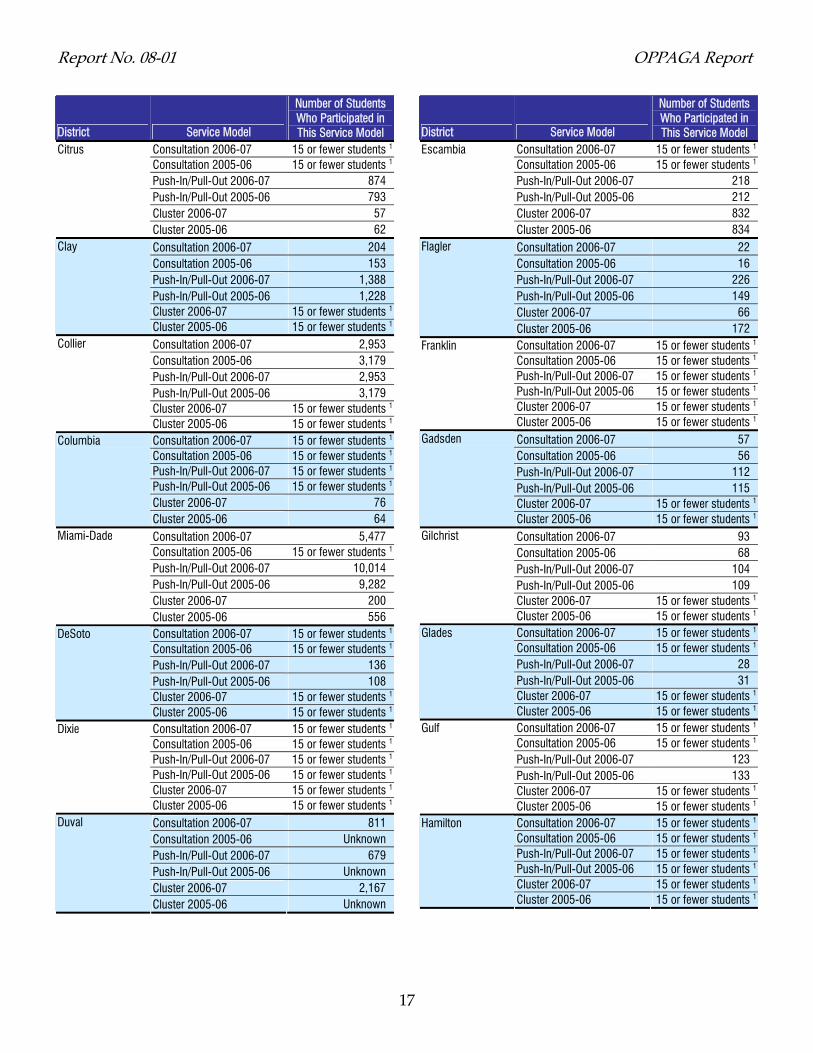
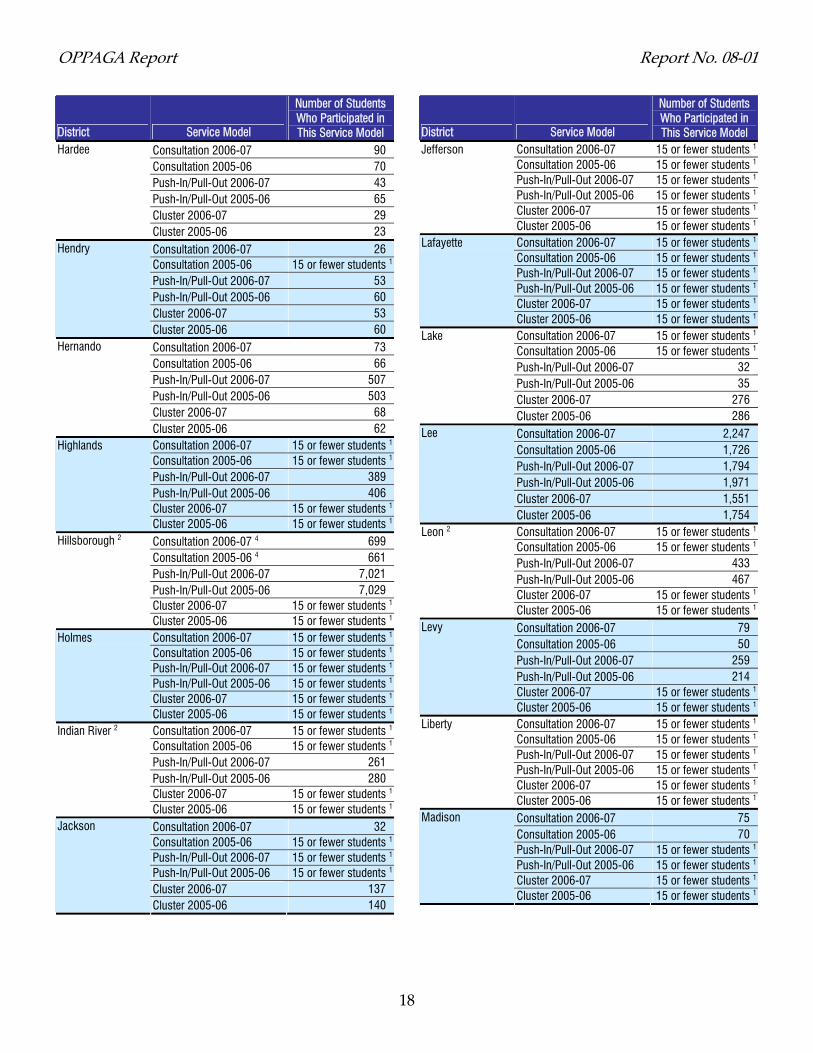
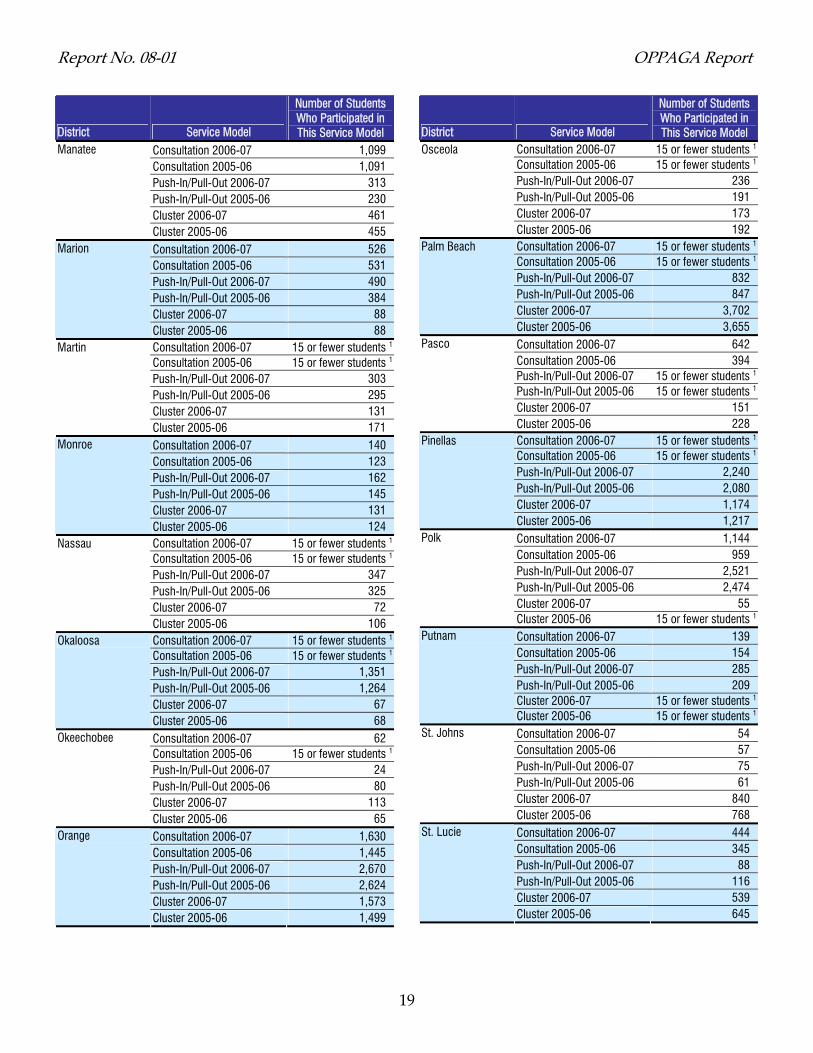
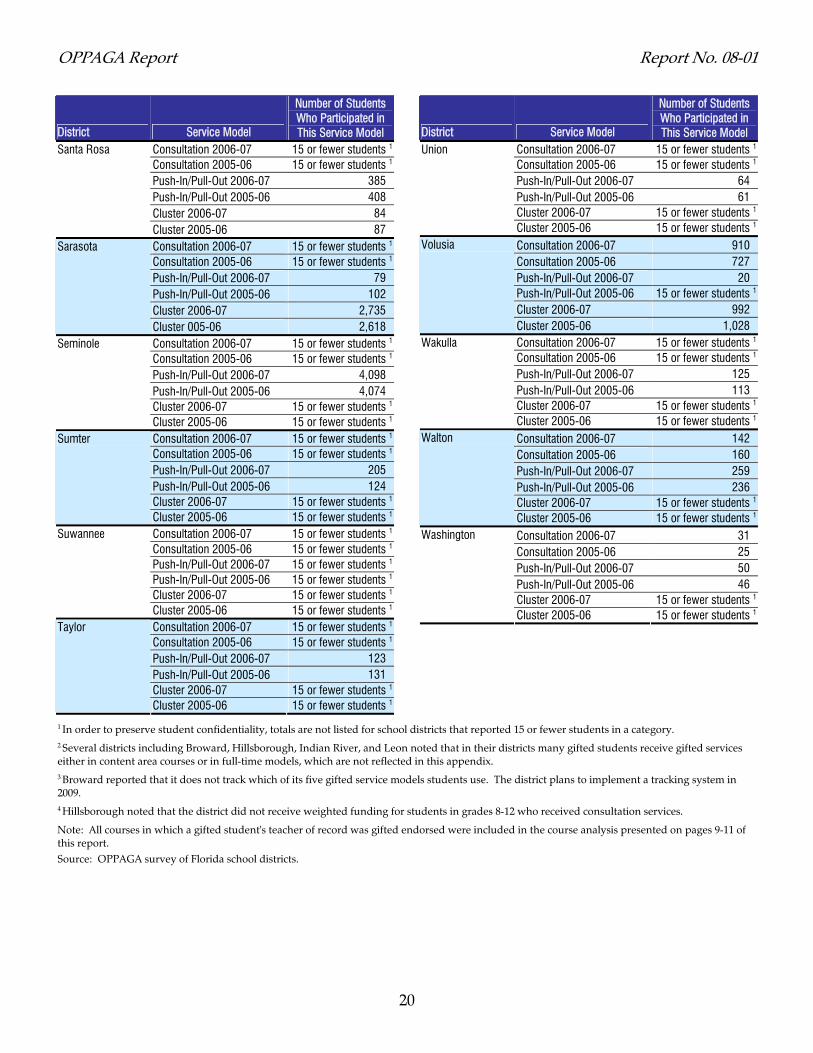
Appendix B
District Level Information About Three Types of Gifted Services This appendix provides details about the information school districts submitted to us about three types of gifted services (consultation services, push-in/pull-out classes, and cluster schools). Our survey defined these services as described below.
Consultation: A gifted teacher provides consultation to a regular classroom teacher and the regular classroom teacher then provides gifted instruction to the student.
Push-in: A gifted teacher comes into a regular classroom to provide gifted instruction. Pull-out: Gifted students are shifted from their classroom into a resource room/other classroom
with only gifted students. Cluster schools: These are schools that draw upon students from areas outside of the students'
neighborhood school boundaries to receive gifted services at a specific school site for either part of or the entire school day.
Some school districts told us that they provide combination services or gifted classes that do not fall into the above definitions. These other services are not included in Appendix B. All ‘gifted only classes’ were factored into the analysis which is shown in Exhibit 9 of this report.
District Service Model
Number of Students Who Participated in This Service Model
Consultation 2006-07 15 or fewer students 1 Consultation 2005-06 15 or fewer students 1
Push-In/Pull-Out 2006-07 1,667 Push-In/Pull-Out 2005-06 1,566 Cluster 2006-07 511
Alachua
Cluster 2005-06 517 Consultation 2006-07 15 or fewer students 1 Consultation 2005-06 15 or fewer students 1 Push-In/Pull-Out 2006-07 75 Push-In/Pull-Out 2005-06 73 Cluster 2006-07 15 or fewer students 1
Baker
Cluster 2005-06 15 or fewer students 1 Consultation 2006-07 15 or fewer students 1 Consultation 2005-06 15 or fewer students 1 Push-In/Pull-Out 2006-07 321 Push-In/Pull-Out 2005-06 397 Cluster 2006-07 15 or fewer students 1
Bay
Cluster 2005-06 15 or fewer students 1 Consultation 2006-07 25 Consultation 2005-06 32 Push-In/Pull-Out 2006-07 79 Push-In/Pull-Out 2005-06 91 Cluster 2006-07 33
Bradford
Cluster 2005-06 34
District Service Model
Number of Students Who Participated in This Service Model
Consultation 2006-07 15 or fewer students 1 Consultation 2005-06 15 or fewer students 1 Push-In/Pull-Out 2006-07 113 Push-In/Pull-Out 2005-06 115 Cluster 2006-07 474
Brevard
Cluster 2005-06 394 Consultation 2006-07 Unknown Consultation 2005-06 Unknown Push-In/Pull-Out 2006-07 Unknown Push-In/Pull-Out 2005-06 Unknown Cluster 2006-07 Unknown
Broward 2, 3
Cluster 2005-06 Unknown Consultation 2006-07 42 Consultation 2005-06 35 Push-In/Pull-Out 2006-07 35 Push-In/Pull-Out 2005-06 34 Cluster 2006-07 15 or fewer students 1
Calhoun
Cluster 2005-06 15 or fewer students 1 Consultation 2006-07 669 Consultation 2005-06 670 Push-In/Pull-Out 2006-07 75 Push-In/Pull-Out 2005-06 66 Cluster 2006-07 247
Charlotte
Cluster 2005-06 237
Report No. 08-01 OPPAGA Report
17
District Service Model
Number of Students Who Participated in This Service Model
Consultation 2006-07 15 or fewer students 1 Consultation 2005-06 15 or fewer students 1 Push-In/Pull-Out 2006-07 874 Push-In/Pull-Out 2005-06 793 Cluster 2006-07 57
Citrus
Cluster 2005-06 62 Consultation 2006-07 204 Consultation 2005-06 153 Push-In/Pull-Out 2006-07 1,388 Push-In/Pull-Out 2005-06 1,228 Cluster 2006-07 15 or fewer students 1
Clay
Cluster 2005-06 15 or fewer students 1 Consultation 2006-07 2,953 Consultation 2005-06 3,179 Push-In/Pull-Out 2006-07 2,953 Push-In/Pull-Out 2005-06 3,179 Cluster 2006-07 15 or fewer students 1
Collier
Cluster 2005-06 15 or fewer students 1 Consultation 2006-07 15 or fewer students 1 Consultation 2005-06 15 or fewer students 1 Push-In/Pull-Out 2006-07 15 or fewer students 1 Push-In/Pull-Out 2005-06 15 or fewer students 1 Cluster 2006-07 76
Columbia
Cluster 2005-06 64 Consultation 2006-07 5,477 Consultation 2005-06 15 or fewer students 1 Push-In/Pull-Out 2006-07 10,014 Push-In/Pull-Out 2005-06 9,282 Cluster 2006-07 200
Miami-Dade
Cluster 2005-06 556 Consultation 2006-07 15 or fewer students 1 Consultation 2005-06 15 or fewer students 1 Push-In/Pull-Out 2006-07 136 Push-In/Pull-Out 2005-06 108 Cluster 2006-07 15 or fewer students 1
DeSoto
Cluster 2005-06 15 or fewer students 1 Consultation 2006-07 15 or fewer students 1 Consultation 2005-06 15 or fewer students 1 Push-In/Pull-Out 2006-07 15 or fewer students 1 Push-In/Pull-Out 2005-06 15 or fewer students 1 Cluster 2006-07 15 or fewer students 1
Dixie
Cluster 2005-06 15 or fewer students 1 Consultation 2006-07 811 Consultation 2005-06 Unknown Push-In/Pull-Out 2006-07 679 Push-In/Pull-Out 2005-06 Unknown Cluster 2006-07 2,167
Duval
Cluster 2005-06 Unknown
District Service Model
Number of Students Who Participated in This Service Model
Consultation 2006-07 15 or fewer students 1 Consultation 2005-06 15 or fewer students 1 Push-In/Pull-Out 2006-07 218 Push-In/Pull-Out 2005-06 212 Cluster 2006-07 832
Escambia
Cluster 2005-06 834 Consultation 2006-07 22 Consultation 2005-06 16 Push-In/Pull-Out 2006-07 226 Push-In/Pull-Out 2005-06 149 Cluster 2006-07 66
Flagler
Cluster 2005-06 172 Consultation 2006-07 15 or fewer students 1 Consultation 2005-06 15 or fewer students 1 Push-In/Pull-Out 2006-07 15 or fewer students 1 Push-In/Pull-Out 2005-06 15 or fewer students 1 Cluster 2006-07 15 or fewer students 1
Franklin
Cluster 2005-06 15 or fewer students 1 Consultation 2006-07 57 Consultation 2005-06 56 Push-In/Pull-Out 2006-07 112 Push-In/Pull-Out 2005-06 115 Cluster 2006-07 15 or fewer students 1
Gadsden
Cluster 2005-06 15 or fewer students 1 Consultation 2006-07 93 Consultation 2005-06 68 Push-In/Pull-Out 2006-07 104 Push-In/Pull-Out 2005-06 109 Cluster 2006-07 15 or fewer students 1
Gilchrist
Cluster 2005-06 15 or fewer students 1 Consultation 2006-07 15 or fewer students 1 Consultation 2005-06 15 or fewer students 1 Push-In/Pull-Out 2006-07 28 Push-In/Pull-Out 2005-06 31 Cluster 2006-07 15 or fewer students 1
Glades
Cluster 2005-06 15 or fewer students 1 Consultation 2006-07 15 or fewer students 1 Consultation 2005-06 15 or fewer students 1 Push-In/Pull-Out 2006-07 123 Push-In/Pull-Out 2005-06 133 Cluster 2006-07 15 or fewer students 1
Gulf
Cluster 2005-06 15 or fewer students 1 Consultation 2006-07 15 or fewer students 1 Consultation 2005-06 15 or fewer students 1 Push-In/Pull-Out 2006-07 15 or fewer students 1 Push-In/Pull-Out 2005-06 15 or fewer students 1 Cluster 2006-07 15 or fewer students 1
Hamilton
Cluster 2005-06 15 or fewer students 1
OPPAGA Report Report No. 08-01
18
District Service Model
Number of Students Who Participated in This Service Model
Consultation 2006-07 90 Consultation 2005-06 70 Push-In/Pull-Out 2006-07 43 Push-In/Pull-Out 2005-06 65 Cluster 2006-07 29
Hardee
Cluster 2005-06 23 Consultation 2006-07 26 Consultation 2005-06 15 or fewer students 1 Push-In/Pull-Out 2006-07 53 Push-In/Pull-Out 2005-06 60 Cluster 2006-07 53
Hendry
Cluster 2005-06 60 Consultation 2006-07 73 Consultation 2005-06 66 Push-In/Pull-Out 2006-07 507 Push-In/Pull-Out 2005-06 503 Cluster 2006-07 68
Hernando
Cluster 2005-06 62 Consultation 2006-07 15 or fewer students 1 Consultation 2005-06 15 or fewer students 1 Push-In/Pull-Out 2006-07 389 Push-In/Pull-Out 2005-06 406 Cluster 2006-07 15 or fewer students 1
Highlands
Cluster 2005-06 15 or fewer students 1 Consultation 2006-07 4 699 Consultation 2005-06 4 661 Push-In/Pull-Out 2006-07 7,021 Push-In/Pull-Out 2005-06 7,029 Cluster 2006-07 15 or fewer students 1
Hillsborough 2
Cluster 2005-06 15 or fewer students 1 Consultation 2006-07 15 or fewer students 1 Consultation 2005-06 15 or fewer students 1 Push-In/Pull-Out 2006-07 15 or fewer students 1 Push-In/Pull-Out 2005-06 15 or fewer students 1 Cluster 2006-07 15 or fewer students 1
Holmes
Cluster 2005-06 15 or fewer students 1 Consultation 2006-07 15 or fewer students 1 Consultation 2005-06 15 or fewer students 1 Push-In/Pull-Out 2006-07 261 Push-In/Pull-Out 2005-06 280 Cluster 2006-07 15 or fewer students 1
Indian River 2
Cluster 2005-06 15 or fewer students 1 Consultation 2006-07 32 Consultation 2005-06 15 or fewer students 1 Push-In/Pull-Out 2006-07 15 or fewer students 1 Push-In/Pull-Out 2005-06 15 or fewer students 1 Cluster 2006-07 137
Jackson
Cluster 2005-06 140
District Service Model
Number of Students Who Participated in This Service Model
Consultation 2006-07 15 or fewer students 1 Consultation 2005-06 15 or fewer students 1 Push-In/Pull-Out 2006-07 15 or fewer students 1 Push-In/Pull-Out 2005-06 15 or fewer students 1 Cluster 2006-07 15 or fewer students 1
Jefferson
Cluster 2005-06 15 or fewer students 1 Consultation 2006-07 15 or fewer students 1 Consultation 2005-06 15 or fewer students 1 Push-In/Pull-Out 2006-07 15 or fewer students 1 Push-In/Pull-Out 2005-06 15 or fewer students 1 Cluster 2006-07 15 or fewer students 1
Lafayette
Cluster 2005-06 15 or fewer students 1 Consultation 2006-07 15 or fewer students 1 Consultation 2005-06 15 or fewer students 1 Push-In/Pull-Out 2006-07 32 Push-In/Pull-Out 2005-06 35 Cluster 2006-07 276
Lake
Cluster 2005-06 286 Consultation 2006-07 2,247 Consultation 2005-06 1,726 Push-In/Pull-Out 2006-07 1,794 Push-In/Pull-Out 2005-06 1,971 Cluster 2006-07 1,551
Lee
Cluster 2005-06 1,754 Consultation 2006-07 15 or fewer students 1 Consultation 2005-06 15 or fewer students 1 Push-In/Pull-Out 2006-07 433 Push-In/Pull-Out 2005-06 467 Cluster 2006-07 15 or fewer students 1
Leon 2
Cluster 2005-06 15 or fewer students 1 Consultation 2006-07 79 Consultation 2005-06 50 Push-In/Pull-Out 2006-07 259 Push-In/Pull-Out 2005-06 214 Cluster 2006-07 15 or fewer students 1
Levy
Cluster 2005-06 15 or fewer students 1 Consultation 2006-07 15 or fewer students 1 Consultation 2005-06 15 or fewer students 1 Push-In/Pull-Out 2006-07 15 or fewer students 1 Push-In/Pull-Out 2005-06 15 or fewer students 1 Cluster 2006-07 15 or fewer students 1
Liberty
Cluster 2005-06 15 or fewer students 1 Consultation 2006-07 75 Consultation 2005-06 70 Push-In/Pull-Out 2006-07 15 or fewer students 1 Push-In/Pull-Out 2005-06 15 or fewer students 1 Cluster 2006-07 15 or fewer students 1
Madison
Cluster 2005-06 15 or fewer students 1
Report No. 08-01 OPPAGA Report
19
District Service Model
Number of Students Who Participated in This Service Model
Consultation 2006-07 1,099 Consultation 2005-06 1,091 Push-In/Pull-Out 2006-07 313 Push-In/Pull-Out 2005-06 230 Cluster 2006-07 461
Manatee
Cluster 2005-06 455 Consultation 2006-07 526 Consultation 2005-06 531 Push-In/Pull-Out 2006-07 490 Push-In/Pull-Out 2005-06 384 Cluster 2006-07 88
Marion
Cluster 2005-06 88 Consultation 2006-07 15 or fewer students 1 Consultation 2005-06 15 or fewer students 1 Push-In/Pull-Out 2006-07 303 Push-In/Pull-Out 2005-06 295 Cluster 2006-07 131
Martin
Cluster 2005-06 171 Consultation 2006-07 140 Consultation 2005-06 123 Push-In/Pull-Out 2006-07 162 Push-In/Pull-Out 2005-06 145 Cluster 2006-07 131
Monroe
Cluster 2005-06 124 Consultation 2006-07 15 or fewer students 1 Consultation 2005-06 15 or fewer students 1 Push-In/Pull-Out 2006-07 347 Push-In/Pull-Out 2005-06 325 Cluster 2006-07 72
Nassau
Cluster 2005-06 106 Consultation 2006-07 15 or fewer students 1 Consultation 2005-06 15 or fewer students 1 Push-In/Pull-Out 2006-07 1,351 Push-In/Pull-Out 2005-06 1,264 Cluster 2006-07 67
Okaloosa
Cluster 2005-06 68 Consultation 2006-07 62 Consultation 2005-06 15 or fewer students 1 Push-In/Pull-Out 2006-07 24 Push-In/Pull-Out 2005-06 80 Cluster 2006-07 113
Okeechobee
Cluster 2005-06 65 Consultation 2006-07 1,630 Consultation 2005-06 1,445 Push-In/Pull-Out 2006-07 2,670 Push-In/Pull-Out 2005-06 2,624 Cluster 2006-07 1,573
Orange
Cluster 2005-06 1,499
District Service Model
Number of Students Who Participated in This Service Model
Consultation 2006-07 15 or fewer students 1 Consultation 2005-06 15 or fewer students 1 Push-In/Pull-Out 2006-07 236 Push-In/Pull-Out 2005-06 191 Cluster 2006-07 173
Osceola
Cluster 2005-06 192 Consultation 2006-07 15 or fewer students 1 Consultation 2005-06 15 or fewer students 1 Push-In/Pull-Out 2006-07 832 Push-In/Pull-Out 2005-06 847 Cluster 2006-07 3,702
Palm Beach
Cluster 2005-06 3,655 Consultation 2006-07 642 Consultation 2005-06 394 Push-In/Pull-Out 2006-07 15 or fewer students 1 Push-In/Pull-Out 2005-06 15 or fewer students 1 Cluster 2006-07 151
Pasco
Cluster 2005-06 228 Consultation 2006-07 15 or fewer students 1 Consultation 2005-06 15 or fewer students 1 Push-In/Pull-Out 2006-07 2,240 Push-In/Pull-Out 2005-06 2,080 Cluster 2006-07 1,174
Pinellas
Cluster 2005-06 1,217 Consultation 2006-07 1,144 Consultation 2005-06 959 Push-In/Pull-Out 2006-07 2,521 Push-In/Pull-Out 2005-06 2,474 Cluster 2006-07 55
Polk
Cluster 2005-06 15 or fewer students 1 Consultation 2006-07 139 Consultation 2005-06 154 Push-In/Pull-Out 2006-07 285 Push-In/Pull-Out 2005-06 209 Cluster 2006-07 15 or fewer students 1
Putnam
Cluster 2005-06 15 or fewer students 1 Consultation 2006-07 54 Consultation 2005-06 57 Push-In/Pull-Out 2006-07 75 Push-In/Pull-Out 2005-06 61 Cluster 2006-07 840
St. Johns
Cluster 2005-06 768 Consultation 2006-07 444 Consultation 2005-06 345 Push-In/Pull-Out 2006-07 88 Push-In/Pull-Out 2005-06 116 Cluster 2006-07 539
St. Lucie
Cluster 2005-06 645
OPPAGA Report Report No. 08-01
20
District Service Model
Number of Students Who Participated in This Service Model
Consultation 2006-07 15 or fewer students 1 Consultation 2005-06 15 or fewer students 1 Push-In/Pull-Out 2006-07 385 Push-In/Pull-Out 2005-06 408 Cluster 2006-07 84
Santa Rosa
Cluster 2005-06 87 Consultation 2006-07 15 or fewer students 1 Consultation 2005-06 15 or fewer students 1 Push-In/Pull-Out 2006-07 79 Push-In/Pull-Out 2005-06 102 Cluster 2006-07 2,735
Sarasota
Cluster 005-06 2,618 Consultation 2006-07 15 or fewer students 1 Consultation 2005-06 15 or fewer students 1 Push-In/Pull-Out 2006-07 4,098 Push-In/Pull-Out 2005-06 4,074 Cluster 2006-07 15 or fewer students 1
Seminole
Cluster 2005-06 15 or fewer students 1 Consultation 2006-07 15 or fewer students 1 Consultation 2005-06 15 or fewer students 1 Push-In/Pull-Out 2006-07 205 Push-In/Pull-Out 2005-06 124 Cluster 2006-07 15 or fewer students 1
Sumter
Cluster 2005-06 15 or fewer students 1 Consultation 2006-07 15 or fewer students 1 Consultation 2005-06 15 or fewer students 1 Push-In/Pull-Out 2006-07 15 or fewer students 1 Push-In/Pull-Out 2005-06 15 or fewer students 1 Cluster 2006-07 15 or fewer students 1
Suwannee
Cluster 2005-06 15 or fewer students 1 Consultation 2006-07 15 or fewer students 1 Consultation 2005-06 15 or fewer students 1 Push-In/Pull-Out 2006-07 123 Push-In/Pull-Out 2005-06 131 Cluster 2006-07 15 or fewer students 1
Taylor
Cluster 2005-06 15 or fewer students 1
District Service Model
Number of Students Who Participated in This Service Model
Consultation 2006-07 15 or fewer students 1 Consultation 2005-06 15 or fewer students 1 Push-In/Pull-Out 2006-07 64 Push-In/Pull-Out 2005-06 61 Cluster 2006-07 15 or fewer students 1
Union
Cluster 2005-06 15 or fewer students 1 Consultation 2006-07 910 Consultation 2005-06 727 Push-In/Pull-Out 2006-07 20 Push-In/Pull-Out 2005-06 15 or fewer students 1 Cluster 2006-07 992
Volusia
Cluster 2005-06 1,028 Consultation 2006-07 15 or fewer students 1 Consultation 2005-06 15 or fewer students 1 Push-In/Pull-Out 2006-07 125 Push-In/Pull-Out 2005-06 113 Cluster 2006-07 15 or fewer students 1
Wakulla
Cluster 2005-06 15 or fewer students 1 Consultation 2006-07 142 Consultation 2005-06 160 Push-In/Pull-Out 2006-07 259 Push-In/Pull-Out 2005-06 236 Cluster 2006-07 15 or fewer students 1
Walton
Cluster 2005-06 15 or fewer students 1 Consultation 2006-07 31 Consultation 2005-06 25 Push-In/Pull-Out 2006-07 50 Push-In/Pull-Out 2005-06 46 Cluster 2006-07 15 or fewer students 1
Washington
Cluster 2005-06 15 or fewer students 1
1 In order to preserve student confidentiality, totals are not listed for school districts that reported 15 or fewer students in a category. 2 Several districts including Broward, Hillsborough, Indian River, and Leon noted that in their districts many gifted students receive gifted services either in content area courses or in full-time models, which are not reflected in this appendix. 3 Broward reported that it does not track which of its five gifted service models students use. The district plans to implement a tracking system in 2009. 4 Hillsborough noted that the district did not receive weighted funding for students in grades 8-12 who received consultation services.
Note: All courses in which a gifted student's teacher of record was gifted endorsed were included in the course analysis presented on pages 9-11 of this report. Source: OPPAGA survey of Florida school districts.