florida association of local housing finance...
TRANSCRIPT

Investment Training: MBS Market
July 12, 2013Helen Hough Feinberg, Managing Director - RBC Capital Markets
Scott Kirby, Senior Portfolio Manager – RBC Global Asset Management
Florida Association of Local Housing Finance Authorities
DisclaimerRBC Capital Markets, LLC (“RBC CM”) is providing the information contained in this document for discussion purposes only and not in connection withRBC CM serving as Underwriter, Investment Banker, municipal advisor, financial advisor or fiduciary to a financial transaction participant or any otherperson or entity. RBC CM will not have any duties or liability to any person or entity in connection with the information being provided herein. Theinformation provided is not intended to be and should not be construed as “advice” within the meaning of Section 15B of the Securities Exchange Act of1934. The financial transaction participants should consult with its own legal, accounting, tax, financial and other advisors, as applicable, to the extent itdeems appropriate.
RBC Global Asset Management (U.S.) Inc. (“RBC GAM-US”), a federally registered investment adviser founded in 1983. RBC Global Asset Management(“RBC GAM”) is an affiliate of RBC CM and is the asset management division of Royal Bank of Canada (“RBC”) which includes RBC Global AssetManagement Inc., RBC Global Asset Management (U.S.) Inc., RBC Alternative Asset Management Inc., and BlueBay Asset Management LLP, which areseparate, but affiliated corporate entities. RBC GAM-US is not a broker-dealer and does not offer the products describe herein.
This presentation was prepared exclusively for the benefit of and internal use by the recipient for the purpose of considering the transaction or transactionscontemplated herein. This presentation is confidential and proprietary to RBC Capital Markets, LLC (“RBC CM”) and may not be disclosed, reproduced,distributed or used for any other purpose by the recipient without RBCCM’s express written consent.
By acceptance of these materials, and notwithstanding any other express or implied agreement, arrangement, or understanding to the contrary, RBC CM,its affiliates and the recipient agree that the recipient (and its employees, representatives, and other agents) may disclose to any and all persons, withoutlimitation of any kind from the commencement of discussions, the tax treatment, structure or strategy of the transaction and any fact that may be relevant tounderstanding such treatment, structure or strategy, and all materials of any kind (including opinions or other tax analyses) that are provided to therecipient relating to such tax treatment, structure, or strategy.
The information and any analyses contained in this presentation are taken from, or based upon, information obtained from the recipient or from publiclyavailable sources, the completeness and accuracy of which has not been independently verified, and cannot be assured by RBC CM. The information andany analyses in these materials reflect prevailing conditions and RBC CM’s views as of this date, all of which are subject to change.
To the extent projections and financial analyses are set forth herein, they may be based on estimated financial performance prepared by or in consultationwith the recipient and are intended only to suggest reasonable ranges of results. The printed presentation is incomplete without reference to the oralpresentation or other written materials that supplement it.
IRS Circular 230 Disclosure: RBC CM and its affiliates do not provide tax advice and nothing contained herein should be construed as tax advice. Anydiscussion of U.S. tax matters contained herein (including any attachments) (i) was not intended or written to be used, and cannot be used, by you for thepurpose of avoiding tax penalties; and (ii) was written in connection with the promotion or marketing of the matters addressed herein. Accordingly, youshould seek advice based upon your particular circumstances from an independent tax advisor.
Panelist Scott Kirby: RBC Global Asset Management
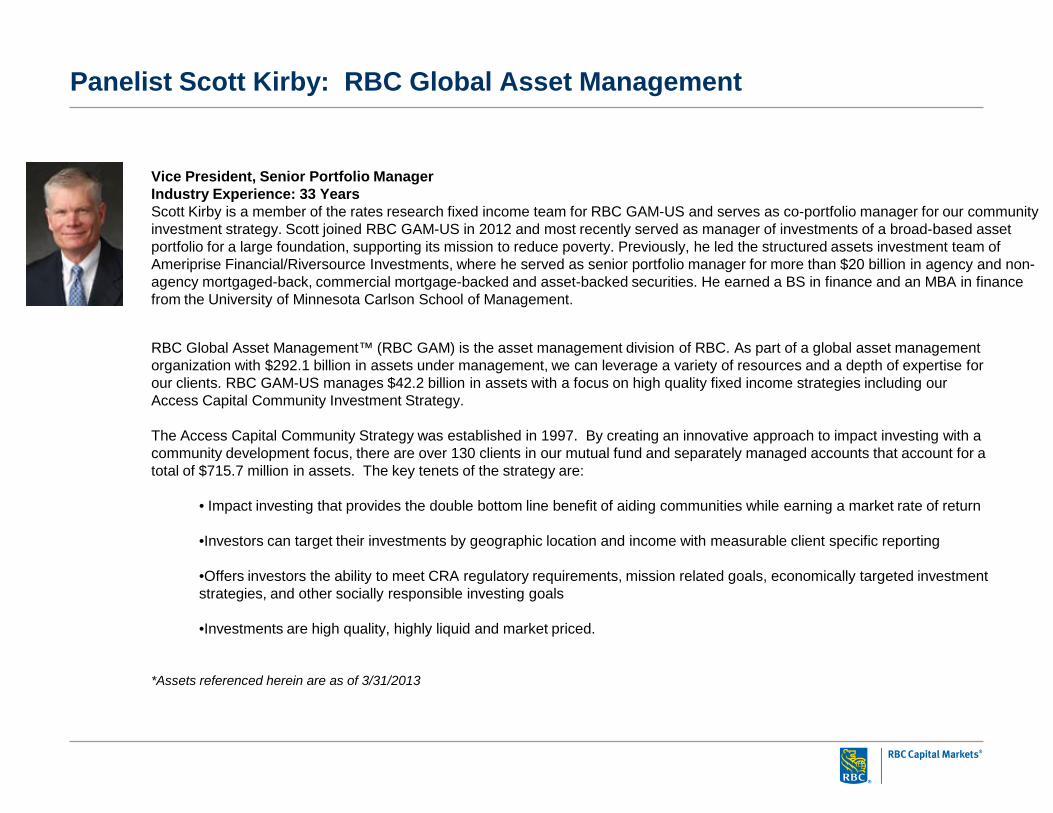
Vice President, Senior Portfolio ManagerIndustry Experience: 33 YearsScott Kirby is a member of the rates research fixed income team for RBC GAM-US and serves as co-portfolio manager for our community investment strategy. Scott joined RBC GAM-US in 2012 and most recently served as manager of investments of a broad-based asset portfolio for a large foundation, supporting its mission to reduce poverty. Previously, he led the structured assets investment team of Ameriprise Financial/Riversource Investments, where he served as senior portfolio manager for more than $20 billion in agency and non-agency mortgaged-back, commercial mortgage-backed and asset-backed securities. He earned a BS in finance and an MBA in finance from the University of Minnesota Carlson School of Management.
RBC Global Asset Management™ (RBC GAM) is the asset management division of RBC. As part of a global asset management organization with $292.1 billion in assets under management, we can leverage a variety of resources and a depth of expertise forour clients. RBC GAM-US manages $42.2 billion in assets with a focus on high quality fixed income strategies including our Access Capital Community Investment Strategy.
The Access Capital Community Strategy was established in 1997. By creating an innovative approach to impact investing with a community development focus, there are over 130 clients in our mutual fund and separately managed accounts that account for atotal of $715.7 million in assets. The key tenets of the strategy are:
• Impact investing that provides the double bottom line benefit of aiding communities while earning a market rate of return
•Investors can target their investments by geographic location and income with measurable client specific reporting
•Offers investors the ability to meet CRA regulatory requirements, mission related goals, economically targeted investment strategies, and other socially responsible investing goals
•Investments are high quality, highly liquid and market priced.
*Assets referenced herein are as of 3/31/2013
Florida ALHFASection 1: GNMA Securities and the TBA Market
4
GNMA MORTGAGE-BACKED SECURITIES
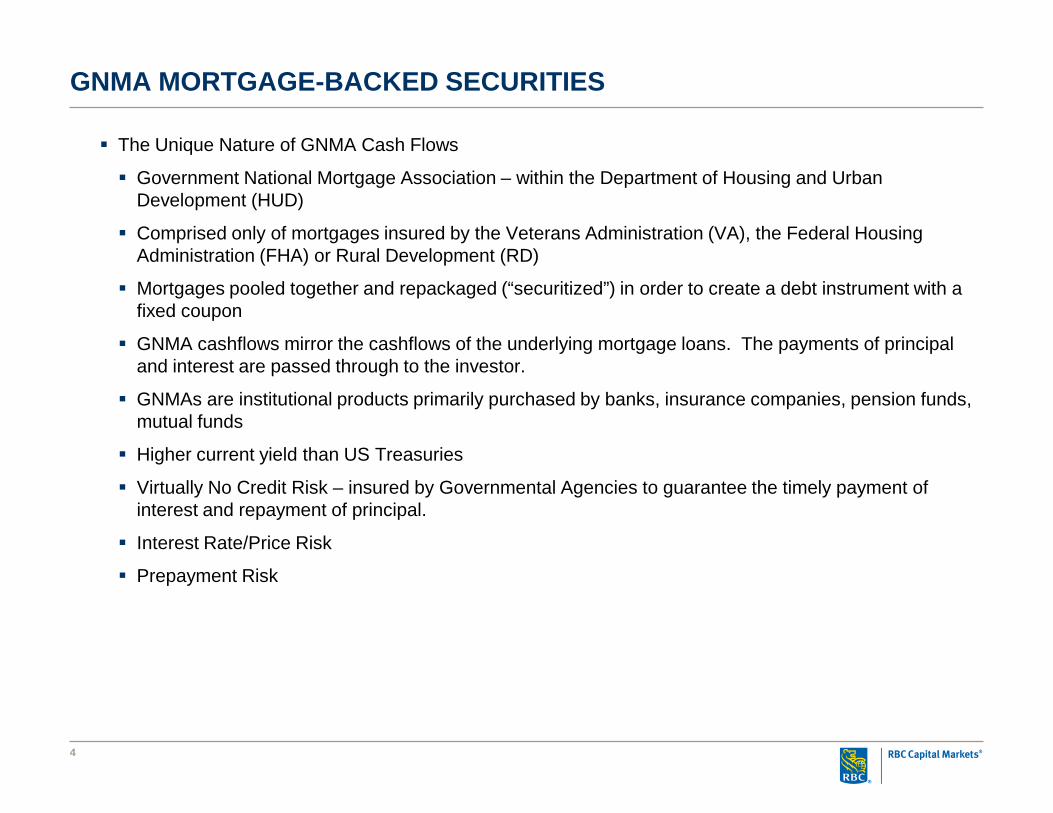
The Unique Nature of GNMA Cash Flows
Government National Mortgage Association – within the Department of Housing and Urban Development (HUD)
Comprised only of mortgages insured by the Veterans Administration (VA), the Federal Housing Administration (FHA) or Rural Development (RD)
Mortgages pooled together and repackaged (“securitized”) in order to create a debt instrument with a fixed coupon
GNMA cashflows mirror the cashflows of the underlying mortgage loans. The payments of principal and interest are passed through to the investor.
GNMAs are institutional products primarily purchased by banks, insurance companies, pension funds, mutual funds
Higher current yield than US Treasuries
Virtually No Credit Risk – insured by Governmental Agencies to guarantee the timely payment of interest and repayment of principal.
Interest Rate/Price Risk
Prepayment Risk
5
GNMA SECURITIES
Homogenous Nature of a GNMA Security 100% fixed rate loans Similar maturity (-15 year, -20 year, -30 year) Same interest rate on the loans (unless a GNMA II Multi Issuer Pool)
Master Servicer acts as a middle man Receives the mortgage payments on each individual loan and sends them to the GNMA
pool investor Charges a fee for the Servicer Investor receives monthly payments – the percentage of the payment that is attributable to
principal grows over time.

6
GNMA SECURITIES – Impact of Prepayments on Cash Flows
Prepayments are also passed through to the investor, radically changing the return to the investor – shortening the average life
Prepayments reduce the amount of interest that the investor will receive over the life of the GNMA
Prepayments are unpredictable
The GNMA investor is compensated for this risk in the form of a higher yield
7
GNMA SECURITIES
Interest Rate Changes impact on GNMAs In general, there is an inverse relationship between interest rates and price. (i.e. when
interest rates go down, prices go up) For GNMAs - If interest rates drop substantially – homeowners will refinance their mortgages
by prepaying the balance before expected maturity Bad News for the GNMA investor Get back principal sooner than expected (principal or prepayment risk) Reinvestment opportunities at lower rates (interest rate risk) Value of GNMA increases, but investment yield will decline if security was purchased at a
premium If Interest Rates Rise – also bad news for the GNMA Investor Prepayment rates slow down – homeowners won’t refinance to a higher rate loan
(principal or prepayment risk) Coupon on the GNMA security is below market (interest rate risk) Value of GNMA declines While GNMAs perform better than US Treasuries on a current yield basis, they may
underperform when there are significant moves in interest rates. Investors like GNMAs from Bond Programs because they tend to have slower prepayment
speeds
8
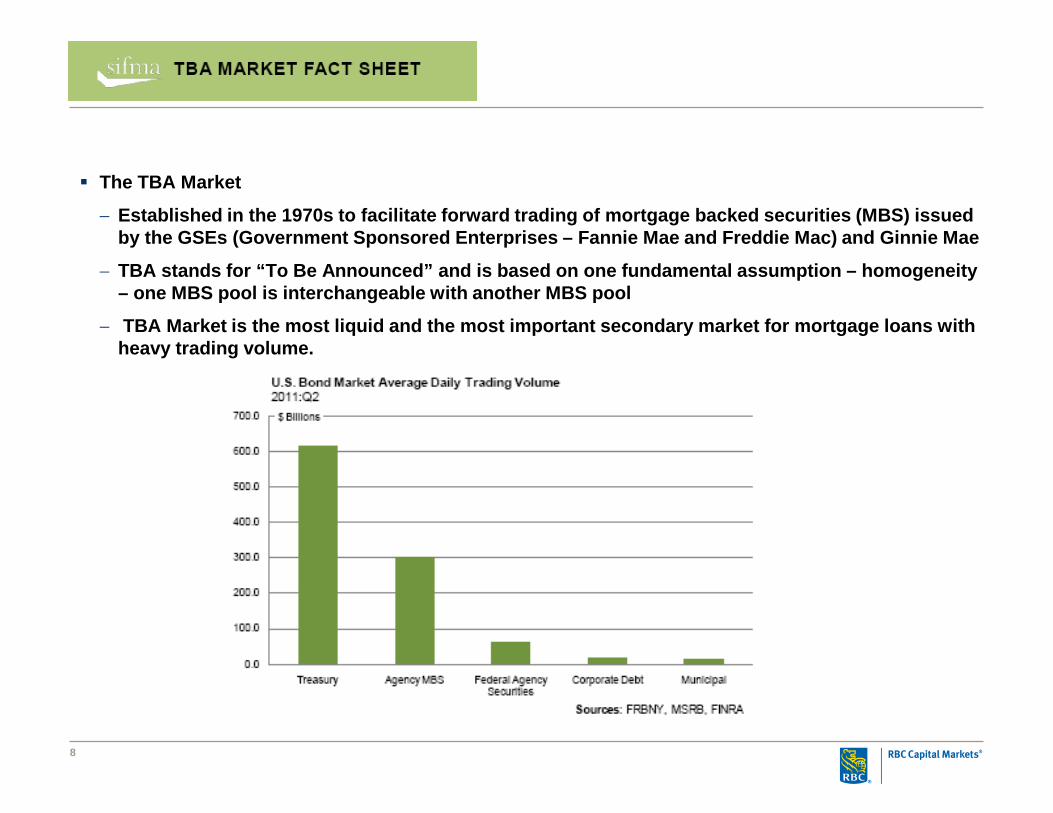
The TBA Market
− Established in the 1970s to facilitate forward trading of mortgage backed securities (MBS) issued by the GSEs (Government Sponsored Enterprises – Fannie Mae and Freddie Mac) and Ginnie Mae
− TBA stands for “To Be Announced” and is based on one fundamental assumption – homogeneity – one MBS pool is interchangeable with another MBS pool
− TBA Market is the most liquid and the most important secondary market for mortgage loans with heavy trading volume.
9
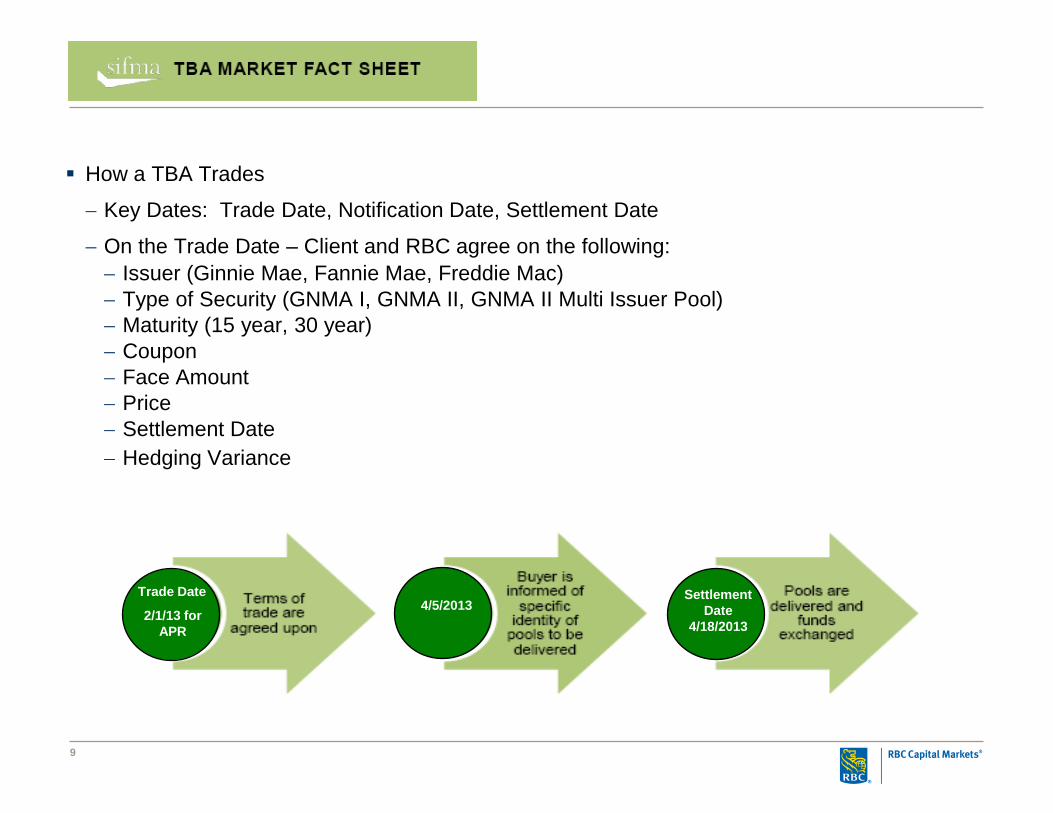
How a TBA Trades
− Key Dates: Trade Date, Notification Date, Settlement Date
− On the Trade Date – Client and RBC agree on the following:− Issuer (Ginnie Mae, Fannie Mae, Freddie Mac)− Type of Security (GNMA I, GNMA II, GNMA II Multi Issuer Pool)− Maturity (15 year, 30 year)− Coupon− Face Amount− Price− Settlement Date− Hedging Variance
Trade Date
2/1/13 for APR
4/5/2013Settlement
Date4/18/2013
10
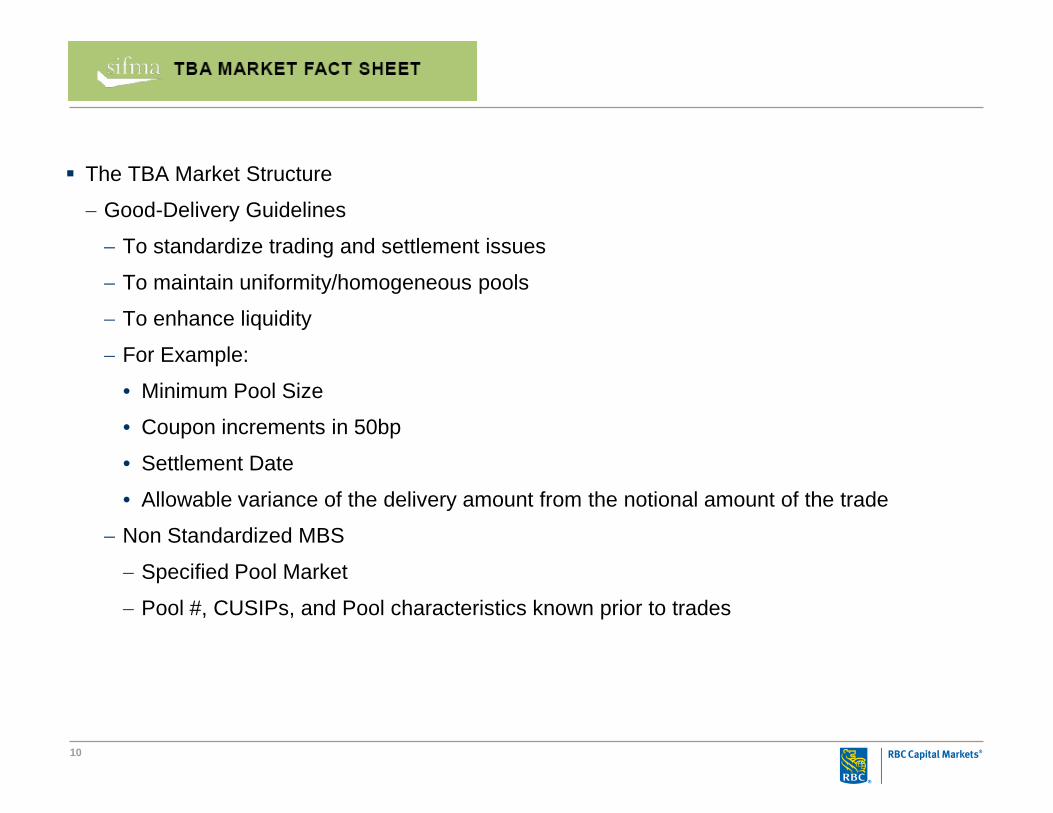
The TBA Market Structure
− Good-Delivery Guidelines
− To standardize trading and settlement issues
− To maintain uniformity/homogeneous pools
− To enhance liquidity
− For Example:
• Minimum Pool Size
• Coupon increments in 50bp
• Settlement Date
• Allowable variance of the delivery amount from the notional amount of the trade
− Non Standardized MBS
− Specified Pool Market
− Pool #, CUSIPs, and Pool characteristics known prior to trades
11
Trade Date
2/113 for APR
4/5/2013Settlement
Date4/18/2013
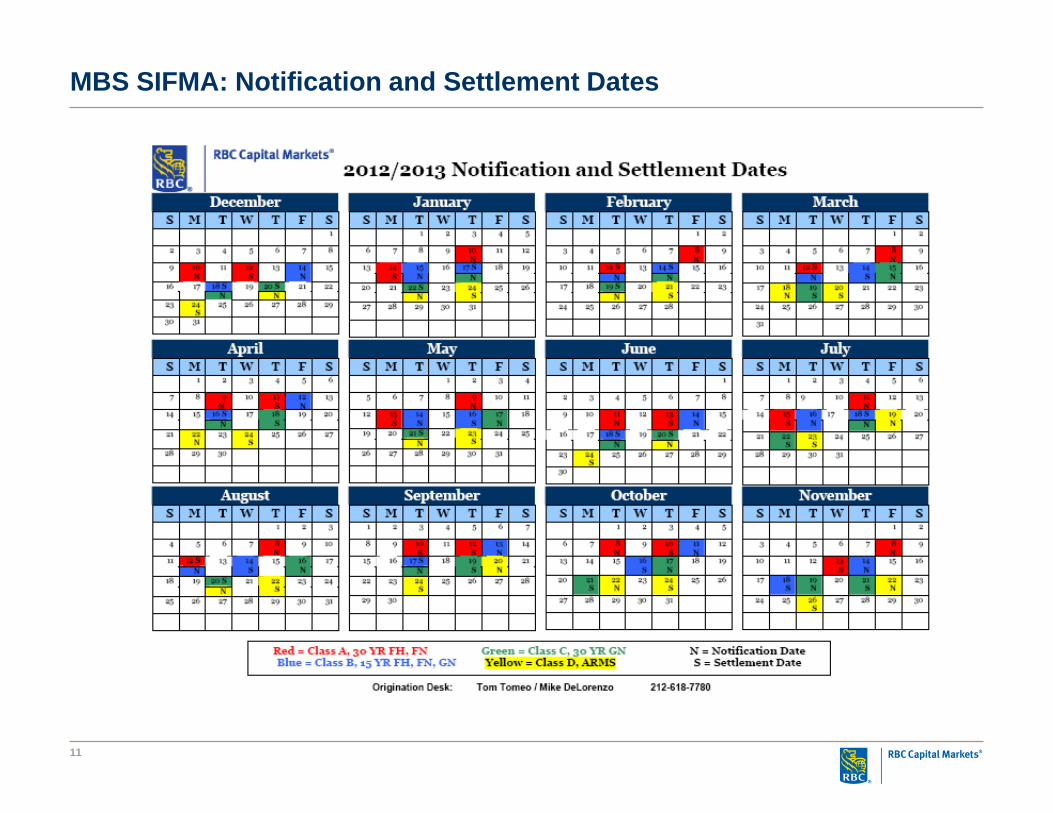
MBS SIFMA: Notification and Settlement Dates
12
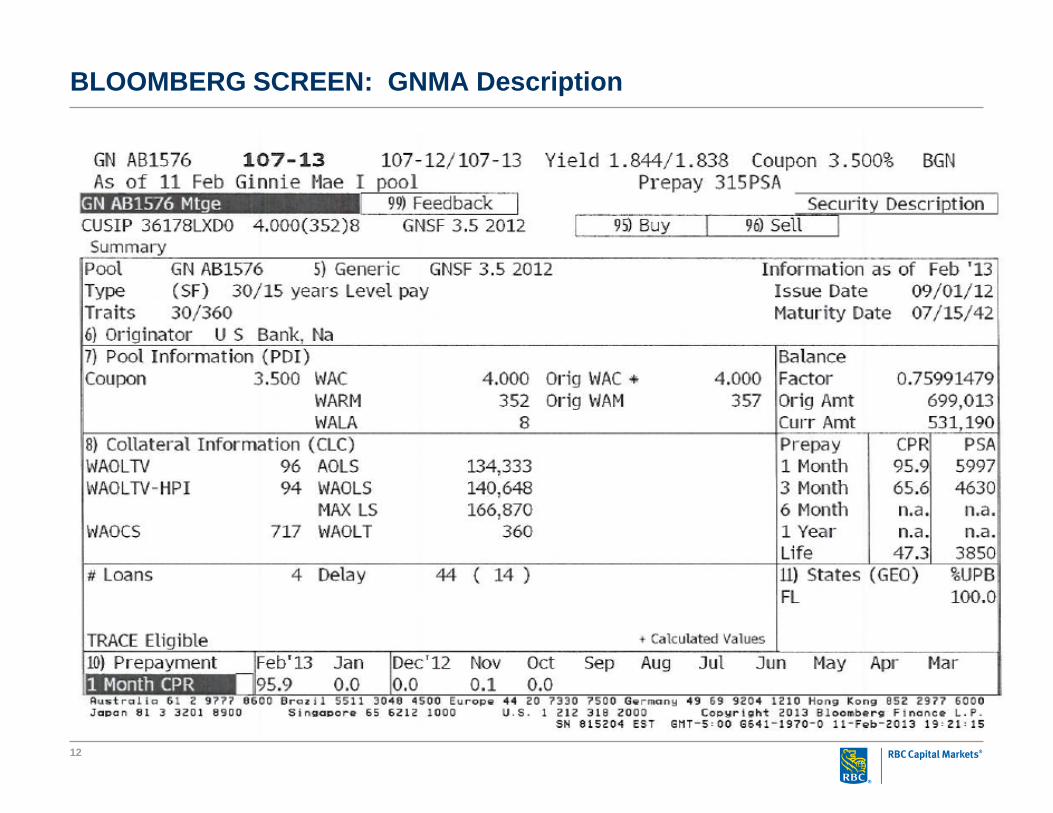
BLOOMBERG SCREEN: GNMA Description
13
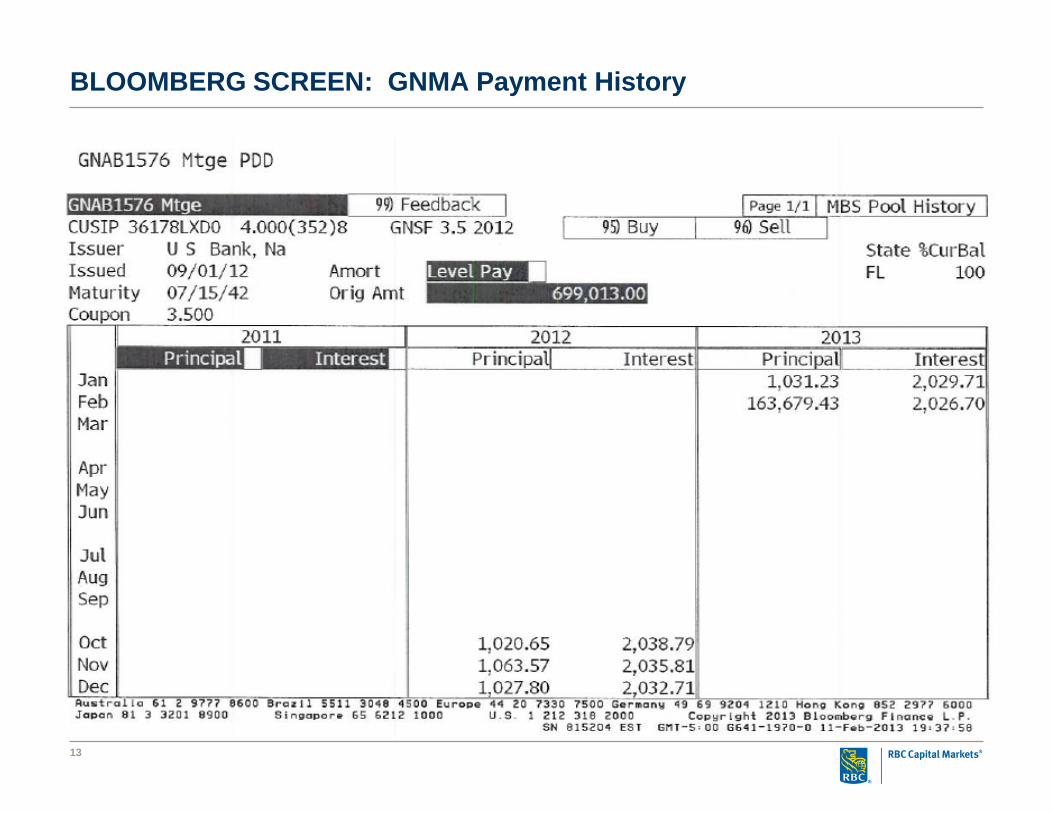
BLOOMBERG SCREEN: GNMA Payment History
14
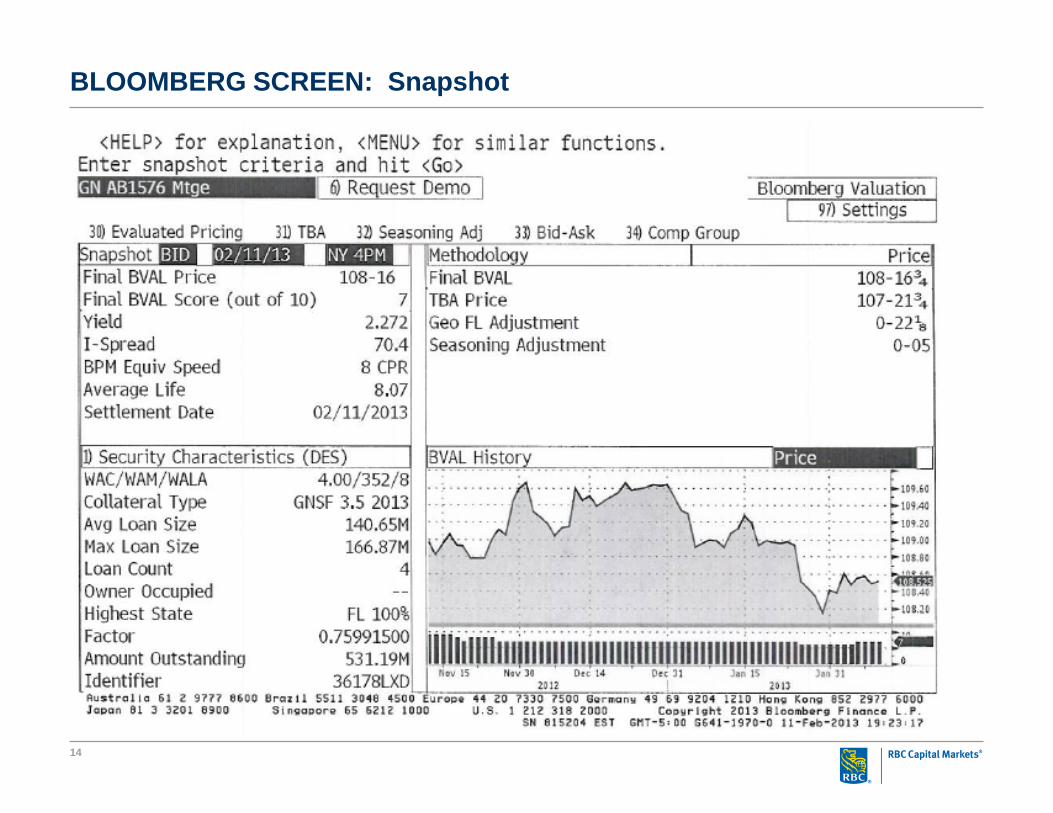
BLOOMBERG SCREEN: Snapshot
15
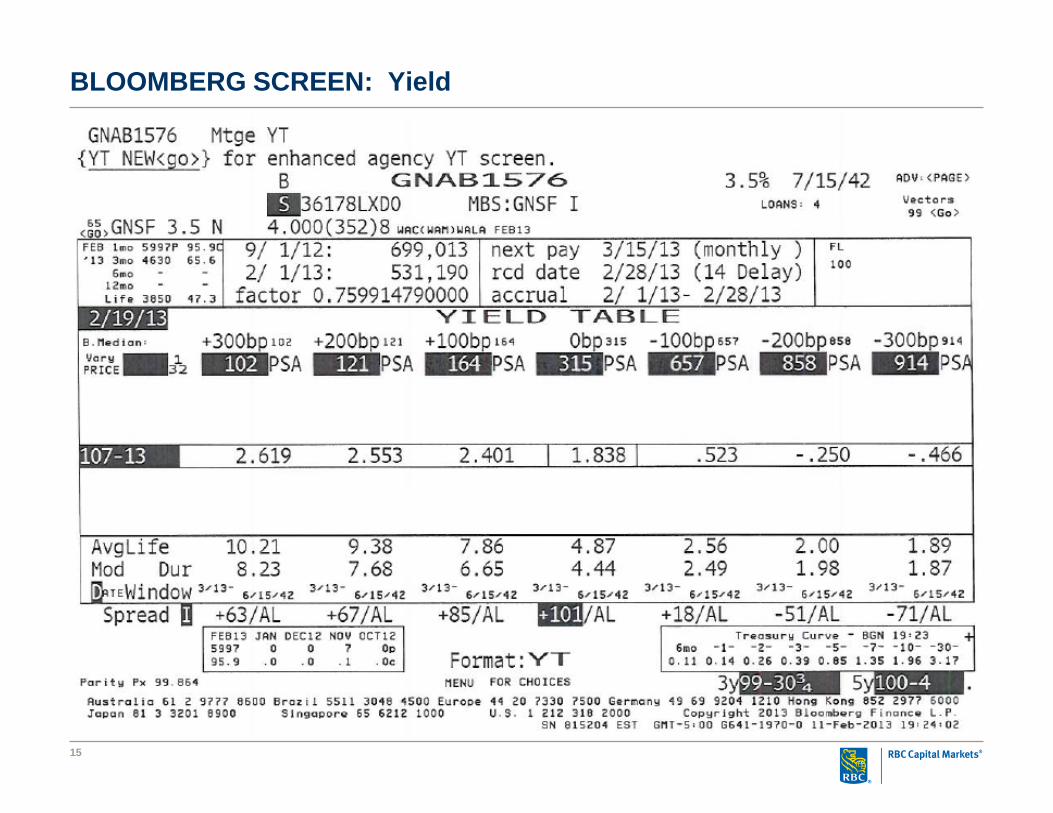
BLOOMBERG SCREEN: Yield
16
While mortgage securitization by private financial institutions has declined to low levels since2007, issuance of agency MBS has remained robust.
− Agency MBS issued in 2008/2009 = $2.89 Trillion
− NO non agency securitizations for years after financial crisis
MBS carries explicit government credit guarantee or is perceived to carry an implicit one
Liquid forward market for trading Agency MBS
− Improves market functioning
− Helps mortgage lenders manage risk by locking in sale prices for new loans as themortgages are originated
More than 90% of agency MBS trading volume occurs in the forward market – TBA Market
Securitization remains central to the US mortgage finance system because of the continuinglarge issuance volumes of AGENCY MBS.
Mortgage Credit Risk is borne by the guarantor (Fannie Mae/Freddie Mac/GNMA)
Types of loans are restricted – based on size, credit quality (conforming loans)
Don’t include JUMBO loans
TBA Trading
17
TBA Good Delivery Guidelines – GNMA I
There are industry standards in terms of what constitutes good delivery of a TBA security
The number of mortgage pools are limited to no more than three per $million
Good delivery requires minimum trade of $1 million
The seller must notify the TBA purchaser 48 hours prior to the settlement date of the actual pools to be delivered
TBA trades require the following information
− Agency name and program description (e.g. GNMA I Single Family)
− Coupon and Maturity
− Price
− Settlement Month
− Any stipulations
TBA trades price in increments of 1/32nd or “ticks”
18
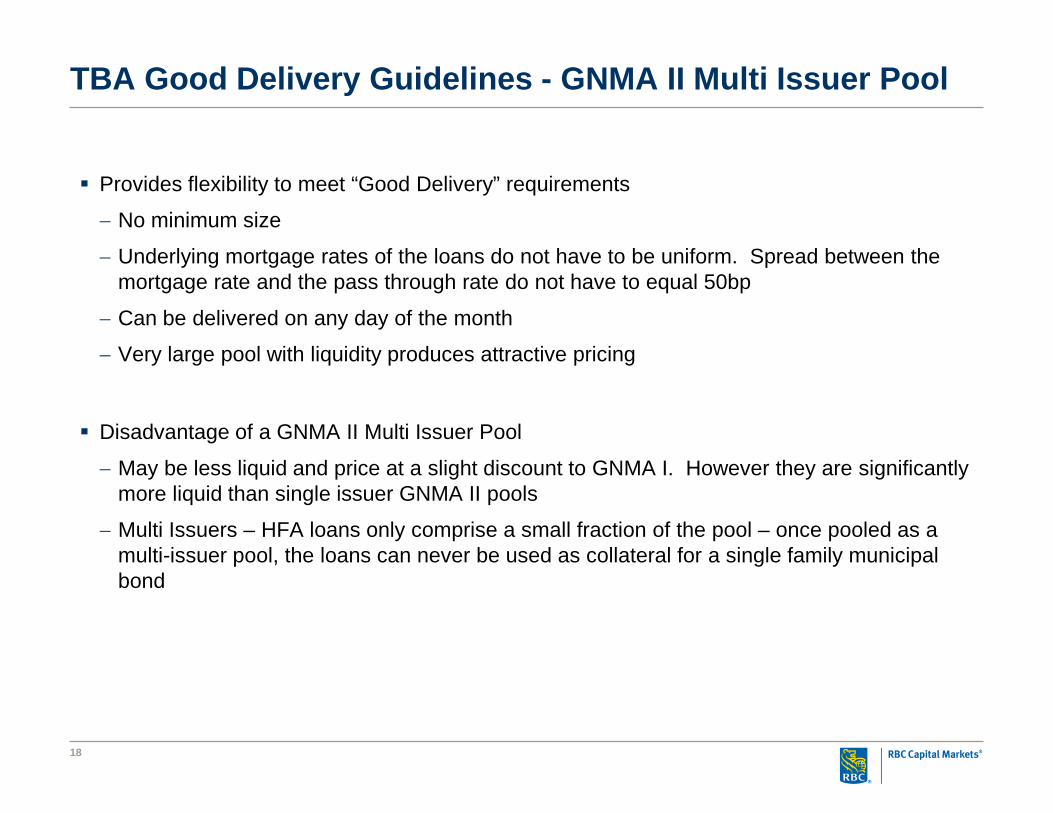
TBA Good Delivery Guidelines - GNMA II Multi Issuer Pool
Provides flexibility to meet “Good Delivery” requirements
− No minimum size
− Underlying mortgage rates of the loans do not have to be uniform. Spread between the mortgage rate and the pass through rate do not have to equal 50bp
− Can be delivered on any day of the month
− Very large pool with liquidity produces attractive pricing
Disadvantage of a GNMA II Multi Issuer Pool
− May be less liquid and price at a slight discount to GNMA I. However they are significantly more liquid than single issuer GNMA II pools
− Multi Issuers – HFA loans only comprise a small fraction of the pool – once pooled as a multi-issuer pool, the loans can never be used as collateral for a single family municipal bond
19
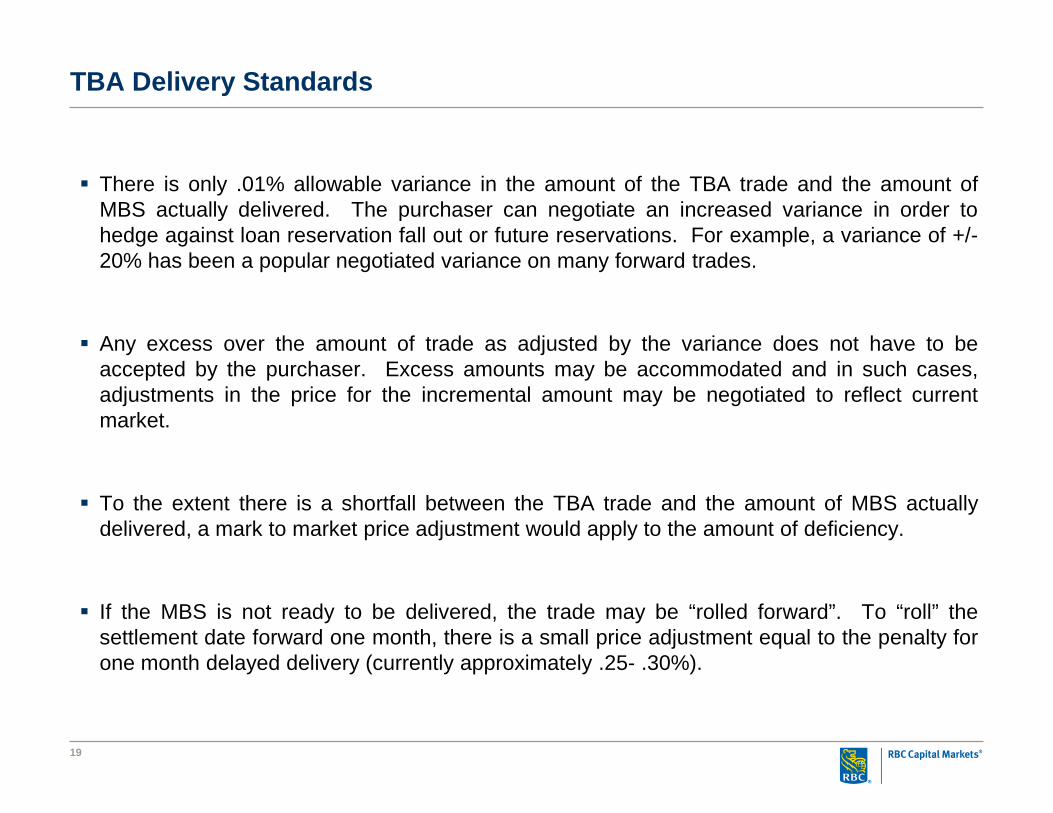
TBA Delivery Standards
There is only .01% allowable variance in the amount of the TBA trade and the amount ofMBS actually delivered. The purchaser can negotiate an increased variance in order tohedge against loan reservation fall out or future reservations. For example, a variance of +/-20% has been a popular negotiated variance on many forward trades.
Any excess over the amount of trade as adjusted by the variance does not have to beaccepted by the purchaser. Excess amounts may be accommodated and in such cases,adjustments in the price for the incremental amount may be negotiated to reflect currentmarket.
To the extent there is a shortfall between the TBA trade and the amount of MBS actuallydelivered, a mark to market price adjustment would apply to the amount of deficiency.
If the MBS is not ready to be delivered, the trade may be “rolled forward”. To “roll” thesettlement date forward one month, there is a small price adjustment equal to the penalty forone month delayed delivery (currently approximately .25- .30%).
20
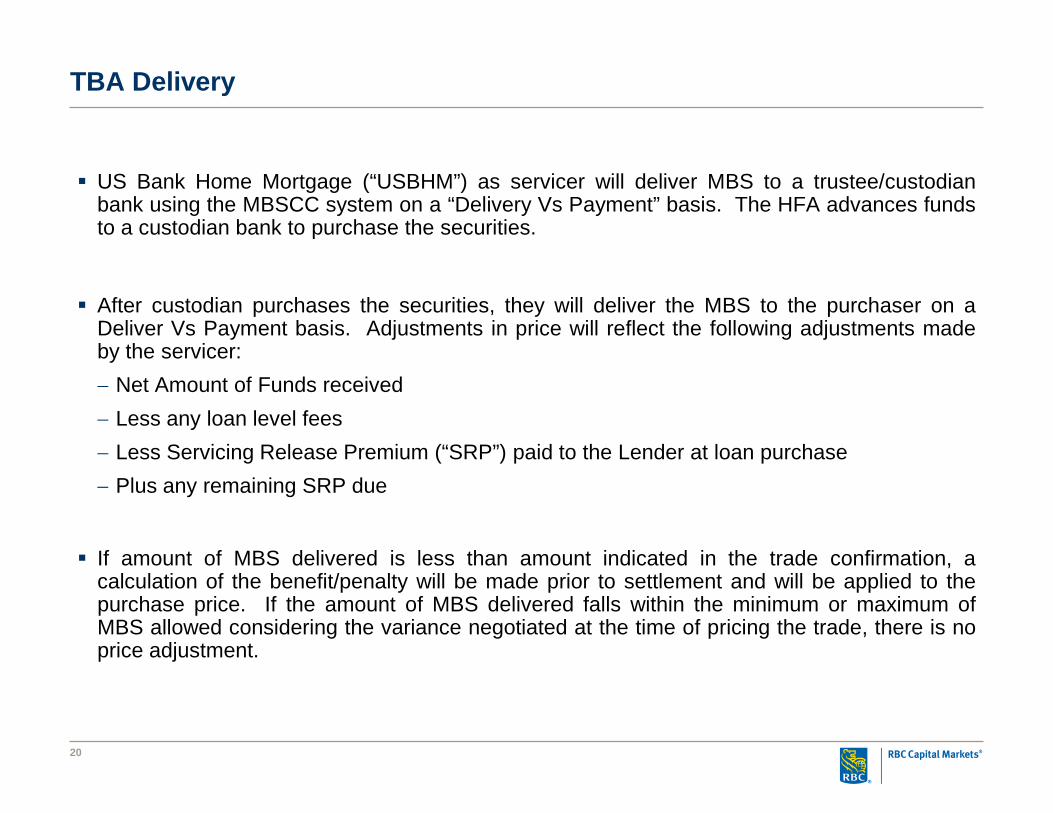
TBA Delivery
US Bank Home Mortgage (“USBHM”) as servicer will deliver MBS to a trustee/custodianbank using the MBSCC system on a “Delivery Vs Payment” basis. The HFA advances fundsto a custodian bank to purchase the securities.
After custodian purchases the securities, they will deliver the MBS to the purchaser on aDeliver Vs Payment basis. Adjustments in price will reflect the following adjustments madeby the servicer:− Net Amount of Funds received− Less any loan level fees− Less Servicing Release Premium (“SRP”) paid to the Lender at loan purchase− Plus any remaining SRP due
If amount of MBS delivered is less than amount indicated in the trade confirmation, acalculation of the benefit/penalty will be made prior to settlement and will be applied to thepurchase price. If the amount of MBS delivered falls within the minimum or maximum ofMBS allowed considering the variance negotiated at the time of pricing the trade, there is noprice adjustment.
Florida ALHFASection 2: Managing Interest Rate and Pipeline Risk
22
1.50%
1.75%
2.00%
2.25%
2.50%
2.75%
3.00%
3.25%
3.50%
3.75%
10/12 11/12 12/12 01/13 02/13 03/13 04/13 05/13 06/13 07/13 08/13
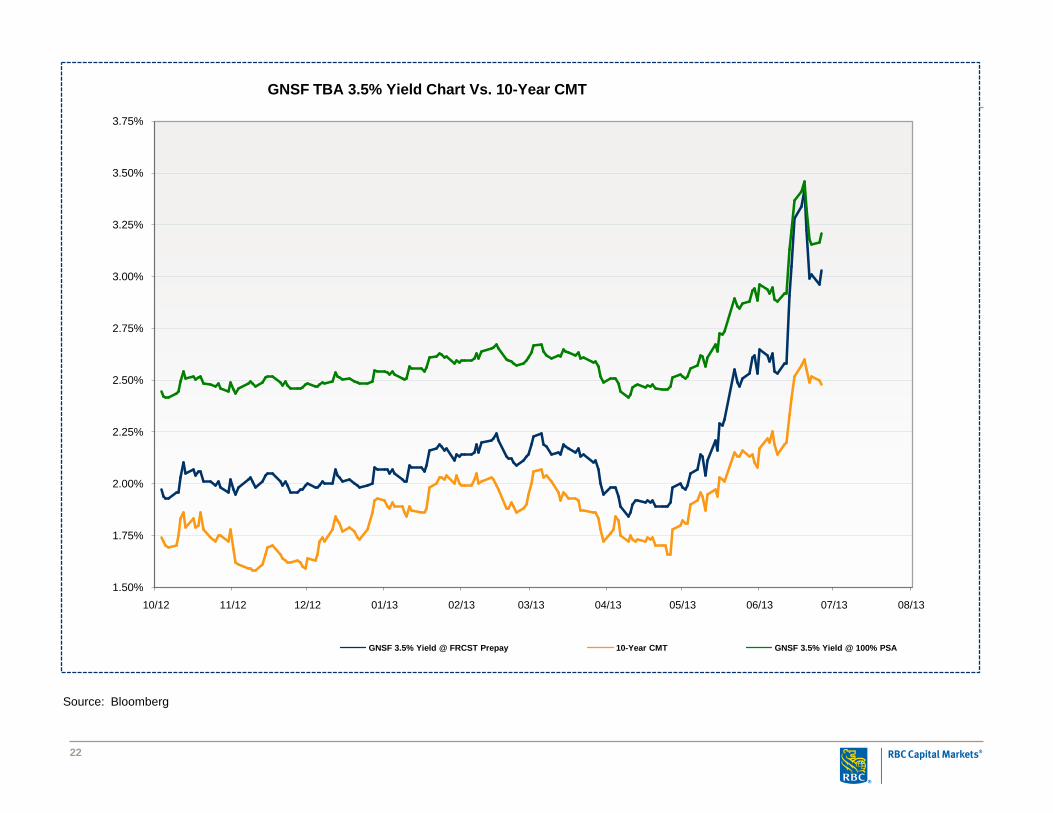
GNSF TBA 3.5% Yield Chart Vs. 10-Year CMT
GNSF 3.5% Yield @ FRCST Prepay 10-Year CMT GNSF 3.5% Yield @ 100% PSA
Source: Bloomberg
23
1.50%
1.75%
2.00%
2.25%
2.50%
2.75%
3.00%
3.25%
3.50%
3.75%
10/12 11/12 12/12 01/13 02/13 03/13 04/13 05/13 06/13 07/13 08/13
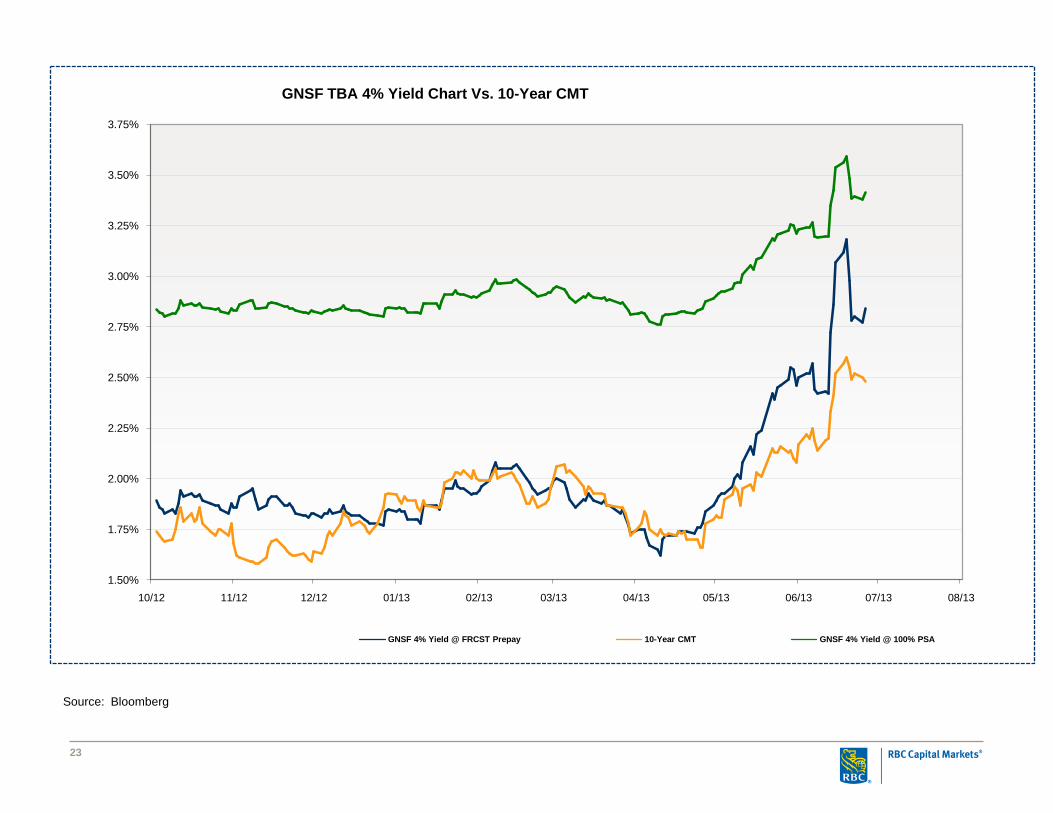
GNSF TBA 4% Yield Chart Vs. 10-Year CMT
GNSF 4% Yield @ FRCST Prepay 10-Year CMT GNSF 4% Yield @ 100% PSA
Source: Bloomberg
24
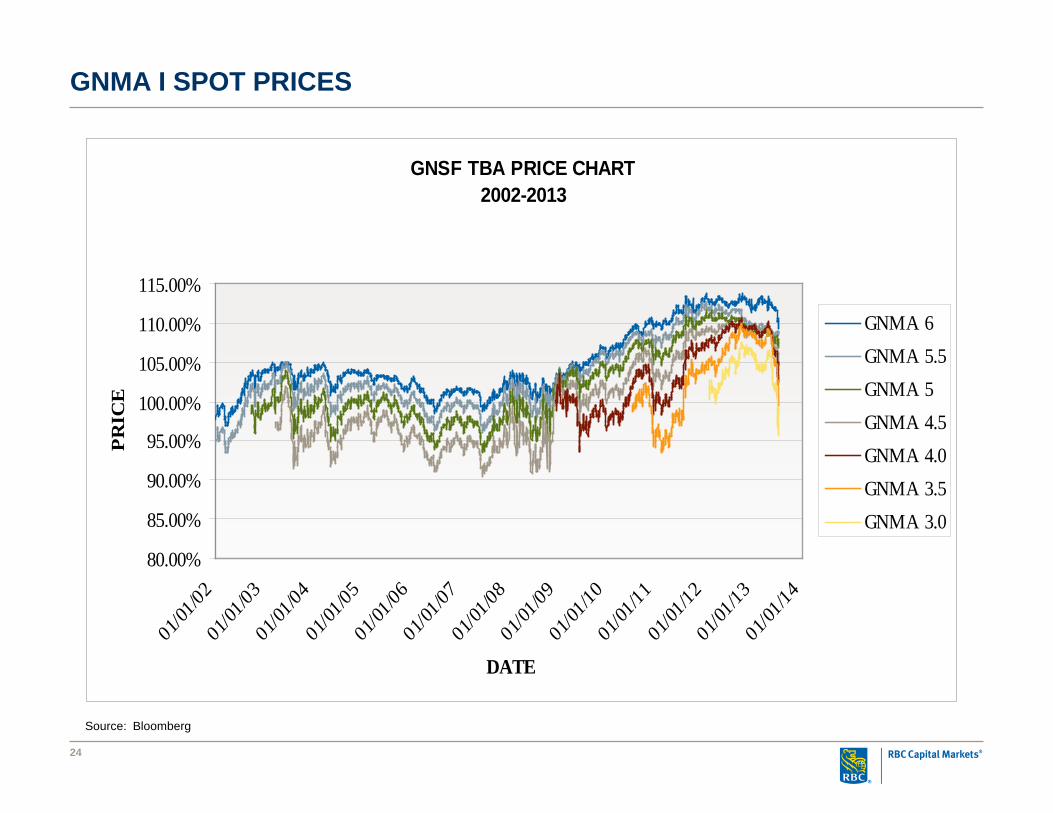
GNMA I SPOT PRICES
GNSF TBA PRICE CHART2002-2013
80.00%
85.00%
90.00%
95.00%
100.00%
105.00%
110.00%
115.00%
01/01
/02
01/01
/03
01/01
/04
01/01
/05
01/01
/06
01/01
/07
01/01
/08
01/01
/09
01/01
/10
01/01
/11
01/01
/12
01/01
/13
01/01
/14
DATE
PR
ICE
GNMA 6GNMA 5.5GNMA 5GNMA 4.5GNMA 4.0GNMA 3.5GNMA 3.0
Source: Bloomberg
25
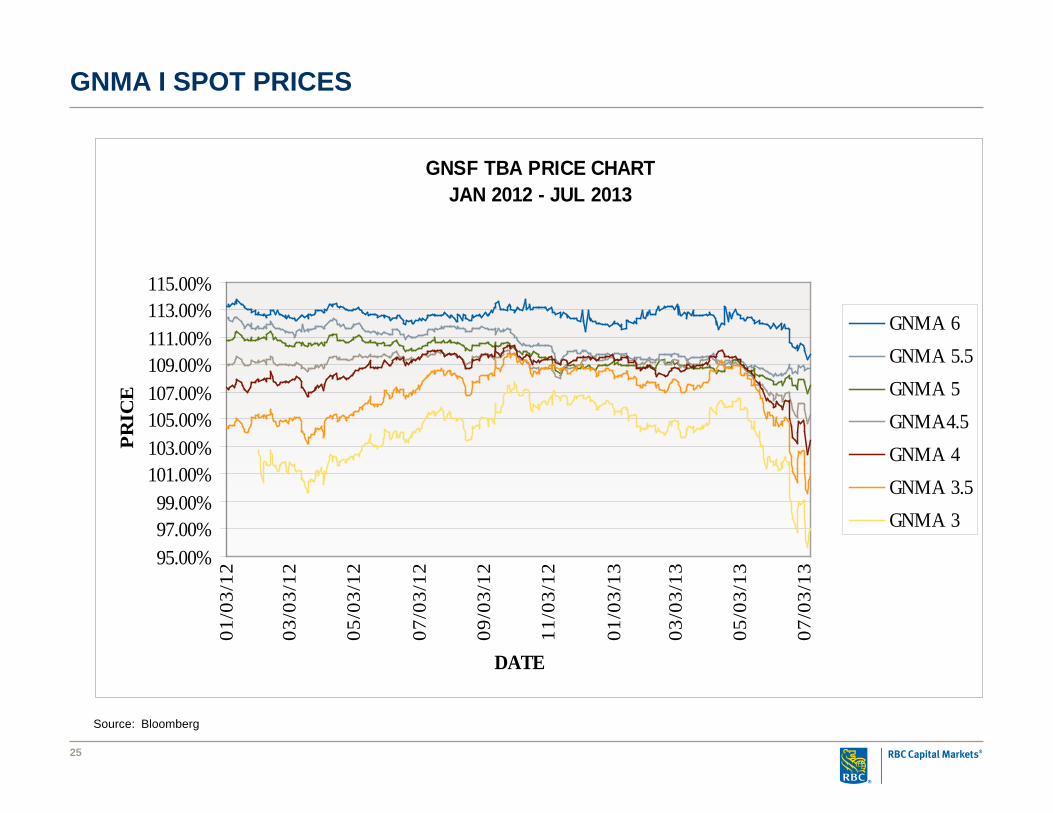
GNMA I SPOT PRICES
GNSF TBA PRICE CHARTJAN 2012 - JUL 2013
95.00%97.00%99.00%
101.00%103.00%105.00%107.00%109.00%111.00%113.00%115.00%
01/0
3/12
03/0
3/12
05/0
3/12
07/0
3/12
09/0
3/12
11/0
3/12
01/0
3/13
03/0
3/13
05/0
3/13
07/0
3/13
DATE
PRIC
E
GNMA 6GNMA 5.5GNMA 5GNMA4.5GNMA 4GNMA 3.5GNMA 3
Source: Bloomberg
26
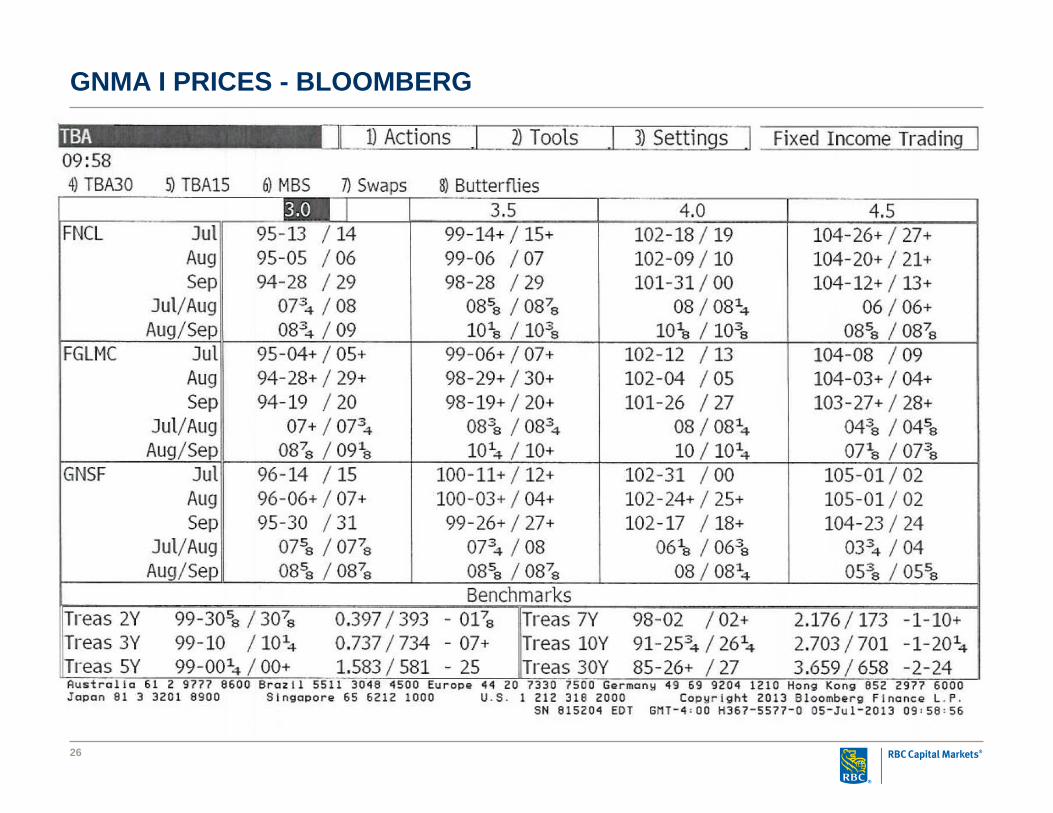
GNMA I PRICES - BLOOMBERG
27
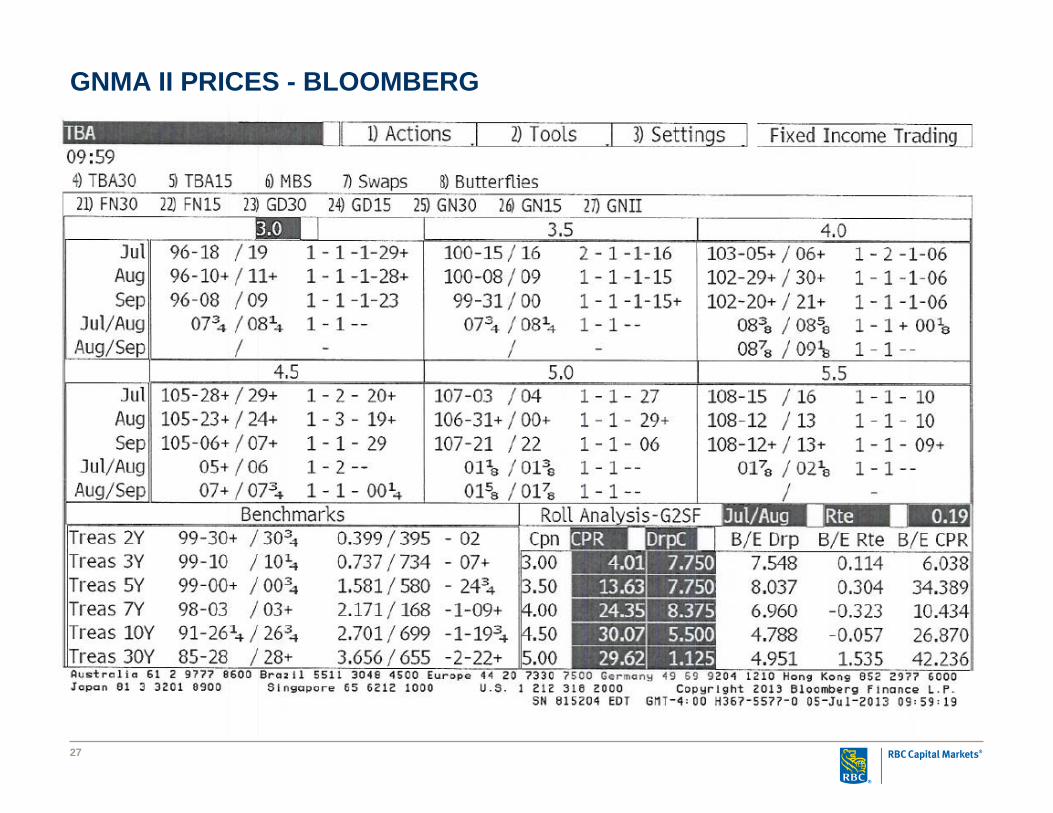
GNMA II PRICES - BLOOMBERG
Managing Interest Rate Risk
The Housing Finance Authority incurs interest rate between the time a loan is reserved and sold. How can this interest rate risk be managed?
Monitor the pipeline on a daily basis and determine when there are sufficient loans to execute a forward sale of GNMAs
Monitor mortgage rates and prices on a daily basis to ensure there is profit/cushion in the value of current reservations. If not – raise the current mortgage lending rate.
Work with lenders to expedite processing of reservations and loan closing/delivery. Issuers have reduced the time lenders have to process loans from 100+ days to 60-70 days
Impose penalties on lenders that do not deliver loans timely – currently there is a $375 penalty due to the issuer if the lender does not deliver timely
Reserve net assets to hold GNMAs for an interim period
28
29
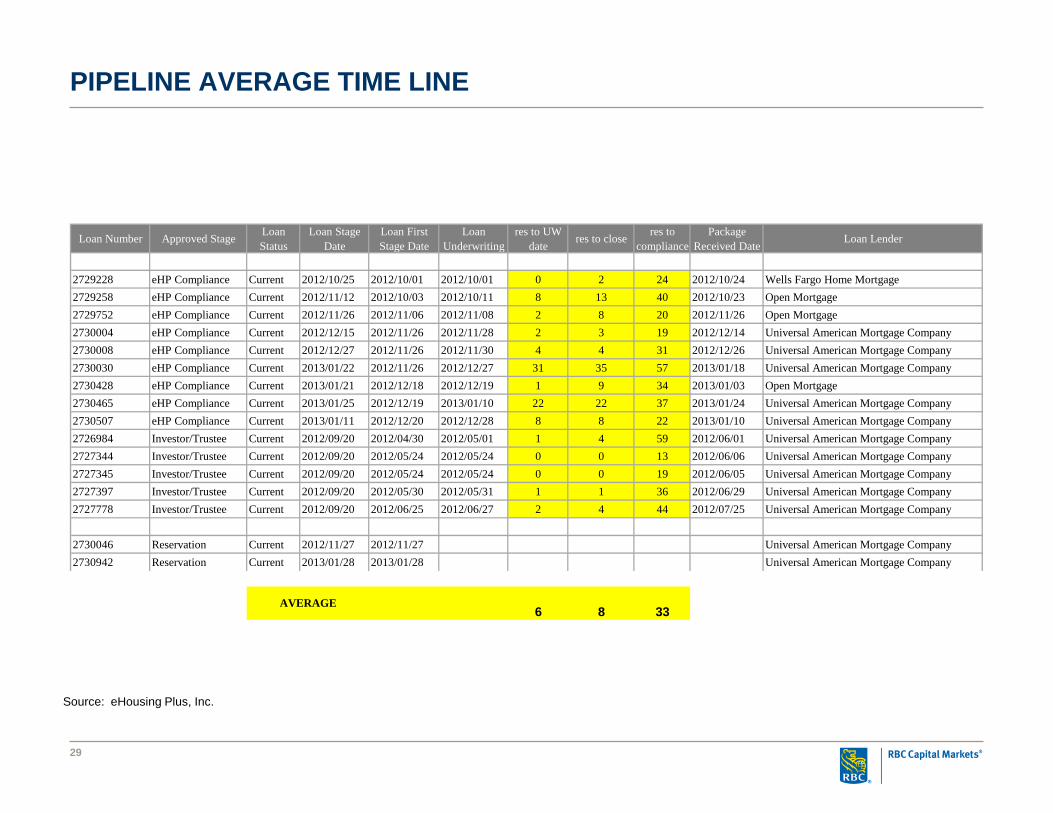
PIPELINE AVERAGE TIME LINE
Loan Number Approved Stage Loan Status
Loan Stage Date
Loan First Stage Date
Loan Underwriting
res to UW date res to close res to
compliance Package
Received Date Loan Lender
2729228 eHP Compliance Current 2012/10/25 2012/10/01 2012/10/01 0 2 24 2012/10/24 Wells Fargo Home Mortgage2729258 eHP Compliance Current 2012/11/12 2012/10/03 2012/10/11 8 13 40 2012/10/23 Open Mortgage2729752 eHP Compliance Current 2012/11/26 2012/11/06 2012/11/08 2 8 20 2012/11/26 Open Mortgage2730004 eHP Compliance Current 2012/12/15 2012/11/26 2012/11/28 2 3 19 2012/12/14 Universal American Mortgage Company2730008 eHP Compliance Current 2012/12/27 2012/11/26 2012/11/30 4 4 31 2012/12/26 Universal American Mortgage Company2730030 eHP Compliance Current 2013/01/22 2012/11/26 2012/12/27 31 35 57 2013/01/18 Universal American Mortgage Company2730428 eHP Compliance Current 2013/01/21 2012/12/18 2012/12/19 1 9 34 2013/01/03 Open Mortgage2730465 eHP Compliance Current 2013/01/25 2012/12/19 2013/01/10 22 22 37 2013/01/24 Universal American Mortgage Company2730507 eHP Compliance Current 2013/01/11 2012/12/20 2012/12/28 8 8 22 2013/01/10 Universal American Mortgage Company2726984 Investor/Trustee Current 2012/09/20 2012/04/30 2012/05/01 1 4 59 2012/06/01 Universal American Mortgage Company2727344 Investor/Trustee Current 2012/09/20 2012/05/24 2012/05/24 0 0 13 2012/06/06 Universal American Mortgage Company2727345 Investor/Trustee Current 2012/09/20 2012/05/24 2012/05/24 0 0 19 2012/06/05 Universal American Mortgage Company2727397 Investor/Trustee Current 2012/09/20 2012/05/30 2012/05/31 1 1 36 2012/06/29 Universal American Mortgage Company2727778 Investor/Trustee Current 2012/09/20 2012/06/25 2012/06/27 2 4 44 2012/07/25 Universal American Mortgage Company
2730046 Reservation Current 2012/11/27 2012/11/27 Universal American Mortgage Company2730942 Reservation Current 2013/01/28 2013/01/28 Universal American Mortgage Company
6 8 33AVERAGE
Source: eHousing Plus, Inc.
Managing Pipeline/ Delivery Risk
When a HFA executes a forward trade, there is an agreement to deliver a specific GNMA on a date in the future. What options are available if loans are not ready to be delivered or “fall out”?
The HFA can execute a trade with delivery variance. The specified amount to be delivered can exceed or fall short of the agreed upon par amount by a specific percentage (such as +/- 20%). In this case a $1MM trade could be filled by delivering $800,000 or $1,200,000.
If loans are moving more slowly than will allow a timely delivery, the trade may be “rolled forward”. To “roll” the settlement date forward one month, there is a small price adjustment equal to the penalty for one month delayed delivery (currently approximately .25- .30%).
If there are more loans available to be pooled into a GNMA than specified in the trade, these GNMAs may be sold in the “spot” market.
If there are fewer loans to deliver than specified in the trade (and the variance is exceeded), the HFA can pay/receive a mark to market price adjustment. If rates have increased since the trade, the HFA will receive funds and if rates have fallen, the HFA will owe a penalty equal to the change in prices.
30
Conclusion
Numerous changes have been required to modify loan programs using tax exempt bonds as a funding source to a program funded by MBS sales
Tax exempt bonds may become more efficient in the future if − Rates increase− Tax rates increase− Treasury reduces or ceases asset/MBS purchases
Changes made to lending programs to accommodate TBA will benefit issuers over the long run - even if issuers shift back to bonds:− Shorter lender processing time will reduce interest rate risk and negative
arbitrage expense− Use of both the conventional MBS market and tax exempt bonds can allow
issuers to offer continuous lending programs
31