flood impact assessment report maryfields development site ... · flood impact assessment report...
TRANSCRIPT

1
JMD ref 12100
Issue D 19-08-2015
FLOOD IMPACT ASSESSMENT REPORT
MARYFIELDS DEVELOPMENT SITE
192 NARELLAN ROAD, CAMPBELLTOWN
PREPARED BY JMD
DEVELOPMENT CONSULTANTS
Consultants in Surveying, Engineering, Water & Sewer Design &
Project Management
32 Iolanthe St, Campbelltown NSW 2560
PH (02) 4625 5055
Email: [email protected]
FOR FRANCISCAN FRIARS
DATE March 2015

2
JMD ref 12100
Issue D 19-08-2015
Contents
1. Introduction .................................................................................................................................... 4
2. Previous Studies .............................................................................................................................. 5
a) Rust PPK Report .......................................................................................................................... 5
b) Lyall & Associates ........................................................................................................................ 5
3. Narellan Road Upgrade Works........................................................................................................ 5
4. Site Hydrology & Hydraulics ............................................................................................................ 6
a. Hydrology .................................................................................................................................... 6
b. Impact of Climate Change ........................................................................................................... 7
c. Hydraulics .................................................................................................................................... 8
5. Impacts on Stormwater Flows from Proposed development ......................................................... 8
6. NSW Office of Water Riparian Zones ............................................................................................ 12
7. Flood Impact Assessment ............................................................................................................. 13
a. South Arm station 850 to station 645 ....................................................................................... 13
b. South Arm station 645 to station 430 ....................................................................................... 14
c. South Arm station 430 to station 274 ....................................................................................... 14
d. North Arm Station 560 to station 170 ...................................................................................... 15
e. South Arm Station 274 to station 0 .......................................................................................... 15
8. Overall Flood Impact Assessment ................................................................................................. 15
9. Water Quality Issues ..................................................................................................................... 16
10. Conclusion ................................................................................................................................. 18
Appendix A ............................................................................................................................................ 19
A1 Notes and Assumptions adopted for site hydrology & hydraulic models ................................... 19
Catchment S1 ................................................................................................................................ 19
Catchment S2 ................................................................................................................................ 19
Catchment S3 ................................................................................................................................ 20
Catchment S4 ................................................................................................................................ 20
Catchment N1 ............................................................................................................................... 20
Catchment N2 ............................................................................................................................... 21
Catchment N3 ............................................................................................................................... 21
Catchment N4 ............................................................................................................................... 21
Catchment N5 ............................................................................................................................... 22
Catchments S5 & N6 ..................................................................................................................... 22

3
JMD ref 12100
Issue D 19-08-2015
Catchment S6 ................................................................................................................................ 22
Links .............................................................................................................................................. 22
A2 External Catchments .................................................................................................................... 24
Catchment E1 ................................................................................................................................ 24
Catchment E2 ................................................................................................................................ 24
Catchment E3 ................................................................................................................................ 24
A3 Comparison of JMD XP-Rafts outputs.......................................................................................... 25
JMD results .................................................................................................................................... 25
Lyall Results ................................................................................................................................... 26
Rust PPK Results ............................................................................................................................ 27
Appendix B ............................................................................................................................................ 28
Catchment Plan ................................................................................................................................. 28
Appendix C ............................................................................................................................................ 29
Tributary 1 Water Surface Profiles for existing conditions ............................................................... 29
5 Year Event – Existing Conditions ................................................................................................ 29
10 Year Event – Existing Conditions .............................................................................................. 31
20 Year Event – Existing Conditions .............................................................................................. 32
50 Year Event – Existing Conditions .............................................................................................. 33
100 Year Event – Existing Conditions ............................................................................................ 34
PMF Event ..................................................................................................................................... 35

4
JMD ref 12100
Issue D 19-08-2015
1. Introduction JMD have been engaged by the Franciscan Friars to prepare a flood impact assessment to assist
Council and other authorities in the consideration of the proposed future development of the
Maryfields Development Site.
The Maryfields Site which measures some 43.4ha in area is located on the north-east corner of the
intersection of Narellan Road with the Hume Motorway and incorporates the following parcels:-
Lot 2 in DP569795
Lot12 in DP829093
Lot 13 in DP1034409
Lots 11 to 13 in DP1198323.
The Maryfields Site is bounded in the northwest by the Hume Motorway, in the northeast by existing
residential land known as Blair Athol, in the southeast by bushland understood to be Council reserve
and in the southwest by Narellan Road.
The site is affected by two main creek systems both originating on the eastern slopes of Kenny Hill to
the west of the Hume Motorway which join at a large dam located in the southeast corner of the site
to become a creek system which is understood to be known as Monastery Creek but has been referred
to a Tributary 1 of Bow Bowing Creek in a previous drainage assessment prepared by Lyall & Associates
for RMS. Hereinafter the creek is referred to as Tributary 1. Tributary 1 discharges across the south-
east boundary of the site into the Council reserve land known as Lots 841 and 843 in DP1024090 which
is a natural system for about 450m and then becomes a formed grass lined flow path with a low flow
pipe system.
The southern arm of Tributary 1 enters the Maryfields Site via an existing 1200mm dia stormwater
pipe at the southwest corner of the site at a level of approximately RL100m AHD and falls to
approximately RL84.2m AHD at the main dam with a channel length of some 867m.
The northern arm of Tributary 1 enters the Maryfields Site mid-way along the western boundary of
the site and is fed by two pipes constructed under the Hume Motorway. The southern pipe is 900mm
in diameter and the northern pipe 1200mm in diameter. The two branches of the northern arm meet
at approximately the western boundary of the Maryfields Site at a level of approximately 94.6m AHD
and then falls to RL84.2 at the main dam with a channel length of some 671m.
This assessment investigates the flood risk in the creek systems within the extent of the Maryfields
Site under current conditions and assuming the site is developed in accordance with the planning
proposal that has been ‘gateway determined’ by NSW Planning & Environment in December 2014 and
subsequent adjustments thereto as agreed between the proponent and Campbelltown City Council
following further investigative reporting and consultation. This assessment has been completed based
on the assumption that there will be no further development on the land downstream of the
Maryfields Site as identified above.

5
JMD ref 12100
Issue D 19-08-2015
2. Previous Studies It is understood from recent discussions with Council’s Drainage Engineer that to date there has not
been a full flood risk assessment for the Maryfields Site. JMD have been provided with copies of
reports by Rust PPK circa 1994 and Lyall & Associates dated May 2013 which review aspects of
drainage relating to the Maryfields Site.
a) Rust PPK Report
The Rust PPK report is titled “Investigation – Stormwater Drainage Land Owned by Association of
Franciscan Orders of Friars Minor Narellan Road, Campbelltown” and is dated 2 June 1994 (Ref No.
65F018A). This report has assessed the stormwater flows through the site using the Rational Method
as documented in Australian Rainfall and Runoff.
The report documents little in the way of hydrological data. In the introduction, the report indicates
that the site accepts water from the land on the western side of the Hume Motorway and again at
section 3 indicates that the estimated flows include flows off the catchments to the west of the Hume
Motorway but then states that the estimated flow off the entire site using the rational method is
9.4m³/s. This flow has been reviewed by JMD as detailed in Appendix A and is considered to be an
estimate of the peak flow off the Maryfields Site alone rather than for the whole of the catchment.
The RUST PPK report assumes that the whole of the site was to be developed for low density
residential with roads to be located in the major creek lines. The total flow off the undeveloped site
was estimated at 9.4m³/s and under fully developed conditions 17.8m³/s. The report recommended
the use of the large dam for detention storage but no specific details of the basin configuration are
provided. Due to the lack of detail in the report and inconsistency between the assumed development
pattern and the current proposal, this report is not considered further.
b) Lyall & Associates
Lyall & Associates prepared a report on existing and proposed stormwater systems for Narellan Road
upgrade works in May 2013 (Ref NRU_r3.0_v1_Report.doc). This report does not consider the
drainage system for the whole of the Maryfields Site but does review drainage systems near Narellan
Road and describes the changes in the hydrologic patterns which will result from the upgrade works.
The Catchment C11 in the Lyall Report is consistent with the JMD Catchment S1. The results by Lyall
and JMD are reviewed in Appendix 1.
The details in the Lyall Report relating to the extent of the Narellan Road Upgrade have been used to
estimate the impact on flows in the site arising from the upgrade works.
3. Narellan Road Upgrade Works The Lyall Report was used by JMD to estimate the changes in catchments resulting from the upgrade
works currently underway on Narellan Road. These works will impact on JMD Catchments S1, S5RD as
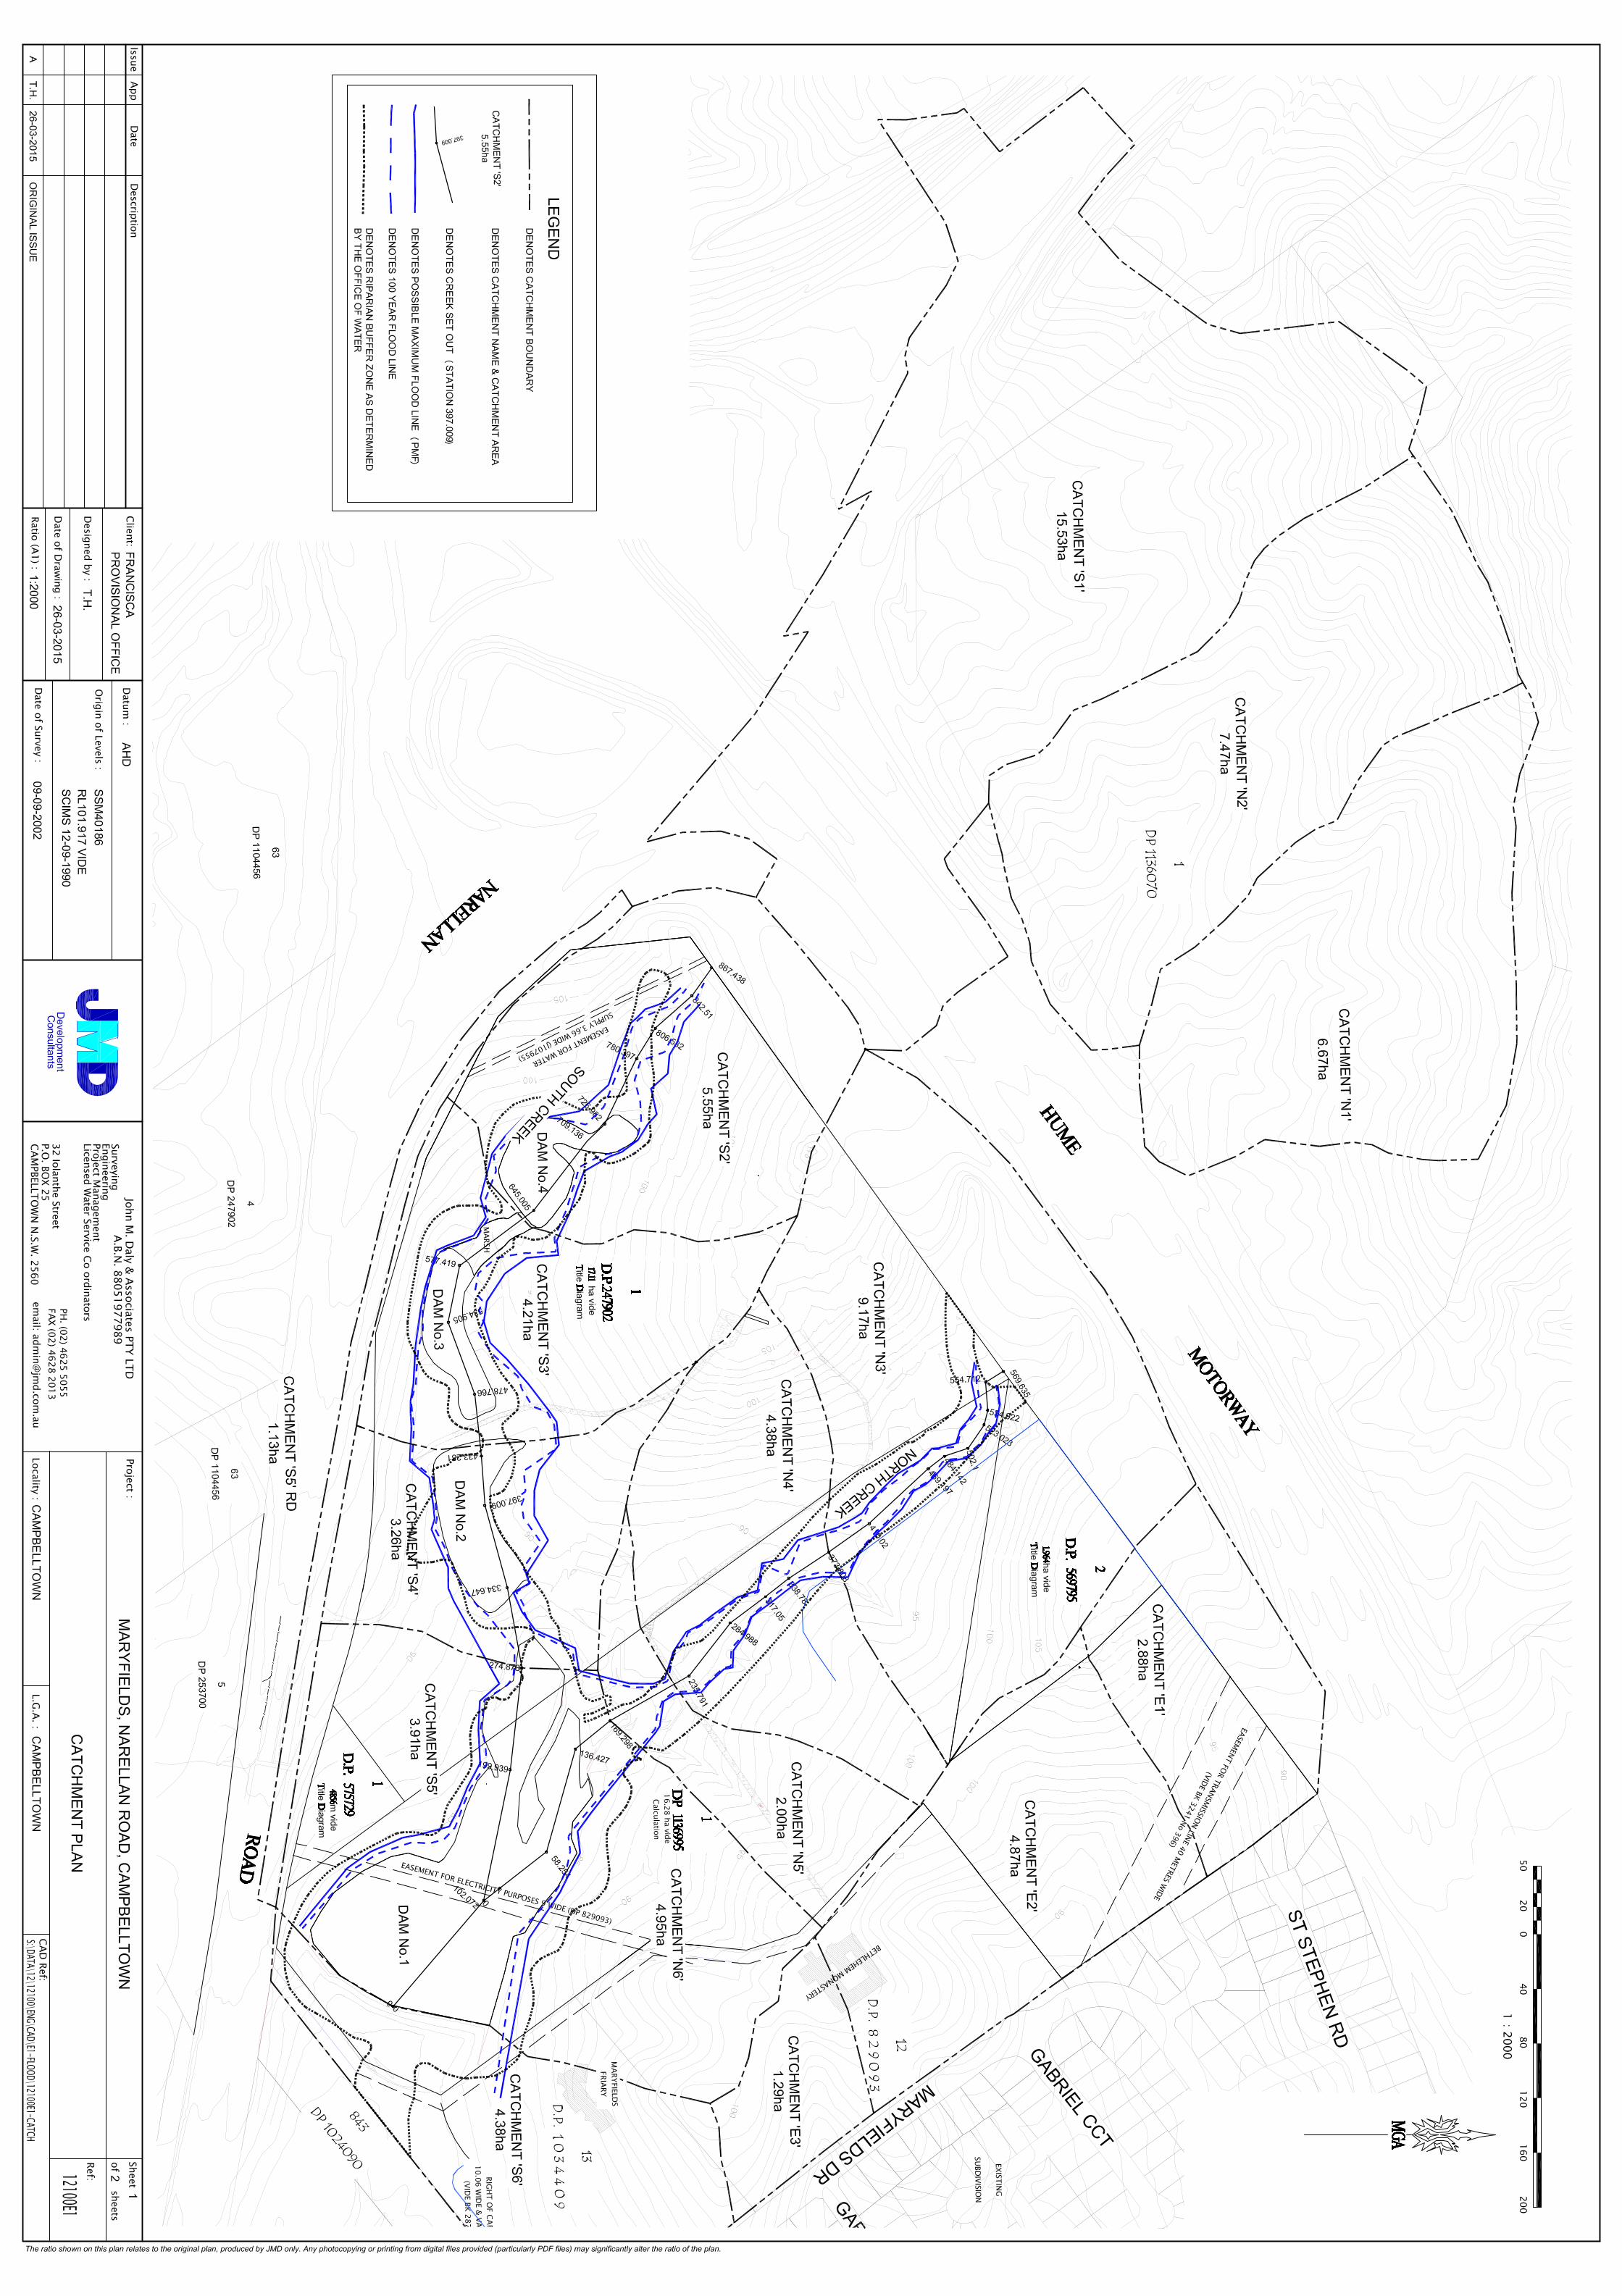
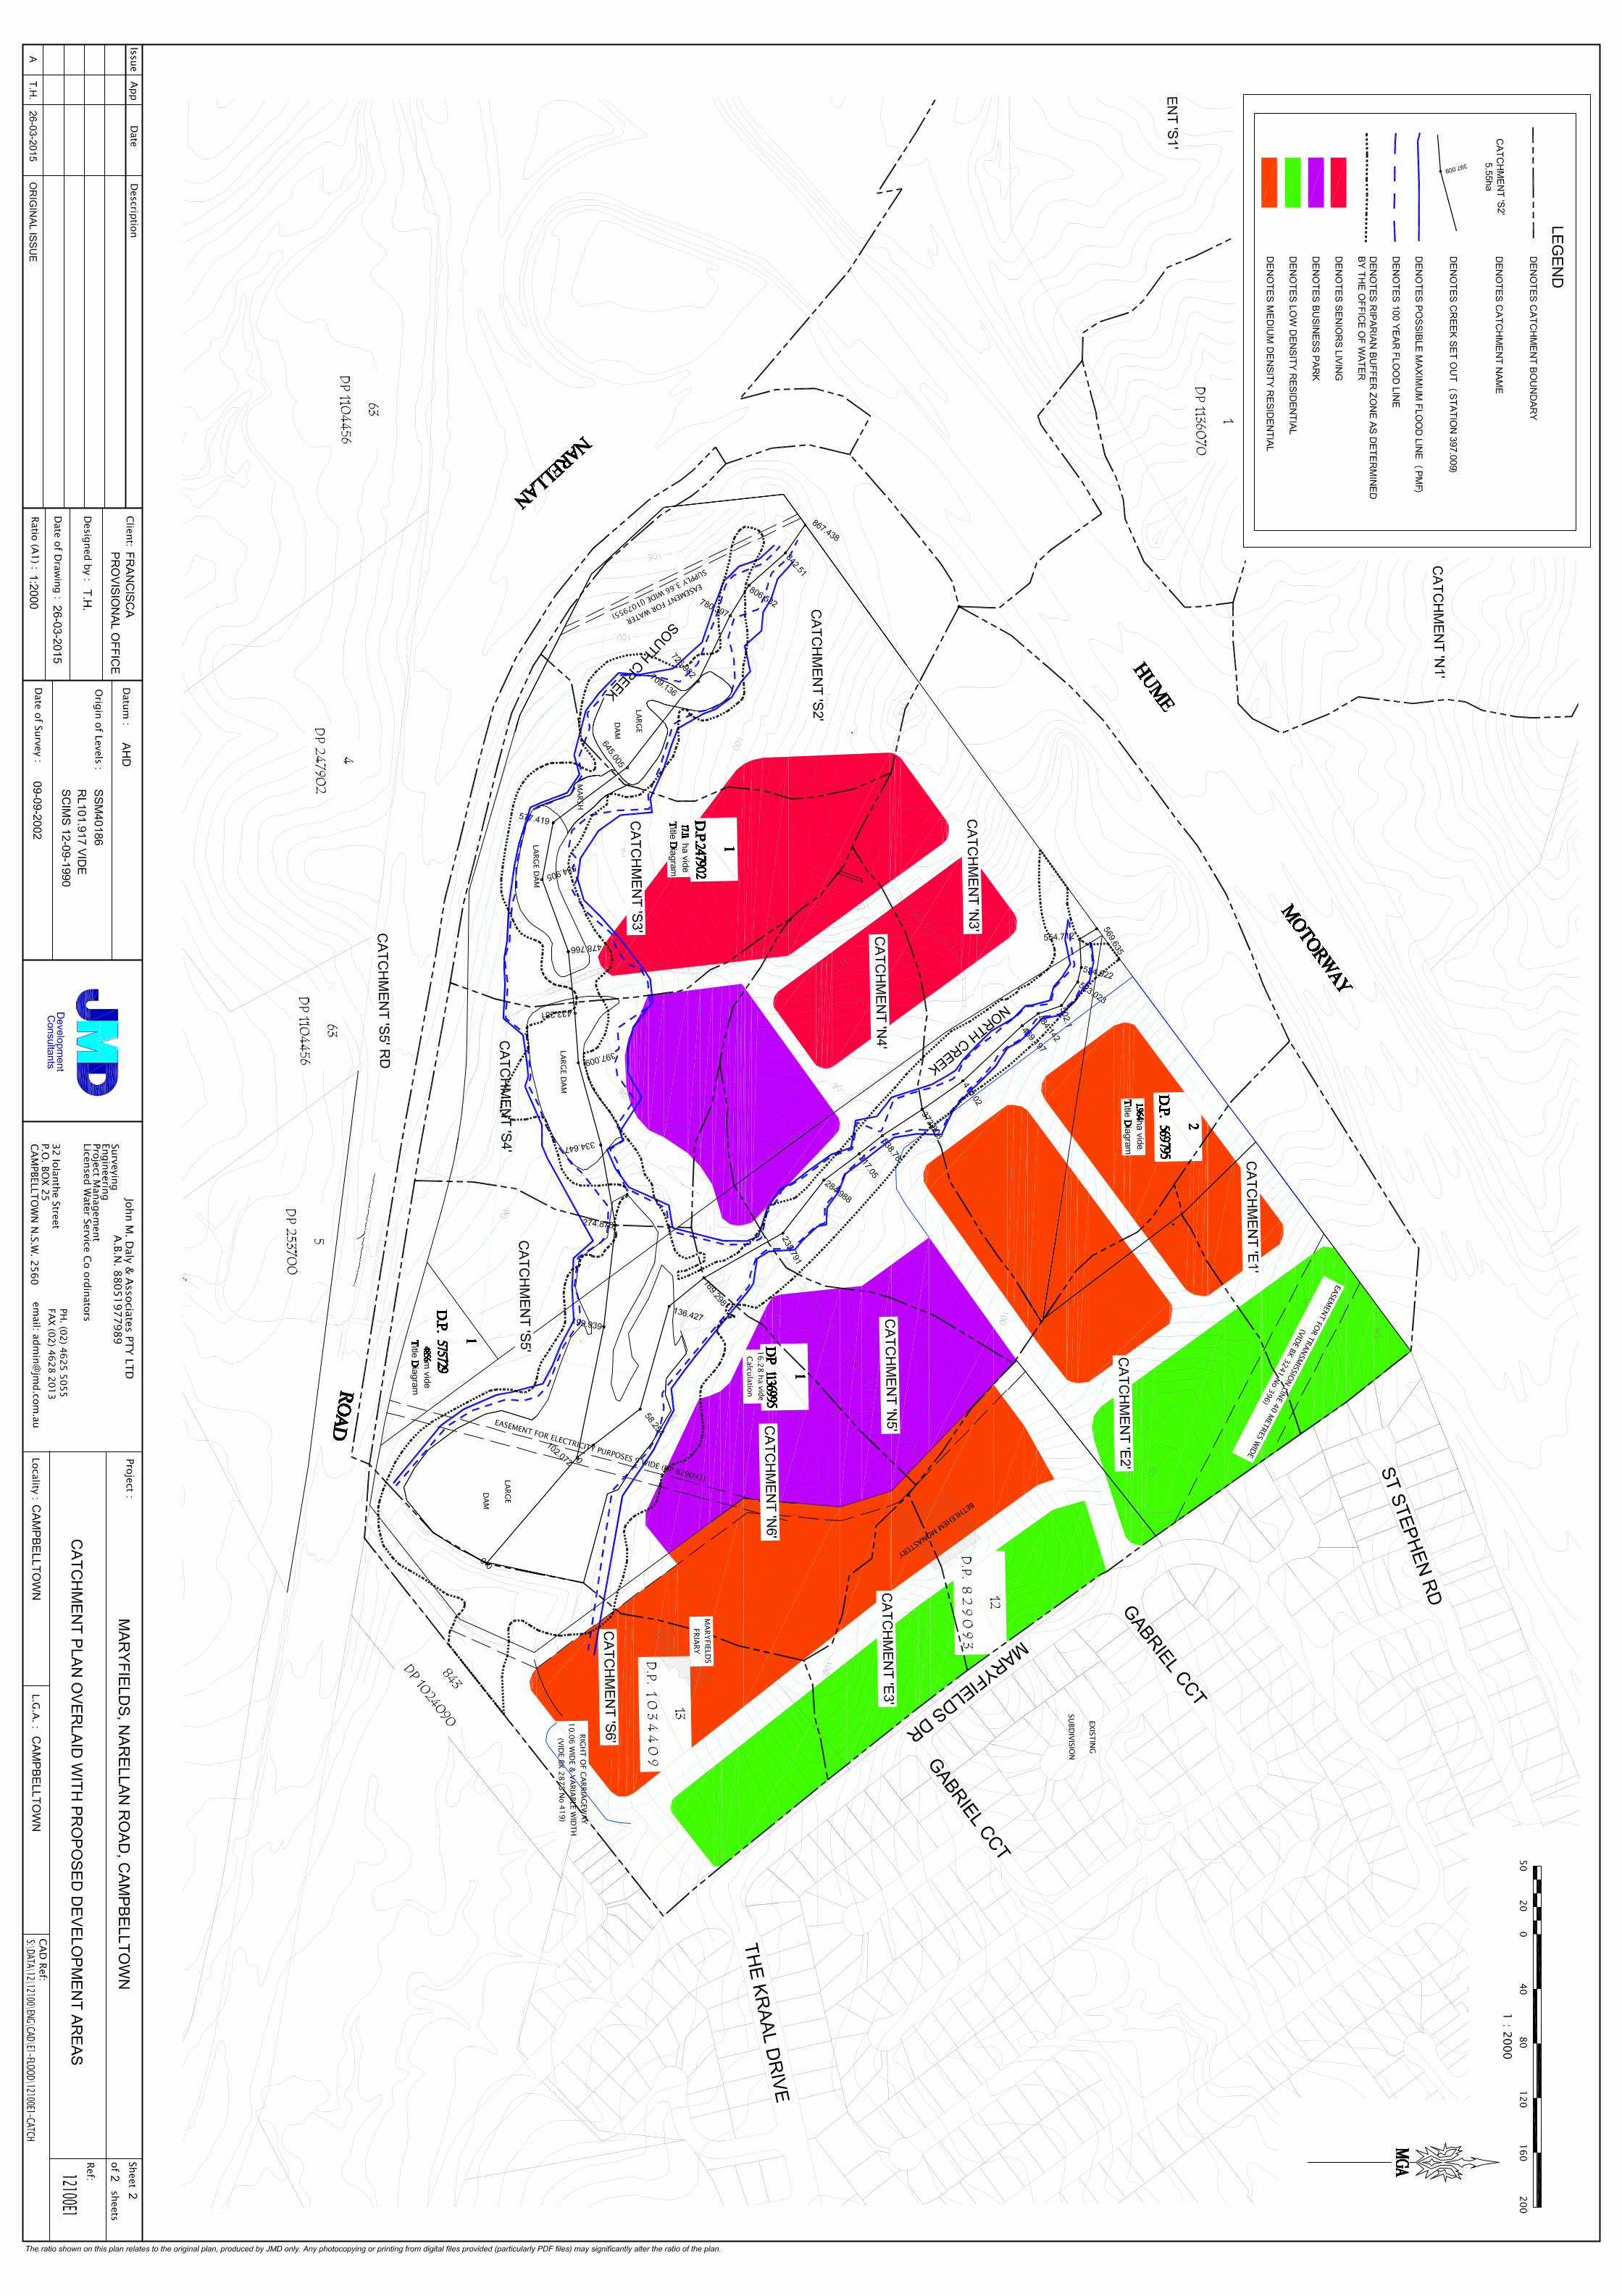
detailed in the JMD Catchment Plan (Ref 12100E1 sheet 1 of 1 – refer Appendix B). The extent of the
Upgrade works and the impact on flows through the site is detailed in Appendix A and was found to
be of negligible impact.

6
JMD ref 12100
Issue D 19-08-2015
4. Site Hydrology & Hydraulics
a. Hydrology
The nature of the site under current conditions has been examined by JMD. As described in Section1
of the report, the site is affected by two creeks which join at a large farm dam to form Tributary 1 of
Bow Bowing Creek. For the purposes of description of the creeks in this report, the northern arm of
Tributary 1 has been denoted North and the southern arm as South.
There are three catchments along the northern boundary of the site which do not fall to the Tributary
No.1. These discharge to the existing Blair Athol residential development to the north.
A portion of land, approximately 29.67ha in area located on the western side of the Hume Motorway
falls towards the Motorway and the subject site. The Motorway itself generally grades away to the
north and other than a minor part of the Narellan Road southbound off ramp, does not drain tho the
site. The land to the west of the Hume Motorway has been divided into three catchments interpreted
from topographic data obtained from NSW Dept of Lands. These Catchments are denoted S1, N1 and
N2 on the Catchment Plan attached at Appendix B. Catchment S1 drains to the site via a 1200mm
diameter pipe approximately 315m long passing under the Hume Motorway. Catchment N1 drains to
the site via a 900mm diameter pipe approximately 167m long passing under the Hume Motorway.
Catchment N2 drains to the site via a 1200mm diameter pipe approximately 155m long passing under
the Hume Motorway. The outlets for each of these catchments act as detention systems with flows in
excess of the piped capacity being withheld in depressions formed on the western side of the Hume
Motorway by the raise nature of the road embankment.
The hydrology of the site catchments has been modelled using the XP-Rafts computer program. This
program estimates the flows off catchments using data inputs to calculate unit hydrographs. The flows
off each catchment are distributed down the system using link data which simulates a typical creek
section with link lengths and grades interpreted from the site survey data. The velocity data from the
XP-Rafts results were compared to the subsequent hydraulic model flow results to ensure that the
links in the XP-Rafts model were providing realistic results. The velocities from both models were
found to be similar and so the linkage in the XP-Rafts model were considered to be reasonable for the
assessment.
The XP-Rafts nodes for the three catchments located to the west of the Hume Motorway were
interrogated for depth of pondage as overflows from Node N2 are diverted to Node N1 and those
from Node N1 to the north out of the system by the Hume Motorway Embankment. The volume of
storage in the depressions was estimated from the available topographic data and Nodes S1, N1 and
N2 were modelled in the XP-Rafts file as detention basins (refer Appendix A for details). The maximum
capacity of the pipe outlets was modelled using the orifice equation assuming free outfall at the
downstream end (verified as correct later in the hydraulic model). Nodes N1 and N2 were found to
have insufficient capacity for the catchment flows in all storm events. This limitation was modelled in
the Xp-Rafts file by the inclusion of diversion nodes and links with the bypass thresholds for the
diversion links being set at the inlet capacity of the pipe assuming the depth of water in the storage
was at Hume Motorway level. Overflows from Node N2 divert to Node N1 and those from Node N1
divert to the north out of the system. This has been included in the XP-Rafts model as dummy Node
“Out”.
The estimated flows through the site under current conditions are detailed in Appendix A and
repeated below in Table 4.1.

7
JMD ref 12100
Issue D 19-08-2015
Table 4.1 – Summary of existing stormwater flows through Maryfields Site
Catchment Peak Flow for Storm Event Average Recurrence Interval (m³)
5 10 20 50 100 PMF
S1 2.17 2.46 2.87 3.16/3.17 3.48
S2 2.92/2.93 3.33/3.34 3.92/3.94 4.40/4.41 4.84/4.86
11.85
22.64
S3 3.48/3.49 4.00/4.02 4.73/4.76 5.37/5.39 6.00/6.03
16.47
34.21
S4 3.91/3.92 4.51/4.53 5.37/5.40 6.13/6.17 6.90/6.93
20.05
43.41
N1 1.16 1.40 1.73 2.02 2.29 7.55
N2 1.32 1.57 1.99 2.17 2.42 8.59
N3 3.79 4.58 5.65 6.56 7.44
18.86
37.02
N4 4.43 5.35 6.61 7.71 8.73 23.69 50.3
N5 4.72 5.68 7.03 8.19 9.32
25.89
56.05
S5,S5RD+N6 9.45/9.46 11.23/11.24 13.77/13.79 16.07/16.09
18.3
/18.32
54.62
121.9
S6 9.93/9.94 11.84/11.85 14.61/14.63 17.05/17.07
19.43
/19.45 59.47 135
E1 0.58 0.7 0.86 0.98 1.10 3.58 8.90
E2 0.79 1.01 1.27 1.50 1.72 5.70 15.44
E3 0.28 0.34 0.42 0.48 0.55 1.68 4.17 The second set of figures for catchments S1 to S6 indicate the change in flows through the site as a result of the Narellan
Road upgrade works. The changes in flows resulting from these works are not considered significant.
b. Impact of Climate Change
During recent discussions with Campbelltown City Council officers, JMD have been requested to
consider the impacts of climate change on the drainage systems in the site. Impacts from climate
change are understood to be related to temperature changes. NSW OEH published a document in
November 2014 Titled “Metropolitan Sydney Climate Change Snapshot” which states that the
temperature increase long term is expected to be 1.9 degrees.
Engineers Australia have published a discussion paper “An interim Guideline for Considering Climate
Change in Rainfall and Runoff” dated November 2014 which proposes a 5% increase in rainfall
intensity per degree in temperature rise.
Based on the above references then, the XP-Rafts model has interrogated with rain fall intensities for
2 hour storm events (critical events in previous model runs) increased by 9.5% as detailed in Table 4.2
Table 4.2 – Impact of Climate Change on Rainfall Intensities
Recurrence Interval 1 2 5 10 20 50 100
Current Intensity
(2 Hour Duration) 16.3 20.9 26.8 30.2 34.7 40.6 45.0
Climate Change
Intensity (2 Hour
Duration) 17.8 22.9 29.3 33.1 38.0 44.5 49.3

8
JMD ref 12100
Issue D 19-08-2015
For the purposes of this investigation, the climate change impacts have only been investigated for the
developed conditions as the consideration of climate change impacts on the flows through the site is
not relevant to the current site conditions.
c. Hydraulics
The flows estimated using the XP-Rafts model were entered into a hydraulic model of the creek
systems created in the HEC-Ras computer program. This program has been developed by the US army
for calculating backwater profiles on 1 dimensional flow regimes. The flows in the creeks running
through the site are generally linear in nature and so the use of this program to estimate the water
levels in the creeks is considered appropriate.
A series of cross sections for both creeks were generated off the survey model held by JMD over the
site using the control lines indicated on the catchment plan (HEC-Ras station locations are indicated
at the bends in the control lines. The validity of this survey data was confirm by a site walk in March
2015. Sections of the creeks have been generated at 20m centres with control sections at dam walls
and rod crossings entered into the model as road embankments.
A review of the sections interpolated from the survey data and inspection on site revealed that the
section at station 274 on the south creek was the same as that at station 169 of the north creek and
was essentially the top end of the large dam. The HEC-Ras model was therefore developed with north
creek joining south creek at station 274.
The roughness factors adopted for the hydraulic model were as described in Appendix A but also
examined for a range of values between 0.03 and 0.05. The model was found to be reasonably
insensitive to these changes in roughness which is attributed to the depth of flow through the number
of dams on site.
The resulting water levels in the creeks under current conditions including the Narellan upgrade works
which were generated by the HEC-Ras model are detailed in Appendix C.
The flood levels downstream of the large dam have not been determined in this study as it is
understood that this area of the site will be filled and reshaped to stabilise the existing dam wall. This
proposal would see the area immediately downstream of the site filled with controlled fill, in effect
building a new structurally sound dam wall against the existing wall thereby stabilising the existing
dam wall. The design of these earthworks is beyond the scope of this report and will need to
incorporate a discharge control path from the dam so that flows which overtop the dam wall do so in
a controlled manner which will not impact on the structural integrity of the dam wall.
5. Impacts on Stormwater Flows from Proposed development JMD were provided at the commencement of this investigation with a sketch showing the proposed
development of the site under the current planning proposal. This sketch is reproduced at Figure 5.1.
It is understood that this proposal has achieved NSW Gateway consent and Campbelltown City Council
endorsement to proceed to a future re-zoning of the Maryfields Site.
This sketch has been overlaid on the site plan and the areas of various development types in each
catchment estimated. For the purposes of this assessment, each development type was assigned a %
impervious factor in line with Council’s design specification as detailed in Table 5.1 below.

9
JMD ref 12100
Issue D 19-08-2015
These factors were applied to the areas interpreted from the planning proposal layout provided to
produce new catchment characteristics for the developed scenario as detailed in table 5.2 below. The
% impervious were applied to the estimated areas coloured in Figure 5.1. All open space areas
coloured green were assumed to be 5% impervious with the surface areas of existing dames assumed
to be 100% impervious.
Figure 5.1 – planning proposal as submitted for Gateway Determination 2014
Table 5.1 – Adopted % Impervious factors for developed scenario
Development Type Adopted % Impervious
Open Space 5
Low Density Residential 80
High Density Housing 90
Business Park 90
Seniors Living 80
The XP-Rafts models for the site were edited to reflect the above data to produce a hydrology model
reflective of the proposed developed conditions. For this exercise, impervious areas were assumed to
be grading at 5% to reflect the likely benching which will accompany the development of the site. The
resultant stormwater flows have been added in bold to those from Table 4.1 and reproduced at Table
5.3.
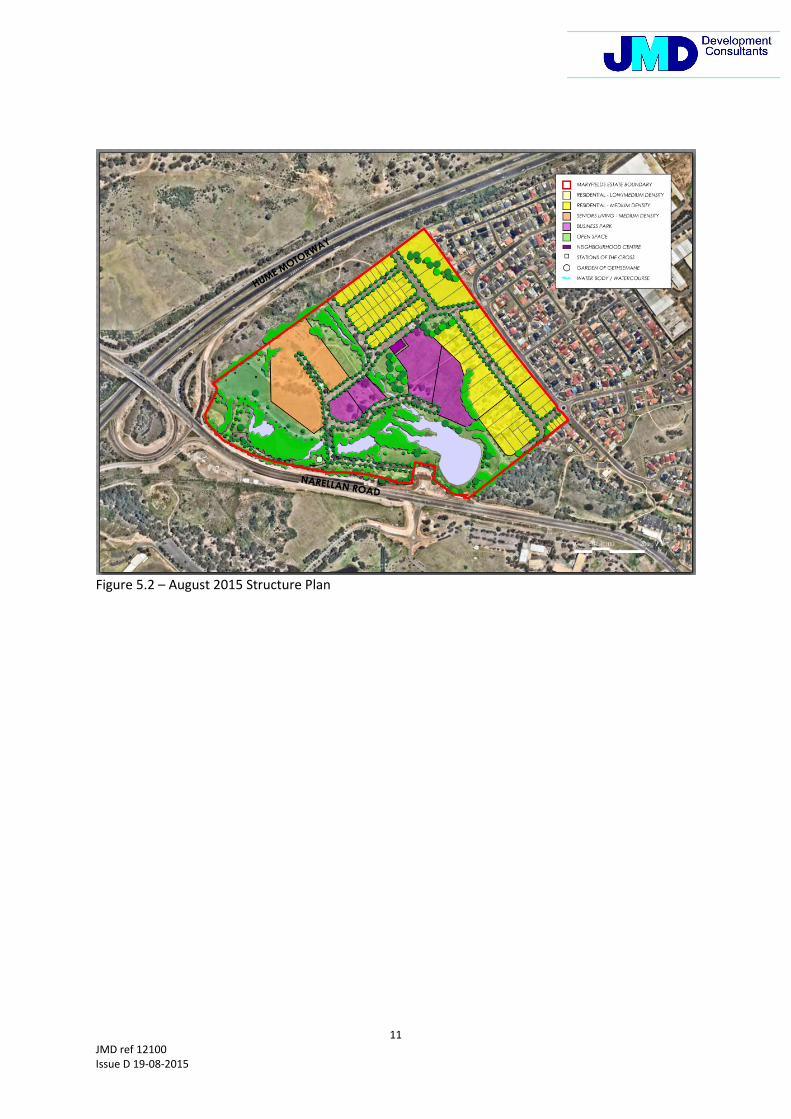
Subsequent to the original modelling, JMD have been provided with an updated Structure plan for the
site. This plan has been reproduced at Figure 5.2. The development areas depicted in the amended
structure plan have been reviewed and are similar to that in the original planning proposal. The
updated Structure plan is not considered to be a significant departure from the original planning
proposal and will not result in significant changes in flood levels from that documented in this report.
The results from the XP-Rafts modelling, as summarised in Table 5.3, indicate that in general, the
proposed development of the site will not result in an increase in peak stormwater flows in the
Tributary 1 creek system through the site. The modelling indicates then, that under current conditions,
there is no need to provide any stormwater detention on the Tributary 1 system as a result of the

10
JMD ref 12100
Issue D 19-08-2015
proposed development. Long term climate change impacts as discussed in Section 4b of this report
result in an increase in stormwater flows in the Tributary 1 system by approximately 8.5% over current
undeveloped conditions.
Table 5.2 – Developed Catchment Characteristics CATCHMENT SUMMARY - AS DEVELOPED
CATCH
AREA
BUSINESS
PARK
(90% imp)
AREA
SENIORS
LIVING
(80% imp)
AREA
MED DEN
RES (90%
imp)
AREA
LOW
DENSITY
RES (80%
imp)
AREA
ROADS
(80% imp)
Remaining
area
(open
space 5%
imp)
Developed
AREA
IMPERVIOUS
(ha)
Developed
AREA
PERVIOUS
(ha)
CHECK
TOTAL
AREA (ha)
S1
S2 0 0.29 0 0 0.1 5.16 0.57 4.98 5.55
S3 0 1.58 0 0 0.66 1.97 1.8905 2.3195 4.21
S4 0.69 0.04 0 0 0.35 2.18 1.042 2.218 3.26
S5 0 0 0 0 0.54 3.37 0.6005 3.3095 3.91
S5RD 0 0 0 0 0
N1 0 0 0 0 0
N2 0 0 0 0 0
N3 0 0.88 1.99 0 0.96 5.34 3.53 5.64 9.17
N4 1.15 0.923 0.204 0 0.6 1.503 2.51215 1.86785 4.38
N5 1.53 0 0.04 0 0.512 -0.082 1.8185 0.1815 2
N6 1.48 0 1.45 0 0.26 1.76 2.933 2.017 4.95
DAM 0 0 0 0
S6 0 0 1.45 0.93 0.646 1.354 2.6335 1.7465 4.38
E1 0 0 0.49 0.9 0.35 1.14 1.498 1.382 2.88
E2 0 0 1.29 2.19 1.05 0.34 3.77 1.1 4.87
E3 0 0 0.29 0.75 0.25 0.00 1.061 0.229 1.29
The development of the northern catchments E1 to E3 will result in increases to peak stormwater
flows off those catchments and it will be necessary to provide stormwater detention in these
catchments to ensure that the peak discharges from the catchments are not increased as a result of
the proposed development. The detailed design of the detention systems is not within the scope of
this assessment as such designs will need to include the consideration of future site and road levels.
Recent detention modelling completed by JMD for development sites at Glenfield indicate that for
developments similar in nature to that proposed on this site, detention storage requirements are
approximately 350 to 400 cubic metres per hectare of contributing catchment. It should be noted
that the volume of storage required and the associated area of land required for the storage is
dependent on the design specifications of the storage. For example, an open air basin with grassed
batters suitable for active or passive recreation will require more land area than an enclosed tank type
basin. Given the many variables which impact on the design of a detention storage and the generic
nature of the development proposal at this time, it is not possible to formulate a final design of the
storage required for each catchment however, Table 5.4 below provides indicative basin sizes for each
catchment which are provided as a guide only and will need to be confirmed as the development of
the site progresses. The basin areas assume an open area basin with 1 in 6 batters and a depth of
1.5m. The areas provided do not account for freeboard requirements ,etc.
11
JMD ref 12100
Issue D 19-08-2015
Figure 5.2 – August 2015 Structure Plan
12
JMD ref 12100
Issue D 19-08-2015
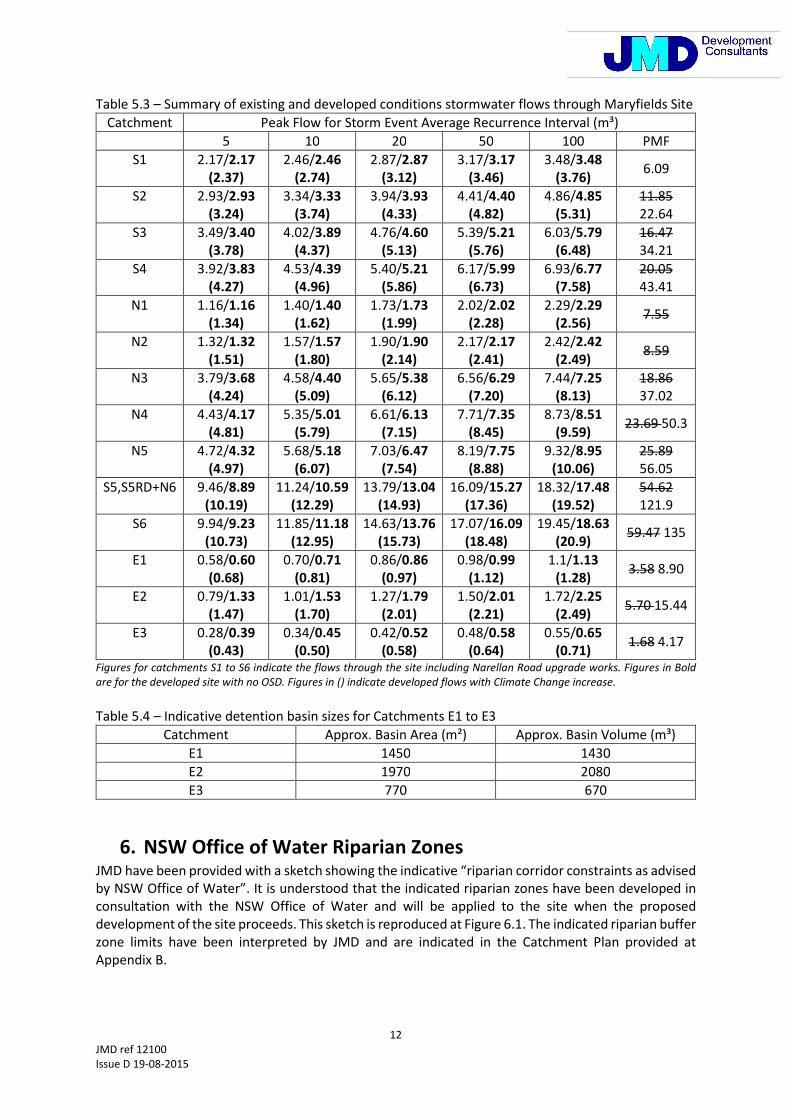
Table 5.3 – Summary of existing and developed conditions stormwater flows through Maryfields Site
Catchment Peak Flow for Storm Event Average Recurrence Interval (m³)
5 10 20 50 100 PMF
S1 2.17/2.17
(2.37)
2.46/2.46
(2.74)
2.87/2.87
(3.12)
3.17/3.17
(3.46)
3.48/3.48
(3.76) 6.09
S2 2.93/2.93
(3.24)
3.34/3.33
(3.74)
3.94/3.93
(4.33)
4.41/4.40
(4.82)
4.86/4.85
(5.31)
11.85
22.64
S3 3.49/3.40
(3.78)
4.02/3.89
(4.37)
4.76/4.60
(5.13)
5.39/5.21
(5.76)
6.03/5.79
(6.48)
16.47
34.21
S4 3.92/3.83
(4.27)
4.53/4.39
(4.96)
5.40/5.21
(5.86)
6.17/5.99
(6.73)
6.93/6.77
(7.58)
20.05
43.41
N1 1.16/1.16
(1.34)
1.40/1.40
(1.62)
1.73/1.73
(1.99)
2.02/2.02
(2.28)
2.29/2.29
(2.56) 7.55
N2 1.32/1.32
(1.51)
1.57/1.57
(1.80)
1.90/1.90
(2.14)
2.17/2.17
(2.41)
2.42/2.42
(2.49) 8.59
N3 3.79/3.68
(4.24)
4.58/4.40
(5.09)
5.65/5.38
(6.12)
6.56/6.29
(7.20)
7.44/7.25
(8.13)
18.86
37.02
N4 4.43/4.17
(4.81)
5.35/5.01
(5.79)
6.61/6.13
(7.15)
7.71/7.35
(8.45)
8.73/8.51
(9.59) 23.69 50.3
N5 4.72/4.32
(4.97)
5.68/5.18
(6.07)
7.03/6.47
(7.54)
8.19/7.75
(8.88)
9.32/8.95
(10.06)
25.89
56.05
S5,S5RD+N6 9.46/8.89
(10.19)
11.24/10.59
(12.29)
13.79/13.04
(14.93)
16.09/15.27
(17.36)
18.32/17.48
(19.52)
54.62
121.9
S6 9.94/9.23
(10.73)
11.85/11.18
(12.95)
14.63/13.76
(15.73)
17.07/16.09
(18.48)
19.45/18.63
(20.9) 59.47 135
E1 0.58/0.60
(0.68)
0.70/0.71
(0.81)
0.86/0.86
(0.97)
0.98/0.99
(1.12)
1.1/1.13
(1.28) 3.58 8.90
E2 0.79/1.33
(1.47)
1.01/1.53
(1.70)
1.27/1.79
(2.01)
1.50/2.01
(2.21)
1.72/2.25
(2.49) 5.70 15.44
E3 0.28/0.39
(0.43)
0.34/0.45
(0.50)
0.42/0.52
(0.58)
0.48/0.58
(0.64)
0.55/0.65
(0.71) 1.68 4.17
Figures for catchments S1 to S6 indicate the flows through the site including Narellan Road upgrade works. Figures in Bold
are for the developed site with no OSD. Figures in () indicate developed flows with Climate Change increase.
Table 5.4 – Indicative detention basin sizes for Catchments E1 to E3
Catchment Approx. Basin Area (m²) Approx. Basin Volume (m³)
E1 1450 1430
E2 1970 2080
E3 770 670
6. NSW Office of Water Riparian Zones JMD have been provided with a sketch showing the indicative “riparian corridor constraints as advised
by NSW Office of Water”. It is understood that the indicated riparian zones have been developed in
consultation with the NSW Office of Water and will be applied to the site when the proposed
development of the site proceeds. This sketch is reproduced at Figure 6.1. The indicated riparian buffer
zone limits have been interpreted by JMD and are indicated in the Catchment Plan provided at
Appendix B.
13
JMD ref 12100
Issue D 19-08-2015
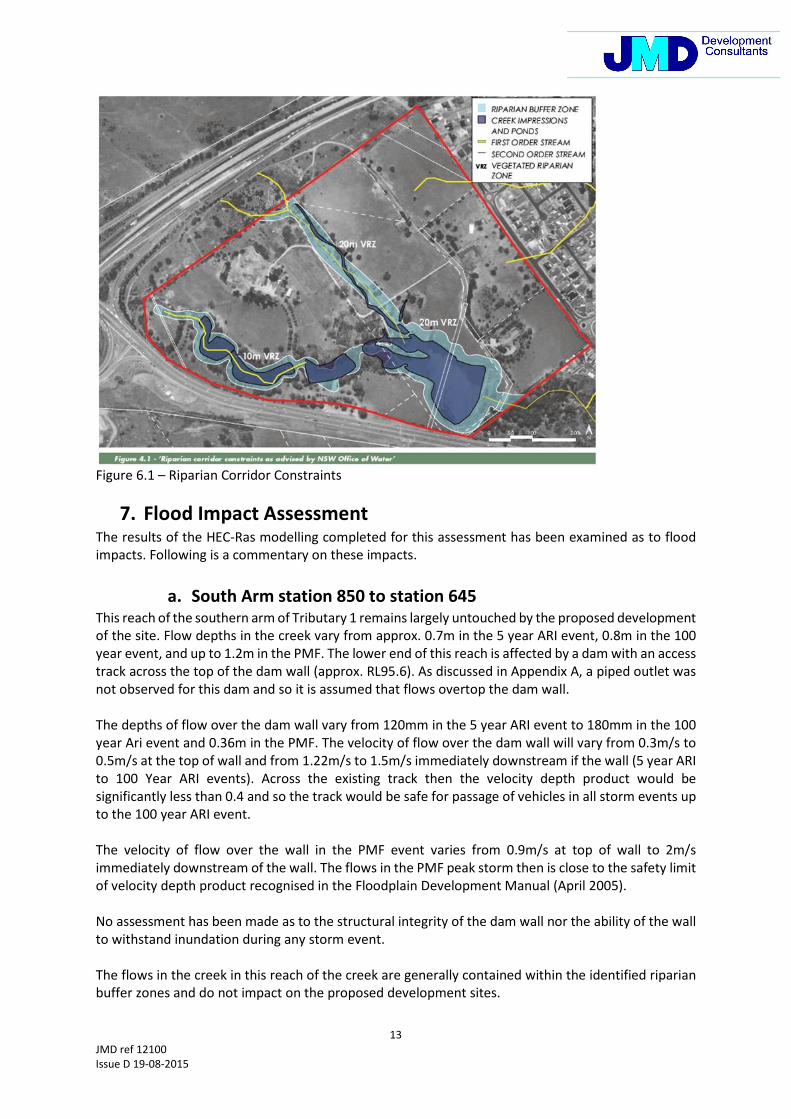
Figure 6.1 – Riparian Corridor Constraints
7. Flood Impact Assessment The results of the HEC-Ras modelling completed for this assessment has been examined as to flood
impacts. Following is a commentary on these impacts.
a. South Arm station 850 to station 645
This reach of the southern arm of Tributary 1 remains largely untouched by the proposed development
of the site. Flow depths in the creek vary from approx. 0.7m in the 5 year ARI event, 0.8m in the 100
year event, and up to 1.2m in the PMF. The lower end of this reach is affected by a dam with an access
track across the top of the dam wall (approx. RL95.6). As discussed in Appendix A, a piped outlet was
not observed for this dam and so it is assumed that flows overtop the dam wall.
The depths of flow over the dam wall vary from 120mm in the 5 year ARI event to 180mm in the 100
year Ari event and 0.36m in the PMF. The velocity of flow over the dam wall will vary from 0.3m/s to
0.5m/s at the top of wall and from 1.22m/s to 1.5m/s immediately downstream if the wall (5 year ARI
to 100 Year ARI events). Across the existing track then the velocity depth product would be
significantly less than 0.4 and so the track would be safe for passage of vehicles in all storm events up
to the 100 year ARI event.
The velocity of flow over the wall in the PMF event varies from 0.9m/s at top of wall to 2m/s
immediately downstream of the wall. The flows in the PMF peak storm then is close to the safety limit
of velocity depth product recognised in the Floodplain Development Manual (April 2005).
No assessment has been made as to the structural integrity of the dam wall nor the ability of the wall
to withstand inundation during any storm event.
The flows in the creek in this reach of the creek are generally contained within the identified riparian
buffer zones and do not impact on the proposed development sites.

14
JMD ref 12100
Issue D 19-08-2015
b. South Arm station 645 to station 430
This reach of the southern arm of Tributary 1 will be affected by the proposed development of the
site. Flow depths in the creek vary from approx. 0.8m in the 5 year ARI event, 0.9m in the 100 year
event, and up to 1.5m in the PMF. The lower end of this reach is affected by a dam with a sealed access
track across the top of the dam wall (approx. RL92.0). The water level in the dam is maintained by a
concrete weir draining to a pipe laid through the dam wall. The modelling has revealed that the pipe
has insufficient capacity for peak storm flows in all storm events resulting in flow overtopping the
access track in all modelled storm events.
The depths of flow over the dam wall vary from 60mm in the 5 year ARI event to 130mm in the 100
year Ari event and 0.32m in the PMF. The velocity of flow over the dam wall is very low (less than
0.2m/s. the modelling indicates that the flows immediately downstream of the access track remain
low as the creek is “drowned” by the backwater effects from the downstream dam. Across the existing
track then the velocity depth product would be significantly less than 0.4 and so the track would be
safe for passage of vehicles in all storm events up to the 100 year ARI event.
The velocity of flow over the wall in the PMF event varies but does not exceed 0.6m/s resulting in the
velocity depth product for the PMF peak storm being well below the 0.4 safe limit recognised in the
Floodplain Development Manual.
No assessment has been made as to the structural integrity of the dam wall nor the ability of the wall
to withstand inundation during any storm event.
The flows in the creek in this reach of the creek are generally contained within the identified riparian
zones on the south side of the creek except for in the vicinity of the dam wall where the overtopping
of the wall causes the width of flow to exceed the indicated riparian buffer zone width. The modelling
indicates that the 100 year and PMF flood lines will exceed the width of the riparian buffer zone on
the north side of the creek. The planning proposal detailed at Figure 5.1 was found to be marginally
affected by stormwater flows in the creek during the peak 1 in 100 year design storm. The August
2015 planning proposal indicated at Figure 5.2 has the development areas adjusted to remove the
minor affectation and so all residential areas in the August 2015 Planning Proposal will be above the
1 in 100 year flood line.
The development proposal indicates that the current sealed access will be replaced by a public road
providing access to the proposed seniors living area. In accordance with the requirements of Council’s
design specification, this road will need to be flood free in the 100 year ARI flood event and passable
in the PMF. It is understood that the existing dam water levels are to be retained to retain the current
ecology of the area. The public road will therefore need to be raised to provide for the necessary
culverts to be constructed under the road while maintaining the existing upstream water level. The
culverts will need to be designed to convey the 100 year ARI flood flow (8.47m³/s) plus allowance for
50% blockage.
c. South Arm station 430 to station 274
This reach of the southern arm of Tributary 1 may be affected by the proposed development of the
site. Flow depths in the creek are not know in this reach of the creek as the reach is affected by an
existing dam of unknown depth.
Velocities along the reach are low and the width and depth of flow is controlled by the dam wall at
station 320. The 100 year ARI and PMF flood lines are generally consistent with the Riparian buffer
zone on the south side of the creek but exceed the indicated width of the riparian buffer zones on the
north side of the creek where the 100 year ARI flood line approximates the proposed Business Park

15
JMD ref 12100
Issue D 19-08-2015
area as identified in the original Planning Proposal at Figure 5.1 but will be clear of the proposed
Business Park area identified in the August 2015 Planning Proposal at Figure 5.2. The PMF flood line
intrudes into to proposed Business Park area.
No assessment has been made as to the structural integrity of the dam wall nor the ability of the wall
to withstand inundation during any storm event.
d. North Arm Station 560 to station 170
This reach is roughly linear in alignment. Flow depths vary from approx. 300mm in the 5 year Ari event
to approx. 0.6m in the 100 year ARI event and 0.7m in the PMF. Velocities are generally in the vicinity
of 0.8m/s to 1.2m/s and flows are generally sub-critical.
An existing access track has been built across the creek at station 225. The embankment associated
with this access track is approx. 2.5m high with the creek drained through the embankment by twin
900mm dia pipes. These pipes have insufficient capacity to convey the 5 year ARI flows and so the
embankment is overtopped in all storm events modelled.
Flood flows in this reach are generally contained within the proposed riparian buffer zones and so the
flood flows are considered to have a low impact on the proposed development of the site.
The development proposal indicates that a cycleway connection will cross this reach at approximately
station 330. The design requirements for such a crossing are not clearly stated in Council’s design
specification however the crossing will need to be designed to provide for the safe conveyance of
flood flows.
The development proposal indicates that a public road will cross this reach at approximately station
200. In accordance with the requirements of Council’s design specification, this road will need to be
flood free in the 100 year ARI flood event and passable in the PMF. It is assumed that the existing
access road embankment will be removed. The public road will need to be elevated above creek invert
to provide for the necessary culverts to be constructed under the road. The culverts will need to be
designed to convey the 100 year ARI flood flow (7.99m³/s) plus allowance for 50% blockage.
e. South Arm Station 274 to station 0
This reach represents the large dam at the south-east corner of the Maryfields Site. Flood flows are
generally contained within the existing dam and its immediate surrounds with water levels governed
directly by the outlet conditions. Under current conditions as modelled, flood flows in all storm events
up to PMF are contained with the indicated riparian buffer zones.
The development proposal indicates that a public road will cross this reach at approximately station
170. In accordance with the requirements of Council’s design specification, this road will need to be
flood free in the 100 year ARI flood event and passable in the PMF. The public road will need to be
elevated above dam surface to provide for the necessary culverts to be constructed under the road.
The culverts will need to be designed to convey the 100 year ARI flood flow (21.3m³/s) plus allowance
for 50% blockage.
8. Overall Flood Impact Assessment This study has undertaken a comprehensive assessment of the flood impacts likely to result from the
development of the site as indicated at Section 5. In general, flood flows will be contained within the
proposed riparian buffer zones indicated in Figure 6.1 with no impacts on the proposed development

16
JMD ref 12100
Issue D 19-08-2015
zones on the site as identified in the August 2015 Planning Proposal at Figure 5.2 in the peak 1 in 100
year flood. Proposed road crossings providing public access to the various development zones will
need to be designed to cater for the indicated flood flows and provide safe passage in the design storm
events.
Subject to the provision of suitable culvert/bridge crossings compliant with Council’s design
specification, the August 2015 development proposal will not have a significant impact on the riparian
zones associated with the Tributary 1 traversing the Maryfields site.
The development proposal indicated for the site will not result in the need to provide stormwater
detention on the Tributary 1 catchment. The development of the Tributary 1 catchment as indicated
will result in a minor reduction in peak flows in the Tributary.
The northern portion of the Maryfields Site not draining to the Tributary 1 creek system will require
the provision of stormwater detention systems to reduce developed flows to that which occur under
current conditions. Alternatively, it may be possible to take advantage of the minor decrease in peak
flows in Tributary 1 which will result from the development of the site and divert flows of part of the
northern catchment to the tributary 1 catchment such that the developed flows to the north are
reduced to current levels. The investigation of this alternative however is beyond the scope of this
assessment.
9. Water Quality Issues The development of the Maryfields Site will need to address water quality impacts resulting from the
development of the site. At this preliminary stage of the development process, it is not possible to
provide details of specific water quality measures required to address the impacts of the development
proposal. Following however is a generic discussion of water quality issues and possible design
solutions. The final treatment measures to be adopted for the site will need to be determined in
consultation with Council and NSW Office of Water.
Council’s Design Specification describes the following generic treatment targets for use where targets
are not provided in the site specific Stormwater Management Plans.
Campbelltown City Council Generic Stormwater Quality Objectives
Parameter Criteria
Total Phosphorus (TP) 45% retention of average annual load
Total Nitrogen (TN) 45% retention of average annual load
Total Suspended Solids (TSS) 80% retention of average annual load
Water Quality is a developing area of engineering and the above targets detailed in Council’s design
specification are outdated. More recent development proposals such as that at Oran Park are required
to meet the following higher targets:-
Oran Park DCP Stormwater Quality Objectives
Parameter Criteria
Total Phosphorus (TP) 65% retention of average annual load
Total Nitrogen (TN) 45% retention of average annual load
Total Suspended Solids (TSS) 85% retention of average annual load
Typically water quality measures are designed using the MUSIC computer program developed by
eWater. This program has become the industry standard for this type of modelling and has been
adopted by a number of Councils and Government agencies. The program requires the site to be

17
JMD ref 12100
Issue D 19-08-2015
modelled using input nodes to represent the site conditions and treatment nodes to represent the
water quality treatment measures. The results are then generated generally as mean annual loads.
The effectiveness of the proposed treatment measures can be ascertained by comparing results from
a model with no treatment measures to that with treatment measures included.
One method of achieving water quality treatment targets is by diverting low flows off developed
catchments through a gross pollutant trap (GPT) to a bio-retention basin where stormwater is
detained and filtered through vegetated sandy filter beds prior to discharge. The MUSIC program
enables the designer to determine the area of the bio-retention basin. Typically, the surface area of
the filter media in a bio-retention basin needs to be between 1% and 1.5% of the contributing
catchment area to achieve the required water quality outcomes. Generally, bio-retention basins are
required to be located outside riparian buffer zones.
Recent experience has revealed a reluctance on the part of Campbelltown Council to adopt the use of
bio-retention basins for water quality treatment if the basins are to become a public asset. An
alternative treatment measure used by JMD on a number developments within the Campbelltown
LGA has been to divert low flows from developed catchments to a GPT in tandem with a proprietary
filter pit such as a “Jellyfish” treatment pit which is produced by Humes. Modelling completed by JMD
has shown such filter pits to be effective for residential catchments (vacant lot development where
surfaces are assumed to be 80% impervious) up to approximately 2ha.

18
JMD ref 12100
Issue D 19-08-2015
10. Conclusion JMD have been engaged by the Franciscan Friars to prepare a flood impact assessment to assist
Council and other authorities in the consideration of the proposed future development of the
Maryfields Development Site.
The Maryfields Site which measures some 43.4ha in area is located on the north-east corner of the
intersection of Narellan Road with the Hume Motorway and is traversed by a creek system known as
Tributary No.1 of Bow Bowing Creek.
The site is proposed to be developed for a number of uses including residential, business and senior
living. The proposal has achieved NSW Gateway Consent and Campbelltown City Council endorsement
to proceed to a future re-zoning of the Maryfields Site. This report details the findings of a flood
assessment conducted by JMD, documents the likely impacts of flooding on the proposed
development areas and provides preliminary flood extent mapping. Subject to the detailed design of
road crossings and certification of the stability of existing dam structures (both issues are beyond the
scope of this assessment), the development proposal has been found to be largely unaffected by
flooding issues.
The assessment has found that the proposed development will not adversely impact on the existing
creek system in the area. A portion of the site located along the northern boundary of the site does
not currently drain to Tributary No.1. The development of these northern catchments will result in an
increase stormwater flows which will need to be addressed by the provision of stormwater detention
or other means. At this stage of the development process, it is not possible to provide detailed
information of the design of the proposed detention systems but preliminary estimates of storage
volumes have been documented.
The development of the site will need to include the provision of adequate measures to address water
quality impacts resulting from the development. Again, at this stage of the development process, it is
not possible to provide detailed information of the design of the proposed water quality measures
however the report provides a preliminary discussion of the issues associated with water quality and
options for the treatment of storm water flows which have been successfully used on other similar
projects in the Campbelltown LGA.
Yours faithfully
……………………….
Terry Hams
BE (Civil) MIR Aust (409949)
CP Eng
19
JMD ref 12100
Issue D 19-08-2015
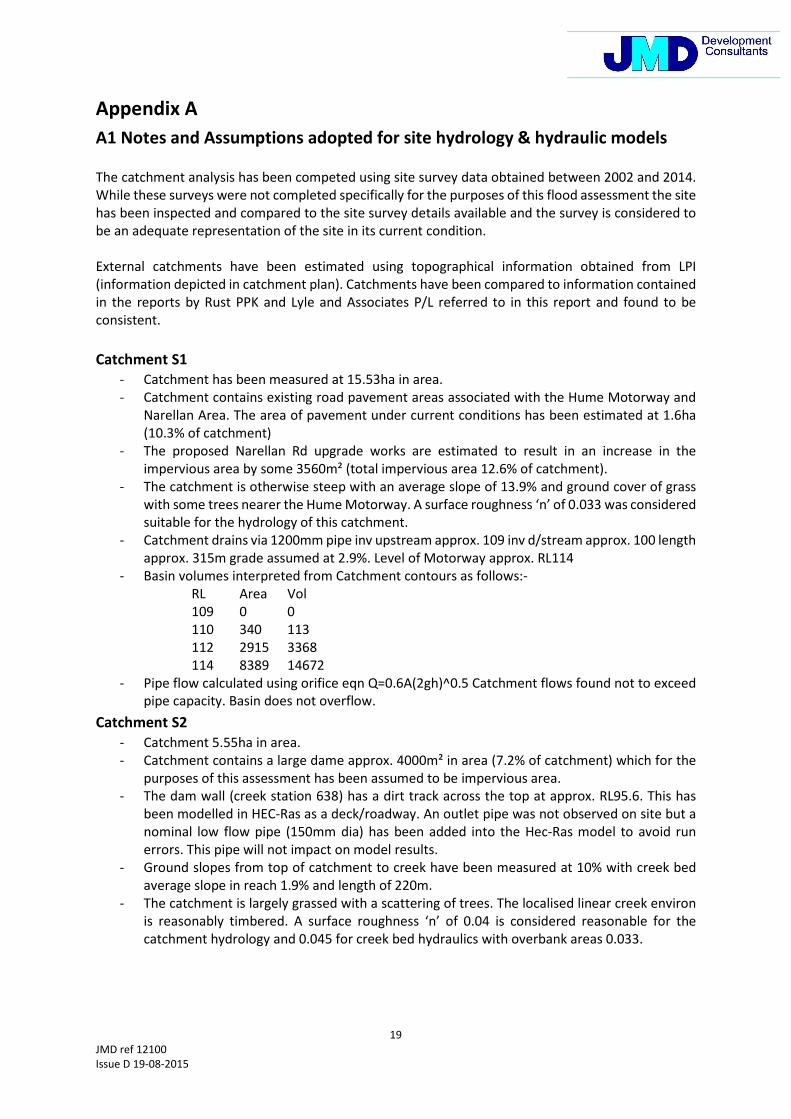
Appendix A
A1 Notes and Assumptions adopted for site hydrology & hydraulic models
The catchment analysis has been competed using site survey data obtained between 2002 and 2014.
While these surveys were not completed specifically for the purposes of this flood assessment the site
has been inspected and compared to the site survey details available and the survey is considered to
be an adequate representation of the site in its current condition.
External catchments have been estimated using topographical information obtained from LPI
(information depicted in catchment plan). Catchments have been compared to information contained
in the reports by Rust PPK and Lyle and Associates P/L referred to in this report and found to be
consistent.
Catchment S1
- Catchment has been measured at 15.53ha in area.
- Catchment contains existing road pavement areas associated with the Hume Motorway and
Narellan Area. The area of pavement under current conditions has been estimated at 1.6ha
(10.3% of catchment)
- The proposed Narellan Rd upgrade works are estimated to result in an increase in the
impervious area by some 3560m² (total impervious area 12.6% of catchment).
- The catchment is otherwise steep with an average slope of 13.9% and ground cover of grass
with some trees nearer the Hume Motorway. A surface roughness ‘n’ of 0.033 was considered
suitable for the hydrology of this catchment.
- Catchment drains via 1200mm pipe inv upstream approx. 109 inv d/stream approx. 100 length
approx. 315m grade assumed at 2.9%. Level of Motorway approx. RL114
- Basin volumes interpreted from Catchment contours as follows:-
RL Area Vol
109 0 0
110 340 113
112 2915 3368
114 8389 14672
- Pipe flow calculated using orifice eqn Q=0.6A(2gh)^0.5 Catchment flows found not to exceed
pipe capacity. Basin does not overflow.
Catchment S2
- Catchment 5.55ha in area.
- Catchment contains a large dame approx. 4000m² in area (7.2% of catchment) which for the
purposes of this assessment has been assumed to be impervious area.
- The dam wall (creek station 638) has a dirt track across the top at approx. RL95.6. This has
been modelled in HEC-Ras as a deck/roadway. An outlet pipe was not observed on site but a
nominal low flow pipe (150mm dia) has been added into the Hec-Ras model to avoid run
errors. This pipe will not impact on model results.
- Ground slopes from top of catchment to creek have been measured at 10% with creek bed
average slope in reach 1.9% and length of 220m.
- The catchment is largely grassed with a scattering of trees. The localised linear creek environ
is reasonably timbered. A surface roughness ‘n’ of 0.04 is considered reasonable for the
catchment hydrology and 0.045 for creek bed hydraulics with overbank areas 0.033.

20
JMD ref 12100
Issue D 19-08-2015
Catchment S3
- Catchment is 4.21 ha in area.
- Catchment contains a large dam approx. 3500m² in area (8.3% of catchment)
- Catchment contains an sealed access track to a dwelling approx. 870m² in area and approx.
400m² of area associated with the dwelling which would be considered impervious. Total
impervious area for catchment then is 4770m² (11.3% of catchment).
- The dam wall (creek station 433) has been constructed with a weir and 600mm dia low flow
pipe under the sealed road on top of the dam wall. Top of dam wall is approx. RL92.0 and pipe
invert is approx. RL91.0 but has been modelled with an upstream invert of RL91.4 to replicate
the operation of the concrete weir which controls water level in the dam to RL91.4.
- Ground slopes from top of catchment to creek have been measured at 8% with creek bed
average slope in reach 2% and length of 210m.
- The upper northern portion of the catchment is grassed. The lower portion of the catchment
and creek environ is timbered. A surface roughness ‘n’ of 0.04 is considered reasonable for
the catchment hydrology and 0.05 for creek bed hydraulics with overbank areas 0.04.
Catchment S4
- Catchment is 3.26ha in area.
- Catchment contains a large dam approx. 5,300m² in area (16.3% of catchment)
- Catchment contains part of the sealed access track to the dwelling referred to in Catchment
S3 above approx. 130m² in area. Total impervious area for catchment then is 5430m² (16.7%
of catchment).
- The dam (creek station 320) was observed to be a simple farm dam with no visible low flow
pipe (wall is overgrown) but a nominal low flow pipe (150mm dia) has been added into the
Hec-Ras model to avoid run errors. This pipe will not impact on model results. Based on site
survey, the top of wall has been entered into model at RL90.0
- Ground slopes from top of catchment to creek have been measured at 6.5% with creek bed
average slope in reach 2% and length of 90m.
- The catchment is grassed with a scattering of trees. The creek portion of this catchment is
primarily dam lined with trees. A surface roughness ‘n’ of 0.04 is considered reasonable for
the catchment hydrology and 0.04 for creek bed hydraulics with overbank areas 0.04.
Catchment N1
- Catchment has been measured at 6.67ha in area.
- Catchment does not include any road pavement areas associated with the Hume Motorway.
The catchment analysis conducted by Lyall and Associates and confirmed by JMD indicates
that the pavement area of the Hume Motorway adjacent to this catchment drains to the north
away from the Maryfield Site.
- The catchment is steep with an average slope of 11% and ground cover of grass with some
trees nearer the Hume Motorway. A surface roughness ‘n’ of 0.033 was considered suitable
for the hydrology of this catchment.
- Catchment drains via 1200mm pipe inv upstream approx. 101.5 inv d/stream approx. 96
length approx. 155m grade assumed at 3.5%. Level of Motorway approx. RL106
- Basin volumes interpreted from Catchment contours as follows:-
RL Area Vol
101.5 0 0
102 40 6
104 483 526
106 2648 3657
- Pipe flow calculated using orifice eqn Q=0.6A(2gh)^0.5 Catchment flows found to exceed pipe
capacity in some storm events. Basin overflows diverted out of system (to dummy node “Out”)

21
JMD ref 12100
Issue D 19-08-2015
via diversion link with bypass threshold set at 5.9m³/s (capacity of pipe inlet with water level
at RL106)
-
Catchment N2
- Catchment has been measured at 7.47ha in area.
- Catchment does not include any road pavement areas associated with the Hume Motorway.
The catchment analysis conducted by Lyall and Associates and confirmed by JMD indicates
that the pavement area of the Hume Motorway adjacent to this catchment drains to the north
away from the Maryfield Site.
- The catchment is steep with an average slope of 12.8% and ground cover of grass with some
trees nearer the Hume Motorway. A surface roughness ‘n’ of 0.033 was considered suitable
for the hydrology of this catchment.
- Catchment drains via 900mm pipe inv upstream approx. 101.5 inv d/stream approx. 98 length
approx. 167m grade assumed at 2%. Level of Motorway approx. RL106
- Basin volumes interpreted from Catchment contours as follows:-
RL Area Vol
101.5 0 0
102 22 4
104 338 364
106 1491 2193
- Pipe flow calculated using orifice eqn Q=0.6A(2gh)^0.5 Catchment flows found to exceed pipe
capacity in some storm events. Basin overflows diverted to Node N1 via diversion link with
bypass threshold set at 3.4m³/s (capacity of pipe inlet with water level at RL106)
Catchment N3
- Catchment 9.17ha in area.
- Catchment contains 150m of unsealed access track which has been assumed to be impervious
(adopted area 450m² = 0.5% of catchment)
- Ground slopes from top of catchment to creek have been measured at 10% with creek bed
average slope in reach 2.6% and length of 200m.
- The catchment is largely grassed with a scattering of trees. The localised linear creek environ
is reasonably timbered. A surface roughness ‘n’ of 0.04 is considered reasonable for the
catchment hydrology and 0.045 for creek bed hydraulics with overbank areas 0.04.
Catchment N4
- Catchment 4.38ha in area.
- Catchment contains 310m of access track which has been assumed to be impervious (adopted
area 930m² = 2.1% of catchment)
- The access track across the creek has been built up to form an embankment with twin 900mm
pipes allowing the passage of water. Top of embankment is approx. RL87.7
- Ground slopes from top of catchment to creek have been measured at 10% south and 7%
north. Average slope adopted was 8.5% with creek bed average slope in reach 2.4% and length
of 138m.
- The catchment is largely grassed with only some of trees. The localised linear creek environ is
only lightly timbered. A surface roughness ‘n’ of 0.035 is considered reasonable for the
catchment hydrology and 0.04 for creek bed hydraulics with overbank areas 0.035.
22
JMD ref 12100
Issue D 19-08-2015
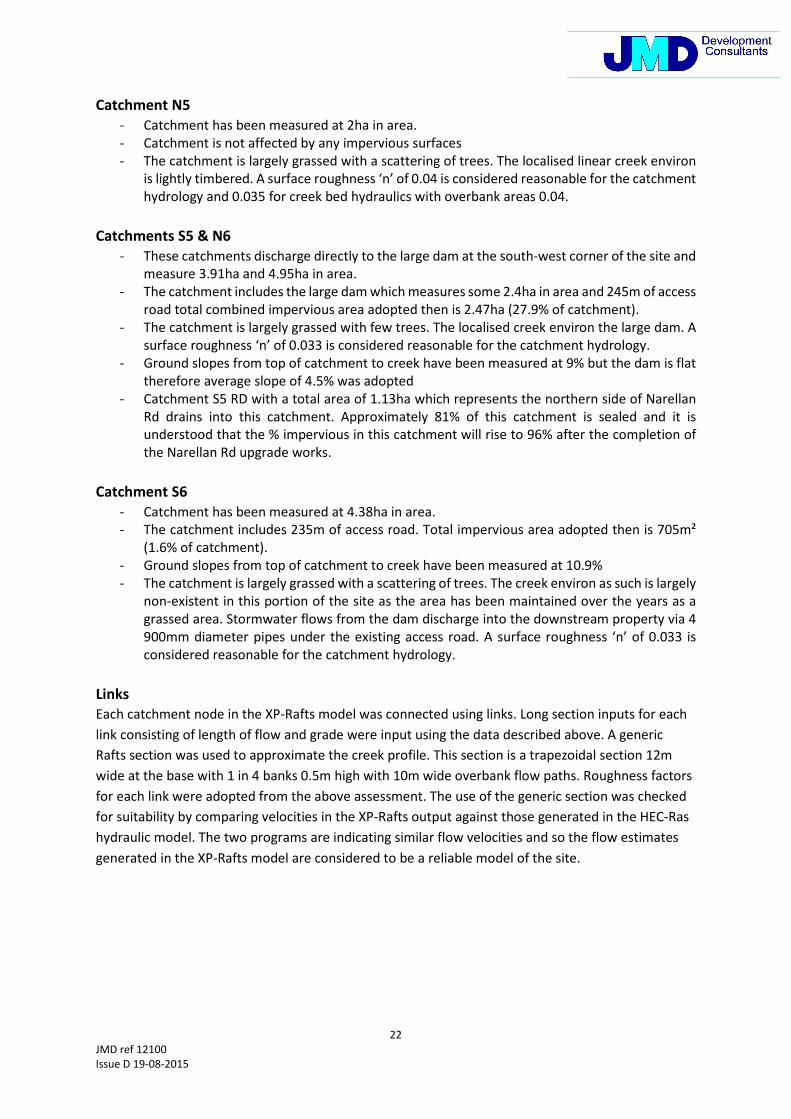
Catchment N5
- Catchment has been measured at 2ha in area.
- Catchment is not affected by any impervious surfaces
- The catchment is largely grassed with a scattering of trees. The localised linear creek environ
is lightly timbered. A surface roughness ‘n’ of 0.04 is considered reasonable for the catchment
hydrology and 0.035 for creek bed hydraulics with overbank areas 0.04.
Catchments S5 & N6
- These catchments discharge directly to the large dam at the south-west corner of the site and
measure 3.91ha and 4.95ha in area.
- The catchment includes the large dam which measures some 2.4ha in area and 245m of access
road total combined impervious area adopted then is 2.47ha (27.9% of catchment).
- The catchment is largely grassed with few trees. The localised creek environ the large dam. A
surface roughness ‘n’ of 0.033 is considered reasonable for the catchment hydrology.
- Ground slopes from top of catchment to creek have been measured at 9% but the dam is flat
therefore average slope of 4.5% was adopted
- Catchment S5 RD with a total area of 1.13ha which represents the northern side of Narellan
Rd drains into this catchment. Approximately 81% of this catchment is sealed and it is
understood that the % impervious in this catchment will rise to 96% after the completion of
the Narellan Rd upgrade works.
Catchment S6
- Catchment has been measured at 4.38ha in area.
- The catchment includes 235m of access road. Total impervious area adopted then is 705m²
(1.6% of catchment).
- Ground slopes from top of catchment to creek have been measured at 10.9%
- The catchment is largely grassed with a scattering of trees. The creek environ as such is largely
non-existent in this portion of the site as the area has been maintained over the years as a
grassed area. Stormwater flows from the dam discharge into the downstream property via 4
900mm diameter pipes under the existing access road. A surface roughness ‘n’ of 0.033 is
considered reasonable for the catchment hydrology.
Links
Each catchment node in the XP-Rafts model was connected using links. Long section inputs for each
link consisting of length of flow and grade were input using the data described above. A generic
Rafts section was used to approximate the creek profile. This section is a trapezoidal section 12m
wide at the base with 1 in 4 banks 0.5m high with 10m wide overbank flow paths. Roughness factors
for each link were adopted from the above assessment. The use of the generic section was checked
for suitability by comparing velocities in the XP-Rafts output against those generated in the HEC-Ras
hydraulic model. The two programs are indicating similar flow velocities and so the flow estimates
generated in the XP-Rafts model are considered to be a reliable model of the site.

23
JMD ref 12100
Issue D 19-08-2015
Table A1 below is a summary of the above details. MARYFIELDS SITE
CATCHMENT SUMMARY
EXISTING CONDITIONS - PRIOR TO NARELLAN RD WORKS
CATCH AREA
%
IMPERV.
AREA
IMPERVIOUS
(ha)
AREA
PERVIOUS
(ha)
CHECK
TOTAL
AREA (ha)
S1 15.53 10.30% 1.60 13.93 15.53
S2 5.55 7.20% 0.40 5.15 5.55
S3 4.21 11.30% 0.48 3.73 4.21
S4 3.26 16.70% 0.54 2.72 3.26
S5 3.91 27.90% 1.09 2.82 3.91
S5RD 1.13 81.00% 0.92 0.21 1.13
N1 6.67 0.00% 0.00 6.67 6.67
N2 7.47 0.00% 0.00 7.47 7.47
N3 9.17 0.50% 0.05 9.12 9.17
N4 4.38 2.10% 0.09 4.29 4.38
N5 2 0.00% 0.00 2.00 2
N6 4.95 27.90% 1.38 3.57 4.95
DAM 0 0.00% 0.00 0.00 0
S6 4.38 1.60% 0.07 4.31 4.38
Totals 72.61 6.61 66.00 72.61
POST NARELLAN RD WORKS
CATCH AREA
%
IMPERV.
Exist AREA
IMPERVIOUS
(ha)
Exist
AREA
PERVIOUS
(ha)
CHECK
TOTAL
AREA (ha)
S1 15.53 12.60% 1.96 13.57 15.53
S2 5.55 7.20% 0.40 5.15 5.55
S3 4.21 11.30% 0.48 3.73 4.21
S4 3.26 16.70% 0.54 2.72 3.26
S5 3.91 27.90% 1.09 2.82 3.91
S5RD 1.13 96.00% 1.08 0.05 1.13
N1 6.67 0.00% 0.00 6.67 6.67
N2 7.47 0.00% 0.00 7.47 7.47
N3 9.17 0.50% 0.05 9.12 9.17
N4 4.38 2.10% 0.09 4.29 4.38
N5 2 0.00% 0.00 2.00 2
N6 4.95 27.90% 1.38 3.57 4.95
DAM 0 0.00% 0.00 0.00 0
S6 4.38 1.60% 0.07 4.31 4.38
72.61 7.14 65.47 72.61
E1 2.88 0% 0.00 2.88 2.88

24
JMD ref 12100
Issue D 19-08-2015
The HEC-Ras computer hydraulic model was setup as described in section 4. The large dam does not
at present have any significant overflow structure. For the purpose of this assessment, it has been
assumed that any flows which escape the large dam flow over the wall. For the purpose of setting
downstream water levels, the wall has been assumed to be a control with the depth of water over the
wall being estimated by the use of the generic weir equation:-
Q = 1.7Ld^1.5 Q = flow over weir (m³/s)
L = length of weir (m)
d = depth of flow over weir
The wall is approximately 148m wide with a top of bank level of approx. RL84.4m resulting in the
following starting water levels assuming the large dam is full at the start of the peak flow events:-
Event ARI Flow (m³/s) d(m) Top water Level(m)
5 10.11 0.12 84.52
10 12.48 0.14 84.54
20 15.76 0.16 84.56
50 18.54 0.18 84.58
100 21.3 0.19 84.59
PMF 75.13 0.45 84.85
A2 External Catchments
There are three catchments along the northern boundary of the Maryfields Site which discharge to
the north away from the central creek section. These have been denoted catchments E1, E2 and E3.
Catchment E1
- This catchment is 2.88ha in area and includes a portion of the Hume Motorway land.
- Catchment falls at 10% grade to a gully along the southern side of the Hume Motorway.
- The catchment is grassed A surface roughness ‘n’ of 0.033 is considered reasonable for the
catchment hydrology.
Catchment E2
- This catchment is 4.87ha in area.
- The catchment has a small % impervious (4%) associated with the existing building at the top
of the catchment.
- Catchment falls at 8% grade to the bend in Maryfields Drive north of the intersection with the
northern leg of Gabriel Cct.
- The catchment is grassed A surface roughness ‘n’ of 0.033 is considered reasonable for the
catchment hydrology.
Catchment E3
- This catchment is 1.29ha in area.
- The catchment has a small % impervious (9%) associated with the existing building at the top
of the catchment.
- Catchment falls at 9% grade to Maryfields Drive at the intersection with the southern leg of
Gabriel Cct.
- The catchment is grassed A surface roughness ‘n’ of 0.033 is considered reasonable for the
catchment hydrology.
25
JMD ref 12100
Issue D 19-08-2015
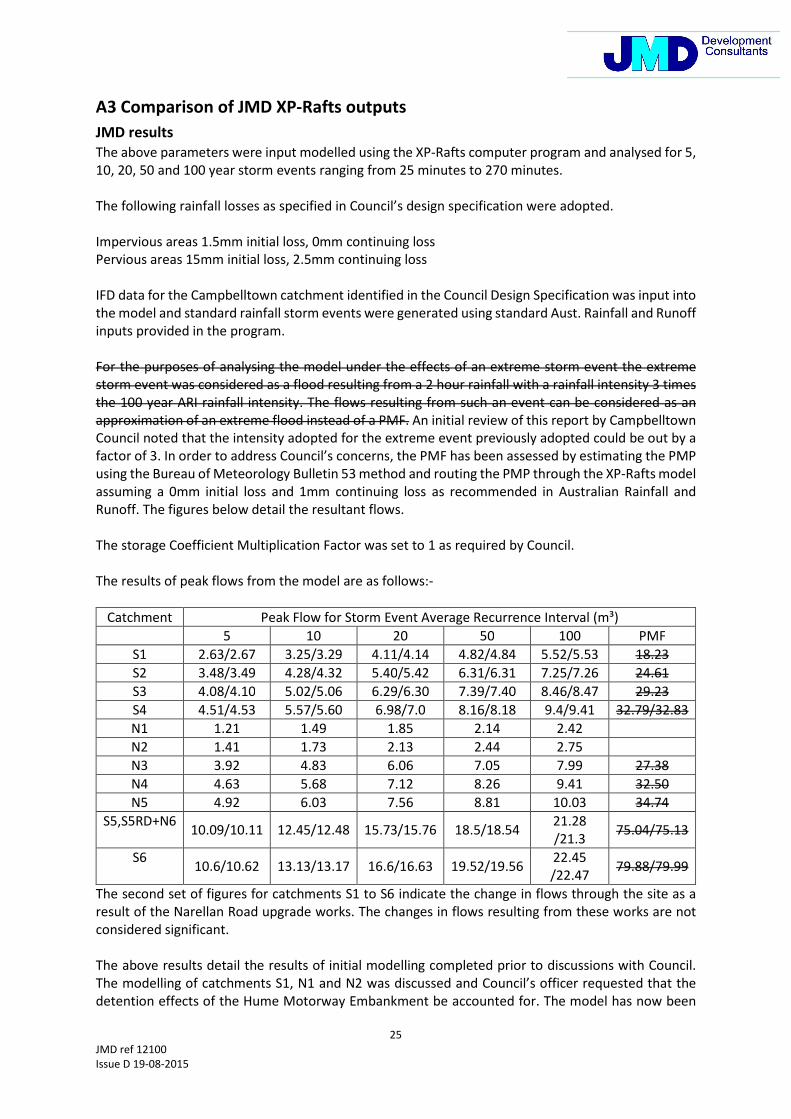
A3 Comparison of JMD XP-Rafts outputs
JMD results
The above parameters were input modelled using the XP-Rafts computer program and analysed for 5,
10, 20, 50 and 100 year storm events ranging from 25 minutes to 270 minutes.
The following rainfall losses as specified in Council’s design specification were adopted.
Impervious areas 1.5mm initial loss, 0mm continuing loss
Pervious areas 15mm initial loss, 2.5mm continuing loss
IFD data for the Campbelltown catchment identified in the Council Design Specification was input into
the model and standard rainfall storm events were generated using standard Aust. Rainfall and Runoff
inputs provided in the program.
For the purposes of analysing the model under the effects of an extreme storm event the extreme
storm event was considered as a flood resulting from a 2 hour rainfall with a rainfall intensity 3 times
the 100 year ARI rainfall intensity. The flows resulting from such an event can be considered as an
approximation of an extreme flood instead of a PMF. An initial review of this report by Campbelltown
Council noted that the intensity adopted for the extreme event previously adopted could be out by a
factor of 3. In order to address Council’s concerns, the PMF has been assessed by estimating the PMP
using the Bureau of Meteorology Bulletin 53 method and routing the PMP through the XP-Rafts model
assuming a 0mm initial loss and 1mm continuing loss as recommended in Australian Rainfall and
Runoff. The figures below detail the resultant flows.
The storage Coefficient Multiplication Factor was set to 1 as required by Council.
The results of peak flows from the model are as follows:-
Catchment Peak Flow for Storm Event Average Recurrence Interval (m³)
5 10 20 50 100 PMF
S1 2.63/2.67 3.25/3.29 4.11/4.14 4.82/4.84 5.52/5.53 18.23
S2 3.48/3.49 4.28/4.32 5.40/5.42 6.31/6.31 7.25/7.26 24.61
S3 4.08/4.10 5.02/5.06 6.29/6.30 7.39/7.40 8.46/8.47 29.23
S4 4.51/4.53 5.57/5.60 6.98/7.0 8.16/8.18 9.4/9.41 32.79/32.83
N1 1.21 1.49 1.85 2.14 2.42
N2 1.41 1.73 2.13 2.44 2.75
N3 3.92 4.83 6.06 7.05 7.99 27.38
N4 4.63 5.68 7.12 8.26 9.41 32.50
N5 4.92 6.03 7.56 8.81 10.03 34.74
S5,S5RD+N6 10.09/10.11 12.45/12.48 15.73/15.76 18.5/18.54
21.28
/21.3 75.04/75.13
S6 10.6/10.62 13.13/13.17 16.6/16.63 19.52/19.56
22.45
/22.47 79.88/79.99
The second set of figures for catchments S1 to S6 indicate the change in flows through the site as a
result of the Narellan Road upgrade works. The changes in flows resulting from these works are not
considered significant.
The above results detail the results of initial modelling completed prior to discussions with Council.
The modelling of catchments S1, N1 and N2 was discussed and Council’s officer requested that the
detention effects of the Hume Motorway Embankment be accounted for. The model has now been
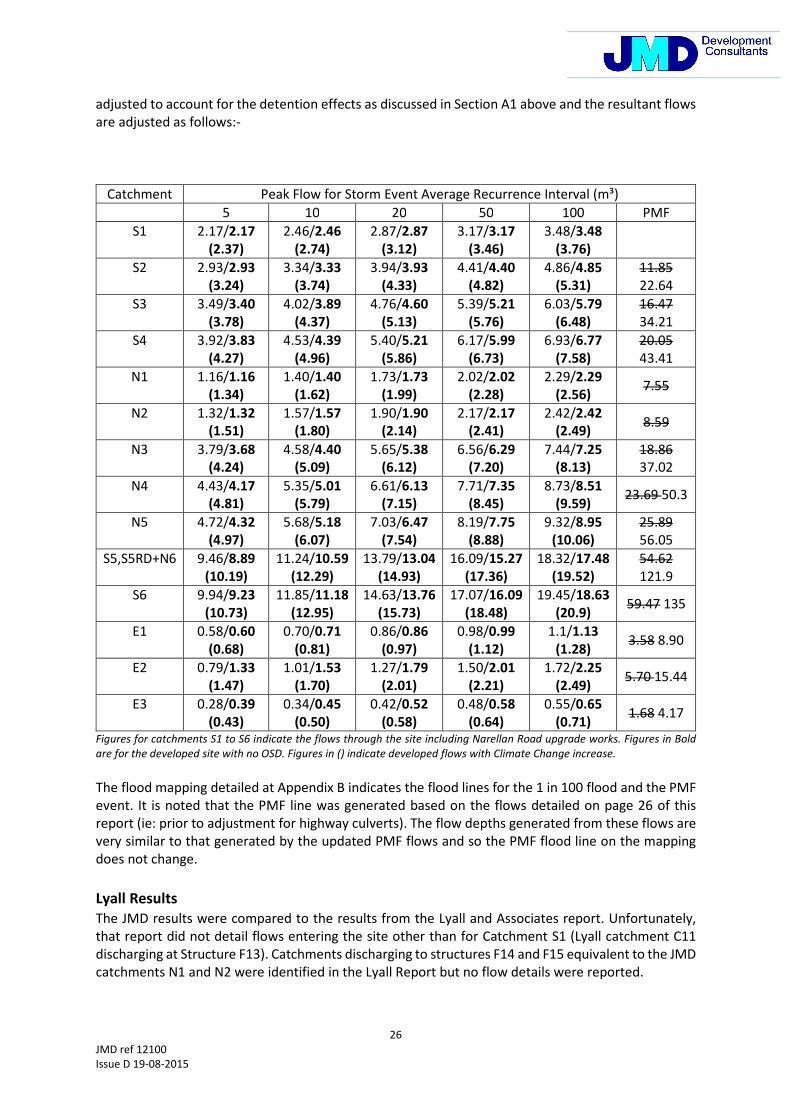
26
JMD ref 12100
Issue D 19-08-2015
adjusted to account for the detention effects as discussed in Section A1 above and the resultant flows
are adjusted as follows:-
Catchment Peak Flow for Storm Event Average Recurrence Interval (m³)
5 10 20 50 100 PMF
S1 2.17/2.17
(2.37)
2.46/2.46
(2.74)
2.87/2.87
(3.12)
3.17/3.17
(3.46)
3.48/3.48
(3.76)
S2 2.93/2.93
(3.24)
3.34/3.33
(3.74)
3.94/3.93
(4.33)
4.41/4.40
(4.82)
4.86/4.85
(5.31)
11.85
22.64
S3 3.49/3.40
(3.78)
4.02/3.89
(4.37)
4.76/4.60
(5.13)
5.39/5.21
(5.76)
6.03/5.79
(6.48)
16.47
34.21
S4 3.92/3.83
(4.27)
4.53/4.39
(4.96)
5.40/5.21
(5.86)
6.17/5.99
(6.73)
6.93/6.77
(7.58)
20.05
43.41
N1 1.16/1.16
(1.34)
1.40/1.40
(1.62)
1.73/1.73
(1.99)
2.02/2.02
(2.28)
2.29/2.29
(2.56) 7.55
N2 1.32/1.32
(1.51)
1.57/1.57
(1.80)
1.90/1.90
(2.14)
2.17/2.17
(2.41)
2.42/2.42
(2.49) 8.59
N3 3.79/3.68
(4.24)
4.58/4.40
(5.09)
5.65/5.38
(6.12)
6.56/6.29
(7.20)
7.44/7.25
(8.13)
18.86
37.02
N4 4.43/4.17
(4.81)
5.35/5.01
(5.79)
6.61/6.13
(7.15)
7.71/7.35
(8.45)
8.73/8.51
(9.59) 23.69 50.3
N5 4.72/4.32
(4.97)
5.68/5.18
(6.07)
7.03/6.47
(7.54)
8.19/7.75
(8.88)
9.32/8.95
(10.06)
25.89
56.05
S5,S5RD+N6 9.46/8.89
(10.19)
11.24/10.59
(12.29)
13.79/13.04
(14.93)
16.09/15.27
(17.36)
18.32/17.48
(19.52)
54.62
121.9
S6 9.94/9.23
(10.73)
11.85/11.18
(12.95)
14.63/13.76
(15.73)
17.07/16.09
(18.48)
19.45/18.63
(20.9) 59.47 135
E1 0.58/0.60
(0.68)
0.70/0.71
(0.81)
0.86/0.86
(0.97)
0.98/0.99
(1.12)
1.1/1.13
(1.28) 3.58 8.90
E2 0.79/1.33
(1.47)
1.01/1.53
(1.70)
1.27/1.79
(2.01)
1.50/2.01
(2.21)
1.72/2.25
(2.49) 5.70 15.44
E3 0.28/0.39
(0.43)
0.34/0.45
(0.50)
0.42/0.52
(0.58)
0.48/0.58
(0.64)
0.55/0.65
(0.71) 1.68 4.17
Figures for catchments S1 to S6 indicate the flows through the site including Narellan Road upgrade works. Figures in Bold
are for the developed site with no OSD. Figures in () indicate developed flows with Climate Change increase.
The flood mapping detailed at Appendix B indicates the flood lines for the 1 in 100 flood and the PMF
event. It is noted that the PMF line was generated based on the flows detailed on page 26 of this
report (ie: prior to adjustment for highway culverts). The flow depths generated from these flows are
very similar to that generated by the updated PMF flows and so the PMF flood line on the mapping
does not change.
Lyall Results
The JMD results were compared to the results from the Lyall and Associates report. Unfortunately,
that report did not detail flows entering the site other than for Catchment S1 (Lyall catchment C11
discharging at Structure F13). Catchments discharging to structures F14 and F15 equivalent to the JMD
catchments N1 and N2 were identified in the Lyall Report but no flow details were reported.

27
JMD ref 12100
Issue D 19-08-2015
The Lyall results for the Lyall Catchment C11 discharging to Structure F13 are reported at Table 5.2 of
the Lyall report as 2.71m³/s in the 5 yr event, 4.16m³/s in the 20 year event and 5.66m³/s in the 100
year event. These figures correspond to the initial JMD results for JMD Catchment S1.
Rust PPK Results
The Rust PPK report does not detail the catchment areas used to estimate the peak flow. The total
area draining to the south-east boundary of the Maryfields Site as estimated by JMD is 72.61ha.
Adopting the Rural Rational method as recommended in Australian Rainfall and Runoff,
t’c = 0.76A^0.38 A-catchment area in sq.km (0.7261km²)
= 40 minutes
I100 = 87mm/hr
C10 =0.6
FF100 =1.38
Q =fCIA
= 0.6 x 1.38 x 87 x 72.61 / 360
= 14.53m³/s
If the external catchments are excluded (JMD catchments S1, N1, N2 and S5RD) the catchment area
becomes 41.8ha and the resulting t’c = 33mins I100 = 97mm/h and the peak 100 year flow is 9.33m³/s.
It would seem then that the Rust PPK report only considered the flows off the local site and ignored
the flows off the external catchment.
The difference between the JMD flow peak 100 year flow (22.45m³/s) detailed above and the
14.53m³/s peak rational method flow of the combined catchment area in the above calculation results
from the use of more detailed site specific input data. The Rational Method is a generic flow estimation
only and is based on gross data and does not consider factors such as surface slope and roughness,
and catchment characteristics.
The Lyall calculations were undertaken using the DRAINS unit hydrograph type hydrological model
similar to the XP-Rafts model used by JMD and have achieved similar results.

28
JMD ref 12100
Issue D 19-08-2015
Appendix B
Catchment Plan
29
JMD ref 12100
Issue D 19-08-2015
Appendix C
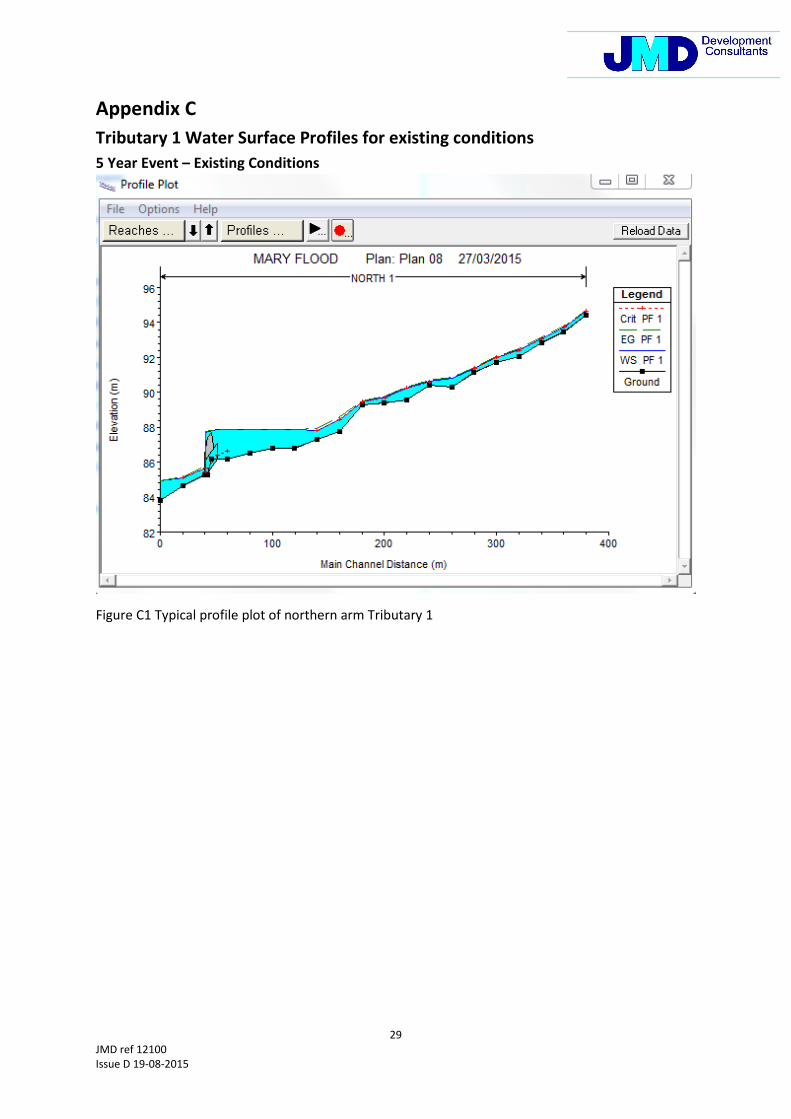
Tributary 1 Water Surface Profiles for existing conditions
5 Year Event – Existing Conditions
Figure C1 Typical profile plot of northern arm Tributary 1
30
JMD ref 12100
Issue D 19-08-2015
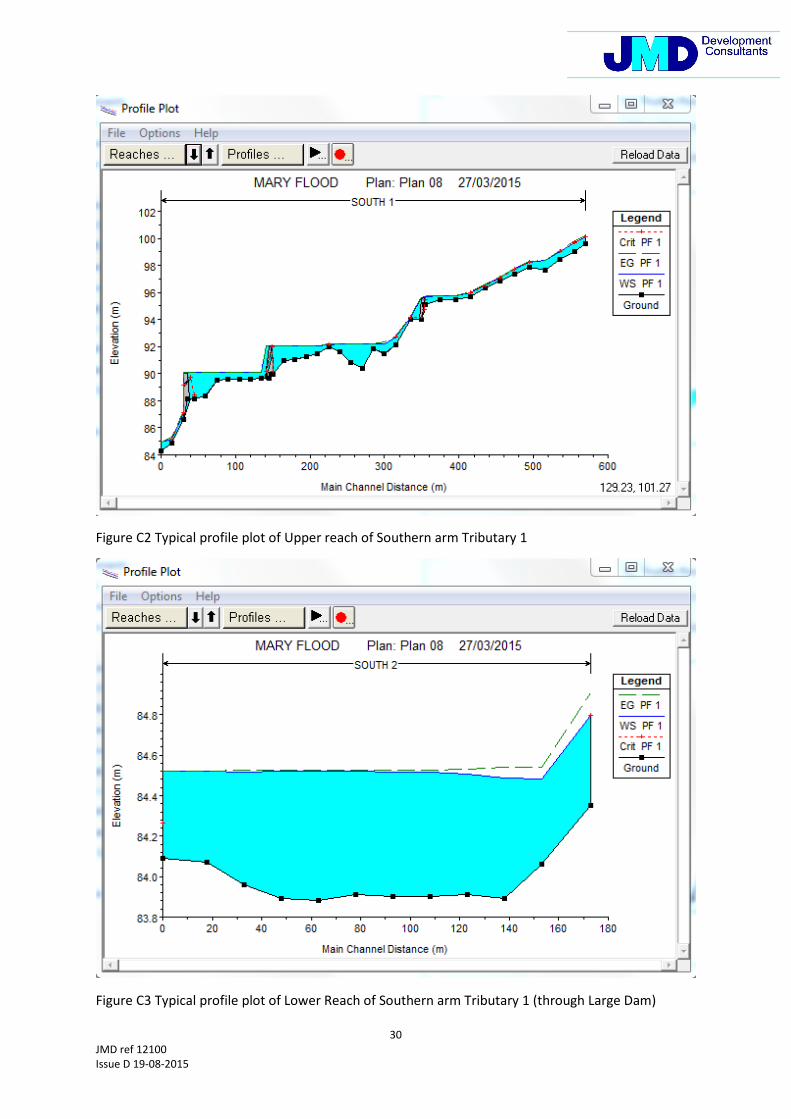
Figure C2 Typical profile plot of Upper reach of Southern arm Tributary 1
Figure C3 Typical profile plot of Lower Reach of Southern arm Tributary 1 (through Large Dam)

HEC-RAS Plan: Plan 07 Profile: PF 1
River Reach River Sta Profile Q Total Min Ch El W.S. Elev Crit W.S. E.G. Elev E.G. Slope Vel Chnl Flow Area Top Width Froude # Chl
(m3/s) (m) (m) (m) (m) (m/m) (m/s) (m2) (m)
SOUTH 1 855 PF 1 2.17 99.58 100.10 100.08 100.18 0.024093 1.48 1.90 9.47 0.77
SOUTH 1 840 PF 1 2.17 98.99 99.61 99.61 99.77 0.028946 1.81 1.30 4.43 0.88
SOUTH 1 820 PF 1 2.17 98.42 98.98 98.98 99.08 0.035304 1.49 1.63 8.20 0.91
SOUTH 1 800 PF 1 2.17 97.68 98.34 98.35 0.001984 0.36 6.11 24.81 0.23
SOUTH 1 780 PF 1 2.17 97.88 98.21 98.16 98.25 0.022286 0.92 2.44 15.40 0.71
SOUTH 1 760 PF 1 2.17 97.35 97.73 97.69 97.78 0.024636 1.03 2.11 11.14 0.76
SOUTH 1 740 PF 1 2.17 96.87 97.08 97.08 97.13 0.045626 0.92 2.36 23.60 0.93
SOUTH 1 720 PF 1 2.17 96.36 96.54 96.50 96.57 0.018400 0.74 2.95 21.11 0.63
SOUTH 1 700 PF 1 2.17 95.66 95.93 95.93 96.00 0.049171 1.17 1.85 13.65 1.01
SOUTH 1 680 PF 1 2.17 95.46 95.76 95.76 0.000833 0.22 10.28 47.80 0.14
SOUTH 1 660 PF 1 2.17 95.45 95.74 95.74 0.001158 0.21 10.22 59.03 0.16
SOUTH 1 640 PF 1 2.93 95.08 95.71 95.43 95.71 0.001642 0.31 11.09 72.15 0.20
SOUTH 1 638 Culvert
SOUTH 1 620 PF 1 2.93 93.99 94.16 94.16 94.23 0.048559 1.16 2.52 18.56 1.01
SOUTH 1 600 PF 1 2.93 92.12 92.65 92.65 92.77 0.040270 1.51 1.96 8.88 0.99
SOUTH 1 585 PF 1 2.93 91.48 92.20 92.29 0.017442 1.33 2.25 6.23 0.71
SOUTH 1 570 PF 1 2.93 91.85 92.19 92.20 0.002160 0.32 6.49 21.18 0.23
SOUTH 1 555 PF 1 2.93 90.39 92.19 92.19 0.000016 0.08 38.17 39.56 0.03
SOUTH 1 540 PF 1 2.93 90.84 92.19 92.19 0.000025 0.08 34.84 45.16 0.03
SOUTH 1 525 PF 1 2.93 91.64 92.19 92.19 0.000286 0.17 17.40 49.59 0.09
SOUTH 1 510 PF 1 2.93 92.02 92.14 92.14 92.17 0.061049 0.83 3.56 52.87 1.01
SOUTH 1 495 PF 1 2.93 91.51 92.08 92.08 0.000368 0.19 17.59 64.02 0.10
SOUTH 1 480 PF 1 2.93 91.24 92.08 92.08 0.000033 0.09 38.74 80.07 0.03
SOUTH 1 465 PF 1 2.93 91.06 92.08 92.08 0.000024 0.08 42.43 86.31 0.03
SOUTH 1 450 PF 1 2.93 90.95 92.08 92.08 0.000021 0.06 50.66 103.53 0.03
SOUTH 1 435 PF 1 3.49 89.98 92.08 90.16 92.08 0.000001 0.03 131.90 105.86 0.01
SOUTH 1 433 Culvert
SOUTH 1 420 PF 1 3.49 89.66 90.10 90.10 0.000255 0.17 21.42 63.24 0.09
SOUTH 1 405 PF 1 3.49 89.59 90.09 90.09 0.000204 0.15 23.64 63.93 0.08
SOUTH 1 390 PF 1 3.49 89.57 90.09 90.09 0.000238 0.17 21.81 62.77 0.08
SOUTH 1 375 PF 1 3.49 89.59 90.08 90.08 0.000560 0.20 17.09 60.81 0.12
SOUTH 1 360 PF 1 3.49 89.54 90.07 90.07 0.000807 0.22 15.77 65.79 0.14
SOUTH 1 345 PF 1 3.49 88.35 90.07 90.07 0.000041 0.11 42.15 94.78 0.04
SOUTH 1 330 PF 1 3.49 88.11 90.07 88.38 90.07 0.000002 0.03 120.89 129.04 0.01
SOUTH 1 320 Culvert
SOUTH 1 315 PF 1 3.49 86.63 87.11 87.11 87.21 0.044002 1.43 2.43 12.04 1.02
SOUTH 1 300 PF 1 3.49 84.89 85.17 85.17 85.25 0.045934 1.29 2.70 16.29 1.01
SOUTH 1 285 PF 1 3.49 84.26 84.90 84.91 0.000564 0.26 13.31 32.65 0.13
SOUTH 2 274.9 PF 1 9.46 84.35 84.78 84.78 84.89 0.000000 1.48 6.39 29.53 1.02
SOUTH 2 255 PF 1 9.46 84.06 84.49 84.54 0.000000 1.00 9.42 38.92 0.65
SOUTH 2 240 PF 1 9.46 83.89 84.49 84.54 0.000000 0.90 10.52 45.74 0.60
SOUTH 2 225 PF 1 9.46 83.91 84.51 84.53 0.000000 0.63 17.37 60.01 0.37
SOUTH 2 210 PF 1 9.46 83.90 84.52 84.53 0.000000 0.40 24.12 61.48 0.20
SOUTH 2 195 PF 1 9.46 83.90 84.52 84.53 0.000000 0.44 22.18 60.62 0.22
SOUTH 2 180 PF 1 9.46 83.91 84.52 84.52 0.000000 0.32 30.43 78.77 0.16
SOUTH 2 165 PF 1 9.46 83.88 84.52 84.52 0.000000 0.28 34.25 80.86 0.14
SOUTH 2 150 PF 1 9.46 83.89 84.52 84.52 0.000000 0.25 38.28 85.13 0.12
SOUTH 2 135 PF 1 9.46 83.96 84.52 84.52 0.000000 0.31 34.90 83.41 0.14
SOUTH 2 120 PF 1 9.46 84.07 84.52 84.52 0.000000 0.22 47.44 125.49 0.11
SOUTH 2 102 PF 1 9.46 84.09 84.52 84.26 84.52 0.000000 0.21 45.87 142.53 0.12
NORTH 1 560 PF 1 2.48 94.41 94.62 94.62 94.68 0.032360 1.11 2.24 18.30 1.01
NORTH 1 540 PF 1 2.48 93.44 93.73 93.73 93.81 0.028969 1.29 1.94 12.16 1.01
NORTH 1 520 PF 1 2.48 92.83 93.08 93.08 93.16 0.029984 1.27 1.96 12.33 1.01
NORTH 1 500 PF 1 2.48 92.06 92.43 92.40 92.51 0.017511 1.24 2.00 8.58 0.82
NORTH 1 480 PF 1 2.48 91.70 91.97 91.97 92.06 0.029382 1.30 1.91 11.38 1.01
NORTH 1 460 PF 1 2.48 91.12 91.36 91.36 91.43 0.030230 1.23 2.02 13.44 1.01
NORTH 1 440 PF 1 2.48 90.30 90.82 90.85 0.006554 0.78 3.20 13.24 0.50
NORTH 1 420 PF 1 2.48 90.39 90.64 90.59 90.68 0.011457 0.86 2.87 15.66 0.64
NORTH 1 400 PF 1 2.48 89.59 90.24 90.24 90.31 0.032303 1.20 2.07 14.88 1.02
NORTH 1 380 PF 1 3.79 89.42 89.75 89.68 89.77 0.007304 0.71 5.36 28.14 0.52
NORTH 1 360 PF 1 3.79 89.27 89.44 89.44 89.50 0.031428 1.15 3.29 24.77 1.01
NORTH 1 340 PF 1 3.79 87.75 88.41 88.41 88.58 0.024240 1.82 2.08 6.29 1.01
NORTH 1 320 PF 1 3.79 87.31 87.82 87.82 87.92 0.024650 1.42 2.67 12.40 0.97
NORTH 1 300 PF 1 3.79 86.79 87.86 87.87 0.000191 0.30 12.54 14.95 0.11
NORTH 1 280 PF 1 3.79 86.82 87.86 87.86 0.000088 0.20 18.70 22.95 0.07
NORTH 1 260 PF 1 3.79 86.51 87.86 87.86 0.000025 0.12 32.84 39.05 0.04
NORTH 1 240 PF 1 3.79 86.18 87.86 86.64 87.86 0.000024 0.13 31.05 48.84 0.04
NORTH 1 226 Culvert
NORTH 1 220 PF 1 3.79 85.27 85.65 85.65 85.80 0.024806 1.68 2.25 7.94 1.01
NORTH 1 200 PF 1 3.79 84.66 85.07 85.07 85.14 0.034737 1.12 3.41 29.17 1.04
NORTH 1 180 PF 1 3.79 83.83 84.90 84.91 0.000394 0.28 13.38 30.62 0.14

31
JMD ref 12100
Issue D 19-08-2015
10 Year Event – Existing Conditions

HEC-RAS Plan: Plan 07 Profile: PF 1
River Reach River Sta Profile Q Total Min Ch El W.S. Elev Crit W.S. E.G. Elev E.G. Slope Vel Chnl Flow Area Top Width Froude # Chl
(m3/s) (m) (m) (m) (m) (m/m) (m/s) (m2) (m)
SOUTH 1 855 PF 1 2.46 99.58 100.12 100.09 100.20 0.024004 1.53 2.11 10.04 0.77
SOUTH 1 840 PF 1 2.46 98.99 99.67 99.67 99.81 0.027395 1.74 1.56 5.40 0.86
SOUTH 1 820 PF 1 2.46 98.42 99.00 99.00 99.11 0.035404 1.53 1.80 8.74 0.92
SOUTH 1 800 PF 1 2.46 97.68 98.36 98.37 0.002004 0.38 6.58 25.08 0.23
SOUTH 1 780 PF 1 2.46 97.88 98.23 98.18 98.27 0.021557 0.92 2.76 16.77 0.70
SOUTH 1 760 PF 1 2.46 97.35 97.74 97.71 97.80 0.025451 1.08 2.29 11.60 0.78
SOUTH 1 740 PF 1 2.46 96.87 97.09 97.09 97.14 0.044587 0.93 2.63 25.34 0.92
SOUTH 1 720 PF 1 2.46 96.36 96.56 96.51 96.59 0.018415 0.77 3.21 21.78 0.63
SOUTH 1 700 PF 1 2.46 95.66 95.95 95.95 96.02 0.048358 1.20 2.05 14.35 1.01
SOUTH 1 680 PF 1 2.46 95.46 95.77 95.77 0.000897 0.23 10.87 48.20 0.15
SOUTH 1 660 PF 1 2.46 95.45 95.75 95.75 0.001216 0.23 10.87 59.27 0.17
SOUTH 1 640 PF 1 3.34 95.08 95.72 95.45 95.72 0.001853 0.33 11.67 72.52 0.22
SOUTH 1 638 Culvert
SOUTH 1 620 PF 1 3.34 93.99 94.17 94.17 94.25 0.046990 1.21 2.77 19.17 1.00
SOUTH 1 600 PF 1 3.34 92.12 92.68 92.68 92.79 0.039543 1.52 2.22 9.96 0.99
SOUTH 1 585 PF 1 3.34 91.48 92.22 92.32 0.020700 1.47 2.33 6.35 0.77
SOUTH 1 570 PF 1 3.34 91.85 92.20 92.21 0.002567 0.36 6.71 21.39 0.25
SOUTH 1 555 PF 1 3.34 90.39 92.20 92.21 0.000020 0.09 38.65 39.79 0.03
SOUTH 1 540 PF 1 3.34 90.84 92.20 92.20 0.000031 0.10 35.37 45.19 0.03
SOUTH 1 525 PF 1 3.34 91.64 92.20 92.20 0.000334 0.19 17.97 49.63 0.10
SOUTH 1 510 PF 1 3.34 92.02 92.15 92.15 92.18 0.057738 0.86 3.92 53.02 1.00
SOUTH 1 495 PF 1 3.34 91.51 92.09 92.09 0.000408 0.20 18.53 64.35 0.11
SOUTH 1 480 PF 1 3.34 91.24 92.09 92.09 0.000039 0.10 39.91 80.27 0.04
SOUTH 1 465 PF 1 3.34 91.06 92.09 92.09 0.000029 0.08 43.68 86.66 0.03
SOUTH 1 450 PF 1 3.34 90.95 92.09 92.09 0.000025 0.06 52.15 103.72 0.03
SOUTH 1 435 PF 1 4.53 89.98 92.09 90.18 92.09 0.000002 0.04 133.43 106.17 0.01
SOUTH 1 433 Culvert
SOUTH 1 420 PF 1 4.53 89.66 90.12 90.12 0.000350 0.21 22.92 64.38 0.10
SOUTH 1 405 PF 1 4.53 89.59 90.11 90.12 0.000290 0.18 25.07 65.01 0.09
SOUTH 1 390 PF 1 4.53 89.57 90.11 90.11 0.000336 0.21 23.11 63.75 0.10
SOUTH 1 375 PF 1 4.53 89.59 90.10 90.10 0.000777 0.25 18.21 61.76 0.15
SOUTH 1 360 PF 1 4.53 89.54 90.09 90.09 0.001157 0.27 16.69 67.20 0.17
SOUTH 1 345 PF 1 4.53 88.35 90.09 90.09 0.000064 0.13 43.45 95.88 0.05
SOUTH 1 330 PF 1 4.53 88.11 90.09 88.41 90.09 0.000003 0.04 122.68 130.12 0.01
SOUTH 1 320 Culvert
SOUTH 1 315 PF 1 4.53 86.63 87.15 87.15 87.27 0.042266 1.50 3.01 13.49 1.01
SOUTH 1 300 PF 1 4.53 84.89 85.20 85.20 85.30 0.042963 1.40 3.25 16.58 1.01
SOUTH 1 285 PF 1 4.53 84.26 84.94 84.94 0.000715 0.31 14.56 33.03 0.15
SOUTH 2 274.9 PF 1 11.24 84.35 84.81 84.81 84.93 0.000000 1.53 7.35 31.67 1.01
SOUTH 2 255 PF 1 11.24 84.06 84.50 84.56 0.000000 1.15 9.81 39.49 0.73
SOUTH 2 240 PF 1 11.24 83.89 84.51 84.56 0.000000 1.01 11.13 46.77 0.66
SOUTH 2 225 PF 1 11.24 83.91 84.53 84.55 0.000000 0.71 18.40 61.35 0.41
SOUTH 2 210 PF 1 11.24 83.90 84.54 84.55 0.000000 0.46 25.31 62.65 0.23
SOUTH 2 195 PF 1 11.24 83.90 84.53 84.55 0.000000 0.51 23.31 61.72 0.25
SOUTH 2 180 PF 1 11.24 83.91 84.54 84.54 0.000000 0.36 31.98 79.98 0.17
SOUTH 2 165 PF 1 11.24 83.88 84.54 84.54 0.000000 0.32 35.85 81.87 0.15
SOUTH 2 150 PF 1 11.24 83.89 84.54 84.54 0.000000 0.29 39.98 86.37 0.13
SOUTH 2 135 PF 1 11.24 83.96 84.54 84.54 0.000000 0.36 36.56 88.96 0.16
SOUTH 2 120 PF 1 11.24 84.07 84.54 84.54 0.000000 0.24 49.93 126.45 0.12
SOUTH 2 102 PF 1 11.24 84.09 84.54 84.27 84.54 0.000000 0.24 48.69 143.01 0.13
NORTH 1 560 PF 1 2.97 94.41 94.64 94.64 94.71 0.031588 1.15 2.58 19.46 1.01
NORTH 1 540 PF 1 2.97 93.44 93.75 93.75 93.85 0.027263 1.35 2.22 12.42 1.00
NORTH 1 520 PF 1 2.97 92.83 93.10 93.10 93.20 0.028840 1.34 2.22 12.44 1.01
NORTH 1 500 PF 1 2.97 92.06 92.45 92.42 92.54 0.018654 1.35 2.20 8.70 0.86
NORTH 1 480 PF 1 2.97 91.70 92.00 92.00 92.09 0.027807 1.37 2.17 11.52 1.01
NORTH 1 460 PF 1 2.97 91.12 91.38 91.38 91.46 0.029264 1.29 2.30 13.84 1.01
NORTH 1 440 PF 1 2.97 90.30 90.85 90.88 0.006831 0.82 3.61 14.07 0.52
NORTH 1 420 PF 1 2.97 90.39 90.66 90.61 90.71 0.011809 0.93 3.20 16.03 0.66
NORTH 1 400 PF 1 2.97 89.59 90.26 90.26 90.34 0.030834 1.25 2.37 15.34 1.02
NORTH 1 380 PF 1 4.58 89.42 89.77 89.69 89.80 0.007550 0.77 5.97 28.55 0.53
NORTH 1 360 PF 1 4.58 89.27 89.46 89.46 89.53 0.029518 1.21 3.77 25.11 1.00
NORTH 1 340 PF 1 4.58 87.75 88.47 88.47 88.65 0.023383 1.88 2.43 6.80 1.01
NORTH 1 320 PF 1 4.58 87.31 87.84 87.84 87.96 0.026495 1.56 2.95 12.61 1.02
NORTH 1 300 PF 1 4.58 86.79 87.88 87.89 0.000259 0.36 12.85 15.06 0.12
NORTH 1 280 PF 1 4.58 86.82 87.88 87.89 0.000119 0.24 19.18 23.09 0.08
NORTH 1 260 PF 1 4.58 86.51 87.88 87.88 0.000034 0.14 33.66 39.27 0.05
NORTH 1 240 PF 1 4.58 86.18 87.88 86.67 87.88 0.000033 0.15 32.08 50.26 0.05
NORTH 1 226 Culvert
NORTH 1 220 PF 1 4.58 85.27 85.69 85.69 85.85 0.024737 1.79 2.56 8.17 1.02
NORTH 1 200 PF 1 4.58 84.66 85.09 85.09 85.16 0.030909 1.16 3.97 29.49 1.00
NORTH 1 180 PF 1 4.58 83.83 84.94 84.94 0.000460 0.31 14.59 32.17 0.15

32
JMD ref 12100
Issue D 19-08-2015
20 Year Event – Existing Conditions

HEC-RAS Plan: Plan 07 Profile: PF 1
River Reach River Sta Profile Q Total Min Ch El W.S. Elev Crit W.S. E.G. Elev E.G. Slope Vel Chnl Flow Area Top Width Froude # Chl
(m3/s) (m) (m) (m) (m) (m/m) (m/s) (m2) (m)
SOUTH 1 855 PF 1 2.87 99.58 100.16 100.12 100.23 0.022054 1.55 2.47 10.98 0.75
SOUTH 1 840 PF 1 2.87 98.99 99.71 99.71 99.85 0.028571 1.74 1.84 6.40 0.87
SOUTH 1 820 PF 1 2.87 98.42 99.03 99.03 99.14 0.034039 1.55 2.08 9.54 0.91
SOUTH 1 800 PF 1 2.87 97.68 98.38 98.39 0.002072 0.41 7.18 25.41 0.24
SOUTH 1 780 PF 1 2.87 97.88 98.25 98.20 98.30 0.020686 0.93 3.19 18.49 0.69
SOUTH 1 760 PF 1 2.87 97.35 97.76 97.73 97.83 0.026433 1.14 2.53 12.20 0.80
SOUTH 1 740 PF 1 2.87 96.87 97.11 97.10 97.15 0.043858 0.96 3.00 27.48 0.92
SOUTH 1 720 PF 1 2.87 96.36 96.57 96.52 96.60 0.018488 0.81 3.56 22.65 0.64
SOUTH 1 700 PF 1 2.87 95.66 95.96 95.96 96.04 0.047324 1.24 2.32 15.26 1.01
SOUTH 1 680 PF 1 2.87 95.46 95.79 95.79 0.000981 0.26 11.65 48.73 0.16
SOUTH 1 660 PF 1 2.87 95.45 95.77 95.77 0.001287 0.25 11.75 59.58 0.18
SOUTH 1 640 PF 1 3.94 95.08 95.73 95.47 95.73 0.002162 0.37 12.43 73.00 0.24
SOUTH 1 638 Culvert
SOUTH 1 620 PF 1 3.94 93.99 94.19 94.19 94.27 0.044981 1.26 3.14 20.02 1.00
SOUTH 1 600 PF 1 3.94 92.12 92.71 92.71 92.83 0.038549 1.54 2.60 11.33 0.98
SOUTH 1 585 PF 1 3.94 91.48 92.23 92.37 0.025599 1.65 2.44 6.51 0.86
SOUTH 1 570 PF 1 3.94 91.85 92.21 92.23 0.003161 0.42 7.03 21.69 0.28
SOUTH 1 555 PF 1 3.94 90.39 92.22 92.22 0.000026 0.10 39.33 40.12 0.03
SOUTH 1 540 PF 1 3.94 90.84 92.22 92.22 0.000040 0.11 36.14 45.24 0.04
SOUTH 1 525 PF 1 3.94 91.64 92.22 92.22 0.000402 0.21 18.77 49.68 0.11
SOUTH 1 510 PF 1 3.94 92.02 92.15 92.15 92.20 0.057217 0.91 4.35 53.20 1.01
SOUTH 1 495 PF 1 3.94 91.51 92.10 92.11 0.000500 0.23 19.31 64.72 0.12
SOUTH 1 480 PF 1 3.94 91.24 92.10 92.10 0.000050 0.12 40.87 80.44 0.04
SOUTH 1 465 PF 1 3.94 91.06 92.10 92.10 0.000037 0.10 44.71 86.94 0.04
SOUTH 1 450 PF 1 3.94 90.95 92.10 92.10 0.000033 0.07 53.37 103.87 0.03
SOUTH 1 435 PF 1 5.40 89.98 92.10 90.20 92.10 0.000003 0.05 134.67 106.41 0.01
SOUTH 1 433 Culvert
SOUTH 1 420 PF 1 5.40 89.66 90.14 90.14 0.000427 0.24 24.12 65.27 0.12
SOUTH 1 405 PF 1 5.40 89.59 90.13 90.13 0.000357 0.21 26.21 65.63 0.10
SOUTH 1 390 PF 1 5.40 89.57 90.13 90.13 0.000418 0.24 24.16 64.52 0.11
SOUTH 1 375 PF 1 5.40 89.59 90.11 90.12 0.000956 0.28 19.09 62.51 0.16
SOUTH 1 360 PF 1 5.40 89.54 90.10 90.10 0.001445 0.31 17.40 67.75 0.19
SOUTH 1 345 PF 1 5.40 88.35 90.10 90.10 0.000085 0.16 44.46 96.72 0.05
SOUTH 1 330 PF 1 5.40 88.11 90.10 88.43 90.10 0.000004 0.05 124.05 130.95 0.01
SOUTH 1 320 Culvert
SOUTH 1 315 PF 1 5.40 86.63 87.18 87.18 87.31 0.040577 1.55 3.47 14.32 1.01
SOUTH 1 300 PF 1 5.40 84.89 85.22 85.22 85.33 0.041512 1.47 3.67 16.81 1.01
SOUTH 1 285 PF 1 5.40 84.26 84.99 85.00 0.000722 0.33 16.23 33.53 0.15
SOUTH 2 274.9 PF 1 13.79 84.35 84.85 84.85 84.98 0.000000 1.59 8.65 34.36 1.01
SOUTH 2 255 PF 1 13.79 84.06 84.49 84.48 84.60 0.000000 1.42 9.72 39.36 0.91
SOUTH 2 240 PF 1 13.79 83.89 84.51 84.59 0.000000 1.21 11.43 47.27 0.78
SOUTH 2 225 PF 1 13.79 83.91 84.54 84.58 0.000000 0.83 19.33 62.61 0.47
SOUTH 2 210 PF 1 13.79 83.90 84.56 84.57 0.000000 0.54 26.50 63.82 0.26
SOUTH 2 195 PF 1 13.79 83.90 84.55 84.57 0.000000 0.60 24.41 63.07 0.29
SOUTH 2 180 PF 1 13.79 83.91 84.56 84.57 0.000000 0.42 33.55 81.20 0.20
SOUTH 2 165 PF 1 13.79 83.88 84.56 84.57 0.000000 0.37 37.48 82.34 0.17
SOUTH 2 150 PF 1 13.79 83.89 84.56 84.57 0.000000 0.34 41.73 87.63 0.15
SOUTH 2 135 PF 1 13.79 83.96 84.56 84.57 0.000000 0.42 38.30 94.47 0.18
SOUTH 2 120 PF 1 13.79 84.07 84.56 84.56 0.000000 0.29 52.47 127.42 0.14
SOUTH 2 102 PF 1 13.79 84.09 84.56 84.28 84.56 0.000000 0.28 51.58 143.49 0.15
NORTH 1 560 PF 1 3.63 94.41 94.66 94.66 94.73 0.030654 1.20 3.02 20.89 1.01
NORTH 1 540 PF 1 3.63 93.44 93.78 93.78 93.88 0.026238 1.44 2.56 12.72 1.00
NORTH 1 520 PF 1 3.63 92.83 93.13 93.13 93.23 0.027571 1.43 2.55 12.58 1.01
NORTH 1 500 PF 1 3.63 92.06 92.48 92.46 92.59 0.019489 1.47 2.46 8.86 0.89
NORTH 1 480 PF 1 3.63 91.70 92.02 92.02 92.13 0.027093 1.46 2.48 11.69 1.01
NORTH 1 460 PF 1 3.63 91.12 91.40 91.40 91.50 0.027717 1.36 2.68 14.36 1.00
NORTH 1 440 PF 1 3.63 90.30 90.88 90.92 0.007101 0.88 4.13 15.07 0.54
NORTH 1 420 PF 1 3.63 90.39 90.69 90.63 90.74 0.012387 1.01 3.60 16.47 0.69
NORTH 1 400 PF 1 3.63 89.59 90.29 90.29 90.37 0.028664 1.31 2.77 15.94 1.00
NORTH 1 380 PF 1 5.65 89.42 89.80 89.83 0.007583 0.83 6.82 29.11 0.55
NORTH 1 360 PF 1 5.65 89.27 89.48 89.48 89.57 0.028780 1.30 4.34 25.50 1.01
NORTH 1 340 PF 1 5.65 87.75 88.53 88.53 88.72 0.023041 1.97 2.86 7.37 1.01
NORTH 1 320 PF 1 5.65 87.31 87.88 87.88 88.02 0.025057 1.66 3.44 12.98 1.01
NORTH 1 300 PF 1 5.65 86.79 87.91 87.92 0.000361 0.43 13.24 15.19 0.15
NORTH 1 280 PF 1 5.65 86.82 87.91 87.91 0.000165 0.29 19.78 23.26 0.10
NORTH 1 260 PF 1 5.65 86.51 87.91 87.91 0.000047 0.17 34.68 39.53 0.05
NORTH 1 240 PF 1 5.65 86.18 87.91 86.72 87.91 0.000047 0.18 33.38 52.02 0.06
NORTH 1 226 Culvert
NORTH 1 220 PF 1 5.65 85.27 85.77 85.77 85.92 0.024108 1.71 3.31 11.17 1.00
NORTH 1 200 PF 1 5.65 84.66 85.11 85.11 85.19 0.031029 1.26 4.52 29.81 1.02
NORTH 1 180 PF 1 5.65 83.83 84.99 85.00 0.000532 0.35 16.23 34.15 0.16

33
JMD ref 12100
Issue D 19-08-2015
50 Year Event – Existing Conditions

HEC-RAS Plan: Plan 07 Profile: PF 1
River Reach River Sta Profile Q Total Min Ch El W.S. Elev Crit W.S. E.G. Elev E.G. Slope Vel Chnl Flow Area Top Width Froude # Chl
(m3/s) (m) (m) (m) (m) (m/m) (m/s) (m2) (m)
SOUTH 1 855 PF 1 3.17 99.58 100.18 100.14 100.26 0.021061 1.57 2.72 11.58 0.74
SOUTH 1 840 PF 1 3.17 98.99 99.74 99.74 99.88 0.029224 1.75 2.02 6.98 0.89
SOUTH 1 820 PF 1 3.17 98.42 99.05 99.05 99.16 0.034019 1.58 2.26 10.01 0.91
SOUTH 1 800 PF 1 3.17 97.68 98.40 98.41 0.002102 0.42 7.61 25.65 0.24
SOUTH 1 780 PF 1 3.17 97.88 98.27 98.22 98.31 0.020189 0.94 3.49 19.61 0.68
SOUTH 1 760 PF 1 3.17 97.35 97.78 97.74 97.85 0.026907 1.17 2.71 12.63 0.81
SOUTH 1 740 PF 1 3.17 96.87 97.12 97.11 97.17 0.043610 0.97 3.25 28.87 0.93
SOUTH 1 720 PF 1 3.17 96.36 96.58 96.53 96.62 0.018548 0.84 3.81 23.25 0.65
SOUTH 1 700 PF 1 3.17 95.66 95.98 95.98 96.06 0.046789 1.26 2.51 15.88 1.01
SOUTH 1 680 PF 1 3.17 95.46 95.80 95.80 0.001019 0.27 12.26 49.13 0.16
SOUTH 1 660 PF 1 3.17 95.45 95.78 95.78 0.001308 0.26 12.42 59.83 0.18
SOUTH 1 640 PF 1 4.41 95.08 95.74 95.49 95.74 0.002366 0.40 13.04 73.39 0.25
SOUTH 1 638 Culvert
SOUTH 1 620 PF 1 4.41 93.99 94.21 94.21 94.29 0.043997 1.30 3.41 20.63 1.00
SOUTH 1 600 PF 1 4.41 92.12 92.76 92.74 92.86 0.031055 1.44 3.15 13.03 0.89
SOUTH 1 585 PF 1 4.41 91.48 92.24 92.21 92.40 0.029559 1.79 2.52 6.63 0.93
SOUTH 1 570 PF 1 4.41 91.85 92.22 92.24 0.003627 0.46 7.27 21.91 0.30
SOUTH 1 555 PF 1 4.41 90.39 92.23 92.23 0.000032 0.11 39.83 40.36 0.04
SOUTH 1 540 PF 1 4.41 90.84 92.23 92.23 0.000048 0.12 36.70 45.27 0.04
SOUTH 1 525 PF 1 4.41 91.64 92.23 92.23 0.000454 0.23 19.37 49.72 0.12
SOUTH 1 510 PF 1 4.41 92.02 92.16 92.16 92.21 0.055376 0.94 4.70 53.36 1.01
SOUTH 1 495 PF 1 4.41 91.51 92.10 92.11 0.000624 0.26 19.33 64.73 0.14
SOUTH 1 480 PF 1 4.41 91.24 92.10 92.10 0.000063 0.13 40.87 80.44 0.05
SOUTH 1 465 PF 1 4.41 91.06 92.10 92.10 0.000047 0.11 44.70 86.94 0.04
SOUTH 1 450 PF 1 4.41 90.95 92.10 92.10 0.000041 0.08 53.35 103.87 0.04
SOUTH 1 435 PF 1 6.17 89.98 92.10 90.21 92.10 0.000003 0.06 134.66 106.41 0.01
SOUTH 1 433 Culvert
SOUTH 1 420 PF 1 6.17 89.66 90.15 90.16 0.000491 0.26 25.14 66.03 0.12
SOUTH 1 405 PF 1 6.17 89.59 90.15 90.15 0.000413 0.23 27.19 66.05 0.11
SOUTH 1 390 PF 1 6.17 89.57 90.14 90.14 0.000489 0.26 25.05 65.17 0.12
SOUTH 1 375 PF 1 6.17 89.59 90.13 90.13 0.001109 0.31 19.84 63.13 0.18
SOUTH 1 360 PF 1 6.17 89.54 90.10 90.11 0.001700 0.35 18.00 68.20 0.21
SOUTH 1 345 PF 1 6.17 88.35 90.10 90.11 0.000106 0.17 45.30 97.42 0.06
SOUTH 1 330 PF 1 6.17 88.11 90.10 88.45 90.10 0.000005 0.06 125.20 131.64 0.02
SOUTH 1 320 Culvert
SOUTH 1 315 PF 1 6.17 86.63 87.21 87.21 87.34 0.039918 1.62 3.80 14.48 1.01
SOUTH 1 300 PF 1 6.17 84.89 85.24 85.24 85.36 0.040416 1.53 4.02 16.99 1.01
SOUTH 1 285 PF 1 6.17 84.26 85.03 85.04 0.000732 0.35 17.59 33.93 0.16
SOUTH 2 274.9 PF 1 16.09 84.35 84.89 84.89 85.02 0.000000 1.64 9.79 36.56 1.01
SOUTH 2 255 PF 1 16.09 84.06 84.50 84.50 84.63 0.000000 1.60 10.09 39.89 1.01
SOUTH 2 240 PF 1 16.09 83.89 84.52 84.49 84.62 0.000000 1.37 11.77 47.82 0.88
SOUTH 2 225 PF 1 16.09 83.91 84.56 84.60 0.000000 0.93 20.30 63.90 0.51
SOUTH 2 210 PF 1 16.09 83.90 84.57 84.59 0.000000 0.60 27.71 64.98 0.29
SOUTH 2 195 PF 1 16.09 83.90 84.57 84.59 0.000000 0.67 25.54 64.56 0.32
SOUTH 2 180 PF 1 16.09 83.91 84.58 84.59 0.000000 0.47 35.12 82.40 0.22
SOUTH 2 165 PF 1 16.09 83.88 84.58 84.59 0.000000 0.42 39.10 82.78 0.19
SOUTH 2 150 PF 1 16.09 83.89 84.58 84.59 0.000000 0.38 43.47 88.88 0.17
SOUTH 2 135 PF 1 16.09 83.96 84.58 84.59 0.000000 0.48 40.10 97.34 0.20
SOUTH 2 120 PF 1 16.09 84.07 84.58 84.58 0.000000 0.32 54.99 128.37 0.15
SOUTH 2 102 PF 1 16.09 84.09 84.58 84.30 84.58 0.000000 0.31 54.42 143.97 0.16
NORTH 1 560 PF 1 4.19 94.41 94.68 94.68 94.75 0.030062 1.24 3.39 22.23 1.01
NORTH 1 540 PF 1 4.19 93.44 93.80 93.80 93.92 0.024839 1.49 2.85 12.99 0.99
NORTH 1 520 PF 1 4.19 92.83 93.15 93.15 93.26 0.026771 1.49 2.81 12.69 1.01
NORTH 1 500 PF 1 4.19 92.06 92.50 92.48 92.63 0.020556 1.58 2.66 8.97 0.92
NORTH 1 480 PF 1 4.19 91.70 92.05 92.05 92.16 0.026094 1.52 2.75 11.83 1.01
NORTH 1 460 PF 1 4.19 91.12 91.42 91.42 91.52 0.027462 1.42 2.96 14.74 1.01
NORTH 1 440 PF 1 4.19 90.30 90.91 90.95 0.007334 0.92 4.55 15.81 0.55
NORTH 1 420 PF 1 4.19 90.39 90.71 90.65 90.76 0.012374 1.06 3.96 16.85 0.70
NORTH 1 400 PF 1 4.19 89.59 90.30 90.30 90.40 0.028783 1.37 3.05 16.34 1.01
NORTH 1 380 PF 1 6.56 89.42 89.82 89.86 0.007610 0.88 7.49 29.57 0.55
NORTH 1 360 PF 1 6.56 89.27 89.50 89.50 89.59 0.027840 1.36 4.82 25.82 1.01
NORTH 1 340 PF 1 6.56 87.75 88.57 88.57 88.78 0.022621 2.04 3.22 7.82 1.01
NORTH 1 320 PF 1 6.56 87.31 87.91 87.91 88.06 0.024195 1.73 3.83 13.26 1.01
NORTH 1 300 PF 1 6.56 86.79 87.93 87.94 0.000455 0.48 13.55 15.29 0.16
NORTH 1 280 PF 1 6.56 86.82 87.93 87.93 0.000207 0.32 20.25 23.39 0.11
NORTH 1 260 PF 1 6.56 86.51 87.93 87.93 0.000059 0.20 35.48 39.74 0.06
NORTH 1 240 PF 1 6.56 86.18 87.93 86.75 87.93 0.000059 0.21 34.42 53.38 0.06
NORTH 1 226 Culvert
NORTH 1 220 PF 1 6.56 85.27 85.82 85.82 85.96 0.024608 1.68 3.91 13.75 1.00
NORTH 1 200 PF 1 6.56 84.66 85.13 85.13 85.22 0.030931 1.33 4.96 30.06 1.04
NORTH 1 180 PF 1 6.56 83.83 85.03 85.04 0.000578 0.37 17.63 35.76 0.17

34
JMD ref 12100
Issue D 19-08-2015
100 Year Event – Existing Conditions
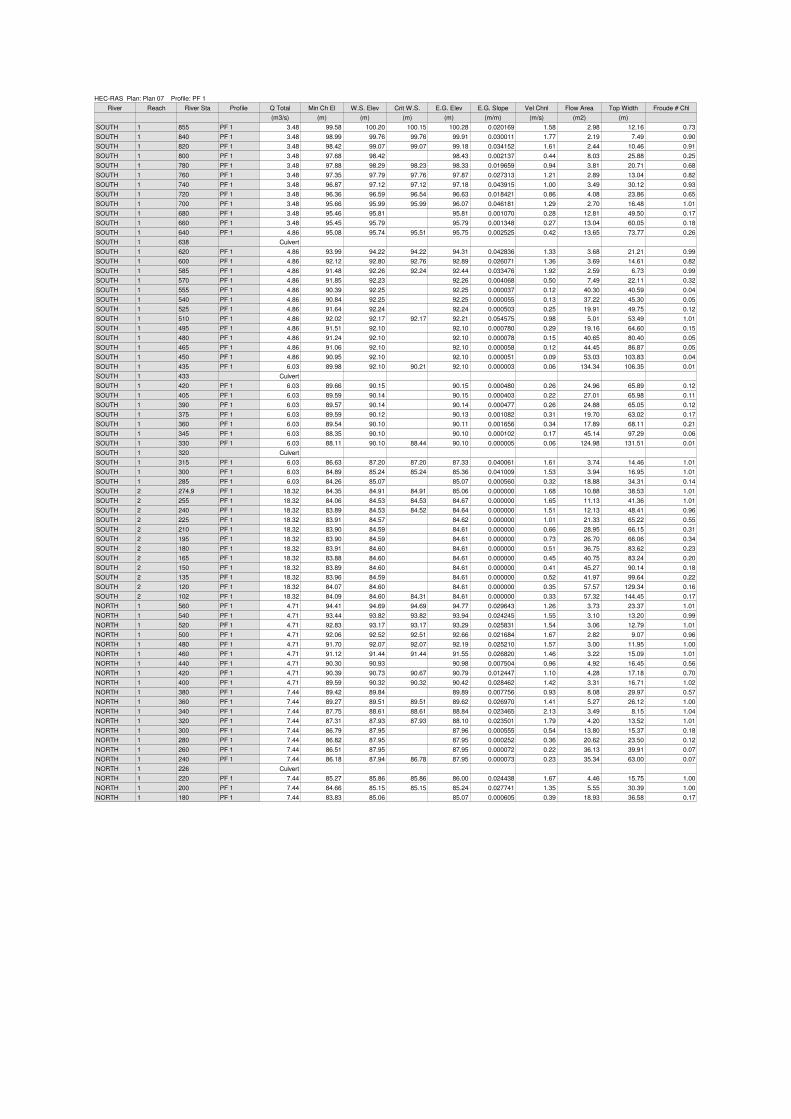
HEC-RAS Plan: Plan 07 Profile: PF 1
River Reach River Sta Profile Q Total Min Ch El W.S. Elev Crit W.S. E.G. Elev E.G. Slope Vel Chnl Flow Area Top Width Froude # Chl
(m3/s) (m) (m) (m) (m) (m/m) (m/s) (m2) (m)
SOUTH 1 855 PF 1 3.48 99.58 100.20 100.15 100.28 0.020169 1.58 2.98 12.16 0.73
SOUTH 1 840 PF 1 3.48 98.99 99.76 99.76 99.91 0.030011 1.77 2.19 7.49 0.90
SOUTH 1 820 PF 1 3.48 98.42 99.07 99.07 99.18 0.034152 1.61 2.44 10.46 0.91
SOUTH 1 800 PF 1 3.48 97.68 98.42 98.43 0.002137 0.44 8.03 25.88 0.25
SOUTH 1 780 PF 1 3.48 97.88 98.29 98.23 98.33 0.019659 0.94 3.81 20.71 0.68
SOUTH 1 760 PF 1 3.48 97.35 97.79 97.76 97.87 0.027313 1.21 2.89 13.04 0.82
SOUTH 1 740 PF 1 3.48 96.87 97.12 97.12 97.18 0.043915 1.00 3.49 30.12 0.93
SOUTH 1 720 PF 1 3.48 96.36 96.59 96.54 96.63 0.018421 0.86 4.08 23.86 0.65
SOUTH 1 700 PF 1 3.48 95.66 95.99 95.99 96.07 0.046181 1.29 2.70 16.48 1.01
SOUTH 1 680 PF 1 3.48 95.46 95.81 95.81 0.001070 0.28 12.81 49.50 0.17
SOUTH 1 660 PF 1 3.48 95.45 95.79 95.79 0.001348 0.27 13.04 60.05 0.18
SOUTH 1 640 PF 1 4.86 95.08 95.74 95.51 95.75 0.002525 0.42 13.65 73.77 0.26
SOUTH 1 638 Culvert
SOUTH 1 620 PF 1 4.86 93.99 94.22 94.22 94.31 0.042836 1.33 3.68 21.21 0.99
SOUTH 1 600 PF 1 4.86 92.12 92.80 92.76 92.89 0.026071 1.36 3.69 14.61 0.82
SOUTH 1 585 PF 1 4.86 91.48 92.26 92.24 92.44 0.033476 1.92 2.59 6.73 0.99
SOUTH 1 570 PF 1 4.86 91.85 92.23 92.26 0.004068 0.50 7.49 22.11 0.32
SOUTH 1 555 PF 1 4.86 90.39 92.25 92.25 0.000037 0.12 40.30 40.59 0.04
SOUTH 1 540 PF 1 4.86 90.84 92.25 92.25 0.000055 0.13 37.22 45.30 0.05
SOUTH 1 525 PF 1 4.86 91.64 92.24 92.24 0.000503 0.25 19.91 49.75 0.12
SOUTH 1 510 PF 1 4.86 92.02 92.17 92.17 92.21 0.054575 0.98 5.01 53.49 1.01
SOUTH 1 495 PF 1 4.86 91.51 92.10 92.10 0.000780 0.29 19.16 64.60 0.15
SOUTH 1 480 PF 1 4.86 91.24 92.10 92.10 0.000078 0.15 40.65 80.40 0.05
SOUTH 1 465 PF 1 4.86 91.06 92.10 92.10 0.000058 0.12 44.45 86.87 0.05
SOUTH 1 450 PF 1 4.86 90.95 92.10 92.10 0.000051 0.09 53.03 103.83 0.04
SOUTH 1 435 PF 1 6.03 89.98 92.10 90.21 92.10 0.000003 0.06 134.34 106.35 0.01
SOUTH 1 433 Culvert
SOUTH 1 420 PF 1 6.03 89.66 90.15 90.15 0.000480 0.26 24.96 65.89 0.12
SOUTH 1 405 PF 1 6.03 89.59 90.14 90.15 0.000403 0.22 27.01 65.98 0.11
SOUTH 1 390 PF 1 6.03 89.57 90.14 90.14 0.000477 0.26 24.88 65.05 0.12
SOUTH 1 375 PF 1 6.03 89.59 90.12 90.13 0.001082 0.31 19.70 63.02 0.17
SOUTH 1 360 PF 1 6.03 89.54 90.10 90.11 0.001656 0.34 17.89 68.11 0.21
SOUTH 1 345 PF 1 6.03 88.35 90.10 90.10 0.000102 0.17 45.14 97.29 0.06
SOUTH 1 330 PF 1 6.03 88.11 90.10 88.44 90.10 0.000005 0.06 124.98 131.51 0.01
SOUTH 1 320 Culvert
SOUTH 1 315 PF 1 6.03 86.63 87.20 87.20 87.33 0.040061 1.61 3.74 14.46 1.01
SOUTH 1 300 PF 1 6.03 84.89 85.24 85.24 85.36 0.041009 1.53 3.94 16.95 1.01
SOUTH 1 285 PF 1 6.03 84.26 85.07 85.07 0.000560 0.32 18.88 34.31 0.14
SOUTH 2 274.9 PF 1 18.32 84.35 84.91 84.91 85.06 0.000000 1.68 10.88 38.53 1.01
SOUTH 2 255 PF 1 18.32 84.06 84.53 84.53 84.67 0.000000 1.65 11.13 41.36 1.01
SOUTH 2 240 PF 1 18.32 83.89 84.53 84.52 84.64 0.000000 1.51 12.13 48.41 0.96
SOUTH 2 225 PF 1 18.32 83.91 84.57 84.62 0.000000 1.01 21.33 65.22 0.55
SOUTH 2 210 PF 1 18.32 83.90 84.59 84.61 0.000000 0.66 28.95 66.15 0.31
SOUTH 2 195 PF 1 18.32 83.90 84.59 84.61 0.000000 0.73 26.70 66.06 0.34
SOUTH 2 180 PF 1 18.32 83.91 84.60 84.61 0.000000 0.51 36.75 83.62 0.23
SOUTH 2 165 PF 1 18.32 83.88 84.60 84.61 0.000000 0.45 40.75 83.24 0.20
SOUTH 2 150 PF 1 18.32 83.89 84.60 84.61 0.000000 0.41 45.27 90.14 0.18
SOUTH 2 135 PF 1 18.32 83.96 84.59 84.61 0.000000 0.52 41.97 99.64 0.22
SOUTH 2 120 PF 1 18.32 84.07 84.60 84.61 0.000000 0.35 57.57 129.34 0.16
SOUTH 2 102 PF 1 18.32 84.09 84.60 84.31 84.61 0.000000 0.33 57.32 144.45 0.17
NORTH 1 560 PF 1 4.71 94.41 94.69 94.69 94.77 0.029643 1.26 3.73 23.37 1.01
NORTH 1 540 PF 1 4.71 93.44 93.82 93.82 93.94 0.024245 1.55 3.10 13.20 0.99
NORTH 1 520 PF 1 4.71 92.83 93.17 93.17 93.29 0.025831 1.54 3.06 12.79 1.01
NORTH 1 500 PF 1 4.71 92.06 92.52 92.51 92.66 0.021684 1.67 2.82 9.07 0.96
NORTH 1 480 PF 1 4.71 91.70 92.07 92.07 92.19 0.025210 1.57 3.00 11.95 1.00
NORTH 1 460 PF 1 4.71 91.12 91.44 91.44 91.55 0.026820 1.46 3.22 15.09 1.01
NORTH 1 440 PF 1 4.71 90.30 90.93 90.98 0.007504 0.96 4.92 16.45 0.56
NORTH 1 420 PF 1 4.71 90.39 90.73 90.67 90.79 0.012447 1.10 4.28 17.18 0.70
NORTH 1 400 PF 1 4.71 89.59 90.32 90.32 90.42 0.028462 1.42 3.31 16.71 1.02
NORTH 1 380 PF 1 7.44 89.42 89.84 89.89 0.007756 0.93 8.08 29.97 0.57
NORTH 1 360 PF 1 7.44 89.27 89.51 89.51 89.62 0.026970 1.41 5.27 26.12 1.00
NORTH 1 340 PF 1 7.44 87.75 88.61 88.61 88.84 0.023465 2.13 3.49 8.15 1.04
NORTH 1 320 PF 1 7.44 87.31 87.93 87.93 88.10 0.023501 1.79 4.20 13.52 1.01
NORTH 1 300 PF 1 7.44 86.79 87.95 87.96 0.000555 0.54 13.80 15.37 0.18
NORTH 1 280 PF 1 7.44 86.82 87.95 87.95 0.000252 0.36 20.62 23.50 0.12
NORTH 1 260 PF 1 7.44 86.51 87.95 87.95 0.000072 0.22 36.13 39.91 0.07
NORTH 1 240 PF 1 7.44 86.18 87.94 86.78 87.95 0.000073 0.23 35.34 63.00 0.07
NORTH 1 226 Culvert
NORTH 1 220 PF 1 7.44 85.27 85.86 85.86 86.00 0.024438 1.67 4.46 15.75 1.00
NORTH 1 200 PF 1 7.44 84.66 85.15 85.15 85.24 0.027741 1.35 5.55 30.39 1.00
NORTH 1 180 PF 1 7.44 83.83 85.06 85.07 0.000605 0.39 18.93 36.58 0.17

35
JMD ref 12100
Issue D 19-08-2015
PMF Event
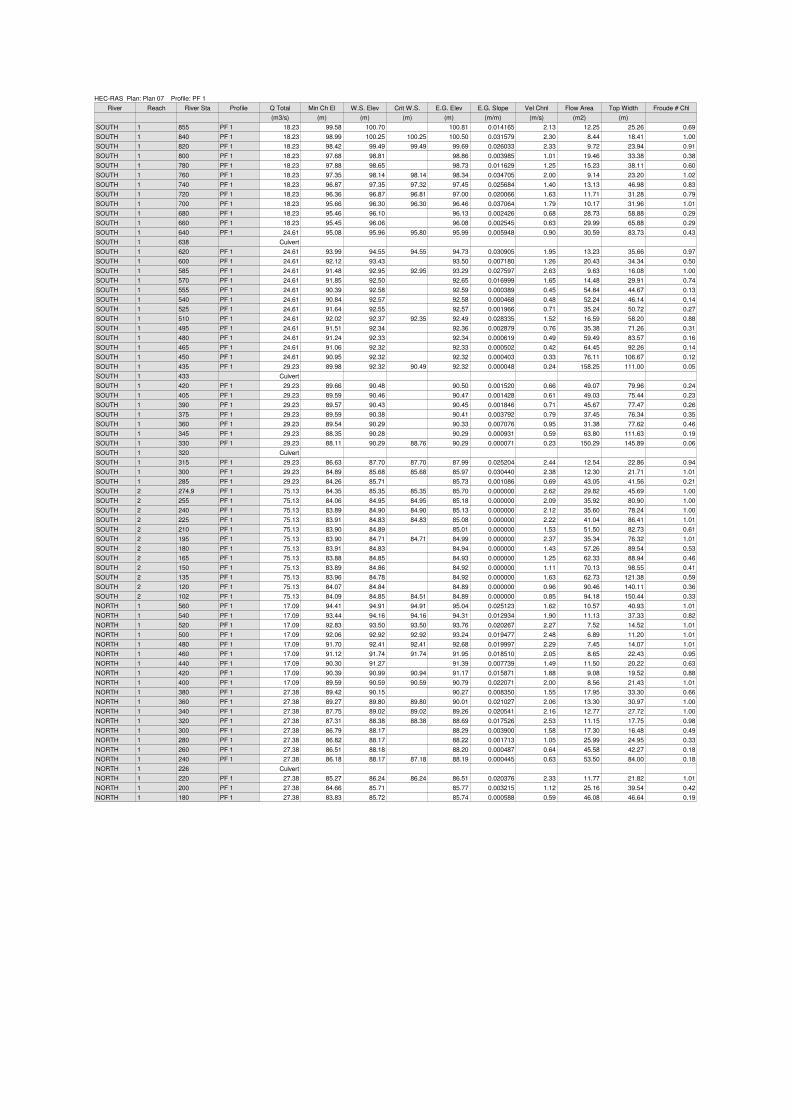
HEC-RAS Plan: Plan 07 Profile: PF 1
River Reach River Sta Profile Q Total Min Ch El W.S. Elev Crit W.S. E.G. Elev E.G. Slope Vel Chnl Flow Area Top Width Froude # Chl
(m3/s) (m) (m) (m) (m) (m/m) (m/s) (m2) (m)
SOUTH 1 855 PF 1 18.23 99.58 100.70 100.81 0.014165 2.13 12.25 25.26 0.69
SOUTH 1 840 PF 1 18.23 98.99 100.25 100.25 100.50 0.031579 2.30 8.44 18.41 1.00
SOUTH 1 820 PF 1 18.23 98.42 99.49 99.49 99.69 0.026033 2.33 9.72 23.94 0.91
SOUTH 1 800 PF 1 18.23 97.68 98.81 98.86 0.003985 1.01 19.46 33.38 0.38
SOUTH 1 780 PF 1 18.23 97.88 98.65 98.73 0.011629 1.25 15.23 38.11 0.60
SOUTH 1 760 PF 1 18.23 97.35 98.14 98.14 98.34 0.034705 2.00 9.14 23.20 1.02
SOUTH 1 740 PF 1 18.23 96.87 97.35 97.32 97.45 0.025684 1.40 13.13 46.98 0.83
SOUTH 1 720 PF 1 18.23 96.36 96.87 96.81 97.00 0.020066 1.63 11.71 31.28 0.79
SOUTH 1 700 PF 1 18.23 95.66 96.30 96.30 96.46 0.037064 1.79 10.17 31.96 1.01
SOUTH 1 680 PF 1 18.23 95.46 96.10 96.13 0.002426 0.68 28.73 58.88 0.29
SOUTH 1 660 PF 1 18.23 95.45 96.06 96.08 0.002545 0.63 29.99 65.88 0.29
SOUTH 1 640 PF 1 24.61 95.08 95.96 95.80 95.99 0.005948 0.90 30.59 83.73 0.43
SOUTH 1 638 Culvert
SOUTH 1 620 PF 1 24.61 93.99 94.55 94.55 94.73 0.030905 1.95 13.23 35.66 0.97
SOUTH 1 600 PF 1 24.61 92.12 93.43 93.50 0.007180 1.26 20.43 34.34 0.50
SOUTH 1 585 PF 1 24.61 91.48 92.95 92.95 93.29 0.027597 2.63 9.63 16.08 1.00
SOUTH 1 570 PF 1 24.61 91.85 92.50 92.65 0.016999 1.65 14.48 29.91 0.74
SOUTH 1 555 PF 1 24.61 90.39 92.58 92.59 0.000389 0.45 54.84 44.67 0.13
SOUTH 1 540 PF 1 24.61 90.84 92.57 92.58 0.000468 0.48 52.24 46.14 0.14
SOUTH 1 525 PF 1 24.61 91.64 92.55 92.57 0.001966 0.71 35.24 50.72 0.27
SOUTH 1 510 PF 1 24.61 92.02 92.37 92.35 92.49 0.028335 1.52 16.59 58.20 0.88
SOUTH 1 495 PF 1 24.61 91.51 92.34 92.36 0.002879 0.76 35.38 71.26 0.31
SOUTH 1 480 PF 1 24.61 91.24 92.33 92.34 0.000619 0.49 59.49 83.57 0.16
SOUTH 1 465 PF 1 24.61 91.06 92.32 92.33 0.000502 0.42 64.45 92.26 0.14
SOUTH 1 450 PF 1 24.61 90.95 92.32 92.32 0.000403 0.33 76.11 106.67 0.12
SOUTH 1 435 PF 1 29.23 89.98 92.32 90.49 92.32 0.000048 0.24 158.25 111.00 0.05
SOUTH 1 433 Culvert
SOUTH 1 420 PF 1 29.23 89.66 90.48 90.50 0.001520 0.66 49.07 79.96 0.24
SOUTH 1 405 PF 1 29.23 89.59 90.46 90.47 0.001428 0.61 49.03 75.44 0.23
SOUTH 1 390 PF 1 29.23 89.57 90.43 90.45 0.001846 0.71 45.67 77.47 0.26
SOUTH 1 375 PF 1 29.23 89.59 90.38 90.41 0.003792 0.79 37.45 76.34 0.35
SOUTH 1 360 PF 1 29.23 89.54 90.29 90.33 0.007076 0.95 31.38 77.62 0.46
SOUTH 1 345 PF 1 29.23 88.35 90.28 90.29 0.000931 0.59 63.80 111.63 0.19
SOUTH 1 330 PF 1 29.23 88.11 90.29 88.76 90.29 0.000071 0.23 150.29 145.89 0.06
SOUTH 1 320 Culvert
SOUTH 1 315 PF 1 29.23 86.63 87.70 87.70 87.99 0.025204 2.44 12.54 22.86 0.94
SOUTH 1 300 PF 1 29.23 84.89 85.68 85.68 85.97 0.030440 2.38 12.30 21.71 1.01
SOUTH 1 285 PF 1 29.23 84.26 85.71 85.73 0.001086 0.69 43.05 41.56 0.21
SOUTH 2 274.9 PF 1 75.13 84.35 85.35 85.35 85.70 0.000000 2.62 29.82 45.69 1.00
SOUTH 2 255 PF 1 75.13 84.06 84.95 84.95 85.18 0.000000 2.09 35.92 80.90 1.00
SOUTH 2 240 PF 1 75.13 83.89 84.90 84.90 85.13 0.000000 2.12 35.60 78.24 1.00
SOUTH 2 225 PF 1 75.13 83.91 84.83 84.83 85.08 0.000000 2.22 41.04 86.41 1.01
SOUTH 2 210 PF 1 75.13 83.90 84.89 85.01 0.000000 1.53 51.50 82.73 0.61
SOUTH 2 195 PF 1 75.13 83.90 84.71 84.71 84.99 0.000000 2.37 35.34 76.32 1.01
SOUTH 2 180 PF 1 75.13 83.91 84.83 84.94 0.000000 1.43 57.26 89.54 0.53
SOUTH 2 165 PF 1 75.13 83.88 84.85 84.93 0.000000 1.25 62.33 88.94 0.46
SOUTH 2 150 PF 1 75.13 83.89 84.86 84.92 0.000000 1.11 70.13 98.55 0.41
SOUTH 2 135 PF 1 75.13 83.96 84.78 84.92 0.000000 1.63 62.73 121.38 0.59
SOUTH 2 120 PF 1 75.13 84.07 84.84 84.89 0.000000 0.96 90.46 140.11 0.36
SOUTH 2 102 PF 1 75.13 84.09 84.85 84.51 84.89 0.000000 0.85 94.18 150.44 0.33
NORTH 1 560 PF 1 17.09 94.41 94.91 94.91 95.04 0.025123 1.62 10.57 40.93 1.01
NORTH 1 540 PF 1 17.09 93.44 94.16 94.16 94.31 0.012934 1.90 11.13 37.33 0.82
NORTH 1 520 PF 1 17.09 92.83 93.50 93.50 93.76 0.020267 2.27 7.52 14.52 1.01
NORTH 1 500 PF 1 17.09 92.06 92.92 92.92 93.24 0.019477 2.48 6.89 11.20 1.01
NORTH 1 480 PF 1 17.09 91.70 92.41 92.41 92.68 0.019997 2.29 7.45 14.07 1.01
NORTH 1 460 PF 1 17.09 91.12 91.74 91.74 91.95 0.018510 2.05 8.65 22.43 0.95
NORTH 1 440 PF 1 17.09 90.30 91.27 91.39 0.007739 1.49 11.50 20.22 0.63
NORTH 1 420 PF 1 17.09 90.39 90.99 90.94 91.17 0.015871 1.88 9.08 19.52 0.88
NORTH 1 400 PF 1 17.09 89.59 90.59 90.59 90.79 0.022071 2.00 8.56 21.43 1.01
NORTH 1 380 PF 1 27.38 89.42 90.15 90.27 0.008350 1.55 17.95 33.30 0.66
NORTH 1 360 PF 1 27.38 89.27 89.80 89.80 90.01 0.021027 2.06 13.30 30.97 1.00
NORTH 1 340 PF 1 27.38 87.75 89.02 89.02 89.26 0.020541 2.16 12.77 27.72 1.00
NORTH 1 320 PF 1 27.38 87.31 88.38 88.38 88.69 0.017526 2.53 11.15 17.75 0.98
NORTH 1 300 PF 1 27.38 86.79 88.17 88.29 0.003900 1.58 17.30 16.48 0.49
NORTH 1 280 PF 1 27.38 86.82 88.17 88.22 0.001713 1.05 25.99 24.95 0.33
NORTH 1 260 PF 1 27.38 86.51 88.18 88.20 0.000487 0.64 45.58 42.27 0.18
NORTH 1 240 PF 1 27.38 86.18 88.17 87.18 88.19 0.000445 0.63 53.50 84.00 0.18
NORTH 1 226 Culvert
NORTH 1 220 PF 1 27.38 85.27 86.24 86.24 86.51 0.020376 2.33 11.77 21.82 1.01
NORTH 1 200 PF 1 27.38 84.66 85.71 85.77 0.003215 1.12 25.16 39.54 0.42
NORTH 1 180 PF 1 27.38 83.83 85.72 85.74 0.000588 0.59 46.08 46.64 0.19