flexible and efficient profiling with aspect-oriented programming
TRANSCRIPT
CONCURRENCY AND COMPUTATION: PRACTICE AND EXPERIENCEConcurrency Computat.: Pract. Exper. 2011; 23:1749–1773Published online 2 May 2011 in Wiley Online Library (wileyonlinelibrary.com). DOI: 10.1002/cpe.1760
Flexible and efficient profiling with aspect-oriented programming
Walter Binder1,∗,†, Danilo Ansaloni1, Alex Villazón2 and Philippe Moret1
1University of Lugano, CH-6900 Lugano, Switzerland2Centro de Investigaciones de Nuevas Tecnologías Informaticas (CINTI), Universidad Privada Boliviana (UPB),
Cochabamba, Bolivia
SUMMARY
Many profilers for virtual execution environments, such as the Java virtual machine (JVM), are imple-mented with low-level bytecode instrumentation techniques, which is tedious, error-prone, and complicatesmaintenance and extension of the tools. In order to reduce the development time and cost, we promotebuilding profilers for the JVM using high-level aspect-oriented programming (AOP). We show that theuse of aspects yields concise profilers that are easy to develop, extend, and maintain, because low-levelinstrumentation details are hidden from the tool developer. In order to build efficient profilers, we introduceinter-advice communication, an extension to common AOP languages that enables efficient data passingbetween advices that are woven into the same method using local variables. We illustrate our approachwith two case studies. First, we show that an existing, instrumentation-based tool for listener latencyprofiling can be easily recast as an aspect. Second, we present an aspect for comprehensive calling contextprofiling. In order to reduce profiling overhead, our aspect parallelizes application execution and profilecreation, resulting in a speedup of 110% on a machine with more than two cores, compared with aprimitive, non-parallel approach. Copyright � 2011 John Wiley & Sons, Ltd.
Received 4 April 2010; Revised 16 February 2011; Accepted 22 March 2011
KEY WORDS: profiling; aspect-oriented programming; aspect weaving; bytecode instrumentation; callingcontext tree; concurrency; multicores; java virtual machine
1. INTRODUCTION
Bytecode instrumentation techniques are widely used for profiling [1–5]. Java supports bytecodeinstrumentation using native code agents through the Java virtual machine tool interface (JVMTI)[6], as well as portable bytecode instrumentation through the java.lang.instrument API.Several bytecode engineering libraries have been developed, such as BCEL [7], ASM [8], Javassist[9], or Soot [10], to mention a few. However, because of the low-level nature of bytecode andbytecode engineering libraries, it is difficult and error-prone to implement new profilers, whichoften requires high effort for development and testing. Moreover, profilers based on low-levelinstrumentation techniques are difficult to maintain and extend.
In order to ease, speedup, and reduce the cost of profiler development, maintenance, and exten-sion, we resort to aspect-oriented programming (AOP) [11]. AOP allows concisely specifyinginstrumentations in a high-level manner. For example, an aspect‡ can be used to specify profilingcode to be executed before or after the invocation of some methods of interest, hiding the low-leveldetails of bytecode instrumentation from the tool developer.
∗Correspondence to: Walter Binder, Faculty of Informatics, University of Lugano, Via Giuseppe Buffi 13, CH-6900Lugano, Switzerland.
†E-mail: [email protected]‡Section 2.1 gives a brief overview of AOP terminology.
Copyright � 2011 John Wiley & Sons, Ltd.
1750 W. BINDER ET AL.
Profiling usually requires instrumentation with full method coverage, that is, comprehensiveinstrumentation reaching all methods executed in the Java virtual machine (JVM); otherwise, apart of the program execution may be missing in the generated profiles. Prevailing aspect weavers,such as AspectJ [12] or abc [13], do not support comprehensive aspect weaving, notably becausethey prevent aspect weaving in the Java class library. Although the weaving of classes in the Javaclass library can be forced in AspectJ, weaving core Java classes usually results in JVM crashesupon bootstrapping.
Our approach to aspect-based profiler development relies on MAJOR [14–16], an aspect weaverthat complements AspectJ with support for comprehensive weaving. To this end, MAJOR leveragesFERRARI§ a bytecode instrumentation framework that ensures full method coverage of anyuser-defined instrumentation.
We introduce a new inter-advice communication model for AOP, which we have integrated intoMAJOR. Inter-advice communication allows for efficiently passing data between advices that arewoven into the same method. With the aid of annotations, the aspect programmer can declareinvocation-local variables, which correspond to local variables with the scope of a woven method.The inter-advice communication model is complementary to AspectJ constructs and enables impor-tant optimizations in our aspect-based profilers.
We demonstrate our approach with two case studies. First, we illustrate how the listener latencyprofiler LiLa [3], which is based on bytecode instrumentation using ASM [8], can be recast as anaspect using MAJOR and inter-advice communication.
Second, we present an aspect for calling context profiling. Calling context profiling helpsanalyze the dynamic inter-procedural control flow of applications. It is particularly important forunderstanding and optimizing object-oriented software, where polymorphism and dynamic bindinghinder static analyses. The calling context tree (CCT) [18] is a prevailing data structure for callingcontext profiling. It provides dynamic metrics, such as the number of method invocations, foreach calling context. There is a large body of related work dealing with different techniques togenerate CCTs [18–23], highlighting the importance of the CCT for calling context profiling. Ouraspect yields complete CCTs representing overall program execution. In order to speedup CCTconstruction on multicores, we refine the aspect so as to parallelize CCT construction and programexecution.
This article addresses the following four topics:
1. We present an approach to the rapid development of profilers using AOP. The profiling toolsare concise, extensible, and have full method coverage.
2. We introduce an AOP mechanism, inter-advice communication, for efficiently passing databetween advices in local variables.
3. We present two case studies in order to demonstrate our approach to profiler development.While the first case study represents an existing profiler as an aspect, the second case studydiscusses aspects generating CCTs. One of our aspects parallelizes calling context profiling,which can significantly reduce the overhead of CCT construction on multicores.
4. We thoroughly evaluate our aspects for calling context profiling with the DaCapo [24] andSPECjvm2008 [25] benchmark suites. Parallelized CCT construction is more than 110%faster than a primitive, non-parallel approach, when more than two cores are available. Ourevaluation shows that the speedup stems both from reduced contention and from paralleliza-tion. Moreover, we explore the CPU utilization for some selected benchmarks.
In addition to integrating the results from our prior work [26–28] and presenting them in arefined way, the original scientific contribution of this article is an extended performance evaluationof parallelized calling context profiling.
This article is structured as follows: Section 2 gives a short overview of the AOP terminologyand discusses our prior work related to this article. Section 3 explains our new inter-advice commu-nication mechanism. Section 4 presents our first case study, an aspect for listener latency profiling,
§http://www.inf.usi.ch/projects/ferrari/.[17],
Copyright � 2011 John Wiley & Sons, Ltd. Concurrency Computat.: Pract. Exper. 2011; 23:1749–1773DOI: 10.1002/cpe
FLEXIBLE AND EFFICIENT PROFILING WITH AOP 1751
and Section 5 elaborates on our second case study, aspects for calling context profiling. Section 6provides a detailed performance evaluation of our aspects for parallelized CCT construction. Section7 discusses the related work, and Section 8 concludes this article.
2. BACKGROUND
In this section we give a brief overview of AOP and summarize our prior work on which thisarticle builds.
2.1. Aspect-oriented programming
AOP [11] enables a clean modularization of crosscutting concerns in applications, such as errorchecking and handling, synchronization, monitoring, or logging. AOP helps avoid related code thatis scattered throughout methods, classes, or components. Traditionally, AOP has been successfullyused for disposing of ‘design smells’, such as needless repetition, and for improving maintainabilityof applications. Recently, AOP has also been applied to the development of software engineeringtools, such as profilers, debuggers, or testing tools [15, 29, 30], which in many cases can be specifiedas aspects.
AspectJ [12] is a popular AOP language for Java, allowing new functionality to be systematicallyadded to existing programs. In AspectJ, an aspect is an extended class with additional constructs.A join point is any identifiable execution point in a system (e.g. method call, method execution,object creation, or field assignment). Join points are the places where a crosscutting action canbe inserted. The user can specify weaving rules to be applied to join points through so-calledpointcuts and advices. A pointcut identifies or captures join points in the program flow, and anadvice is the action to be applied.
AspectJ supports three kinds of advices: before(), after(), and around(), which areexecuted prior, following, or surrounding a join point’s execution. Aspects are compiled intostandard Java classes. In the aspect class, advices are compiled into methods. During the weavingprocess, the weaver inserts code into the woven class to invoke these advice methods. Advices canreceive some context information, e.g. to identify which join point has been captured.
During the execution of a woven class, by default, a singleton instance of the aspect is instantiated.Several aspects can be woven simultaneously and can therefore coexist during the execution.
2.2. Prior work
Our approach to profiler development relies on MAJOR [14–16], an aspect weaver that enhancesAspectJ with support for comprehensive weaving. That is, MAJOR is able to weave aspects intoall classes loaded in the JVM, including dynamically loaded or generated classes, as well as thestandard Java class library. To the best of our knowledge, MAJOR is currently the only aspectweaver that can weave aspects into all classes in the Java class library in a portable way, compatiblewith any standard, state-of-the-art JVM.
MAJOR deals with issues such as bootstrapping the JVM with a woven Java class library andpreventing infinite recursions when advices invoke methods in the woven Java class library [14, 16].To this end, MAJOR leverages FERRARI [17], a generic bytecode instrumentation frameworkthat guarantees complete method coverage of user-defined instrumentations (after an initial JVMbootstrapping phase, which is completed before the application’s main(...) method is invoked).
BMW [31] is a profiler generator based on bytecode instrumentation techniques. In contrast toMAJOR, the programming model of BMW is very much restricted. It provides only a small set oflow-level pointcuts, which severely limits the kind of profilers that can be specified. Hence, BMWcannot be considered as an AOP framework. In addition, BMW does not support instrumentationof the Java class library.
In [4, 5], we addressed platform-independent calling context profiling using a hard-coded, low-level instrumentation that was difficult to extend. Thanks to AOP and to our new inter-advicecommunication model, we can now concisely express profilers as aspects in just a few lines of code.
Copyright � 2011 John Wiley & Sons, Ltd. Concurrency Computat.: Pract. Exper. 2011; 23:1749–1773DOI: 10.1002/cpe
1752 W. BINDER ET AL.
The high-level specification of aspect-based profilers eases the implementation of optimizations,such as the parallelized CCT construction presented in this article.
3. INTER-ADVICE COMMUNICATION
In AspectJ, the around() advice, in conjunction with a proceed() statement, allows storingdata in local variables before a join point, and accessing that data after the join point. The invocationof proceed() within an advice causes the execution of the captured join point. Hence, onecommon use of the around() advice can be regarded as communicating data produced in abefore() advice to an after() advice, within the scope of a woven method.
However, there are two severe limitations when using around() advices for communicatingdata across a join point:
1. The AspectJ weaver implements the around() advice by inserting wrapper methods inwoven classes [32], which can cause problems when weaving the Java class library. Forinstance, in Oracle’s HotSpot JVMs there is a bug that limits the insertion of methods injava.lang.Object¶ . wrapping certain methods in the Java class library breaks stackintrospection in many recent JVMs, including Oracle’s HotSpot JVMs and IBM’s J9 JVM[5, 15]; usually, there is no public documentation indicating those methods in the class librarythat must not be wrapped. Hence, the use of around() advices compromises comprehensiveaspect weaving in many common, state-of-the-art JVMs.
2. The around() advice does not constitute a general mechanism for efficiently passingdata in local variables between arbitrary advices that are woven into the same methodbody. For instance, it is not possible to pass data in local variables from one ‘before()execution()’ advice to an ‘after() call()’ advice.
In this article, we introduce an inter-advice communication model for AOP [26], in order toallow efficient data passing in local variables between advices. Inter-advice communication solvesthe two aforementioned problems, because it does not require the insertion of any wrapper methodsand it enables data passing between arbitrary advices woven into the same method body.
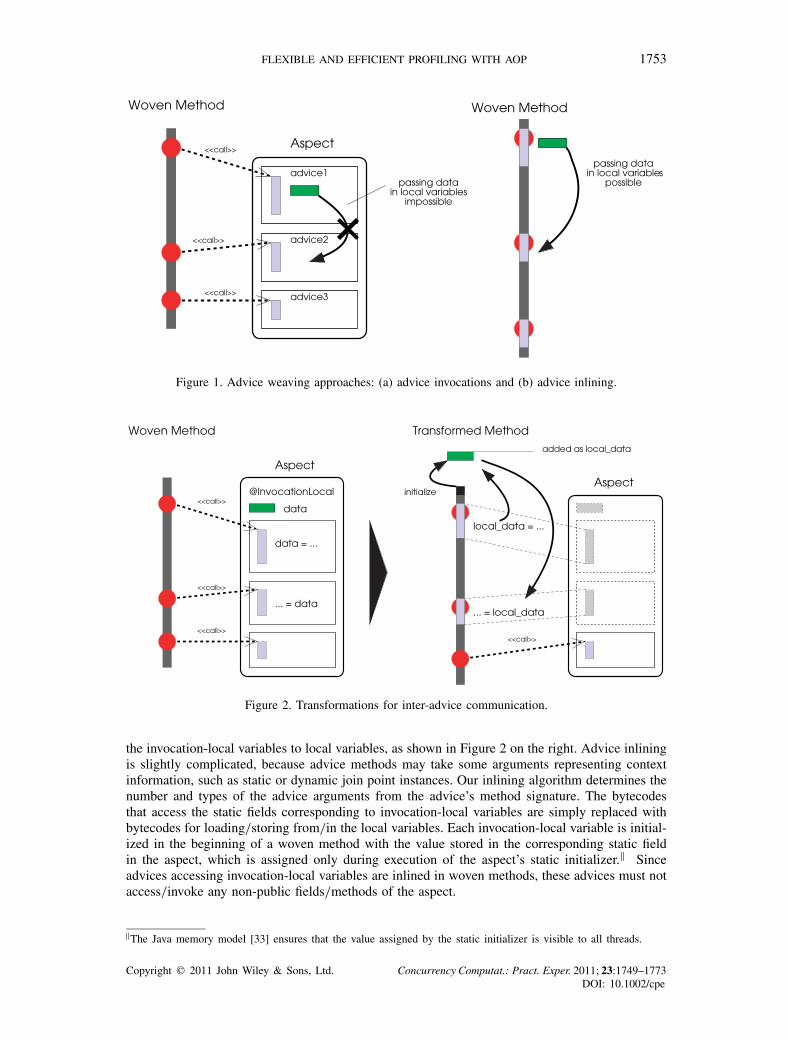
There are two common approaches to advice weaving: At each join point in a woven method,(a) an invocation to an advice is inserted, or (b) the advice body is inlined. For example, AspectJalways follows the first approach [32], whereas abc applies some heuristics to decide whetherinlining should be applied or not [13]. As illustrated in Figure 1, passing data in local variablesfrom one advice to another is only possible if the advices are inlined in the same woven method. Ifan advice is invoked as a method, the local variables used by the advice method are not accessibleafter its completion.
Therefore, our implementation of inter-advice communication first selectively inlines advicemethods that refer to specially marked static fields, and allocates local variables for these specialfields. We call these fields invocation-local variables (in analogy to thread-local variables), sincetheir scope is the execution of one invoked woven method. In effect, invocation-local variablesspecify synthetic local variables in woven methods.
We use the custom Java annotation @InvocationLocal to declare public static fields in anaspect as invocation-local variables. Within advices, invocation-local variables can be read andwritten as if they were static fields. @InvocationLocal is defined as follows:
@Target(ElementType.FIELD)@Retention(RetentionPolicy.CLASS)public @interface InvocationLocal {}
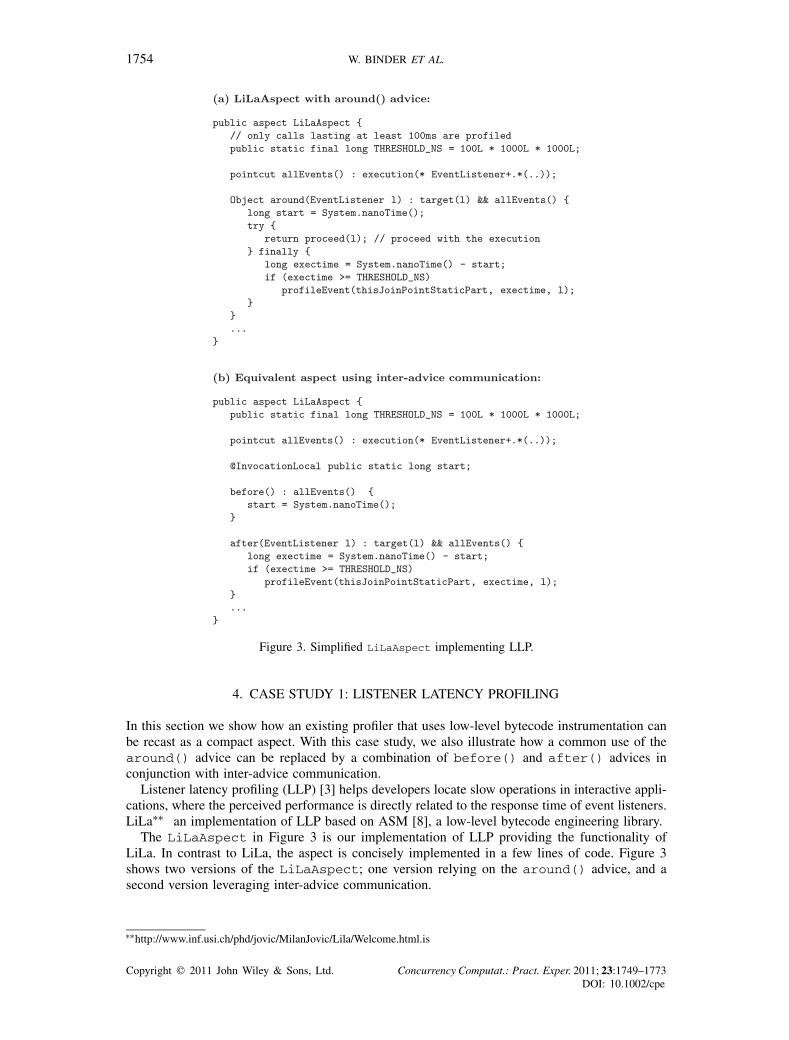
Aspects are first woven with the standard AspectJ weaver, as illustrated in Figure 2 on the left.Later, program transformations inline those advices that access invocation-local variables and map
¶http://bugs.sun.com/bugdatabase/view_bug.do?bug_id=6583051.Moreover,
Copyright � 2011 John Wiley & Sons, Ltd. Concurrency Computat.: Pract. Exper. 2011; 23:1749–1773DOI: 10.1002/cpe
FLEXIBLE AND EFFICIENT PROFILING WITH AOP 1753
Figure 1. Advice weaving approaches: (a) advice invocations and (b) advice inlining.
Figure 2. Transformations for inter-advice communication.
the invocation-local variables to local variables, as shown in Figure 2 on the right. Advice inliningis slightly complicated, because advice methods may take some arguments representing contextinformation, such as static or dynamic join point instances. Our inlining algorithm determines thenumber and types of the advice arguments from the advice’s method signature. The bytecodesthat access the static fields corresponding to invocation-local variables are simply replaced withbytecodes for loading/storing from/in the local variables. Each invocation-local variable is initial-ized in the beginning of a woven method with the value stored in the corresponding static fieldin the aspect, which is assigned only during execution of the aspect’s static initializer.‖ Sinceadvices accessing invocation-local variables are inlined in woven methods, these advices must notaccess/invoke any non-public fields/methods of the aspect.
‖The Java memory model [33] ensures that the value assigned by the static initializer is visible to all threads.
Copyright � 2011 John Wiley & Sons, Ltd. Concurrency Computat.: Pract. Exper. 2011; 23:1749–1773DOI: 10.1002/cpe
1754 W. BINDER ET AL.
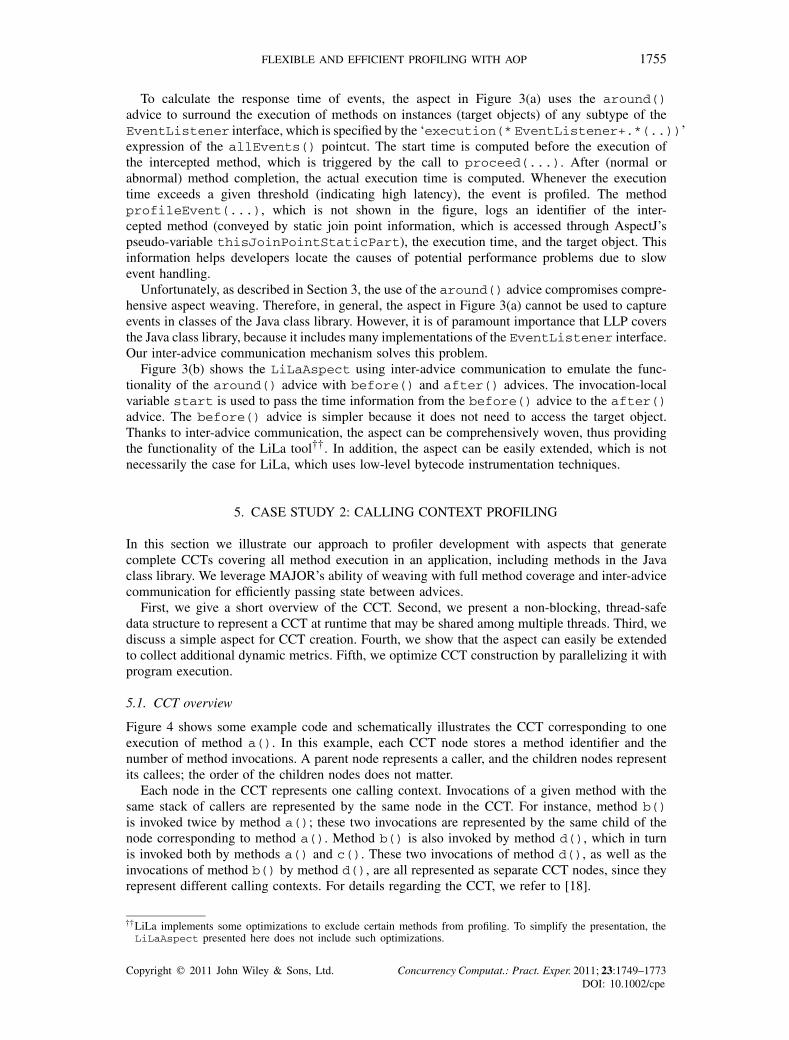
Figure 3. Simplified LiLaAspect implementing LLP.
4. CASE STUDY 1: LISTENER LATENCY PROFILING
In this section we show how an existing profiler that uses low-level bytecode instrumentation canbe recast as a compact aspect. With this case study, we also illustrate how a common use of thearound() advice can be replaced by a combination of before() and after() advices inconjunction with inter-advice communication.
Listener latency profiling (LLP) [3] helps developers locate slow operations in interactive appli-cations, where the perceived performance is directly related to the response time of event listeners.LiLa∗∗ an implementation of LLP based on ASM [8], a low-level bytecode engineering library.
The LiLaAspect in Figure 3 is our implementation of LLP providing the functionality ofLiLa. In contrast to LiLa, the aspect is concisely implemented in a few lines of code. Figure 3shows two versions of the LiLaAspect; one version relying on the around() advice, and asecond version leveraging inter-advice communication.
∗∗http://www.inf.usi.ch/phd/jovic/MilanJovic/Lila/Welcome.html.is
Copyright � 2011 John Wiley & Sons, Ltd. Concurrency Computat.: Pract. Exper. 2011; 23:1749–1773DOI: 10.1002/cpe
FLEXIBLE AND EFFICIENT PROFILING WITH AOP 1755
To calculate the response time of events, the aspect in Figure 3(a) uses the around()advice to surround the execution of methods on instances (target objects) of any subtype of theEventListener interface, which is specified by the ‘execution(* EventListener+.*(..))’expression of the allEvents() pointcut. The start time is computed before the execution ofthe intercepted method, which is triggered by the call to proceed(...). After (normal orabnormal) method completion, the actual execution time is computed. Whenever the executiontime exceeds a given threshold (indicating high latency), the event is profiled. The methodprofileEvent(...), which is not shown in the figure, logs an identifier of the inter-cepted method (conveyed by static join point information, which is accessed through AspectJ’spseudo-variable thisJoinPointStaticPart), the execution time, and the target object. Thisinformation helps developers locate the causes of potential performance problems due to slowevent handling.
Unfortunately, as described in Section 3, the use of the around() advice compromises compre-hensive aspect weaving. Therefore, in general, the aspect in Figure 3(a) cannot be used to captureevents in classes of the Java class library. However, it is of paramount importance that LLP coversthe Java class library, because it includes many implementations of the EventListener interface.Our inter-advice communication mechanism solves this problem.
Figure 3(b) shows the LiLaAspect using inter-advice communication to emulate the func-tionality of the around() advice with before() and after() advices. The invocation-localvariable start is used to pass the time information from the before() advice to the after()advice. The before() advice is simpler because it does not need to access the target object.Thanks to inter-advice communication, the aspect can be comprehensively woven, thus providingthe functionality of the LiLa tool††. In addition, the aspect can be easily extended, which is notnecessarily the case for LiLa, which uses low-level bytecode instrumentation techniques.
5. CASE STUDY 2: CALLING CONTEXT PROFILING
In this section we illustrate our approach to profiler development with aspects that generatecomplete CCTs covering all method execution in an application, including methods in the Javaclass library. We leverage MAJOR’s ability of weaving with full method coverage and inter-advicecommunication for efficiently passing state between advices.
First, we give a short overview of the CCT. Second, we present a non-blocking, thread-safedata structure to represent a CCT at runtime that may be shared among multiple threads. Third, wediscuss a simple aspect for CCT creation. Fourth, we show that the aspect can easily be extendedto collect additional dynamic metrics. Fifth, we optimize CCT construction by parallelizing it withprogram execution.
5.1. CCT overview
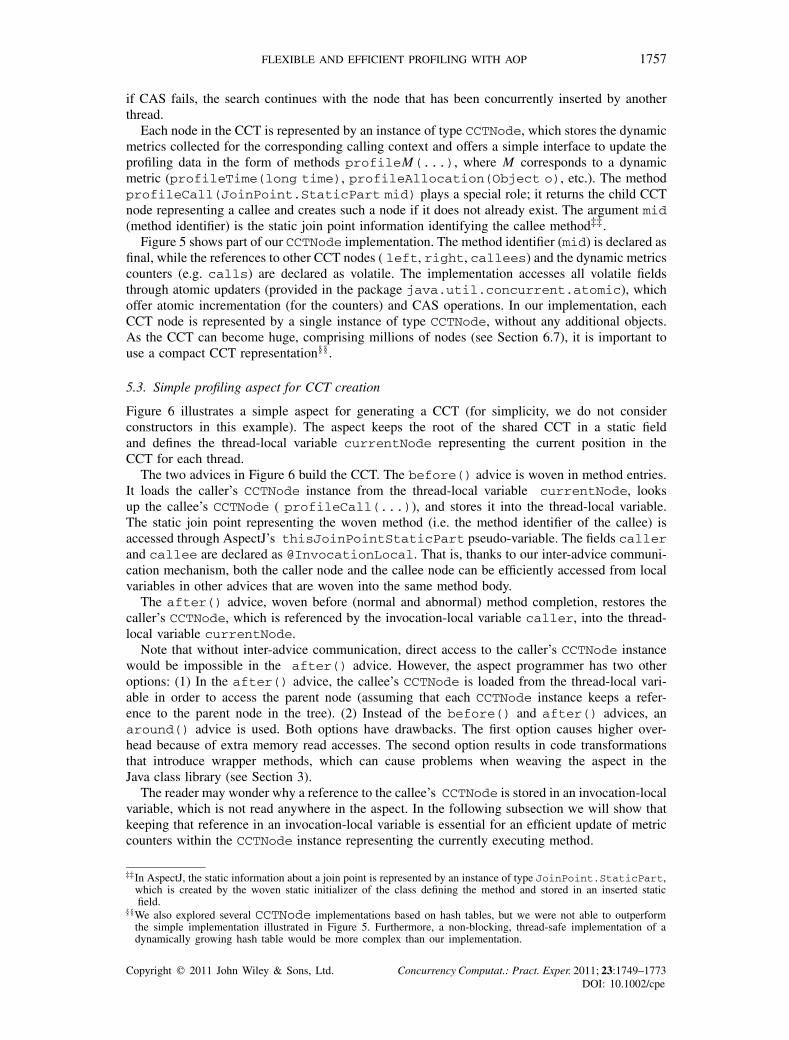
Figure 4 shows some example code and schematically illustrates the CCT corresponding to oneexecution of method a(). In this example, each CCT node stores a method identifier and thenumber of method invocations. A parent node represents a caller, and the children nodes representits callees; the order of the children nodes does not matter.
Each node in the CCT represents one calling context. Invocations of a given method with thesame stack of callers are represented by the same node in the CCT. For instance, method b()is invoked twice by method a(); these two invocations are represented by the same child of thenode corresponding to method a(). Method b() is also invoked by method d(), which in turnis invoked both by methods a() and c(). These two invocations of method d(), as well as theinvocations of method b() by method d(), are all represented as separate CCT nodes, since theyrepresent different calling contexts. For details regarding the CCT, we refer to [18].
††LiLa implements some optimizations to exclude certain methods from profiling. To simplify the presentation, theLiLaAspect presented here does not include such optimizations.
Copyright � 2011 John Wiley & Sons, Ltd. Concurrency Computat.: Pract. Exper. 2011; 23:1749–1773DOI: 10.1002/cpe

1756 W. BINDER ET AL.
Figure 4. Sample code and CCT for one execution of method a() (schematic representation).
There are several variations of the CCT. For instance, calls to the same method from differentcall sites in a calling method may be represented by the same node or by different nodes in theCCT, depending on whether or not the user wants to distinguish between these call sites [18].Furthermore, in the presence of recursions, the depth of the CCT may be unbounded, representingeach recursive call to a method by a separate CCT node. As an alternative, dynamic metrics forrecursive calls may be stored in the same node, effectively limiting the theoretical depth of theCCT (to the number of methods in the profiled program) and introducing back-edges in the CCT[18] (actually, the resulting CCT has no tree structure). In this article, we assume that call sites arenot distinguished and that the CCT depth is not bounded (i.e. recursions are completely representedin the tree structure).
5.2. Thread-safe CCT implementation
Before presenting an aspect that creates CCTs, we briefly discuss our data structure representingCCTs at runtime. In a multithreaded environment, there are two options: Each thread may createa separate, thread-confined CCT, and the per-thread CCTs may be integrated after termination ofthe corresponding threads. Alternatively, the CCT under construction may be shared between allthreads, and access to the CCT has to be thread-safe. While the first approach enables efficientaccess to the thread-local CCTs, it can result in high memory consumption, if several concurrentthreads execute the same code, resulting in replicated CCT structures, such as in the case of threadpools used in task execution frameworks. Therefore, we choose the second option, a single, shared,thread-safe CCT.
Thread-safety of a shared CCT can be achieved in different ways. Synchronizing every access tothe CCT is too expensive. Hence, we rely on a non-blocking data structure using atomic Compare-And-Swap (CAS) instructions. Each CCT node has a reference to a method identifier, a referenceto callee nodes, as well as counters to store the dynamic metrics collected within the correspondingcalling context, such as the number of method invocations.
The callees of the same caller node in the CCT (i.e. siblings) are stored in a binary search tree,using the identities of the nodes’ method identifiers as keys and their identity hash codes for leftand right navigation in the search tree. Although the binary search tree of sibling nodes is notbalanced, the usage of the identity hash codes makes a degeneration into a list structure unlikely.When registering an invocation of a callee method, the binary tree of callees is searched for anode with the corresponding method identifier. If such a node is found, its invocation counter isincremented using CAS. Otherwise, a new node is inserted into the binary search tree using CAS;
Copyright � 2011 John Wiley & Sons, Ltd. Concurrency Computat.: Pract. Exper. 2011; 23:1749–1773DOI: 10.1002/cpe
FLEXIBLE AND EFFICIENT PROFILING WITH AOP 1757
if CAS fails, the search continues with the node that has been concurrently inserted by anotherthread.
Each node in the CCT is represented by an instance of type CCTNode, which stores the dynamicmetrics collected for the corresponding calling context and offers a simple interface to update theprofiling data in the form of methods profileM(...), where M corresponds to a dynamicmetric (profileTime(long time), profileAllocation(Object o), etc.). The methodprofileCall(JoinPoint.StaticPart mid) plays a special role; it returns the child CCTnode representing a callee and creates such a node if it does not already exist. The argument mid(method identifier) is the static join point information identifying the callee method‡‡.
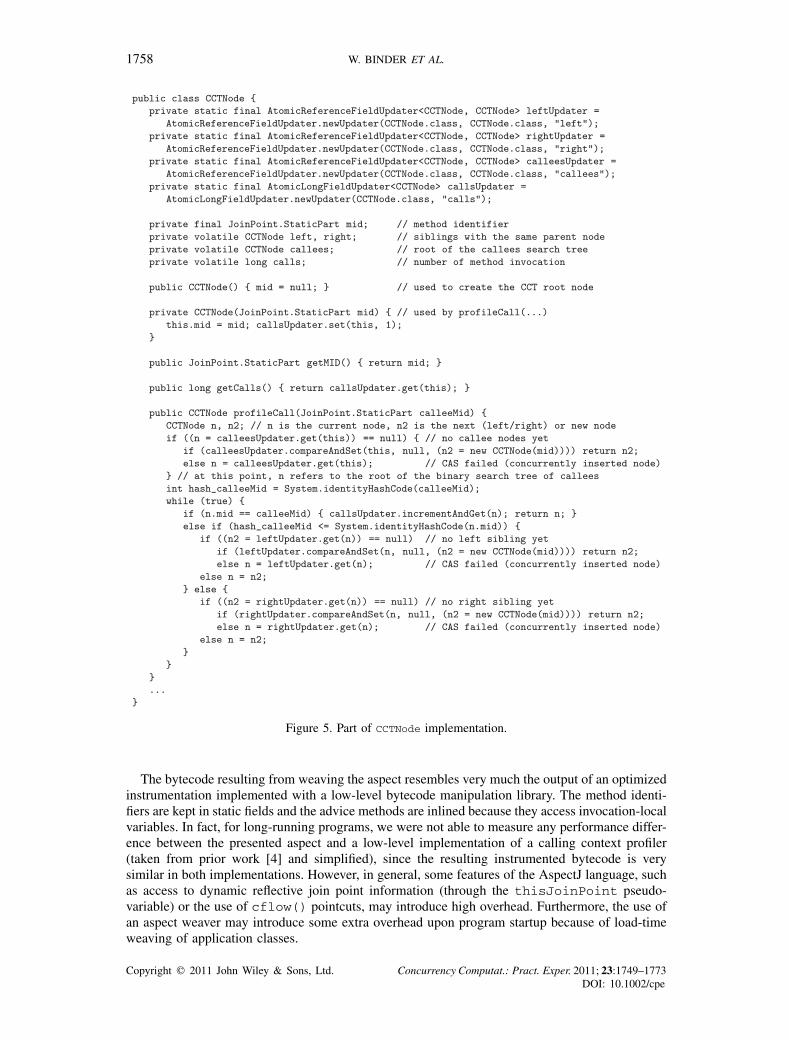
Figure 5 shows part of our CCTNode implementation. The method identifier (mid) is declared asfinal, while the references to other CCT nodes ( left, right, callees) and the dynamic metricscounters (e.g. calls) are declared as volatile. The implementation accesses all volatile fieldsthrough atomic updaters (provided in the package java.util.concurrent.atomic), whichoffer atomic incrementation (for the counters) and CAS operations. In our implementation, eachCCT node is represented by a single instance of type CCTNode, without any additional objects.As the CCT can become huge, comprising millions of nodes (see Section 6.7), it is important touse a compact CCT representation§§ .
5.3. Simple profiling aspect for CCT creation
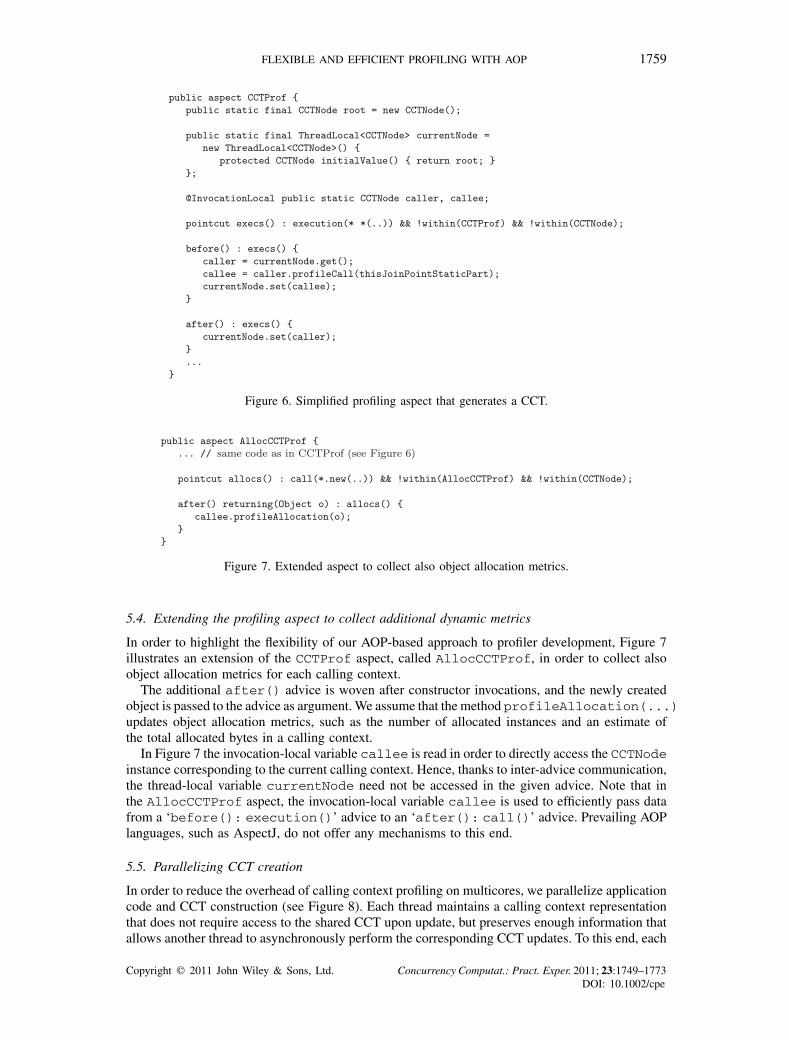
Figure 6 illustrates a simple aspect for generating a CCT (for simplicity, we do not considerconstructors in this example). The aspect keeps the root of the shared CCT in a static fieldand defines the thread-local variable currentNode representing the current position in theCCT for each thread.
The two advices in Figure 6 build the CCT. The before() advice is woven in method entries.It loads the caller’s CCTNode instance from the thread-local variable currentNode, looksup the callee’s CCTNode ( profileCall(...)), and stores it into the thread-local variable.The static join point representing the woven method (i.e. the method identifier of the callee) isaccessed through AspectJ’s thisJoinPointStaticPart pseudo-variable. The fields callerand callee are declared as @InvocationLocal. That is, thanks to our inter-advice communi-cation mechanism, both the caller node and the callee node can be efficiently accessed from localvariables in other advices that are woven into the same method body.
The after() advice, woven before (normal and abnormal) method completion, restores thecaller’s CCTNode, which is referenced by the invocation-local variable caller, into the thread-local variable currentNode.
Note that without inter-advice communication, direct access to the caller’s CCTNode instancewould be impossible in the after() advice. However, the aspect programmer has two otheroptions: (1) In the after() advice, the callee’s CCTNode is loaded from the thread-local vari-able in order to access the parent node (assuming that each CCTNode instance keeps a refer-ence to the parent node in the tree). (2) Instead of the before() and after() advices, anaround() advice is used. Both options have drawbacks. The first option causes higher over-head because of extra memory read accesses. The second option results in code transformationsthat introduce wrapper methods, which can cause problems when weaving the aspect in theJava class library (see Section 3).
The reader may wonder why a reference to the callee’s CCTNode is stored in an invocation-localvariable, which is not read anywhere in the aspect. In the following subsection we will show thatkeeping that reference in an invocation-local variable is essential for an efficient update of metriccounters within the CCTNode instance representing the currently executing method.
‡‡In AspectJ, the static information about a join point is represented by an instance of type JoinPoint.StaticPart,which is created by the woven static initializer of the class defining the method and stored in an inserted staticfield.
§§We also explored several CCTNode implementations based on hash tables, but we were not able to outperformthe simple implementation illustrated in Figure 5. Furthermore, a non-blocking, thread-safe implementation of adynamically growing hash table would be more complex than our implementation.
Copyright � 2011 John Wiley & Sons, Ltd. Concurrency Computat.: Pract. Exper. 2011; 23:1749–1773DOI: 10.1002/cpe
1758 W. BINDER ET AL.
Figure 5. Part of CCTNode implementation.
The bytecode resulting from weaving the aspect resembles very much the output of an optimizedinstrumentation implemented with a low-level bytecode manipulation library. The method identi-fiers are kept in static fields and the advice methods are inlined because they access invocation-localvariables. In fact, for long-running programs, we were not able to measure any performance differ-ence between the presented aspect and a low-level implementation of a calling context profiler(taken from prior work [4] and simplified), since the resulting instrumented bytecode is verysimilar in both implementations. However, in general, some features of the AspectJ language, suchas access to dynamic reflective join point information (through the thisJoinPoint pseudo-variable) or the use of cflow() pointcuts, may introduce high overhead. Furthermore, the use ofan aspect weaver may introduce some extra overhead upon program startup because of load-timeweaving of application classes.
Copyright � 2011 John Wiley & Sons, Ltd. Concurrency Computat.: Pract. Exper. 2011; 23:1749–1773DOI: 10.1002/cpe
FLEXIBLE AND EFFICIENT PROFILING WITH AOP 1759
Figure 6. Simplified profiling aspect that generates a CCT.
Figure 7. Extended aspect to collect also object allocation metrics.
5.4. Extending the profiling aspect to collect additional dynamic metrics
In order to highlight the flexibility of our AOP-based approach to profiler development, Figure 7illustrates an extension of the CCTProf aspect, called AllocCCTProf, in order to collect alsoobject allocation metrics for each calling context.
The additional after() advice is woven after constructor invocations, and the newly createdobject is passed to the advice as argument. We assume that the method profileAllocation(...)updates object allocation metrics, such as the number of allocated instances and an estimate ofthe total allocated bytes in a calling context.
In Figure 7 the invocation-local variable callee is read in order to directly access the CCTNodeinstance corresponding to the current calling context. Hence, thanks to inter-advice communication,the thread-local variable currentNode need not be accessed in the given advice. Note that inthe AllocCCTProf aspect, the invocation-local variable callee is used to efficiently pass datafrom a ‘before(): execution()’ advice to an ‘after(): call()’ advice. Prevailing AOPlanguages, such as AspectJ, do not offer any mechanisms to this end.
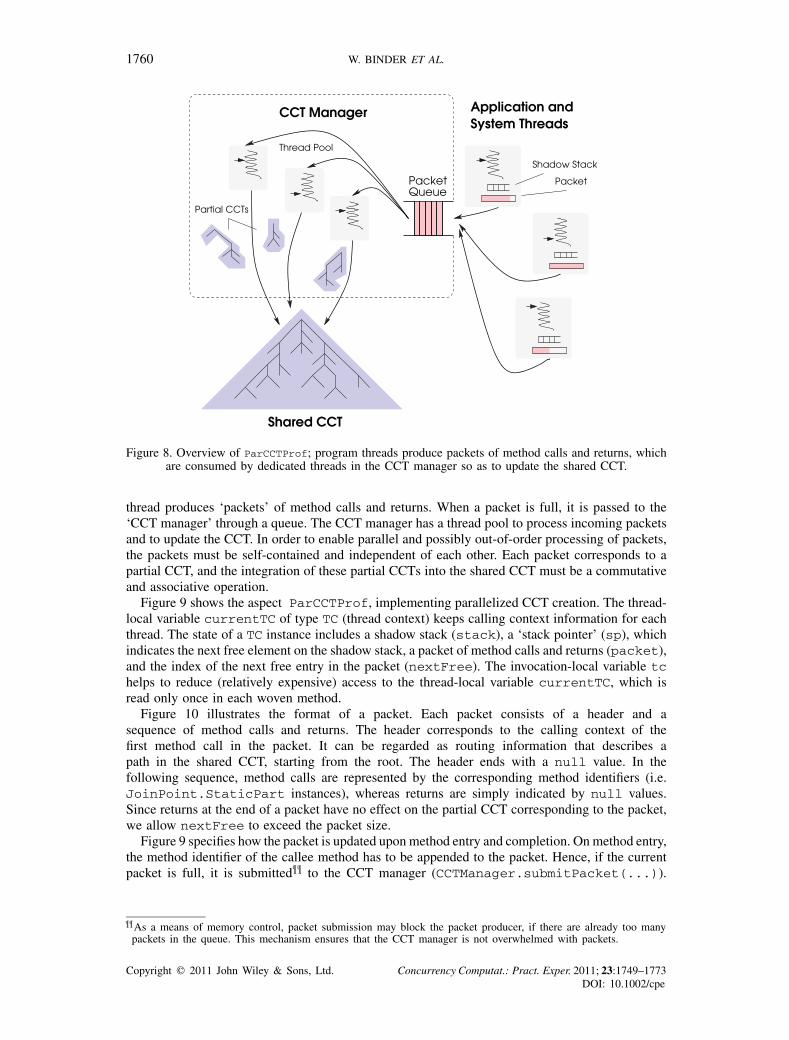
5.5. Parallelizing CCT creation
In order to reduce the overhead of calling context profiling on multicores, we parallelize applicationcode and CCT construction (see Figure 8). Each thread maintains a calling context representationthat does not require access to the shared CCT upon update, but preserves enough information thatallows another thread to asynchronously perform the corresponding CCT updates. To this end, each
Copyright � 2011 John Wiley & Sons, Ltd. Concurrency Computat.: Pract. Exper. 2011; 23:1749–1773DOI: 10.1002/cpe
1760 W. BINDER ET AL.
Figure 8. Overview of ParCCTProf; program threads produce packets of method calls and returns, whichare consumed by dedicated threads in the CCT manager so as to update the shared CCT.
thread produces ‘packets’ of method calls and returns. When a packet is full, it is passed to the‘CCT manager’ through a queue. The CCT manager has a thread pool to process incoming packetsand to update the CCT. In order to enable parallel and possibly out-of-order processing of packets,the packets must be self-contained and independent of each other. Each packet corresponds to apartial CCT, and the integration of these partial CCTs into the shared CCT must be a commutativeand associative operation.
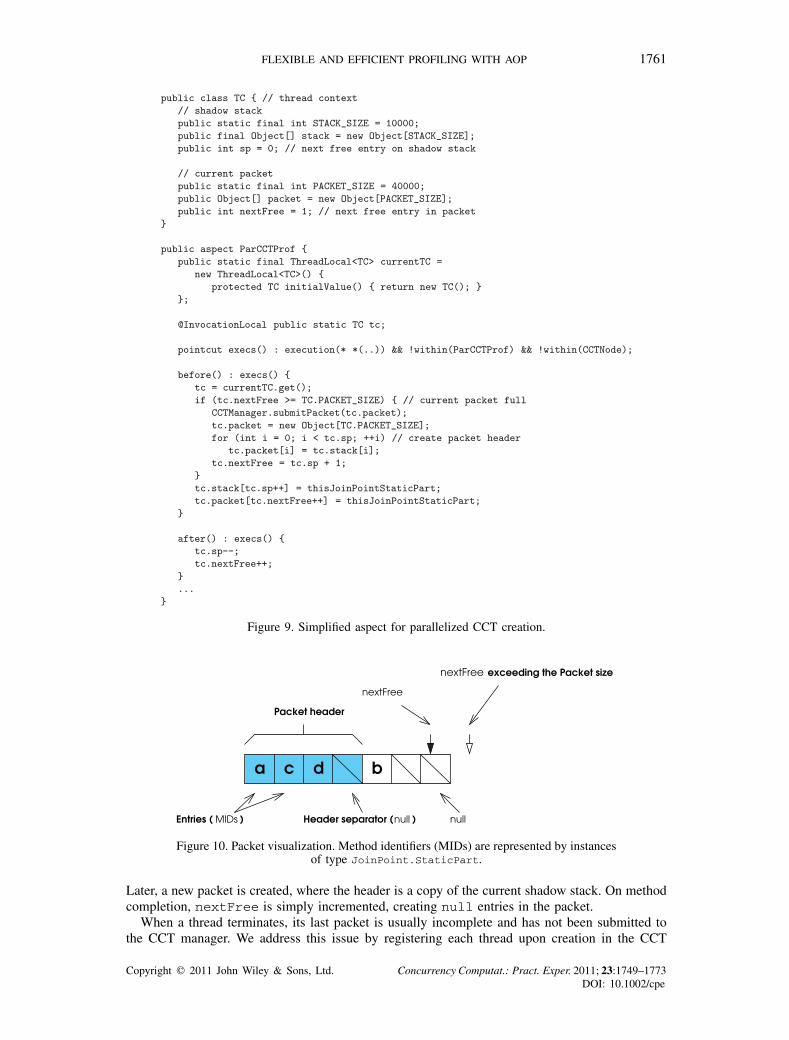
Figure 9 shows the aspect ParCCTProf, implementing parallelized CCT creation. The thread-local variable currentTC of type TC (thread context) keeps calling context information for eachthread. The state of a TC instance includes a shadow stack (stack), a ‘stack pointer’ (sp), whichindicates the next free element on the shadow stack, a packet of method calls and returns (packet),and the index of the next free entry in the packet (nextFree). The invocation-local variable tchelps to reduce (relatively expensive) access to the thread-local variable currentTC, which isread only once in each woven method.
Figure 10 illustrates the format of a packet. Each packet consists of a header and asequence of method calls and returns. The header corresponds to the calling context of thefirst method call in the packet. It can be regarded as routing information that describes apath in the shared CCT, starting from the root. The header ends with a null value. In thefollowing sequence, method calls are represented by the corresponding method identifiers (i.e.JoinPoint.StaticPart instances), whereas returns are simply indicated by null values.Since returns at the end of a packet have no effect on the partial CCT corresponding to the packet,we allow nextFree to exceed the packet size.
Figure 9 specifies how the packet is updated upon method entry and completion. On method entry,the method identifier of the callee method has to be appended to the packet. Hence, if the currentpacket is full, it is submitted¶¶ to the CCT manager (CCTManager.submitPacket(...)).
¶¶As a means of memory control, packet submission may block the packet producer, if there are already too manypackets in the queue. This mechanism ensures that the CCT manager is not overwhelmed with packets.
Copyright � 2011 John Wiley & Sons, Ltd. Concurrency Computat.: Pract. Exper. 2011; 23:1749–1773DOI: 10.1002/cpe
FLEXIBLE AND EFFICIENT PROFILING WITH AOP 1761
Figure 9. Simplified aspect for parallelized CCT creation.
Figure 10. Packet visualization. Method identifiers (MIDs) are represented by instancesof type JoinPoint.StaticPart.
Later, a new packet is created, where the header is a copy of the current shadow stack. On methodcompletion, nextFree is simply incremented, creating null entries in the packet.
When a thread terminates, its last packet is usually incomplete and has not been submitted tothe CCT manager. We address this issue by registering each thread upon creation in the CCT
Copyright � 2011 John Wiley & Sons, Ltd. Concurrency Computat.: Pract. Exper. 2011; 23:1749–1773DOI: 10.1002/cpe
1762 W. BINDER ET AL.
manager. The CCT manager is responsible for detecting thread termination (e.g. by periodicallypolling the thread state), to collect the last packet from the TC instance of a terminated thread,and to put it into the queue. Note that the Java memory model guarantees that a thread X sees theeffects of all assignments made by another thread Y , after thread X has detected the terminationof thread Y [33]. Hence, it is possible to process the (otherwise thread-local) final packets ofterminated threads.
Each thread in the CCT manager’s thread pool repeatedly takes a packet from the queue andintegrates the corresponding partial CCT into the shared CCT. The thread first creates a thread-local, partial CCT representing the method calls in the packet. Afterwards, the partial CCT isintegrated into the shared CCT using a recursive method. This approach helps to reduce the numberof accesses to nodes in the shared CCT, because packets frequently include repetitive call patterns(e.g. methods invoked in a loop). Instead of accessing the shared CCT upon each method call, weneed to access it only once for a series of accumulated method calls.
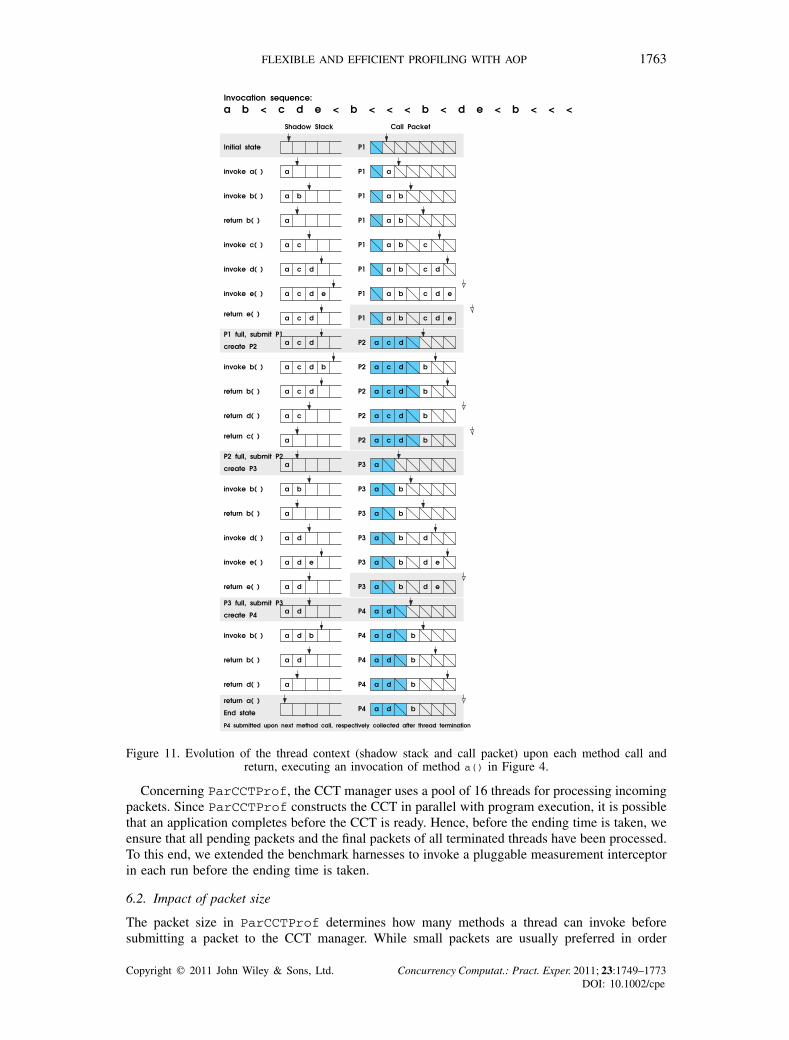
Figure 11 illustrates the production of packets for the sample code shown in Figure 4. Weassume that a single thread invokes method a() once. The packet size is seven in this example. Intotal, four packets are created. The first three packets are submitted by the executing thread whenthey are full. The last packet, which is full but has not yet been submitted, will be submitted uponthe next method invocation, respectively collected by the CCT manager upon termination of thethread. The partial CCTs corresponding to the four packets are illustrated in Figure 12. Integratingthese four CCTs in any order results in the CCT shown in Figure 4.
Note that the packet format can be extended to support also other events besides method call andreturn. For example, in order to profile object allocation, the packet could store a class referencefor each allocated object (in addition to the method identifiers upon method invocation).
6. EVALUATION
Here, we evaluate the ParCCTProf aspect presented in Section 5.5. After explaining our measure-ment settings (Section 6.1), we explore the impact of the packet size on performance and ongarbage collection (Section 6.2). We compare the performance of CCTProf and ParCCTProfand study the benefits of ParCCTProf—parallelization and reduced contention (Section 6.3). Weinvestigate the performance of ParCCTProf using a varying number of processor cores (Section6.4), explore CPU utilization for two multithreaded benchmarks (Section 6.5), and study the over-head caused by ParCCTProf with an increasing number of benchmark threads (Section 6.6).Finally, we present statistics gathered from the generated CCTs (Section 6.7).
6.1. Measurement settings
For most of our experiments, we use the DaCapo benchmark suite (dacapo-2006-10-MR2) [24], andfor the final experiment, we employ SPECjvm2008 V1.01 [25]. The measurements with DaCapoare collected with default workload size; they represent the median of 15 runs within the sameJVM process (except for the measurements of the impact of packet size on garbage collection,which are taken for a single run of all benchmarks). For SPECjvm2008, we take the compositeresult of all benchmarks running with a fixed workload (five iterations, one operation per iteration),as reported by the benchmark harness.
Our measurement environment is a 16-core machine (Sun Fire X4450 Server, 4 quad-core IntelXeon CPUs, 2.4 GHz, 16 GB RAM) running CentOS Enterprise Linux 5.3. To avoid perturba-tions due to dynamic frequency scaling, we disabled the Enhanced SpeedStep Technology‖‖ theprocessors. We present measurements made with the Oracle JDK 1.6.0_14 HotSpot 64-bit ServerVM. To weave the aspects, we use MAJOR version 0.5 with AspectJ∗∗∗ 1.6.2.
‖‖http://www.intel.com/support/processors/xeon/.of∗∗∗http://www.eclipse.org/aspectj/.version
Copyright � 2011 John Wiley & Sons, Ltd. Concurrency Computat.: Pract. Exper. 2011; 23:1749–1773DOI: 10.1002/cpe
FLEXIBLE AND EFFICIENT PROFILING WITH AOP 1763
Figure 11. Evolution of the thread context (shadow stack and call packet) upon each method call andreturn, executing an invocation of method a() in Figure 4.
Concerning ParCCTProf, the CCT manager uses a pool of 16 threads for processing incomingpackets. Since ParCCTProf constructs the CCT in parallel with program execution, it is possiblethat an application completes before the CCT is ready. Hence, before the ending time is taken, weensure that all pending packets and the final packets of all terminated threads have been processed.To this end, we extended the benchmark harnesses to invoke a pluggable measurement interceptorin each run before the ending time is taken.
6.2. Impact of packet size
The packet size in ParCCTProf determines how many methods a thread can invoke beforesubmitting a packet to the CCT manager. While small packets are usually preferred in order
Copyright � 2011 John Wiley & Sons, Ltd. Concurrency Computat.: Pract. Exper. 2011; 23:1749–1773DOI: 10.1002/cpe
1764 W. BINDER ET AL.
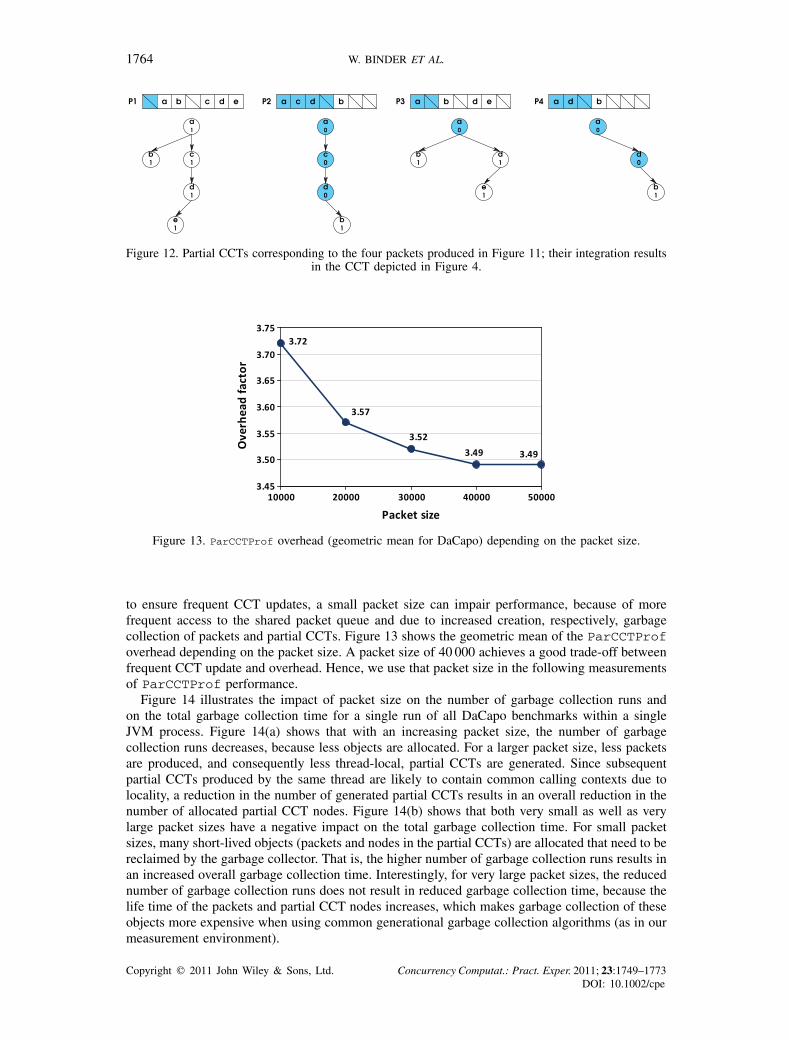
Figure 12. Partial CCTs corresponding to the four packets produced in Figure 11; their integration resultsin the CCT depicted in Figure 4.
Figure 13. ParCCTProf overhead (geometric mean for DaCapo) depending on the packet size.
to ensure frequent CCT updates, a small packet size can impair performance, because of morefrequent access to the shared packet queue and due to increased creation, respectively, garbagecollection of packets and partial CCTs. Figure 13 shows the geometric mean of the ParCCTProfoverhead depending on the packet size. A packet size of 40 000 achieves a good trade-off betweenfrequent CCT update and overhead. Hence, we use that packet size in the following measurementsof ParCCTProf performance.
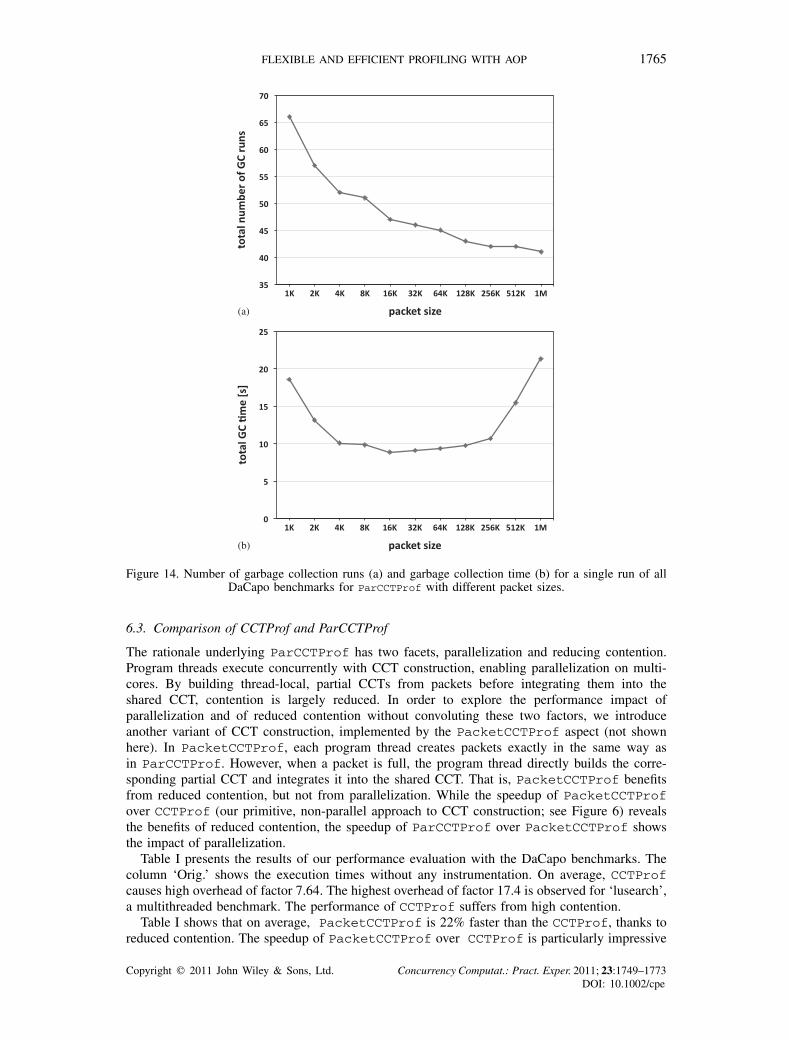
Figure 14 illustrates the impact of packet size on the number of garbage collection runs andon the total garbage collection time for a single run of all DaCapo benchmarks within a singleJVM process. Figure 14(a) shows that with an increasing packet size, the number of garbagecollection runs decreases, because less objects are allocated. For a larger packet size, less packetsare produced, and consequently less thread-local, partial CCTs are generated. Since subsequentpartial CCTs produced by the same thread are likely to contain common calling contexts due tolocality, a reduction in the number of generated partial CCTs results in an overall reduction in thenumber of allocated partial CCT nodes. Figure 14(b) shows that both very small as well as verylarge packet sizes have a negative impact on the total garbage collection time. For small packetsizes, many short-lived objects (packets and nodes in the partial CCTs) are allocated that need to bereclaimed by the garbage collector. That is, the higher number of garbage collection runs results inan increased overall garbage collection time. Interestingly, for very large packet sizes, the reducednumber of garbage collection runs does not result in reduced garbage collection time, because thelife time of the packets and partial CCT nodes increases, which makes garbage collection of theseobjects more expensive when using common generational garbage collection algorithms (as in ourmeasurement environment).
Copyright � 2011 John Wiley & Sons, Ltd. Concurrency Computat.: Pract. Exper. 2011; 23:1749–1773DOI: 10.1002/cpe
FLEXIBLE AND EFFICIENT PROFILING WITH AOP 1765
(a)
(b)
Figure 14. Number of garbage collection runs (a) and garbage collection time (b) for a single run of allDaCapo benchmarks for ParCCTProf with different packet sizes.
6.3. Comparison of CCTProf and ParCCTProf
The rationale underlying ParCCTProf has two facets, parallelization and reducing contention.Program threads execute concurrently with CCT construction, enabling parallelization on multi-cores. By building thread-local, partial CCTs from packets before integrating them into theshared CCT, contention is largely reduced. In order to explore the performance impact ofparallelization and of reduced contention without convoluting these two factors, we introduceanother variant of CCT construction, implemented by the PacketCCTProf aspect (not shownhere). In PacketCCTProf, each program thread creates packets exactly in the same way asin ParCCTProf. However, when a packet is full, the program thread directly builds the corre-sponding partial CCT and integrates it into the shared CCT. That is, PacketCCTProf benefitsfrom reduced contention, but not from parallelization. While the speedup of PacketCCTProfover CCTProf (our primitive, non-parallel approach to CCT construction; see Figure 6) revealsthe benefits of reduced contention, the speedup of ParCCTProf over PacketCCTProf showsthe impact of parallelization.
Table I presents the results of our performance evaluation with the DaCapo benchmarks. Thecolumn ‘Orig.’ shows the execution times without any instrumentation. On average, CCTProfcauses high overhead of factor 7.64. The highest overhead of factor 17.4 is observed for ‘lusearch’,a multithreaded benchmark. The performance of CCTProf suffers from high contention.
Table I shows that on average, PacketCCTProf is 22% faster than the CCTProf, thanks toreduced contention. The speedup of PacketCCTProf over CCTProf is particularly impressive
Copyright � 2011 John Wiley & Sons, Ltd. Concurrency Computat.: Pract. Exper. 2011; 23:1749–1773DOI: 10.1002/cpe
1766 W. BINDER ET AL.
Table I. Execution times and overhead factors for CCTProf, PacketCCTProf, and ParCCTProf.
CCTProf PacketCCTProf ParCCTProfOrig.
DaCapo (s) (s) ovh (s) ovh (s) ovh
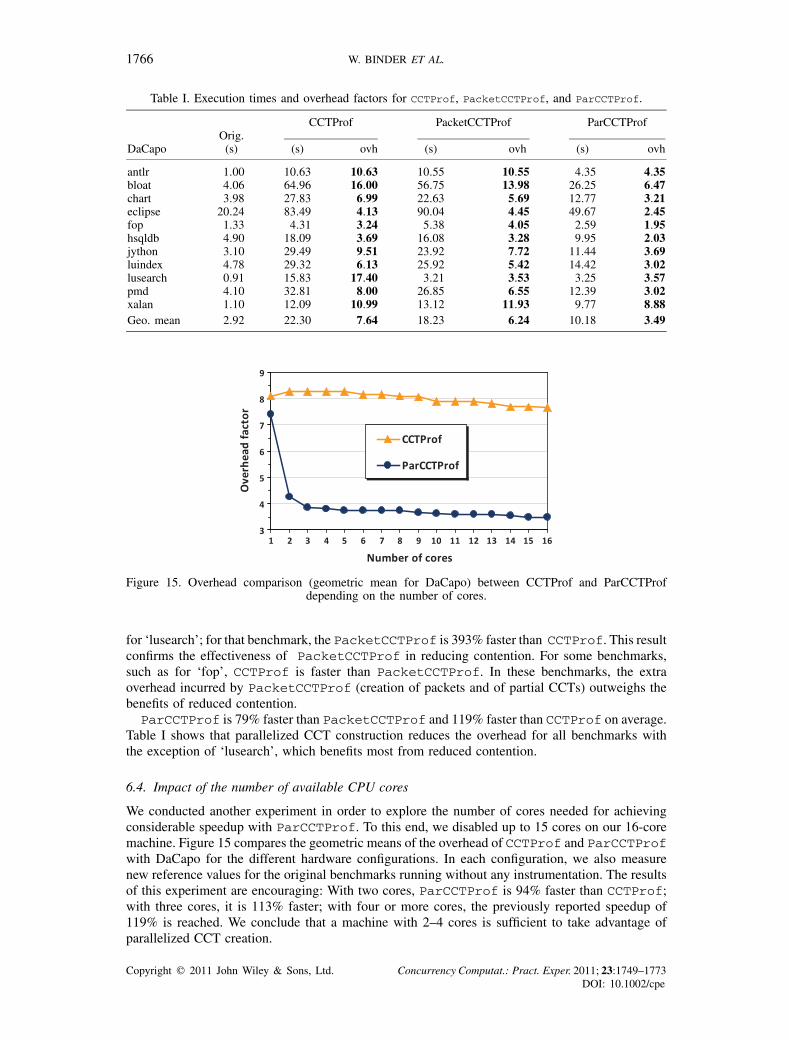
antlr 1.00 10.63 10.63 10.55 10.55 4.35 4.35bloat 4.06 64.96 16.00 56.75 13.98 26.25 6.47chart 3.98 27.83 6.99 22.63 5.69 12.77 3.21eclipse 20.24 83.49 4.13 90.04 4.45 49.67 2.45fop 1.33 4.31 3.24 5.38 4.05 2.59 1.95hsqldb 4.90 18.09 3.69 16.08 3.28 9.95 2.03jython 3.10 29.49 9.51 23.92 7.72 11.44 3.69luindex 4.78 29.32 6.13 25.92 5.42 14.42 3.02lusearch 0.91 15.83 17.40 3.21 3.53 3.25 3.57pmd 4.10 32.81 8.00 26.85 6.55 12.39 3.02xalan 1.10 12.09 10.99 13.12 11.93 9.77 8.88Geo. mean 2.92 22.30 7.64 18.23 6.24 10.18 3.49
Figure 15. Overhead comparison (geometric mean for DaCapo) between CCTProf and ParCCTProfdepending on the number of cores.
for ‘lusearch’; for that benchmark, the PacketCCTProf is 393% faster than CCTProf. This resultconfirms the effectiveness of PacketCCTProf in reducing contention. For some benchmarks,such as for ‘fop’, CCTProf is faster than PacketCCTProf. In these benchmarks, the extraoverhead incurred by PacketCCTProf (creation of packets and of partial CCTs) outweighs thebenefits of reduced contention.ParCCTProf is 79% faster than PacketCCTProf and 119% faster than CCTProf on average.
Table I shows that parallelized CCT construction reduces the overhead for all benchmarks withthe exception of ‘lusearch’, which benefits most from reduced contention.
6.4. Impact of the number of available CPU cores
We conducted another experiment in order to explore the number of cores needed for achievingconsiderable speedup with ParCCTProf. To this end, we disabled up to 15 cores on our 16-coremachine. Figure 15 compares the geometric means of the overhead of CCTProf and ParCCTProfwith DaCapo for the different hardware configurations. In each configuration, we also measurenew reference values for the original benchmarks running without any instrumentation. The resultsof this experiment are encouraging: With two cores, ParCCTProf is 94% faster than CCTProf;with three cores, it is 113% faster; with four or more cores, the previously reported speedup of119% is reached. We conclude that a machine with 2–4 cores is sufficient to take advantage ofparallelized CCT creation.
Copyright � 2011 John Wiley & Sons, Ltd. Concurrency Computat.: Pract. Exper. 2011; 23:1749–1773DOI: 10.1002/cpe
FLEXIBLE AND EFFICIENT PROFILING WITH AOP 1767
0 200 400 600 800
1000 1200 1400 1600
% C
PU
Util
izat
ion
% Execution
lusearch
CCT ProcessingApplication
System
0 200 400 600 800
1000 1200 1400 1600
0
% C
PU
Util
izat
ion
% Execution
xalan
CCT ProcessingApplication
System
20 40 60 80 100
0 20 40 60 80 100
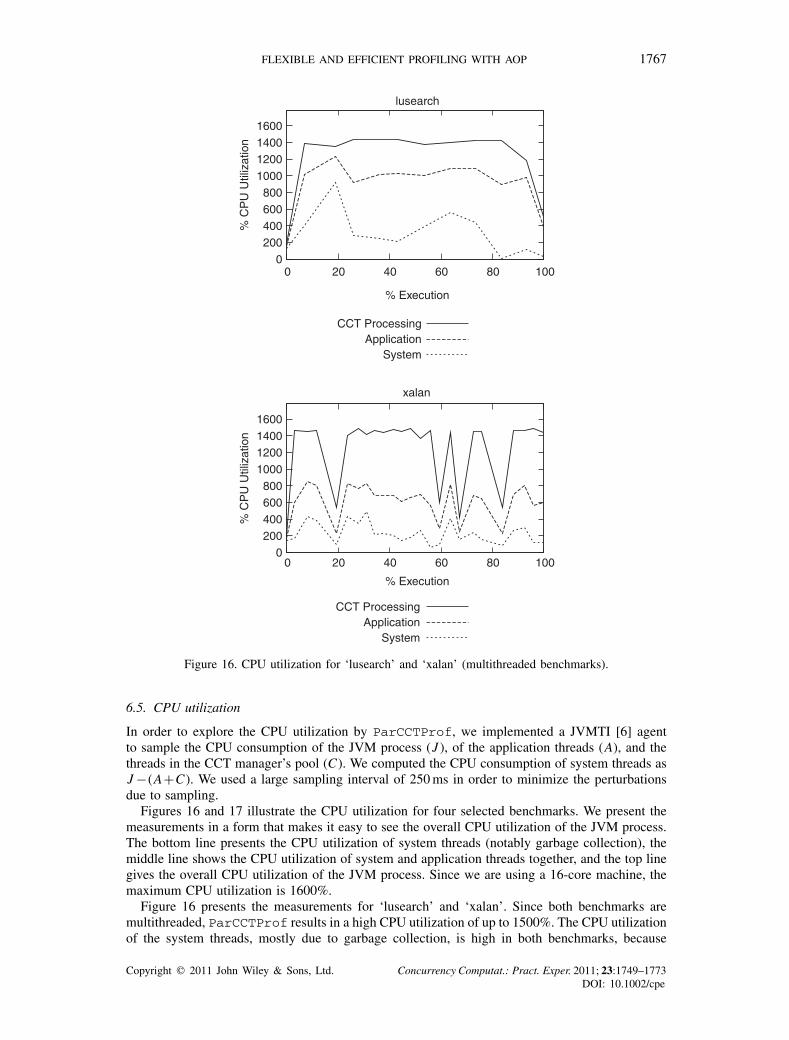
Figure 16. CPU utilization for ‘lusearch’ and ‘xalan’ (multithreaded benchmarks).
6.5. CPU utilization
In order to explore the CPU utilization by ParCCTProf, we implemented a JVMTI [6] agentto sample the CPU consumption of the JVM process (J ), of the application threads (A), and thethreads in the CCT manager’s pool (C). We computed the CPU consumption of system threads asJ −(A+C). We used a large sampling interval of 250 ms in order to minimize the perturbationsdue to sampling.
Figures 16 and 17 illustrate the CPU utilization for four selected benchmarks. We present themeasurements in a form that makes it easy to see the overall CPU utilization of the JVM process.The bottom line presents the CPU utilization of system threads (notably garbage collection), themiddle line shows the CPU utilization of system and application threads together, and the top linegives the overall CPU utilization of the JVM process. Since we are using a 16-core machine, themaximum CPU utilization is 1600%.
Figure 16 presents the measurements for ‘lusearch’ and ‘xalan’. Since both benchmarks aremultithreaded, ParCCTProf results in a high CPU utilization of up to 1500%. The CPU utilizationof the system threads, mostly due to garbage collection, is high in both benchmarks, because
Copyright � 2011 John Wiley & Sons, Ltd. Concurrency Computat.: Pract. Exper. 2011; 23:1749–1773DOI: 10.1002/cpe
1768 W. BINDER ET AL.
0 200 400 600 800
1000 1200 1400 1600
0 20 40 60 80 100%
CP
U U
tiliz
atio
n
% Execution
bloat
CCT ProcessingApplication
System
0 200 400 600 800
1000 1200 1400 1600
0 20 40 60 80 100
% C
PU
Util
izat
ion
% Execution
pmd
CCT ProcessingApplication
System
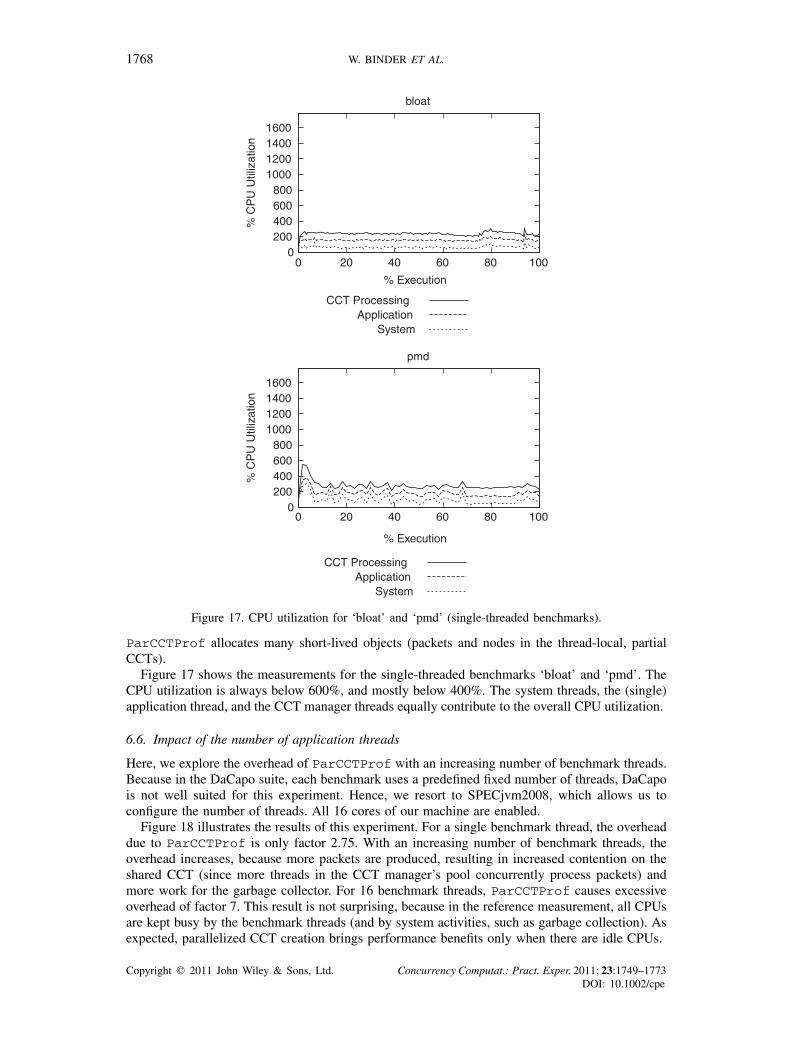
Figure 17. CPU utilization for ‘bloat’ and ‘pmd’ (single-threaded benchmarks).
ParCCTProf allocates many short-lived objects (packets and nodes in the thread-local, partialCCTs).
Figure 17 shows the measurements for the single-threaded benchmarks ‘bloat’ and ‘pmd’. TheCPU utilization is always below 600%, and mostly below 400%. The system threads, the (single)application thread, and the CCT manager threads equally contribute to the overall CPU utilization.
6.6. Impact of the number of application threads
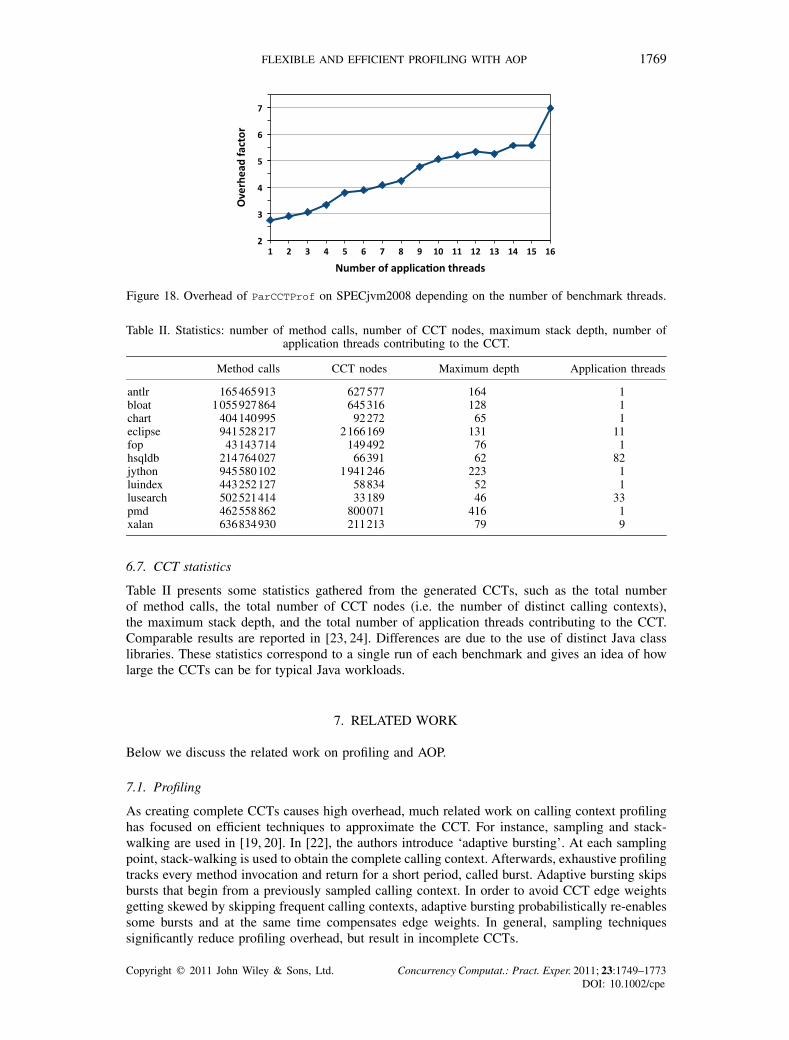
Here, we explore the overhead of ParCCTProf with an increasing number of benchmark threads.Because in the DaCapo suite, each benchmark uses a predefined fixed number of threads, DaCapois not well suited for this experiment. Hence, we resort to SPECjvm2008, which allows us toconfigure the number of threads. All 16 cores of our machine are enabled.
Figure 18 illustrates the results of this experiment. For a single benchmark thread, the overheaddue to ParCCTProf is only factor 2.75. With an increasing number of benchmark threads, theoverhead increases, because more packets are produced, resulting in increased contention on theshared CCT (since more threads in the CCT manager’s pool concurrently process packets) andmore work for the garbage collector. For 16 benchmark threads, ParCCTProf causes excessiveoverhead of factor 7. This result is not surprising, because in the reference measurement, all CPUsare kept busy by the benchmark threads (and by system activities, such as garbage collection). Asexpected, parallelized CCT creation brings performance benefits only when there are idle CPUs.
Copyright � 2011 John Wiley & Sons, Ltd. Concurrency Computat.: Pract. Exper. 2011; 23:1749–1773DOI: 10.1002/cpe
FLEXIBLE AND EFFICIENT PROFILING WITH AOP 1769
Figure 18. Overhead of ParCCTProf on SPECjvm2008 depending on the number of benchmark threads.
Table II. Statistics: number of method calls, number of CCT nodes, maximum stack depth, number ofapplication threads contributing to the CCT.
Method calls CCT nodes Maximum depth Application threads
antlr 165465913 627577 164 1bloat 1055927864 645316 128 1chart 404140995 92272 65 1eclipse 941528217 2166169 131 11fop 43143714 149492 76 1hsqldb 214764027 66391 62 82jython 945580102 1941246 223 1luindex 443252127 58834 52 1lusearch 502521414 33189 46 33pmd 462558862 800071 416 1xalan 636834930 211213 79 9
6.7. CCT statistics
Table II presents some statistics gathered from the generated CCTs, such as the total numberof method calls, the total number of CCT nodes (i.e. the number of distinct calling contexts),the maximum stack depth, and the total number of application threads contributing to the CCT.Comparable results are reported in [23, 24]. Differences are due to the use of distinct Java classlibraries. These statistics correspond to a single run of each benchmark and gives an idea of howlarge the CCTs can be for typical Java workloads.
7. RELATED WORK
Below we discuss the related work on profiling and AOP.
7.1. Profiling
As creating complete CCTs causes high overhead, much related work on calling context profilinghas focused on efficient techniques to approximate the CCT. For instance, sampling and stack-walking are used in [19, 20]. In [22], the authors introduce ‘adaptive bursting’. At each samplingpoint, stack-walking is used to obtain the complete calling context. Afterwards, exhaustive profilingtracks every method invocation and return for a short period, called burst. Adaptive bursting skipsbursts that begin from a previously sampled calling context. In order to avoid CCT edge weightsgetting skewed by skipping frequent calling contexts, adaptive bursting probabilistically re-enablessome bursts and at the same time compensates edge weights. In general, sampling techniquessignificantly reduce profiling overhead, but result in incomplete CCTs.
Copyright � 2011 John Wiley & Sons, Ltd. Concurrency Computat.: Pract. Exper. 2011; 23:1749–1773DOI: 10.1002/cpe
1770 W. BINDER ET AL.
In [23], the authors introduce the probabilistic calling context (PCC). Each thread maintainsa probabilistically unique value representing the current calling context. PCC causes only lowoverhead, but does not produce any CCT. PCC is intended for use in production systems to detectunexpected calling contexts that may indicate faulty program behavior. To this end, during atraining phase of the software, encountered PCC values are stored in a hash table, which is usedfor checking PCC values in the production system. As different calling contexts may compute thesame PCC value, the approach is prone to false negatives. Moreover, PCC excludes methods inthe Java class library from the calling context and does not accurately handle calling context whennative code calls back into bytecode.
Most prevailing approaches to calling context profiling depend on a modified JVM or on nativecode, limiting portability. For example, adaptive bursting [22] relies on the JVM Profiler Interface(JVMPI), the predecessor of the JVMTI [6], which requires profiling agents to be written in nativecode. PCC [23] is based on a modified Jikes RVM [34], thus preventing its use on other standardJVMs. In contrast, we strive for maximum portability, compatibility with standard JVMs, andextensibility, thanks to the use of AOP. Nonetheless, while several other approaches, such as PCC,exclude the Java class library from profiling, our approach guarantees complete method coveragethanks to comprehensive aspect weaving.
In some profilers, the profiler code is adapted at runtime based on user choices, in order torestrict profiling to only part of an executing application or to enable and disable the collection ofcertain dynamic metrics. This approach helps to reduce profiling overhead, since only data that theuser is currently interested in are gathered. A good example of such a profiler is JFluid [2], whichhas been integrated in the NetBeans Profiler [35]. JFluid allows to enable and disable profilingcode in a running application. JFluid measures execution time for selected methods and generatesa CCT to help analyze the contributions of direct and indirect callees to the execution time of theselected methods. When the user selects different methods for profiling at runtime, JFluid adaptsthe profiling code accordingly with the aid of code hotswapping. However, because JFluid relieson low-level bytecode instrumentation techniques, it cannot be easily extended; the set of dynamicmetrics collected by JFluid is hard-coded.
Shadow profiling [36] is a technique for sampling long traces of instrumented code in parallelwith normal program execution. Instead of directly instrumenting an application, a shadow processis periodically created and instrumented for profiling, while the original process continues execu-tion. The Pin [37] binary instrumentation tool is used to instrument the shadow process. While thisapproach avoids the execution of profiling code by the primary application process, the executionof the shadow process is not optimized. Similar to shadow profiling, SuperPin [38] is also basedon Pin and exploits parallel hardware to speedup instrumented code. It runs the uninstrumentedapplication and periodically forks off instrumented, non-overlapping slices of large code regionsthat execute concurrently, thereby hiding much of the cost of executing the analysis code. Bothshadow profiling and SuperPin target parallelism at the level of processes and use a low-level instru-mentation scheme.
In [39], a dynamic analysis framework is presented to exploit multicore hardware. Ha et al.[39] introduced cache-friendly asymmetric buffering, a lock-free ring-buffer that offers efficientcommunication between application and analysis threads. The framework makes use of carefullytuned CPU affinities of threads. The framework relies on extensions to the Jikes RVM [34]
PiPA [40] parallelizes profiling on multicores using pipelining. In PiPA, threads form a pipelinefor collecting and processing profiling data. The program being profiled acts as the source of thepipeline. Processing of profiling data can be divided into multiple pipeline stages; at some stages,multiple threads may execute in parallel. PiPA is based on the dynamic binary instrumentationframework DynamoRIO [41].
7.2. Aspect-oriented programming
AOP allows to describe program transformations for profiling in a concise, high-level manner.DJProf [29] defines several profiling aspects in AspectJ in order to collect various dynamic metrics.However, as witnessed by DJProf’s authors, the limitations of prevailing aspect weavers (such as
Copyright � 2011 John Wiley & Sons, Ltd. Concurrency Computat.: Pract. Exper. 2011; 23:1749–1773DOI: 10.1002/cpe

FLEXIBLE AND EFFICIENT PROFILING WITH AOP 1771
AspectJ or abc), which do not support aspect weaving in the Java class library, result in incompleteand inaccurate profiles. Furthermore, some aspect of DJProf cause excessive overhead. Thanks tocomprehensive aspect weaving and efficient inter-advice communication, our approach solves boththese problems. In addition, and in contrast to DJProf, we explore aspect-based calling contextprofiling and reduce overhead on multicores by parallelizing program execution and profiling.
Steamloom [42, 43] and PROSE [44, 45] provide aspect support within the JVM, which mayease the collection of calling context information thanks to the direct access to JVM internals.Steamloom is an extension of the Jikes RVM [34] supporting efficient aspect execution and runtimeaspect weaving. PROSE uses code hotswapping techniques, bytecode instrumentation, and anextension of the Jikes RVM to support runtime aspect weaving. These approaches trade portabilityfor performance, since the aspect support is integrated in the JVM. In contrast, our approachsupports comprehensive aspect weaving and is compatible with state-of-the-art standard JVMs.
8. CONCLUSION
Bytecode instrumentation techniques are very useful in the development of profilers, but masteringthem requires deep knowledge of the virtual machine and of low-level bytecode engineeringlibraries. The resulting profilers are often complex, require considerable development effort, andare difficult to extend. As an alternative to bytecode instrumentation, we promote AOP for therapid development of extensible profilers. With the aid of AOP, many important profilers can beconcisely specified in a few lines of code.
However, current AOP frameworks, such as AspectJ, lack some features that are essential forbuilding useful and efficient aspect-based profilers. For instance, aspect weaving in the standardJava class library is seriously restricted or even impossible. Furthermore, it is not possible toefficiently pass data in local variables from one join point to another within the same wovenmethod. To overcome these limitations, we leverage MAJOR, an aspect weaver that ensurescomprehensive weaving in all classes loaded in a JVM. Furthermore, we introduce inter-advicecommunication, a novel mechanism for passing data in local variables between woven advices.Inter-advice communication is complementary to the features offered by current AOP languages,and we integrated it into MAJOR.
To illustrate our approach to profiler development, we presented two case studies, an aspect forlistener latency profiling, as well as an extensible and efficient aspect for calling context profiling.Regarding the latter aspect, we achieve significant speedup by parallelizing program executionand profiling on multicores. Using AOP for specifying profilers eases the implementation of suchadvanced optimizations, because low-level instrumentation details are hidden from the profilerdeveloper.
Regarding limitations, the JVM imposes strict limits on certain parts of a class file (e.g. the sizeof the constant pool is limited); these limits may be exceeded by the code inserted upon aspectweaving. Our approach aggravates this issue by inlining advices for inter-advice communication,usually increasing the code bloat. Nonetheless, we have not yet encountered any problems due tocode growth in practice.
Concerning ongoing research, we are extending AspectJ with new pointcuts in order to interceptthe execution of basic blocks of code or specified bytecode sequences. For example, these newpointcuts allow an aspect-based specification of profilers that use the number of executed bytecodesas platform-independent dynamic metric, as well as of cross-profilers for embedded Java systems.Existing tools in these areas rely on hard-coded, low-level bytecode instrumentations that aredifficult to maintain [4, 5, 46].
ACKNOWLEDGEMENTS
The work presented in this article has been supported by the Swiss National Science Foundation. It wasconducted while A. Villazón was with the University of Lugano, Switzerland.
Copyright � 2011 John Wiley & Sons, Ltd. Concurrency Computat.: Pract. Exper. 2011; 23:1749–1773DOI: 10.1002/cpe
1772 W. BINDER ET AL.
REFERENCES
1. Dufour B, Hendren L, Verbrugge C. *J: A tool for dynamic analysis of Java programs. OOPSLA ’03: Companionof the 18th Annual ACM SIGPLAN Conference on Object-oriented Programming, Systems, Languages, andApplications. ACM Press: New York, NY, U.S.A., 2003; 306–307.
2. Dmitriev M. Profiling Java applications using code hotswapping and dynamic call graph revelation. WOSP ’04:Proceedings of the Fourth International Workshop on Software and Performance. ACM Press: New York, 2004;139–150.
3. Jovic M, Hauswirth M. Measuring the performance of interactive applications with listener latency profiling.PPPJ ’08: Proceedings of the Sixth International Symposium on Principles and Practice of Programming inJava. ACM: New York, NY, U.S.A., 2008; 137–146.
4. Binder W, Hulaas J, Moret P, Villazón A. Platform-independent profiling in a virtual execution environment.Software: Practice and Experience 2009; 39(1):47–79.
5. Moret P, Binder W, Villazón A. CCCP: Complete calling context profiling in virtual execution environments.PEPM ’09: Proceedings of the 2009 ACM SIGPLAN Workshop on Partial Evaluation and Program Manipulation.ACM: Savannah, GA, U.S.A., 2009; 151–160.
6. Sun Microsystems, Inc., JVM Tool Interface (JVMTI) Version 1.1, 2006. Available at: http://java.sun.com/javase/6/docs/platform/jvmti/jvmti.html [19 April 2011].
7. The Apache Jakarta Project. The Byte Code Engineering Library (BCEL). Available at: http://jakarta.apache.org/bcel/ [19 April 2011].
8. OW2 Consortium. ASM—A Java bytecode engineering library. Available at: http://asm.ow2.org/ [19 April 2011].9. Chiba S. Load-time structural reflection in Java. Proceedings of the 14th European Conference on Object-oriented
Programming (ECOOP’2000) (Lecture Notes in Computer Science, vol. 1850). Springer: Cannes, France, 2000;313–336.
10. Vallée-Rai R, Gagnon E, Hendren LJ, Lam P, Pominville P, Sundaresan V. Optimizing Java bytecode using theSoot framework: Is it feasible? Compiler Construction, the Ninth International Conference (CC 2000), Berlin,Germany, 2000; 18–34.
11. Kiczales G, Lamping J, Menhdhekar A, Maeda C, Lopes C, Loingtier J-M, Irwin J. Aspect-oriented programming.In ECOOP ’97: Proceedings of the 11th European Conference on Object-oriented Programming (Lecture Notesin Computer Science, vol. 1241), Aksit M, Matsuoka S (eds.). Springer: Jyväkylä, Finnland, 1997; 220–242.
12. Kiczales G, Hilsdale E, Hugunin J, Kersten M, Palm J, Griswold WG. An overview of AspectJ. Proceedingsof the 15th European Conference on Object-oriented Programming (ECOOP-2001) (Lecture Notes in ComputerScience, vol. 2072), Knudsen JL (ed.). Springer: London, U.K., 2001; 327–353.
13. Avgustinov P, Christensen AS, Hendren LJ, Kuzins S, Lhoták J, Lhoták O, de Moor O, Sereni D, SittampalamG, Tibble J. abc: An extensible AspectJ compiler. AOSD ’05: Proceedings of the Fourth International Conferenceon Aspect-oriented Software Development. ACM Press: New York, NY, U.S.A., 2005; 87–98.
14. Villazón A, Binder W, Moret P. Aspect weaving in standard Java class libraries. PPPJ ’08: Proceedings of the6th International Symposium on Principles and Practice of Programming in Java. ACM: New York, NY, U.S.A.,2008; 159–167.
15. Villazón A, Binder W, Moret P. Flexible calling context reification for aspect-oriented programming. AOSD’09: Proceedings of the Eighth International Conference on Aspect-oriented Software Development. ACM:Charlottesville, VA, U.S.A., 2009; 63–74.
16. Villazón A, Binder W, Moret P, Ansaloni D. Comprehensive aspect weaving for Java. Science of ComputerProgramming, 2010. Available at: http://dx.doi.org/10.1016/j.scico.2010.04.007 [19 April 2011].
17. Binder W, Hulaas J, Moret P. Advanced Java Bytecode Instrumentation. PPPJ’07: Proceedings of the FifthInternational Symposium on Principles and Practice of Programming in Java. ACM Press: New York, NY,U.S.A., 2007; 135–144.
18. Ammons G, Ball T, Larus JR. Exploiting hardware performance counters with flow and context sensitiveprofiling. PLDI ’97: Proceedings of the ACM SIGPLAN 1997 Conference on Programming Language Designand Implementation. ACM Press: New York, 1997; 85–96.
19. Arnold M, Sweeney PF. Approximating the calling context tree via sampling. Research Report RC21789, IBMT.J. Watson Research Center, July 2000.
20. Whaley J. A portable sampling-based profiler for Java virtual machines. Proceedings of the ACM 2000 Conferenceon Java Grande. ACM Press: New York, 2000; 78–87.
21. Spivey JM. Fast, accurate call graph profiling. Software: Practice and Experience 2004; 34(3):249–264.22. Zhuang X, Serrano MJ, Cain HW, Choi J-D. Accurate, efficient, and adaptive calling context profiling. PLDI ’06:
Proceedings of the 2006 ACM SIGPLAN Conference on Programming Language Design and Implementation.ACM: New York, NY, U.S.A., 2006; 263–271.
23. Bond MD, McKinley KS. Probabilistic calling context. OOPSLA ’07: Proceedings of the 22nd Annual ACMSIGPLAN Conference on Object Oriented Programming, Systems and Applications. ACM: New York, NY, U.S.A.,2007; 97–112.
24. Blackburn SM, Garner R, Hoffman C, Khan AM, McKinley KS, Bentzur R, Diwan A, Feinberg D, FramptonD, Guyer SZ, Hirzel M, Hosking A, Jump M, Lee H, Moss JEB, Phansalkar A, Stefanovi¢ D, VanDrunen T,von Dincklage D, Wiedermann B. The DaCapo benchmarks: Java benchmarking development and analysis.
Copyright � 2011 John Wiley & Sons, Ltd. Concurrency Computat.: Pract. Exper. 2011; 23:1749–1773DOI: 10.1002/cpe
FLEXIBLE AND EFFICIENT PROFILING WITH AOP 1773
OOPSLA ’06: Proceedings of the 21st Annual ACM SIGPLAN Conference on Object-oriented Programing,
Systems, Languages, and Applications. ACM Press: New York, NY, U.S.A., 2006; 169–190.25. The Standard Performance Evaluation Corporation. SPECjvm2008 Benchmarks, 2008. Available at:
http://www.spec.org/jvm2008/ [19 April 2011].26. Villazón A, Binder W, Ansaloni D, Moret P. Advanced runtime adaptation for Java. GPCE ’09: Proceedings
of the Eighth International Conference on Generative Programming and Component Engineering. ACM:New York, 2009; 85–94.
27. Binder W, Ansaloni D, Villazón A, Moret P. Parallelizing calling context profiling in virtual machines onmulticores. PPPJ ’09: Proceedings of the Seventh International Conference on Principles and Practice ofProgramming in Java. ACM Press: New York, NY, U.S.A., 2009; 111–120.
28. Ansaloni D, Binder W, Villazón A, Moret P. Rapid development of extensible profilers for the Java virtualmachine with aspect-oriented programming. WOSP/SIPEW 2010: Proceedings of the First Joint InternationalConference on Performance Engineering. ACM Press: New York, 2010; 57–62.
29. Pearce DJ, Webster M, Berry R, Kelly PHJ. Profiling with AspectJ. Software: Practice and Experience 2007;37(7):747–777.
30. Benavides LD, Douence R, Südholt M. Debugging and testing middleware with aspect-based control-flow andcausal patterns. Middleware ’08: Proceedings of the Ninth ACM/IFIP/USENIX International Conference onMiddleware. Springer New York, Inc: New York, NY, U.S.A., 2008; 183–202.
31. Binder W, Hulaas J. Flexible and efficient measurement of dynamic bytecode metrics. Fifth InternationalConference on Generative Programming and Component Engineering (GPCE-2006). ACM: Portland, OR, U.S.A.,2006; 171–180.
32. Hilsdale E, Hugunin J. Advice weaving in AspectJ. AOSD ’04: Proceedings of the Third International Conferenceon Aspect-oriented Software Development. ACM: New York, NY, U.S.A., 2004; 26–35.
33. Gosling J, Joy B, Steele GL, Bracha G. The Java Language Specification (3rd edn), The Java Series. Addison-Wesley: Reading, MA, 2005.
34. Alpern B, Attanasio CR, Barton JJ, Burke B, Cheng P, Choi J-D, Cocchi A, Fink SJ, Grove D, Hind M, HummelSF, Lieber D, Litvinov V, Mergen MF, Ngo N, Russell JR, Sarkar V, Serrano MJ, Shepherd JC, Smith SE,Sreedhar VC, Srinivasan H, Whaley J. The Jalapeño virtual machine. IBM Systems Journal 2000; 39(1):211–238.
35. NetBeans. The NetBeans Profiler Project. Available at: http://profiler.netbeans.org/ [19 April 2011].36. Moseley T, Shye A, Reddi VJ, Grunwald D, Peri R. Shadow profiling: Hiding instrumentation costs with
parallelism. CGO ’07: Proceedings of the Fifth IEEE/ACM International Symposium on Code Generation andOptimization. IEEE Computer Society: San Jose, CA, U.S.A., 2007; 198–208.
37. Luk C-K, Cohn R, Muth R, Ptil H, Klauser A, Lowney G, Wallace S, Reddi V, Hazelwood K. Pin: Buildingcustomized program analysis tools with dynamic instrumentation. PLDI 2005: Proceedings of the ACM SIGPLAN2005 Conference on Programming Language Design and Implementation. ACM Press: New York, 2005; 191–200.
38. Wallace S, Hazelwood K. SuperPin: Parallelizing dynamic instrumentation for real-time performance. CGO ’07:Proceedings of the International Symposium on Code Generation and Optimization. IEEE Computer Society:San Jose, CA, U.S.A., 2007; 209–217.
39. Ha J, Arnold M, Blackburn SM, McKinley KS. A concurrent dynamic analysis framework for multicore hardware.OOPSLA ’09: Proceeding of the 24th ACM SIGPLAN Conference on Object-oriented Programming, Systems,Languages, and Applications. ACM Press: Orlando, FL, U.S.A., 2009; 155–174.
40. Zhao Q, Cutcutache I, Wong W-F. PiPA: Pipelined profiling and analysis on multi-core systems. CGO ’08:Proceedings of the Sixth IEEE/ACM International Symposium on Code Generation and Optimization. ACMPress: Boston, MA, U.S.A., 2008; 185–194.
41. Bruening D, Garnett T, Amarasinghe S. An infrastructure for adaptive dynamic optimization. CGO 2003:Proceedings of the International Symposium on Code Generation and Optimization, San Francisco, CA, U.S.A.,2003; 265–276.
42. Haupt M, Mezini M, Bockisch C, Dinkelaker T, Eichberg M, Krebs M. An execution layer for aspect-orientedprogramming languages. VEE ’05: Proceedings of the First ACM/USENIX International Conference on VirtualExecution Environments. ACM: New York, NY, U.S.A., 2005; 142–152.
43. Bockisch C, Arnold M, Dinkelaker T, Mezini M. Adapting virtual machine techniques for seamless aspect support.OOPSLA ’06: Proceedings of the 21st Annual ACM SIGPLAN Conference on Object-oriented ProgrammingSystems, Languages, and Applications. ACM: New York, NY, U.S.A., 2006; 109–124.
44. Popovici A, Gross T, Alonso G. Dynamic weaving for aspect-oriented programming. AOSD ’02: Proceedingsof the First International Conference on Aspect-oriented Software Development. ACM Press: New York, NY,U.S.A., 2002; 141–147.
45. Popovici A, Alonso G, Gross T. Just-in-time aspects: efficient dynamic weaving for Java. AOSD ’03: Proceedingsof the Second International Conference on Aspect-oriented Software Development. ACM Press: New York, NY,U.S.A., 2003; 100–109.
46. Binder W, Schoeberl M, Moret P, Villazón A. Cross-profiling for embedded Java processors. Fifth InternationalConference on the Quantitative Evaluation of Systems (QEST-2008). IEEE Computer Society: Saint-Malo, France,2008; 287–296.
Copyright � 2011 John Wiley & Sons, Ltd. Concurrency Computat.: Pract. Exper. 2011; 23:1749–1773DOI: 10.1002/cpe