five year financial forecast - the city of san … · five year financial forecast fy 2013 - fy...
TRANSCRIPT
FIVE YEARFINANCIALFORECAST
FY 2013 - FY 2017
CITY OF SAN ANTONIO, TEXASA current and long-range assessment of
financial conditions and costs for City Services
CITY OF SAN ANTONIO
Five Year Financial Forecast Fiscal Year 2013 To 2017
PREPARED BY:
OFFICE OF MANAGEMENT AND BUDGET
MARIA D. VILLAGOMEZ CPA, DIRECTOR
JUSTINA TATE, ASSISTANT DIRECTOR BRYAN LAYTON, ASSISTANT DIRECTOR
KANDICE BOUTTE KISHA HOLLAND LUCY RODRIGUEZ
ANA BRADSHAW JOEL JENKS VICTORIA ROEDER
MANNY ESPINO ZACHERY KUENTZ PATRICK STECK
HOLLY FRINDELL PHIL LANEY JOHN STEVENS
RYAN HENDRICKS BRIAN LARSON EDWARD TAPIA
CATHERINE HERNANDEZ RYAN LUCKETT CATHERINE TKACHYK
MATTHEW HOBSON SHANNON OSTER ROBERT YOUNG
ANGELA RAMIREZ
MAY 16, 2012

CITY OF SAN ANTONIO
FIVE YEAR FINANCIAL FORECAST
FY 2013 – FY 2017
TABLE OF CONTENTS
DESCRIPTION PAGE
GENERAL FUND FORECAST
FORECAST OVERVIEW ……………………………………………………………………………………………………. 1
FORECAST ASSUMPTIONS …..…………………………………………………………………………………………. 3
FORECAST SCHEDULE …………………………………………………………………………………………………….. 4
REVENUES …………………………………..…………………………………………………………………………………. 6
MANDATES & COMMITMENTS.……………………………………………………………………………………...15
ADDITIONAL EXPENDITURE REQUESTS.……………………………………………………………………………17
FINANCIAL RESERVE FUNDS …………………………………………………………………………………………….18
SOLID WASTE OPERATING & MAINTENANCE FUND FORECAST……………………………………………..19
ECONOMIC PERSPECTIVE & OUTLOOK…………………………………………………………………………………. 26


OVERVIEW AND SUMMARY

OVERVIEW AND SUMMARY
The Financial Forecast provides a current and long-range financial assessment addressing revenues, City services and programs, and financial reserve policies. The primary objective of the Forecast is to provide the City Council and the community with an early financial assessment and identify significant issues that need to be addressed in the budget development process.
The forecast information presented in this document combines projected resources, current service expenditures, and mandated expenditures to illustrate the financial impact to the General Fund and Solid Waste Operating and Maintenance Fund and the ending balances for the two funds. Recent revenue trends and economic assumptions (many of which can be found in the Economic Outlook section of this document) are used to develop these figures. Service expenditures required to sustain the current (FY 2012) level of services are used throughout the forecast period based in part on the rate of inflation. The net result of this combined data highlights the adjustments needed over the forecast period to maintain a balanced budget as required by State Law. Many of the assumptions, projections, and cost estimates within this document are based on early and preliminary information that will be refined and changed as the FY 2013 Proposed Operating Budget is developed and presented to City Council on August 9, 2012.
GENERAL FUND
During the forecast period, total General Fund revenue is expected to grow annually at rates ranging from less than 1.0% to 3.0%. The FY 2012 revenue forecast estimate is approximately $12 million higher than the current year adopted budget, or an overall increase of 1.3%. The rate of revenue growth projected in FY 2013 over the FY 2012 Adopted Budget is less than 1.5%. Revenue growth beyond FY 2013 is forecasted at rates of 2.3% in FY 2014, 2.6% in FY 2015, 2.9% in FY 2016, and 3.0% in FY 2017.
Projections show that while revenue growth gradually increases over the forecast period, cost drivers over the forecast period continue to exceed revenue growth. This increased growth in expenditures over the forecast period is primarily due to Police and Fire collective bargaining contractual increases, increased costs for the City’s civilian pay plan, and mandated operational costs associated with 2012 Bond Projects and other capital projects. The General Fund Schedule contains two sections – the current service budget and a section highlighting additional expenditures associated with policy issues. The current service budget section shows the aggregate annual projected expenditures required to sustain the current FY 2012 level of services. The policy section provides budget scenarios for employee compensation, economic development incentives, deferred maintenance for the Library, funding to maintain Animal Care Services goal of 70% live release, and debt service payments for the VIA Streetcar. These expenses will be considered and evaluated during the FY 2013 Budget Process and are shown in the schedule to provide estimated costs and the impact to the General Fund.
1

In FY 2012, the General Fund Adopted Ending Balance, which represents the difference between the City’s total available resources and total expenditures, is a positive $20.81 million. However in FY 2013, the forecasted General Fund ending balance is negative $24.6 million, which includes additional expenses and policy issues. Beyond FY 2013, negative ending balances continue through the forecast period.
In September 2011, the FY 2012 General Fund Budget was adopted by the Mayor and City Council which includes a Two-Year Budget Plan. A Two Year Budget plan was included in the FY 2012 Adopted Budget. The plan projected a negative fund balance of $40 million. Since the adoption of the FY 2012 Budget, several factors have impacted this projection bringing the FY 2013 negative ending balance from $40 million to a newly projected negative ending balance of $24.6 million.
2
FORECAST METHODOLOGIES AND ASSUMPTIONS
REVENUES
Departments responsible for administering the services and/or collecting the associated revenues work with the Office of Management & Budget to develop revenue projections based on an analysis of various factors. These include historical trends, current economic conditions, projected economic activity, and known future factors such as contracts and interlocal agreements. In some cases, a regression analysis is utilized to project revenues that are impacted by economic factors. Revenue projections do not include fee or rate increases and are based on current service levels.
EXPENDITURES
Expenditures assumed in the Forecast are based on the current service level, or funding needed to provide today’s level of recurring City services. Fiscal Year 2012 budget estimates are based on an analysis of current fiscal year expenditure trends by using six months of actual expenditures to project estimated expenditure levels at the end of FY 2012. The FY 2013 base projection modifies current service costs for price changes and assumes the removal of one-time improvements and adds second year costs for improvements included in the FY 2012 Adopted Budget. Inflation rates are also used to project certain non-personal services expenditures derived from the San Antonio Consumer Price Index (CPI) projections for each year from 2013 through 2017 (See Economic Outlook section for more detail on CPI projections used).
Expenditures in the Forecast include funding for Police and Fire collective bargaining agreements, implementation of the civilian pay plan, and operations and maintenance costs for the recently approved FY 2012 Bond Program. In FY 2013, the 50 police officers previously funded by a Federal Stimulus Grant are mostly funded by the City; in FY 2014 the City will absorb 100% of the cost associated with these positions. The Forecast also provides partial funding for 19 police officers positions should the City be awarded the Community Oriented Policing Grant. Other mandated expenditures and commitments are included in the projections as well as adjustments to financial reserve level to maintain reserves at 9% of total appropriations. Adjusted ending balances in the Forecast take into account the impact of operating expenses, mandated costs, additional expenditures, and policy issues.
3


GENERAL FUND FORECAST

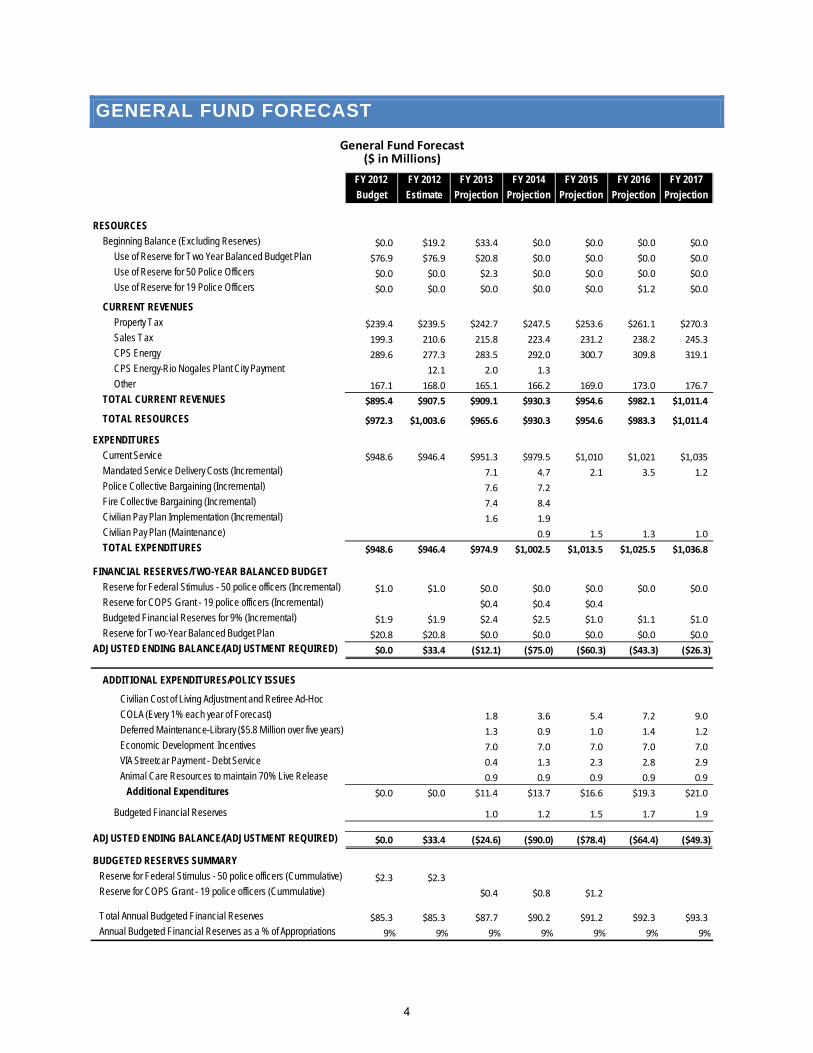
GENERAL FUND FORECAST
FY 2012
Budget
FY 2012
Estimate
FY 2013
Projection
FY 2014
Projection
FY 2015
Projection
FY 2016
Projection
FY 2017
Projection
RESOURCES
Beginning Balance (Excluding Reserves) $0.0 $19.2 $33.4 $0.0 $0.0 $0.0 $0.0
Use of Reserve for Two Year Balanced Budget Plan $76.9 $76.9 $20.8 $0.0 $0.0 $0.0 $0.0
Use of Reserve for 50 Police Officers $0.0 $0.0 $2.3 $0.0 $0.0 $0.0 $0.0
Use of Reserve for 19 Police Officers $0.0 $0.0 $0.0 $0.0 $0.0 $1.2 $0.0
CURRENT REVENUES
Property Tax $239.4 $239.5 $242.7 $247.5 $253.6 $261.1 $270.3
Sales Tax 199.3 210.6 215.8 223.4 231.2 238.2 245.3
CPS Energy 289.6 277.3 283.5 292.0 300.7 309.8 319.1
CPS Energy-Rio Nogales Plant City Payment 12.1 2.0 1.3
Other 167.1 168.0 165.1 166.2 169.0 173.0 176.7
TOTAL CURRENT REVENUES $895.4 $907.5 $909.1 $930.3 $954.6 $982.1 $1,011.4
TOTAL RESOURCES $972.3 $1,003.6 $965.6 $930.3 $954.6 $983.3 $1,011.4
EXPENDITURES
Current Service $948.6 $946.4 $951.3 $979.5 $1,010 $1,021 $1,035
Mandated Service Delivery Costs (Incremental) 7.1 4.7 2.1 3.5 1.2
Police Collective Bargaining (Incremental) 7.6 7.2
Fire Collective Bargaining (Incremental) 7.4 8.4
Civilian Pay Plan Implementation (Incremental) 1.6 1.9
Civilian Pay Plan (Maintenance) 0.9 1.5 1.3 1.0
TOTAL EXPENDITURES $948.6 $946.4 $974.9 $1,002.5 $1,013.5 $1,025.5 $1,036.8
FINANCIAL RESERVES/TWO-YEAR BALANCED BUDGET
Reserve for Federal Stimulus - 50 police officers (Incremental) $1.0 $1.0 $0.0 $0.0 $0.0 $0.0 $0.0
Reserve for COPS Grant - 19 police officers (Incremental) $0.4 $0.4 $0.4
Budgeted Financial Reserves for 9% (Incremental) $1.9 $1.9 $2.4 $2.5 $1.0 $1.1 $1.0
Reserve for Two-Year Balanced Budget Plan $20.8 $20.8 $0.0 $0.0 $0.0 $0.0 $0.0
ADJUSTED ENDING BALANCE/(ADJUSTMENT REQUIRED) $0.0 $33.4 ($12.1) ($75.0) ($60.3) ($43.3) ($26.3)
ADDITIONAL EXPENDITURES/POLICY ISSUES
Civilian Cost of Living Adjustment and Retiree Ad-Hoc
COLA (Every 1% each year of Forecast) 1.8 3.6 5.4 7.2 9.0
Deferred Maintenance-Library ($5.8 Million over five years) 1.3 0.9 1.0 1.4 1.2
Economic Development Incentives 7.0 7.0 7.0 7.0 7.0
VIA Streetcar Payment - Debt Service 0.4 1.3 2.3 2.8 2.9
Animal Care Resources to maintain 70% Live Release 0.9 0.9 0.9 0.9 0.9
Additional Expenditures $0.0 $0.0 $11.4 $13.7 $16.6 $19.3 $21.0
Budgeted Financial Reserves 1.0 1.2 1.5 1.7 1.9
ADJUSTED ENDING BALANCE/(ADJUSTMENT REQUIRED) $0.0 $33.4 ($24.6) ($90.0) ($78.4) ($64.4) ($49.3)
BUDGETED RESERVES SUMMARY
Reserve for Federal Stimulus - 50 police officers (Cummulative) $2.3 $2.3
Reserve for COPS Grant - 19 police officers (Cummulative) $0.4 $0.8 $1.2
Total Annual Budgeted Financial Reserves $85.3 $85.3 $87.7 $90.2 $91.2 $92.3 $93.3
Annual Budgeted Financial Reserves as a % of Appropriations 9% 9% 9% 9% 9% 9% 9%
General Fund Forecast($ in Millions)
4
GENERAL FUND FORECAST SCHEDULE EXPLANATION
BEGINNING BALANCE “Beginning Balance” reflects the amount of funds available for use at the beginning of the fiscal year. The balance is the result of the net prior year-end revenues-to-expenditures, except in years projected to have a negative ending balance. The Beginning Balance does not include the City’s Financial Reserves.
CURRENT REVENUES “Current Revenues” highlights the major sources of current revenue – Property Taxes, Sales Tax, CPS Energy, and all other sources, including fines and fees and other charges for current service.
TOTAL RESOURCES “Total Resources” is the sum of the Beginning Balance and Current Revenues.
CURRENT SERVICE “Current Service” shows the aggregate annual projected expenditures required to sustain the current FY 2012 level of services throughout the forecast period.
MANDATED SERVICE DELIVERY COSTS “Mandated Service Delivery Costs (Incremental)” are the incremental recurring and one-time mandated expenditures required each year. These expenditures constitute a change to a current service budget in order to comply with a federal, state, or local law or ordinance, a contractual obligation, or the operation and maintenance requirement needed for a completed capital improvement project.
ENDING BALANCE / ADJUSTMENT REQUIRED “Ending Balance / (Adjustment Required)” represents the difference between Total Available Resources and Total Expenditures, but does not include the cumulative funds for the City’s Budgeted Financial Reserves. A revenue and/or expenditure adjustment is required in those years when this balance is negative.
BUDGETED FINANCIAL RESERVES “Budgeted Financial Reserves (Incremental)” is the incremental amount needed each year to maintain annual Budgeted Financial Reserves at nine percent of appropriations in FY 2013 through FY 2017 respectively.
5
GENERAL FUND REVENUES
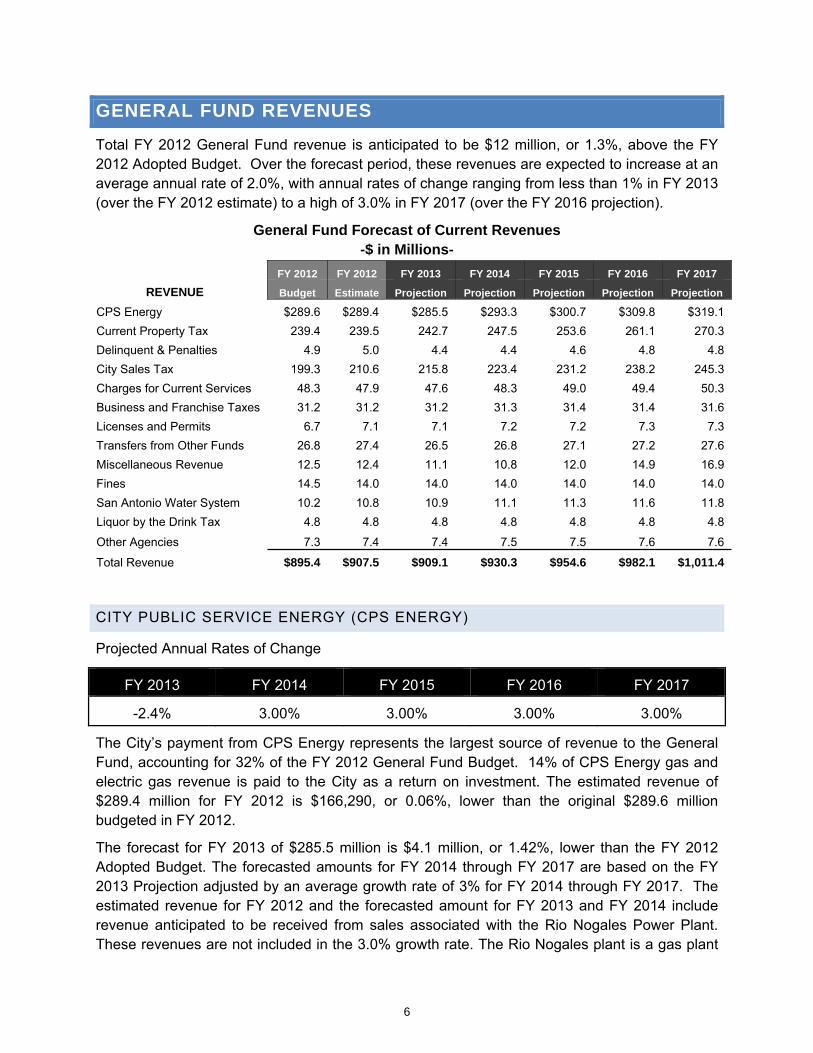
Total FY 2012 General Fund revenue is anticipated to be $12 million, or 1.3%, above the FY 2012 Adopted Budget. Over the forecast period, these revenues are expected to increase at an average annual rate of 2.0%, with annual rates of change ranging from less than 1% in FY 2013 (over the FY 2012 estimate) to a high of 3.0% in FY 2017 (over the FY 2016 projection).
General Fund Forecast of Current Revenues -$ in Millions-
FY 2012 FY 2012 FY 2013 FY 2014 FY 2015 FY 2016 FY 2017
REVENUE Budget Estimate Projection Projection Projection Projection Projection
CPS Energy $289.6 $289.4 $285.5 $293.3 $300.7 $309.8 $319.1
Current Property Tax 239.4 239.5 242.7 247.5 253.6 261.1 270.3
Delinquent & Penalties 4.9 5.0 4.4 4.4 4.6 4.8 4.8
City Sales Tax 199.3 210.6 215.8 223.4 231.2 238.2 245.3
Charges for Current Services 48.3 47.9 47.6 48.3 49.0 49.4 50.3
Business and Franchise Taxes 31.2 31.2 31.2 31.3 31.4 31.4 31.6
Licenses and Permits 6.7 7.1 7.1 7.2 7.2 7.3 7.3
Transfers from Other Funds 26.8 27.4 26.5 26.8 27.1 27.2 27.6
Miscellaneous Revenue 12.5 12.4 11.1 10.8 12.0 14.9 16.9
Fines 14.5 14.0 14.0 14.0 14.0 14.0 14.0
San Antonio Water System 10.2 10.8 10.9 11.1 11.3 11.6 11.8
Liquor by the Drink Tax 4.8 4.8 4.8 4.8 4.8 4.8 4.8
Other Agencies 7.3 7.4 7.4 7.5 7.5 7.6 7.6
Total Revenue $895.4 $907.5 $909.1 $930.3 $954.6 $982.1 $1,011.4
CITY PUBLIC SERVICE ENERGY (CPS ENERGY)
Projected Annual Rates of Change
FY 2013 FY 2014 FY 2015 FY 2016 FY 2017
-2.4% 3.00% 3.00% 3.00% 3.00%
The City’s payment from CPS Energy represents the largest source of revenue to the General Fund, accounting for 32% of the FY 2012 General Fund Budget. 14% of CPS Energy gas and electric gas revenue is paid to the City as a return on investment. The estimated revenue of $289.4 million for FY 2012 is $166,290, or 0.06%, lower than the original $289.6 million budgeted in FY 2012.
The forecast for FY 2013 of $285.5 million is $4.1 million, or 1.42%, lower than the FY 2012 Adopted Budget. The forecasted amounts for FY 2014 through FY 2017 are based on the FY 2013 Projection adjusted by an average growth rate of 3% for FY 2014 through FY 2017. The estimated revenue for FY 2012 and the forecasted amount for FY 2013 and FY 2014 include revenue anticipated to be received from sales associated with the Rio Nogales Power Plant. These revenues are not included in the 3.0% growth rate. The Rio Nogales plant is a gas plant
6

that was purchased by CPS in FY 2012. The additional revenues reflect CPS’ anticipated power sales from the plant to the open market and potential sales to CPS customers.
The additional revenues from the Rio Nogales Plant are $12 Million in FY 2012, $2 Million in FY 2013 and $1.3 Million in FY 2014. No payments from this plant are forecasted for FY 2015, FY 2016 or FY 2017.
Accurately forecasting the CPS Energy payment revenue is challenged by a number of variables such as the weather, growth of the system, changes in per capita consumption, fuel prices, generation mix, and unscheduled maintenance on generation plants. Historically, instability in natural gas prices coupled with fluctuations in demand due to weather have resulted in significant variances in the City’s payment from CPS Energy from year to year.
$165
$204 $190$213
$246 $249
$294$265
$284 $297
$0
$50
$100
$150
$200
$250
$300
$350
FY 2002 FY 2003 FY 2004 FY 2005 FY 2006 FY 2007 FY 2008 FY 2009 FY 2010 FY 2011
CPS Revenues Since 2002‐$ in Millions‐
$290 $289 $286 $293 $301 $310 $319
$0
$50
$100
$150
$200
$250
$300
$350
FY 2012 Budget
FY 2012 Estimate
FY 2013 Projection
FY 2014 Projection
FY 2015 Projection
FY 2016 Projection
FY 2017 Projection
CPS RevenuesFY 2012 Estimate and FY 2013 ‐ 2017 Projections
‐$ in Millions‐
7
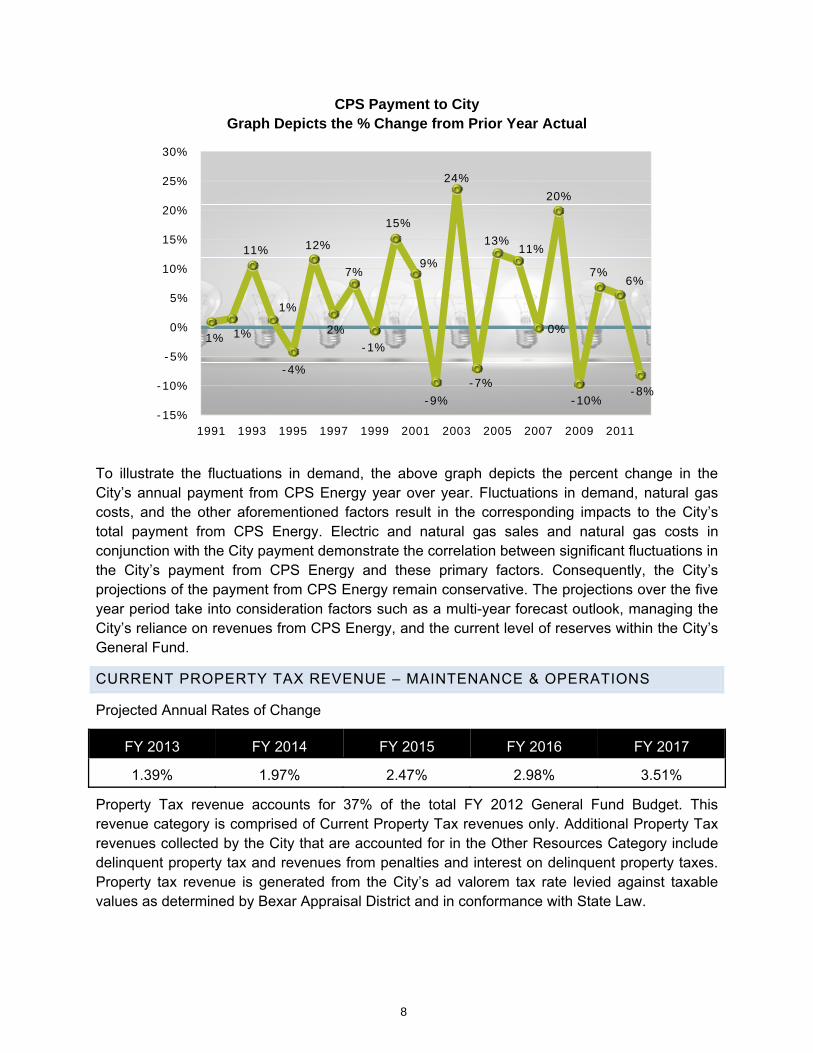
CPS Payment to City Graph Depicts the % Change from Prior Year Actual
To illustrate the fluctuations in demand, the above graph depicts the percent change in the City’s annual payment from CPS Energy year over year. Fluctuations in demand, natural gas costs, and the other aforementioned factors result in the corresponding impacts to the City’s total payment from CPS Energy. Electric and natural gas sales and natural gas costs in conjunction with the City payment demonstrate the correlation between significant fluctuations in the City’s payment from CPS Energy and these primary factors. Consequently, the City’s projections of the payment from CPS Energy remain conservative. The projections over the five year period take into consideration factors such as a multi-year forecast outlook, managing the City’s reliance on revenues from CPS Energy, and the current level of reserves within the City’s General Fund.
CURRENT PROPERTY TAX REVENUE – MAINTENANCE & OPERATIONS
Projected Annual Rates of Change
FY 2013 FY 2014 FY 2015 FY 2016 FY 2017
1.39% 1.97% 2.47% 2.98% 3.51%
Property Tax revenue accounts for 37% of the total FY 2012 General Fund Budget. This revenue category is comprised of Current Property Tax revenues only. Additional Property Tax revenues collected by the City that are accounted for in the Other Resources Category include delinquent property tax and revenues from penalties and interest on delinquent property taxes. Property tax revenue is generated from the City’s ad valorem tax rate levied against taxable values as determined by Bexar Appraisal District and in conformance with State Law.
1% 1%
11%
1%
-4%
12%
2%
7%
-1%
15%
9%
-9%
24%
-7%
13%11%
0%
20%
-10%
7%6%
-8%
-15%
-10%
-5%
0%
5%
10%
15%
20%
25%
30%
1991 1993 1995 1997 1999 2001 2003 2005 2007 2009 2011
8
The FY 2013 projected property taxable value is based on preliminary data from the Bexar County Appraisal District. The final Certified Property Tax Roll will be available by the end of July 2012.
The Property Tax revenue projections used in the budget and over the Forecast period are derived from the City’s total assessed value less exemptions such as the Over-65 and Disabled Residence Homestead and Disabled Veterans exemptions. City property taxes for the elderly and disabled are frozen and may not increase as long as the residence is maintained as a homestead by the owner. Additional tax relief provided by the City includes Tax Abatement/Phase-Ins exemptions, Freeport exemptions, Historic Property exemptions, and the 10% Residence Homestead limitation.
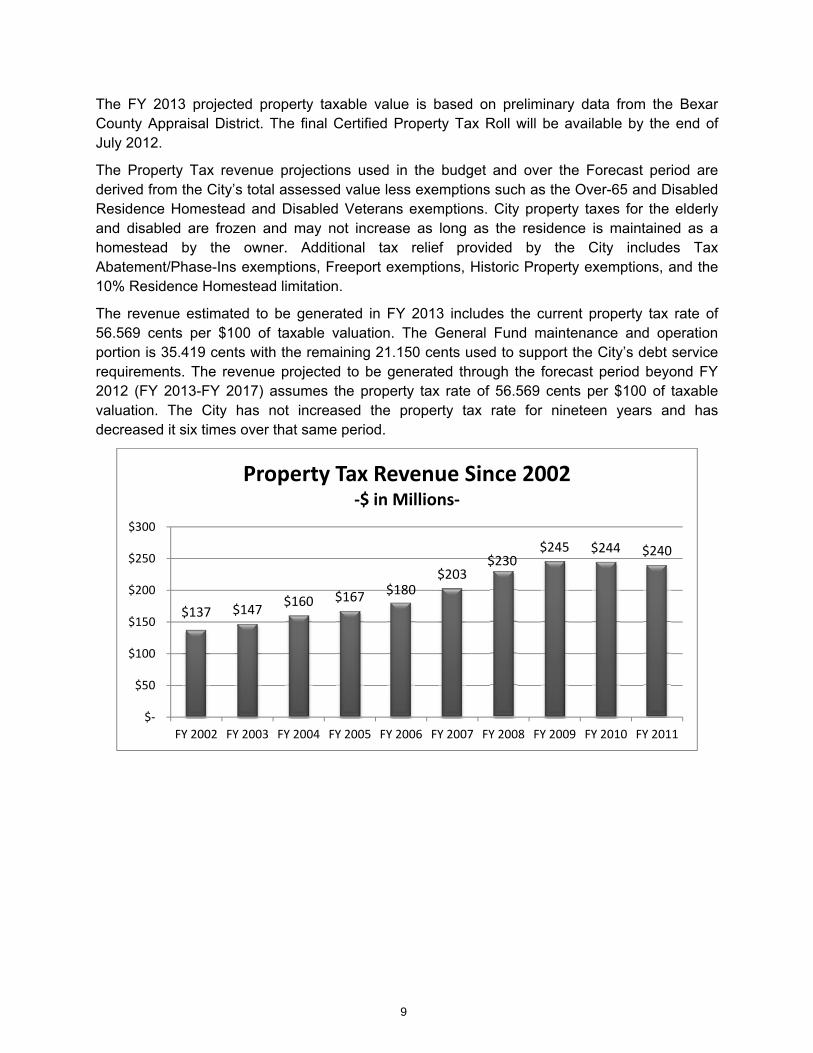
The revenue estimated to be generated in FY 2013 includes the current property tax rate of 56.569 cents per $100 of taxable valuation. The General Fund maintenance and operation portion is 35.419 cents with the remaining 21.150 cents used to support the City’s debt service requirements. The revenue projected to be generated through the forecast period beyond FY 2012 (FY 2013-FY 2017) assumes the property tax rate of 56.569 cents per $100 of taxable valuation. The City has not increased the property tax rate for nineteen years and has decreased it six times over that same period.
$137 $147$160 $167 $180
$203$230
$245 $244 $240
$‐
$50
$100
$150
$200
$250
$300
FY 2002 FY 2003 FY 2004 FY 2005 FY 2006 FY 2007 FY 2008 FY 2009 FY 2010 FY 2011
Property Tax Revenue Since 2002‐$ in Millions‐
9
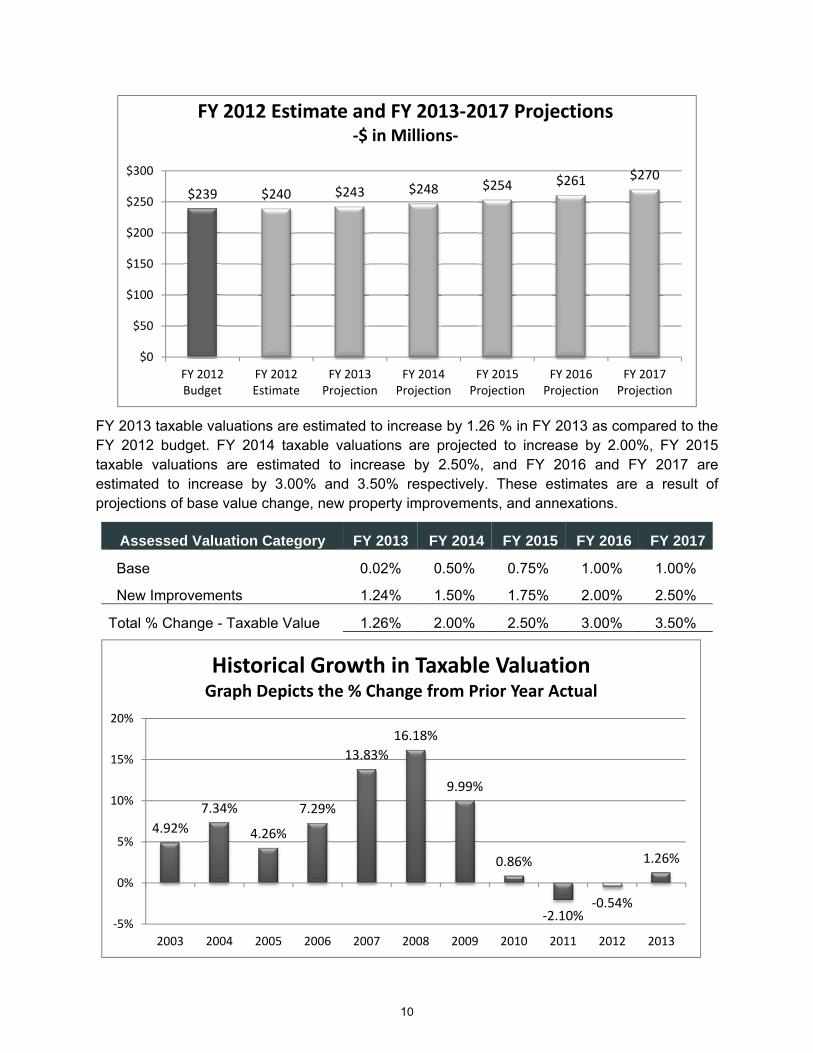
FY 2013 taxable valuations are estimated to increase by 1.26 % in FY 2013 as compared to the FY 2012 budget. FY 2014 taxable valuations are projected to increase by 2.00%, FY 2015 taxable valuations are estimated to increase by 2.50%, and FY 2016 and FY 2017 are estimated to increase by 3.00% and 3.50% respectively. These estimates are a result of projections of base value change, new property improvements, and annexations.
Assessed Valuation Category FY 2013 FY 2014 FY 2015 FY 2016 FY 2017
Base 0.02% 0.50% 0.75% 1.00% 1.00%
New Improvements 1.24% 1.50% 1.75% 2.00% 2.50%
Total % Change - Taxable Value 1.26% 2.00% 2.50% 3.00% 3.50%
$239 $240 $243 $248 $254 $261 $270
$0
$50
$100
$150
$200
$250
$300
FY 2012 Budget
FY 2012 Estimate
FY 2013 Projection
FY 2014 Projection
FY 2015 Projection
FY 2016 Projection
FY 2017 Projection
FY 2012 Estimate and FY 2013‐2017 Projections‐$ in Millions‐
4.92%
7.34%
4.26%
7.29%
13.83%
16.18%
9.99%
0.86%
‐2.10%‐0.54%
1.26%
‐5%
0%
5%
10%
15%
20%
2003 2004 2005 2006 2007 2008 2009 2010 2011 2012 2013
Historical Growth in Taxable ValuationGraph Depicts the % Change from Prior Year Actual
10
CITY SALES TAX REVENUE
Projected Annual Rates of Change
FY 2013 FY 2014 FY 2015 FY 2016 FY 2017
8.29% 3.50% 3.50% 3.00% 3.00%
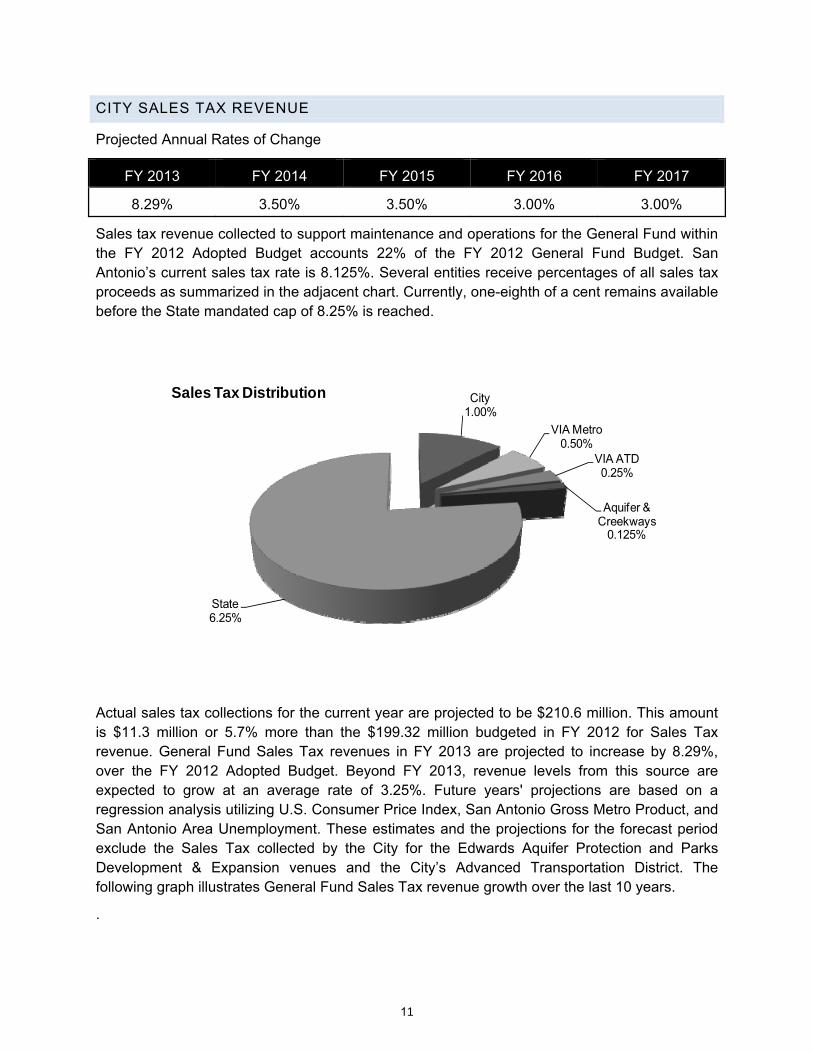
Sales tax revenue collected to support maintenance and operations for the General Fund within the FY 2012 Adopted Budget accounts 22% of the FY 2012 General Fund Budget. San Antonio’s current sales tax rate is 8.125%. Several entities receive percentages of all sales tax proceeds as summarized in the adjacent chart. Currently, one-eighth of a cent remains available before the State mandated cap of 8.25% is reached.
Actual sales tax collections for the current year are projected to be $210.6 million. This amount is $11.3 million or 5.7% more than the $199.32 million budgeted in FY 2012 for Sales Tax revenue. General Fund Sales Tax revenues in FY 2013 are projected to increase by 8.29%, over the FY 2012 Adopted Budget. Beyond FY 2013, revenue levels from this source are expected to grow at an average rate of 3.25%. Future years' projections are based on a regression analysis utilizing U.S. Consumer Price Index, San Antonio Gross Metro Product, and San Antonio Area Unemployment. These estimates and the projections for the forecast period exclude the Sales Tax collected by the City for the Edwards Aquifer Protection and Parks Development & Expansion venues and the City’s Advanced Transportation District. The following graph illustrates General Fund Sales Tax revenue growth over the last 10 years.
.
City1.00%
VIA Metro0.50%
VIA ATD0.25%
Aquifer & Creekways
0.125%
State6.25%
Sales Tax Distribution
11

Sales tax collections have a strong correlation to national and local economic conditions. As described in the Economic Perspective & Outlook Section, both the local and national economies have begun to show signs of growth. Local economic conditions, such as the unemployment rate and economic output, are projected to perform slightly better than national trends for every year throughout the forecast period.
Prior to April 2010 sales tax revenue declined for 16 consecutive months. Since June of 2010 sales tax revenues have increased year over year for 21 of the 22 months to date. The following table depicts the monthly change in year over year actual sales tax revenue for the City of San Antonio.
$140 $139 $148$163
$178$190 $196 $187 $189 $200
$0
$50
$100
$150
$200
$250
FY 2002 FY 2003 FY 2004 FY 2005 FY 2006 FY 2007 FY 2008 FY 2009 FY 2010 FY 2011
City of San Antonio Sales Tax Since 2002‐$ in Millions‐
$199 $211 $216 $223$231 $238 $245
$0
$50
$100
$150
$200
$250
$300
FY 2012 Budget
FY 2012 Estimate
FY 2013 Projection
FY 2014 Projection
FY 2015 Projection
FY 2016 Projection
FY 2017 Projection
FY 2012 Estimate and FY 2013‐2017 Projections‐$ in Millions‐
12
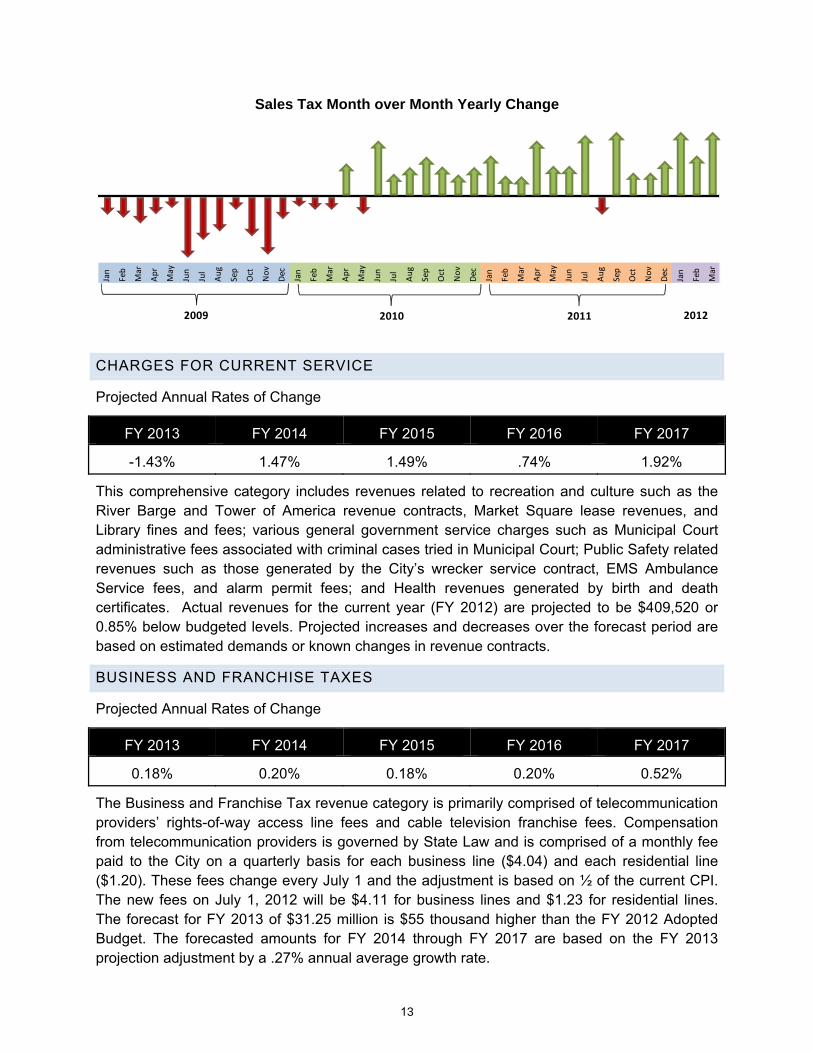
Sales Tax Month over Month Yearly Change
CHARGES FOR CURRENT SERVICE
Projected Annual Rates of Change
FY 2013 FY 2014 FY 2015 FY 2016 FY 2017
-1.43% 1.47% 1.49% .74% 1.92%
This comprehensive category includes revenues related to recreation and culture such as the River Barge and Tower of America revenue contracts, Market Square lease revenues, and Library fines and fees; various general government service charges such as Municipal Court administrative fees associated with criminal cases tried in Municipal Court; Public Safety related revenues such as those generated by the City’s wrecker service contract, EMS Ambulance Service fees, and alarm permit fees; and Health revenues generated by birth and death certificates. Actual revenues for the current year (FY 2012) are projected to be $409,520 or 0.85% below budgeted levels. Projected increases and decreases over the forecast period are based on estimated demands or known changes in revenue contracts.
BUSINESS AND FRANCHISE TAXES
Projected Annual Rates of Change
FY 2013 FY 2014 FY 2015 FY 2016 FY 2017
0.18% 0.20% 0.18% 0.20% 0.52%
The Business and Franchise Tax revenue category is primarily comprised of telecommunication providers’ rights-of-way access line fees and cable television franchise fees. Compensation from telecommunication providers is governed by State Law and is comprised of a monthly fee paid to the City on a quarterly basis for each business line ($4.04) and each residential line ($1.20). These fees change every July 1 and the adjustment is based on ½ of the current CPI. The new fees on July 1, 2012 will be $4.11 for business lines and $1.23 for residential lines. The forecast for FY 2013 of $31.25 million is $55 thousand higher than the FY 2012 Adopted Budget. The forecasted amounts for FY 2014 through FY 2017 are based on the FY 2013 projection adjustment by a .27% annual average growth rate.
Jan
Feb
Mar
Apr
May
Jun
Jul
Aug
Sep
Oct
Nov
Dec
Jan
Feb
Mar
Apr
May
Jun
Jul
Aug
Sep
Oct
Nov
Dec
Jan
Feb
Mar
Apr
May
Jun
Jul
Aug
Sep
Oct
Nov
Dec
Jan
Feb
Mar
2009 2010 2011 2012
13
Revenue derived from Certified Telecommunications Providers (CTPs) has been declining based on a decrease in actual line counts as reported by CTPs on a quarterly basis to the Public Utility Commission of Texas. Other Cities throughout Texas, both large and small, are experiencing similar CTP revenue declines; however, there was no change in the CTP estimated revenue for FY 2012 of $14.91 million. The cable television franchise fees estimated revenue for FY 2012 of $14.50 million is $295,000 or 2.00% lower than the FY 2012 budget amount of $14.79 million.
SAN ANTONIO WATER SYSTEM (SAWS) PAYMENT
Projected Annual Rates of Change
FY 2013 FY 2014 FY 2015 FY 2016 FY 2017
7.73% 1.50% 2.00% 2.00% 2.00%
The SAWS revenue payment to the City is based on 2.7% of SAWS’ total projected revenue for each year of the Forecast period. This payment agreement was initiated in April 1992 when certain City of San Antonio water and waste water systems were consolidated into the San Antonio Water System. The projected revenue for FY 2013 from SAWS is $10.95 million. This is an increase of $785,762 from the FY 2012 Budget of $10.16 million. Projections for the forecast period are based on historical revenue experience of SAWS for each of its core businesses.
OTHER RESOURCES
Projected Annual Rates of Change
FY 2013 FY 2014 FY 2015 FY 2016 FY 2017
-2.81% 0.25% 2.40% 4.32% 2.95%
Other revenues received by the General Fund include delinquent and penalties from property taxes, licenses and permits, fines, liquor by the drink, interest earnings, transfer from other funds, and other miscellaneous revenue. Other resources for the current year are projected to be approximately $78.09 million compared to the FY 2012 Budget of $77.50 million. This $598,000 increase is largely attributable to an increase in license and permits revenue. For FY 2013, total other General Fund revenue is expected to be $75.32 million or 2.26% lower than the $78.09 million estimated in FY 2012. In future years beyond FY 2013, other resources are projected to steadily increase by an average of 2.48%.
14
MANDATED EXPENDITURES AND COMMITMENTS
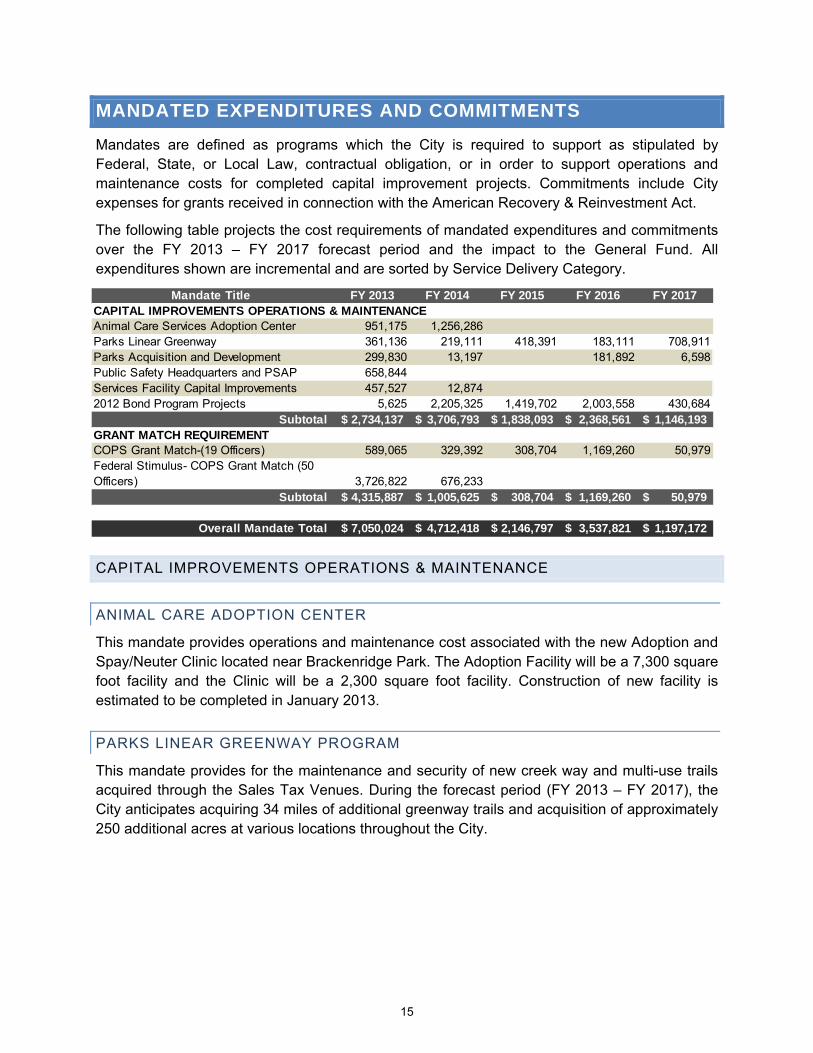
Mandates are defined as programs which the City is required to support as stipulated by Federal, State, or Local Law, contractual obligation, or in order to support operations and maintenance costs for completed capital improvement projects. Commitments include City expenses for grants received in connection with the American Recovery & Reinvestment Act.
The following table projects the cost requirements of mandated expenditures and commitments over the FY 2013 – FY 2017 forecast period and the impact to the General Fund. All expenditures shown are incremental and are sorted by Service Delivery Category.
CAPITAL IMPROVEMENTS OPERATIONS & MAINTENANCE
ANIMAL CARE ADOPTION CENTER
This mandate provides operations and maintenance cost associated with the new Adoption and Spay/Neuter Clinic located near Brackenridge Park. The Adoption Facility will be a 7,300 square foot facility and the Clinic will be a 2,300 square foot facility. Construction of new facility is estimated to be completed in January 2013.
PARKS LINEAR GREENWAY PROGRAM
This mandate provides for the maintenance and security of new creek way and multi-use trails acquired through the Sales Tax Venues. During the forecast period (FY 2013 – FY 2017), the City anticipates acquiring 34 miles of additional greenway trails and acquisition of approximately 250 additional acres at various locations throughout the City.
Mandate Title FY 2013 FY 2014 FY 2015 FY 2016 FY 2017CAPITAL IMPROVEMENTS OPERATIONS & MAINTENANCEAnimal Care Services Adoption Center 951,175 1,256,286Parks Linear Greenway 361,136 219,111 418,391 183,111 708,911Parks Acquisition and Development 299,830 13,197 181,892 6,598Public Safety Headquarters and PSAP 658,844Services Facility Capital Improvements 457,527 12,8742012 Bond Program Projects 5,625 2,205,325 1,419,702 2,003,558 430,684
Subtotal 2,734,137$ 3,706,793$ 1,838,093$ 2,368,561$ 1,146,193$ GRANT MATCH REQUIREMENTCOPS Grant Match-(19 Officers) 589,065 329,392 308,704 1,169,260 50,979Federal Stimulus- COPS Grant Match (50 Officers) 3,726,822 676,233
Subtotal 4,315,887$ 1,005,625$ 308,704$ 1,169,260$ 50,979$
Overall Mandate Total 7,050,024$ 4,712,418$ 2,146,797$ 3,537,821$ 1,197,172$
15
PARKS ACQUISITION AND DEVELOPMENT
This mandate provides for maintenance of new facilities and park components. During the forecast period (FY 2013 – FY 2017) the City anticipates acquiring 147 additional components in approximately 26 parks, with approximately 77 new park acres to maintain. Park components include fitness stations, playgrounds, sports fields, and walking trails.
PUBLIC SAFETY HEADQUARTERS AND PUBLIC SAFETY ANSWERING POINT
This mandate provides for the operational and maintenance costs for the new Public Safety Headquarters and Public Safety Answering Point facilities. The anticipated expenses are net of the current cost to maintain the Nueva Police Central Station and the Fire Headquarters located at Auditorium Circle. The Public Safety Answering Point opened in December 2011. The Public Safety Headquarters is anticipated to open by September 2012. Partial Funding was included in FY 2012 Budget.
2012 BOND PROGRAM PROJECTS
2012 BOND PROGRAM PROJECTS OPERATIONS & MAINTENANCE
This mandate provides for operations and maintenance of the 140 capital projects included in the 2012 Bond Program. During the forecast period (FY 2013 – FY 2017), the City will construct 41 Streets, Bridges & Sidewalks projects, 17 Drainage & Flood Control projects, 68 Parks, Recreation & Open Space projects, 11 Library, Museum & Cultural Arts projects, and three Public Safety Facilities projects.
GRANT MATCH REQUIREMENTS & COMMITMENTS
COPS GRANT MATCH-50 POLICE OFFICERS
As part of the American Recovery & Reinvestment Act of 2009, the City of San Antonio was awarded $10.4 million over a three year period for the hiring of 50 Police Officers. The grant award began in July 2009 Grants Funds are available thru January 2013. The FY 2010, FY 2011, and FY 2012 Budgets included funds to account for expenses not eligible under the grant award. The 50 Police Officers will be fully funded in FY 2014.
COMMUNITY ORIENTED POLICING SERVICE HIRING PROGRAM GRANT MATCH-19 POLICE OFFICERS
In May 2011, The City applied for funding for up to 25 Police Officers to the U.S. Department of Justice (DOJ), Office of Community Oriented Policing Services. The City amended its application in January 2013 as a result of new grant requirements. The City expects to receive notification regarding status of grant by mid to late summer. This mandate provides funding for the police officers associated costs that are not covered by the Grant. These costs include equipment, overtime, retiree’s prepaid insurance, Cleat insurance, and uniform leave buyback costs. The City would also be required to fund the full cost of these new police officer positions for at least 12 months once the grant funding ends.
16
ADDITIONAL EXPENDITURE REQUESTS
The following paragraphs provide brief descriptions of potential additional expenditures to the General Fund that are not currently planned within the current service levels. Some of these expenditures were included as one-time expenses in the FY 2012 Budget and are shown as budget scenarios for discussion and evaluation should the Mayor and City Council wish to continue these projects in FY 2013.
ECONOMIC DEVELOPMENT INCENTIVE FUND
In order to attract, expand, and retain businesses, create new jobs, and stimulate development and investment across the City, $4 million in additional expenditures could be added to the General Fund Budget to maintain the same level of funding as in FY 2012.
INNER CITY ECONOMIC DEVELOPMENT INCENTIVES
Funding for inner city economic development incentives in the amount of $3 million could be maintained in the FY 2013 Budget to provide incentives to businesses and encourage investment in the downtown areas of the City of San Antonio.
FUNDING FOR ANIMAL CARE SERVICES
Funding in the amount of approximately $900,000 to continue Animal Care Services initiatives in an effort to maintain the 70% live release goal is included in the policy issues section of the Forecast. These initiatives include funding for Animal Care Education Program Awareness, Funding for "High-Volume" Pet Placement Partners, and a Pet Licensing awareness campaign.
CIVILIAN COST OF LIVING ADJUSTMENT
This potential additional expenditure of $1.7 million in the General Fund shows the impact of every 1% of a cost of living adjustment for City of San Antonio civilian employees.
VIA STREET CAR PAYMENT
On October 20, 2011, City Council authorized City Staff to negotiate the an Interlocal Agreement with VIA Metropolitan Transit to commit whereby the City would commit to fund an amount not to exceed $40,000,000 for streetcar and transit improvements associated with the 2035 Long Range Comprehensive Transportation Plan developed by VIA. However, the commitment of funds is contingent upon VIA meeting certain conditions. The forecast shows the impact of debt payments associated with this potential additional expense.
LIBRARY DEFERRED MAINTENANCE
Funding for Library Deferred Maintenance in the amount of approximately $5.8 million could be included over the term of the Forecast (FY 2013 to FY 2017) to address maintenance items at Library Facilities.
17
FINANCIAL RESERVES FUNDS
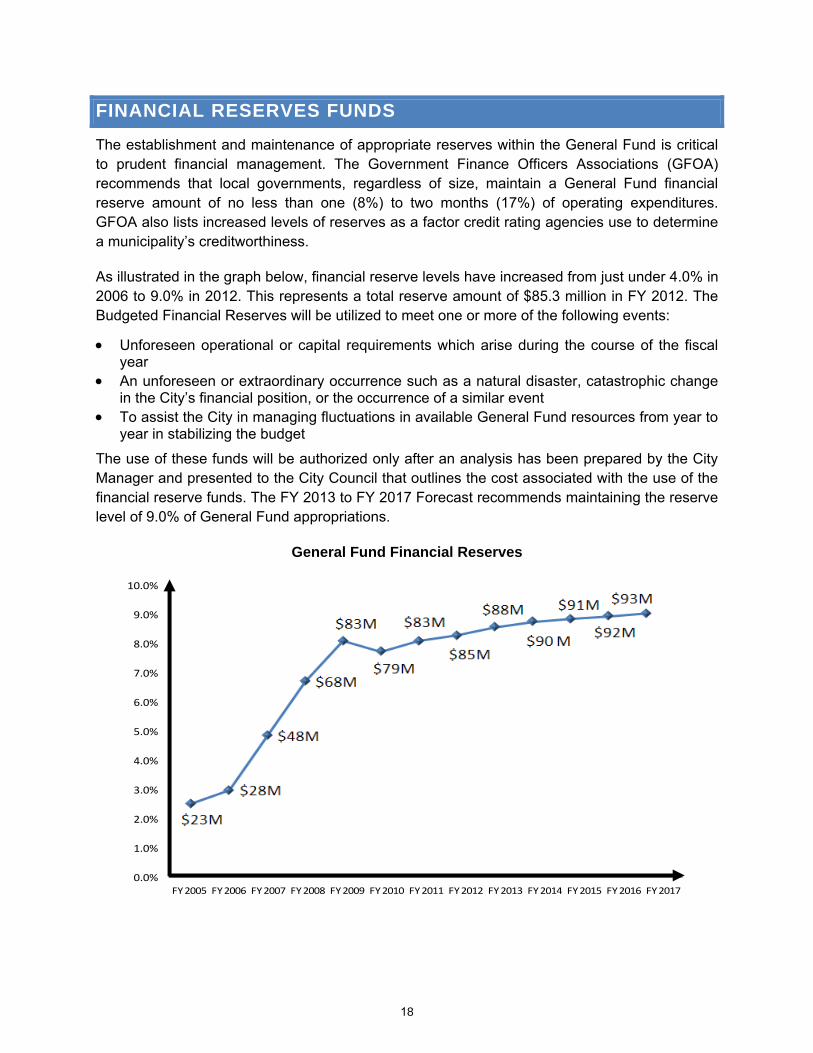
The establishment and maintenance of appropriate reserves within the General Fund is critical to prudent financial management. The Government Finance Officers Associations (GFOA) recommends that local governments, regardless of size, maintain a General Fund financial reserve amount of no less than one (8%) to two months (17%) of operating expenditures. GFOA also lists increased levels of reserves as a factor credit rating agencies use to determine a municipality’s creditworthiness.
As illustrated in the graph below, financial reserve levels have increased from just under 4.0% in 2006 to 9.0% in 2012. This represents a total reserve amount of $85.3 million in FY 2012. The Budgeted Financial Reserves will be utilized to meet one or more of the following events:
Unforeseen operational or capital requirements which arise during the course of the fiscal year
An unforeseen or extraordinary occurrence such as a natural disaster, catastrophic change in the City’s financial position, or the occurrence of a similar event
To assist the City in managing fluctuations in available General Fund resources from year to year in stabilizing the budget
The use of these funds will be authorized only after an analysis has been prepared by the City Manager and presented to the City Council that outlines the cost associated with the use of the financial reserve funds. The FY 2013 to FY 2017 Forecast recommends maintaining the reserve level of 9.0% of General Fund appropriations.
General Fund Financial Reserves
0.0%
1.0%
2.0%
3.0%
4.0%
5.0%
6.0%
7.0%
8.0%
9.0%
10.0%
FY 2005 FY 2006 FY 2007 FY 2008 FY 2009 FY 2010 FY 2011 FY 2012 FY 2013 FY 2014 FY 2015 FY 2016 FY 2017
18


SOLID WASTE OPERATING AND MAINTENANCE
FUND

SOLID WASTE OPERATING AND MAINTENANCE FUND
The Solid Waste Operating and Maintenance Fund records all revenues and expenditures for services provided by the Solid Waste Management Department (SWMD) and the Office of Environmental Policy (OEP).
SWMD is composed of four divisions: Solid Waste, Recycling, Brush, and Environmental Management. These divisions contribute to reaching the Department’s operational goals and the goals detailed in the 10-Year Recycling and Resource Recovery Plan.
10 Year Recycling and Resource Recovery Plan
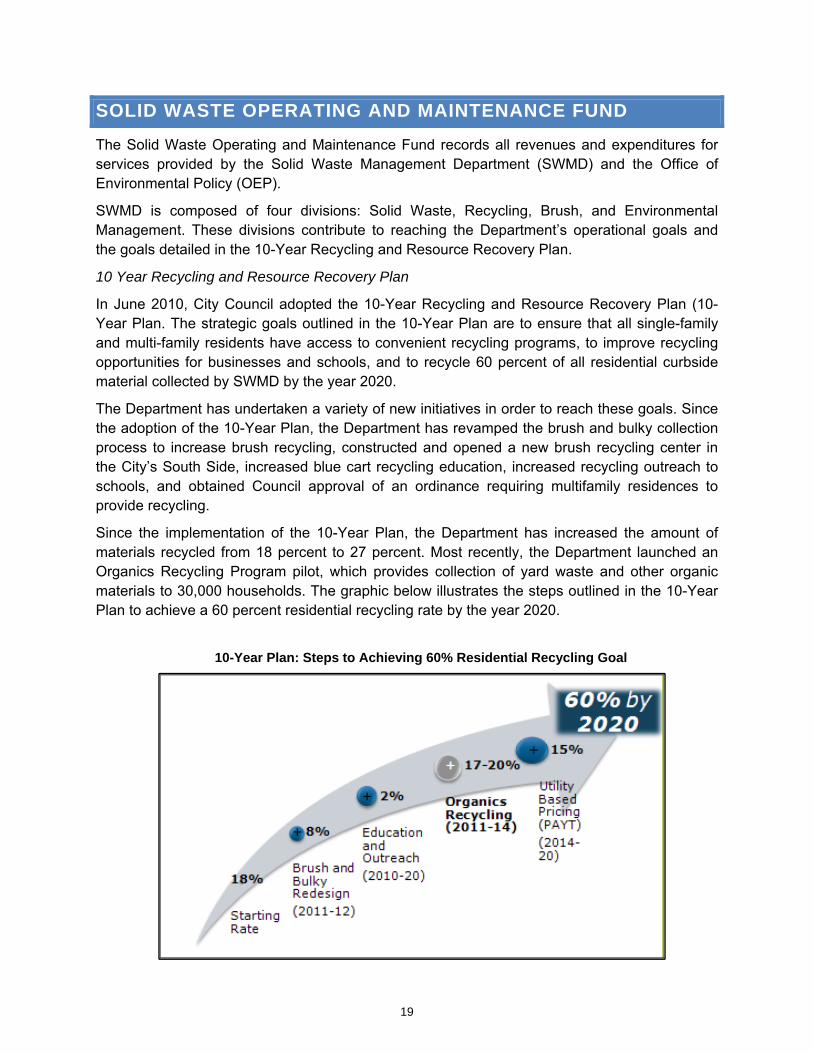
In June 2010, City Council adopted the 10-Year Recycling and Resource Recovery Plan (10-Year Plan. The strategic goals outlined in the 10-Year Plan are to ensure that all single-family and multi-family residents have access to convenient recycling programs, to improve recycling opportunities for businesses and schools, and to recycle 60 percent of all residential curbside material collected by SWMD by the year 2020.
The Department has undertaken a variety of new initiatives in order to reach these goals. Since the adoption of the 10-Year Plan, the Department has revamped the brush and bulky collection process to increase brush recycling, constructed and opened a new brush recycling center in the City’s South Side, increased blue cart recycling education, increased recycling outreach to schools, and obtained Council approval of an ordinance requiring multifamily residences to provide recycling.
Since the implementation of the 10-Year Plan, the Department has increased the amount of materials recycled from 18 percent to 27 percent. Most recently, the Department launched an Organics Recycling Program pilot, which provides collection of yard waste and other organic materials to 30,000 households. The graphic below illustrates the steps outlined in the 10-Year Plan to achieve a 60 percent residential recycling rate by the year 2020.
10-Year Plan: Steps to Achieving 60% Residential Recycling Goal
19
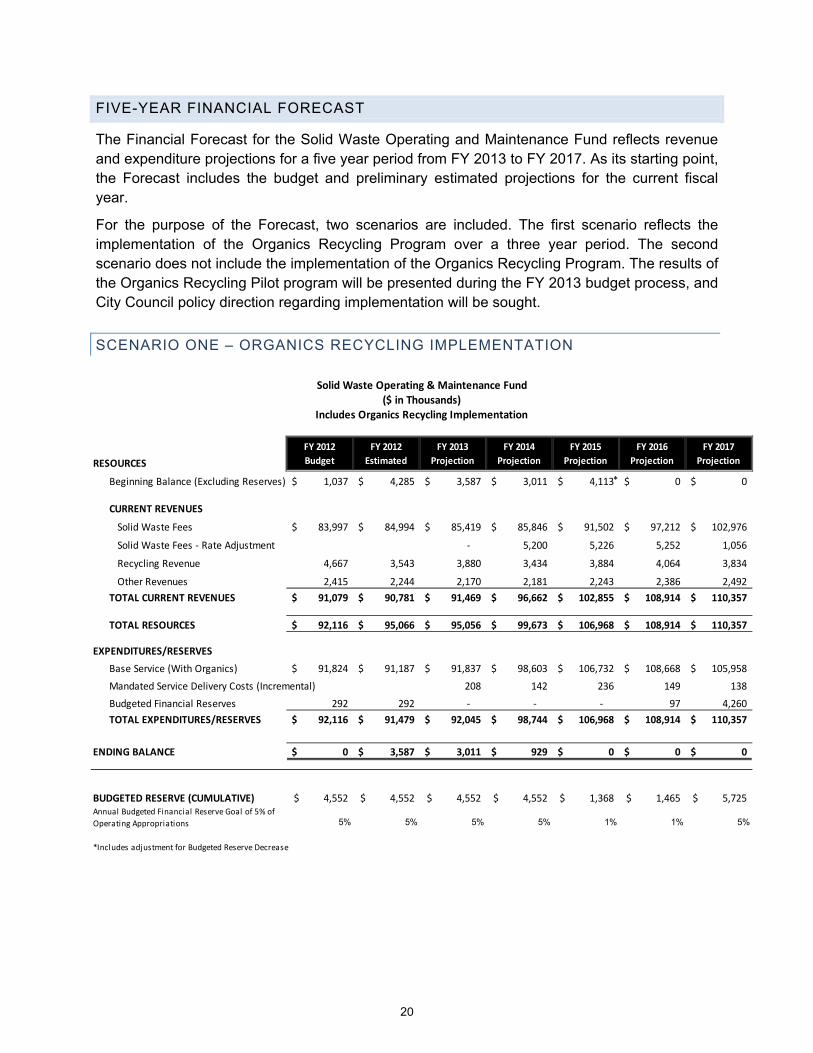
RESOURCES
Beginning Balance (Excluding Reserves) 1,037$ 4,285$ 3,587$ 3,011$ 4,113$ 0$ 0$
CURRENT REVENUES
Solid Waste Fees 83,997$ 84,994$ 85,419$ 85,846$ 91,502$ 97,212$ 102,976$
Solid Waste Fees ‐ Rate Adjustment ‐ 5,200 5,226 5,252 1,056
Recycling Revenue 4,667 3,543 3,880 3,434 3,884 4,064 3,834
Other Revenues 2,415 2,244 2,170 2,181 2,243 2,386 2,492
TOTAL CURRENT REVENUES 91,079$ 90,781$ 91,469$ 96,662$ 102,855$ 108,914$ 110,357$
TOTAL RESOURCES 92,116$ 95,066$ 95,056$ 99,673$ 106,968$ 108,914$ 110,357$
EXPENDITURES/RESERVES
Base Service (With Organics) 91,824$ 91,187$ 91,837$ 98,603$ 106,732$ 108,668$ 105,958$
Mandated Service Delivery Costs (Incremental) 208 142 236 149 138
Budgeted Financial Reserves 292 292 ‐ ‐ ‐ 97 4,260
TOTAL EXPENDITURES/RESERVES 92,116$ 91,479$ 92,045$ 98,744$ 106,968$ 108,914$ 110,357$
ENDING BALANCE 0$ 3,587$ 3,011$ 929$ 0$ 0$ 0$
BUDGETED RESERVE (CUMULATIVE) 4,552$ 4,552$ 4,552$ 4,552$ 1,368$ 1,465$ 5,725$
5% 5% 5% 5% 1% 1% 5%
*Includes adjustment for Budgeted Reserve Decrease
Annual Budgeted Financial Reserve Goal of 5% of
Operating Appropriations
Solid Waste Operating & Maintenance Fund($ in Thousands)
Includes Organics Recycling Implementation
FY 2012
Budget
FY 2012
Estimated
FY 2013
Projection
FY 2014
Projection
FY 2015
Projection
FY 2016
Projection
FY 2017
Projection
*
FIVE-YEAR FINANCIAL FORECAST
The Financial Forecast for the Solid Waste Operating and Maintenance Fund reflects revenue and expenditure projections for a five year period from FY 2013 to FY 2017. As its starting point, the Forecast includes the budget and preliminary estimated projections for the current fiscal year.
For the purpose of the Forecast, two scenarios are included. The first scenario reflects the implementation of the Organics Recycling Program over a three year period. The second scenario does not include the implementation of the Organics Recycling Program. The results of the Organics Recycling Pilot program will be presented during the FY 2013 budget process, and City Council policy direction regarding implementation will be sought.
SCENARIO ONE – ORGANICS RECYCLING IMPLEMENTATION
20

RESOURCES
Beginning Balance (Excluding Reserves) 1,037$ 4,285$ 3,587$ 0$ 0$ 0$ 0$
CURRENT REVENUES
Solid Waste Fees 83,997$ 84,994$ 85,419$ 85,846$ 87,321$ 88,808$ 90,308$
Solid Waste Fees ‐ Rate Adjustment ‐ 1,040 1,045 1,050 1,056
Recycling Revenue 4,667 3,543 3,880 3,434 3,884 4,064 3,834
Other Revenues 2,415 2,244 2,170 2,181 2,243 2,386 2,492
TOTAL CURRENT REVENUES 91,079$ 90,781$ 91,469$ 92,502$ 94,493$ 96,308$ 97,689$
TOTAL RESOURCES 92,116$ 95,066$ 95,056$ 92,502$ 94,493$ 96,308$ 97,689$
EXPENDITURES/RESERVES
Base Service (Without Organics) 91,824$ 91,187$ 90,079$ 89,530$ 90,910$ 90,684$ 90,045$
Mandated Service Delivery Costs (Incremental) 208 142 236 149 138
Budgeted Financial Reserves 292 292 ‐ ‐ ‐ ‐ ‐
Reserve for Cart Replacement ‐ ‐ 4,770 2,830 3,347 5,476 7,506
TOTAL EXPENDITURES/RESERVES 92,116$ 91,479$ 95,056$ 92,502$ 94,493$ 96,308$ 97,689$
ENDING BALANCE 0$ 3,587$ 0$ 0$ 0$ 0$ 0$
BUDGETED RESERVE SUMMARY (CUMULATIVE)
Reserve for Cart Replacement 4,770$ 7,600$ 10,947$ 16,423$ 23,928$
Budgeted Operating Financial Reserve 4,552$ 4,552$ 4,552$ 4,552$ 4,552$ 4,552$ 4,552$
5% 5% 5% 5% 5% 5% 5%Annual Budgeted Financial Reserve Goal of 5%
of Operating Appropriations
Solid Waste Operating & Maintenance Fund($ in Thousands)
No Organics Recycling Implementation
FY 2012
Budget
FY 2012
Estimated
FY 2013
Projection
FY 2014
Projection
FY 2015
Projection
FY 2016
Projection
FY 2017
Projection
SCENARIO TWO – NO ORGANICS RECYCLING IMPLEMENTATION
REVENUES
MONTHLY SOLID WASTE FEES
The primary sources of revenue for the Solid Waste Operating and Maintenance Fund are the monthly Solid Waste fees assessed to customers and billed by CPS Energy. The Solid Waste Processing Fee is assessed to each single-family residential household in the City for municipal waste collection services. The Environmental Fee is charged to all residential customers and commercial entities. Forecasted revenues are based on an annual growth factor of 0.5% in the number of homes from FY 2013 through FY 2017, along with any estimated rate increases.
21
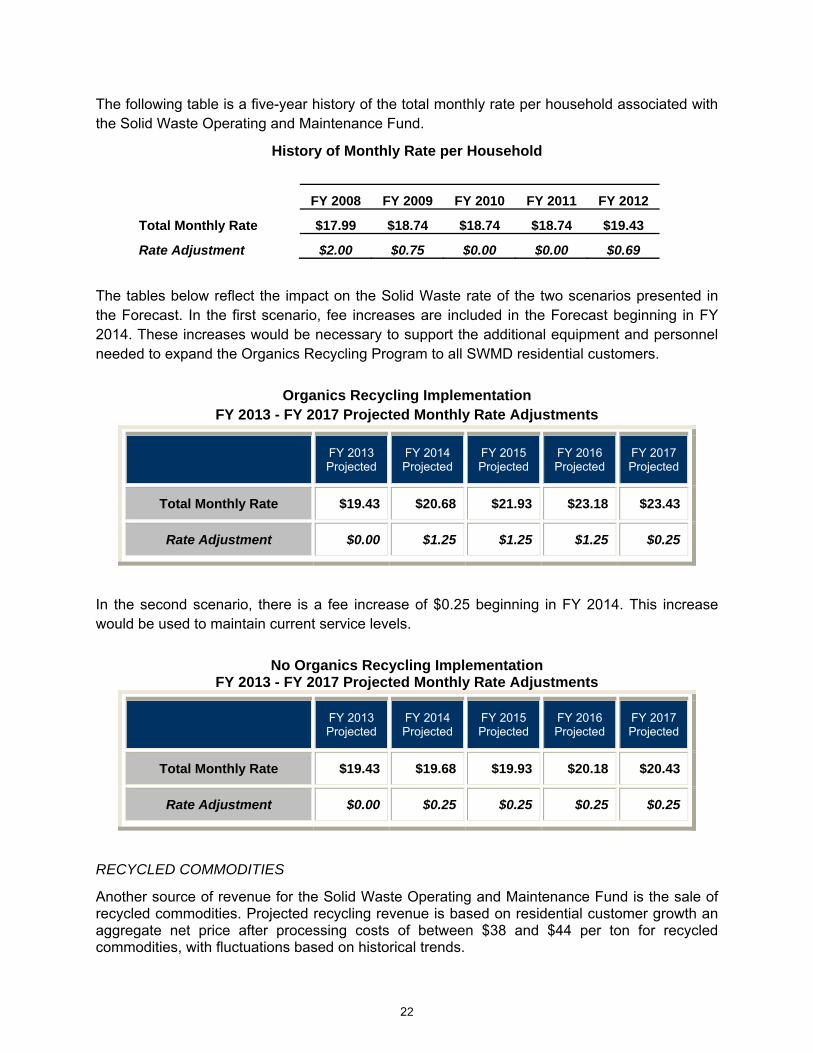
The following table is a five-year history of the total monthly rate per household associated with the Solid Waste Operating and Maintenance Fund.
History of Monthly Rate per Household
FY 2008 FY 2009 FY 2010 FY 2011 FY 2012
Total Monthly Rate $17.99 $18.74 $18.74 $18.74 $19.43
Rate Adjustment $2.00 $0.75 $0.00 $0.00 $0.69
The tables below reflect the impact on the Solid Waste rate of the two scenarios presented in the Forecast. In the first scenario, fee increases are included in the Forecast beginning in FY 2014. These increases would be necessary to support the additional equipment and personnel needed to expand the Organics Recycling Program to all SWMD residential customers.
Organics Recycling Implementation FY 2013 - FY 2017 Projected Monthly Rate Adjustments
FY 2013 Projected
FY 2014 Projected
FY 2015 Projected
FY 2016 Projected
FY 2017 Projected
Total Monthly Rate $19.43 $20.68 $21.93 $23.18 $23.43
Rate Adjustment $0.00 $1.25 $1.25 $1.25 $0.25
In the second scenario, there is a fee increase of $0.25 beginning in FY 2014. This increase would be used to maintain current service levels.
No Organics Recycling Implementation FY 2013 - FY 2017 Projected Monthly Rate Adjustments
FY 2013 Projected
FY 2014 Projected
FY 2015 Projected
FY 2016 Projected
FY 2017 Projected
Total Monthly Rate $19.43 $19.68 $19.93 $20.18 $20.43
Rate Adjustment $0.00 $0.25 $0.25 $0.25 $0.25
RECYCLED COMMODITIES
Another source of revenue for the Solid Waste Operating and Maintenance Fund is the sale of recycled commodities. Projected recycling revenue is based on residential customer growth an aggregate net price after processing costs of between $38 and $44 per ton for recycled commodities, with fluctuations based on historical trends.
22
EXPENDITURES
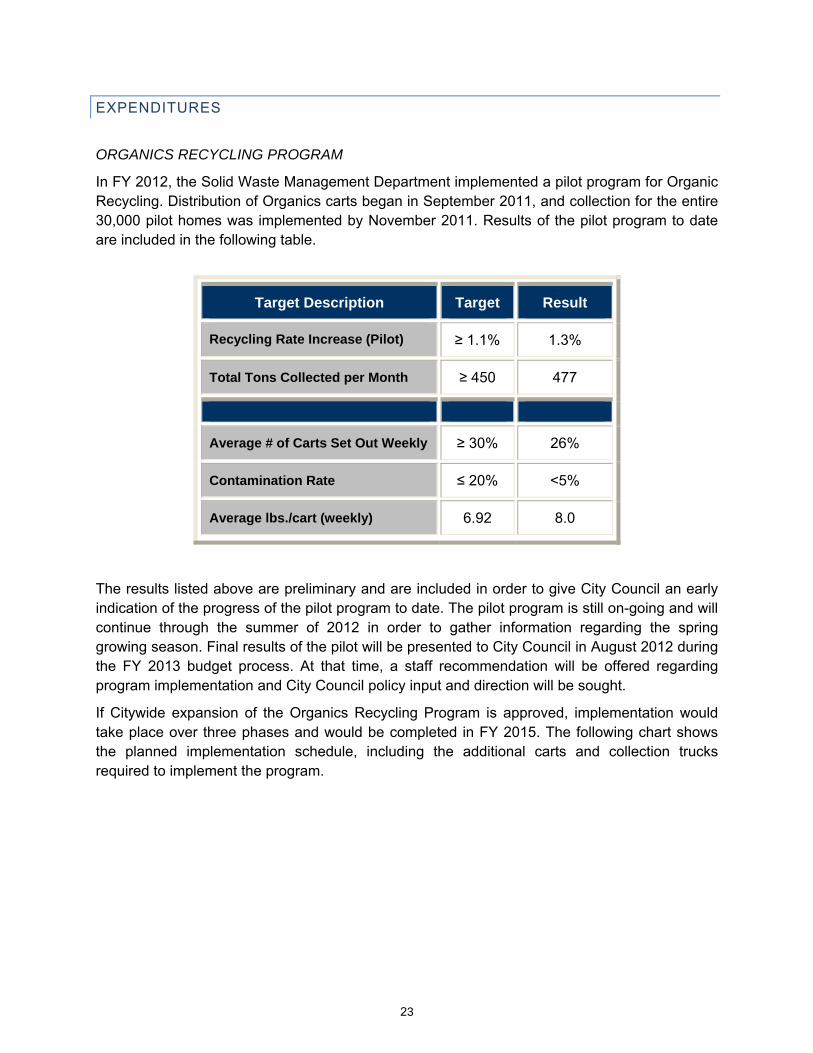
ORGANICS RECYCLING PROGRAM
In FY 2012, the Solid Waste Management Department implemented a pilot program for Organic Recycling. Distribution of Organics carts began in September 2011, and collection for the entire 30,000 pilot homes was implemented by November 2011. Results of the pilot program to date are included in the following table.
Target Description Target Result
Recycling Rate Increase (Pilot) ≥ 1.1% 1.3%
Total Tons Collected per Month ≥ 450 477
Average # of Carts Set Out Weekly ≥ 30% 26%
Contamination Rate ≤ 20% <5%
Average lbs./cart (weekly) 6.92 8.0
The results listed above are preliminary and are included in order to give City Council an early indication of the progress of the pilot program to date. The pilot program is still on-going and will continue through the summer of 2012 in order to gather information regarding the spring growing season. Final results of the pilot will be presented to City Council in August 2012 during the FY 2013 budget process. At that time, a staff recommendation will be offered regarding program implementation and City Council policy input and direction will be sought.
If Citywide expansion of the Organics Recycling Program is approved, implementation would take place over three phases and would be completed in FY 2015. The following chart shows the planned implementation schedule, including the additional carts and collection trucks required to implement the program.
23
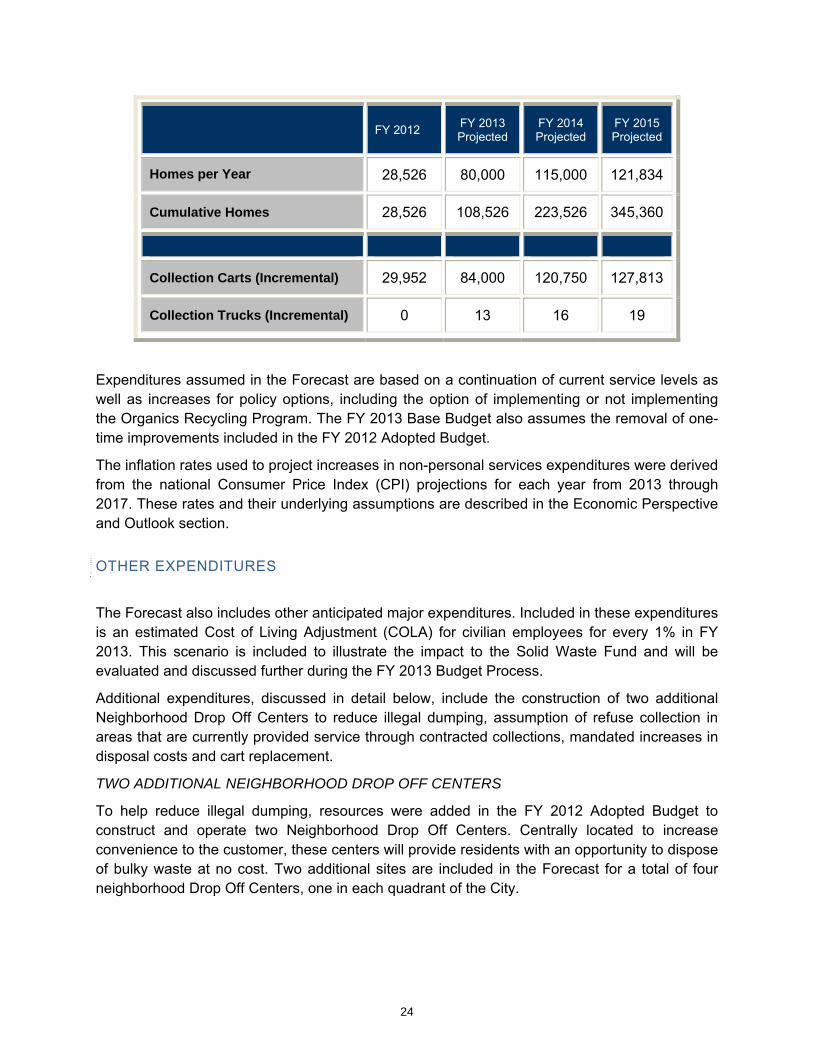
FY 2012 FY 2013 Projected
FY 2014 Projected
FY 2015 Projected
Homes per Year 28,526 80,000 115,000 121,834
Cumulative Homes 28,526 108,526 223,526 345,360
Collection Carts (Incremental) 29,952 84,000 120,750 127,813
Collection Trucks (Incremental) 0 13 16 19
Expenditures assumed in the Forecast are based on a continuation of current service levels as well as increases for policy options, including the option of implementing or not implementing the Organics Recycling Program. The FY 2013 Base Budget also assumes the removal of one-time improvements included in the FY 2012 Adopted Budget.
The inflation rates used to project increases in non-personal services expenditures were derived from the national Consumer Price Index (CPI) projections for each year from 2013 through 2017. These rates and their underlying assumptions are described in the Economic Perspective and Outlook section.
OTHER EXPENDITURES
The Forecast also includes other anticipated major expenditures. Included in these expenditures is an estimated Cost of Living Adjustment (COLA) for civilian employees for every 1% in FY 2013. This scenario is included to illustrate the impact to the Solid Waste Fund and will be evaluated and discussed further during the FY 2013 Budget Process.
Additional expenditures, discussed in detail below, include the construction of two additional Neighborhood Drop Off Centers to reduce illegal dumping, assumption of refuse collection in areas that are currently provided service through contracted collections, mandated increases in disposal costs and cart replacement.
TWO ADDITIONAL NEIGHBORHOOD DROP OFF CENTERS
To help reduce illegal dumping, resources were added in the FY 2012 Adopted Budget to construct and operate two Neighborhood Drop Off Centers. Centrally located to increase convenience to the customer, these centers will provide residents with an opportunity to dispose of bulky waste at no cost. Two additional sites are included in the Forecast for a total of four neighborhood Drop Off Centers, one in each quadrant of the City.
24
For the two additional centers, SWMD would purchase 16 roll off containers and 3 roll off trucks and hire nine new positions. Also included for each center is funding for property acquisition and facility construction. PRIVATE SECTOR CONTRACTED COLLECTIONS
SWMD contracts with Allied Waste, Inc. (AWI), a private sector waste collection company, to provide collection services for approximately 10,500 residents in the areas of Heritage Northwest and Longs Creek. This contract expires in December 2012. At that time, collection services to these households will be resumed by SWMD. It will be less expensive for SWMD to provide collection as compared to a contract with a private collection company.
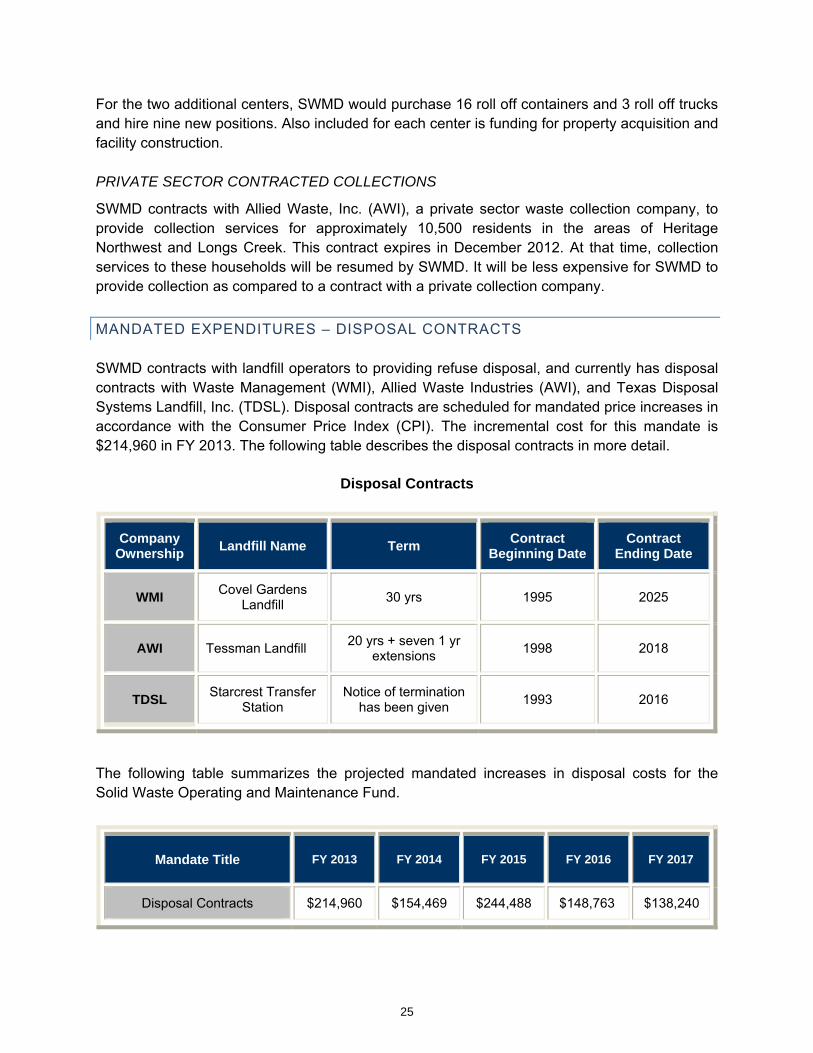
MANDATED EXPENDITURES – DISPOSAL CONTRACTS
SWMD contracts with landfill operators to providing refuse disposal, and currently has disposal contracts with Waste Management (WMI), Allied Waste Industries (AWI), and Texas Disposal Systems Landfill, Inc. (TDSL). Disposal contracts are scheduled for mandated price increases in accordance with the Consumer Price Index (CPI). The incremental cost for this mandate is $214,960 in FY 2013. The following table describes the disposal contracts in more detail.
Disposal Contracts
Company Ownership
Landfill Name Term Contract
Beginning Date Contract
Ending Date
WMI Covel Gardens
Landfill 30 yrs 1995 2025
AWI Tessman Landfill 20 yrs + seven 1 yr
extensions 1998 2018
TDSL Starcrest Transfer
Station Notice of termination
has been given 1993 2016
Company
The following table summarizes the projected mandated increases in disposal costs for the Solid Waste Operating and Maintenance Fund.
Mandate Title FY 2013 FY 2014 FY 2015 FY 2016 FY 2017
Disposal Contracts $214,960 $154,469 $244,488 $148,763 $138,240
25


ECOMONIC OUTLOOK &
PERSPECTIVE

ECONOMIC OUTLOOK
OVERVIEW
A forecast of the City’s finances recognizes that the City’s fiscal health is directly linked to the success of the local, national, and global economies. In light of this relationship, the fiscal projections provided in this document are based, in large part, upon an analysis of historical and current economic trends. The historical data and forecast projections are provided by government and private organizations. This section provides projections for the local and national economies, which support the fiscal projections presented in this document.
INFLATION
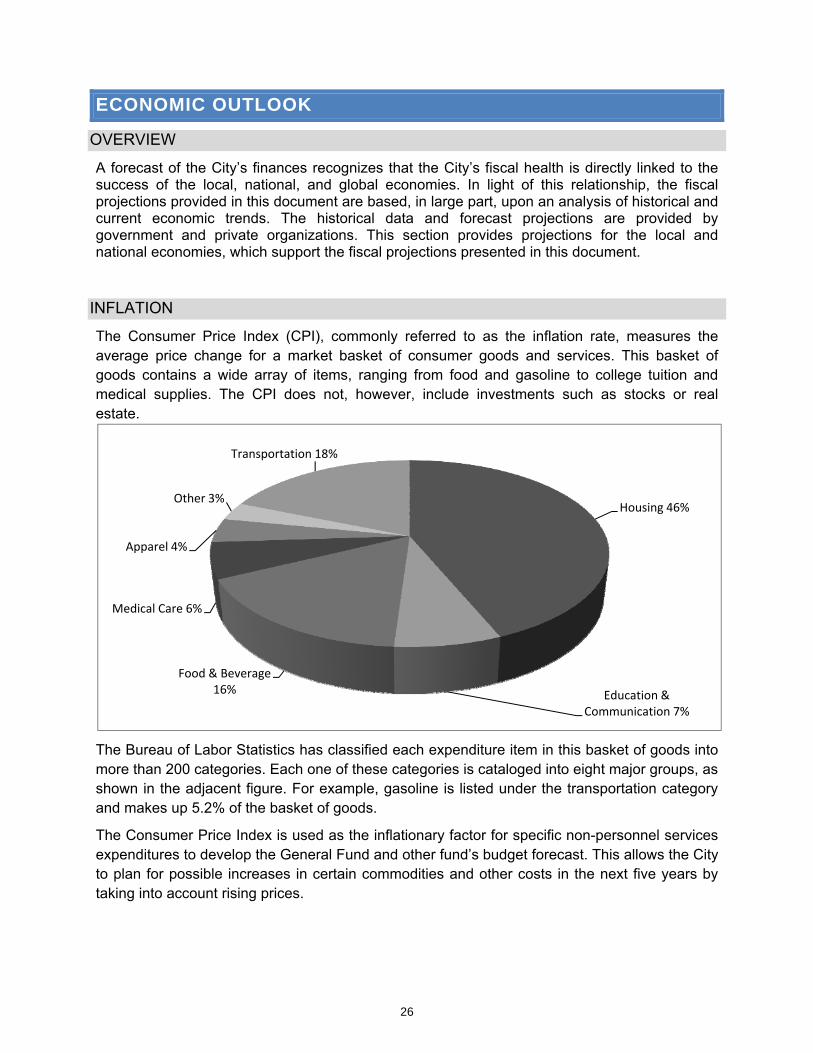
The Consumer Price Index (CPI), commonly referred to as the inflation rate, measures the average price change for a market basket of consumer goods and services. This basket of goods contains a wide array of items, ranging from food and gasoline to college tuition and medical supplies. The CPI does not, however, include investments such as stocks or real estate.
The Bureau of Labor Statistics has classified each expenditure item in this basket of goods into more than 200 categories. Each one of these categories is cataloged into eight major groups, as shown in the adjacent figure. For example, gasoline is listed under the transportation category and makes up 5.2% of the basket of goods.
The Consumer Price Index is used as the inflationary factor for specific non-personnel services expenditures to develop the General Fund and other fund’s budget forecast. This allows the City to plan for possible increases in certain commodities and other costs in the next five years by taking into account rising prices.
Housing 46%
Education & Communication 7%
Food & Beverage 16%
Medical Care 6%
Apparel 4%
Other 3%
Transportation 18%
26

Additionally, CPI also serves as a cost of living index. With assistance from Moody’s Financial Services the projections for CPI have been developed and modified to reflect the City’s budget cycle based on a fiscal year from October 1 to September 30.
Source: Actual and Projection Data from Moody’s Economy.com
SAN ANTONIO ECONOMY
EMPLOYMENT
Increases in the total number of employed in a particular region can be attributed to either job creation from within the area or the migration of jobs to the region. The figure below provides historical and projected data on San Antonio’s employment growth rate.
3.79%
‐3.51%
1.23%
2.68% 2.68% 2.47% 2.80% 3.11% 2.70% 2.51%
‐4.00%
‐3.00%
‐2.00%
‐1.00%
0.00%
1.00%
2.00%
3.00%
4.00%
FY 2008 FY 2009 FY 2010 FY 2011 FY 2012 FY 2013 FY 2014 FY 2015 FY 2016 FY 2017
San Antonio Consumer Price Index % ChangeActual Through FY 2011/Forecasted FY 2012 ‐ 2017
0.4%
‐1.7%
1.3%0.6%
1.4%
2.1%
3.5% 3.4%
3.8% 3.9%
‐3.0%
‐2.0%
‐1.0%
0.0%
1.0%
2.0%
3.0%
4.0%
5.0%
2008 2009 2010 2011 2012 2013 2014 2015 2016 2017
27
UNEMPLOYMENT
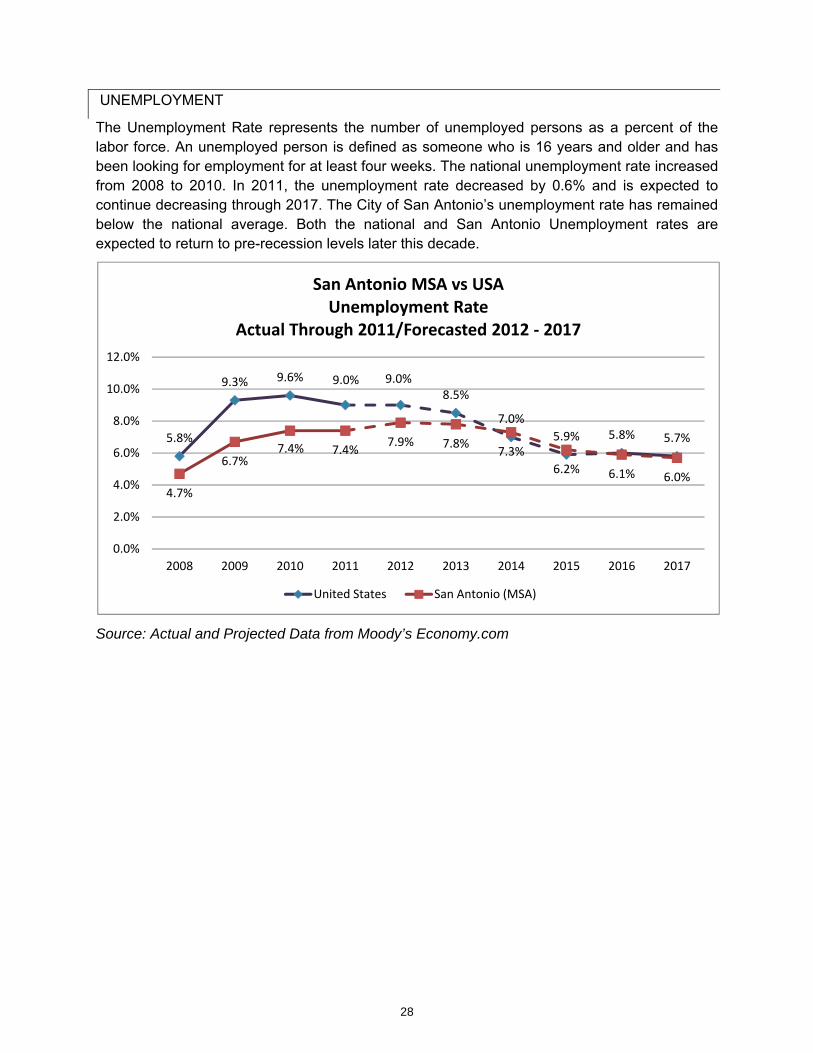
The Unemployment Rate represents the number of unemployed persons as a percent of the labor force. An unemployed person is defined as someone who is 16 years and older and has been looking for employment for at least four weeks. The national unemployment rate increased from 2008 to 2010. In 2011, the unemployment rate decreased by 0.6% and is expected to continue decreasing through 2017. The City of San Antonio’s unemployment rate has remained below the national average. Both the national and San Antonio Unemployment rates are expected to return to pre-recession levels later this decade.
Source: Actual and Projected Data from Moody’s Economy.com
5.8%
9.3% 9.6% 9.0% 9.0%8.5%
7.0%
5.9% 5.8% 5.7%
4.7%
6.7%7.4% 7.4%
7.9% 7.8%7.3%
6.2% 6.1% 6.0%
0.0%
2.0%
4.0%
6.0%
8.0%
10.0%
12.0%
2008 2009 2010 2011 2012 2013 2014 2015 2016 2017
San Antonio MSA vs USAUnemployment Rate
Actual Through 2011/Forecasted 2012 ‐ 2017
United States San Antonio (MSA)
28

HOUSING
The Housing Market in San Antonio is beginning to recover, but is still adversely impacted by the national housing market and overall economy.
Source: Real Estate Center at Texas A&M University
Months in Inventory measures the amount of time it would take to sell the current housing inventory or supply if no other homes were added to the current inventory. The San Antonio housing market saw this number increase steadily between 2007 and 2009, but it has decreased since 2010. The current average is 6.7 months in inventory, compared to 7.9 last year, and 8.0 in 2010.
Source: Real Estate Center at Texas A&M University
1,614 1,560 1,536 1,537
1,323
‐
500
1,000
1,500
2,000
2008 2009 2010 2011 *2012
Average Monthly Home Sales *2012 (Jan ‐Mar)
7.4
8.1 8.0 7.9
6.7
0.0
1.0
2.0
3.0
4.0
5.0
6.0
7.0
8.0
9.0
2008 2009 2010 2011 *2012
Months in Inventory*2012 (Jan ‐Mar)
29
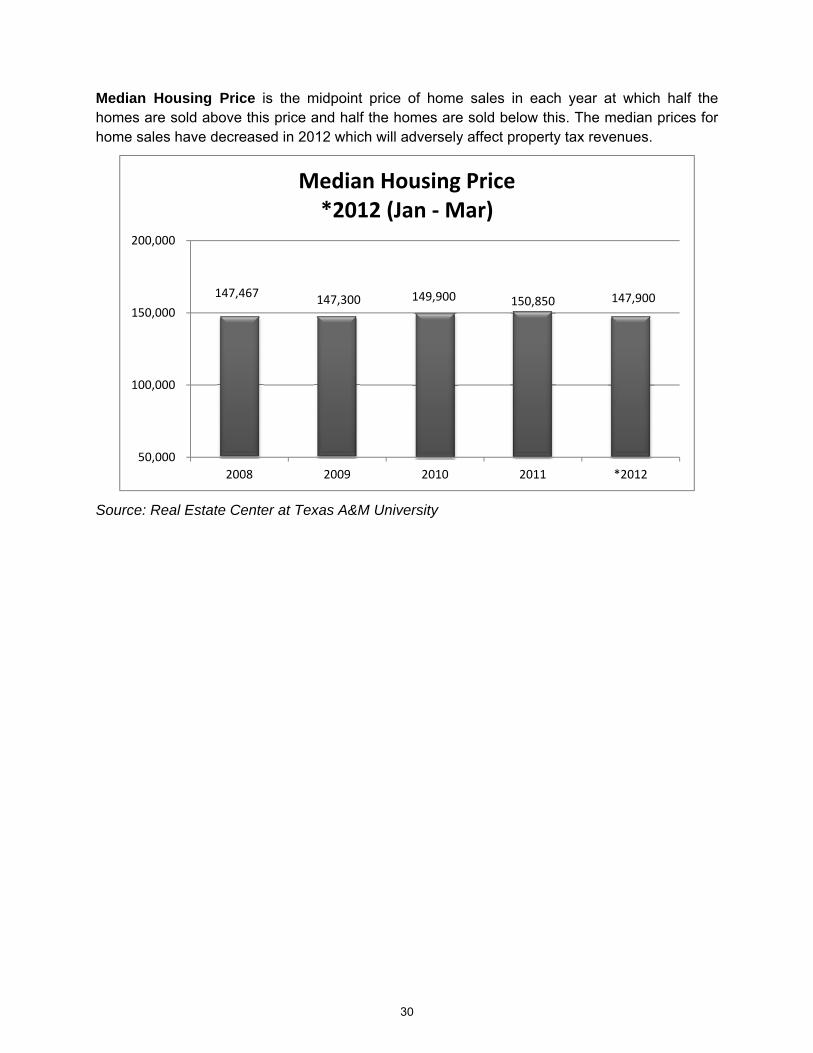
Median Housing Price is the midpoint price of home sales in each year at which half the homes are sold above this price and half the homes are sold below this. The median prices for home sales have decreased in 2012 which will adversely affect property tax revenues.
Source: Real Estate Center at Texas A&M University
147,467 147,300 149,900 150,850 147,900
50,000
100,000
150,000
200,000
2008 2009 2010 2011 *2012
Median Housing Price*2012 (Jan ‐Mar)
30

HOSPITALITY INDUSTRY
Despite national economic challenges, the San Antonio hospitality industry continues to be one of the top leisure/convention cities in the country and benefits from visitors within driving distance from Dallas, Houston, and other Texas cities. During 2011, hotel room demand increased 5.1% and hotel room revenue increased 4.3% compared to 2010. This was a result of a continued increase in new hotel openings and a 2.0% decrease in average daily rate.
Hotel Room Demand (City Level)
(In Millions)
Source: Data obtained from Smith Travel Research based on hotels in San Antonio Market reports dated March 2007, February 2009, January 2011, and February 2012.
Average Daily Room Rate (ADR) is the average price of a room night in San Antonio. ADR is indicative of the hospitality industry’s health, and is also adversely affected by the supply of hotel rooms, which has been increasing in San Antonio over the last five years.
Average Daily Room Rate (City Level)
Source: Data obtained from Smith Travel Research based on hotels in San Antonio Market reports dated March 2007, February 2009, January 2011, and February 2012.
6.50
7.00
7.50
8.00
8.50
2007 2008 2009 2010 2011
7.57.7
7.2
7.8
8.2
$‐
$20.00
$40.00
$60.00
$80.00
$100.00
$120.00
2007 2008 2009 2010 2011
$105.00 $109.30
$102.82 $95.77 $94.45
31
ENPLANEMENTS
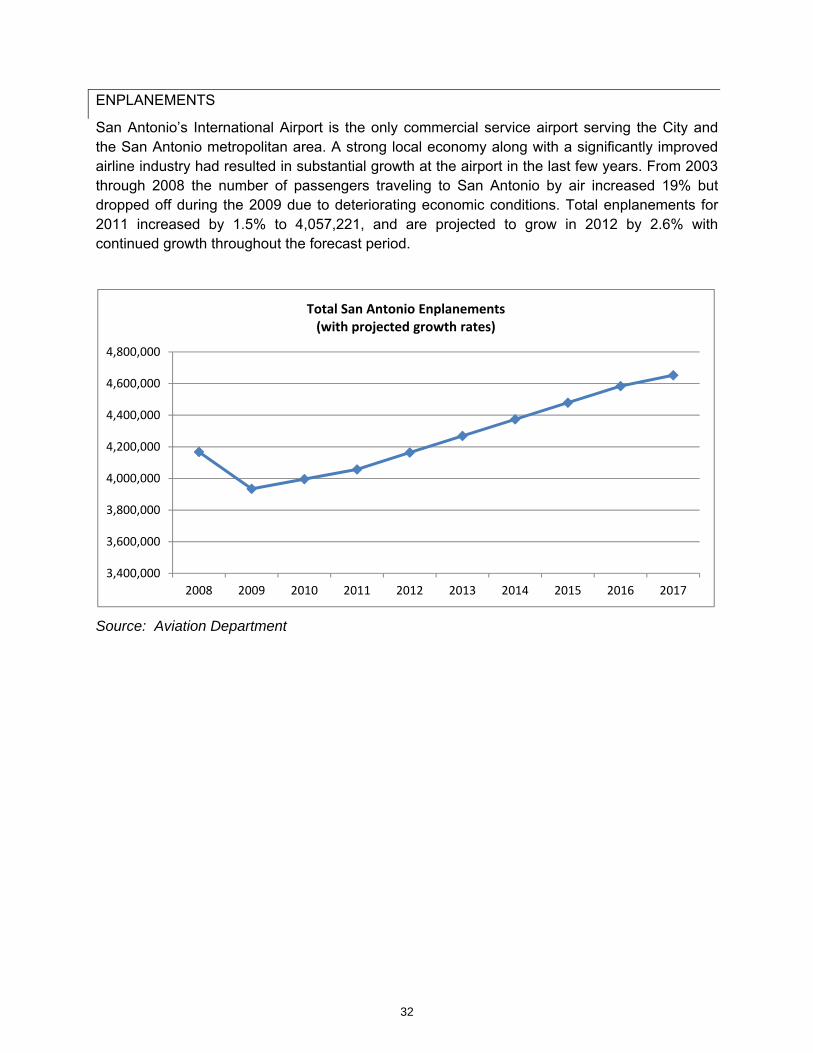
San Antonio’s International Airport is the only commercial service airport serving the City and the San Antonio metropolitan area. A strong local economy along with a significantly improved airline industry had resulted in substantial growth at the airport in the last few years. From 2003 through 2008 the number of passengers traveling to San Antonio by air increased 19% but dropped off during the 2009 due to deteriorating economic conditions. Total enplanements for 2011 increased by 1.5% to 4,057,221, and are projected to grow in 2012 by 2.6% with continued growth throughout the forecast period.
Source: Aviation Department
3,400,000
3,600,000
3,800,000
4,000,000
4,200,000
4,400,000
4,600,000
4,800,000
2008 2009 2010 2011 2012 2013 2014 2015 2016 2017
Total San Antonio Enplanements(with projected growth rates)
32