fisheries local action group local development strategy … · the development of this local...
TRANSCRIPT

Fisheries Local Action Group
Local Development Strategy 2016

This an edited version of the full FLAG South West Local Development Strategy produced to inform potential project applicants of the themes and priorities contained therein. The full text of all FLAG strategies and their appendices may be found on www.bim.ie. E & O E.
The development of this Local Development Strategy by FLAG South West was facilitated through the provision of preparatory support as part of Ireland’s European Maritime and Fisheries Fund Operational Programme 2014-2020, co-funded by the Exchequer and European Union. This Strategy was 100% funded under that Programme. This Strategy covers the period of the Programme and is intended to guide FLAG South West in prioritising, selecting and supporting projects with EMFF funds in its FLAG territory.

Table of Contents
1 THE DEFINITION OF THE STRATEGY AREA 2
1.1 Introduction 2
1.2 Description of the FLAG Area 2
1.3 Confirmation of Compliance of FLAG Area 4
1.4 Coherent Sub-Areas 4
2 ANALYSIS OF THE DEVELOPMENT NEEDS 5
2.1 Introduction 5
2.2 Summary of Socio-Economic Review 5
2.3 Summary – Infographic 7
2.4 Overview of the Consultation Process 9
2.5 Feedback from Consultation 10
2.6 Summary 19
3 STRATEGY AND OBJECTIVES 20
3.1 Introduction 20
3.2 Consistency with the Overarching Strategy set out in the Operational Programme 20
3.3 Level of Change Required 20
3.4 Prioritisation of Identified Areas of Activity 20
3.5 Intervention Logic of the FLAG South West Strategy 22
4 COMMUNITY INVOLVEMENT IN THE DEVELOPMENT OF THE STRATEGY 32
4.1 Introduction 32
4.2 Overview of Public Consultation Events 32
4.3 Categories of Stakeholders 33
5 ACTION PLAN 34
5.1 Introduction 34
6 FINANCIAL PLAN 37
6.1 Total budget 37
6.2 Rationale for Spend 37
6.3 Allocation of total budget between Project and Administration Spend 37
6.4 Project Spend by Theme, Objective and Year 38
6.5 Administration Spend 40
6.6 Mobilisation of Other Resources 41
7 THE FISHERIES LOCAL ACTION GROUP 43
7.1 Organisation Details 43
7.2 FLAG Composition and Decision Making 43

2 | FLAG SOUTH WEST FISHERIES LOCAL ACTION GROUP
1 The Definition of the Strategy Area
1.1 IntroductionThis section describes the FLAG area and sets out confirmation that the FLAG area meets the criteria set out in the European Maritime Fisheries Fund 2014 – 2020 (Section 5.1.2).
1.2 Description of the FLAG AreaThe FLAG South West area comprises the coastal zones of County Kerry and County Limerick. In order to provide a snapshot of the nature of this area the 85 District Electoral Divisions have been used to provide aggregate statistics. The area of operation will typically be the 10 km coastal strip however should projects further inland positively impact the coastal strip they will be considered on a case by case basis.
The FLAG region has a relatively weak urban structure with just 10 settlements falling into the aggregate urban area category of over 1,500 inhabitants, however, there are many smaller settlements in the region. County Kerry is one of the most sparsely populated counties in Ireland with the most rural and peripheral areas in the county experiencing declining populations over the last 20 years. The coastal regions of Kerry have experienced a contraction in populations.
The scale and distribution of fishing and aquaculture dependent businesses along the coast of Kerry and along the Shannon estuary has led to the area being chosen. The fishery and aquaculture activity that authenticates that dependence is described in detail below. The area also coincides with local governance and development infrastructure, allowing greater synergies to be achieved without creating structures too unwieldy to function at the scale appropriate for the communities of fisheries and aquaculture dependent areas. According to the national fleet register in May 2016 the fleet in this area represents approximately 258 vessels included in the polyvalent general, specific, aquaculture and potting sectors. Only twelve of these vessels are over 18m, three of which are aquaculture vessels. There are a further forty vessels, between 12 and 18 meters, while 222 or 86% of vessels are under 12m showing the dependence of Kerry’s coastal communities on inshore fishing. The majority of the inshore vessels are distributed across the smaller harbours and piers in the region prosecuting a variety of fish and shellfish species by a range of gear types as described later. Living in coastal areas requires a high degree of adaptability to survive economically, therefore even a part time job may “keep the lights on” in a small coastal community as it allows individuals to be survive the inherent cash flow problems that those, dependent on maritime resources/ primary production, experience. An estimate of employment from the fishing sector not including aquaculture in Kerry is 207 jobs. The BIM Annual Aquaculture Survey published in 2016 puts employment from aquaculture at 361 which is circa 20% of the national employment figure for aquaculture which is significant both at local and national level. There are 40 production units across native oysters Gigas oyster, Rope Mussel and Seabed mussel, salmon, scallop and seaweed with a total volume of 3,694 tonnes and a value of €5.6 million. There are an estimated 16 processing companies in Kerry though clearly much of the raw product is sold before any form of processing occurs. Nonetheless the processing industry counts for 310 jobs. There is no account of ancillary jobs in boat building (3 in the region), Gear supply and construction, engineering, maintenance and transport services.
The proposed FLAG SW region is home to areas of local and international significance in terms of biodiversity. Within county Kerry and that of county Limerick’s Shannon Estuary there are 23 Special Areas of Conservation (within the FLAG region) and 10 Special Protection Areas (within the FLAG region). Kerry also has eight Natural Heritage Areas (NHAs) designated to protect ecologically important habitats and a collection of 6 Nature Reserves allocated the purpose of conservation. Within the FLAG South West area, the marine NHAs include the Skelligs. All leisure and commercial activities proceed, or not, based on protection afforded by these designations.

LOCAL DEVELOPMENT STRATEGY 2016 | 3
The FLAG SW region has 3 very large ports with diverse economic activities; Dingle Fishery Harbour Centre, Fenit Harbour and Foynes. Furthermore, the Shannon Foynes Port Company operates Ireland’s second largest port facility in the Shannon estuary. Three of its six terminals fall within the FLAG area, at Tarbert in Kerry and at Foynes and Aughinish in Limerick. The ferry link between Tarbert and Kilimer in Co Clare affords visitors the opportunity to remain close to the coast and experience the unique communities that live there. Elsewhere fishing and tourism activities occur at a relatively large number of smaller harbours and piers along the entire coastline. In Kerry piers and harbours with three or more vessels fishing on a seasonal basis include; Ballyheigue and to the north Cashen and Meenagahane followed by Fenit to the south which is the centre of the native oyster fishing. At the Maharees (Scaggane pier) there is a significant fleet of <12m vessels, some of which fish all year round. Brandon and Ballydavid are still active although they have been badly affected by the ban on mixed stock fishing for salmon. Ard na Caithne also serves the fishermen in Smerwick Harbour. Dún Chaoin, although affording no protection in swell or weather does serve fishing vessels seasonally. Ventry harbour has two piers – Ventry and Cuan which serve fishing vessels. Outside of Dingle Harbour, Dingle Bay is served by piers/slips on a seasonal basis in Minard and Kells Bay while The Point at Cromane is year round focal point for both fishing and aquaculture activity. The area south of Cahersiveen supports a strong potting fleet, the focal piers for which are Portmagee, Cahersiveen and Knighstown. Further south along the coast and around to the Cork border numerous small piers and slips dot the coastline, the foremost among them are Ballinskelligs, Bunawalla and Westcove with fishing vessels and several leisure craft; Oysterbed Pier outside of Sneem is used for lobster shrimp and mussel aquaculture; Tahilla and Blackwater serve a few of the inner Kenmare River fishers and much aquaculture, The south side of the Kenmare River is served by a number of small landing places between Tuosist and Kilmacilogue harbour. The prevalence of small vessel means that there are a variety of smaller informal though traditional landing places used particularly for shrimp and lobster fisheries.
In terms of pot fisheries there is a substantial dependence on this method of fishing particularly among smaller vessel <12 meter. Broadly prosecuted pot fisheries for Lobster feature all along the Kerry coastline. The brown Crab pot fishery is a valuable fishery with high dependency from north Kerry -Tralee Bay south to Kenmare Bay. The Shrimp pot fishery is particularly significant in the South West; Valentia Harbour into Dingle Bay, Kenmare River. Spider crab is significant top entry pot fishery in north Kerry – Tralee Bay with seasonal fisheries in other areas. There is also a significant crayfish bycatch to the top entry pot spider crab fishery. A limited Nephrops pot fishery exists in Kenmare River. There is a green crab fishery around Cromane which is often associated with shellfish production areas and the Velvet crab pot fishery is ubiquitous but not heavily exploited. There is an intermittent Whelk pot fishery with small fisheries in Kenmare River and in Tralee bay.
Tangle-netting is practised through the Kerry coast mainly targeting Crayfish. Scalloping occurs off the Blasket Islands and in the Kenmare River, Valentia Harbour. Inshore trawling occurs in Dingle Bay predominantly with some also occurring in Tralee Bay and North of the Kerry Head shoals. Fintan’s Bay and the Kenmare River provide some towing areas also. Hook & line fisheries including trolling and jigging for whitefish happen all along the coast and particularly among the smaller inshore vessels. Gillnetting for demersal species also occurs within the region.
SW Region’s Licensed Charter fleet has approximately twenty-five 10 meter vessels and five smaller vessels distributed along the Kerry coast with hotspots in Fenit, Dingle, Cahersiveen and Portmagee/Valentia. Substantial tourism is present along the coast. There are many attractions ranging from angling, eco tours, whale watching, sightseeing, adventure rides, sailing, self-drive boat hire, traditional Naomhog rowing, canoeing, kayaking, surfing including wind & kite, paddle boarding, diving and snorkelling. There are several hotspots including Castlegregory, Dingle, Inch, Valentia, Derrynane, and Dawros and a good dispersion of operators all along the coast coinciding with the Wild Atlantic Way and contributing to the Visitor experience.

4 | FLAG SOUTH WEST FISHERIES LOCAL ACTION GROUP
1.2.1 Map of the FLAG Area
Figure 1.1: Map of FLAG South West area
Source: PACEC, 2016
1.3 Confirmation of Compliance of FLAG AreaConfirmation of compliance of the FLAG South West with the following criteria was addressed by the FLAG selection committee.
Table 1.1: FLAG Area – Compliance with Criteria
Criteria1 Compliant (✔ / ✘)
The area proposed must have at least one boundary comprising the coastline ✔
The area must have a significant level of employment in fisheries or aquaculture ✔
The population of Coastal Electoral Districts for proposed area must be over 70,000 ✔
The area must have a minimum of 150 vessels in all fleet segments of the fleet register and preferably not more than 400
✔
The area proposed must have no more than one National Fisheries Harbour Centre ✔
1.4 Coherent Sub-AreasAs part of the development of the strategy the differing needs and priorities of differing areas of the FLAG were considered.
The differing needs of areas were identified through the socio-economic review, the needs identified were further explored through meetings with key stakeholders representing differing areas of the FLAG. The needs and priorities of the areas were identified through this process and there was found to be little need to establish a coherent sub-area as part of the FLAG strategy but rather any varying needs have been acknowledged and addressed as part of the main strategy.
1 In accordance with Article 33 of Common Provisions Regulation 1303/2013 – December 2013.

LOCAL DEVELOPMENT STRATEGY 2016 | 5
2 ANALYSIS OF THE DEVELOPMENT NEEDS
2.1 IntroductionThis section sets out the summary of the analysis of the development needs and potential of the FLAG Area. This includes an analysis of the strengths, weaknesses, opportunities and threats. It has been developed based on desk-based research along with consultation findings.
2.2 Summary of Socio-Economic ReviewlPreliminary Census 2016 statistics suggest that population is increasing in Kerry (by 8.9% over the past five
years). This is likely to place pressure upon local services, but could create further employment prospects for coastal communities and the fisheries sector.
lThere is a significantly older population (over-65) in the FLAG South West area (14.6% of the population) than other FLAGs (12.6% overall) and across Ireland (11.7%), resulting in age dependency and public services implications for the communities. Almost one in three workers in the Agriculture, Forestry and Fishing sector are over the age of 65, compared to 25% across all sectors suggesting potential longer term supply issues.
lThere is also a slightly larger proportion of persons aged under 15 in the FLAG South West (22.4%) in comparison to Ireland (21.3%).
lThere is a significantly larger proportion of one person households in the FLAG South West (26.8%) than in Ireland overall (23.7%) and a smaller proportion of households occupied by two or more persons (73.2%) when compared to the national figure (76.3%). This may suggest potentially higher levels of social isolation affecting those living alone in the FLAG area.
lVacancy rates are highest along the coast from Kenmare to Valentia Island. In 2011, 53,088 households were permanently occupied in Kerry. This represents roughly 71% of the total number of houses in Kerry in 2011 (74,747). 21,981 permanent private households were located in main settlements while 31,325 were located in the wider rural area.
lThe FLAG South West has the higher proportion of those identifying as Irish (89.9%) across the seven FLAGs (average of 89.2%).
lThere is a lower proportion of persons in the FLAG South West with no formal education completed (1.5%) than all FLAGs (1.7%). This is higher than the national figure (1.4%). The FLAG South West has fewer people qualified through a technical or vocational qualification (9.0%) than in other FLAG regions (9.3%) but marginally more than Ireland overall (8.6%); The FLAG South West has one of the lowest levels of people qualified to third level (34.3%) compare to the FLAG areas overall (35.8%) and Ireland as a whole (34.8%)
lPACEC estimates for Q1 2016 highlight unemployment within the FLAG South West (8.4%) to be higher than the national average (8.3%). Economic inactivity is also higher within the FLAG South West, as well as inability to work due to ill health (4.7% in FLAG South West against 4.4% in Ireland)
lDeprivation is highly prevalent in the FLAG South West zone (72% of EDs lower than the national average) which could present a disincentive to migration into the area and this could be a factor in the decrease in population.
lOwnership levels within the FLAG South West are 267, making up 12.2% of vessel owners in Ireland. Furthermore, the number of owners per 1,000 persons is one of the highest across FLAGs at 3.7 – this means that regarding ownership, the fishing industry is over seven times more important to the FLAG South West’s local economy than at the Irish level. However, gross tonnage is considerably lower within the FLAG South West compared to other FLAGs consisting of 5.6% of total Irish gross tonnage indicating the high dependence if the fishing industry on vessels under 12 metres.

6 | FLAG SOUTH WEST FISHERIES LOCAL ACTION GROUP
lWithin Ireland, the top twenty ports consist of approximately 280,000 tonnes of fish (i.e. 95% of fish landed), and €323m (93%) of the value. Dingle Fishery Harbour Centre is the third port in terms of both weight of fish landed and the value of fish landed is Dingle, this represents 4% of the weight of overall landings at the top 20 ports and 8% of the value showing the significance of Dingle to the sector. Dingle is a Designated Port for specific species and volumes which tends to be whitefish and pelagic and is landed predominantly by national and European vessels over 18 metres.
lThere are significant tourism opportunities for the area due to the scenic landscape and initiatives such as the Wild Atlantic Way route
lInformation is not available at a FLAG level regarding exporting, however the points below summarise the general picture.
- The overall value of Irish seafood exports was €564 million in 2015. The largest Irish seafood export by value is pelagic (€204m, 36%), followed by crustaceans (€113m, 20%), freshwater fish (€85m, 15%), molluscs (€82m, 15%), whitefish (€53m, 9%) and fish meat and oil (€26m, 5%). Sectorally, shellfish led the way – rising 12% to €195 million; followed by salmon – where exports increased to an impressive €75 million; and whitefish – where exports grew by 7% to €53 million. The only decline in 2015 was seen in pelagic, where exports fell 7% to €204 million as a result of falling trade and market prices.
- 70% of the seafood industry exports are as a bulk commodity, it is anticipated that this needs to be reduced to 50% by 2025 to meet increasing market demands, with seafood demand expected to increase by 50% by 2030.
- Looking at aquaculture specifically, France remains the main market for Irish oysters accounting for over 76% of all exports, however this has decreased by 10% in 2015 identifying the need for oyster produces to diversify outside the French market. France and The Netherlands are the primary markets for rope mussels with demand from The Netherlands increasing as processors there have developed techniques for handling and packaging of rope mussels.
- Over two thirds of Irish seafood exports in 2015 were to EU countries (€388m, 69%), while just under a fifth of exports were to Nigeria and North Africa (€98m, 17%), (€47m, 8%) were to Asia which is seen as an expanding export market for certain species and the remaining €31m was to Non-EU countries (6%).

LOCAL DEVELOPMENT STRATEGY 2016 | 7
2.3 Summary - Infographic ( FLAG National)D
EMO
GR
AP
HY
POPULATION POPULATION CHANGE IN FLAG COUNTIES
(2011-2016)
GENDER
MA
RIN
E &
SE
AFO
OD
SEC
TO
R
NO. OF COMPANIES ENGAGED IN MARINE AND
SEAFOOD SECTOR
COMPANIES BY TYPE OF BUSINESS
1. Wholesale (n=7)
2. Processing (n=6)
3. Aquaculture (n=3)
4. Fishing (n=2)
NUMBER OF VESSELS
FISHING FLEET GROSS TONNAGE (‘000)
VOLUME OF FISH LANDED VALUE OF FISH LANDED
TOTAL SECTORAL EMPLOYMENT
PERCENTAGE OF VISITORS (TOURISTS)
VISITOR EXPENDITURE
72,863 4,588,252
1.6% of the population live in the FLAG
This represents 4.9% of companies engaged in Ireland
12% of vessels are in the FLAG South West
The gross tonnage is 6% of the national figure
Representing 9% of Seafood employment across all FLAGs
26% of visitors to Ireland visit the South West region
Representing 4.2% of the value of landings across all FLAGs
Kerry Average €219Limerick Average €342
Ireland Average €306
Kerry Total €228mLimerick Total €169m
Avg. Total per county €128m
26%
267
€9.12m
2,196
€219.32m64.5 tonnes
550 6,424
18
3.6 tonnes
Kerry +1.4%Limerick +1.8%
Ireland +3.7%
There is slightly more women
49.8% 49.5%
50.2% 50.5%
Representing 2.8% of the volume of landings across all FLAGs
5,706 tonnes
203,423 tonnes

8 | FLAG SOUTH WEST FISHERIES LOCAL ACTION GROUP
AQ
UA
CU
LTU
RE
NUMBER OF AQUACULTURE VESSELS
GROSS TONNAGE OF AQUACULTURE VESSELS
EMPLOYMENT IN AQUACULTURE (FTE)
ECO
NO
MY
EMPLOYMENT MALE UNEMPLOYMENT FEMALE UNEMPLOYMENT
DEP
RIV
AT
ION
SOCIAL CLASS
1. Managerial and Technical 26%/27%
2. Non-manual 17%/18%
3. Skilled Manual 16%/15%
4. Semi-Skilled 11%/11%
DEPRIVATION
PR
OFI
LE &
ED
UC
AT
ION
AGE PROFILE % OF POP. WITH PRIMARY EDUCATION ONLY
% OF POP. WITH THIRD LEVEL QUAL. OR ABOVE
HO
USE
HO
LDS,
AC
CES
S &
HEA
LTH
ONE PERSON HOUSEHOLDS ACCESS TO BROADBAND % OF POPULATION UNABLE TO WORK DUE TO HEALTH
PROBLEMS
9.8% 6.1%9.9% 6.4%
There is a lower proportion of people in employment than
the national fi gureThe male unemployment rate is
slightly lower than nationallyThe female unemployment rate is
slightly lower than nationally
54.5%50.8%
27% of FLAG South West EDs are within the top 30%
most deprived in Ireland while 9% are within the top
20% most deprived
There is a higher proportion of one person households than
nationally
Lower proportion of the population have access to broadband than the
national fi gure
A lower proportion of FLAG population are unable to work
due to health problems
56%27% 4.2%
63%24% 4.4%
65+
15-64
0-14
12%
67%
21%
15%
65%
20%
The population of the FLAG is slightly older than
national statisticsOver on in seven with a primary education only
Similar portion of population with Third Level qualifi cations
35%14%
65%86%
15%
85%
34%
66%
49.5% of aquaculture vessels are in the FLAG South West
The gross tonnage is 9.4% of the overall aquaculture tonnage
Representing 12% of FTE Aquaculture employment
across all FLAGs
54
1094,752 tonnes
117 995
447tonnes

LOCAL DEVELOPMENT STRATEGY 2016 | 9
2.4 Overview of the Consultation ProcessThe FLAG South West recognises the importance of the active engagement and participation of Kerry citizens in the sustainable development of their coastal communities and the opportunity for them to input meaningfully into the design, development and implementation of the FLAG South West Strategy. The FLAG Board has supported Public and Corporate Economic Consultants (PACEC) in the comprehensive public consultation process undertaken.
In keeping with the Community Led Local Development (CLLD) approach of FLAG, the FLAG Board undertook a comprehensive consultation process at a local level to ensure the local development strategy was informed by the active engagement and participation of those directly involved in fishing and aquaculture, those involved in the development and maintenance of coastal communities, those involved in marine tourism and promoting coastal areas and many others. The table below sets out the consultation activity undertaken by PACEC on behalf of the FLAG Board.
Table 2.1: Overview of the Consultation Process
Consultation Activity
Public Meetings
5 public meetings carried out in the FLAG South West region (Kenmare, Cahersiveen, Tarbert, Tralee and Dingle). Over the 5 public meetings there were approximately 65 attendees. Representation of the attendees in the FLAG South West was:
lRepresentatives from local authorities made up 16% of attendees;
lEconomic and social partners made up 44% of attendees;
lOther relevant bodies that represent civil society made up 40% of attendees.
Meetings with Relevant Stakeholders
As part of a strategy development process, interviews were held with a range of key stakeholders2 including those from the statutory sector as well as industry representatives. In addition, FLAG board members had the opportunity to identify relevant stakeholders who were to be included in the consultation process.
In some instances, despite attempts3 to gain input from stakeholders, some were unavailable to feed into the development process. These consultees were encouraged to make written submissions to the strategy development process.
The format of the community consultation events was participatory in nature to promote meaningful engagement and to ensure the active participation of the local community in identifying the challenges and opportunities present in their local areas.
2.4.1 Inclusive Process that involved key stakeholdersAll consultation events were promoted and well publicised to raise awareness of the process amongst all key stakeholders. The meetings held were publicised locally using a variety of different means including advertisements in local and trade press, notices on local and regional radio, signage and posters, broadcast emails to mailing lists and past FLAG applicants, SMS alerts to focus groups and word of mouth. The inclusive nature of these events can be witnessed from the diverse representation amongst the attendees.
2.4.2 Multi-Sector Approach that involves co-ordination with relevant sectorsThe consultation processes directly engaged with various sectoral groups covering a very broad remit of different population cohorts, activity and geographic areas of coverage. The different sectoral group interests were captured from a combination of the public consultation events, stakeholder meetings and telephone consultations.
2 Dingle Business Camber; Dingle Peninsula Tourism Alliance; Comharchumann Forbartha Chorca Dhuibhne Teo; Northwest Kerry Shellfish Co-op; Tralee Oyster Fishery Society; Valentia Harbour Development Company; Kerry Aquaculture (BIM); Dingle Boat Owners Association; Dingle Marine and Leisure; Skellig Tour Operators; Údarás na Gaeltachta; Sea Synergy Centre and LEO Since the consultation took place a number of stakeholders were identified and telephone consultations have been arranged with Taste of Kerry; Shannon Port Company; Fáilte Ireland; Artisan Food.
3 All consultees were emailed three times seeking a meeting or telephone consultation. Each consultee was also contracted three time by telephone. This is standard practice.

10 | FLAG SOUTH WEST FISHERIES LOCAL ACTION GROUP
2.4.3 Specifi c Methodologies for engaging with more diffi cult to reach groupsSeveral specifi c methodologies were adopted to ensure the engagement of more diffi cult to reach groups. Consultation meetings were held within local communities, the timing of the meetings (i.e. during the day or early evening) tried to accommodate those who may be at sea and unable to attend meetings during the day. This outreach approach through which communities were directly engaged in their own areas (avoiding the need for them travel long distances) was important in ensuring that more remote, peripheral and isolated communities were aff orded the opportunity to actively participate in the preparation of the Local Development Strategy.
In addition, eff orts were made to include Islands and other isolated communities. Meetings and consultation events were held on islands and specifi c travel and meeting arrangements were made to ensure that these important areas of the FLAG were included in the process.
Other specifi c actions were taken including meeting with organisations that represent migrant workers, who have a key role to play in the fi shery, aquaculture and seafood processing industries. These stakeholders may have been restricted from participating in consultation events due to issues related to language etc.
In addition to this, when a FLAG area included a Gaeltacht area eff orts were made to ensure that the meetings were conducted in Irish, or that an Irish interpreter was present to ensure that the views of Gaeltacht areas were also taken on board.
2.5 Feedback from Consultation
2.5.1 Introduction and MethodologyThe public consultation and the engagement with local stakeholders is the most important element in the development of the strategy. Given this the meetings were designed such that pertinent information, that would clearly inform the strategy, was collected at each.
The engagement had three main components which are described in the diagram below.
Table 2.2: Consultation Methodology
SWOT and Needs
This element asked consultees to consider the information gathered by PACEC in relation to the Socio-Economic Review and discuss the Strengths, Weaknesses, Opportunities and Threats within their local area.
Ranking
Using seven areas of activity, developed from the Union Priority 4 of the EMFF Regulation, Article 63 of the Common Provision Regulation and the European Maritime Fisheries Fund, we asked attendees to rank the areas of activity in order of important to them and to their local area.
Opportunities and Project Ideas
Using the highest ranked areas of activity, attendees were asked to consider the opportunities and project ideas that may be supported through the programme to address some of the weaknesses and threats identifi ed.
Source: PACEC, 2016
The outworking was a bank of information which we have used to inform the development of the strategy in constant liaison with the FLAG South West Board. A summary of the information gathered through the public consultation process is included in the sections that follow.

LOCAL DEVELOPMENT STRATEGY 2016 | 11
2.5.2 SWOT and NeedsThe consultation exercise undertaken included a discussion of the needs of the local area and through this a SWOT analysis was developed. The key findings from this analysis are presented in Figure 2.1.
Figure 2.1: SWOT Analysis – South West Fisheries Local Action Group
Strengths Weaknesses
lThe region boasts a vast experience amongst those involved in fishing and aquaculture;
lThere is a particularly strong skills base in the Kerry area and the county is particularly entrepreneurial;
lStrongly networked coastal community
lWell-developed diaspora resulting from emigration pressures
lHigh level of entrepreneurial activity within communities
lStrong sense of community, heritage and it's preservation
lRecognition of the sustainable management of the marine resource
lGlobal food demand is rising and local fishing communities can supply this growing market
lHigh level of tourism activity within the coastal region.
lYoung people leaving coastal areas for education and employment and not returning because of limited employment prospects;
lYoung people seeking employment in more secure sectors e.g. ICT and do not see fishing and aquaculture as secure employment;
lVery limited access to existing marine / environmental assets. Significant barrier to utilising and promoting these;
lLicensing system, specifically issues around duel licensing providing significant barrier to development of those in the fisheries sector.
lNo young people in the fishing and aquaculture industry is a significant weakness for future planning and succession planning;
lInfrastructure issues in relation to broadband and mobile telephone signal are barriers to new business development in coastal or rural areas;
lLimited access to finance for private individuals or businesses making it difficult to apply for grant aid;
lSeasonal unemployment is very high (circa 18%) and this impacts young people on welfare.

12 | FLAG SOUTH WEST FISHERIES LOCAL ACTION GROUP
Opportunities Threats
lSignificant opportunities related to marine tourism particularly in relation to boats trips to view wildlife such as whales and dolphins; Kerry boosts the largest population of dolphins in Europe which could support these opportunities.
lRegional fisheries festivals could be used to promote the sea / marine life;
lProjects to be supported which specifically target young people which aim to educate them about the marine environment and the potential careers within it;
lThe development of a blue way, particularly in the more sheltered bays and water courses.
lOpportunities to develop seafood trails on the Wild Atlantic Way. This may include opportunities for catch and cook initiatives which will bring new people to the area.
lOpportunities in relation to the growth of sports angling in the region.
lSignificant assets in relation to Tourism in Tarbert and along the Shannon which could be exploited;
lBrexit provides opportunities in relation to the exploration of new markets and changes in markets and exports;
lThere is a long history of maritime heritage which could be developed including through canoe / kayak trails, maritime tourism initiatives and the establishment of walking groups.
lThreat of reducing fish stocks, despite quotas, impacting on growing tourism sector related to sports angling;
lNo new capacity for employment being created in the sector due no new licenses being granted;
lThreat to supply chain as existing domestic and export markets are full;
lSignificant threat in balancing competition for water and marine infrastructure use between fishing vessels and tourism / personal use vessels;
lIncrease in the number of marine predators (e.g. Seals and Green Crab) have impacted upon fish stocks;
lPerceptional lack of communication between authorities and local coastal communities and industry;
lLack of co-operative working within fishing and aquaculture sectors;
lPotential impact of Brexit and the implications on exports and trade
lLimited private financial support for industry particularly in relation to business startup / expansion of activities;
lExisting markets, both domestic and foreign are at capacity and therefore there is little room for additional producers;
lLimited access to existing maritime assets including Shannon Estuary;
lRestricting on access to Fishing threatens the development of the angling tourism industry;
lBrexit poses threats to established trading and export markets;
lNo access to training for volunteers or support for the time and cost of existing courses.
Source: PACEC, 2016
2.5.3 RankingA key element of the consultation exercise was the ranking of the Areas of Activity in order of importance and priority for the FLAG. The Areas of Activity are taken from Article 63 Implementation of Community Led Local Development of the Common Provision Regulations. The table below details the out workings of this process including the overall assessment of the ranking of areas based on feedback from the consultation process.

LOCAL DEVELOPMENT STRATEGY 2016 | 13
Table 2.3: Ranking of Areas of Activities
Area of Activity Overall Ranking
1. Adding Value to Fishery and Aquaculture Products 2.2
2. Job Creation/Maintenance 1.3
3. Supporting Innovation and Diversifi cation 2.2
4. Lifelong Learning & Attracting Young People 2.3
5. Promoting Environmental Assets 3.0
6. Promoting Social Wellbeing and Cultural Heritage 2.8
7. Strengthening Role and Governance 2.8
Source: PACEC, 2016
Table 2.3 indicates that across all the consultation activity:
lJob creation and maintenance was identifi ed as the highest ranked priority area;
lSupporting innovation and diversifi cation and adding value to fi sheries and aquaculture products were identifi ed as the 2nd most important areas for the FLAG;
lLifelong learning and attracting young people was identifi ed as the 4th most important area;
lPromoting social well-being and cultural heritage and strengthening the role and governance were identifi ed as the 5th most important areas; and
lPromoting environmental assets was identifi ed as the least important area for the FLAG board.
After the consultation exercise and taking into account feedback from the consultation meetings the areas of activity were refi ned and remodelled to better refl ect the framework of activities. The main change in the framework is that ‘creating and maintain jobs in coastal areas’ was seen as an overarching goal and that all of the other Areas of Activity could contribute to. In addition, another area was added in relation to the development of marine tourism and diversifi cation. The outcome of this process is displayed below.
Figure 2.2: Refi nement of the Areas of Activity
Adding value to fi sheries & aquaculture
products
Promoting innovation in fi sheries and aquaculture
and supporting diversifi cation
inside and outside od
commercial fi sheries
Marine Tourism Development
and diversifi cation
Lifelong learning and
attracting young people
in fi sheries and aquaculture
areas
Creating and maintaining jobs in coastal areas
Promoting social well being and
cultural heritage in
fi sheries and aquaculture
areas
Strengthening the role and governance of fi sheries
communities in local
development
Promoting the environmental assets of the fi sheries and aquaculture
areas and the mitigation of
climate change
Source: PACEC, 2016
Continuing the development of the framework it was acknowledged that some of the areas above were overlapping and could be grouped together to streamline the focus of the strategy to be developed. PACEC, in consultation with the FLAG Board, developed fi ve themes for which the prioritised areas of activity would fi t. The breakdown of these themes is detailed in fi gure 2.3.

14 | FLAG SOUTH WEST FISHERIES LOCAL ACTION GROUP
Figure 2:3: Areas of Activity to Themes
Adding value to fisheries & aquaculture
products
Revised areas of activity
Themes
Promoting innovation in fisheries and aquaculture
and supporting diversification
inside and outside od
commercial fisheries
Economic Development of Coastal Areas
Marine Tourism Development
and diversification
Lifelong learning and
attracting young people
in fisheries and aquaculture
areas
Harnessing and developing the
skills, talent and local
knowledge of local coastal communities
Promoting social well being and
cultural heritage in
fisheries and aquaculture
areas
Promoting social well being and
cultural heritage in
coastal areas
Strengthening the role and governance of fisheries
communities in local
development
Enabling more participative involvement
in local development
Promoting the environmental assets of the fisheries and aquaculture
areas and the mitigation of
climate change
Protecting and promoting the environment
Source: PACEC, 2016
The five themes detailed above are the bedrock on which the strategy is built. All of the proceeding sections of the strategy use the themes detailed.
2.5.4 Project Ideas / OpportunitiesThe final element of the consultation work considered the opportunities and project ideas that attendees had in relation to the areas of activity. Using the themes detailed above we have included the tables below a summary of the key needs and project concepts against each theme.
Whilst the tables below set out all the project concepts / needs identified through the consultation the FLAG Board have assessed this feedback and have identified areas that are ineligible or illegal for FLAG support according to State Aid rules. There are also issues arising which are the core remit of other agencies or the state or that are better supported through other programmes or funding streams. Therefore, not all the areas detailed below have been progressed in to the intervention logic for the strategy.

LOCAL DEVELOPMENT STRATEGY 2016 | 15
Table 2.4: Economic Development of Coastal Areas
Economic Development of Coastal Areas
Adding Value to Fisheries and Aquaculture
County Kerry produces an abundance of fisheries and aquaculture products, particularly in the diverse inshore fisheries e.g. lobster, brown crab, crayfish, mussels, oyster, scallop, pollock, mackerel, tuna, monkfish, winkles, spider crab, salmon, shrimp, herring and sprat. In addition, the seaweed industry is expanding and includes Laminaria Spp, Saccharina, Ascophylum nodosum, Palmaria Palmata, Chondrus crispus and Fucus serratus. Despite this the following needs were identified:
lAdding value through improved infrastructure
- Need for improved landing facilities at smaller piers and harbours e.g. (cranes / hoists for removing catch from boats more quickly, storage facilities and ice to ensure product remains fresh, equipment for boats to allow catch to be frozen at sea)
lAdding value through development of new products
- Need to develop new products for local market and for new export markets particularly in Asia and Middle East;
lAdding value through local processing
- Need to develop and encourage local processing of fisheries and aquaculture products so that the full value of the product is retained in the local economy;
- Need to consider alternative processing i.e. improving existing products through existing traditional processing e.g. filleting, salting, drying, smoking etc.
- Need to consider the development of processing units for product testing and development at a local level.
lAdding value through improved product offering
- Need to promote local produce further through: improving the appearance, marketing and packaging of local products; using official quality labels and symbols (e.g. Protected and Traditional Specialty Guaranteed); using eco-labelling and organic labelling; exploring new supply chains and improving local supply chains; improved collaboration with partners and actors in the supply chain; research and feasibility studies on market demand, shelf life, catchment areas etc.
Diversification and Innovation
Limited availability of jobs in coastal areas is a major issue resulting in lack of employment, underemployment and leading to decline and contraction of coastal areas. Key to the rejuvenation of coastal areas is the creation of new enterprises through diversification and innovation. Some of the needs identified in relation to this include:
lSupport for business diversification and development
- Need to encourage entrepreneurship and business startup through support through pilot projects and seed funding for idea exploration through feasibility study and business case development;
- Need to provide appropriate space to encourage business developed e.g. incubation units / hubs / innovation space;
- Need to provide and support on-going mentoring and networking between local people and agencies that can provide soft support (e.g. training)
- Need support for product testing, marketing and branding outside of the centre in Clonakilty which has limited capacity
- Need to support diversification into new areas such as marine tourism, heritage, arts and crafts etc.
- Need to explore renewable energy and seaweed biomass products.

16 | FLAG SOUTH WEST FISHERIES LOCAL ACTION GROUP
Economic Development of Coastal Areas
Marine Tourism
Tourism is vitally important to the economy of County Kerry with the accommodation and hospitality sectors a key driver of employment. Tourism also delivers substantial social and community benefits, as a significant number of tourism businesses in County Kerry are micro-enterprises that are embedded in rural and coastal communities. Some of the key needs in relation to marine tourism included:
lDeveloping the tourism offering
- Need for support for the development of marine tourism and water based activities, walks, and cycling trails;
- Need for support for the development heritage trails seafood trails and cultural information;
- Need for support for exploring the development of eco-tourism and wildlife tourism including bird watching, whale and dolphin tours, seals and other marine species;
- Need for support for seafood festivals and coastal community festivals;
- Need for support for astro-tourism promoting the dark sky to star gazers etc.
- Need to encourage people to stay in the region rather than day-trippers who travel back to main towns and cities for accommodation.
lEnhancing the Tourism Infrastructure
- Need for support for signage and information boards to enhance existing tourism offerings
- Need for support improvement to marine infrastructure e.g. pier to improve safety and facilities and issues regarding shared usage for tourism and fishing/aquaculture;
- Need for improvements to marine infrastructure in relation to pontoons and marines and ensuring that access to water is safe and accessible for all including those with disabilities;
lMarketing and Promoting the Tourism Offering
- Support for the animation and marketing of tourism products;
- Support for the development of new marketing including feasibility studies and training;
- Support for the development of networks and clusters to encourage local tourism business to work more closely together and also work with other local businesses e.g. hotels and restaurants.
Source: PACEC, 2016

LOCAL DEVELOPMENT STRATEGY 2016 | 17
Table 2.5: Harnessing the Skills, Talent and Knowledge of Local Coastal Communities
Harnessing and Developing the Skills, Talent and Knowledge of Local Coastal Communities
Developing Skills in Local Coastal Communities
Those involved in fishing and aquaculture are, by the nature of the industry, highly skilled with regard to marine life, eco-systems and bio-toxins as well practical skills such as navigation, boat management etc. However, the fishing and aquaculture community also have significant knowledge of heritage and historic events which have happened in coastal areas. Some of the needs in relation this included:
lDeveloping Skills in Fisheries and Aquaculture Areas
- Need to support those involved in fishing and aquaculture in training and upskilling;
- Need to support those involved in fishing and aquaculture in advanced training and courses;
- Need to support the development of basic skills
lPromoting the knowledge and experience present in local coastal areas
- Need to support the exchange of knowledge between older and young generations
- Need to ensure that information on coastal heritage is not lost to young generations.
Attracting Young People to Fisheries and Coastal Areas
Like many rural and peripheral locations, coastal areas struggle to attract young people who wish to remain, work and live in the area. Partly this is due to a lack of employment opportunities with many leaving for education and not returning, however many young people are not aware of the opportunities within local coastal areas that many be an attraction and encouragement for them to return. Some of the needs identified included:
lIntroducing young people to the marine environment early
- Need to support the development of educational resources to enable children and young people to explore and learn about the marine environment;
- Need to support the development of information on the career opportunities related to the marine sector (e.g. fishing, aquaculture, tourism, scientific roles i.e. marine biologist etc.)
- Need to support existing infrastructure which invites and encourages young people to interact and learn about the marine sector.
lSupporting young people training in marine sectors
- Need to support young people through grants for taking courses in marine sector skills
- Need to encourage the development of apprenticeships for young people seeking to gain employment in the fisheries and aquaculture sectors;
- Need to support young entrepreneurs who have business ideas for coastal areas.
Source: PACEC, 2016

18 | FLAG SOUTH WEST FISHERIES LOCAL ACTION GROUP
Table 2.6: Promoting Social Well-Being and Cultural Heritage in Coastal Areas
Promoting Social Well-Being and Cultural Heritage in Coastal Areas
Improving Social Well-Being in Coastal Communities
Issues related to social isolation and access to service came up during the consultation process. In particular there were issues raised in relation isolation amongst older single men in coastal areas as well as access to services for fishing families. Some of the needs highlighted included:
lLack of services in coastal communities
- Support for the development and sustainability of existing coastal community assets;
- Targeted initiatives to address isolation such as fishermen living alone e.g. Men’s Sheds type initiatives;
- Supported needed for vulnerable people in coastal communities;
- Need to develop services linked to the coast e.g. coastal walks which are accessible, community health and well-being projects.
lPromotion and Development of Coastal Cultural Heritage
- Support for historical events and exhibitions in relation to coastal heritage
- Support for the development of heritage centres
- Support for research into local history
- Support for festival and other activities to promote seafood and the marine;
- Support for information boards and signage in relation to points of interest
- Development of coastal heritage trails.
Source: PACEC, 2016
Table 2.7: Enabling more Participative Involvement in the Governance of Fisheries
Enabling more Participative Involvement in the Governance of Fisheries
Throughout the consultation events there was a strong sense of a disconnect between authorities and decision makers and local fisheries and aquaculture. In particular there was a need to improve the capacity of local fisheries to better govern themselves and to be involved in decision making.
lImproving the capacity of local fishing and aquaculture organisations
- Need to improve the co-operation and networking being local fisheries;
- Need to improve the capacity in local fisheries through training in relation to good governance and group management
- Need to improve the training and support offered to local fisheries organisations.
- Need to improve the networking and consultation between local actors and authorities and agencies.
Source: PACEC, 2016

LOCAL DEVELOPMENT STRATEGY 2016 | 19
Table 2.8: Protecting and Promoting the Environment
Protecting and Promoting the Environment
County Kerry is arguably one of the most scenic part of Ireland and boosts many natural areas of outstanding beauty. This provides both opportunities and issues for the local area. Whilst there are opportunities to promote and exploit these areas as attractions for tourists there are challenges in relation to the protection and maintenance of these regions as well. Some of the needs identified include:
lPromoting the Natural Environment
lNeed to improve the offering exploiting the natural environment through information, wildlife tours, walking routes etc.
lNeed to improve the access to and safety of existing sites to enable more people to enjoy them without damaging the environment
lProtection the Environment
lNeed to raise awareness of bio-diversity in coastal areas
lNeed to protect inland water courses such as rivers and lake which fall into the FLAG areas;
lNeed to protect coastal areas from floods and storms;
lNeed to invest in community based conservation trails.
Source: PACEC, 2016
2.6 SummaryThis chapter presents all of the desk based and consultation data collected which will form the basis of the strategy going forward. The socio-economic review considered the data and statistical evidence in relation to the FLAG region. In addition, the consultation work including the public consultation and stakeholder meetings collected the views of over 70 people (over 60 people in the public workshops and over 10 in individual stakeholder meetings) in relation to the challenges, weakness and strengthens of the region, their priorities for the FLAG Programme and the project ideas that they had.
Using this information, the next chapter of the strategy now considers the overall prioritisation of areas to be supported under the FLAG South West Programme based on a number of components. The intervention logic is then progressed with the development of objectives and actions.

20 | FLAG SOUTH WEST FISHERIES LOCAL ACTION GROUP
3 STRATEGY AND OBJECTIVES
3.1 IntroductionUsing the information collected so far this chapter sets out the intervention logic for the programme taking into consideration the findings of the socio-economic review and the programme of consultation.
3.2 Consistency with the Overarching Strategy set out in the Operational Programme
As per section 5.1.1 of the EMFF Operational Programme this strategy has been developed to be consistent with the overarching strategy set out in the operational programme. In particular the strategy has been developed to meet the requirements that the evaluation committee will assess the strategy against.
More over the strategy has been developed recognising the aims of the overarching strategy in relation to Union Priority 4, namely in relation to the employment created and maintained, and will seek through all actions to promote these outcomes so as they may be achieved by 2023.
3.3 Level of Change RequiredThe FLAG South West Region is has a strong history of fishing and aquaculture and of having a strong coastal community. This is being threatened by several issues including:
lA decline in fisheries;
lLimitations on licensing for aquaculture sites;
lPopulation migration away from coastal areas to urban centres for opportunities in education and employment; and
lAn aging population.
However, there are also areas which are once again promoting coastal areas these include tourism, the revival of food tourism and artisan products and crafts.
The FLAG South West Programme aims to support fishing dependent coastal communities. The programme aims to support the development of coastal areas by supporting the fishing and aquaculture industry as well as coastal community groups to upskill, diversify, innovate regenerate and exploit the opportunities that are available.
The overall aim of the strategy is to see the rejuvenation of coastal communities.
3.4 Prioritisation of Identified Areas of Activity
3.4.1 IntroductionThe process for prioritising the areas of activity was an iterative one ensuring that all views elicited were heard and that relevant internal and external documents were objectively examined. It was also evident from this process that the local knowledge on the ground and in all the relevant organisations and agencies was consistent with the comprehensive statistical information available and analysed.
The FLAG Board were heavily involved in the prioritisation, receiving all information from the public consultation meetings and having workshops with the consultants.

LOCAL DEVELOPMENT STRATEGY 2016 | 21
3.4.2 PrioritisationThe following section considers the prioritisation of the areas of activity which were developed from the following sources:
lUnion Priority 4 of the European Maritime and Fisheries Fund Regulations;
lArticle 63 of the Common Provision Regulation; and
lThe European Maritime Fisheries Fund Priorities.
The prioritisation exercise was carried out by examining the following four criteria:
lStrength of support for the need (using information from ranking exercises carried out within the public meetings);
lStrength of the evidence of need (using information gathered through the socio-economic review of the FLAG Region);
lFit with the European Maritime Fisheries Fund 2014 – 2020 – Union Priority 4; and
lOpportunities/Project Pipeline.
Each of these criteria were assigned a weighting and a score between 1 and 5. The details of the scoring are included in the table below.
Table 3.1: Scoring Methodology
Criteria Weighting Scoring Rationale
Weighting Rationale
Strength of support for the need
25 lThis weighting reflects the importance attributed to the information provided through the public engagement.
lA stronger score will be awarded for this criterion if the findings from the public consultation have highlighted this area of activity as a key priority.
Strength of evidence of the need
30 lThis criterion has been awarded the highest weighting as it is based on the socio-economic review of the FLAG region which supports the need for intervention under certain areas of activity.
lA stronger score will be awarded for this criterion if the findings from the socio-economic review have highlighted this area of activity as a key priority.
Fit with European Maritime Fisheries Fund 2014 – 2020
20 lGiven that the areas of activity are derived from the EMFF Regulations all of them fit with the EMFF to a certain degree. This criterion has been allocated the lowest weighting for this reason.
lA stronger score will be awarded for this criteria if the area of activity fits with the priorities and objectives of the EMFF. The highest score is awarded to those which will directly contribute to UP4.
Opportunities/Project Pipeline
25 lThe project pipeline is an indication of the opportunities that the FLAG will have to spend money on a projects under a particular area of activity. Therefore, a weighting of 25 has been attributed to this criterion.
lA stronger score will be awarded for this criterion if through the stakeholder engagement a larger pipeline of potential projects has been identified.
Source: PACEC, 2016

22 | FLAG SOUTH WEST FISHERIES LOCAL ACTION GROUP
The prioritisation of the areas of activity has led to the following summary.
Table 3.2: Summary of Prioritisation
Area of Activity Score Ranking
Adding value to fisheries and aquaculture products 400 2nd
Creating and maintaining jobs in coastal areas 475 1st
Promoting innovation in fisheries and aquaculture and supporting diversification inside and outside commercial fisheries
375 3rd=
Lifelong learning and attracting young people in fisheries and aquaculture areas 375 3rd=
Promoting the environmental assets of the fisheries and aquaculture areas and mitigation of climate change
225 7th
Promoting social well-being and cultural heritage in fisheries and aquaculture areas 275 5th=
Strengthening the role and governance of fisheries communities in local development 275 5th=
Source: PACEC, 2016
The prioritisation exercise has established a ranking for all of the seven areas of activity. This is broadly in line with the findings from the consultation exercise.
In addition, the FLAG Board considered that the interlinkages between adding value, job creation and maintenance and innovation and diversification meant that these would work best in co-ordination and therefore collected then under one thematic heading of Economic Development in Coastal Areas.
In consultation with the FLAG Board it was agreed that the strategy would pursue the three thematic areas:
lEconomic Development of Coastal Areas;
lDeveloping the Skills and Knowledge of the Local Coastal Community; and
lPromoting Social Well-Being, Coastal Cultural Heritage and Environmental Protection
The one area which has been omitted relates to strengthening the role and governance of fisheries communities in local development. The rationale for this being omitted is detailed in the points below:
lSupporting the governance and voice of fisheries and aquaculture was the remit of the Regional Inshore Fisheries Forum and therefore FLAG did not want to support activities which could provide competition of duplication to this body;
lGovernance training for organisations is already provided through several sources including the Local Enterprise Office, other BIM schemes including through the Technical Assistance budget.
The next sections of this Chapter set out the development of the intervention logic.
3.5 Intervention Logic of the FLAG South West Strategy
3.5.1 Components of the Intervention LogicThe components of the intervention logic have been developed using the latest guidance from FARNET “Results Orientated Community Led Local Development”4.
4 https://webgate.ec.europa.eu/fpfis/cms/farnet/publications/guides

LOCAL DEVELOPMENT STRATEGY 2016 | 23
Table 3.3: Components of the Intervention Logic
Component Description
Vision The vision describes the overall goal of the entire programme. This is a high level, often qualitative metric.
Theme The theme in this instance sets out a group of areas of activity which are similar in nature and which can lead or support the achievement of joint goals.
Area of Activity The areas of activity are the areas which the FLAG programme can legally support and are based on the EMFF and Common Provision Regulation documents as well as the European Maritime Fisheries Fund.
Objective The objectives are high level outcomes which intervention under a particular theme aims to achieve. These are often macro-level and qualitative.
Action The actions are the direct supports that will be provided to applicants in order to enable them to complete project which will contribute to the achievement of the earlier components of the intervention logic.
Output The outputs describe the tangible impact of the programme and are often specific to individual projects. These are quantified and used to assess the performance of the programme overall.
Source: PACEC, 2016
The remainder of Chapter 3 sets out the components above for the FLAG South West Strategy.
3.5.2 Strategy Vision
The FLAG South West will have innovative, sustainable fishing and aquaculture dependent communities.
3.5.3 Objectives and Supporting Actions
3.5.3.1 Introduction to IndicatorsAn indicator is a tool that defines, measures and values progress in the implementation of the local strategy. This information will help the FLAG to determine whether and to what extent the objectives are being reached and to review and update the local strategy5. There are several different types of indicators including impact6, result and output indicators. The types most relevant to the FLAG programme are:
lResult Indicators – these measure products or services delivered because of implementing a set of activities. These have been defined as per the overall European Maritime Fisheries Fund 2014 – 2020.
lOutput Indicators – these measure the immediate tangible product of support. These have been defined for each objective and action of the FLAG Local Development Strategy.
3.5.3.2 Result IndicatorsResult indicators measure the products or services delivered because of implementing the set of actions that are outlined in this strategy. The FLAG Programme is funded under Union Priority 4 of the European Maritime Fisheries Fund and therefore must report against a set of targets at both the mid-point of the programme (2019) and the ex-post evaluation (2023). All FLAGs must contribute to these overall objectives and therefore they are standard across all FLAG Regions. The value of the indicators however is dependent on the allocations to each FLAG region and therefore these vary between FLAG Regions.
5 FARNET Factsheet 2 – Results Orientated CLLD in Fisheries Areas – Selecting the Indicators and Setting Targets.6 these measure the effect of the intervention on the wider environment and its contribution to wider policy objectives

24 | FLAG SOUTH WEST FISHERIES LOCAL ACTION GROUP
The two overarching targets that the FLAG programme must achieve are in relation to FTE jobs created and maintained. Since these specific result indicators are cross-cutting rather than tied to any specific theme or action, they have been included as result indicators.
Table 3.4: Indicator Tables – Programme Level Result Indicators
Programme level indicators: Total Programme Budget €1,361,400
*assume that Theme 1 – Economic Development of Coastal Areas makes the largest contribution so indicators based on this allocation of 50% of the programme budget (i.e. €680,700)
Action Financial Allocation
Indicator(s) Measurement Unit
Milestone (2019)
Target (2023)
Estimated Cost per Job
FTE Jobs created
€680,700 # of FTE Jobs created
# 4 12 55,000
FTE jobs maintained
€680,700 # of FTE jobs maintained
# 12 30 €22,300
These are complemented by output indicators across all of the themes for the FLAG South West.
3.5.3.3 Objectives, Actions and Output IndicatorsThe following tables set out the detail of the intervention logic for the strategy. This includes the indicators which will be used to measure the output of the FLAG South West Programme. In particular, these contain two target values as follows:
lMilestone (2019) – this sets out the proportion of the final target value that is expected to be achieved by the mid-point of the programme in 2019. This will be used to measure the success of the programme during the mid-term review of the overall FLAG Programme and the whole EMFF Programme for Ireland; and
lTarget (2023) – this sets out the final value of the target to be achieved throughout the lifetime of the programme. This is the value that will be used to measure the level of success the programme has been able to achieve overall and will be used for the official programme reporting and evaluation.
LOCAL DEVELOPMENT STRATEGY 2016 | 25
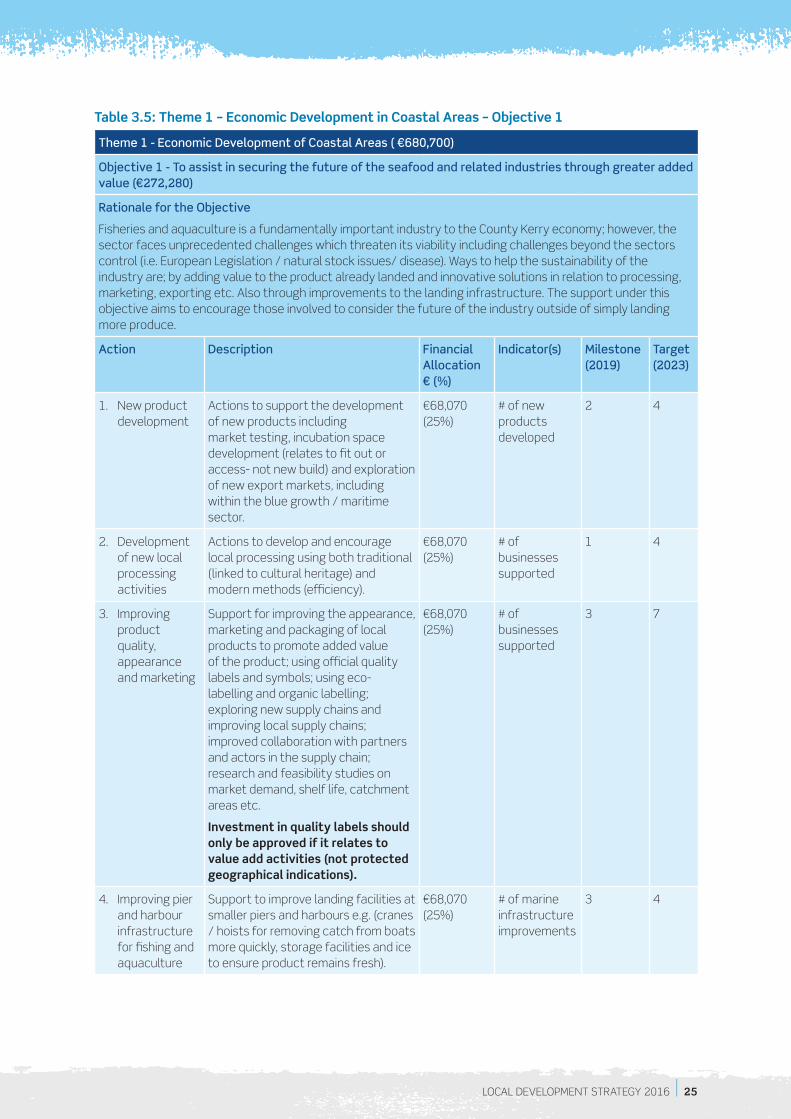
Table 3.5: Theme 1 – Economic Development in Coastal Areas – Objective 1
Theme 1 - Economic Development of Coastal Areas ( €680,700)
Objective 1 - To assist in securing the future of the seafood and related industries through greater added value (€272,280)
Rationale for the Objective
Fisheries and aquaculture is a fundamentally important industry to the County Kerry economy; however, the sector faces unprecedented challenges which threaten its viability including challenges beyond the sectors control (i.e. European Legislation / natural stock issues/ disease). Ways to help the sustainability of the industry are; by adding value to the product already landed and innovative solutions in relation to processing, marketing, exporting etc. Also through improvements to the landing infrastructure. The support under this objective aims to encourage those involved to consider the future of the industry outside of simply landing more produce.
Action Description Financial Allocation € (%)
Indicator(s) Milestone (2019)
Target (2023)
1. New product development
Actions to support the development of new products including market testing, incubation space development (relates to fit out or access- not new build) and exploration of new export markets, including within the blue growth / maritime sector.
€68,070 (25%)
# of new products developed
2 4
2. Development of new local processing activities
Actions to develop and encourage local processing using both traditional (linked to cultural heritage) and modern methods (efficiency).
€68,070 (25%)
# of businesses supported
1 4
3. Improving product quality, appearance and marketing
Support for improving the appearance, marketing and packaging of local products to promote added value of the product; using official quality labels and symbols; using eco-labelling and organic labelling; exploring new supply chains and improving local supply chains; improved collaboration with partners and actors in the supply chain; research and feasibility studies on market demand, shelf life, catchment areas etc.
Investment in quality labels should only be approved if it relates to value add activities (not protected geographical indications).
€68,070 (25%)
# of businesses supported
3 7
4. Improving pier and harbour infrastructure for fishing and aquaculture
Support to improve landing facilities at smaller piers and harbours e.g. (cranes / hoists for removing catch from boats more quickly, storage facilities and ice to ensure product remains fresh).
€68,070 (25%)
# of marine infrastructure improvements
3 4

26 | FLAG SOUTH WEST FISHERIES LOCAL ACTION GROUP
Table 3.6: Theme 1 – Economic Development in Coastal Areas – Objective 2
Theme 1 - Economic Development of Coastal Areas (€680,700)
Objective 2 - To further develop the South West Region as tourist destination through the development of marine based tourism activities focused on extending the season (€272,280)
Rationale for the Objective
Tourism is the largest growth sector for the economy of County Kerry, this increase is based on the regional and national strategies, such as the Wild Atlantic Way, which have created a joined up approach to tourism for the first time. Many of the key tourism assets are linked to the sea and the coastal areas and these are breathing new life into many areas. The continued development and growth of the marine tourism sector is a key driver of economic development in coastal regions which in turn can bring investment in facilities and services e.g. hotels, restaurants and shops but also vital employment opportunities for local people in coastal areas. The support under this objective aims to promote the development of the marine tourism product in coastal areas.
Action Description Financial Allocation € (%)
Indicator(s) Milestone (2019)
Target (2023)
5. Development of Coastal Tourism and water based activities
Support for the development of coastal tourism and water based activities with emphasis on activities that:
lincrease off-season activities and extend the tourism season; and
lencourage people to stay in the area (i.e. increased bed nights).
€217,284 (80%)
# of marine leisure / tourism activities supported
8 15
6. Out of Season Festivals
Support for coastal festivals however all applications to this must contribute to the following criteria
lsupporting locally produced goods; and
lhappen outside the main tourism season.
€54,456 (20%)
# of seafood/marine festivals or events supported
4 10

LOCAL DEVELOPMENT STRATEGY 2016 | 27
Table 3.7: Theme 1 – Economic Development in Coastal Areas – Objective 3
Theme 1 - Economic Development of Coastal Areas (€680,700)
Objective 3 - To increase the economic well-being of coastal areas through diversification and innovation (€136,140)
Rationale for the Objective
Coastal areas, like all rural areas, were more deeply affected by the economic downturn. Linked to this was the closure of many businesses and the migration of many people to urban centres to secure employment. Key to the rejuvenation of coastal areas is the creation of new enterprises and the development of existing enterprises through diversification and innovation, including within the blue growth / maritime sector.
Action Description Financial Allocation € (%)
Indicator(s) Milestone (2019)
Target (2023)
7. Coastal Diversification
Support to encourage entrepreneurship and business startup through support for pilot projects.
€136,140 (100%)
# of businesses supported
5 12
Table 3.8: Theme 2 – Developing the Skills and Knowledge of the Local Coastal Community – Objective 1
Theme 2 - Developing the Skills and Knowledge of the Local Coastal Community (€340,350)
Objective 1 - To build on the knowledge and experience present within fisheries and aquaculture areas to improve the communities economic and social viability (€85,088)
Rationale for the Objective
Those involved in fishing and aquaculture are, by the nature of the industry, highly skilled regarding marine life, eco-systems and bio-toxins as well practical skills such as navigation, boat management etc. There is potential to build on this inherent potential to improve the vibrancy of coastal communities.
Action Description Financial Allocation € (%)
Indicator(s) Milestone (2019)
Target (2023)
8. Developing Skills in Fisheries and Aquaculture Areas
Support for those involved in fishing and aquaculture to partake in: training and upskilling; advanced training and specialist courses; and the development and sharing of basic marine skills in line with the Leech Report. Training supported by the FLAG should complement / not duplicate training already provided by BIM.
€85,088 (100%)
# of participants on training courses
20 40

28 | FLAG SOUTH WEST FISHERIES LOCAL ACTION GROUP
Table 3.9: Theme 2 – Developing the Skills and Knowledge of the Local Coastal Community – Objective 2
Theme 2 - Developing the Skills and Knowledge of the Local Coastal Community (€340,350)
Objective 2 - To promote the fisheries and aquaculture sectors to young people including the promotion of the sector as a career path (€170,175)
Rationale for the Objective
Like many rural and peripheral locations, coastal areas struggle to attract young people who wish to remain in the area to work and live. Partly this is due to a lack of employment opportunities with many leaving for education and not returning, however many young people are not aware of the opportunities within local coastal areas that may be an attraction and encouragement for them to return. However, the fishing and aquaculture community also have significant knowledge of heritage and historic events which have happened in coastal areas. Support under this area will promote the maintenance and sharing of this knowledge.
Action Description Financial Allocation € (%)
Indicator(s) Milestone (2019)
Target (2023)
9. Young People Training in Marine Sectors
Support for young people through grants for taking courses in marine sector skills, and to support young entrepreneurs who have business ideas for coastal areas in line with the Leech Report. Training supported by the FLAG should complement / not duplicate training already provided by BIM.
€68,070 (40%)
# of participants on training courses
5 10
10. Marine, Heritage, Environment and Education
Support for the development of educational resources to enable children and young people to explore and learn about their marine environment /heritage and support for the development of information on the career opportunities related to all aspects of the marine sector.
€102,105 (60%)
# of educational/information schemes
2 5

LOCAL DEVELOPMENT STRATEGY 2016 | 29
Table 3.10: Theme 2 – Developing the Skills and Knowledge of the Local Coastal Community – Objective 3
Theme 2 - Developing the Skills and Knowledge of the Local Coastal Community (€340,350)
Objective 3 - To improve the capacity of fisheries communities in relation to better self-governance (€85,088)
Rationale for the Objective
There is a need to improve the capacity of local fisheries to better govern themselves and to be involved in decision making. Support under this objective aims to provide local fishing and aquaculture groups with the skills and training required to enable better local governance. There was a strong sense of disconnect between authorities and decision makers and local fisheries and aquaculture. Support under this objective aims to improve the linkages and networking between local groups and decision makers.
Action Description Financial Allocation € (%)
Indicator(s) Milestone (2019)
Target (2023)
11. Capacity Building in Fisheries and Aquaculture Organisations
Support for capacity building and training in local fisheries through training in relation to good governance and group management in line with the Leech Report. Training supported by the FLAG should complement / not duplicate training already provided by BIM or available through the Inshore Fisheries Scheme or the Regional / National Inshore Fisheries Forums.
€42,544 (50%)
# of community/user groups with enhanced capacity
20 40
12. Developing the voice of fisheries and aquaculture
Support to improve the co-operation and networking between fisheries and local groups, authorities, agencies and relevant bodies.
€42,544 (50%)
# of community/user groups with enhanced capacity
1 3

30 | FLAG SOUTH WEST FISHERIES LOCAL ACTION GROUP
Table 3.11: Theme 3 – Promoting Social Well-Being, Coastal Cultural Heritage and Environmental Protection – Objective 1
Theme 3 - Promoting Social Well-Being, Coastal Cultural Heritage and Environmental Protection (€340,350)
Objective 1 - To tackle issues related to social isolation and strengthen the resilience and cohesion of coastal areas (€136,140)
Rationale for the Objective
Issues of social isolation are important and often under reported issues impact on the social wellbeing of coastal communities. This objective seeks to support and improve the quality of life and social wellbeing of coastal residents.
Action Description Financial Allocation € (%)
Indicator(s) Milestone (2019)
Target (2023)
13. Improving social cohesion, resilience through community based initiatives which strengthen identity and co-operation of coastal communities
Support for the sustainability and enhancement of existing coastal communities including: targeted collective activities or initiatives for the benefit of the wider coastal community including courses (e.g. CPR and first aid), discussion groups, supports for exchange of knowledge including between older and young generations.
€136,140 (100%)
# of projects which improve quality of life or social well-being
2 4
Table 3.12: Theme 3 – Promoting Social Well-Being, Coastal Cultural Heritage and Environmental Protection – Objective 2
Theme 3 - Promoting Social Well-Being, Coastal Cultural Heritage and Environmental Protection (€340,350)
Objective 2 - To promote & share the rich cultural heritage of fisheries and aquaculture areas to make it accessible to all (€68,070)
Rationale for the Objective
The promotion of cultural heritage is an important area of development for coastal areas in two ways. Firstly, it ensures that the history and heritage of coastal regions is maintained throughout generations strengthening community’s identity and secondly it promotes the local area’s tourism offering which can improve and increase economic activity.
Action Description Financial Allocation € (%)
Indicator(s) Milestone (2019)
Target (2023)
14. Ensuring the survival of coastal heritage & coastal maritime identity
Support for the dissemination of maritime coastal heritage including education, historical events and exhibitions in relation to coastal heritage, information boards and signage in relation to points of interest and of coastal heritage trails.
€68,070 (100%)
# of projects supported to promote local fishing heritage, knowledge and culture
1 2

LOCAL DEVELOPMENT STRATEGY 2016 | 31
Table 3.13: Theme 3 – Promoting Social Well-Being, Coastal Cultural Heritage and Environmental Protection – Objective 3
Theme 3 - Promoting Social Well-Being, Coastal Cultural Heritage and Environmental Protection (€340,350)
Objective 3 - To support the protection of environmental assets (€136,140)
Rationale for the Objective
Whilst there are opportunities to promote and exploit these areas as attractions for tourists there are challenges in relation to the protection and maintenance of these regions as well. Support under this objective aims to protect the coastal and marine environmental assets of the FLAG South West area.
Action Description Financial Allocation € (%)
Indicator(s) Milestone (2019)
Target (2023)
15. Protecting the Environment
Support for: raising awareness of bio-diversity in coastal areas and community based conservation measures in relation to marine coastal environment.
€136,140 (100%)
# of projects supported to enhance environmental conservation, awareness and protection
3 7
Table 3.14: Cross - Cutting Theme - Networking and Co-Operation
Cross-Cutting Theme - Networking and Co-Operation - €50,000
Rationale for the Objective:
The budget for this FLAG includes a provision of €50,000 over the lifetime of the programme for networking and co-operation with other FLAGs nationally and internationally, including the ability to contribute funding to multi-territorial projects where there is a mutual benefit for the involved FLAGs e.g. sharing of best practice, ability to foster a relationship with a comparable European FLAG area and promote trading, learning and knowledge exchange, or to learn from other projects supported by FLAGs across member states.
Action Description Financial Allocation €
Indicator(s) Milestone (2019)
Target (2023)
To support networking and co-operation between FLAGs at a regional, national and international level.
€50,000 (100%)
n/a n/a n/a

32 | FLAG SOUTH WEST FISHERIES LOCAL ACTION GROUP
4 COMMUNITY INVOLVEMENT IN THE DEVELOPMENT OF THE STRATEGY
4.1 IntroductionThis section sets out an overview of community involvement in the development of this strategy including details of public consultation events held (location, attendance at each and the sectors represented) as well as information on stakeholder consultation undertaken to inform the strategy.
This details the number, organisations and categorisation of all of those consulted with in the development of the strategy.
4.2 Overview of Public Consultation EventsThe table below sets out the overview of the public consultation events held
Table 4.1: Consultation Events
Stakeholders to be Involved7 Details
Preliminary interviews with key stakeholders
As part of a strategy development process, interviews were held with a range of key stakeholders8 including those from the statutory sector as well as industry representatives. In addition, FLAG board members had the opportunity to identify relevant stakeholders who were to be included in the consultation process.
Public meetings9
As part of the consultation process during the development of the strategy, public meetings were held in 5 locations within the FLAG Region10. These locations were distributed across the FLAG Region, including other remote locations to ensure that all coastal communities and stakeholders had the opportunity to participate (see map). Approximately 60 people attended these 5 meetings.
7 FARNET GUIDE #1 – A Start-Up Guide for Fisheries Local Action Groups (FLAGS) – Stakeholders.8 Dingle Business Camber; Dingle Peninsula Tourism Alliance; Comharchumann Forbartha Chorca Dhuibhne Teo; Tralee IT;
Northwest Kerry Shellfish Co-op; Tralee Oyster Fishery Society; Cumainn Gleamaigh Chorca Dhuibhne; Iveragh Fisherman’s Co-op; Cromane Community Council; Valentia Harbour Fisheries Society; Valentia Harbour Development Company; Iascairi Intire na Eireann; Inshore Fisheries; Kerry Aquaculture (BIM); Dingle Boat Owners Association; Dingle Marine and Leisure; Skellig Tour Operators; Údarás na Gaeltachta; Sea Synergy Centre; LEO; Kerry Farmer’s Market. Since the consultation took place a number of stakeholders were identified and telephone consultations have been arranged with Taste of Kerry; Shannon Port Company; Fáilte Ireland; Artisan Food.
9 Public meetings should be held to inform the local community and to consult on the strategy development and building of partnership. A series of public information meetings will be held in the FLAG Regions to ensure that all parts of the area have the opportunity to participate. FARNET GUIDE #1 – A Start-Up Guide for Fisheries Local Action Groups (FLAGS).
10 Kenmare, Cahersiveen, Tarbert, Tralee and Dingle.

LOCAL DEVELOPMENT STRATEGY 2016 | 33
4.3 Categories of StakeholdersThe table below categorises the stakeholder who have fed into the strategy, this includes both those who attended public consultation events and those consulted with separately either in individual meetings or telephone consultations. The categories are based on those identified in the Common Provisions Regulation (Article 9).
Table 4.2: Representation from Categories of Stakeholders
Category of Stakeholder Number attending public meetings
Key stakeholder meetings
Competent regional, local, urban and other public authorities 7 (16%) 4 (16%)
Economic and social partners 20 (44%) 10 (40%)
Other relevant bodies representing civil society, including environmental partners, non- governmental organisations and bodies responsible for promoting social inclusion, gender equality and non- discrimination, including, where appropriate, the umbrella organisations of such authorities and bodies.
18 (40%) 11 (44%)
Total 45 (75% of the 60)11 25 (100%)
Source: PACEC 2016
Public engagement is, by its nature, non-discriminatory, in that anyone is welcome to attend. In developing the strategy there are no specific requirements set out in European or national legislation in relation to the proportion of stakeholders to be involved from each category. However, in the interests of facilitating a bottom-up approach it is accepted that good practice is to ensure that those representing civic society and economic and social partners provide the majority of the input and that those representing regional and public authorities should have a lesser role in the development of the strategy.
The table above shows that this has been achieved with 80%+ of those participating in the consultation representing economic and social partners and other relevant bodies representing civic society. Whilst this is no measure of the quality of the input, it does demonstrate that the strategy has been developed from the bottom up.
11 It was not possible to identify and therefore categorise some of those attending public meetings. This is the rationale for the percentage being lower than 100%.

34 | FLAG SOUTH WEST FISHERIES LOCAL ACTION GROUP
5 ACTION PLAN
5.1 IntroductionThis section sets out the Action Plan for FLAG South West demonstrating how the objectives of the strategy are translated into actions. This builds on the work conducted through the public workshop events and the meetings with the FLAG Board and BIM.

LOCAL DEVELOPMENT STRATEGY 2016 | 35
Tabl
e 5
.1: F
LAG
Sou
th W
est
Act
ion
Pla
n –
20
16
/17
Act
ion
Resp
onsi
bilit
yD
ec ‘1
6Ja
nFe
bM
arA
prM
ayJu
neJu
lyA
ugS
epO
ctN
ovD
ec
Ove
rarc
hing
Act
ivit
ies
FLA
G B
oard
Mee
ting
FLA
G B
oard
XX
XX
Dec
ide
Dat
es fo
r Cal
lsFL
AG
Boa
rdX
Trai
ning
Skill
s Tr
aini
ng e
.g. G
over
nanc
e /
Confl
ict
of In
tere
stFL
AG
Boa
rdX
XX
Ass
essi
ng A
pplic
atio
ns T
rain
ing
FLA
G B
oard
/ B
IM C
entr
ally
XX
X
Mon
itorin
g an
d Ev
alua
tion
Tra
inin
gFL
AG
Boa
rd/
BIM
Cen
tral
lyX
XX
PR /
Ani
mat
ion
/ Co
mm
unic
atio
n Tr
aini
ngFL
AG
Boa
rd/
BIM
Cen
tral
lyX
XX
PR /
Ani
mat
ion
/ C
omm
unic
atio
n
PR /
Com
mun
icat
ion
FLA
G B
oard
XX
XX
Ani
mat
ion
/ Pu
blic
Wor
ksho
psFL
AG
Boa
rdX
XX
X
Init
iati
on o
f C
all
Cal
l Pub
licit
y/A
nim
atio
nFL
AG
Boa
rdX
XX
XX
X
Ope
n C
all
FLA
G B
oard
XX
XX
Clos
e C
all
FLA
G B
oard
XX
XX
Ass
essm
ent
Proc
ess
Ass
essm
ent
Aga
inst
Elig
ibili
ty C
riter
iaB
IMX
XX
Ass
essm
ent
Aga
inst
Crit
eria
FLA
G T
echn
ical
&
Inve
stm
ent
Com
mit
tee
XX
X
Reco
mm
enda
tion
s ap
prov
ed/r
ejec
ted
FLA
G B
oard
XX
X
Issu
e Re
ject
ion
Lett
ers
FLA
G B
oard
via
BIM
XX
X
Issu
e Lo
Os
FLA
G B
oard
via
BIM
XX
X
Mon
itorin
g &
Eva
luat
ion
Proj
ect
mon
itorin
gFL
AG
Boa
rd /
BIM
XX
Post
Pro
ject
Eva
luat
ion
Exte
rnal
X
Stra
tegy
Rev
iew
FLA
G B
oard
/ B
IMX
X

36 | FLAG SOUTH WEST FISHERIES LOCAL ACTION GROUP
Tabl
e 5
.2: F
LAG
Sou
th W
est
Act
ion
Pla
n –
20
18
- 2
02
2
Act
ion
Resp
onsi
bilit
yJa
nFe
bM
arA
prM
ayJu
neJu
lyA
ugS
epO
ctN
ovD
ec
Ove
rarc
hing
Act
ivit
ies
FLA
G B
oard
Mee
ting
FLA
G B
oard
XX
XX
Dec
ide
Dat
es fo
r Cal
lsFL
AG
Boa
rdX
PR /
Ani
mat
ion
/ C
omm
unic
atio
n
PR /
Com
mun
icat
ion
FLA
G B
oard
XX
XX
Ani
mat
ion
/ Pu
blic
Wor
ksho
psFL
AG
Boa
rdX
XX
X
Init
iati
on o
f C
all
Cal
l Pub
licit
y/A
nim
atio
nFL
AG
Boa
rd /
BIM
XX
XX
X
Ope
n C
all
FLA
G B
oard
/ B
IMX
XX
X
Clos
e C
all
FLA
G B
oard
/ B
IMX
XX
X
Ass
essm
ent
Proc
ess
Ass
essm
ent
Aga
inst
Elig
ibili
ty C
riter
iaB
IMX
XX
Ass
essm
ent
Aga
inst
Crit
eria
FLA
G T
echn
ical
& In
vest
men
t Co
mm
itte
eX
XX
Reco
mm
enda
tion
s ap
prov
ed/r
ejec
ted
FLA
G B
oard
XX
X
Issu
e Re
ject
ion
Lett
ers
FLA
G B
oard
via
BIM
XX
X
Issu
e Lo
Os
FLA
G B
oard
via
BIM
XX
X
Mon
itor
ing
& E
valu
atio
n
Proj
ect
mon
itorin
gFL
AG
Boa
rd /
BIM
XX
Post
Pro
ject
Eva
luat
ion
Exte
rnal
X
Stra
tegy
Rev
iew
FLA
G B
oard
/ B
IMX
X
Net
wor
king
and
Co-
Ope
rati
on
Co-o
pera
tion
FLA
G B
oard
XX
Net
wor
king
FLA
G B
oard
XX

LOCAL DEVELOPMENT STRATEGY 2016 | 37
6 FINANCIAL PLAN
6.1 Total budgetThe overall allocation for the FLAG Programme across all seven FLAG Regions is €12m. This is considerably greater than the total investment (direct and indirect) delivered to coastal communities by the previous FLAG previous programme, an approximately eight-fold increase. The previous programme made over €1.5 million available via direct and indirect investment over the period 2012-2015.
The allocation for FLAG South West is €1.53m, this is across the 6 years that the programme will be operational (i.e. from 2017 -2022). The tables in this section profile budget for the FLAG South West.
The proposed budget reflects the Board’s investment strategy based on information available at the time of developing the strategy and appropriate use of FLAG funds to address identified needs.
The FLAG Board will keep the budget, funds committed and funds spent under regular review. It will also take into account demand for funding and project pipeline as well as external factors which emerge in the FLAG area over the course of the FLAG programme. Based on this information, the FLAG Board will consider the need to transfer funds between themes, objectives and actions as required and in such situations, will put forward a proposed reallocation supported by a robust rationale to BIM Head Office for approval.
6.2 Rationale for SpendThe use of the financial resources in relation to the proposed actions have been robustly justified through:
lA bottom-up process seeking feedback and input from local stakeholders;
lA robust review of socio-economic data.
The evidence collected in this way has been used to build and shape the objectives, actions and outputs for the programme. The budgetary allocation across each areas has also been determined by taking into account:
lThe need for the type of intervention;
lThe indicative project pipeline;
lThe anticipated size and scale of projects to be supported (i.e. infrastructure projects attributed more given capital and large nature compared to perhaps training which requires less investment).
6.3 Allocation of total budget between Project and Administration SpendTable 6.1 profiles the FLAG budget by project (i.e. grant aid for projects) and administration (i.e. supporting the operation of the programme) spend by year.

38 | FLAG SOUTH WEST FISHERIES LOCAL ACTION GROUP
Table 6.1: Summary Sheet
2017 (€) 2018 (€) 2019 (€) 2020 (€) 2021 (€) Total (€)
Implementation of Operations / Projects under the LDS
Theme 1: Economic Development of Coastal Areas
€136,140 €170,175 €170,175 €136,140 €68,070 €680,700
Theme 2: Developing the Skills and Knowledge of the Local Coastal Community
€68,070 €68,070 €68,070 €68,070 €68,070 €340,350
Theme 3: Promoting Social Well-Being, Coastal Cultural Heritage and Environmental Protection
€68,070 €68,070 €68,070 €68,070 €68,070 €340,350
Cross Cutting Theme – Networking and Co-operation.
€10,000 €10,000 €10,000 €10,000 €10,000 €50,000
Sub-Total €282,280 €316,315 €316,315 €282,280 €214,210 €1,411,400
FLAG Administration and Animation Costs
Overall Admin Costs €23,720 €23,720 €23,720 €23,720 €23,720 €118,600
Total € 306,000 € 340,035 € 340,035 € 306,000 €237,930 €1,530,000
6.4 Project Spend by Theme, Objective and YearTable 6.2 considers project spend in more detail setting out the budget by theme and objective across the programme period.

LOCAL DEVELOPMENT STRATEGY 2016 | 39
Table 6.2: Implementation of Operations / Projects under the LDS
2017 (€) 2018 (€) 2019 (€) 2020 (€) 2021 (€) Total (€)
Implementation of Operations / Projects under the LDS
Theme 1: Economic Development of Coastal Areas
Objective 1: To assist in securing the future of the seafood and related industries through greater added value
€54,456 €68,070 €68,070 €54,456 €27,228 €272,280
Objective 2: To further develop the South West Region as tourist destination through the development of marine based tourism activities focused on extending the season
€54,456 €68,070 €68,070 €54,456 €27,228 €272,280
Objective 3: To increase the economic well-being of coastal areas through diversification and innovation
€27,228 €34,035 €34,035 €27,228 €13,614 €136,140
Sub-Total €136,140 €170,175 €170,175 €136,140 €68,070 €680,700
Theme 2: Developing the Skills and Knowledge of the Local Coastal Community
Objective 1: To build on the knowledge and experience present within fisheries and aquaculture areas to improve the communities economic and social viability
€17,018 €17,018 €17,018 €17,018 €17,018 €85,088
Objective 2: To promote the fisheries and aquaculture sectors to young people including the promotion of the sector as a career path
€34,035 €34,035 €34,035 €34,035 €34,035 €170,175
Objective 3: To improve the capacity of fisheries communities in relation to better self-governance
€17,018 €17,018 €17,018 €17,018 €17,018 €85,088
Sub-Total €68,071 €68,071 €68,071 €68,071 €68,071 €340,350
Theme 3: Promoting Social Well-Being, Coastal Cultural Heritage and Environmental Protection
Objective 1: To tackle issues related to social isolation and strengthen the resilience and cohesion of coastal areas
€27,228 €27,228 €27,228 €27,228 €27,228 €136,140
Objective 2: To promote & share the rich cultural heritage of fisheries and aquaculture areas to make it accessible to all
€13,614 €13,614 €13,614 €13,614 €13,614 €68,070
Objective 3: To support the protection of environmental assets
€27,228 €27,228 €27,228 €27,228 €27,228 €136,140
Sub-Total €68,070 €68,070 €68,070 €68,070 €34,035 €340,350
Cross Cutting Theme – Networking and Co-operation.
Networking and Co-operation. €10,000 €10,000 €10,000 €10,000 €10,000 €50,000
Sub-Total €10,000 €10,000 €10,000 €10,000 €10,000 €50,000
Total €282,280 €316,315 €316,315 €282,280 €214,210 €1,411,400

40 | FLAG SOUTH WEST FISHERIES LOCAL ACTION GROUP
6.5 Administration SpendAnother important element of the budget is the administration spend. At present this is set at a maximum of 10% of the grant aid spend across the programme period. This will be used to cover necessary administration to support the FLAG to deliver on its role. This includes communication / PR, evaluation, monitoring, buying in services, travel and subsistence for FLAG board members, networking and co-operation, etc.
Article 35 of the Common Provisions Regulation states what can be supported under the Administration budget.
“Support from the ESI Funds concerned for community-led local development shall cover:
l(d) running costs linked to the management of the implementation of the community-led local development strategy consisting of operating costs, personnel costs, training cost, costs linked to public relations, financial costs as well as the costs linked to monitoring and evaluation of that strategy as referred to in point (g) of Article 34(3);
l(e) animation of the community-led local development strategy in order to facilitate exchange between stakeholders to provide information and to promote the strategy and to support potential beneficiaries with a view to developing operations and preparing applications.
lSupport for running costs and animation as referred to in points (d) and (e) of paragraph 1 shall not exceed 25 % of the total public expenditure incurred.”
The breakdown of administration spend is detailed in Table 6.3.
Table 6.3: Administration and Animation Costs
2017 (€) 2018 (€) 2019 (€) 2020 (€) 2021 (€) Total (€)
FLAG Administration and Animation Costs
Communication / Publicity / Advertising12
€2,220 €2,220 €2,220 €2,220 €2,220 € 11,100
Meeting Facilitation13 €3,000 €3,000 €3,000 €3,000 €6,000 € 15,000
Travel & Subsistence14 €6,000 €6,000 €6,000 €6,000 €6,000 €30,000
Buying in service/person15 3,000 3,000 3,000 3,000 3,000 € 15,000
Labour Replacement Costs16 €9,500 €9,500 €9,500 €9,500 €9,500 € 47,500
Total €23,720 €23,720 €23,720 €23,720 €23,720 € 118,000
12 Budget for communication, publicity and advertising is based on the acknowledgement that all common activity in relation to this (i.e. communication, publicity and advertising that is common to all FLAGS) will be covered centrally by BIM. The FLAG Board have remit to conduct their own individual activity in relation to this area and a budget has been set. The FLAG anticipates expenditure of approximately €3,000 per annum for communication, publicity and marketing; this may include printing informational materials, local news and radio advertising, signposting calls for applications, photography, content creation for the website, and events to showcase successful projects.
13 Includes allowance for meeting room hire, refreshments and one meal allowance for Board members in attendance. This is anticipated to cost approximately €300 per meeting, subject to attendance. This is capped at €3,000 per annum.
14 The rates paid for all travel and subsistence costs are based on the following rates: 0.3125c per km, lunch – up to €15, Dinner – up to €30 and overnight accommodation costs of up to €70. Mileage expenses will be payable in full to all board members attending FLAG Board meetings excluding those who can re-coup mileage expenses through their own organisation or employer. The Travel and Subsistence budget is based upon six FLAG Board meetings per year, and includes provisions that travel, hotels and accommodation may be reflected within this budget line where appropriate for meetings external to the regular board meetings.
15 The FLAG cannot legally hire a member of staff; however, it has the right to commission an individual(s) on a consultancy basis to support with the administration of the FLAG. This budget assumes such a commission may take place for approx. 10 days per annum at €300 per day. This is capped at €3,000 per annum.
16 Labour Replacement Costs have been agreed at a National FLAG Level to be an important part of the administration expenditure to ensure continued engagement with the FLAG Programme. Labour Replacement costs will be paid to voluntary board members, who, through attendance at a FLAG Board meeting, lose their normal income (i.e. this Labour Replacement Cost is specifically for those involved in the fisheries, aquaculture and in some specific instances other marine industries.) The LRC is payable to a maximum of €200 per day assuming that a full 8 hour day has been completed. In addition the payment is not payable if – FLAG Board meetings are not held during the day or they are held on a day when board members would not normally be working or earning an income. In these instances when LRC is not payable members are still eligible for travel and subsistence payments. In line with similar structures (RIFF), the Board will reserve budget for payment of approximately nine members for five meetings (i.e. up to 45 payments of this kind per annum, totalling to €9,500 per annum.

LOCAL DEVELOPMENT STRATEGY 2016 | 41
In comparison, the previous (pilot) programme incurred admin spend of around €165K across 6 FLAGs (which equates to around 11% of the previous programme budget of €1.5m). This included strategy development costs, T&S, Networking events costs, advertising for project calls, etc. However the current programme is of a larger scale and is split across 7 rather than 6 FLAGs.
6.6 Mobilisation of Other ResourcesAn important element of the FLAG programme is the imperative to mobilise other resources both financial and human.
Financial resources: This is facilitated by grant aid intensity rates which vary by type of applicant as outlined in the table below.
Table 6.4: Grant Aid Intensity Rates
Beneficiary Project Type Maximum support
rate %
Maximum Aid per project
Total Investment
1 Public bodies e.g. State agencies or Local Authorities
Public good projects 100% €200,000 €200,000
2 Community Groups (non commercial) and Registered Charities
All 80% €200,000 €200,000
3 SSCF vessels owners or collective thereof
Investment ashore adding value directly related to SSCF fisheries
80% €80,000 €100,000
4 Collectives and co-operatives Related to seafood 60% €100,000 €166,666
5 Seafood & Marine Enterprises* (incl. sole traders)
Related to seafood or marine sector and diversification
50% €100,000 €200,000
6 Enterprises* & sole traders outside seafood sector
All 40% €50,000 €125,000
7 FLAG All 100% €100,000 €100,000
*Micro-enterprise means a person(s) carrying on a business, including but not limited to sole traders, partnerships, limited companies and cooperatives, and having less than 25 employees (FTE) and turnover of less than €5 million per annum. Definitions wrt thresholds between processing and aquaculture schemes to be confirmed following further discussion. Source: FLAG Grant Rates Final - BIM 14 November 2016
These rates mean that for most applications other resources, finance and human, will need to be mobilised to see the successful completion of the project. This in turn will ensure that the FLAG programme will leverage in additional private investment into the region. It is important to note that in all cases match funding cannot come from another European Funding Programme (i.e. LEADER cannot match fund FLAG) or from statutory monies (i.e. council cannot match fund a FLAG project). However, match funding can be private monies including bank loans and other private funding mechanisms; however the private match funding must be secured at the time of application. Given the variable grant rates available it is difficult to estimate the value of the additional private investment that could be generated by the programme. However, PACEC estimate that this will be in the region of €612,63017.
17 This is calculated on the assumption that the majority of those apply under Theme 1: Economic Development of Coastal Area will be applying for the 50%, 60% or 80% grant rates; that those applying under Themes 2 – 4 will be applying under the 60% or 100% grant rates.

42 | FLAG SOUTH WEST FISHERIES LOCAL ACTION GROUP
Human Resources: There is also significant scope for the mobilisation of human resources both those involved in the project application (i.e. volunteers involved in community groups and initiatives) as well as FLAG board members. The time invested by voluntary FLAG Board members is not insignificant. Whilst this will depend on the number of meetings, calls for applications and application received as well as other Board member duties including PR, monitoring and evaluation, it is expected to be in the region of 10-15 days per board member per year across the life-span of the programme.

LOCAL DEVELOPMENT STRATEGY 2016 | 43
7 The Fisheries Local Action Group
7.1 Organisation Details
Table 7.1: Organisation Details
Element Detail
Organisation Details Fisheries Local Action Group South West
Primary Contact Details Contact Name: Vera O’Donovan
Website: TBC
Role: FLAG SW Co-ordinator
Address: BIM Office, An Chúilín, Daingean Uí Chúis, Co Chiarraí
Email: [email protected]
Direct: +353 (0) 66 915 0909
Mobile: +353 (0) 87 224 6518
Date of FLAG Establishment December 2016
Legal Structure The Fisheries Local Action Group is the South West Fisheries Local Action Group with Bord Iascaigh Mhara fulfilling the role of Financial Partner and Implementation Partner.
7.2 FLAG Composition and Decision Making
7.2.1 Basis for FLAG MembershipNumber of Members: At any given time, it is expected that overall board membership will not be less than ten and not more than seventeen members, but may evolve to ensure that there is democratic accountability across the programme area.
Sectoral Representation: The FLAG comprises public and private partners from the defined geographical areas and includes representatives from different sectors of the local economy/ community that reflect the main focus of the strategy and the socio-economic composition of the area through a balanced representation of the main stakeholders, including private sector, public sector and civil society and ensure a significant representation of the fisheries and/or aquaculture sectors. In keeping with Article 58 of the EMFF Regulation18 508/2014 and Article 32 (2) (b) of the Common Provisions Regulation19, it is important that no single interest group has more than 49% of the voting rights in the decision-making. It is recommended that membership of the FLAG should have a maximum of 40% representation from the Statutory/Public Sector20 and a minimum of 60% representation from the fishing, seafood, coastal communities sector21. The balance of organisational representation will be retained throughout the replacement/ rotation process.
18 Article 58 of the EMFF Regulation 508/2014: “Community-led local development should be implemented through a bottom-up approach by local partnerships that are composed of representatives of the public, private and civil society sectors and that reflect correctly the local society. Those local actors are best placed to draw up and implement multisectoral community-led local development strategies to meet the needs of their local fisheries area. It is important to ensure that no single interest group has more than 49 % of the voting rights in the decision-making bodies of Fisheries local action groups (FLAGs).”
19 Article 32 (2) (b) of the CPR 1303/2013: “2. Community-led local development shall be: (b) led by local action groups composed of representatives of public and private local socio-economic interests, in which, at the decision-making level neither public authorities, as defined in accordance with national rules, nor any single interest group represents more than 49 % of the voting rights;”
20 These are likely to include Údarás na Gaeltachta, County Councils including LEOs, Education and Training Boards, LEADER LAGs, Fáilte Ireland, and Enterprise Ireland, among others deemed as statutory.
21 This can include representatives or individuals within the fishery, aquaculture or processing sectors; as well as representatives from the community and voluntary sector.

44 | FLAG SOUTH WEST FISHERIES LOCAL ACTION GROUP
Gender Balance: In line with Government Policy the gender balance on FLAG boards is to be at least 40% female22. In the previous FLAG programme, the Policy was to ensure that at least 30% of committee members23 were female and whilst some met this requirement, not all did. Ideally, during the lifetime of the strategy, if at any stage the gender balance does not reflect at least 40% female, the FLAG Board will actively try to recruit suitably qualified female volunteers. To help to achieve this, all nominating bodies will, in future, be asked to nominate two candidates, one male and one female, to the FLAG for any vacant position; in addition, assistance will be sought from respective Public Participation Networks24 (PPN) in identifying appropriate female candidates for any relevant vacancy on the FLAG. This commitment to gender balance will also apply to relevant sub-committees.
Declaration of Interests: All FLAG members will, on appointment, declare their employment status, all business interests and community and voluntary involvement which might involve a conflict of interest or might materially influence the FLAG member in relation to the performance of their duties.
Term of membership: The FLAG Board members will commit to implementing the objectives of the FLAG Local Development Strategy, and will act as a focal point for consultations, implementation and delivery, and promotion of the FLAG. To ensure continuity, appointed members shall remain in place until the end of the current programme.
Annual Review of Membership: The FLAG shall carry out an annual internal review of the membership to account for any change to FLAG objectives or actions, where this is appropriate e.g. where the strategic need for member organisations has been satisfied or new member organisations are required to meet a specific Local Development Strategy need or member organisations are not attending on a regular basis.’
22 Consistent with approach in LEADER Local Development Strategies and reflects aspirations in government policy on gender parity e.g.: Towards Gender Parity in Decision-Making in Ireland – An Initiative of the National Women’s Strategy 2007-2016 (2013)
23 http://www.bim.ie/media/bim/content/newsandevents/START%20UP%20GUIDE%20FOR%20FISHERIES%20LOCAL%20ACTION%20GROUPS.pdf )
24 Public Participation Networks are the chosen method for recruiting community representatives to the FLAG Board.

LOCAL DEVELOPMENT STRATEGY 2016 | 45
7.2.2 Experience and Expertise of FLAG MembersThe FLAG South West has 13 members, and is representative of a wide range of sectors and areas. The table below sets out the current membership of the FLAG.
Table 7.2: FLAG Members - Experience25
Organisation Member Sector25 Area Experience
Mid Kerry Draft nets Assoc.
Denis Teahan
Private Fishing Aquaculture
Denis is an active member of the Mid Kerry Draft Net Association whom he represents at the Fishery District Committee on behalf of the licensed draftnets men in Cromane. He depends on aquaculture in Castlemaine Harbour and has worked in this industry for the last 30 years. He is also a member of Castlemaine Harbour Co-op. He has a first-hand experience of the dependence of his community on fishing and aquaculture.
Tralee Oyster Fishery Society
Denis O’Shea
Private Aquaculture Denis has a biological background and has worked with Tralee Oyster Fishery Society for over 25 years as manager. He represents TOFS on local and national issues and is a proponent of the fishing and aquaculture industry in Kerry. He is based in North Kerry and acutely aware of the importance of public fishing resources such as Tralee Oyster Fishery to the community in north and mid Kerry.
SW RIFF Edward Moore
Private Fishing industry Eddie fishes out of Smerbhic Harbour and Dingle having with over 30 years’ experience. He participated in the brown Crab LAC and is now the Chair of the SW RIFF. He is an active member of Chumainn Gleamaigh Chorca Dhuibhne. He is familiar with the challenges facing coastal communities.
Iveragh Fisherman’s Co-op
Joe O’Shea Private Fishing industry Joe is a longstanding member of Iveragh Fisherman’s’ Co-op and also the IFPO. He fishes out of Cahersiveen & has fished all over Ireland. He represented the Co-op on the last FLAG SW 2013-15 and has great interest in the development of the fishing industry.
Údarás na Gaeltachta
Máire Ní Shé Public Business Development
Máire works in Business Enterprise Development in the Kerry and Cork Gaeltacht. She has been an active and engaged member of the last FLAG SW 2013-2015 representing local development from the public perspective in Gaeltacht areas. She has a strong awareness of the challenges facing coastal communities through her work.
LEADER TBC Public Community Representation
TBC
25 As per Article 5 of CPR: private sector (fisheries and/or aquaculture sectors), public sector, civil society.

46 | FLAG SOUTH WEST FISHERIES LOCAL ACTION GROUP
Organisation Member Sector25 Area Experience
Castlemaine Harbour Co-op
Liam O’Connor
Private Aquaculture Liam is treasurer with Castlemaine Harbour Fisheries Cooperative Society Ltd. Which operates the collective management of the Mussel Order Area, to maximise the output and the collective benefit to the community for 57 permit holders who grow mussels producing a harvest of significant economic and social benefit to the area. He has 30 year experience in shellfish growing.
NW Kerry Shellfish Co-op
Seamus O’Grady
Private Fishing industry Seamus was the Co-ops representative on the last FLAG SW and brings that experience with him to the current FLAG. He represents NWKS Co-op on the SW RIFF and is also an active member of TOFS.
Sneem Fisherman’s Co-op
Stephen Casey
Private Aquaculture & Fishing
Stephen is an active member of Sneem Fisherman’s Co-op. They successfully ran a collaborative project with the aid of the FLAG SW during the last programme. He represents the Co-op whose members are dependent on aquaculture and fishing in South Kerry.
Local Enterprise Office
Tomas Hayes
Public Business Development
Tomás is CEO of the Local Enterprise Office working to generate sustainable jobs by encouraging and supporting entrepreneurial activity in county Kerry. He has an in-depth understanding of coastal communities as a result of his involvement in oyster farming In addition to active and engaged involvement in the previous FLAG SW 2013-2015.
Mara Beo Kevin Flannery
Civic Environment Kevin is a long time campaigner on biodiversity and environmental issues. He was the Chair of the previous FLAG SW 2013-2015 and holds a position on OPMC. Through his work with Mara Beo he has a unique appreciation of the environmental and tourism issues as they pertain to coastal communities. He is also a member of the SW RIFF.
Kerry LCDC William Morrell
Civic LEADER NEWKD Kerry PPN
William is the Vice Chair of Kerry County Local Community Development Committee and is their nomination to the FLAG board. Over the last decade he has gained a vast amount of Community development experience and knowledge in Kerry through his work with NEWKD, Community Awards, Public Participation Network, Recreation and Sports Partnership and Community & Voluntary Forum. His understanding of issues facing people will be an asset to coastal communities in the FLAG SW area.
Kerry LCDC TBC Public LEADER Rural Development
TBC

LOCAL DEVELOPMENT STRATEGY 2016 | 47
In accordance with Regulation26 in relation to Fisheries Local Action Groups (FLAGs) it is desirable that the FLAG Board has balanced representation from all relevant sectors and industries to broadly reflect the main focus of their strategy and the socioeconomic composition of the area. At the time of writing the FLAG Board are still working to fill some gaps in the skills, experience and expertise on the FLAG Board. In particular the following issues are noted:
l The FLAG has 5 representatives from the fisheries sector and 4 representatives from the aquaculture sector. It is recognised that these proportions are reflective of the sectors in the FLAG region.
lWhile the FLAG does not have a tourism representative sitting on the Board, the FLAG Board recognise the importance of this sector as well as the need for input from tourism representatives in project scoring and decision making. In instances were expertise are required in relation to tourism the FLAG Boards have put in place a mechanism for accessing tourism expertise by which tourism representatives (e.g. Fáilte Ireland) will make written submissions to information / feedback requests from the FLAG Board. This mechanism will ensure that tourism is adequately represented as part of the FLAG Board.
lIt is recognised that the FLAG Board does not have sufficient representation in terms of training. The FLAG Board are working, through the recruitment of new members, to address this issue, although it is noted that potential members must to be nominated by parent organisations and have a mandate to act on their behalf.
In addition, it is recognised that the FLAG Board members have a greater role to play in the implementation of the 2014-2020 FLAG Programme and that capacity building training will be vital to the successful implementation of the FLAG programme. To equip and support Board members to effectively fulfil their role, a number of actions are planned:
lA training syllabus has been developed – this details a programme of relevant training which will be delivered to address the identified training needs of FLAG Board members; and
lBIM intend to host at least 2 national networking events annually, this will provide an opportunity for networking and the sharing of good practice amongst the Irish FLAGs which in turn will help develop the capacity of board members.
7.2.3 Decision Making Structure and ProceduresThe FLAG Board is representative of a wide range of sectors and areas thus providing for effective and accountable decision making. As the core decision-makers, members of the FLAG Board are responsible for the proposal of a community-led local development strategy and are responsible for its implementation27. This means that they are key in fulfilling the financial, strategic, policy and promotion remit of the FLAG, with support at the administrative level by DAFM and BIM. This will enable the FLAG to deliver the LDS from the bottom-up, consistent with the CLLD approach28.
The FLAG will adhere to all required local, national, and European guidance and requirements within decision making, and will fully support principles of human rights, equality and social justice.
The FLAG has a review and decision making role with regard to the implementation of individual, community, and social benefit projects. The FLAG will operate in accordance with relevant FLAG programme operating rules, as set out within the Procedures Manual.
It is expected that decisions will be made on a consensus basis, and where this is not possible, votes will be cast in accordance with the Committee Standing Orders. Decision-making procedures will be representative, and that no sector may have more than 49% of voting rights at any such times29 to protect accountability. The FLAG Board will be assisted by the implementing partners in its capacity to make recommendations for decision-making and provision of awards.
Ultimately, the FLAG Board will recommend projects for funding subject to final confirmation by BIM.
26 REGULATION (EU) No 508/2014, Article 61.27 Regulation (EU) 508/2014 (EMFF) - Article 61.28 Regulation (EI) 1303/2013 (CPR) – Article 3229 Regulation (EU) 1303/2013, Common Provisions Regulation - Article 32 and also Regulation (EU) 508/2014, European
Maritime and Fisheries Fund Regulation – Article 58

48 | FLAG SOUTH WEST FISHERIES LOCAL ACTION GROUP
BIM also plays a role in the project selection process at the eligibility check stage which is final in the absence of further information or clarification which might allow such a decision to be appealed.
7.2.4 Frequency of FLAG MeetingsThe number of meetings to be held by the FLAG depends on a number of factors including how many calls there will be per year and how often the board need to meet for assessing projects, monitoring and evaluation purposes. In addition there may be different cycles of meetings with the whole FLAG Board meeting a different number of times per year to any sub-groups or sub-committees established.
Guidance from FARNET, Managing Effective Partnerships30, suggests that from experience that FLAG Boards should be between four and five times a year, depending on the number of project applications submitted. Making a calendar of meetings well in advance helps to ensure good attendance at meetings as it is often difficult to arrange meetings at short notice for a large number of busy people.
In line with governance good practice, minutes should be recorded and circulated in advance of each subsequent meeting.
30 FARNET Guide 4 – Steps for Success - Managing Effective Partnerships https://webgate.ec.europa.eu/fpfis/cms/farnet/files/documents/EN_GUIDE_4_4-16.pdf


P.O. BOX 9799Bord Iascaigh Mhara,Crofton Road,Dún Laoghaire,County Dublin,A96E5A0
Tel: +353 1 214 4100Fax: + 353 1 230 0564 Email: [email protected]
www.bim.ie 2017