fiscal policy for the crisis - imf.org · fiscal policy for the crisis spn/08/01 december 29, ......
TRANSCRIPT
I N T E R N A T I O N A L M O N E T A R Y F U N D
I M F S T A F F P O S I T I O N N O T E
Antonio Spilimbergo, Steve Symansky, Olivier Blanchard, and Carlo Cottarelli
Fiscal Policy for the Crisis
SPN/08/01
December 29, 2008

INTERNATIONAL MONETARY FUND
Fiscal Policy for the Crisis1
Prepared by the Fiscal Affairs and Research Departments (Antonio Spilimbergo, Steve Symansky, Olivier Blanchard, Carlo Cottarelli)
December 29, 2008
CONTENTS PAGE
Executive Summary...................................................................................................................2
I. Introductory Remarks .............................................................................................................2
II. Fiscal Policy in Financial Crises—Lessons From History ...................................................4
III. Composition of a Fiscal Stimulus ........................................................................................4 A. Public Spending on Goods and Services...................................................................5 B. Fiscal Stimulus Aimed at Consumers .......................................................................6 C. Fiscal Stimulus Aimed at Firms ................................................................................7
IV. Sustainability Concerns .......................................................................................................7 A. Some Proposals for Discussion.................................................................................9
V. A Collective International Effort ........................................................................................11
VI. Conclusion .........................................................................................................................12
Appendix I: Spending and Revenue Measures ........................................................................13
Appendix II: Fiscal Multipliers—A Review of the Literature.................................................17
Appendix III: Five Case Studies of Fiscal Policy During Financial Crisis .............................22 A. Great Depression and Fiscal Policy ........................................................................22 B. Japan: Banking Crisis in 1997.................................................................................24 C. Korea: Economic Crisis in 1997 .............................................................................26 D. Savings and Loan (S&L) Crisis in the US (1980s–1990s) .....................................29 E. The Nordic Banking and Economic Crises .............................................................32
1 This note has benefited from contributions by Oya Celasun, Lone Christiansen, Borja Gracia, Anna Ivanova, Daehaeng Kim, Chris Papageorgiou, Martin Schindler, Steve Tokarick, and Thierry Tressel. This note includes three attachments on: (1) specific revenue and spending measures; (2) the size of fiscal multipliers; and (3) historical evidence on fiscal policies during banking crises (Korea, Japan, Nordic countries, Savings and Loans, Great Depression).
2
EXECUTIVE SUMMARY
The current crisis calls for two main sets of policy measures. First, measures to repair the financial system. Second, measures to increase demand and restore confidence. While some of these measures overlap, the focus of this note is on the second set of policies, and more specifically, given the limited room for monetary policy, on fiscal policy. The optimal fiscal package should be timely, large, lasting, diversified, contingent, collective, and sustainable: timely, because the need for action is immediate; large, because the current and expected decrease in private demand is exceptionally large; lasting because the downturn will last for some time; diversified because of the unusual degree of uncertainty associated with any single measure; contingent, because the need to reduce the perceived probability of another “Great Depression” requires a commitment to do more, if needed; collective, since each country that has fiscal space should contribute; and sustainable, so as not to lead to a debt explosion and adverse reactions of financial markets. Looking at the content of the fiscal package, in the current circumstances, spending increases, and targeted tax cuts and transfers, are likely to have the highest multipliers. General tax cuts or subsidies, either for consumers or for firms, are likely to have lower multipliers.
I. INTRODUCTORY REMARKS
1. The current crisis, which started in the housing and financial sectors, has now led to a strong fall in aggregate demand. There are indications that this fall could be larger than in any period since the Great Depression. A successful policy package should address both the financial crisis and the fall in aggregate demand, and thus, should have two components: one, aimed at getting the financial system back to health; the other, aimed at increasing aggregate demand. There are obvious interactions and synergies between the two. Financial measures, from recapitalization to asset purchases, have important implications for credit flows and aggregate demand. Measures to support aggregate demand, for example by helping homeowners and improving the housing market, have clear implications for the health of financial institutions. Nevertheless, our focus in this note will be primarily on measures aimed at sustaining aggregate demand (Financial measures have been, and will be, the subject of other notes.)
2. The fall in aggregate demand is due to a large decrease in real and financial wealth, an increase in precautionary saving on the part of consumers, a wait and see attitude on the part of both consumers and firms in the face of uncertainty, and increasing difficulties in obtaining credit. A further fall in demand will increase the risk that the perverse dynamics of deflation, rising debt, and associated feedback loops to the financial sector, may materialize.
3. Two macroeconomic policies often used to support aggregate demand are less effective in the current environment. First, while each single country can, on its own, adopt
3
an export-led recovery strategy, this is clearly not an option open to the world as a whole.2 Second, the financial nature of the crisis weakens the traditional monetary transmission mechanism. Furthermore, many countries have already used monetary expansion, and the room to lower central bank policy rates is limited. In these countries, the role of monetary policy should be to support the fiscal stimulus by avoiding increases in the policy interest rate until output begins to recover. (This statement refers to traditional monetary policy, and the use of the policy rate, not to less traditional dimensions, such as quantitative easing. We think of quantitative easing, that is, direct intervention by the central bank in dysfunctional financial markets, as part of the financial measures, and do not discuss it further in this note. We return, however, to related policies in the last part of the note.)
4. In these circumstances, the Managing Director of the IMF has called for a sizable fiscal response at the global level. Its precise magnitude should depend on the extent of the expected decline in private sector demand and should therefore be reviewed in light of developments. This will be one focus of the forthcoming update for the World Economic Outlook. Moreover, while a fiscal response across many countries may be needed, not all countries have sufficient fiscal space to implement it since expansionary fiscal actions may threaten the sustainability of fiscal finances. In particular, many low income and emerging market countries, but also some advanced countries, face additional constraints such as volatile capital flows, high public and foreign indebtedness, and large risk premia. The fact that some countries cannot engage in fiscal stimulus makes it all the more important that others, including some large emerging economies, do their part (see section V below).
5. This note, rather than focusing on the precise magnitude of the required fiscal response, and its distribution across countries, focuses on some general features that fiscal stimulus should have in the present context. More specifically, we argue that a fiscal stimulus should be timely (as there is an urgent need for action), large (because the drop in demand is large), lasting (as the recession will likely last for some time), diversified (as there is uncertainty regarding which measures will be most effective), contingent (to indicate that further action will be taken, if needed), collective (all countries that have the fiscal space should use it given the severity and global nature of the downturn), and sustainable (to avoid debt explosion in the long run and adverse effects in the short run). The challenge is to provide the right balance between these sometimes competing goals—particularly, large and lasting actions versus fiscal sustainability.
2 In the context of Japan, Lars Svensson argued that a way out of the slump was to achieve exchange rate depreciation, a policy that would work even if interest rates were already down to zero. Exchange rate depreciation was indeed a key factor behind economic recovery after some financial crises. Unfortunately, this cannot work in case of a global crisis (and indeed the beggar-thy-neighbor devaluations of the 1930s were definitely not helpful).
4
II. FISCAL POLICY IN FINANCIAL CRISES—LESSONS FROM HISTORY
6. A survey of the countries that have experienced severe systemic financial crises shows that these episodes are typically associated with severe economic downturns.3 The survey also shows that countries have reacted to these downturns quite differently, depending on economic and political constraints. The list of countries that have experienced both financial and economic crises is long. Appendix III presents an analysis of some well-known cases including Korea in 1997, Japan in the 1990s, the Nordic countries in the early 1990s, the Great Depression in the 1930s, and the U.S. during the Savings and Loans crisis in the 1980s.
7. Several lessons can be drawn from these case studies. First, successful resolution of the financial crisis is a precondition for achieving sustained growth. The archetypal example here is Japan, where fiscal actions following the bursting of its asset bubble failed to achieve sustained recovery because financial sector problems were allowed to fester. Delaying interventions, as was also done in the U.S. during the Hoover administration and during the Savings and Loans crisis, typically leads to a worsening of macroeconomic conditions, resulting in higher fiscal costs later on. Prompt and sizeable support to the financial sector by the Korean authorities limited the duration of the macroeconomic consequences thus limiting the need for other fiscal action. Second, the solution to the financial crisis always precedes the solution to the macroeconomic crisis. Third, a fiscal stimulus is highly useful (almost necessary) when the financial crisis spills over to the corporate and household sectors with a resulting worsening of the balance sheets. Fourth, the fiscal response can have a larger effect on aggregate demand if its composition takes into account the specific features of the crisis. In this regard, some of the tax and transfer policies implemented early in the Nordic crises did little to stimulate output.
8. Fixing the financial system and supporting aggregate demand are, thus, both of the essence. It is for this reason that the authorities in several advanced countries have unveiled a series of unprecedented initiatives to rescue the financial sector. We leave these aside in this note, and turn now to the fiscal component.
III. COMPOSITION OF A FISCAL STIMULUS
9. Two features of the crisis are particularly relevant in defining the appropriate composition of the fiscal stimulus.
10. First, as the current crisis will last at least for several more quarters, the fiscal stimulus can rely, more than is usual, on spending measures: the usual argument that implementation lags are long is less relevant when facing the current risk of a more prolonged downturn. Such expenditure measures may also have advantages over tax cuts or 3 See Chapter 4, World Economic Outlook, October 2008.
5
increases in transfers, which operate by raising the purchasing power of households and firms in the economy, given the highly uncertain response of the latter to an increase of their income in current circumstances.
11. Second, in the current context, characterized by a number of events and macroeconomic conditions not experienced in recent decades, existing estimates of fiscal multipliers are less reliable in informing policymakers about which measures will be relatively effective in supporting demand. This provides a strong argument for policy diversification, that is, for not relying on a single tool to support demand.
A. Public Spending on Goods and Services
12. In theory, public spending on goods and services has larger multiplier effects and, most important in the current circumstances, its first round effects are more certain than those related to transfers or tax cuts. In practice, the appropriate increase in public spending is constrained by the need to avoid waste. What are the key policy prescriptions?
13. First, and quite simply, governments should make sure that existing programs are not cut for lack of resources. In particular, central governments or sub-national governments that are facing balanced budget rules may be forced to suspend various spending programs (or to raise revenue). Measures should be taken to counteract the procyclicality built in these rules. For sub-national entities, this can be mitigated through transfers from the central government (suspending the rules for sub-national governments would not be appropriate as it will be difficult to reverse the suspension later.) In the U.S., for example, increased transfers from the federal government would help states avoid cutting various spending programs.
14. Second, spending programs, from repair and maintenance, to investment projects delayed, interrupted or rejected for lack of funding or macroeconomic considerations, can be (re)started quickly. A few high profile programs, with good long-run justification and strong externalities, (for example, for environmental purposes) can also help, directly and through expectations. Given the higher degree of risk facing firms at the current juncture, the state could also take a larger share in private-public partnerships for valuable projects that would otherwise be suspended for lack of private capital.
15. Public sector wage increases should be avoided as they are not well targeted, difficult to reverse, and similar to transfers in their effectiveness. Nevertheless, a temporary increase in public sector employment associated with some of new programs and policies may be needed.
6
B. Fiscal Stimulus Aimed at Consumers
16. The support of consumer spending also needs to take the present exceptional conditions into account. Three specific factors affect consumption at this juncture:
• Decreases in wealth, be it housing, financial, or human (i.e., declines in current and expected disposable income), leading consumers to cut consumption.
• Tighter credit constraints, as some consumers see their credit lines eliminated or face
much higher interest rates, forcing them to cut consumption. • High uncertainty, leading consumers to increase precautionary saving, and to take a wait
and see attitude and delay purchases until uncertainty has cleared.
17. Each of these three factors has different implications for the marginal propensity to consume out of transitory tax cuts or transfers. The first and the third suggest low marginal propensities to consume, the second a high one. Assessing the relative importance of the three is hard,4 but the list suggests two broad recommendations:
18. The first is to target tax cuts or transfers towards those consumers who are most likely to be credit constrained. Measures along these lines (and discussed further in an appendix) include the greater provision of unemployment benefits, increases in earned income tax credits, and the expansion of safety nets in countries where such nets are limited. Where relevant, support for homeowners facing foreclosures, including a write-down of mortgages using public resources is particularly appealing from a macroeconomic viewpoint as it helps not only support aggregate demand, but also improve conditions in the financial sector.
19. The second is that clarity of policy together with a strong commitment by policy makers to take whatever action may be needed to avoid the tail risk of a depression, are likely to reduce uncertainty, lead consumers to decrease precautionary saving, as well as stop waiting and start spending again.
20. What about other measures? Some countries are considering broad based tax cuts. For reasons explained earlier, the marginal propensity to consume out of such tax cuts may be quite low. Some countries have already introduced, or are considering, temporary decreases in the VAT. If the termination date is credible and not too distant, the intertemporal incentives implied by such a measure are attractive, but the degree of pass-through to consumers is uncertain, and its unwinding can contribute to a further downturn. It is also questionable whether decreases in the VAT of just a few percentage points are salient enough to lead consumers to shift the timing of their purchases. Along these lines, larger but more 4 Micro and macro evidence on the effect of the recent U.S. tax rebates give conflicting answers. Macro evidence suggests most of it was saved. Micro evidence shows some increase in consumption.
7
focused incentives, such as cash transfers for purchases of new, more efficient cars, a measure adopted in France, may attract more attention from consumers and have larger effects on demand.
C. Fiscal Stimulus Aimed at Firms
21. In the current environment, firms face not only a sharp fall in demand, but also a lot of uncertainty on how bad things could turn out to be. In this very uncertain environment, just like the consumers, firms are taking a wait-and-see attitude with respect to their investment decisions. Subsidies or measures to lower the tax adjusted user cost of capital (such as reductions in capital gains and corporate tax rates) are unlikely to have much effect. Rather, the key challenge for policy-makers is to avoid that firms have to cut down their current operations for lack of financing, including reasonably-priced credit.
22. This is, of course, primarily the job of monetary, not fiscal, policy. However, there is also some scope for governments in supporting firms that are facing particularly difficult problems, could survive through restructuring, but find it difficult or impossible to receive the necessary financing from dysfunctional credit markets..
23. In particular, there is an argument for combining Chapter 11-type procedures, which allow the restructuring of firms that are facing economic distress, with government guarantees on new credit (given the non availability of private financing for such firms). This can facilitate the development of a plausible restructuring plan, and is very much the approach underlying IMF-supported program lending to countries: lending plus policy adjustment.
24. It has been argued that governments should provide support to entire high-visibility sectors of the economy because of the potential effect that bankruptcies in these sectors may have on expectations and thus on demand. While there is some validity in this argument, its inherent arbitrariness, and risk of political capture, would make implementation too difficult. Its end result may, in fact, be to add uncertainty, and raise questions about domestic protection.
25. Indeed, direct subsidies to domestic sectors lead to an uneven playing field with respect to foreign corporations, and could lead to retaliation and possibly trade wars. In this context, an important principle of support should be to minimize interference with operational decisions. For example, following the earlier argument that public provision of credit guarantee to firms may be needed as long as the credit markets remain dysfunctional, it is clear that such provision should not be sector specific.
IV. SUSTAINABILITY CONCERNS
26. It is essential for governments to indicate from the start that the extent of the fiscal expansion will be contingent on the state of the economy. While a sizable upfront stimulus is

8
needed, policy makers must commit to doing more, as needed, if conditions so warrant. It is important to announce this at the start, so later increases do not look like desperation repairs.
27. However, it is also essential that fiscal stimulus not be seen by markets as seriously calling into question medium-term fiscal sustainability. This is key, not only for the medium run, but also for the short run, as questions about debt sustainability would undercut the near-term effectiveness of policy through adverse effects on financial markets, interest rates, and consumer spending.
28. Financial markets do not seem, at present, overly concerned about medium-term sustainability in the largest advanced countries, though there has been some widening of borrowing costs within the euro zone that likely reflect sustainability concerns.5, 6 This is however limited comfort, as markets often react late and abruptly. Thus, a fiscally unsustainable path can eventually lead to sharp adjustments in real interest rates, and these in turn can destabilize financial markets and undercut recovery prospects.
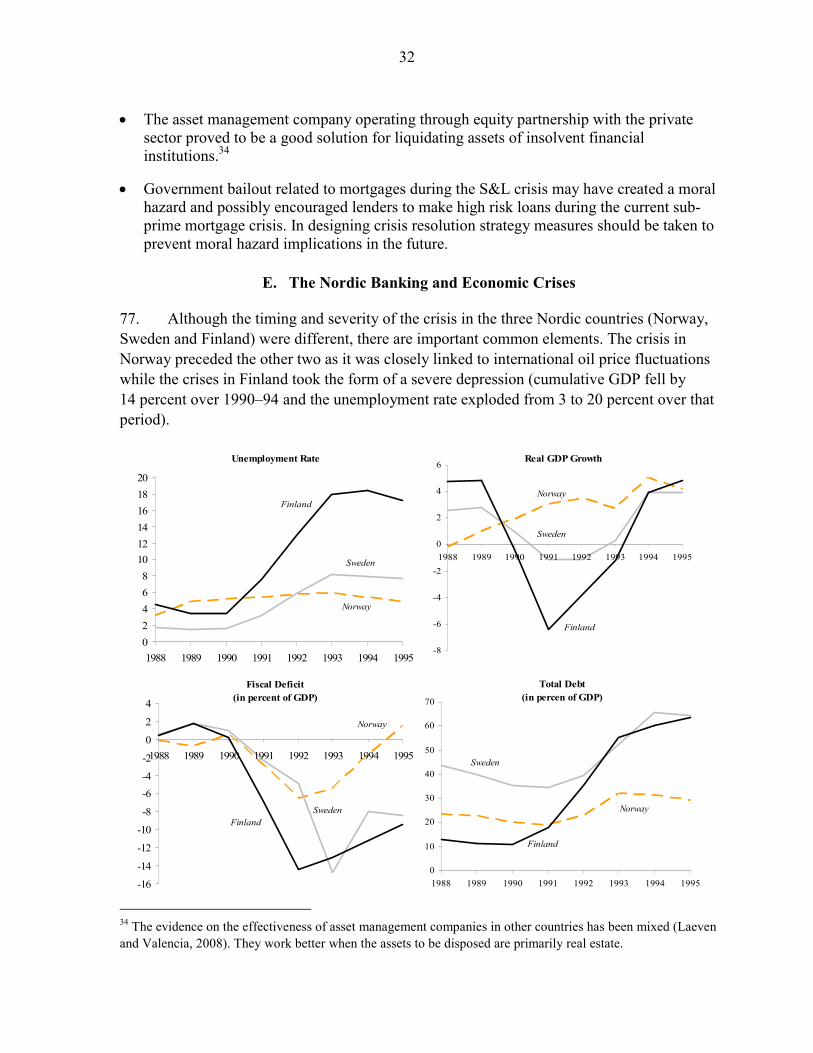
29. What can be done to avoid this danger? The following features can help:
• implementing mostly measures that are reversible or that have clear sunset clauses contingent on the economic situation;
• implementing policies that eliminate distortions (e.g., financial transaction taxes);
• increasing the scope of automatic stabilizers that, by their nature, are countercyclical;7
• pre-committing to identified future corrective measures—e.g., letting the current administration’s upper income tax cuts expire (U.S.)—and to future increases in upper income tax rates (just announced as part of the U.K. package);
• pre-commitment to unwinding stimulus measures either at a specific date (like lowering VAT for just two years as the U.K. recently did) or on a contingent basis (reversing the
5 Econometric estimates for the U.S. indicate that a 1 percentage point increase in the expected or current federal debt-to-GDP ratio increases long-term real interest rates by only 2–4 basis points (Laubach, Thomas (2003), "New Evidence on the Interest Rate Effects of Budget Deficits and Debt," Board of Governors of the Federal Reserve Finance and Economics Discussion Series, No. 2003–12 (Revised in 2007)). There are good reasons to believe, but no strong empirical evidence to support, the notion that the effect is nonlinear in the level of debt.
6 In early December, Italian and Greek government papers were facing interest rates of around 150 basis points over comparable German rates.
7 There is evidence of a secular decline in the role of automatic stabilizers in the U.S. since their historical peak in the 1970s (see Auerbach, (2008) "How Much Should We Rely on Fiscal Stimulus?" Presentation at Federal Reserve Bank of San Francisco Symposium).
9
VAT cut once GDP growth has risen above a certain level). Consideration should be given to a smooth unwinding to avoid cliff effects;
• providing more robust medium-term fiscal frameworks. These should cover a period of 4–5 years and ideally include: accurate and timely projections of government revenues and expenditures; a government balance sheet reporting data on government assets and liabilities; a statement of contingent liabilities and other fiscal risks; and transparent arrangements for monitoring and reporting fiscal information for central and sub-national government, other public sector entities, and central bank quasi-fiscal operations, on a regular and timely basis. Such frameworks should be designed to give confidence that increases in public debt resulting from the stimulus are eventually offset;
• strengthening fiscal governance. For example, independent fiscal councils could help monitor fiscal developments, thus increasing fiscal transparency, and could also advise on specific short-term policies or medium-term budgetary frameworks, to reduce the public’s perception of possible political biases; and
• improving expenditure procedures to ensure that stepped-up public works spending is
well directed to raise long-term growth (and tax-raising) potential.
30. Moreover, we should not forget that the main threat to the long-term viability of public finances in rapidly-aging countries comes from the trend increase in the net cost of publicly funded pension and health entitlements, whose net present values far exceed the magnitude of conceivable fiscal stimulus packages. Finally, structural reforms to boost potential growth, by removing distortions, including those arising from taxation and other public interventions, can also help in strengthening medium-term sustainability: Many countries have succeeded in reducing their public debt burden through growth. A credible commitment to address these long-term issues can go a long way in reassuring markets about fiscal sustainability.
A. Some Proposals for Discussion
31. The gravity and singularity of the current crisis may require new solutions, which address specifically the issues of financial disintermediation and loss in confidence. Some proposals that could be considered further are:
Greater role of the public sector in financial intermediation 32. One of the characteristics of the current financial crisis is an extreme shift in investors’ preferences towards liquid T-bills and away from private assets. To the extent that the state is in a better position than private investors to buy and hold these private assets, it may want to do so, in effect, partly replacing the private sector in financial intermediation. In

10
the U.S. context, the government could issue T-bills and use the funds to provide financing for some of the ultimate borrowers.8 The issue is clearly that the public sector does not have a comparative advantage in evaluating credit risk, nor in administering a diverse portfolio of assets. A possible solution may be to outsource the management of the banking activities to a private entity.
Provision of insurance by the public sector against large recessions 33. In the present environment of extreme uncertainty, there may be a high private value to delaying consumption and investment decisions until part of the uncertainty is resolved. Equally important, banks may delay their decisions on which projects to finance for similar reasons.
34. In this context, the government could provide insurance against extreme recessions by offering contracts, with payment, for example, contingent on GDP growth falling below some threshold level. Banks could condition loan approvals on firms having purchased such insurance from the government. This is analogous to the flood insurance that mortgage companies often require from borrowers. While such contracts would most likely be attractive to firms, which suffer disproportionately during large recessions, they could be open to individuals as well. Widespread use of such contracts would provide an additional automatic stabilizer because payments would be made when they are most needed, namely in bad times.9 Such a market would also provide a market-based view of future output, and the likelihood of severe shocks. (GDP-linked bonds, which have been discussed in the academic literature for some time, would also go some way towards the same goal.)
35. An obvious worry about such a scheme is counterparty risk, i.e., that the government may not be able or willing to honor its obligations. The contingent liabilities created by providing insurance should be included appropriately in the budget and should be taken into consideration when calculating medium-run fiscal sustainability.
8 This was done in the 1930s during the Great Depression. We describe it as a Treasury operation, but it is closely related to the “quantitative easing’’ policies followed by the Fed and other central banks. The differences are in whether these assets are bought or used as collateral, and whether their purchase is financed through government bonds, or through money creation (as is currently the case).
9 Note that this proposal has some resemblance with the ideas on country insurance discussed in “Country Insurance: the Role of Domestic Policies,” IMF Occasional Paper, 2006.

11
V. A COLLECTIVE INTERNATIONAL EFFORT
36. The international dimension of the crisis calls for a collective approach to providing fiscal stimulus. There are several important spillovers that could limit the effectiveness of actions taken by individual countries, or even create adverse externalities across borders:
• Countries with a high degree of trade openness may be discouraged from fiscal stimulus; the more open a country, the less it will benefit from a domestic demand expansion, and the more the fiscal expansion will translate into a deterioration of the trade balance. The amount of stimulus needed to achieve a given level of increased output can be large in open economies. The flip side of these spillovers is that if all countries act, the amount of stimulus needed by each country is reduced (and provides a political economy argument for a collective fiscal effort). At the same time, this collective fiscal effort must be tailored to individual country circumstances to take account of external imbalances, the effects of automatic stabilizers and the degree to which each country has fiscal space.
• Some interventions currently discussed such as subsidies to troubled industries may be perceived as hidden (unfair) industrial policy by trading partners. Such a race would bring significant costs in terms of efficiency.10
• The history of the Great Depression shows that, as the crisis deepens, there is increasing pressure to raise trade barriers. While it is improbable that trade tariffs will be increased because of the commitments to WTO, there is a distinct possibility that organized groups may advocate non-tariff protection to limit imports, or introduce various forms of export subsidies, especially if some fiscal measures are misconstrued as unfair industrial policy (see previous point).
37. All these factors point to the need for a concerted effort by the international community, and stricter coordination among countries with closer economic and institutional ties (e.g., the European Union).11 The recent decision to finance some of the national expenditures from the EU budget is clearly a step in this direction.
10 Attempts to save jobs in troubled sectors of the U.S. economy, e.g., the auto industry, through increased trade protection come with a potentially large cost in terms of lost efficiency. Some estimates suggest that the cost of saving one job far exceeds the average annual wage in the protected sector. For example, in 2002, the Federal Reserve Bank of Dallas published estimates of the annual cost incurred per job saved in 20 sectors in the U.S. economy as a consequence of protection and they concluded that the average annual cost per job saved exceeded $230,000.
11 So far, the EU commission has recommended a fiscal stimulus of 1.5 percent of GDP. France has announced a €19 bn plan, which includes a boost for the construction and car sectors; moreover, the government has promised €20 bn for small business and the construction industry. Germany has announced a package that includes generous amortization rules for companies, and incentives for climate-friendly home renovation; the package will cost €12 bn in two years but it is expected to trigger €50 bn in private investment. Italy proposes a
(continued)

12
38. Some countries have questioned the need for fiscal action and whether it can be effective. The most recent data are pointing more and more to a worldwide growth slowdown. This suggests that the action should be widespread to maximize its effectiveness. To maximize the demand impetus, policies across regions should be tailored to those actions that are likely to provide the largest multipliers. In the United States, that is likely to be investment, other spending on goods and services, and some targeted transfers. In Europe, with its relatively large automatic stabilizers, the additional fiscal impulse can probably be somewhat less than in the United States.
VI. CONCLUSION
39. The solution to the current financial and macroeconomic crisis requires bold initiatives aimed at rescuing the financial sector and increasing demand.
40. The analysis of previous cases of severe financial distress shows the critical role of early resolution of financial sector problems as a prerequisite for a return to sustained economic growth. It also shows the critical role of an early, strong, and carefully thought out, fiscal response. Time and action are of the essence.
nominally large stimulus that will only amount to €5 bn in ‘new’ money (i.e., not previously announced). Spain has announced measures for €40 bn to support infrastructure investment and the car industry. The U.K. has announced a temporary reduction of VAT rate from 17.5 to 15 percent until December 2009 at an estimated cost of £12.5 bn; in addition, the government plans to invest £3 bn on infrastructure and has offered temporary targeted tax breaks for £3.5 bn.
13
APPENDIX I: SPENDING AND REVENUE MEASURES12
41. This appendix provides a list of measures that could be considered, and that correspond to the principles outlined in the note. The respective pros and cons, which may become more or less relevant depending on the institutional and economic context of each country, are also listed.
42. The appendix also identifies measures that are generally not recommended.
Investment spending
Instruments
• Frontloading existing projects, in particular, in the countries with a multi-year expenditure framework.
• Increasing maintenance spending.
• New investment projects: planning now and implemented if downturn continues
Advantage: Large short-term demand effect; and long-term supply side effect as well. If these are projects that countries planned to do anyway, the anticipation of the project will not change the NPV of public debt.
Risks: Potentially significant lags from the idea to implementation, and the quality of spending could suffer from expediting the implementation; maintenance spending tends to be relatively small and thus will not have a large impact.
Targeted transfer payments
Instruments
• Expansion of unemployment benefit by extending the duration and/or eligibility and/or the size of benefits.
• Expansion of in-kind or cash transfers to low-income households by lowering the threshold income level or increasing the support.
Advantage: Support would be channeled quickly through existing social safety nets; it would also be well-targeted as it would support the neediest, who also tend to have higher marginal propensities to consume.
12 Prepared by the staff of the Fiscal Affairs Department.
14
Risks: Difficult to achieve sufficient stimulus as the target groups tend to be small and undesirable labor market effects, such as work incentive problems, may emerge by workers and employers; these measures tend to be perceived as a permanent change in entitlement, which make these measures difficult to reverse. In some countries, steps in this area may require some institutional changes, for example, in the U.S. in the coordination with states, as the latter decide the criteria to access welfare programs (following the Personal Responsibility and Work Opportunity Reconciliation Act of 1996).
Not Recommended Measures: • Introduction of new large-scale entitlement programs as they are hard to reverse, and
already entitlements are creating longer-term problems.
• Increase in the public sector wage bill: this would be politically unpopular, very difficult to reverse, and not well targeted.
• Increase subsidies to specific industries. This could elicit undesirable protectionist responses in other countries.
Temporary reduction in consumption tax rates (not pre-announced)
Advantages: Raises the purchasing power of households and encourages current consumption by lowering its price with respect to future consumption. Disadvantages: Not as well targeted as some other options; not necessarily passed on to the consumers (final prices may remain unchanged); in an uncertain environment with a crises in confidence, may not be enough to encourage spending; in the U.S. it would need to be accompanied by matching transfers from central government to sub-national governments based on last year’s revenue to encourage independent sub nationals to lower their tax rates. Lump sum targeted tax rebates and temporary increases in earned income tax credit rates or ceilings
Advantages: Well targeted to low-income and credit-constrained consumers; can be implemented quickly; temporary. Disadvantages: May be ineffective if precautionary savings motive prevails and highly indebted households increase savings rather than consumption in anticipation of economic slowdown.
15
Temporary reduction in unemployment insurance contributions
Advantages: Targeted to increase employment through the reduction in employer cost, can be implemented quickly; temporary. Disadvantages: May be ineffective if other considerations, such as bleak economic prospects, outweigh employers’ decisions; not much evidence exists that this would have an impact on employers’ decision under current circumstances. While some have advocated a temporary cut in pension contributions, there is a risk that cuts in these contribution rates, even if announced as temporary, will not be reversed, further weakening the viability of social insurance systems. Relaxation of rules on acquisition of tax losses of the troubled banks and companies Advantages: Provides incentives for merging troubled companies with the healthier ones, allows symmetric treatment of profits and losses, targeted to restoring confidence in the banking and corporate sectors. It is a way to help ensure better management of unprofitable firms. Disadvantages: The troubled firm may be liquidated right after the merger or its activities might change. While this could be addressed with strict provisions, such provisions might be difficult to implement in practice. Also, it is not clear that such an enhancement is needed to encourage the merger—its absence would simply be reflected in the price. Adjustment in pre-payment rules to make them more forward-looking and extension of carry-forward rules Advantages: Allows companies to better manage cash-flow and allows symmetric treatment of profits and losses. Disadvantages: Companies may understate expected liabilities (can be remedied by penalties). Perhaps more significantly, it is not clear whether, in the current context, such measures would have any effect in supporting aggregate demand.
Not Recommended Measures:
• Reduction in corporate tax rates, dividends and capital gains taxes or introduction of special incentives such as accelerated depreciation
Disadvantages: Are likely to be ineffective given that business profits and capital gains are low, except possibly in countries with very high corporate rates (e.g., Japan); like all such tax changes, they are often difficult to reverse.

16
• Amnesties/temporary exemptions for companies in trouble
Disadvantages: Very distortionary, likely to be ineffective, inefficient—with well-designed system of pre-payment and loss carry forward, tax payments of troubled companies are automatically reduced; could be seen as unfair industrial policy by international competitors, eliciting a “run to state subsidies.”
• Extension of carry back rules (setting current losses against past profits and
receiving refund for past taxes).
Disadvantages: Are ineffective in stimulating aggregate demand and are distortionary.
• Tax changes that worsen existing distortions, e.g., increases in tariffs.
Disadvantages: Distortionary, likely to be ineffective. • Measures aimed at bolstering financial markets and prices (e.g., reduction in
capital gain taxes).
Disadvantages: distortionary, likely to be ineffective; may have unintended side effects (reclassification of income into categories subject to lower taxes).
17
APPENDIX II: FISCAL MULTIPLIERS—A REVIEW OF THE LITERATURE13 43. What gives the biggest bang for the buck? Existing studies provide a range of fiscal multipliers from less than zero to larger than four, depending on the identifying assumptions, the type of fiscal policy, and the country of interest. This note provides an overview of the methodological issues associated with the estimation of fiscal multipliers, followed by a summary of how fiscal multipliers differ across different approaches and types of stimuli.
Methodological issues The main challenges in estimating the size of multipliers derive from: 1) Identification problems: discretionary fiscal policy is typically used in a period of
recession when many other factors are at play. The effects of the stimulus could be confounded with other factors.
2) Definition of multipliers: fiscal multipliers have dynamic effects for several quarters.
Measuring these dynamic effects over time presents additional challenges, and fiscal multipliers may differ, depending on whether other policy tools are held constant.
44. Various methods commonly used to estimate the size of multipliers, including structural vector auto-regressions (VARs), narrative approaches, model simulations, and case studies, have different strengths and weaknesses in addressing the challenges mentioned above. For example, identification problems in VARs relate to the difficulty in isolating exogenous movements in taxes or government spending. Moreover, the variation in multiplier estimates may also relate to the frequency of the underlying data as lower frequency of the data may complicate the identification of shocks.
45. An additional complication relates to the dynamic adjustment process following fiscal shocks. During the dynamic adjustment process, taxes, government spending, and monetary policy are often allowed to respond endogenously, providing output effects arising also from factors other than the initial shock. For comparison, while macro studies aim at estimating the overall multipliers, including dynamic second-round effects, micro studies generally focus only on first-round effects.14
13 This survey was written by Lone Christiansen (Research Department).
14 Although macro studies include dynamic effects, the multipliers may not necessarily be larger than those from micro studies as, for example, the effects depend critically on expectations. Furthermore, the studies differ in the type of government expenditure considered and are therefore difficult to compare.

18
Different stimuli 46. A review of the literature suggests a lot of heterogeneity across fiscal multiplier estimates, depending on the identifying assumptions, the type of fiscal policy, and the country of interest. Indeed, estimates range from less than zero to larger than four. However, a few lessons arise from a review of the literature: (i) there is no evidence that government investment multipliers are substantially larger than those associated with government consumption; (ii) while short-run effects of tax changes may be smaller than those from spending changes, this is not necessarily the case over the medium term; (iii) multipliers tend to vary considerably across countries; and (iv) multipliers tend to be larger for bigger economies.
Micro studies 47. Micro studies focus primarily on the first-round effects of fiscal stimulus and find that less than the full income effect of tax rebates or changes in the U.S. is consumed on impact. In particular, some studies based on survey data (for example Johnson and others, 2006, for nondurable goods, and Coronado and others, 2005) have found that two-thirds or less of the resulting change in income was spent. Recent preliminary evidence for the 2008 tax rebates (Broda and Parker, 2008) supports this finding.
Macroeconomic VAR and narrative studies for the U.S. 48. VAR studies for the U.S. do not provide a clear conclusion on whether multipliers are larger on spending or on taxes. Although short-run multipliers may be larger following a spending shock, longer-run multipliers potentially show the reverse result. Depending on the trend assumptions on the data, results from a structural VAR (Blanchard and Perotti, 2002) show larger or smaller output effects from taxes versus spending across time. This corresponds to a recent narrative study based on presidential speeches and Congressional reports (Romer and Romer, 2008) that find output effects of around 3 percent a few years following a tax change of 1 percent of GDP. However, Ramey (2008), based on U.S. military dates, finds a nonproductive government spending elasticity of 0.3 (corresponding to a multiplier of around 1.5) after one year, indicating the government spending multipliers may be larger than one.
Structural models 49. Structural models differ vastly in the underlying assumptions regarding endogenous policy responses and forward-looking behavior. In particular, models that allow for interest rate adjustment may have more muted fiscal multipliers than models that hold other policy variables constant. A study comparing results from several models with different assumptions about formation of expectations, but holding foreign monetary aggregates unchanged from the baseline, finds U.S. real GNP effects of government spending varying from close to zero to two percent (Bryant and others, 1988). Additionally, Freedman and

19
others (2008) show how the effect of fiscal stimulus is sensitive to the degree of monetary policy accommodation, and to whether the fiscal expansion is performed in a single country only or is worldwide. As such, a consensus on the model-based size of the fiscal multipliers is hard to obtain.
50. Consistent with results from the VAR and narrative literature, short-run output effects from taxes most often are smaller than one. Elmendorf and Reifschneider (2002) use an open-economy, structural macro model with forward-looking agents. The model is developed for the U.S. at the Federal Reserve Board and assumes a monetary policy rule that only induces a modest rise in short-term interest rates after a fiscal action that stimulates the economy. The model includes adjustment costs that induce gradual responses to changes in the information set. Using this model, they find that “a sustained cut in personal income taxes raises real GDP by less than the amount of the tax cut itself.” Additionally, a temporary tax rebate costing 1 percent of GDP results in a 1 percent short-run increase in GDP if 50 percent is spent but a 0.3 percent GDP effect if only 20 percent is spent, and an increases in federal purchases have larger output effects than permanent tax cuts and investment tax credits (Elmendorf and Furman, 2008). Correspondingly, the European Commission’s QUEST model leads to first-year revenue multipliers of 0.3 or smaller for nine European countries but expenditure multipliers between 0.3 and 0.7 (HM Treasury, 2003).15 However, longer-run effects of tax changes may be larger if supply side effects from tax reductions become more important over time.
51. Ways to increase the effectiveness of fiscal stimulus may include targeting low-income and liquidity-constrained consumers with the highest marginal propensity to consume. This can be done through a temporary increase in food stamps or by providing a larger role for automatic stabilizers through an extension of unemployment benefits, corresponding to findings from a macro-econometric model by Moody’s Economy.com. They report that such measures are associated with multipliers of 1.73 and 1.64, respectively. Additionally, aid to states can be an alternative effective fiscal stimulus as this can relax constraints from balanced-budget rules, allowing for potentially quick output effects. Correspondingly, Moody’s Economy finds that general aid to state governments has a multiplier of 1.36.
Differences across country and time 52. Most of the studies reported above examine the size of multipliers with a focus on the U.S. However, fiscal multipliers differ substantially across countries and tend to be larger for bigger countries. The low range of multiplier estimates shows that fiscal contractions can have expansionary effects in some countries (Giavazzi and Pagano, 1990 and 1996), and that 15 The model assumes fiscal sustainability such that lump-sum tax changes after three years offset both types of fiscal expansions in order to stabilize the debt to GDP ratio. Consumers are forward-looking, and monetary policy is inflation targeting.
20
output effects of revenue- and expenditure-based policy changes are close to zero for a set of advanced countries (IMF, 2008). The high range provides multipliers larger than four (Perotti, 2006). Additionally, some studies (for example IMF, 2008) find that fiscal multipliers may have decreased across time.
53. A structural VAR on quarterly data for five countries (Australia, Canada, Germany, the U.K., and the U.S.) can yield one-year cumulative government spending multipliers that range from around one half to more than twice as large, depending on the country (Perotti, 2006). The corresponding multipliers for public investment range from potentially less than zero to larger than four. As such, although public investment, including core infrastructure investment, can have large productivity effects through positive spillover effects on private investment, there is not clear evidence that the associated multipliers in general are larger than those for government spending.
54. A few countries are often found to have relatively high multipliers. Comparing results for five European countries, using the National Institute Global Model (NiGEM), shows that Germany tends to have larger multipliers from one-year shocks to indirect and direct taxes as well as to transfers than France, Italy, Spain, and the U.K. (Al-Eyd and Barrell, 2005). Similarly, Henry and others (2004) compare results from econometric central bank models and find short-run government purchases multipliers after unanticipated shocks that tend to be higher for the U.S., compared to models for the U.K., France, and Belgium.16 Estimates from the OECD INTERLINK model (Dalsgaard and others, 2001) leads to one-year responses of 1.1 percent or larger for the U.S., Japan, and Germany, while responses in France, Italy, the U.K., and Canada are in the range from 0.2 to 0.9 percent.17
55. Recent studies have found that not only do multipliers differ across countries but they have also decreased over time. For infrastructure, the associated multipliers may be decreasing over time as the marginal productivity of infrastructure falls with its expansion. As such, although public investment multipliers in the past may have been substantially larger than those associated with government consumption, this may not continue to be the case. Furthermore, investment projects are associated with potentially long implementation lags, leading to uncertain short-run effects.
16 Multipliers for some European countries such as Germany, Portugal, and Spain are close to one or larger.
17 The NiGEM assumes forward-looking agents, includes nominal rigidities, and imposes long-run fiscal solvency and active monetary reaction functions. The models in Henry and others assume that interest rates, exchange rates, and fiscal policy variables in most simulations are exogenous. The INTERLINK model holds nominal exchange rates fixed and keeps real interest rates and real government investment unchanged.
21
Conclusion 56. Accurate fiscal multipliers estimated from macro studies are difficult to obtain given the identification problems associated with isolating exogenous fiscal shocks. However, micro studies do not provide the full extent of the output effects from fiscal policy as these primarily focus only on first-round effects. A review of the literature suggests that there is a lot of heterogeneity across fiscal multiplier estimates, depending on the identifying assumptions, the type of fiscal policy, and the country of interest.

22
APPENDIX III: FIVE CASE STUDIES OF FISCAL POLICY DURING FINANCIAL CRISIS18
57. This appendix presents five case studies related to countries with severe financial crises, and that responded with different fiscal policies:
A. Great Depression and Fiscal Policy
58. The possibility that aggregate demand stimulus in the form of changes in government spending was the source of recovery from the depression was analyzed extensively in the 1940s and l950s. Initial research by Smithies (1946) finds that "fiscal policy did prove to be an effective and indeed the only effective means to recovery." Hansen (1941), on the other hand, argues that fiscal policy was not used extensively in the 1930s. Brown (1956) uses a conventional Keynesian multiplier model and the concept of discretionary government spending to support Hansen's view. His often-cited conclusion is that “fiscal policy, then, seems to have been an unsuccessful recovery device in the thirties—not because it did not work, but because it was not tried.” The primary failure of fiscal policy to be expansive in this period is attributable to the sharp increases in tax structures attributable at all levels of government.
59. Overall government purchases of goods and services expanded virtually every year in the 30s; increasing from $13.6 billion in 1929 to $22.8 billion in 1939 (Brown, 1956). In particular, various initiatives were started by President Roosevelt under the “New Deal” in 1933 to create jobs and stimulate demand. The key initiatives were as follows: creation of the Civilian Conservative Corps to provide work for men aged 18–35 through camps run by the War Department; programs by the Agriculture and Interior Department for preservation of the nation’s crops and forests; creation of the Federal Emergency Relief Administration (FERA), which provided grants to states; creation of the Public Works Administration with a budget of $3.3 billion (approximately 6 percent of GDP) to provide funding to local governments for public projects. Another new agency, the Civil Works Administration (CWA) was created in 1934, which would bypass state officials and employ people directly. The CWA workers were used to fix up city halls, docks, and public roads, all on the federal government’s payroll. Finally, the Emergency Relief Appropriation Act gave the President about $5 billion for relief project including highways, conservation, irrigation, electrification, housing, sanitation, reforestation, flood control and indeed any conceivable public good. Roosevelt used the act to set up the Works Progress Administration (WPA), which took over from FERA. WPA spent money directly from the national treasury; and hired workers to
18 This attachment was written by Borja Gracia (the case of the Nordics), Anna Ivanova (Savings and Loans), Daehaeng Kim (Korea and Japan) (all Fiscal Affairs Department), and Prachi Mishra (Great Depression) (Research Department).
23
build hospitals, schools, playgrounds, and airports. The program drew criticism for spending public money to pay idle hands to do unproductive work (Rauchway, 2008).19
60. The tax revenues, however, kept pace with the rising expenditures during the 1930s. The Revenue Act of 1932 pushed up rates virtually across the board, but notably on the low- and middle-income groups. Some of the changes brought about by the law were as follows: personal income tax exemptions were slashed; the normal tax as well as surtax rates were sharply raised, and earned-income credit equal to 25 percent of taxes on low incomes was repealed; corporate tax rate was raised slightly and exemptions sharply reduced; estate tax rates were pushed up, exemptions sharply reduced and a gift tax was provided; broad new list of excise taxes was introduced and substantially higher rates for the old ones; “processing taxes” were introduced later in the 30s; and social security taxes began in 1937.
61. What ended the Great Depression? The traditional view is that public spending associated with World War II brought the economy to potential output.20 Vernon (1994) emphasizes the importance of WWII and shows that fiscal policy relating to WWII was, in fact, the most important factor in the recovery during 1941 and 1942; half of the recovery in output from its 1933 low point occurred during 1941 and 1942. This view has been challenged by Delong and Summers (1988) who argue that five-sixths of the decline in output relative to the trend that occurred during the Depression had been made up before 1942. They find it “hard to attribute any pre-1942 catch-up to the war.” In a similar vein, Romer (1992) argues that the recovery was essentially complete prior to 1942, and shows that fiscal policies “contributed almost nothing to the recovery before 1942.”21
62. Another view is that conventional aggregate demand stimulus did not matter in the recovery from the Great Depression. Bernanke and Parkinson (1989) analyze the apparent trend reversion of employment in the 1930s and are struck by the strength of the recovery. They argue, however, that the “New Deal is better characterized as having cleared the way for a natural recovery... rather than as being the engine of recovery itself.” They suggest that the trend reversion of the interwar economy is evidence of a strong self-corrective force.
19 Brown (1956) shows that the direct effects on aggregate full-employment demand of fiscal policy undertaken by all three levels of government was clearly relatively stronger in the thirties than in 1929 in only two years in which large payments were made under the veterans’ adjusted compensation programs, which amounted to $1.0 billion in 1931 and $1.4 billion in 1936 (Studenski and Krooss, 1952).
20 See Higgs, “Wartime Prosperity?” page 42 for an extensive list of references on this point.
21 Romer (1992) suggests that nearly all of the observed recovery was due to monetary expansion; huge gold inflows in the mid and late 1930s appeared to have stimulated the economy by lowering real interest rates encouraging investment spending and purchases of durable goods.
24
63. Finally, a recent paper by Eggertsson (2008) uses a stochastic general equilibrium model to argue that the U.S. economy’s recovery from the Great Depression was driven by a shift in expectations brought about by the policy actions of President Roosevelt. In particular, increases in federal expenditures and rise in federal (as opposed to states’) deficit in the 1930s did have a role of play in that they changed expectations from being deflationary to being inflationary. This, in turn, reduced the real rate of interest and stimulated demand.
B. Japan: Banking Crisis in 1997
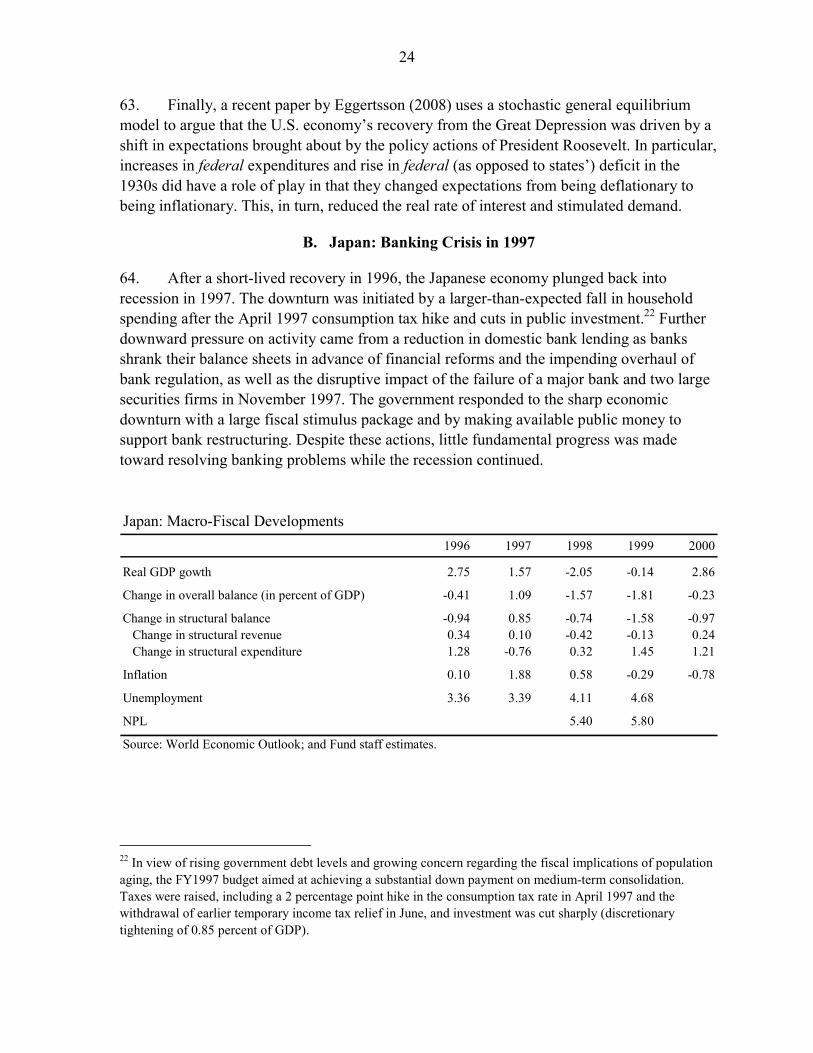
64. After a short-lived recovery in 1996, the Japanese economy plunged back into recession in 1997. The downturn was initiated by a larger-than-expected fall in household spending after the April 1997 consumption tax hike and cuts in public investment.22 Further downward pressure on activity came from a reduction in domestic bank lending as banks shrank their balance sheets in advance of financial reforms and the impending overhaul of bank regulation, as well as the disruptive impact of the failure of a major bank and two large securities firms in November 1997. The government responded to the sharp economic downturn with a large fiscal stimulus package and by making available public money to support bank restructuring. Despite these actions, little fundamental progress was made toward resolving banking problems while the recession continued.
Japan: Macro-Fiscal Developments
1996 1997 1998 1999 2000
Real GDP gowth 2.75 1.57 -2.05 -0.14 2.86
Change in overall balance (in percent of GDP) -0.41 1.09 -1.57 -1.81 -0.23
Change in structural balance -0.94 0.85 -0.74 -1.58 -0.97Change in structural revenue 0.34 0.10 -0.42 -0.13 0.24Change in structural expenditure 1.28 -0.76 0.32 1.45 1.21
Inflation 0.10 1.88 0.58 -0.29 -0.78
Unemployment 3.36 3.39 4.11 4.68
NPL 5.40 5.80
Source: World Economic Outlook; and Fund staff estimates.
22 In view of rising government debt levels and growing concern regarding the fiscal implications of population aging, the FY1997 budget aimed at achieving a substantial down payment on medium-term consolidation. Taxes were raised, including a 2 percentage point hike in the consumption tax rate in April 1997 and the withdrawal of earlier temporary income tax relief in June, and investment was cut sharply (discretionary tightening of 0.85 percent of GDP).
25
Real Domestic Credit to the Private Sector(in percent)
-20
-15
-10
-5
0
5
10
15
20
25
-8 -7 -6 -5 -4 -3 -2 -1 0 1 2 3 4 5 6 7 8
KoreaJapanSweden
Korea
Japan
Sweden
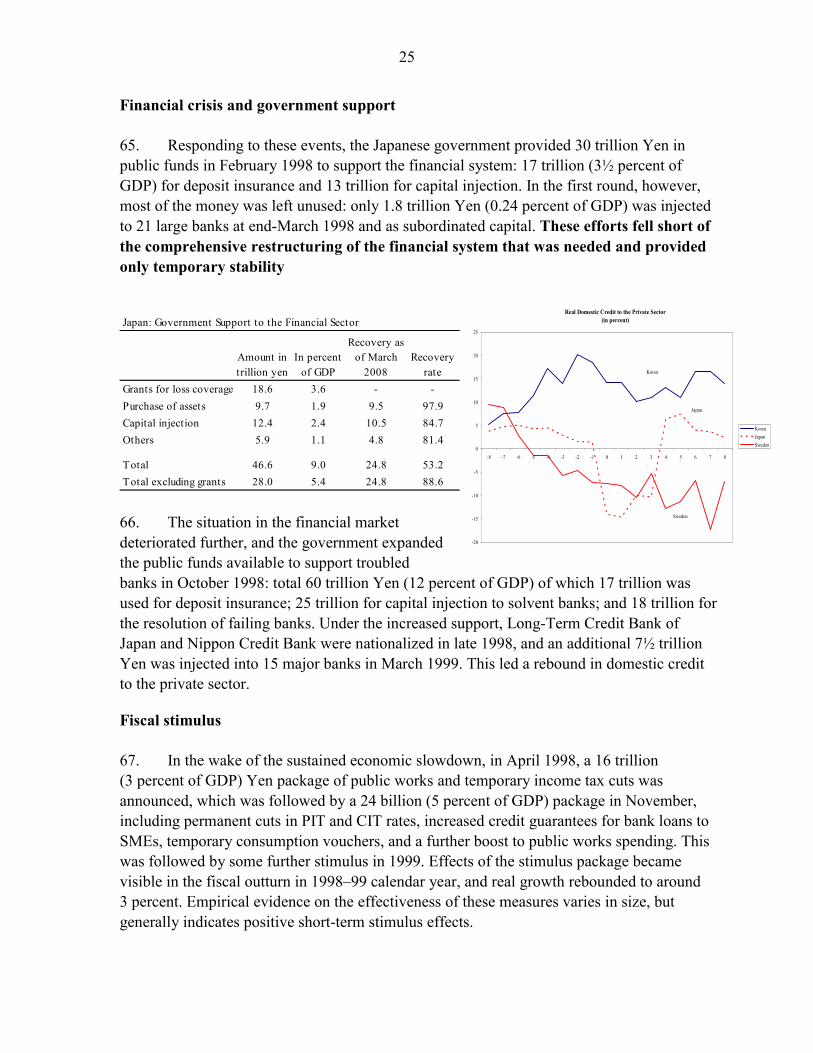
Financial crisis and government support 65. Responding to these events, the Japanese government provided 30 trillion Yen in public funds in February 1998 to support the financial system: 17 trillion (3½ percent of GDP) for deposit insurance and 13 trillion for capital injection. In the first round, however, most of the money was left unused: only 1.8 trillion Yen (0.24 percent of GDP) was injected to 21 large banks at end-March 1998 and as subordinated capital. These efforts fell short of the comprehensive restructuring of the financial system that was needed and provided only temporary stability
Japan: Government Support to the Financial Sector
Amount in trillion yen
In percent of GDP
Recovery as of March
2008Recovery
rateGrants for loss coverage 18.6 3.6 - -Purchase of assets 9.7 1.9 9.5 97.9Capital injection 12.4 2.4 10.5 84.7Others 5.9 1.1 4.8 81.4
Total 46.6 9.0 24.8 53.2Total excluding grants 28.0 5.4 24.8 88.6 66. The situation in the financial market deteriorated further, and the government expanded the public funds available to support troubled banks in October 1998: total 60 trillion Yen (12 percent of GDP) of which 17 trillion was used for deposit insurance; 25 trillion for capital injection to solvent banks; and 18 trillion for the resolution of failing banks. Under the increased support, Long-Term Credit Bank of Japan and Nippon Credit Bank were nationalized in late 1998, and an additional 7½ trillion Yen was injected into 15 major banks in March 1999. This led a rebound in domestic credit to the private sector.
Fiscal stimulus 67. In the wake of the sustained economic slowdown, in April 1998, a 16 trillion (3 percent of GDP) Yen package of public works and temporary income tax cuts was announced, which was followed by a 24 billion (5 percent of GDP) package in November, including permanent cuts in PIT and CIT rates, increased credit guarantees for bank loans to SMEs, temporary consumption vouchers, and a further boost to public works spending. This was followed by some further stimulus in 1999. Effects of the stimulus package became visible in the fiscal outturn in 1998–99 calendar year, and real growth rebounded to around 3 percent. Empirical evidence on the effectiveness of these measures varies in size, but generally indicates positive short-term stimulus effects.

26
C. Korea: Economic Crisis in 1997
68. The 1997 Korean crises had its roots in vulnerabilities in both the corporate and financial sector balance sheets, especially compared to other countries that experienced financial crises (see Table below). The debt/equity ratio of the thirty major largest companies was 500 percent, the profitability of the corporate sector was weak, in part, due to over investment; and substantial currency and maturity mismatches of bank assets and liabilities.23
Debt/Equity Ratio in the Manufacturing Sector
US Japan Taiwan1997 1997 1995 1997 1998
Debt/equity ratio 153.5 193.2 85.7 396.3 303
Total borrowings and bonds payable to total assets
25.6 33.1 26.2 54.2 50.8
Source: Bank of Korea
Korea
Korea: Macro-Fiscal Developments
1996 1997 1998 1999 2000
Real GDP gowth 7.00 4.65 -6.85 9.49 8.49
Change in overall balance (in percent of GDP) -0.07 -1.66 -2.46 1.41 3.60
Change in structural balance -0.37 -1.78 -0.01 0.24 2.84Change in structural revenue 0.81 -0.06 0.96 0.41 3.09Change in structural expenditure 1.17 1.73 0.97 0.17 0.25
Inflation 4.92 4.44 7.51 0.81 2.26
NPL 7.40 8.30 8.90
Source: World Economic Outlook; and Fund staff estimates. 69. In late 1997, Korean banks could not roll over short-term loans, despite the announced government guarantees for foreign debt. The Japanese banks, which were suffering from their growing NPLs, withdrew a large percentage of their loans.24 The 23 Short-term foreign borrowings (in foreign currency) were used to extend long-term loans (in domestic currency).
24 Foreign loans to Korea by Japanese financial institutions dropped from USD22 billion at the end of 1996 to USD9 billion by the end of 1997.
27
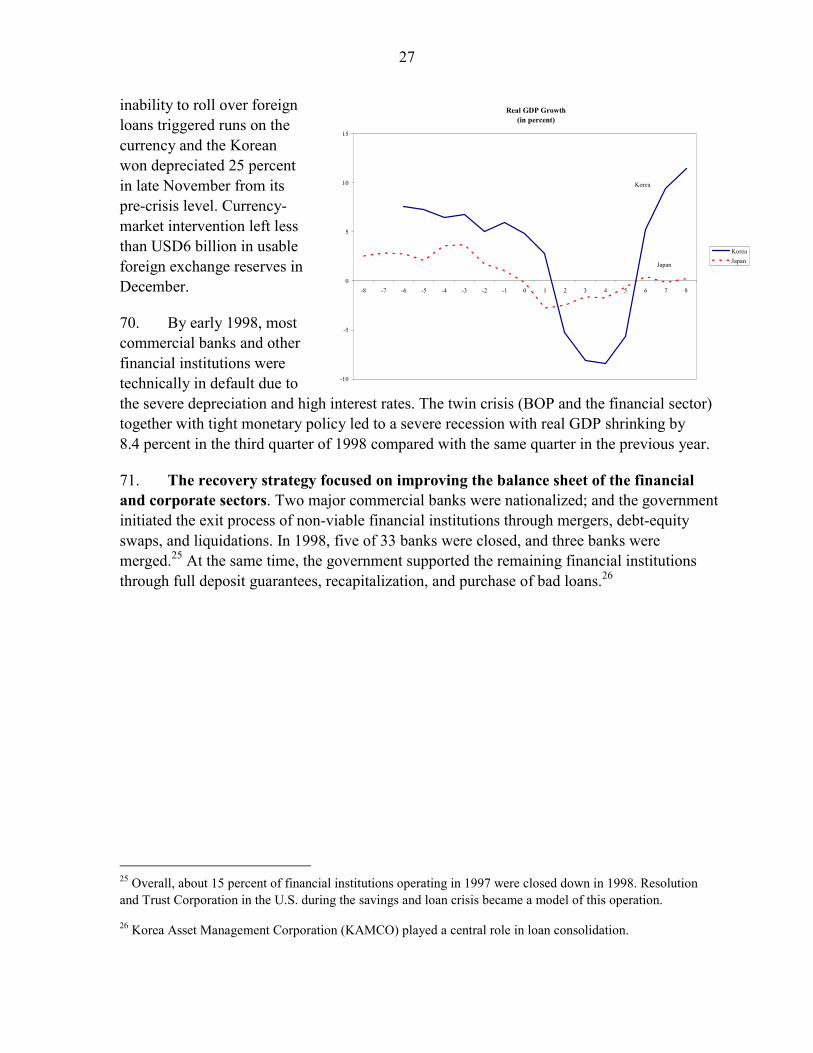
inability to roll over foreign loans triggered runs on the currency and the Korean won depreciated 25 percent in late November from its pre-crisis level. Currency-market intervention left less than USD6 billion in usable foreign exchange reserves in December.
70. By early 1998, most commercial banks and other financial institutions were technically in default due to the severe depreciation and high interest rates. The twin crisis (BOP and the financial sector) together with tight monetary policy led to a severe recession with real GDP shrinking by 8.4 percent in the third quarter of 1998 compared with the same quarter in the previous year.
71. The recovery strategy focused on improving the balance sheet of the financial and corporate sectors. Two major commercial banks were nationalized; and the government initiated the exit process of non-viable financial institutions through mergers, debt-equity swaps, and liquidations. In 1998, five of 33 banks were closed, and three banks were merged.25 At the same time, the government supported the remaining financial institutions through full deposit guarantees, recapitalization, and purchase of bad loans.26
25 Overall, about 15 percent of financial institutions operating in 1997 were closed down in 1998. Resolution and Trust Corporation in the U.S. during the savings and loan crisis became a model of this operation.
26 Korea Asset Management Corporation (KAMCO) played a central role in loan consolidation.
Real GDP Growth(in percent)
-10
-5
0
5
10
15
-8 -7 -6 -5 -4 -3 -2 -1 0 1 2 3 4 5 6 7 8
KoreaJapan
Korea
Japan

28
72. These measures helped to quickly stabilize the financial sector. Furthermore, the centralized support packages enabled the government to control most of the financial institutions’ decision-making process. Through its administrative power, the Financial Supervisory Commission pressured the commercial banks to roll over most of existing debt of small and medium enterprises until the end of 1998.27 At the same time, the banks, over which the government had control, led voluntary corporate debt workouts for large conglomerates. Various financial restructuring methods were used, including debt/equity swaps, asset sales, inducement of foreign investment, and new equity injection. Eight major creditor banks, identified as leading banks, took the responsibility for negotiating workouts with the 64 major corporate groups.28 In Korea, debt/equity swaps have proved to be a very effective method to restructure highly leveraged corporations and creditor banks.
73. In order to facilitate the restructuring process of the corporate sector, some legislative changes were made, including the liberalization of hostile takeover by foreigners; removing the limit to foreign ownership; provision of tax incentives; and measures to improve labor market flexibility. Fiscal support to the economy mostly focused on the financial sector. and despite the collapse of the real sector in 1998, little fiscal stimulus directly supporting aggregate demand was provided. Most of the financial (and institutional) resources that the government could mobilize were spent on stabilizing the financial sector and the balance sheet of the corporate sector. These efforts were followed by fast recovery of the economy in 1999–2000 (real growth at 9½ and 8½, respectively).
27 From July to November 1998, 90 percent of loans to SMEs were rolled over, which accounted for 36 percent of total loans to firms.
28 The negotiation was based on the workout plans prepared by the firms.
Purchase of bad loans Recapitalization Deposit guarantees Total
Banks 17.3 14.6 13.3 45.2
Non-banks 3.2 4.0 11.6 18.8
Total 20.5 18.6 24.9 64.0
Banks 3.5 3.0 2.7 9.2
Non-banks 0.7 0.8 2.4 3.8
Total 4.2 3.8 5.1 13.0
Use of Public Funds for Finanacial Sector Restructuring by End-1999
(In trillion won)
(In percent of 1997 GDP)
29
Key comparison between the Korean and the Japanese Government’s Responses to the Financial Crises
• The Korean government supported full scale evaluations of all financial institutions to assess the balance sheets. Based on this assessment, the government quickly decided which institutions would survive. The Korean government response was fast and aggressive (the package in support of financial institution amounted to 13 percent of GDP in 1998–99), and its support was provided with strong conditionality on managerial issues. On the contrary, the Japanese authorities were much slower in recognizing the scale of distress in the Japanese banking sector and in dealing with the problem. The initial support was small, and there was no initial effort to conduct a comprehensive clean-up of the bank balance sheet.
• While both countries had problems in the corporate sector balance sheet, their approaches to improve it were different. Korea’s ability to contain its downward spiral had a lot to do with the government’s role as a moderator in the financial market and its ability to facilitate corporate sector restructuring through creditor banks. The Korean government did not wait for market forces to stabilize the financial sector. Instead, it aggressively controlled the financial institutions to keep the country’s credit system intact and to push corporate sector restructuring.
• The Japanese government provided fiscal stimulus during 1998–99 (8 percent of GDP in two years) in addition to the fiscal support to the financial sector. The Korean government did not provide fiscal stimulus, but instead, a large amount of public resources were used to improve the balance sheet of the financial and corporate sector.
D. Savings and Loan (S&L) Crisis in the US (1980s–1990s)
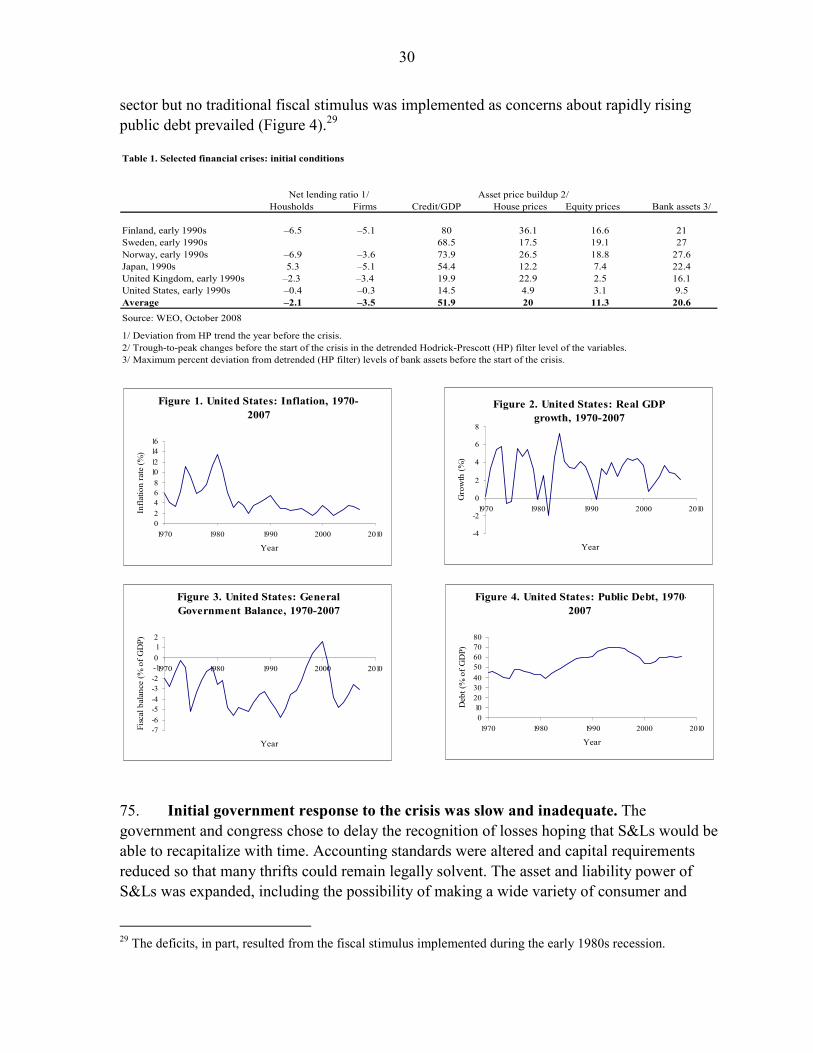
74. The Savings and Loans (S&L) Crisis of the 1980s and 1990s was a massive collapse of the thrift industry. S&Ls financed long-term fixed-rate residential mortgages with savings and time deposits at a restricted interest rate. This maturity mismatch exposed S&Ls to considerable interest rate risk when inflation rose in the 1970s (Figure 1) and monetary policy was tightened. S&Ls experienced enormous losses of net worth in 1979–82, and the early 1980s recession exacerbated the problem. From 1986 to mid-1995 about one half of all S&Ls (1,043) holding $519 billion in assets were closed or otherwise resolved. The resulting slowdown in the finance industry and the real estate market may have contributed to the 1990–91 recession. However, the financial position of households and non-financial corporations in the early 1990s was relatively strong especially compared to other countries that experienced a financial crises (Table 1), and the recession was short-lived and relatively mild (Figure 2). The government intervened to restore stability of the financial
30
sector but no traditional fiscal stimulus was implemented as concerns about rapidly rising public debt prevailed (Figure 4).29
Housholds Firms Credit/GDP House prices Equity prices
Finland, early 1990s –6.5 –5.1 80 36.1 16.6 21Sweden, early 1990s 68.5 17.5 19.1 27Norway, early 1990s –6.9 –3.6 73.9 26.5 18.8 27.6Japan, 1990s 5.3 –5.1 54.4 12.2 7.4 22.4United Kingdom, early 1990s –2.3 –3.4 19.9 22.9 2.5 16.1United States, early 1990s –0.4 –0.3 14.5 4.9 3.1 9.5Average –2.1 –3.5 51.9 20 11.3 20.6
Source: WEO, October 2008
1/ Deviation from HP trend the year before the crisis.
3/ Maximum percent deviation from detrended (HP filter) levels of bank assets before the start of the crisis.2/ Trough-to-peak changes before the start of the crisis in the detrended Hodrick-Prescott (HP) filter level of the variables.
Net lending ratio 1/ Asset price buildup 2/
Table 1. Selected financial crises: initial conditions
Bank assets 3/
Figure 2. United States: Real GDP growth, 1970-2007
-4
-2
0
2
4
6
8
1970 1980 1990 2000 2010
Year
Gro
wth
(%)
Figure 1. United States: Inflation, 1970-2007
02468
10121416
1970 1980 1990 2000 2010
Year
Infla
tion
rate
(%)
Figure 3. United States: General Government Balance, 1970-2007
-7-6-5-4-3-2-1012
1970 1980 1990 2000 2010
Year
Fisc
al b
alan
ce (%
of G
DP)
Figure 4. United States: Public Debt, 1970-2007
01020304050607080
1970 1980 1990 2000 2010
Year
Deb
t (%
of G
DP)
75. Initial government response to the crisis was slow and inadequate. The government and congress chose to delay the recognition of losses hoping that S&Ls would be able to recapitalize with time. Accounting standards were altered and capital requirements reduced so that many thrifts could remain legally solvent. The asset and liability power of S&Ls was expanded, including the possibility of making a wide variety of consumer and
29 The deficits, in part, resulted from the fiscal stimulus implemented during the early 1980s recession.
31
business loans and offering competitive interest rates on liabilities (phasing out of regulation Q).30 Deposit insurance was also increased and tax incentives for the acquisition of troubled S&Ls granted. This approach, however, did not work. These changes, in fact, aggravated the problem because under-capitalized S&Ls had incentives to invest in very risky projects, betting for survival. The deterioration in asset quality was exacerbated by shocks to energy and agricultural sectors. By 1986, the S&L deposit insurer FSLC, which assisted in the resolution of insolvencies, largely through mergers, became insolvent and, after being recapitalized twice with government money (total of $25.75 billion in 1986–87), was abolished in 1989.31
76. The subsequent overhaul of the thrift industry and federal deposit insurance helped resolve the crisis but at a high cost. The 1989 Financial Institutions Reform, Recovery and Enforcement Act (FIRREA) dramatically changed the savings and loan industry and its regulation narrowed the role of S&Ls and making them subject to more stringent capital requirements and regulatory scrutiny.32 A government-owned asset management company Resolution Trust Corporation (RTC) , with initial funds of $50 billion, assumed control of the assets of insolvent S&Ls and was charged with liquidating their assets. The funds proved insufficient and were subsequently raised to $105 billion between 1989 and 1995.33 RTC pioneered “equity partnerships” with private sector partner acquiring a partial interest in a pool of assets and controlling management and sale of these assets, and RTC contributing asset pools and financing. Unlike a direct asset sale, the RTC retained a residual interest, which entitled it to some proceeds throughout the life of the portfolio, which likely reduced net government cost. The total gross fiscal cost of S&L cleanup is estimated at $180 billion (3.3 percent of 1989 GDP). The net fiscal cost, contributing to fiscal deficits, is estimated at $124 billion (2.4 percent of GDP). Most of these costs could have been avoided if the government had recognized and responded to the losses in the early 1980s.
Lessons from S&L crisis • The delay in resolution of financial sector problems, including the failure to close
promptly insolvent financial institutions, increased the fiscal cost of the crisis. • Favorable initial conditions, including strong financial position of households and firms,
moderate credit growth and asset price build up at the onset of the crisis, tended to minimize the cost in terms of output loss and the need for additional fiscal stimulus.
• Insufficient funds allocated for capitalization of the insurance fund or the asset
management company delayed resolution of the crisis, thereby, increasing its cost. 30Deposit Institutions Deregulation and Monetary Control Act of 1980, Economic Recovery Tax Act in 1981 and Garn-St. Germain Act of 1982. 31 Federal Savings and Loan Insurance Corporation. 32 FIRREA dismantled FSLC; consolidated banks and S&L insurance agencies within FDIC and reformulated public policy goals of Freddie Mac and Fannie Mae. 33 Only $ 91.3 billion of the authorized $105 billion were eventually used.
32
• The asset management company operating through equity partnership with the private
sector proved to be a good solution for liquidating assets of insolvent financial institutions.34
• Government bailout related to mortgages during the S&L crisis may have created a moral
hazard and possibly encouraged lenders to make high risk loans during the current sub-prime mortgage crisis. In designing crisis resolution strategy measures should be taken to prevent moral hazard implications in the future.
E. The Nordic Banking and Economic Crises
77. Although the timing and severity of the crisis in the three Nordic countries (Norway, Sweden and Finland) were different, there are important common elements. The crisis in Norway preceded the other two as it was closely linked to international oil price fluctuations while the crises in Finland took the form of a severe depression (cumulative GDP fell by 14 percent over 1990–94 and the unemployment rate exploded from 3 to 20 percent over that period).
Unemployment Rate
02468
101214161820
1988 1989 1990 1991 1992 1993 1994 1995
Finland
Sweden
Norway
Real GDP Growth
-8
-6
-4
-2
0
2
4
6
1988 1989 1990 1991 1992 1993 1994 1995
Finland
Norway
Sweden
Fiscal Deficit(in percent of GDP)
-16
-14
-12
-10
-8
-6-4
-2
0
2
4
1988 1989 1990 1991 1992 1993 1994 1995
FinlandSweden
Norway
Total Debt(in percen of GDP)
0
10
20
30
40
50
60
70
1988 1989 1990 1991 1992 1993 1994 1995
Finland
Sweden
Norway
34 The evidence on the effectiveness of asset management companies in other countries has been mixed (Laeven and Valencia, 2008). They work better when the assets to be disposed are primarily real estate.

33
Gross NetFinland 1/ 9.0 5.3Norway 1/ 2.0 -
2/ 3.4 -0.4Sweden 1/ 3.6 0.21/ In percent of 1997 GDP2/ Present value, in percent of 2001 GDP
Fiscal costs of bank support
78. In these countries, an environment of positive economic performance, the liberalization of financial markets and international capital flows without an appropriate supervisory regime, fixed exchange rates, and positive terms of trade, led to a credit boom that fueled large increases in real estate and stock prices. The credit boom led to record levels of household indebtedness directed towards consumer durables and real estate (the ratio of household debt to net disposable income doubled). The corporate sector also experienced a major investment boom with the majority of investment activity occurring in residential and nonresidential construction, real estate and services. This boom increased inflation and external imbalances. Negative terms of trade shocks at the beginning of the 1990s (including the collapse of the Soviet Union in the case of Finland), higher interest rates after German reunification, and higher domestic interest rates to defend the peg, triggered a correction in real estate and stock prices that led to severe problems for highly indebted individuals and corporations, resulting in the crises in their financial systems.
79. In these countries, very few small banks were liquidated. In the majority of cases, the authorities either assumed ownership, or provided funds for banks to continue to operate. The governments in all three countries established crisis resolution agencies to manage the public support and the restructuring of the banking system. Finland and Sweden also introduced separate asset management companies to deal with non-performing assets from troubled banks. The treatment of ‘old’ shareholders was mixed but they either lost everything or took a significant hit. Most of the total costs of bank support were channeled through the budget.
80. Whereas it is clear that the financial crises had a significant impact in real economic activity, there is, at best, weak evidence that there was a credit crunch (defined as lack of bank capital and quantitative finance constraints as opposed to lack of credit demand from households and corporations).
81. The deterioration of the fiscal position was faster than anticipated and only partially related to cyclical factors. The authorities of the three countries, beyond providing significant budget support to banks, pursued fiscal policies to support activity and employment. However, although real GDP contraction was moderate, except in Finland, the increase in unemployment was large and persistent. The overall fiscal balance deteriorated significantly in all three countries. Over 1990–93 the overall fiscal deficit deteriorated 6, 16 and 13 percentage points of GDP in Norway, Sweden, and Finland, respectively. Staff reports at the time argued that only about half of the deterioration can be attributed to cyclical factors.

34
Key messages 82. The room for discretionary fiscal action over prolonged periods of time is limited even in countries where the initial fiscal position appeared to be strong. Sweden and Finland started the crisis with relatively low debt and fiscal deficits. The fiscal situation deteriorated to the point where the focus of attention shifted from counter-cyclical fiscal policies to fiscal sustainability.
83. Addressing financial market vulnerabilities is a necessary (although not sufficient) condition to prevent prolonged economic downturns. Preventing future spillovers from weaker economic activity into financial markets should be considered when designing fiscal stimulus packages. However, if the fiscal position deteriorates significantly, and the economic downturn persists, sustainability concerns may prevent fiscal policy from continuing to play a countercyclical role.

35
REFERENCES
Al-Eyd, Ali J. and Ray Barrell, 2005, “Estimating Tax and Benefit Multipliers in Europe,” Economic Modeling, Vol. 22, pp. 759–76.
Auebach, Alan, 2008, “How much should we rely on fiscal stimulus” presentation at the
Symposium on fiscal stimulus organized by the Federal Reserve. Bernanke, Ben and Martin Parkinson, 1989, Unemployment, Inflation, and Wages in the
American Depression: Are There Lessons for Europe?", AEA Papers and Proceedings, Vol. 79, No. 2, pp. 210-214.
Blanchard and Perotti, 2002, “An Empirical Characterization of the Dynamic Effects of
Changes in Government Spending and Taxes on Output,“ The Quarterly Journal of Economics, Vol. 117, No. 4, pp. 1329–68.
Broda, Christian and Jonathan Parter, 2008, “The Impact of the 2008 Tax Rebates on
Consumer Spending: Preliminary Evidence,” Mimeo, July 29. Brown, Cary E., 1956, "Fiscal Policy in the 'Thirties: A Reappraisal", The American
Economic Review, Vol. 46, No. 5, pp. 857-879. Bryant, Ralph, Dale Henderson, Gerald Holtham, Peter Hooper, and Steven Symansky, 1988,
“Empirical Macroeconomics for Interdependent Economies,” Supplemental Volume, The Brookings Institution, Washington, D.C.
Coronado, Julia Lynn and Joseph P. Lupton, and Louise M. Shiner, 2005, “The Household
Spending Response to the 2003 Tax Cut: Evidence from Survey Data,” Finance and Economics Discussion Series, No. 2005-32, Federal Reserve Board, Washington, D.C.
Dalsgaard, Thomas, Christophe Andre, and Pete Richardson, 2001, “Standard Shocks in the
OECD Interlink Model,” OECD, Economics Department Working Papers No. 306 De Long, J. Bradford and Lawrence H. Summers, 1988, "How Does Macroeconomic Policy
Affect Output?", Brookings Papers on Economic Activity, 1988: 2, pp. 433-80. Eggertsson, Gauti B., 2008, "Great Expectations and the End of the Depression", American
Economic Review, Vol. 98, No. 4, pp. 1476-1516. Elmendorf, Douglas and Jason Furman, 2008, “If, When, How: A Primer on Fiscal
Stimulus,” The Hamilton Project, Strategy Paper, The Brookings Institution, January 2008.
36
Elmendorf, Douglas W. and David L. Reifschneider, 2002, “Short-Run Effects of Fiscal
Policy with Forward-Looking Financial Markets,” National Tax Journal, Vol. LV, No. 3, September.
Freedman, Charles, Douglas Laxton, and Michael Kumhof, 2008, “Deflation and
Countercyclical Fiscal Policy,” Mimeo, December 2. Giavazzi, Francesco and Marco Pagano, 1990, “Can Severe Fiscal Contractions be
Expansionary? Tales of Two Small European Countries,” NBER Working Paper No. 3372.
Giavazzi, Francesco and Marco Pagano, 1996, “Non-Keynesian Effects of Fiscal Policy
Changes: International Evidence and the Swedish Experience,” Swedish Economic Policy Review, Vol. 3, 1, Spring.
Hansen, Alvin, 1941, "Fiscal Policy and Business Cycles". New York. W.W. Norton, 1941. Henry, Jerome, Pablo Hernandez de Cos, and Sandro Momigliano, 2004, “The Short-Term
Impact of Government Budgets on Prices. Evidence from Macroeconometric Models,” European Central Bank, Working Paper Series, No. 396.
Higgs, Robert, 1992, "Wartime Prosperity? A Reassessment of the U.S. Economy in the
1940s," The Journal of Economic History, 52 (March 1992), pp. 41-60 HM Treasury, 2003, “Fiscal Stabilization and EMU,” Discussion Paper. International Monetary Fund, 2008, “World Economic Outlook. Financial Stress, Downturns,
and Recoveries,” October, Chapter 5. Johnson, David, Jonathan Parker, and Nicholas Souleles, 2006, “Household Expenditure and
the Income Tax Rebates of 2001,“ The American Economic Review, Vol. 96, No. 5, pp. 1589–1610.
Laeven, Luc and Fabian Valencia, 2008, “Systemic Banking Crises: A New Database”, IMF
Working Paper, WP/08/224. Moody’sEconomy.com, 2008, “A Second Quick Boost From Government Could Spark
Recovery,” excerpts of testimony by Mark Zandi before the U.S. House Committee on Small Business, July 24.
Perotti, Roberto, 2006, “Public investment and the Golden Rule: another (different) look,“
Mimeo.

37
Ramey, Valerie, 2008, “Identifying Government Spending Shocks: It’s All in the Timing,”
Mimeo. Rauchway, Eric, 2008, "The Great Depression and the New Deal: A Very Short
Introduction", Oxford University Press. Romer, Christina D., 1992, "What Ended the Great Depression?", The Journal of Economic
History, Vol. 52, No. 4, pp. 757-784. Romer, Christina and David Romer, 2008, “The Macroeconomic Effects of Tax Changes:
Estimates Based on a New Measure of Fiscal Shocks,” University of California, Berkeley, mimeo, November.
Smithies, Arthur, 1946, "The American Economy in the Thirties", The American Economic
Review, Vol. 36, pp. 11-27. Studenski, Paul and Herman Krooss, 1952, "A Financial History of the United States", NY,
McGraw-Hill. Vernon, J.R., 1994, "World War II Fiscal Policies and the End of the Great Depression,"
The Journal of Economic History, Vol. 54, Issue 4, pp. 850-868.