fiscal decentralization in china - world...
TRANSCRIPT
1
Fiscal Decentralization in China: History, Impact, Challenges and Next Steps
Chunli Shen
University of Maryland, USA
Jing Jin
Central University of Finance and Economics, China
Heng-fu Zou
Peking University, Wuhan University, China, and the World Bank
(November 28, 2006)
The findings, interpretations, and conclusions expressed in this paper are entirely those of the authors. They do not necessarily represent the view of the World Bank, its Executive Directors, or the countries they represent.
Mailing address: Heng-fu Zou, The World Bank, Development Research Group, 1818 H St. NW, Washington, DC 20433, USA. Email: [email protected]; Tel. 202-473-7939; Fax: 202-522-1154.
2
Introduction The last decade has witnessed a world trend of fiscal decentralization in the developing
countries as an escape from inadequate growth and inefficient governance. With respect to
China, fiscal decentralization has been a fundamental aspect of its transition to a market
economy; and the country has made substantial efforts to break down its highly centralized
fiscal management system with various forms of fiscal contracting systems (1978-1993)
and later a tax sharing system (1994-present).
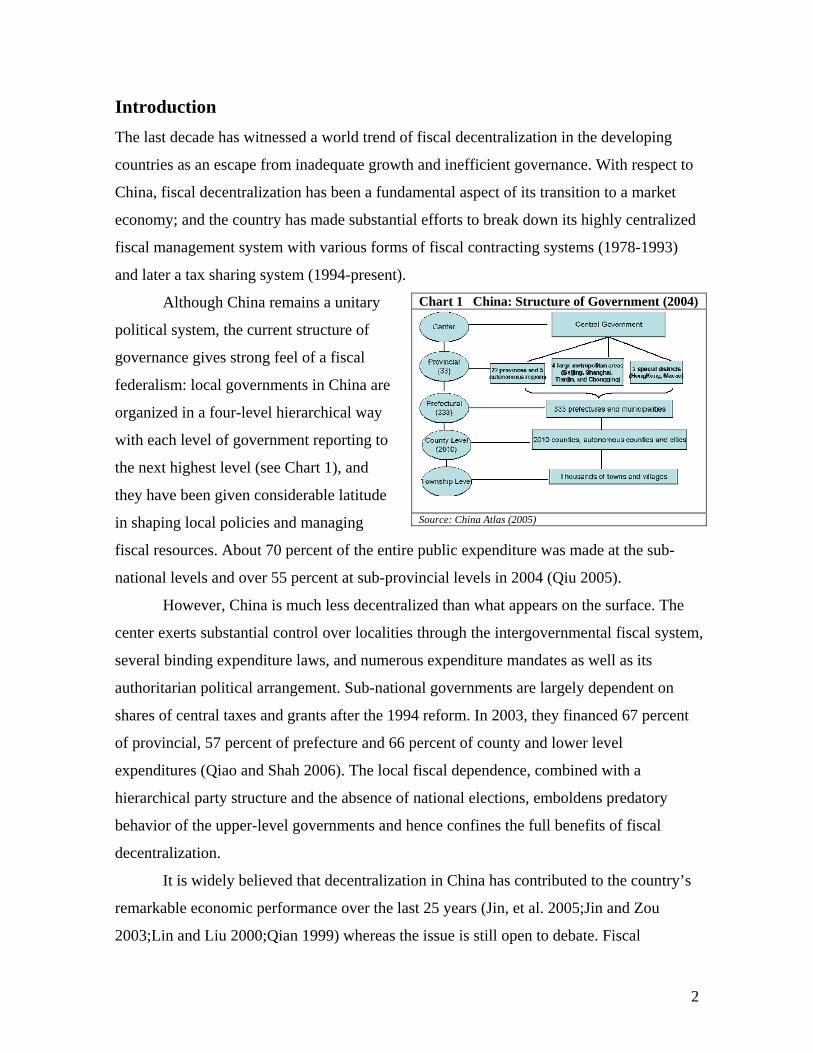
Although China remains a unitary
political system, the current structure of
governance gives strong feel of a fiscal
federalism: local governments in China are
organized in a four-level hierarchical way
with each level of government reporting to
the next highest level (see Chart 1), and
they have been given considerable latitude
in shaping local policies and managing
fiscal resources. About 70 percent of the entire public expenditure was made at the sub-
national levels and over 55 percent at sub-provincial levels in 2004 (Qiu 2005).
However, China is much less decentralized than what appears on the surface. The
center exerts substantial control over localities through the intergovernmental fiscal system,
several binding expenditure laws, and numerous expenditure mandates as well as its
authoritarian political arrangement. Sub-national governments are largely dependent on
shares of central taxes and grants after the 1994 reform. In 2003, they financed 67 percent
of provincial, 57 percent of prefecture and 66 percent of county and lower level
expenditures (Qiao and Shah 2006). The local fiscal dependence, combined with a
hierarchical party structure and the absence of national elections, emboldens predatory
behavior of the upper-level governments and hence confines the full benefits of fiscal
decentralization.
It is widely believed that decentralization in China has contributed to the country’s
remarkable economic performance over the last 25 years (Jin, et al. 2005;Jin and Zou
2003;Lin and Liu 2000;Qian 1999) whereas the issue is still open to debate. Fiscal
Chart 1 China: Structure of Government (2004)
Source: China Atlas (2005)
3
decentralization has also brought many unintended problems, including increasing regional
disparities, proliferation of off-budgetary funds, deficient and unequal public services
delivery, farmers’ financial burden and rural unrest.
The objectives of this paper are to review the experience of China’s fiscal
decentralization, explore the impact of fiscal decentralization on growth and public
expenditures, and identify political as well as economic issues arising after 1994 tax
sharing reform in the last decade.
After some background discussions, this paper is divided into six main parts:
section 2 briefly summaries the process of China’s fiscal decentralization; section 3
examines the expenditure and revenue assignments as well as the intergovernmental
transfer system; section 4 addresses various issues related to local government financing,
including local taxes, intergovernmental transfers, and local borrowing; section 5 assesses
the shifting of fiscal power between the central government and local governments through
decentralization; section 6 analyzes the effects of fiscal decentralization on economic
growth; section 7 highlights political and economic issues induced by the fiscal
decentralization reforms; and the paper concludes with potential policy options.
1. Economic and Political Background of the 1994 Tax Sharing Reform
The rigid centralization of planning, finance, and administration, adopted from the Soviet
Union, dominated the first 30 years of the People's Republic (1949-79). However, the
central planning system did not thrive in the pre-industrial, agrarian, and under-developed
conditions of China. At the dawn of the reform period in the late 1970s, the centralized
system was already decimated: provincial and local governments ran most enterprises and
took responsible for planning and economic administration within their jurisdictions.
Nevertheless, the fiscal system was still highly centralized: the consolidated budget system
forbid the discretionary spending power of the local governments; revenues, largely from
the profit remittances of state-owned enterprises (SOEs), were collected by local
governments and accrued to the center (Riskin 2000;Wong 2000;Wong, et al. 1995).
As China’s leaders set their sights on a market economy beginning in 1979, the
mechanisms of the planned economy, including the monopoly state ownership of industry,
4
administrative prices, and the central economic planning, were dismantled and accordingly
the fiscal system broke down quickly. While some scholars (Lin and Liu 2000) reckon
these changes as a more or less carefully thought out response to China's changing needs,
many scholars believe that the evolution of China’s fiscal decentralization has been an ad
hoc and uncoordinated process; it was mainly driven by the collapse of the old fiscal
system as the central government trying to tackle dysfunctional behavior under the
pressure induced by reforms (Wong 2000). This breakdown was inevitable with the
erosion of the SOE profits - the foundation of the previous fiscal system – in the face of
burgeoning non-state sector, growing competition imposed on SOEs, and rising wages and
resource prices. Furthermore, tax administration was enormously challenged by the rapidly
changing conditions and the proliferation of enterprises of various ownership forms. The
government revenue collection plummeted from 35 percent of GDP in the late 1970s to
just 12.6 percent in 1993. The devolution of fiscal responsibilities to lower levels appeared
prevalent in coping with mounting fiscal stress. The center, increasingly revenue-
dependent on local governments, was left no choice but negotiate with localities for its
own share. The fiscal system was on the verge of crash, and a number of different revenue
sharing systems were tried out during the 1980s.
Despite the persistent efforts to revamp the malfunctioning fiscal system, the late
80s and early 90s were marked by a continuing decline of the “two ratios” (budgetary
revenue to GDP and central to total budgetary revenue), interference of local governments
in the private sector, increasing regional fiscal disparities, devolution of expenditure
responsibilities accompanied by diversion of resources away from formal budget into
extra-budgetary channels, and ongoing distrust between center and localities.
Fiscal Decline
This 1988 fiscal contracting system further dampened fiscal power at the center.
Since the revenue assignment was not clear, local governments continued to appropriate
central revenues. The center relied on local tax collection, which was highly subject to
local authorities who frequently granted tax exemptions without proper central
authorization. The local abuse of tax power intrigued a vicious cycle of jurisdictional
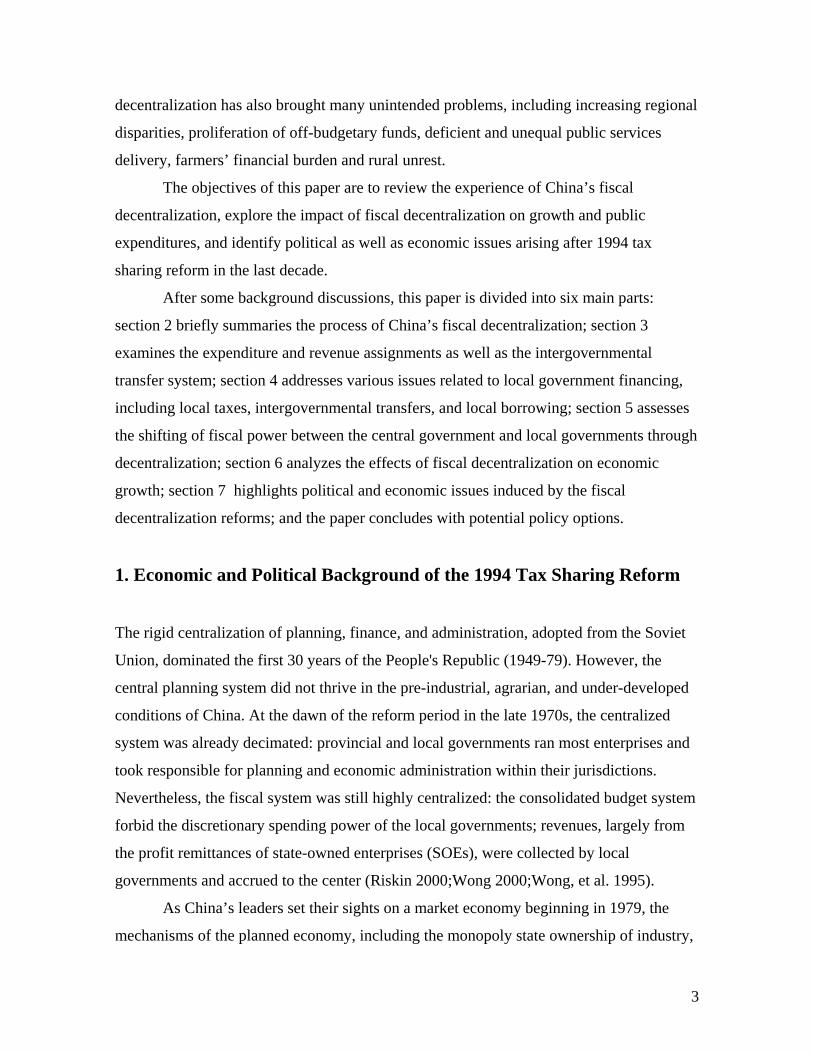
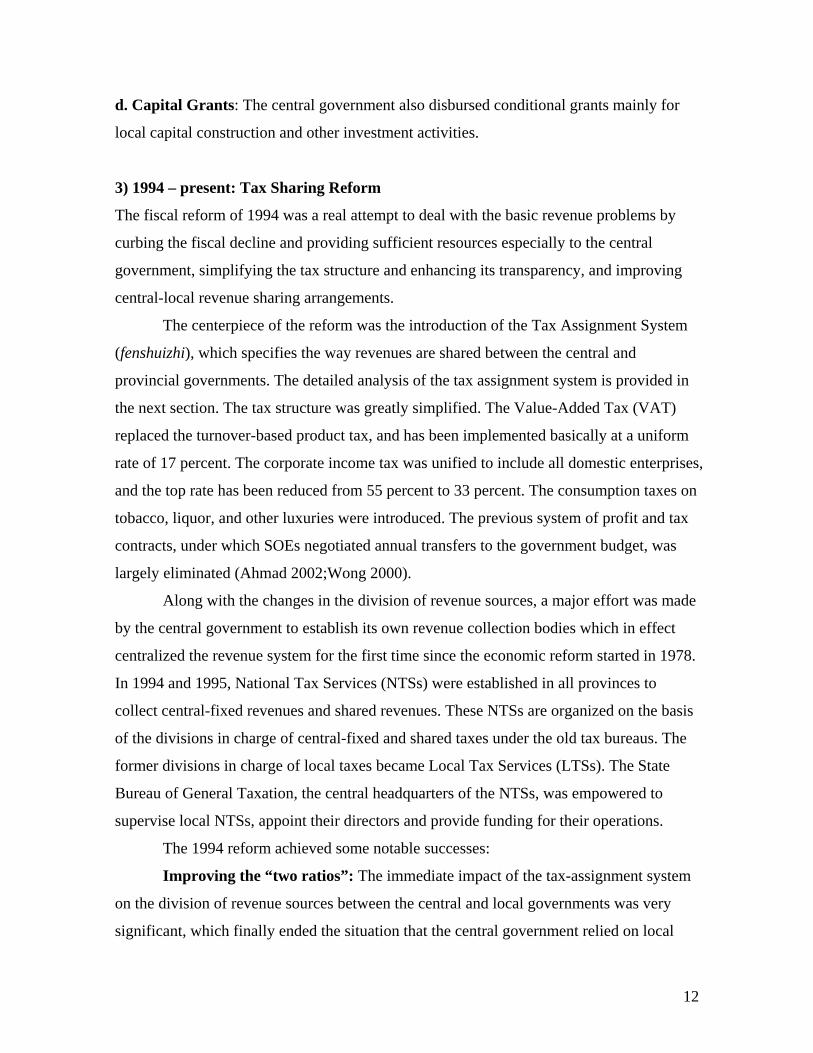
competition. The central government’s shared of revenue fell from 33 percent in 1988 to
5
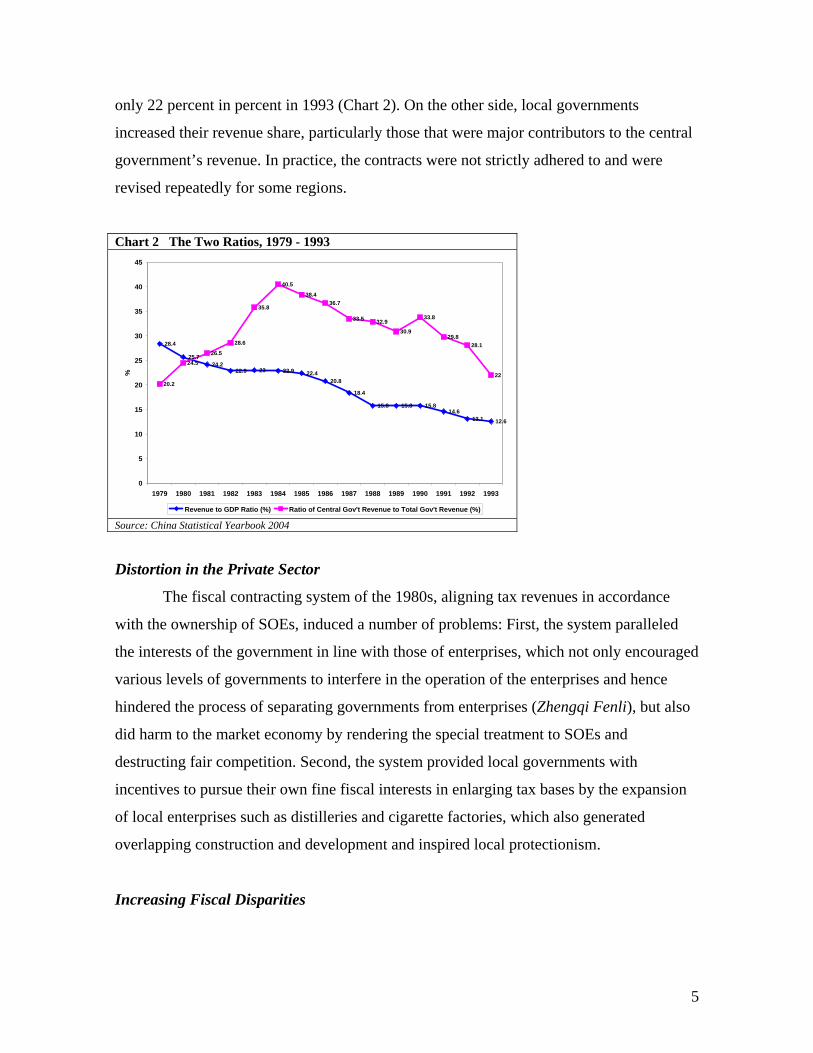
only 22 percent in percent in 1993 (Chart 2). On the other side, local governments
increased their revenue share, particularly those that were major contributors to the central
government’s revenue. In practice, the contracts were not strictly adhered to and were
revised repeatedly for some regions.
Chart 2 The Two Ratios, 1979 - 1993
28.4
25.724.2
22.9 23 22.9 22.420.8
18.4
15.8 15.8 15.814.6
13.1 12.6
20.2
24.526.5
28.6
35.8
40.5
38.436.7
33.5 32.930.9
33.8
29.828.1
22
0
5
10
15
20
25
30
35
40
45
1979 1980 1981 1982 1983 1984 1985 1986 1987 1988 1989 1990 1991 1992 1993
%
Revenue to GDP Ratio (%) Ratio of Central Gov't Revenue to Total Gov't Revenue (%)
Source: China Statistical Yearbook 2004
Distortion in the Private Sector
The fiscal contracting system of the 1980s, aligning tax revenues in accordance
with the ownership of SOEs, induced a number of problems: First, the system paralleled
the interests of the government in line with those of enterprises, which not only encouraged
various levels of governments to interfere in the operation of the enterprises and hence
hindered the process of separating governments from enterprises (Zhengqi Fenli), but also
did harm to the market economy by rendering the special treatment to SOEs and
destructing fair competition. Second, the system provided local governments with
incentives to pursue their own fine fiscal interests in enlarging tax bases by the expansion
of local enterprises such as distilleries and cigarette factories, which also generated
overlapping construction and development and inspired local protectionism.
Increasing Fiscal Disparities
6
The system also contributed to greater regional fiscal disparities. With a great
variety of fiscal contracts in use, the system was a chief result of political negotiation
between the central and individual province; it worked in a way detrimental to the poor
regions. Rich provinces in the East like Canton, Shanghai, and Shandong, were able to
have more advantageous contracts because of the development strategies and their political
leverage.
Devolution of Fiscal Responsibilities and Growing Distrust between Center and Local
On one hand, fiscal stress at the center forced Beijing to cut intergovernmental
transfers and meanwhile shed more spending responsibilities to the lower levels of
government. On the other hand, local expenditure grew much faster than central
expenditures, especially unemployment insurance, pension funds, and housing subsidies.
The share of local expenditure rose from 45 percent of the total in 1981 to about 72 percent
in 1993. The role of local governments shifted from simply providing services to acting as
both financier and provider.
A climate of distrust surrounded intergovernmental fiscal relations in the early
1990s. The central government recognized the continuing fiscal decline partly due to local
government unwillingness to collect taxes while diverting funds from budgetary to extra-
budgetary channels. From the local perspective, the repeated changes in revenue sharing
rules were viewed as a sign of lacking firm commitment at the center to build solid local
finance. Moreover, during the 1980s, on several occasions the central government revised
the ownership of key sectors and introduced new levies to increase its share of revenues,
e.g. the Energy and Transport Key Construction Fund and the Budget Adjustment Fund.
The central government also “borrowed” revenue from local governments as a way to
absorb some excessive local revenues. The manipulative actions by the center convinced
local governments that surplus revenues were not safe from the center’s predatory behavior,
and thus significant amount of revenues was switched subtly into myriad extra-budgetary
funds (Ahmad 2002;Wong, et al. 1995).
When the 1988–90 system was supposed to expire in 1991, Beijing failed to pursue
alternative approaches; the contracting system was extended until the end of 1993. A

7
radical reform of the fiscal system was finally cooked out in 1994 at the climax of the
fiscal struggle.
2. History of Fiscal Decentralization in China
China has made substantial efforts to decentralize its fiscal management system. The
1980s’ and early 1990s’ reforms were aimed at promoting local economic development
through increasing local governments’ responsibilities and their autonomy in carrying out
fiscal functions, while preserving an adequate degree of fiscal control for the central
government. The strategy did boost local growth in many regions, but it also brought many
unintended problems including declining general government revenues, waning fiscal
position of the overall government, weakening macroeconomic management, and rising
regional disparities. At the culmination of the struggle, the 1994 Tax Sharing Reform was
initiated as the first attempt to fix the intergovernmental fiscal system as the main purpose.
However, the grand undertaking was undermined by preserving many features of the pre-
reform arrangements: a lump-sum transfer, or tax rebate, was established to guarantee the
coastal provinces’ pre-1994 income level, and it remains a dominant plank of the total
central transfers until today; the vague responsibilities assignment between levels of
governments was left unaddressed, which is indeed a principal cause of starved local
finance and the enduring quandary of extra- and off – budget revenues; and furthermore,
the equalization transfer has remained small after a decade of implementation which
further deteriorates the relations between central and local governments.
1) 1949-1978 Pre-Reform Fiscal System – Central Control System
The fiscal system installed by the new regime in the 1950s largely ensembles the Soviet
practice. Over the period 1949-79, China government made several attempts to overcome
the rigid centralization of planning, finance, and administration. At the inception of the
reform period in the late 1970s, China was already characterized by many features of fiscal
federalism: provincial and local governments ran most enterprises and were responsible for
planning and economic administration within their jurisdictions. Nevertheless, Beijing
determines every aspect of the fiscal system. It is a simple and effective system under pre-
8
reform conditions, but one completely lacking in fiscal incentives for local governments or
enterprises (Lardy 1978;Oksenberg and Tong 1991;Riskin 2000;Wong 2000;Wong, et al.
1995).
Tax System
The tax system was crude with only few tax types even absent of income and
corporate taxes. Revenues were largely raised from the profit remittances from, and taxes
on, state-owned enterprises (SOEs), whose profitability was ensured by the structure of
state-fixed prices. At the end of the 1970s, profits from SOEs accounted for nearly half of
total government revenues. Although the provinces participated in raising revenues, their
expenditures were budgeted by the center.
Tax administration was simple since there were relatively few taxpayers – mainly
SOEs. Tax collection was delegated to local governments. The accounts of SOEs were
easy to monitor: given fixed prices, planned output and sales, tax capacity and tax effort
were easy to determine. Taxes and profits, collected locally, were transferred back to the
local governments according to the local spending needs approved by the center (Wong
2000).
Expenditure and Budget
Expenditures were essentially all determined at the center. Under the consolidated
budget system, the central government set spending priorities, approved local budgets, and
determined civil service salary scale, pension and unemployment benefits, educational and
health care standards, etc.; sub-national governments, in the absence of independent
budgets, lacked discretionary spending power. Local governments, as budgetary units
identical to SOEs, were agents of the central government.
With respect to expenditure assignment, the central government was responsible for
national defense, economic development (capital spending, R&D, universities and research
institutes), industrial policy, and administration of national institutions such as the judicial
system. Local governments were in charge of delivering day-to-day public administration
and social services such as primary and secondary education, public safety, health care,
social security, housing, and other local/urban services.
9
The Intergovernmental Transfer System: Fiscal Gap Transfers
Since local finance came from the central budget, intergovernmental transfers were
set to finance the gap between locally collected revenues and permitted local expenditures.
In other words, local income in excess of expenses, was to be transferred to the central
government and shortfalls were to be covered automatically. This revenue sharing system
was highly redistributive: for example, while Shanghai gave up 80-90 percent of its
collected revenues, Guizhou was able to finance more than two-thirds of its expenditures
from central subsidies (Wong 2000). Such a system was highly devoted to the equalization
concerns.
2) 1979 – 1993 Ad Hoc Decentralization -- Fiscal Contract System
The prominent features of the period 1979-1993 comprised a significant reduction in fiscal
revenue collection as a percentage of GDP and a conspicuous falling trend of central
revenues. As the tax effort at the local level could no longer be monitored, the central
government was forced to negotiate with increasingly disobedient local governments on
revenue shares. From 1980, three different revenue sharing systems were introduced and
abandoned as they all failed to reverse the trend of falling fiscal revenues, but induced
undesired malpractices one after another. On the positive side, fiscal reforms during this
period provided the device to mobilize local revenue collection in an effort to promote
local economic development.
1980 Contract Responsibility System
A fiscal revenue sharing system replaced the highly centralized system in 1980.
From then on, the central and provincial governments each began to ‘eat in separate
kitchens’, which provided sub-national governments with an incentive to collect revenue.
Under that system, central-provincial sharing rules were established by the central
government; provincial-municipal relations were governed by the province; and this
principal extended to lower levels. There were three basic types of revenues under the
reformed system: central-fixed revenues, local-fixed revenues, and shared revenues.
During the period 1980–84, about 80% of the shared revenues were remitted to the central
10
government and 20% were retained by local governments. The bases and rates of all the
taxes, whether shared or fixed, were determined by the central government. Enterprises
were supposed to pay taxes to the level of government they subordinate to. Almost all
revenues, except a few minor central-fixed revenues, were collected by the local finance
bureaus.
1985 Modified Contract Responsibility System
The uniform-sharing formula during the period 1980-1984 created undesired
surpluses in affluent provinces and deficits in poor provinces although the reform boosted
more revenue collection in many localities. In 1985, the State Council redesigned revenue-
sharing arrangements by varying schedules based on localities’ budget balances in the
previous years. The financially weak provinces were allowed to retain more revenues, but
the wealthier regions, like Shanghai, Beijing, Tianjin, Liaoning, Jiangsu, and Zhejiang,
were penalized by remitting more revenues to the center. As a consequence, the revenues
from these regions generally grew more slowly than the national average since the high
level of remittance curbed local enthusiasm for expanding their tax bases.
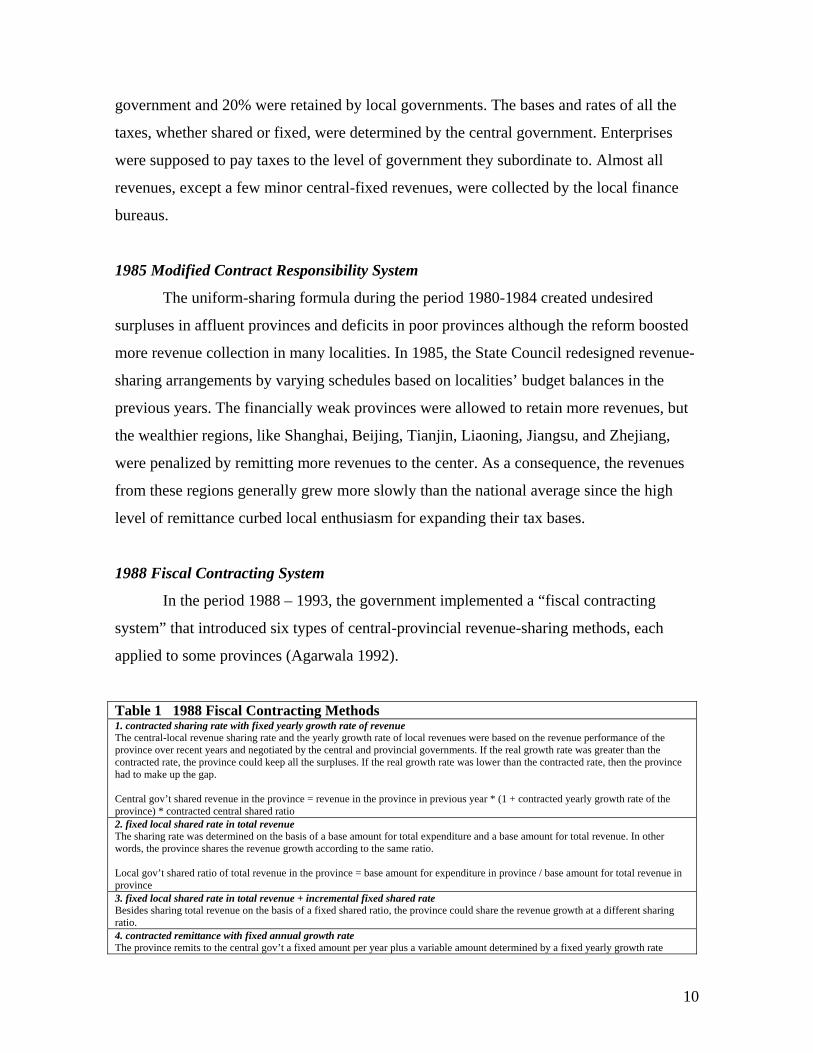
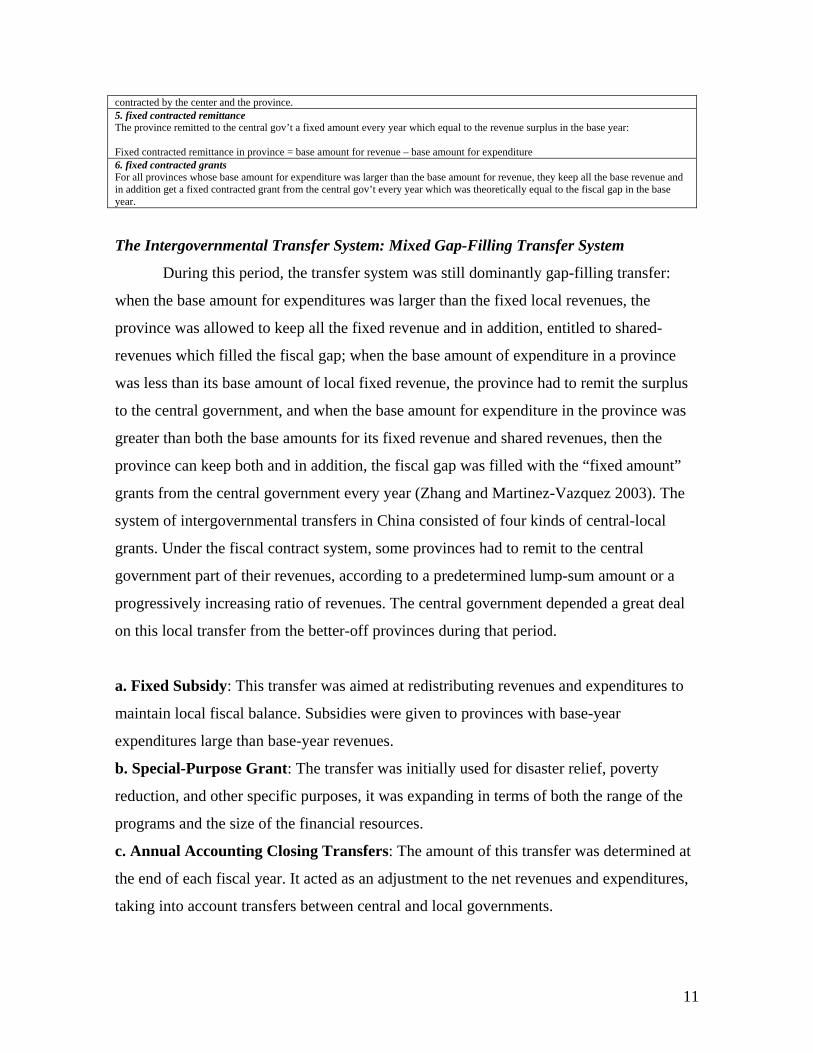
1988 Fiscal Contracting System
In the period 1988 – 1993, the government implemented a “fiscal contracting
system” that introduced six types of central-provincial revenue-sharing methods, each
applied to some provinces (Agarwala 1992).
Table 1 1988 Fiscal Contracting Methods 1. contracted sharing rate with fixed yearly growth rate of revenue The central-local revenue sharing rate and the yearly growth rate of local revenues were based on the revenue performance of the province over recent years and negotiated by the central and provincial governments. If the real growth rate was greater than the contracted rate, the province could keep all the surpluses. If the real growth rate was lower than the contracted rate, then the province had to make up the gap. Central gov’t shared revenue in the province = revenue in the province in previous year * (1 + contracted yearly growth rate of the province) * contracted central shared ratio 2. fixed local shared rate in total revenue The sharing rate was determined on the basis of a base amount for total expenditure and a base amount for total revenue. In other words, the province shares the revenue growth according to the same ratio. Local gov’t shared ratio of total revenue in the province = base amount for expenditure in province / base amount for total revenue in province 3. fixed local shared rate in total revenue + incremental fixed shared rate Besides sharing total revenue on the basis of a fixed shared ratio, the province could share the revenue growth at a different sharing ratio. 4. contracted remittance with fixed annual growth rate The province remits to the central gov’t a fixed amount per year plus a variable amount determined by a fixed yearly growth rate
11
contracted by the center and the province. 5. fixed contracted remittance The province remitted to the central gov’t a fixed amount every year which equal to the revenue surplus in the base year: Fixed contracted remittance in province = base amount for revenue – base amount for expenditure 6. fixed contracted grants For all provinces whose base amount for expenditure was larger than the base amount for revenue, they keep all the base revenue and in addition get a fixed contracted grant from the central gov’t every year which was theoretically equal to the fiscal gap in the base year.
The Intergovernmental Transfer System: Mixed Gap-Filling Transfer System
During this period, the transfer system was still dominantly gap-filling transfer:
when the base amount for expenditures was larger than the fixed local revenues, the
province was allowed to keep all the fixed revenue and in addition, entitled to shared-
revenues which filled the fiscal gap; when the base amount of expenditure in a province
was less than its base amount of local fixed revenue, the province had to remit the surplus
to the central government, and when the base amount for expenditure in the province was
greater than both the base amounts for its fixed revenue and shared revenues, then the
province can keep both and in addition, the fiscal gap was filled with the “fixed amount”
grants from the central government every year (Zhang and Martinez-Vazquez 2003). The
system of intergovernmental transfers in China consisted of four kinds of central-local
grants. Under the fiscal contract system, some provinces had to remit to the central
government part of their revenues, according to a predetermined lump-sum amount or a
progressively increasing ratio of revenues. The central government depended a great deal
on this local transfer from the better-off provinces during that period.
a. Fixed Subsidy: This transfer was aimed at redistributing revenues and expenditures to
maintain local fiscal balance. Subsidies were given to provinces with base-year
expenditures large than base-year revenues.
b. Special-Purpose Grant: The transfer was initially used for disaster relief, poverty
reduction, and other specific purposes, it was expanding in terms of both the range of the
programs and the size of the financial resources.
c. Annual Accounting Closing Transfers: The amount of this transfer was determined at
the end of each fiscal year. It acted as an adjustment to the net revenues and expenditures,
taking into account transfers between central and local governments.
12
d. Capital Grants: The central government also disbursed conditional grants mainly for
local capital construction and other investment activities.
3) 1994 – present: Tax Sharing Reform
The fiscal reform of 1994 was a real attempt to deal with the basic revenue problems by
curbing the fiscal decline and providing sufficient resources especially to the central
government, simplifying the tax structure and enhancing its transparency, and improving
central-local revenue sharing arrangements.
The centerpiece of the reform was the introduction of the Tax Assignment System
(fenshuizhi), which specifies the way revenues are shared between the central and
provincial governments. The detailed analysis of the tax assignment system is provided in
the next section. The tax structure was greatly simplified. The Value-Added Tax (VAT)
replaced the turnover-based product tax, and has been implemented basically at a uniform
rate of 17 percent. The corporate income tax was unified to include all domestic enterprises,
and the top rate has been reduced from 55 percent to 33 percent. The consumption taxes on
tobacco, liquor, and other luxuries were introduced. The previous system of profit and tax
contracts, under which SOEs negotiated annual transfers to the government budget, was
largely eliminated (Ahmad 2002;Wong 2000).
Along with the changes in the division of revenue sources, a major effort was made
by the central government to establish its own revenue collection bodies which in effect
centralized the revenue system for the first time since the economic reform started in 1978.
In 1994 and 1995, National Tax Services (NTSs) were established in all provinces to
collect central-fixed revenues and shared revenues. These NTSs are organized on the basis
of the divisions in charge of central-fixed and shared taxes under the old tax bureaus. The
former divisions in charge of local taxes became Local Tax Services (LTSs). The State
Bureau of General Taxation, the central headquarters of the NTSs, was empowered to
supervise local NTSs, appoint their directors and provide funding for their operations.
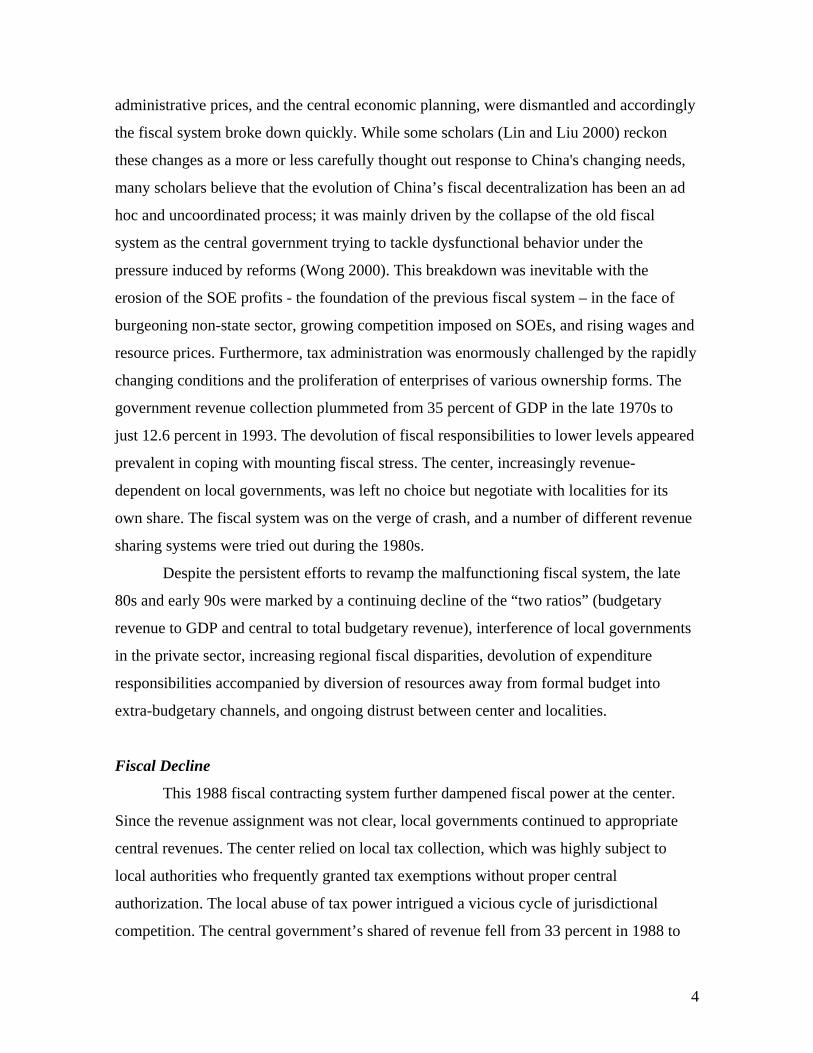
The 1994 reform achieved some notable successes:
Improving the “two ratios”: The immediate impact of the tax-assignment system
on the division of revenue sources between the central and local governments was very
significant, which finally ended the situation that the central government relied on local
13
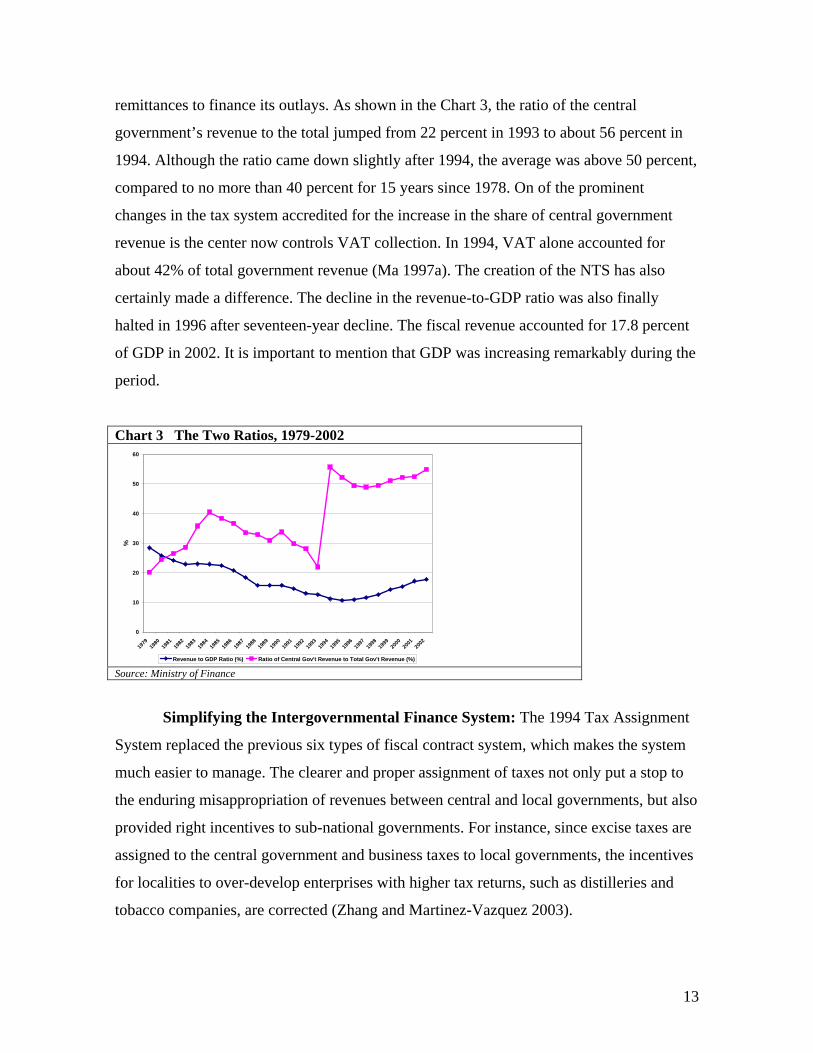
remittances to finance its outlays. As shown in the Chart 3, the ratio of the central
government’s revenue to the total jumped from 22 percent in 1993 to about 56 percent in
1994. Although the ratio came down slightly after 1994, the average was above 50 percent,
compared to no more than 40 percent for 15 years since 1978. On of the prominent
changes in the tax system accredited for the increase in the share of central government
revenue is the center now controls VAT collection. In 1994, VAT alone accounted for
about 42% of total government revenue (Ma 1997a). The creation of the NTS has also
certainly made a difference. The decline in the revenue-to-GDP ratio was also finally
halted in 1996 after seventeen-year decline. The fiscal revenue accounted for 17.8 percent
of GDP in 2002. It is important to mention that GDP was increasing remarkably during the
period.
Chart 3 The Two Ratios, 1979-2002
0
10
20
30
40
50
60
1979
1980
1981
1982
1983
1984
1985
1986
1987
1988
1989
1990
1991
1992
1993
1994
1995
1996
1997
1998
1999
2000
2001
2002
%
Revenue to GDP Ratio (%) Ratio of Central Gov't Revenue to Total Gov't Revenue (%) Source: Ministry of Finance
Simplifying the Intergovernmental Finance System: The 1994 Tax Assignment
System replaced the previous six types of fiscal contract system, which makes the system
much easier to manage. The clearer and proper assignment of taxes not only put a stop to
the enduring misappropriation of revenues between central and local governments, but also
provided right incentives to sub-national governments. For instance, since excise taxes are
assigned to the central government and business taxes to local governments, the incentives
for localities to over-develop enterprises with higher tax returns, such as distilleries and
tobacco companies, are corrected (Zhang and Martinez-Vazquez 2003).
14
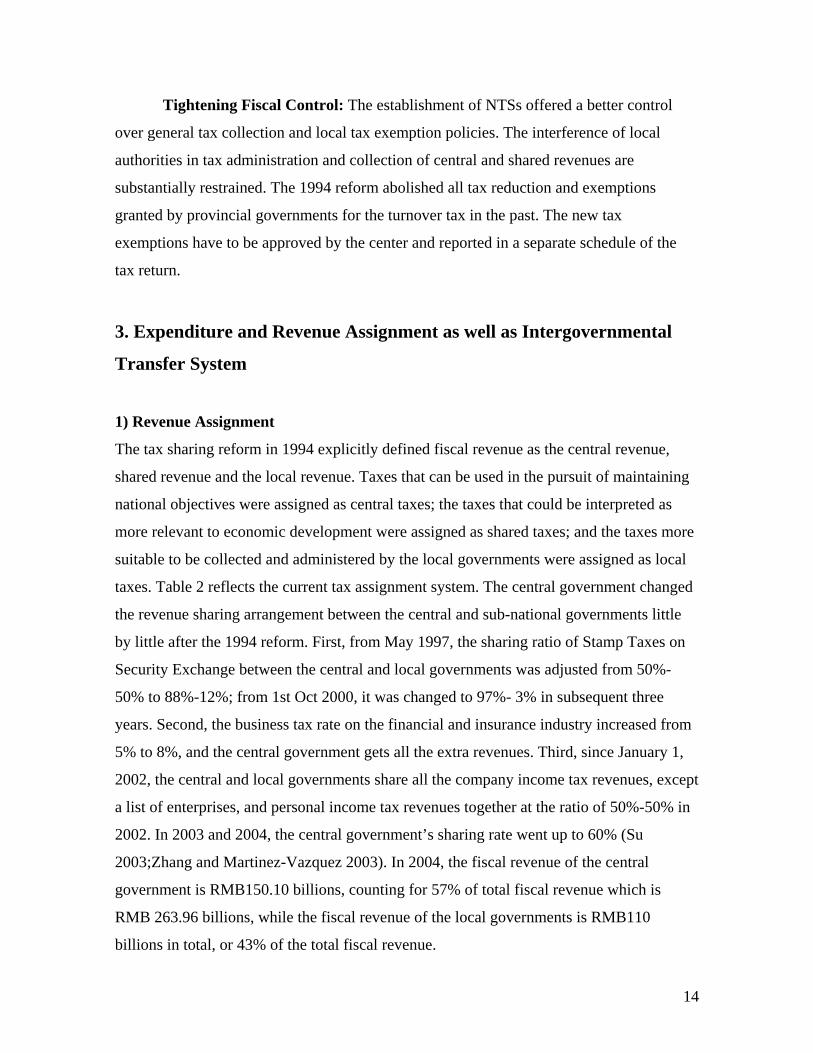
Tightening Fiscal Control: The establishment of NTSs offered a better control
over general tax collection and local tax exemption policies. The interference of local
authorities in tax administration and collection of central and shared revenues are
substantially restrained. The 1994 reform abolished all tax reduction and exemptions
granted by provincial governments for the turnover tax in the past. The new tax
exemptions have to be approved by the center and reported in a separate schedule of the
tax return.
3. Expenditure and Revenue Assignment as well as Intergovernmental
Transfer System
1) Revenue Assignment
The tax sharing reform in 1994 explicitly defined fiscal revenue as the central revenue,
shared revenue and the local revenue. Taxes that can be used in the pursuit of maintaining
national objectives were assigned as central taxes; the taxes that could be interpreted as
more relevant to economic development were assigned as shared taxes; and the taxes more
suitable to be collected and administered by the local governments were assigned as local
taxes. Table 2 reflects the current tax assignment system. The central government changed
the revenue sharing arrangement between the central and sub-national governments little
by little after the 1994 reform. First, from May 1997, the sharing ratio of Stamp Taxes on
Security Exchange between the central and local governments was adjusted from 50%-
50% to 88%-12%; from 1st Oct 2000, it was changed to 97%- 3% in subsequent three
years. Second, the business tax rate on the financial and insurance industry increased from
5% to 8%, and the central government gets all the extra revenues. Third, since January 1,
2002, the central and local governments share all the company income tax revenues, except
a list of enterprises, and personal income tax revenues together at the ratio of 50%-50% in
2002. In 2003 and 2004, the central government’s sharing rate went up to 60% (Su
2003;Zhang and Martinez-Vazquez 2003). In 2004, the fiscal revenue of the central
government is RMB150.10 billions, counting for 57% of total fiscal revenue which is
RMB 263.96 billions, while the fiscal revenue of the local governments is RMB110
billions in total, or 43% of the total fiscal revenue.
15
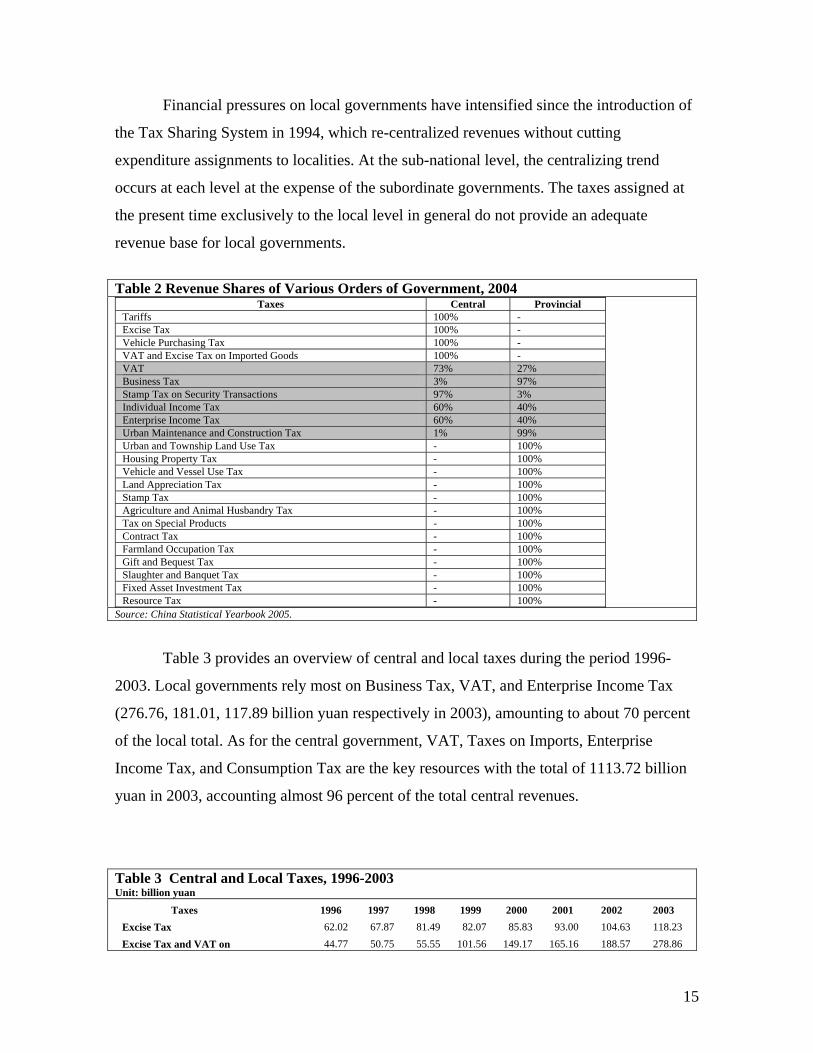
Financial pressures on local governments have intensified since the introduction of
the Tax Sharing System in 1994, which re-centralized revenues without cutting
expenditure assignments to localities. At the sub-national level, the centralizing trend
occurs at each level at the expense of the subordinate governments. The taxes assigned at
the present time exclusively to the local level in general do not provide an adequate
revenue base for local governments.
Table 2 Revenue Shares of Various Orders of Government, 2004
Taxes Central Provincial Tariffs 100% - Excise Tax 100% - Vehicle Purchasing Tax 100% - VAT and Excise Tax on Imported Goods 100% - VAT 73% 27% Business Tax 3% 97% Stamp Tax on Security Transactions 97% 3% Individual Income Tax 60% 40% Enterprise Income Tax 60% 40% Urban Maintenance and Construction Tax 1% 99% Urban and Township Land Use Tax - 100% Housing Property Tax - 100% Vehicle and Vessel Use Tax - 100% Land Appreciation Tax - 100% Stamp Tax - 100% Agriculture and Animal Husbandry Tax - 100% Tax on Special Products - 100% Contract Tax - 100% Farmland Occupation Tax - 100% Gift and Bequest Tax - 100% Slaughter and Banquet Tax - 100% Fixed Asset Investment Tax - 100% Resource Tax - 100%
Source: China Statistical Yearbook 2005.
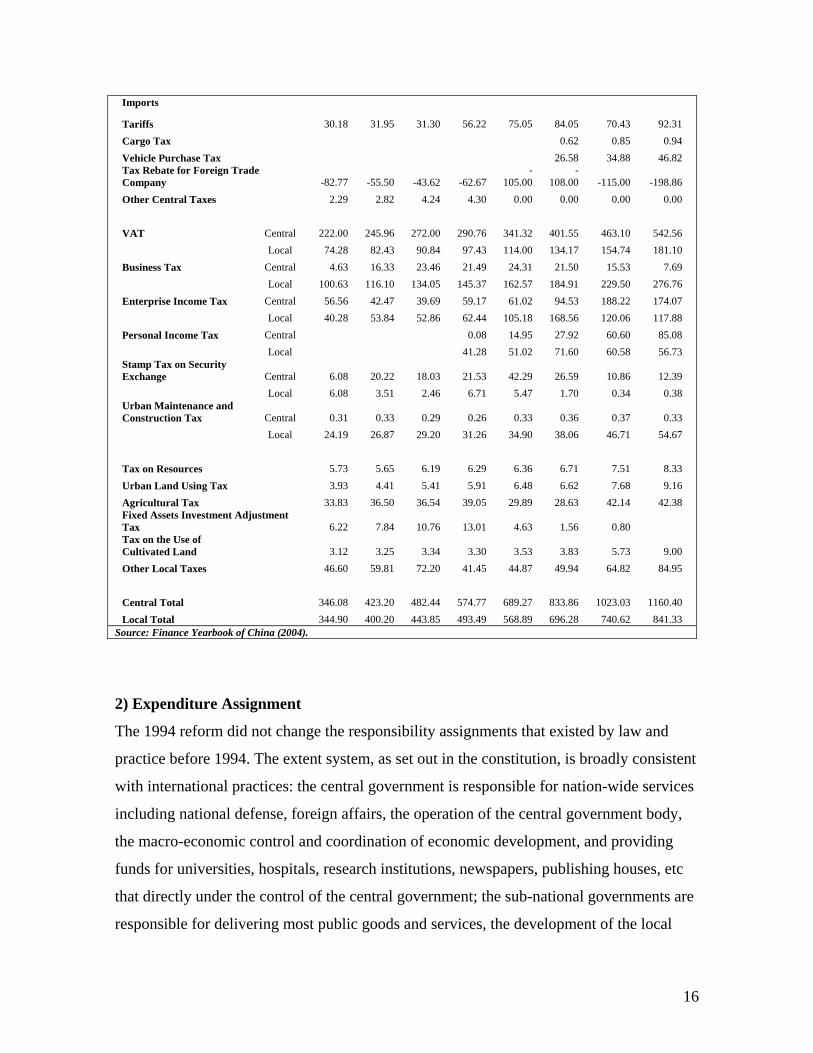
Table 3 provides an overview of central and local taxes during the period 1996-
2003. Local governments rely most on Business Tax, VAT, and Enterprise Income Tax
(276.76, 181.01, 117.89 billion yuan respectively in 2003), amounting to about 70 percent
of the local total. As for the central government, VAT, Taxes on Imports, Enterprise
Income Tax, and Consumption Tax are the key resources with the total of 1113.72 billion
yuan in 2003, accounting almost 96 percent of the total central revenues.
Table 3 Central and Local Taxes, 1996-2003 Unit: billion yuan
Taxes 1996 1997 1998 1999 2000 2001 2002 2003 Excise Tax 62.02 67.87 81.49 82.07 85.83 93.00 104.63 118.23 Excise Tax and VAT on 44.77 50.75 55.55 101.56 149.17 165.16 188.57 278.86
16
Imports
Tariffs 30.18 31.95 31.30 56.22 75.05 84.05 70.43 92.31 Cargo Tax 0.62 0.85 0.94 Vehicle Purchase Tax 26.58 34.88 46.82 Tax Rebate for Foreign Trade Company -82.77 -55.50 -43.62 -62.67
-105.00
-108.00 -115.00 -198.86
Other Central Taxes 2.29 2.82 4.24 4.30 0.00 0.00 0.00 0.00 VAT Central 222.00 245.96 272.00 290.76 341.32 401.55 463.10 542.56 Local 74.28 82.43 90.84 97.43 114.00 134.17 154.74 181.10 Business Tax Central 4.63 16.33 23.46 21.49 24.31 21.50 15.53 7.69 Local 100.63 116.10 134.05 145.37 162.57 184.91 229.50 276.76 Enterprise Income Tax Central 56.56 42.47 39.69 59.17 61.02 94.53 188.22 174.07 Local 40.28 53.84 52.86 62.44 105.18 168.56 120.06 117.88 Personal Income Tax Central 0.08 14.95 27.92 60.60 85.08 Local 41.28 51.02 71.60 60.58 56.73 Stamp Tax on Security Exchange Central 6.08 20.22 18.03 21.53 42.29 26.59 10.86 12.39 Local 6.08 3.51 2.46 6.71 5.47 1.70 0.34 0.38 Urban Maintenance and Construction Tax Central 0.31 0.33 0.29 0.26 0.33 0.36 0.37 0.33 Local 24.19 26.87 29.20 31.26 34.90 38.06 46.71 54.67 Tax on Resources 5.73 5.65 6.19 6.29 6.36 6.71 7.51 8.33 Urban Land Using Tax 3.93 4.41 5.41 5.91 6.48 6.62 7.68 9.16 Agricultural Tax 33.83 36.50 36.54 39.05 29.89 28.63 42.14 42.38 Fixed Assets Investment Adjustment Tax 6.22 7.84 10.76 13.01 4.63 1.56 0.80 Tax on the Use of Cultivated Land 3.12 3.25 3.34 3.30 3.53 3.83 5.73 9.00 Other Local Taxes 46.60 59.81 72.20 41.45 44.87 49.94 64.82 84.95 Central Total 346.08 423.20 482.44 574.77 689.27 833.86 1023.03 1160.40 Local Total 344.90 400.20 443.85 493.49 568.89 696.28 740.62 841.33
Source: Finance Yearbook of China (2004).
2) Expenditure Assignment
The 1994 reform did not change the responsibility assignments that existed by law and
practice before 1994. The extent system, as set out in the constitution, is broadly consistent
with international practices: the central government is responsible for nation-wide services
including national defense, foreign affairs, the operation of the central government body,
the macro-economic control and coordination of economic development, and providing
funds for universities, hospitals, research institutions, newspapers, publishing houses, etc
that directly under the control of the central government; the sub-national governments are
responsible for delivering most public goods and services, the development of the local
17
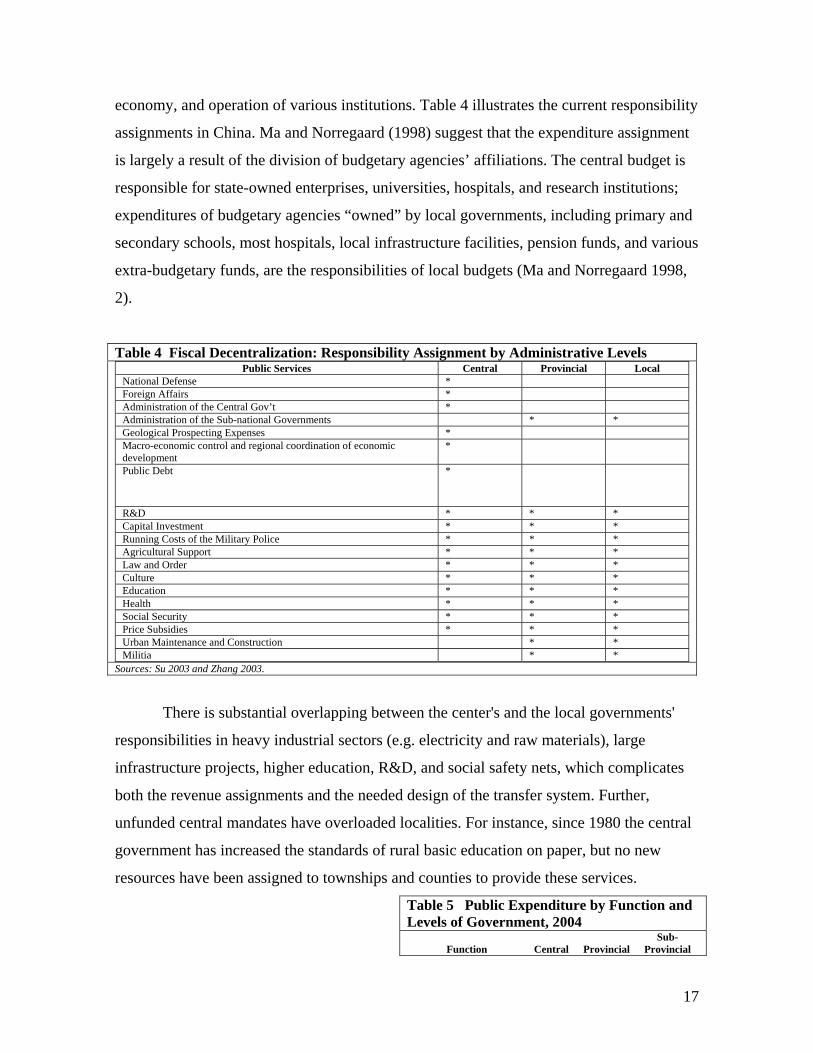
economy, and operation of various institutions. Table 4 illustrates the current responsibility
assignments in China. Ma and Norregaard (1998) suggest that the expenditure assignment
is largely a result of the division of budgetary agencies’ affiliations. The central budget is
responsible for state-owned enterprises, universities, hospitals, and research institutions;
expenditures of budgetary agencies “owned” by local governments, including primary and
secondary schools, most hospitals, local infrastructure facilities, pension funds, and various
extra-budgetary funds, are the responsibilities of local budgets (Ma and Norregaard 1998,
2).
Table 4 Fiscal Decentralization: Responsibility Assignment by Administrative Levels Public Services Central Provincial Local
National Defense * Foreign Affairs * Administration of the Central Gov’t * Administration of the Sub-national Governments * * Geological Prospecting Expenses * Macro-economic control and regional coordination of economic development
*
Public Debt *
R&D * * * Capital Investment * * * Running Costs of the Military Police * * * Agricultural Support * * * Law and Order * * * Culture * * * Education * * * Health * * * Social Security * * * Price Subsidies * * * Urban Maintenance and Construction * * Militia * *
Sources: Su 2003 and Zhang 2003.
There is substantial overlapping between the center's and the local governments'
responsibilities in heavy industrial sectors (e.g. electricity and raw materials), large
infrastructure projects, higher education, R&D, and social safety nets, which complicates
both the revenue assignments and the needed design of the transfer system. Further,
unfunded central mandates have overloaded localities. For instance, since 1980 the central
government has increased the standards of rural basic education on paper, but no new
resources have been assigned to townships and counties to provide these services.
Table 5 Public Expenditure by Function and Levels of Government, 2004
Function Central Provincial Sub-
Provincial
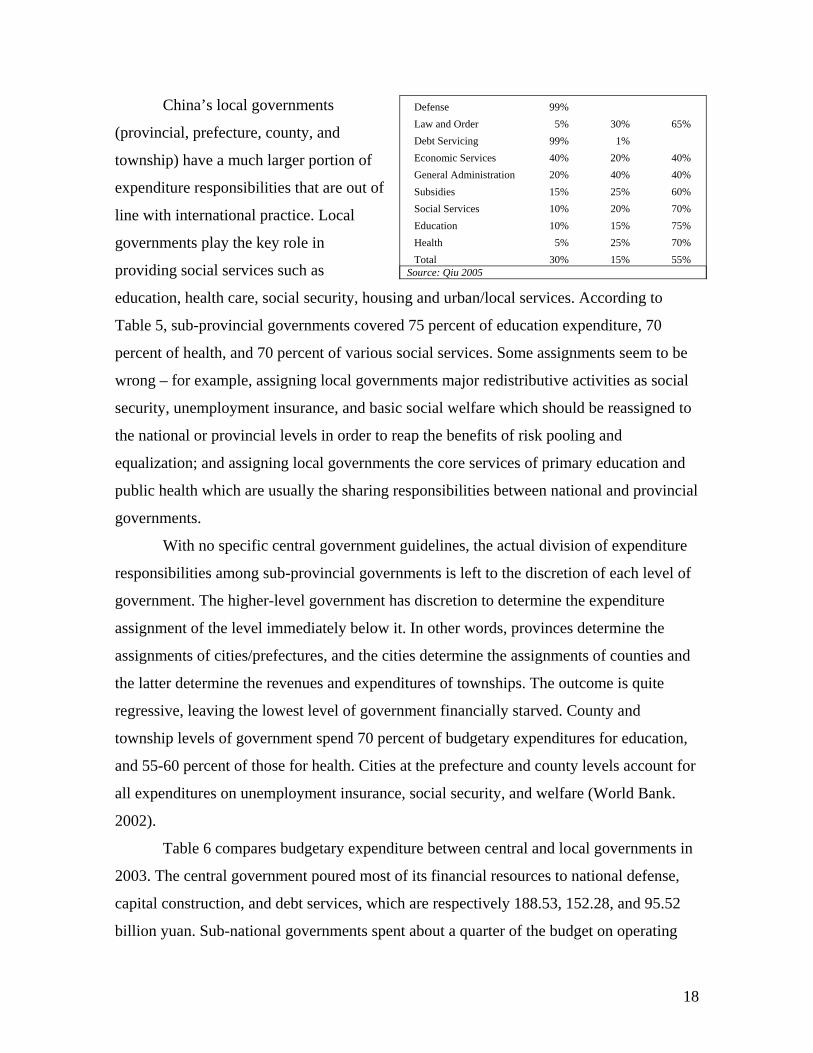
18
China’s local governments
(provincial, prefecture, county, and
township) have a much larger portion of
expenditure responsibilities that are out of
line with international practice. Local
governments play the key role in
providing social services such as
education, health care, social security, housing and urban/local services. According to
Table 5, sub-provincial governments covered 75 percent of education expenditure, 70
percent of health, and 70 percent of various social services. Some assignments seem to be
wrong – for example, assigning local governments major redistributive activities as social
security, unemployment insurance, and basic social welfare which should be reassigned to
the national or provincial levels in order to reap the benefits of risk pooling and
equalization; and assigning local governments the core services of primary education and
public health which are usually the sharing responsibilities between national and provincial
governments.
With no specific central government guidelines, the actual division of expenditure
responsibilities among sub-provincial governments is left to the discretion of each level of
government. The higher-level government has discretion to determine the expenditure
assignment of the level immediately below it. In other words, provinces determine the
assignments of cities/prefectures, and the cities determine the assignments of counties and
the latter determine the revenues and expenditures of townships. The outcome is quite
regressive, leaving the lowest level of government financially starved. County and
township levels of government spend 70 percent of budgetary expenditures for education,
and 55-60 percent of those for health. Cities at the prefecture and county levels account for
all expenditures on unemployment insurance, social security, and welfare (World Bank.
2002).
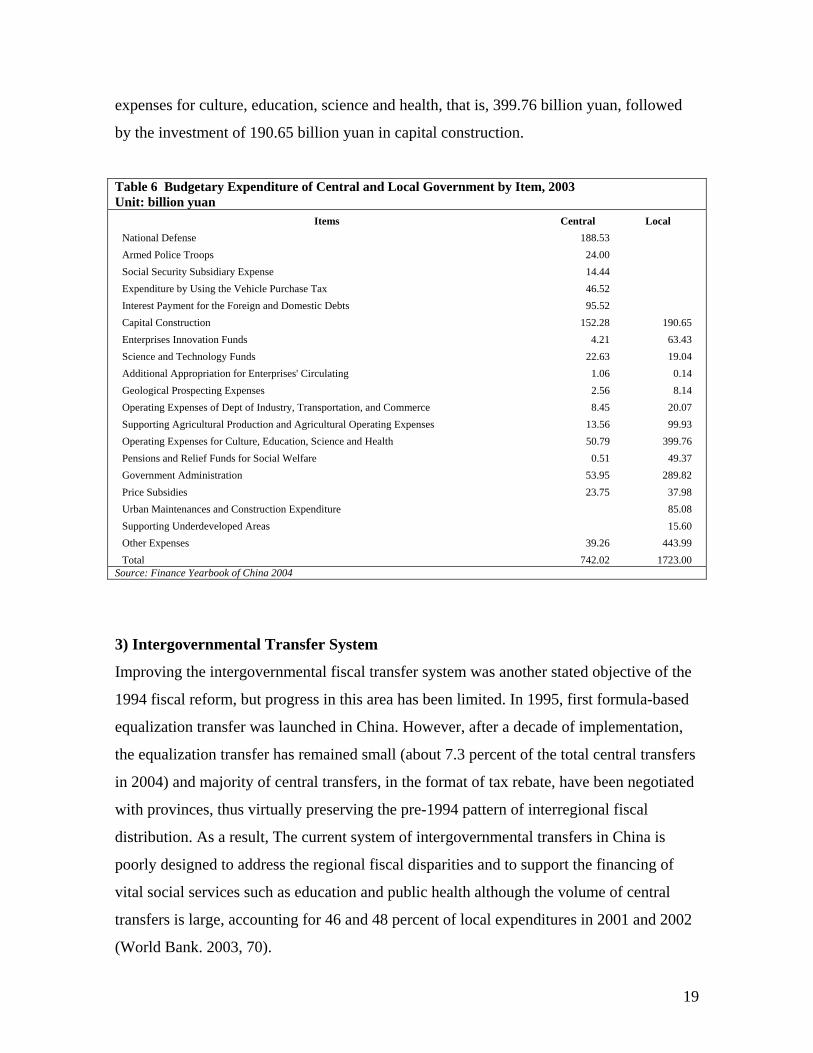
Table 6 compares budgetary expenditure between central and local governments in
2003. The central government poured most of its financial resources to national defense,
capital construction, and debt services, which are respectively 188.53, 152.28, and 95.52
billion yuan. Sub-national governments spent about a quarter of the budget on operating
Defense 99% Law and Order 5% 30% 65% Debt Servicing 99% 1% Economic Services 40% 20% 40% General Administration 20% 40% 40% Subsidies 15% 25% 60% Social Services 10% 20% 70% Education 10% 15% 75% Health 5% 25% 70% Total 30% 15% 55%
Source: Qiu 2005
19
expenses for culture, education, science and health, that is, 399.76 billion yuan, followed
by the investment of 190.65 billion yuan in capital construction.
Table 6 Budgetary Expenditure of Central and Local Government by Item, 2003 Unit: billion yuan
Items Central Local National Defense 188.53 Armed Police Troops 24.00 Social Security Subsidiary Expense 14.44 Expenditure by Using the Vehicle Purchase Tax 46.52 Interest Payment for the Foreign and Domestic Debts 95.52 Capital Construction 152.28 190.65 Enterprises Innovation Funds 4.21 63.43 Science and Technology Funds 22.63 19.04 Additional Appropriation for Enterprises' Circulating 1.06 0.14 Geological Prospecting Expenses 2.56 8.14 Operating Expenses of Dept of Industry, Transportation, and Commerce 8.45 20.07 Supporting Agricultural Production and Agricultural Operating Expenses 13.56 99.93 Operating Expenses for Culture, Education, Science and Health 50.79 399.76 Pensions and Relief Funds for Social Welfare 0.51 49.37 Government Administration 53.95 289.82 Price Subsidies 23.75 37.98 Urban Maintenances and Construction Expenditure 85.08 Supporting Underdeveloped Areas 15.60 Other Expenses 39.26 443.99 Total 742.02 1723.00
Source: Finance Yearbook of China 2004
3) Intergovernmental Transfer System
Improving the intergovernmental fiscal transfer system was another stated objective of the
1994 fiscal reform, but progress in this area has been limited. In 1995, first formula-based
equalization transfer was launched in China. However, after a decade of implementation,
the equalization transfer has remained small (about 7.3 percent of the total central transfers
in 2004) and majority of central transfers, in the format of tax rebate, have been negotiated
with provinces, thus virtually preserving the pre-1994 pattern of interregional fiscal
distribution. As a result, The current system of intergovernmental transfers in China is
poorly designed to address the regional fiscal disparities and to support the financing of
vital social services such as education and public health although the volume of central
transfers is large, accounting for 46 and 48 percent of local expenditures in 2001 and 2002
(World Bank. 2003, 70).
20
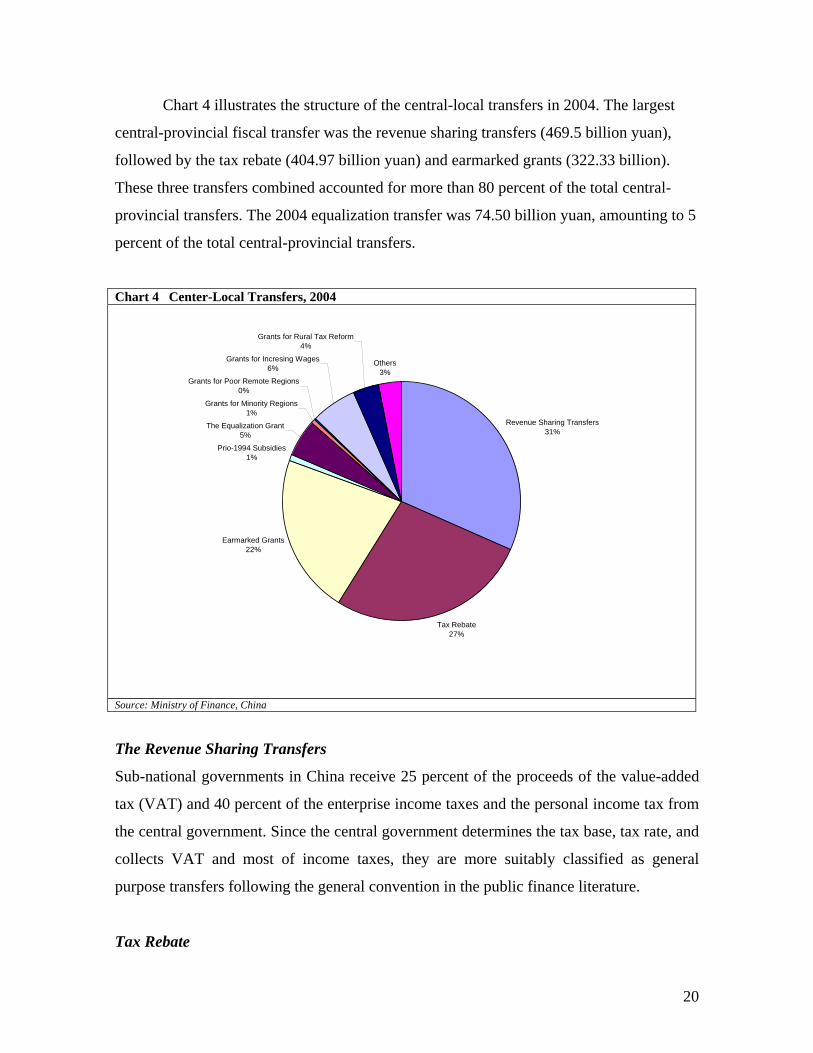
Chart 4 illustrates the structure of the central-local transfers in 2004. The largest
central-provincial fiscal transfer was the revenue sharing transfers (469.5 billion yuan),
followed by the tax rebate (404.97 billion yuan) and earmarked grants (322.33 billion).
These three transfers combined accounted for more than 80 percent of the total central-
provincial transfers. The 2004 equalization transfer was 74.50 billion yuan, amounting to 5
percent of the total central-provincial transfers.
Chart 4 Center-Local Transfers, 2004
Revenue Sharing Transfers31%
Tax Rebate27%
Earmarked Grants22%
Prio-1994 Subsidies1%
The Equalization Grant5%
Grants for Minority Regions1%
Grants for Poor Remote Regions0%
Grants for Incresing Wages6%
Grants for Rural Tax Reform4%
Others3%
Source: Ministry of Finance, China
The Revenue Sharing Transfers
Sub-national governments in China receive 25 percent of the proceeds of the value-added
tax (VAT) and 40 percent of the enterprise income taxes and the personal income tax from
the central government. Since the central government determines the tax base, tax rate, and
collects VAT and most of income taxes, they are more suitably classified as general
purpose transfers following the general convention in the public finance literature.
Tax Rebate
21
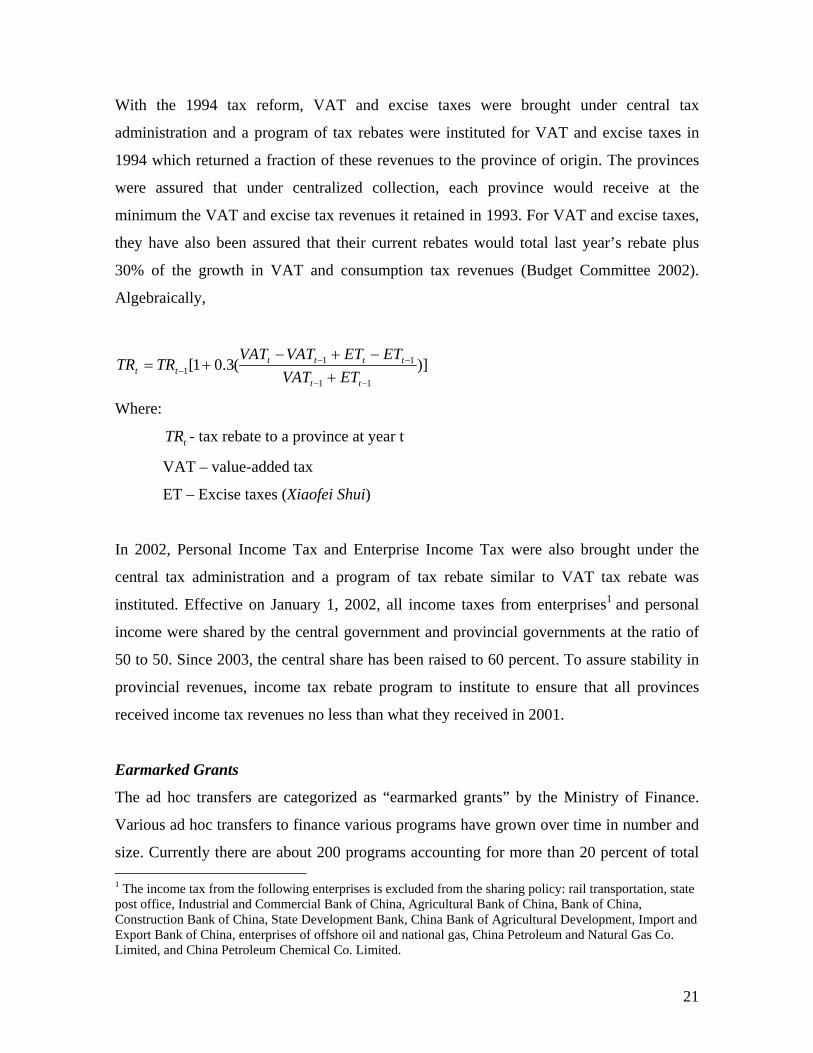
With the 1994 tax reform, VAT and excise taxes were brought under central tax
administration and a program of tax rebates were instituted for VAT and excise taxes in
1994 which returned a fraction of these revenues to the province of origin. The provinces
were assured that under centralized collection, each province would receive at the
minimum the VAT and excise tax revenues it retained in 1993. For VAT and excise taxes,
they have also been assured that their current rebates would total last year’s rebate plus
30% of the growth in VAT and consumption tax revenues (Budget Committee 2002).
Algebraically,
)](3.01[11
111
−−
−−− +
−+−+=
tt
tttttt ETVAT
ETETVATVATTRTR
Where:
TRt - tax rebate to a province at year t
VAT – value-added tax
ET – Excise taxes (Xiaofei Shui)
In 2002, Personal Income Tax and Enterprise Income Tax were also brought under the
central tax administration and a program of tax rebate similar to VAT tax rebate was
instituted. Effective on January 1, 2002, all income taxes from enterprises1 and personal
income were shared by the central government and provincial governments at the ratio of
50 to 50. Since 2003, the central share has been raised to 60 percent. To assure stability in
provincial revenues, income tax rebate program to institute to ensure that all provinces
received income tax revenues no less than what they received in 2001.
Earmarked Grants
The ad hoc transfers are categorized as “earmarked grants” by the Ministry of Finance.
Various ad hoc transfers to finance various programs have grown over time in number and
size. Currently there are about 200 programs accounting for more than 20 percent of total 1 The income tax from the following enterprises is excluded from the sharing policy: rail transportation, state post office, Industrial and Commercial Bank of China, Agricultural Bank of China, Bank of China, Construction Bank of China, State Development Bank, China Bank of Agricultural Development, Import and Export Bank of China, enterprises of offshore oil and national gas, China Petroleum and Natural Gas Co. Limited, and China Petroleum Chemical Co. Limited.
22
central transfers. These transfers are program-based and allocated for specific purposes
such as subsidizing agricultural development, supporting infrastructure construction,
assisting backward regions, and providing emergency funding for natural catastrophes.
This transfer has risen to 322.3 billion yuan in 2004 (Shah and Shen 2006).
Grants for Increasing Wages of Civil Servants
When the center raised the wage rate for public sector employees in 1999 and 2001, a
special grant was established in 1999 to support the implementation of this policy in
western and central regions. Thus the purpose of this transfer is to fill the fiscal gap caused
by the central policy mandate. The wage rate was first increased by an amount of monthly
120 yuan per capita on July 1, 1999, then further raised at a rate of monthly 100 yuan per
capita on January 1, 2001, and on October 1, 2001, additional 80 yuan per capita per
month was added. The wage increase was also accompanied by the construction of a bonus
system for civil servants from 2001 (equivalent to an approximate increase of one month
of wages) and by the establishment of a subsidy system for remote areas. More than 700
counties were eligible to receive this grant. Besides, provinces faced with difficulties of
paying teachers’ wages in rural elementary and middle schools are also compensated by
this transfer (Zhang 2003).
The grant allocation can be characterized as:
iii oditureRatiBasicExpeneExpIncreasWageGrant *=
Where
WageGrant – the grant for increasing wages received by province i
ExpIncrease – the increase of provincial budgetary expenditure due to central
policy of increasing wages
BasicExpenditureRatio – the ratio of the personal and office expenses to the total
disposable revenue of the province i
According to the formula, the volume of the grant received by province i is dependent
upon the provincial expenditure increase due to the wage policy and the share of basic
expenditure (including personnel and office expenses) in the total disposable revenue of
the province. The increased expenditure is determined by the number of civil servants in
23
province i and the standard of wage increase by the central government. The total transfer
in 2004 amounted to 91.94 billion yuan (Shah and Shen 2006).
Grants for Rural Tax Reform
The transfer was created in 2000 to foster the implementation of the central policy to
rescind “three village deductions and five township charges” (xiangtongchou he cun tiliu )
and gradually abolish agricultural taxes. The “three deductions” collected by villages are:
collective investment, public welfare funds, and cadre compensation. The “five charges”
include charges for rural education, family planning, militia training, rural road
construction and maintenance, and subsidies to entitled groups levied by townships. This
transfer is aimed at filling the fiscal gap caused by the rural tax reform. In 2004, the total of
52.33 billion yuan was transferred to provincial governments.
Grants for Minority Regions
The grant for minority regions was established in 2000 in order to support economic
development in minority regions which are usually backward in their economic
performance. The total grant equals a base amount of 1 billion yuan in 2000 with a yearly
growth rate equal to that of central VAT revenue, and the rebate of the 80 percent of the
central increased VAT collection in minority areas. This transfer has risen to 7.69 billion
yuan in 2004 (Shah and Shen 2006).
Prio-1994 Subsidies
Prio-1994 subsidies are the contracted fixed grants under the “Fiscal Contracting System”
during the period 1988-1993. The total of the grant was both 12.6 billion yuan in 2003 and
2004. Since 1994, local governments have continued to remit revenues to or receive
transfers from the centre according to their fiscal contracts in effect in 1993. The amount of
transfers is approximately equal to the estimated deficit (gap between revenue and
expenditure) measured in the base year. Sixteen provinces, including Inner Mongolia, Jilin,
Fujian, Jiangxi, Shandong, Guangxi, Hainan, Sichuan, Guizhou, Yunnan, Tibet, Shannxi,
Gansu, Qinghai, Ningxia, and Xinjiang, still receive this type of grant.
24
The Equalization Grant
In 1995, the equalization grant, the first formula based transfer (the so-called transitory
period grant until 2001) was established with a view to reducing regional fiscal disparities.
The amount of the equalization transfer for a province i is determined by three factors:
standard revenue of the province, standard expenditure of the province, and the share of the
provincial standard fiscal gap of the total fiscal gap. Algebraically,
SRSESRSE
TETET iii −
−= *
Where
iET -- the equalization transfer for province i
TET – total equalization grant available in the budget year
SEi – standard expenditure of province i
SRi – standard revenue of province i
SE – total standard expenditure of the country
SR – total standard revenue of the country
The size of the pool for the equalization transfer (TET) is determined by the central
government on an ad-hoc basis, subject to annual funding availability.
The standard revenues are equal to standard local own and shared taxes plus tax
rebate plus various grants subtracted by remittances to the central government. In the
formula, tax rebate, various grants, and remittances to the central government are actual
amounts paid by the central government. For each type of tax, standard tax revenue is
determined by multiplying the standard tax base with the standard tax rate. For personal
income tax, the standard tax base includes salaries and income of private industrial and
commercial enterprises. The actual income tax collection from other bases is regarded as
the standard revenue. The income tax base of salaries is estimated using per capita taxable
salaries net of exemptions and number of employees. The tax rate of salaries is local
average effective tax rate, adjusted with a regional coefficient. The standard expenditures
are measured as the total spending of seven sectors and for each sector the standard
25
spending cover personal expenditure (salaries and bonus) and office expenditures (vehicles,
heating, and others).
Although the equalization grant has been growing rapidly (2.07 billion yuan in
1995 to 74.5 billion yuan in 2004), but by themselves cannot address public service
delivery needs. At the lower end of the distribution, county and township governments in
poor regions are unable to fulfill their expenditure responsibilities, and consequently
provide insufficient levels of vital public services (Shah and Shen 2006).
4. Local Government Financing: local taxes, intergovernmental transfers,
and local borrowing
During a seminar held by the Ministry of Finance and World Bank in Dali 2004, a local
officer visualized the picture of local government financing with his words, “Center
finances are booming; provincial finances are improving; prefectural finances are not bad;
county finances are near-bankrupt; and township finances are basically bankrupt. Wong
(2000) recorded a report from a Hunan official regarding wage arrears to civil servants, “it
is normal for payroll to be a month behind. For payroll to be two months behind is habitual.
If it is three months late it’s a little awkward. But it is not considered strange to be four
months behind.”
The 1994 tax assignment reform only dealt with revenue assignments, leaving the
expenditure assignments intact. The process of recentralizing revenues upward and
devolving expenditures downward has deteriorated fiscal vertical imbalance and imposed
further fiscal stress on local governments, particularly those in the rural sector and in the
poor regions.
1) Local Taxes
Local taxes in China mainly comprise of Value-Added Tax, Business Tax, Enterprises’
Income Tax, Personal Income Tax, Tax on City Maintenance and Construction, Stamp Tax,
26
Tax on Real Estates, Agricultural Tax, Contract Tax, Resource Tax, Tax on the
Adjustments of the investment in the fixed assets, Tax on the Use of Urban Land, Land
Value-Added Tax, Tax on the Use of Vehicles and Ships, Slaughter Tax, Banquet Tax,
Tax on Special Agricultural Products, Tax on Animal Husbandry, Tax on the Occupancy
of Cultivated Land, State-owned Assets Profit, Penalty and Confiscatory Income, Income
from use of sea area, field, and diggings, Expert Project Income, and administrative fees,
as well as other income.
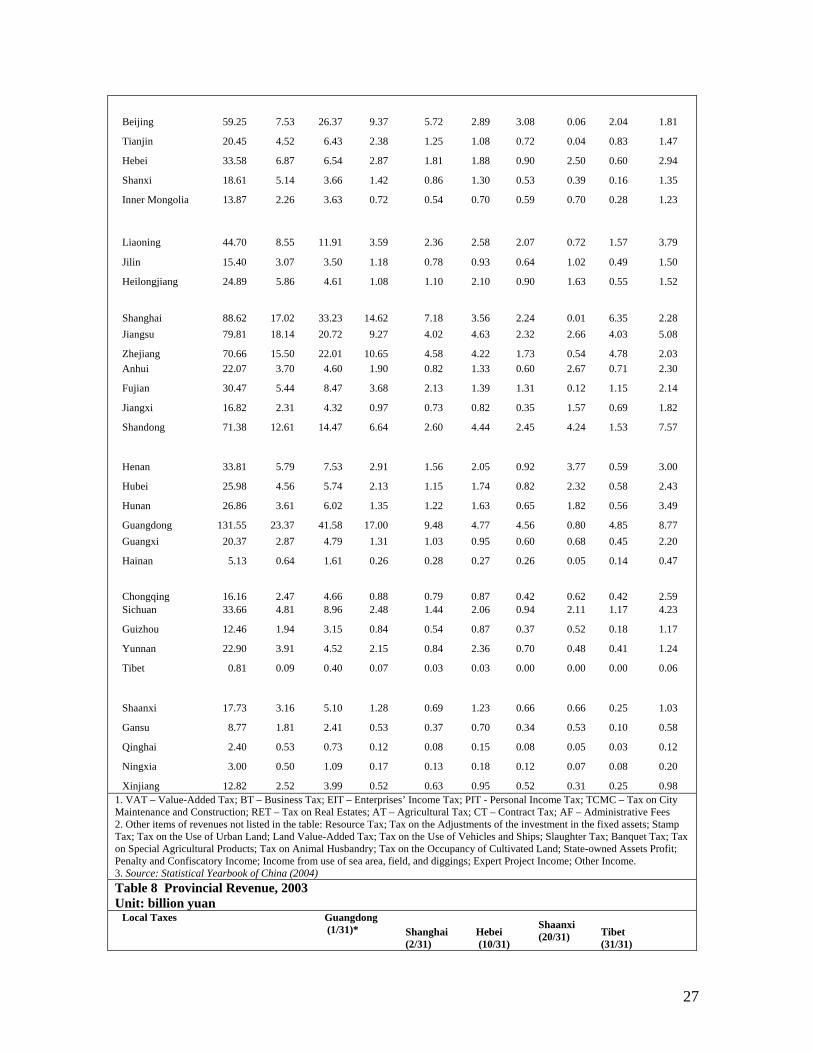
Table 7 provides main tax revenues of 31 provinces in 2003. Local finance is
highly dependent on the shared taxes - Business Tax, VAT, Enterprise Income Tax,
Personal Income Tax, and Urban Maintenance and Construction Tax, all of which are
shared taxes with the central government. For instance, in 2003, Beijing obtained almost
90 percent of revenue from the five shared taxes, or 51.88 million yuan out of the total
59.25 billion; Chongqing’s 60 percent of government revenue was from the shared taxes.
The Business Tax is the foremost important revenue source. The only exceptions are
Shanxi, Heilongjiang, and Tibet, where revenue from VAT surpasses Business Tax.
Thanks to the remarkable economic performance, wealthy regions, including Guangdong,
Shanghai, Beijing, Zhejiang, and Jiangxu, are also able to reap the benefits of economic
development from enterprise and individual income tax. Revenue from local taxes is slim,
totally 673.6 billion yuan in 2003 accounting for only about 30 percent of the entire local
revenues.
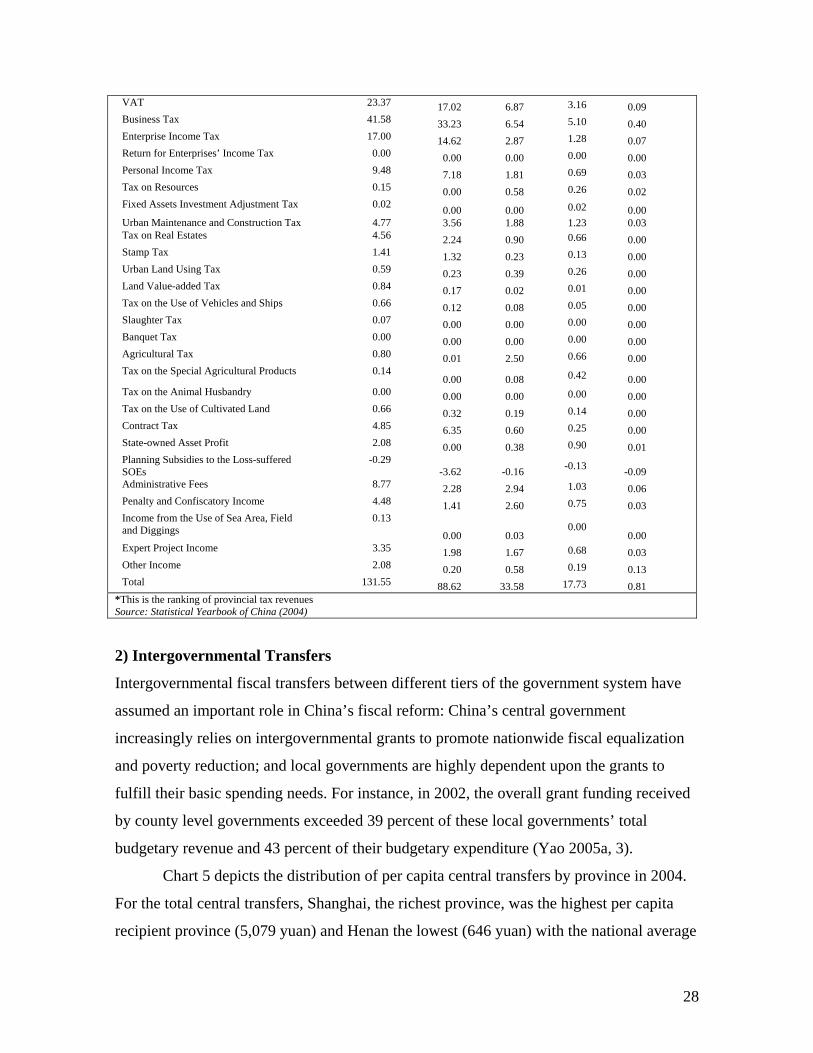
The regional divergence of government revenue is evident. Table 8 compares local
revenues in Guangdong, Shanghai, Hebei, Shaani, and Tibet. Guangdong collected the
largest income for each individual tax and for the total in 2003. In contrast to Guangdong’s
total 131.55 billion yuan, Shanghai obtained 88.62 billion, the second in the nation; Hebei
33.58 billion, the tenth out of the 31 provinces; Shaanxi 17.73 billion, the twentieth; and
Tibet resided at the bottom with revenue of just 0.81 billion yuan.
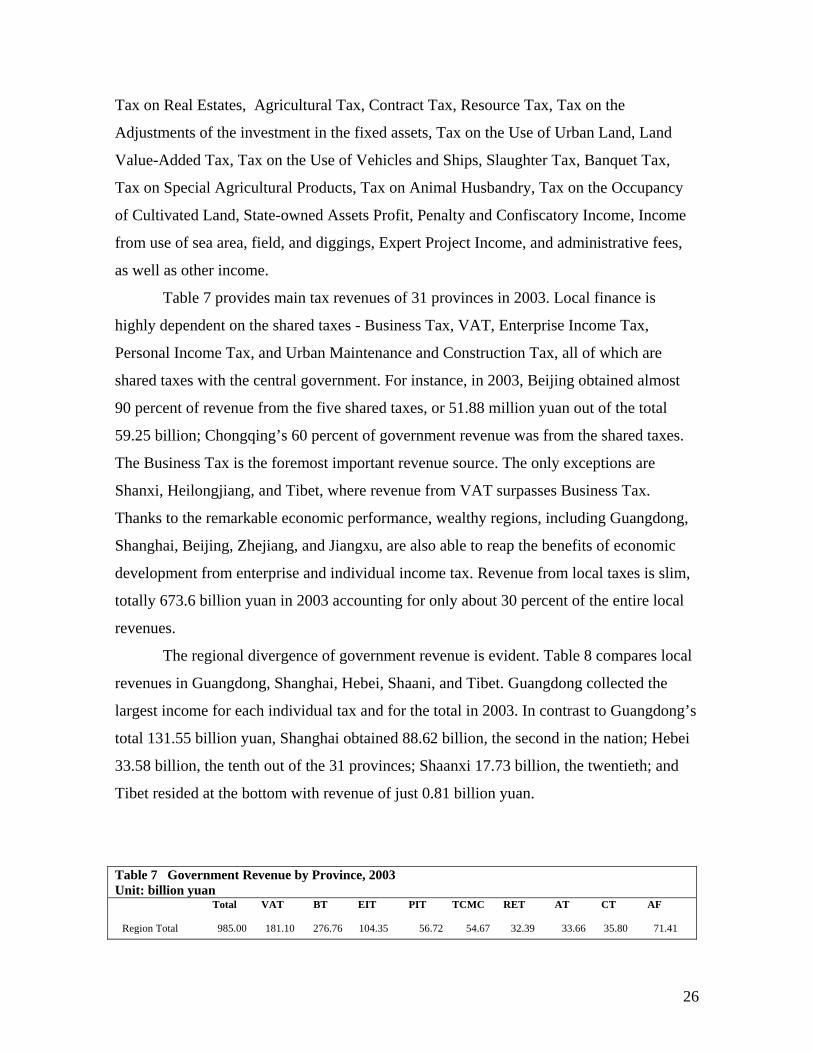
Table 7 Government Revenue by Province, 2003 Unit: billion yuan
Total VAT BT EIT PIT TCMC RET AT CT AF
Region Total 985.00 181.10 276.76 104.35 56.72 54.67 32.39 33.66 35.80 71.41
27
Beijing 59.25 7.53 26.37 9.37 5.72 2.89 3.08 0.06 2.04 1.81
Tianjin 20.45 4.52 6.43 2.38 1.25 1.08 0.72 0.04 0.83 1.47
Hebei 33.58 6.87 6.54 2.87 1.81 1.88 0.90 2.50 0.60 2.94
Shanxi 18.61 5.14 3.66 1.42 0.86 1.30 0.53 0.39 0.16 1.35
Inner Mongolia 13.87 2.26 3.63 0.72 0.54 0.70 0.59 0.70 0.28 1.23
Liaoning 44.70 8.55 11.91 3.59 2.36 2.58 2.07 0.72 1.57 3.79
Jilin 15.40 3.07 3.50 1.18 0.78 0.93 0.64 1.02 0.49 1.50
Heilongjiang 24.89 5.86 4.61 1.08 1.10 2.10 0.90 1.63 0.55 1.52
Shanghai 88.62 17.02 33.23 14.62 7.18 3.56 2.24 0.01 6.35 2.28 Jiangsu 79.81 18.14 20.72 9.27 4.02 4.63 2.32 2.66 4.03 5.08
Zhejiang 70.66 15.50 22.01 10.65 4.58 4.22 1.73 0.54 4.78 2.03 Anhui 22.07 3.70 4.60 1.90 0.82 1.33 0.60 2.67 0.71 2.30
Fujian 30.47 5.44 8.47 3.68 2.13 1.39 1.31 0.12 1.15 2.14
Jiangxi 16.82 2.31 4.32 0.97 0.73 0.82 0.35 1.57 0.69 1.82
Shandong 71.38 12.61 14.47 6.64 2.60 4.44 2.45 4.24 1.53 7.57
Henan 33.81 5.79 7.53 2.91 1.56 2.05 0.92 3.77 0.59 3.00
Hubei 25.98 4.56 5.74 2.13 1.15 1.74 0.82 2.32 0.58 2.43
Hunan 26.86 3.61 6.02 1.35 1.22 1.63 0.65 1.82 0.56 3.49
Guangdong 131.55 23.37 41.58 17.00 9.48 4.77 4.56 0.80 4.85 8.77 Guangxi 20.37 2.87 4.79 1.31 1.03 0.95 0.60 0.68 0.45 2.20
Hainan 5.13 0.64 1.61 0.26 0.28 0.27 0.26 0.05 0.14 0.47
Chongqing 16.16 2.47 4.66 0.88 0.79 0.87 0.42 0.62 0.42 2.59 Sichuan 33.66 4.81 8.96 2.48 1.44 2.06 0.94 2.11 1.17 4.23
Guizhou 12.46 1.94 3.15 0.84 0.54 0.87 0.37 0.52 0.18 1.17
Yunnan 22.90 3.91 4.52 2.15 0.84 2.36 0.70 0.48 0.41 1.24
Tibet 0.81 0.09 0.40 0.07 0.03 0.03 0.00 0.00 0.00 0.06
Shaanxi 17.73 3.16 5.10 1.28 0.69 1.23 0.66 0.66 0.25 1.03
Gansu 8.77 1.81 2.41 0.53 0.37 0.70 0.34 0.53 0.10 0.58
Qinghai 2.40 0.53 0.73 0.12 0.08 0.15 0.08 0.05 0.03 0.12
Ningxia 3.00 0.50 1.09 0.17 0.13 0.18 0.12 0.07 0.08 0.20
Xinjiang 12.82 2.52 3.99 0.52 0.63 0.95 0.52 0.31 0.25 0.98 1. VAT – Value-Added Tax; BT – Business Tax; EIT – Enterprises’ Income Tax; PIT - Personal Income Tax; TCMC – Tax on City Maintenance and Construction; RET – Tax on Real Estates; AT – Agricultural Tax; CT – Contract Tax; AF – Administrative Fees 2. Other items of revenues not listed in the table: Resource Tax; Tax on the Adjustments of the investment in the fixed assets; Stamp Tax; Tax on the Use of Urban Land; Land Value-Added Tax; Tax on the Use of Vehicles and Ships; Slaughter Tax; Banquet Tax; Tax on Special Agricultural Products; Tax on Animal Husbandry; Tax on the Occupancy of Cultivated Land; State-owned Assets Profit; Penalty and Confiscatory Income; Income from use of sea area, field, and diggings; Expert Project Income; Other Income. 3. Source: Statistical Yearbook of China (2004) Table 8 Provincial Revenue, 2003 Unit: billion yuan
Local Taxes Guangdong (1/31)* Shanghai
(2/31) Hebei (10/31)
Shaanxi (20/31) Tibet
(31/31)
28
VAT 23.37 17.02 6.87 3.16 0.09 Business Tax 41.58 33.23 6.54 5.10 0.40 Enterprise Income Tax 17.00 14.62 2.87 1.28 0.07 Return for Enterprises’ Income Tax 0.00 0.00 0.00 0.00 0.00 Personal Income Tax 9.48 7.18 1.81 0.69 0.03 Tax on Resources 0.15 0.00 0.58 0.26 0.02 Fixed Assets Investment Adjustment Tax 0.02 0.00 0.00 0.02 0.00 Urban Maintenance and Construction Tax 4.77 3.56 1.88 1.23 0.03 Tax on Real Estates 4.56 2.24 0.90 0.66 0.00 Stamp Tax 1.41 1.32 0.23 0.13 0.00 Urban Land Using Tax 0.59 0.23 0.39 0.26 0.00 Land Value-added Tax 0.84 0.17 0.02 0.01 0.00 Tax on the Use of Vehicles and Ships 0.66 0.12 0.08 0.05 0.00 Slaughter Tax 0.07 0.00 0.00 0.00 0.00 Banquet Tax 0.00 0.00 0.00 0.00 0.00 Agricultural Tax 0.80 0.01 2.50 0.66 0.00 Tax on the Special Agricultural Products 0.14
0.00 0.08 0.42 0.00 Tax on the Animal Husbandry 0.00 0.00 0.00 0.00 0.00 Tax on the Use of Cultivated Land 0.66 0.32 0.19 0.14 0.00 Contract Tax 4.85 6.35 0.60 0.25 0.00 State-owned Asset Profit 2.08 0.00 0.38 0.90 0.01 Planning Subsidies to the Loss-suffered SOEs
-0.29 -3.62 -0.16 -0.13 -0.09
Administrative Fees 8.77 2.28 2.94 1.03 0.06 Penalty and Confiscatory Income 4.48 1.41 2.60 0.75 0.03 Income from the Use of Sea Area, Field and Diggings
0.13
0.00 0.03 0.00
0.00 Expert Project Income 3.35 1.98 1.67 0.68 0.03 Other Income 2.08 0.20 0.58 0.19 0.13 Total 131.55 88.62 33.58 17.73 0.81
*This is the ranking of provincial tax revenues Source: Statistical Yearbook of China (2004)
2) Intergovernmental Transfers
Intergovernmental fiscal transfers between different tiers of the government system have
assumed an important role in China’s fiscal reform: China’s central government
increasingly relies on intergovernmental grants to promote nationwide fiscal equalization
and poverty reduction; and local governments are highly dependent upon the grants to
fulfill their basic spending needs. For instance, in 2002, the overall grant funding received
by county level governments exceeded 39 percent of these local governments’ total
budgetary revenue and 43 percent of their budgetary expenditure (Yao 2005a, 3).
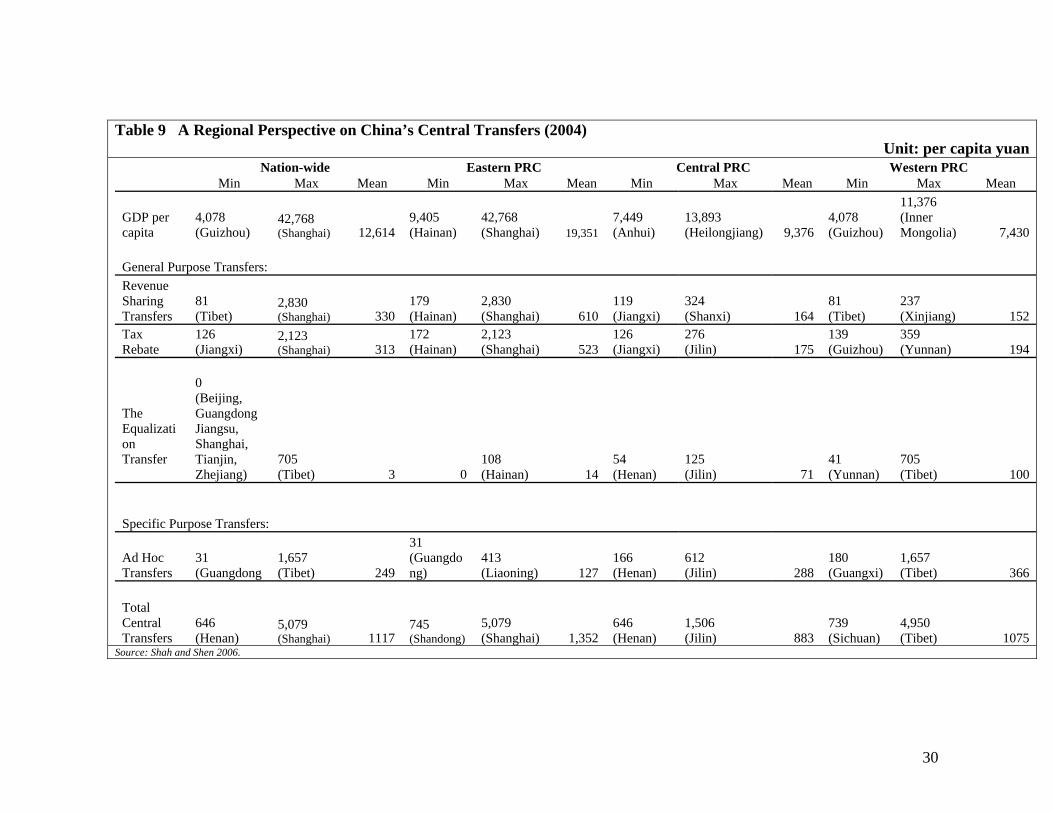
Chart 5 depicts the distribution of per capita central transfers by province in 2004.
For the total central transfers, Shanghai, the richest province, was the highest per capita
recipient province (5,079 yuan) and Henan the lowest (646 yuan) with the national average
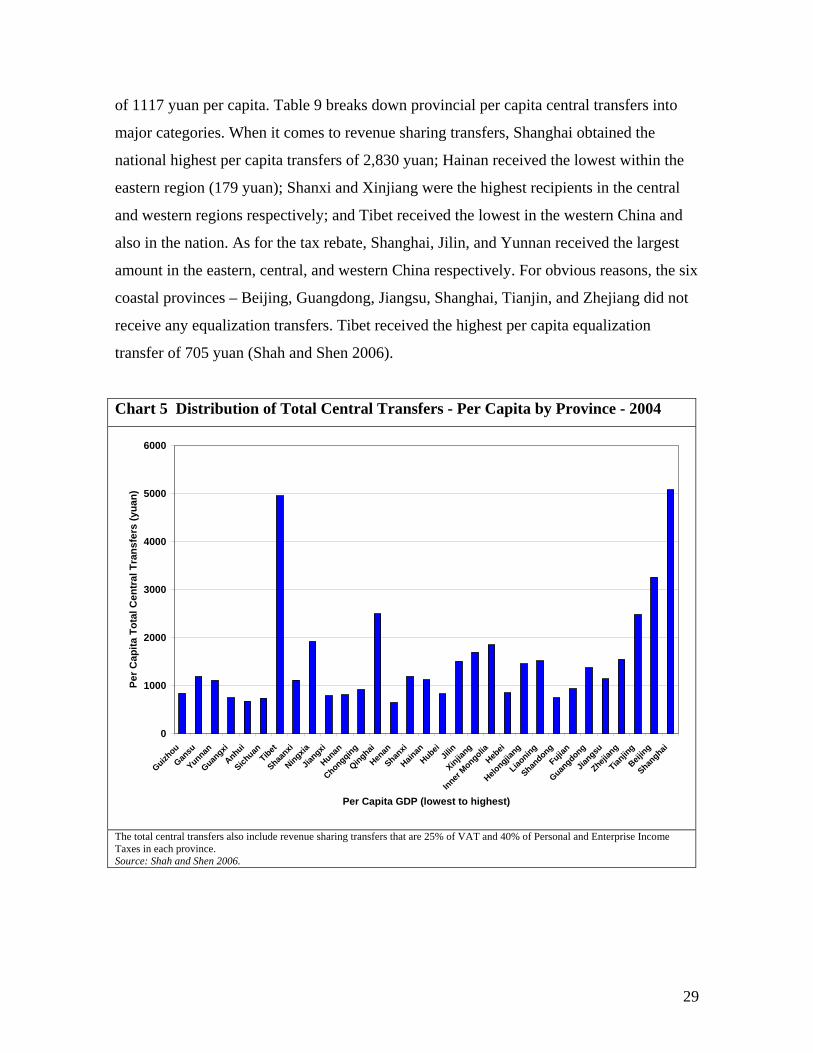
29
of 1117 yuan per capita. Table 9 breaks down provincial per capita central transfers into
major categories. When it comes to revenue sharing transfers, Shanghai obtained the
national highest per capita transfers of 2,830 yuan; Hainan received the lowest within the
eastern region (179 yuan); Shanxi and Xinjiang were the highest recipients in the central
and western regions respectively; and Tibet received the lowest in the western China and
also in the nation. As for the tax rebate, Shanghai, Jilin, and Yunnan received the largest
amount in the eastern, central, and western China respectively. For obvious reasons, the six
coastal provinces – Beijing, Guangdong, Jiangsu, Shanghai, Tianjin, and Zhejiang did not
receive any equalization transfers. Tibet received the highest per capita equalization
transfer of 705 yuan (Shah and Shen 2006).
Chart 5 Distribution of Total Central Transfers - Per Capita by Province - 2004
0
1000
2000
3000
4000
5000
6000
Guizhou
Gansu
Yunnan
Guangxi
Anhui
Sichuan
Tibet
Shaanxi
Ningxia
Jiangxi
Hunan
Chongqing
Qinghai
Henan
Shanxi
Hainan
HubeiJil
in
Xinjiang
Inner Mongolia
Hebei
Helongjia
ng
Liaoning
Shandong
Fujian
Guangdong
Jiangsu
Zhejian
g
Tianjin
g
Beijing
Shanghai
Per Capita GDP (lowest to highest)
Per C
apita
Tot
al C
entr
al T
rans
fers
(yua
n)
The total central transfers also include revenue sharing transfers that are 25% of VAT and 40% of Personal and Enterprise Income Taxes in each province. Source: Shah and Shen 2006.
30
Table 9 A Regional Perspective on China’s Central Transfers (2004) Unit: per capita yuan
Nation-wide Eastern PRC Central PRC Western PRC Min Max Mean Min Max Mean Min Max Mean Min Max Mean
GDP per capita
4,078 (Guizhou)
42,768 (Shanghai) 12,614
9,405 (Hainan)
42,768 (Shanghai) 19,351
7,449 (Anhui)
13,893 (Heilongjiang) 9,376
4,078 (Guizhou)
11,376 (Inner Mongolia) 7,430
General Purpose Transfers: Revenue Sharing Transfers
81 (Tibet)
2,830 (Shanghai) 330
179 (Hainan)
2,830 (Shanghai) 610
119 (Jiangxi)
324 (Shanxi) 164
81 (Tibet)
237 (Xinjiang) 152
Tax Rebate
126 (Jiangxi)
2,123 (Shanghai) 313
172 (Hainan)
2,123 (Shanghai) 523
126 (Jiangxi)
276 (Jilin) 175
139 (Guizhou)
359 (Yunnan) 194
The Equalization Transfer
0 (Beijing, Guangdong Jiangsu, Shanghai, Tianjin, Zhejiang)
705 (Tibet) 3 0
108 (Hainan) 14
54 (Henan)
125 (Jilin) 71
41 (Yunnan)
705 (Tibet) 100
Specific Purpose Transfers:
Ad Hoc Transfers
31 (Guangdong
1,657 (Tibet) 249
31 (Guangdong)
413 (Liaoning) 127
166 (Henan)
612 (Jilin) 288
180 (Guangxi)
1,657 (Tibet) 366
Total Central Transfers
646 (Henan)
5,079 (Shanghai) 1117
745 (Shandong)
5,079 (Shanghai) 1,352
646 (Henan)
1,506 (Jilin) 883
739 (Sichuan)
4,950 (Tibet) 1075
Source: Shah and Shen 2006.
31
3) Local Borrowing
Under China’s 1994 budget law, local governments are forbidden to incur either domestic
or foreign indebtedness unless otherwise permitted by law. However, the reality is many
local governments are on the verge of bankruptcy due to debt services. It is estimated that
the total local borrowing was over US$120 billions by the end of 2004 (Wei 2004). The
total debt of the grassroots governments was around US$ 40 billions by the end of 2001,
over half of which was borrowed by townships. According to the Audit report to the
national congress in June 2002, the total debt for 49 counties (cities) audited was about
US$ 8 billions, about 2.1 times of the yearly disposable fiscal resources. The total debts
should be much higher if the implicit debts such as the unpaid civil servants salaries and
farmers' services were included. Local borrowing can be roughly categorized as follows:
Direct Borrowing and Loan Guarantee
It is illegal but in practice the law and regulations of local borrowing were widely violated
by local governments. Almost all local governments of different levels in China incurred
direct borrowing and the actual borrowing could be from any department of a local
government.
Another form of borrowing is debt to the government employees, mainly teachers
of elementary and secondary school, and venders providing products or services to
governments. Local governments (particularly the county and township governments) in
dire fiscal straits are unable to pay the full salaries of elementary and secondary school
teachers and the unpaid part becomes the local debt. On some occasions, grassroots
governments issue informal debt papers (baitiao) to farmers when they are financially
incapable to pay farmers for their agriculture products.
Meanwhile, almost all local governments provide loan guarantees for SOEs directly
or indirectly, although it is neither allowed by the budget law. Local governments also
provide loan guarantees to the central bank for local financial institutions to avoid financial
risk.
Borrowing from Commercial Banks
32
As banks have been transformed into financial institutions, local governments posed
prevailing impact on the administration of bank lending through the appointment of
regional bank heads, and also through intangible influences such as the supply of water and
electricity, housing, recruitment of bank employees, and schooling of children (Huang
1996). Therefore, local government gained substantial control over the credit supply and
emboldened overlending and underpricing of loans, which led to the excessive expansion
of banks’ credit and a mounting number of bad and non-performing loans. Ultimately the
borrowers of nonperforming loans may default, requiring the lender to absorb the loss. In
1998, the central government had to bail out local government by issuing 270 billion yuan
of government bonds to recapitalize the state-owned banks (Jin and Zou 2003, 308)
Indirect Borrowing
Sub-national governments take on indirect borrowing through various channels such as
local-owned enterprises or Trust and Investment Companies (TICs).
Local enterprises, in charge of providing public services, can and do borrow from
banks and on the capital market. Given the local finance stress and insufficient financial
support from the upper levels, such local borrowing essentially finances much sub-national
spending. This in turn created contingent liabilities for local governments. Local
governments may also borrow through "collective financing" in which various groups of
people, such as government employees and employees of local SOEs, are selected to be
borrow from by local governments. The borrowing could be voluntary, but most of time it
was forced by local governments. Most of these borrowings were used to start local
enterprises. However, a significant part of these projects were not successful and the
bankruptcy of these enterprises due to lack of management skills and experiences imposed
serious debts to local governments. Local authorities also maintain considerable latitude in
securing and deploying financial resources for investment projects. For instance, sub-
national governments are allowed to approve investment projects below 50 million yuan
and technology promotion projects below 30 million. These projects can be funded by
commercial and indirect borrowing, which resulted in redundant of sub-national medium-
and small-sized investment projects (Jin and Zou 2003).
33
Another channel for local indirect borrowing is establishing dummy financial
companies, which has fueled the proliferation of Trust and Investment Companies (TICs)
and securities hourses at subnational levels. TICs receive government and enterprise trust
deposits or trusted deposits. Most TICs were created by the four state-owned specialized
banks, and some by other banks, the MOF, or municipalities. In the late 1980s, as many as
365 TICs were in business across the country (Mehran, et al. 1996).
Foreign Borrowing
External borrowing by the central and local government-owned financial institutions has
been managed by a credit management system, under which the issuance of debt requires a
quota from the SDPC and an approval from the State Administration of Foreign Exchange
(SAFE). Most of these local financial institutions are TICs controlled by local governments
and those TICs engaged in international business are referred to as International Trust and
Investment Companies (ITICs). Since the borrowing by these entities are not guaranteed
by any direct or indirect credit support from the central government and hence the central
government refused to bail out ITICs, Guangdong ITIC went bankrupt in 1999 as well as
Fujian ITIC, Tianjin ITIC, Shanghai ITIC, Daian ITIC, Shandong ITIC, and Shenzhen
ITIC. By the end of 1998, the external debt of domestic financial institutions (including
central agencies) was $41.99 billion, 28.8 percent of China’s total external debt. It is a
question whether the central government has to step in once financial failure emerge on a
large scale among these ITICs (Jin and Zou 2003, 313).
Although practiced informally or illegally, local borrowing played an important role in
local economic development and in alleviating local fiscal pressure, particularly for those
localities struggling to make ends meet. The significant improvement of local
infrastructure in almost all jurisdictions in the last decade is partially attributed to local
borrowing. However, illegal local borrowing usually operated behind the screen, is
difficult to control and susceptible to corruption, which seriously damages local
governments’ accountability.
34
5. Fiscal Power Shifting through Decentralization China’s decentralization is featured by the devolution of fiscal power during the period of
contracting system (1979-1993) and the recentralization of fiscal power under the current
tax sharing system (1994-present).
1) 1979 – 1993: Fiscal Power Devolution
In 1980, China implemented the policy of fenzhaochifan (“eating in different kitchens”),
aiming to separate the central and local budgets. Budgetary contracts between the central
and local governments were established which often varied by regions and were subject to
renegotiations when circumstances changed. During the process of fiscal decentralization,
local governments developed power and their relationships with local enterprises
strengthened.
Under the 1980-93 fiscal contract system, local governments, as agents of the
central government, had strong incentives to reduce the revenue transfer to the center and
heighten the need for transfers from the center as net local net income was to be transferred
to the central government and shortfalls were to be covered automatically. The “Fiscal
Contracting System”, established in 1988, also created a strong incentive for local
governments to conceal information about local revenues from the center as this
information would be valuable when the fiscal contracts were negotiated. During this time,
many of the new townships and village enterprises were joint ventures with local
government ownership; local enterprises and local governments colluded to hide profits
from taxation and shift deficits to the center with retained profits accruing to the benefit of
“local shareholders”. Thus the system heightened an asymmetry, in that local governments
absorbed excess revenues, while deficits were covered by the center (Ahmad 2002).
Further, although local governments did not have the authority to alter the statutory tax
rates and bases, they literally controlled the effective rates and bases by offering varying
degrees of tax concessions to enterprises and shifting budgetary funds to extra-budgetary
funds.
The waning central fiscal control and distorted local incentives prompted a
conspicuous falling trend of central revenues and a significant reduction in fiscal revenue
collection as a percentage of GDP. The ratio of total government revenue to GDP declined
35
from 28.4 percent to about 12.6 percent over the period 1979-1993; the central
government’s share of the total revenue reduced from 40.5 percent to 22 percent over the
period 1984-1993.
In the face of the plummeting fiscal revenue, the center had to resort to various ad
hoc instruments, including arbitrarily shifting expenditure responsibilities to local
governments, cutting intergovernmental transfers, forcing local governments to purchase
bonds at lower-than-market rates, and recentralizing locally-owned enterprises, to
influence revenue remittances from local governments (Ma and Norregaard 1998).
However, these instruments only created a vicious cycle of perverse reactions from
the local governments as the center was opt to revise the rules of the game to penalize local
governments with fast growing revenues. Local governments, with distrust on the center
and also increasing pressure to meet new spending responsibilities, began collecting a wide
variety of extra-budgetary revenues, and even levying illegal fees and charges for
providing basic public services when the fiscal needs were beyond the revenue capacity.
Meanwhile, the weakening fiscal power at the center increased government deficits and
reduced the central government’s flexibility in using fiscal policy in stabilization and
redistribution.
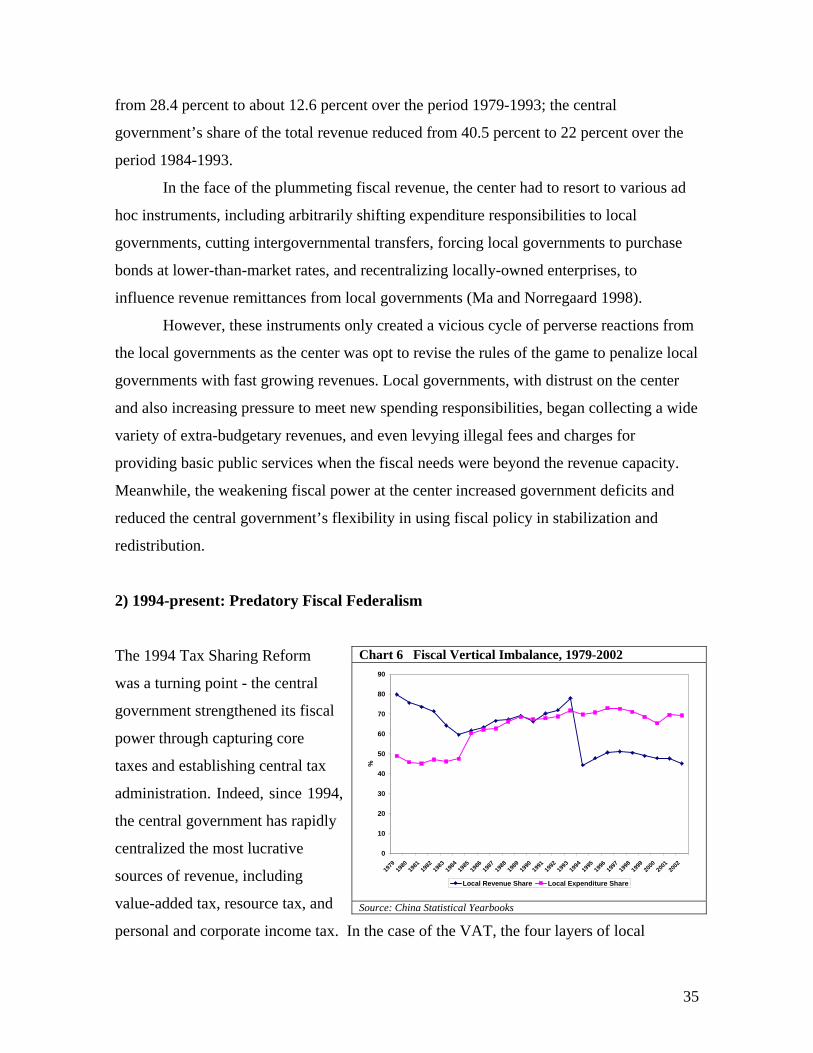
2) 1994-present: Predatory Fiscal Federalism
The 1994 Tax Sharing Reform
was a turning point - the central
government strengthened its fiscal
power through capturing core
taxes and establishing central tax
administration. Indeed, since 1994,
the central government has rapidly
centralized the most lucrative
sources of revenue, including
value-added tax, resource tax, and
personal and corporate income tax. In the case of the VAT, the four layers of local
Chart 6 Fiscal Vertical Imbalance, 1979-2002
0
10
20
30
40
50
60
70
80
90
1979
1980
1981
1982
1983
1984
1985
1986
1987
1988
1989
1990
1991
1992
1993
1994
1995
1996
1997
1998
1999
2000
2001
2002
%
Local Revenue Share Local Expenditure Share Source: China Statistical Yearbooks
36
government—provincial, prefectural/city, county, and township—together share only 25%
of VAT intake. In 2002, the central government further ordered local governments to give
50% of personal and enterprise income tax over to the central government. As chart 6
reveals, local revenue as a share of total government revenue dropped rapidly after the
1994 tax centralization while the local expenditure as a share of total government
expenditure lingered around 70 percent.
The process of recentralizing revenues upward and devolving expenditures
downward extends from the central to the provincial to the prefectural to the county and
ultimately to the township and village level. Each level pushes fiscal responsibilities down
to lower levels while asserting the largest possible claim on revenue residuals. At the
grassroots levels—the county and township levels-- local governments are left no choice
but either predate on local residents, enterprises, and financial institutions or simply not
provide the primary public services.
Politically, the increasing fiscal dependence of county governments on higher
levels may lead to greater political dependence. The fiscal system today is even more
capable of reinforcing the central mandates and hence more vulnerable to punitive
measures from the center (Wedeman 1999;Yang 2004). The central government is also
attempting to inject more earmarked funds directly to the county level (Wong 2005), which
further enhances the organizational integration of grass-roots government with the center.
Central edicts may carry more weight than it would have under the old fiscal system,
which is confirmed by the observation of the rapid local response to the center’s action on
the SARS scare (Liu and Shih 2004).
In the wake of stronger central power in the midst of fiscal decentralization, some
researchers have offered their explanation: in China, fiscal decentralization in the context
of political authoritarianism creates a unique version of distorted federalism, which is
named “predatory fiscal federalism” by some researchers (Shih, et al. 2004;Yao and Yang
2003;Zhang 2003;Zhu and Ye 2001). Due to a hierarchical party structure and the absence
of national elections, the central and provincial governments bear enormous leverage over
grassroots governments – the higher tiers of government devolve fiscal responsibilities
down to the lowest levels of government and meanwhile the most productive sources of
37
revenue are captured by the top tiers of government2. Plus fiscal responsibilities at various
levels are not defined in the constitution and therefore left to the manipulation of higher
tiers of governments. Bureaucrats at all level manage to maximize revenue in order to
build up administrative performance (zhengji). For instance, infrastructure construction is a
main way to present government performance, which indeed led to rampant redundant
investment in many places. In this fiscal structure, Shih et al. (2004) argued that the central
government’s only incentive to transfer money downward is the fear of widespread social
stability or the complete collapse of grassroots governments.
6. Effects of Fiscal Decentralization on Macroeconomic Performance The conventional wisdom favors decentralization as a way to improve the efficiency of the
public sector and thus promote economic growth (Bird, 1993; Bird and Wallich 1993; Bahl
and Linn 1992; Gramlich 1993; Oates 1993, 1972; and World Bank1990, 1992) because
local governments are better positioned than the national government to deliver public
services that match local preferences and needs. Many proposals favor assigning more
revenue and expenditure responsibilities to local governments. The question of whether
fiscal decentralization has contributed to China’s economic success over the past 25 years
is still open to debate. Table 10 provides an overview of various studies conducted on this
subject. Table 10 China: Fiscal Decentralization and Economic Growth
Literature Time Period Conclusion Qi (1992) positive Qian and Weingast (1997) 1980-1993 Promoted economic development Yang (1997) Negatively affected economic growth Ma (1997) positive Zhang and Zou (1998) 1980-1992 negative Qian (1999) 1980-1993 Promoted local economies Young (2000) Negatively affected economic growth Lin and Liu (2000) 70-93 positive Jin and Zou (2005) 1979 - 1999 Divergence in revenue and expenditure at the sub-national level is
associated with higher rates of growth. Jin, Qian and Weingast (2005) 1970-1999 positive
Some scholars argue that fiscal decentralization has been conducive to China’s
economic development. Qi (1992) and Qian (1999) suggested that the fiscal contract
2 This form of fiscal arrangement is still considered federal because local governments do not merely serve as agents to implement standardized central policies; they have considerable discretion to enact specific policies and they have to pay for the provision of most public goods.
38
system (1980-1993) provided material incentives that stimulated sub-national governments
to promote local economies. Qian and Weingast (1997) argued that the fiscal contract
system enabled sub-national governments to avoid revenue predation from the center and
therefore retain financial resources for investments that promoted economic growth. Lin
and Liu (2000) have found that fiscal decentralization is one of the key driving forces3 of
China’s remarkable economic performance via improvement in efficiency rather than
increases in investment. Jin, Qian and Weingast (2005) suggested that fiscal
decentralization reforms considerably strengthened the fiscal incentives of provincial
governments which are generally conducive to provincial economic development and
reform.
Some studies have, however, offered evidence suggesting that fiscal
decentralization is detrimental to China’s economic growth. Yang (1997) and Young (2000)
offered evidence suggesting that fiscal decentralization fragmented the national market,
encouraged local protectionism, induced duplicate investments, and hence negatively
affected economic development. Zhang and Zou (1998) provided supportive evidence
demonstrating that the share of central government development spending has a positive
impact on economic growth while the share of provincial government development
spending is negatively related to growth. Using data across 28 Chinese provinces over the
period of 1980—1992, they have found a significant and negative relationship between the
degree of fiscal decentralization and provincial economic growth. Another concern is that
the aggressive decentralization has crowded out public spending on national priorities by
local public projects. Some public infrastructures crucial to economic growth are better
provided by the central government, such as high ways, railways, telecommunication, and
power. The inefficient resource allocation induced by the fast fiscal decentralization is
detrimental to the overall economic performance. Jin and Zou (2005) empirically
approved that divergence, rather than convergence, in revenue and expenditures at the sub-
national level of government is associated with higher rates of growth.
7. Political as well as Economic Issues arising after Decentralization
1) Decentralization and Inequality 3 Other driving forces include rural reform, the nonstate sector, and capital accumulation.
39
It is widely believed that fiscal decentralization has exacerbated regional inequality in
China. One is that, fiscal decentralization, combined with distorted price systems and
duplicated industry structures across regions, led to inter-regional trade protection and
fragmented domestic markets as a consequence of local governments’ rent-seeking
behaviors (World Bank. 2003;Young 2000). Qiu, et al. (2003) developed a theoretical
model to reveal that fiscal decentralization and international trade protection together give
rise to inter-regional trade protection which can widen the regional gap in China. On the
other hand, fiscal expenditure decentralization reform that hardens the budget constraints
for grass-root levels of government undermines the revenue-starved jurisdictions’ ability to
provide public goods and services, aggravate the lower level governments’ fiscal burden,
and prevent them from pursing further economic investment and development, which
ultimately leads to the regional income and fiscal gaps (Jin and Zou 2003;Park, et al.
1996;Yao 2005b). Kanbur and Zhang (2001) examined the time series of regional
inequality measured by the GE coefficient over the period of 1952—1999. They have
found that decentralization had a significant and positive effect on the degree of regional
inequality; and it has especially enlarged the rural-urban inequality though it reduced the
coastal-inland inequality. To shed more light on this issue, further empirical analyses are
needed using more refined measures of decentralization and more disaggregated data.
China's decentralized fiscal system has not coped well with the problem of
mushrooming inequality. The consensus among observers of China is that both the
willingness and capability of the government to cope with inequality have weakened. In
the pre-reform period, the fiscal system was highly redistributive. For instance, over the
period 1978-1980, Shanghai turned over half of its provincial GDP while the poor
provinces received large subsidies as large as 20-25 percent of their GDP. The fiscal
decentralization between 1979 and 1994 had greatly reduced the scale of inter-regional
redistribution as a result of the localization of public finance and remarkable decline in
inter-governmental transfers. For example, in 1993, Shanghai only submitted only about
8.5 percent of its GDP, and other rich provinces turned over even less. The net remittance
of Guangdong, was only 0.4 percent of GDP. Meanwhile, subsidies to poor regions cut
down sharply (Wang and Hu 1999). However, the mild redistributive feature through the
1993 fiscal system was essentially eliminated by the 1994 Tax Sharing Reform. The taxes
40
were reassigned, with the center capturing the most lucrative taxes, and the transfer of “tax
rebate” was introduced, favoring the rich regions as the leverage to buy in those affluent
provinces.
Moreover, even other discretionary transfers, including earmarked grants and
equalization grants, are not targeted to poorer provinces. Instead, the fiscal transfer system
is used to maintain the loyalty of local officials and key constituents (Liu and Shih 2004,
20-21). Wang (2001) attempted to explore the underlying logic of intergovernmental
transfers in China and has found that that maintaining national unity is an overriding
concern for Chinese political elites -provinces with predominantly non-Han population
have been given the highest levels of subsidies, even though their income levels exceed
those of the poorer provinces. Wong (2000) suggested that the overall impact of inter-
governmental transfers is disequalizing—net of all effects, inter-governmental transfers
tend to favor more developed provinces. Liu and Shih (2004) also confirmed that the post-
1994 fiscal system has exacerbated the divergence in county-level fiscal balance after
fiscal transfers are taken into account. Tsui (2005) conducted an analysis on the impact of
the intergovernmental transfers on fiscal disparities at the county-level. Not surprisingly,
the tax rebate is the conspicuous source of dis-equalizing, contributing more than 21
percent of fiscal disparities in 2000. The TPG, designed supposedly for fiscal equalization,
actually increases fiscal inequality. Yao (2005a) uses a comprehensive dataset for 2755
counties and applied a single-threshold linear-spline model to evaluate the most recent
grant policies. The study reveals a significant equalizing effect of grants to the rural low-
revenue-capacity counties yet a significant counter-equalization effect to urban high-
revenue-capacity counties. For the majority of counties, the effects of equalizing and
disequalizing grant policies sum up to zero (Yao 2005a, 28).
2) Proliferation of Off-Budgetary Resources
Besieged by pressing fiscal needs but constrained financial resources, local governments
have vigorously pursued extra-budgetary funds. Local governments are also faced with
growing spending needs, particularly the financing of social safety nets and infrastructure
investment. Some localities have to take over the uncompensated transfers of social
41
expenditures from SOEs, including housing, childcare, medical care, education, and
pension debts. In spite of overwhelming fiscal needs, local governments in China literally
have no tax autonomy: the center set tax rates and the bases of collection. Plus the central
government, knowing the stress on local budgets, tolerated and often encouraged local
governments to seek “self-reliant” solutions. The channel open to local governments for
revenue expansion is to develop extra-budgetary4 and off-budget5 resources, in the form of
fees and charges, over which the local officials have complete control and face virtually no
oversight (World Bank. 2002). While no official figures are available, some estimates
suggest that the number of extra-budgetary funds and off-budgetary funds may be as large
as 1,000. Some scholar estimated that the size of extra-budgetary and off-budgetary
revenues is similar to the level of budgetary resources, accounting for 11-12 percent of
GDP (Ma and Norregaard 1998, 2).
The 1994 tax-assignment reform did little to discipline the opaque and regressive
extra-budgetary funds. Local governments and line departments continue to use extra-
budgetary and off-budgetary funds as a way to avoid central government (or other higher
level government) restriction on the use of these funds. With almost half of the public
sector revenue wandering outside the budgetary system, the non-budgetary financing at the
macro-level undermines fiscal discipline, hampers efficient resource allocation, and gives
rise to wasteful spending and corruption. The unruly system of extra- and off-budget
finance further impoverishes life of poor farmers by levying myriad fees and charges for
basic public services. Such “unauthorized” use of revenues poses substantial challenges to
the national fiscal discipline, economic reforms, and political stability; it has made poor
farmers in the less-developed regions more miserable.
Prior to 1994, budget deficits were financed by a combination of credits from the
People’s Bank of China (PBC) and domestic and international borrowing. The new budget
law (effective January 1, 1995) stipulates budgets at all levels of government shall be
4 Extra-budgetary revenues are obtained by government units using coercive power but are not included in the formal budget system. They include various surcharges and service fees charged by government agencies. In theory, extra-budgetary revenues are collected based on regulations promulgated by the central or provincial level governments. 5 Off-budget revenues are collected by government units, particularly, township and village level governments, without the authorization from the central or provincial level governments.
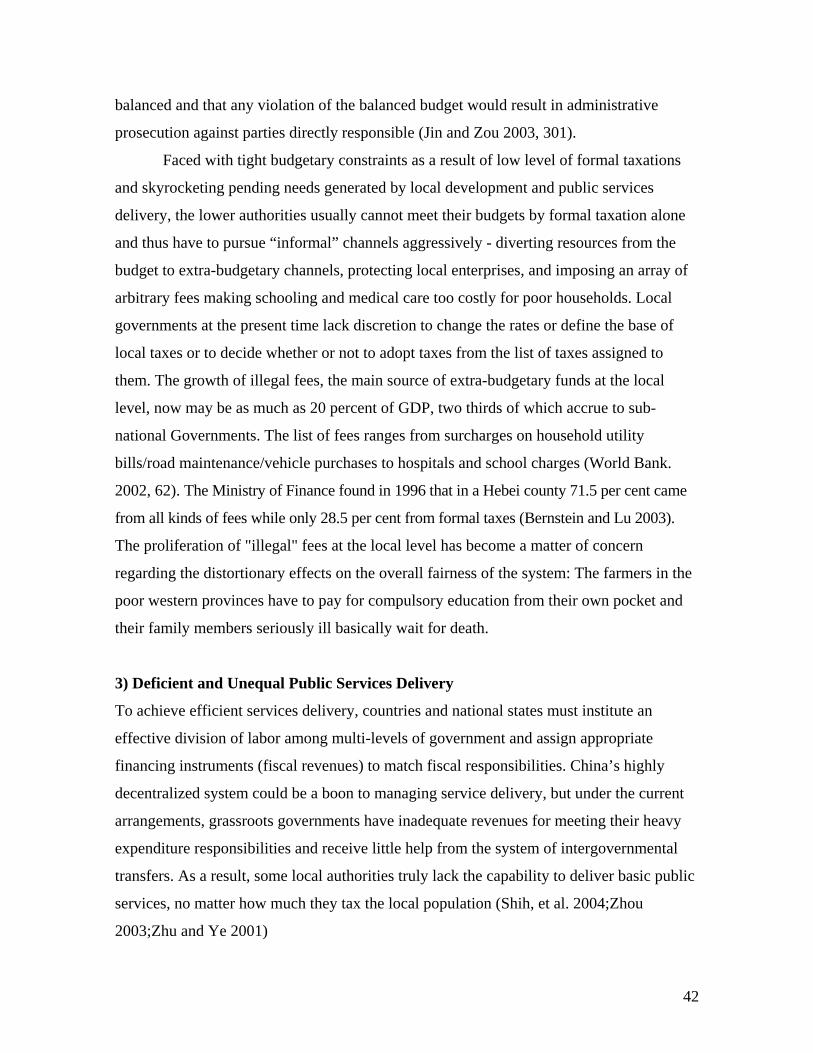
42
balanced and that any violation of the balanced budget would result in administrative
prosecution against parties directly responsible (Jin and Zou 2003, 301).
Faced with tight budgetary constraints as a result of low level of formal taxations
and skyrocketing pending needs generated by local development and public services
delivery, the lower authorities usually cannot meet their budgets by formal taxation alone
and thus have to pursue “informal” channels aggressively - diverting resources from the
budget to extra-budgetary channels, protecting local enterprises, and imposing an array of
arbitrary fees making schooling and medical care too costly for poor households. Local
governments at the present time lack discretion to change the rates or define the base of
local taxes or to decide whether or not to adopt taxes from the list of taxes assigned to
them. The growth of illegal fees, the main source of extra-budgetary funds at the local
level, now may be as much as 20 percent of GDP, two thirds of which accrue to sub-
national Governments. The list of fees ranges from surcharges on household utility
bills/road maintenance/vehicle purchases to hospitals and school charges (World Bank.
2002, 62). The Ministry of Finance found in 1996 that in a Hebei county 71.5 per cent came
from all kinds of fees while only 28.5 per cent from formal taxes (Bernstein and Lu 2003).
The proliferation of "illegal" fees at the local level has become a matter of concern
regarding the distortionary effects on the overall fairness of the system: The farmers in the
poor western provinces have to pay for compulsory education from their own pocket and
their family members seriously ill basically wait for death.
3) Deficient and Unequal Public Services Delivery
To achieve efficient services delivery, countries and national states must institute an
effective division of labor among multi-levels of government and assign appropriate
financing instruments (fiscal revenues) to match fiscal responsibilities. China’s highly
decentralized system could be a boon to managing service delivery, but under the current
arrangements, grassroots governments have inadequate revenues for meeting their heavy
expenditure responsibilities and receive little help from the system of intergovernmental
transfers. As a result, some local authorities truly lack the capability to deliver basic public
services, no matter how much they tax the local population (Shih, et al. 2004;Zhou
2003;Zhu and Ye 2001)
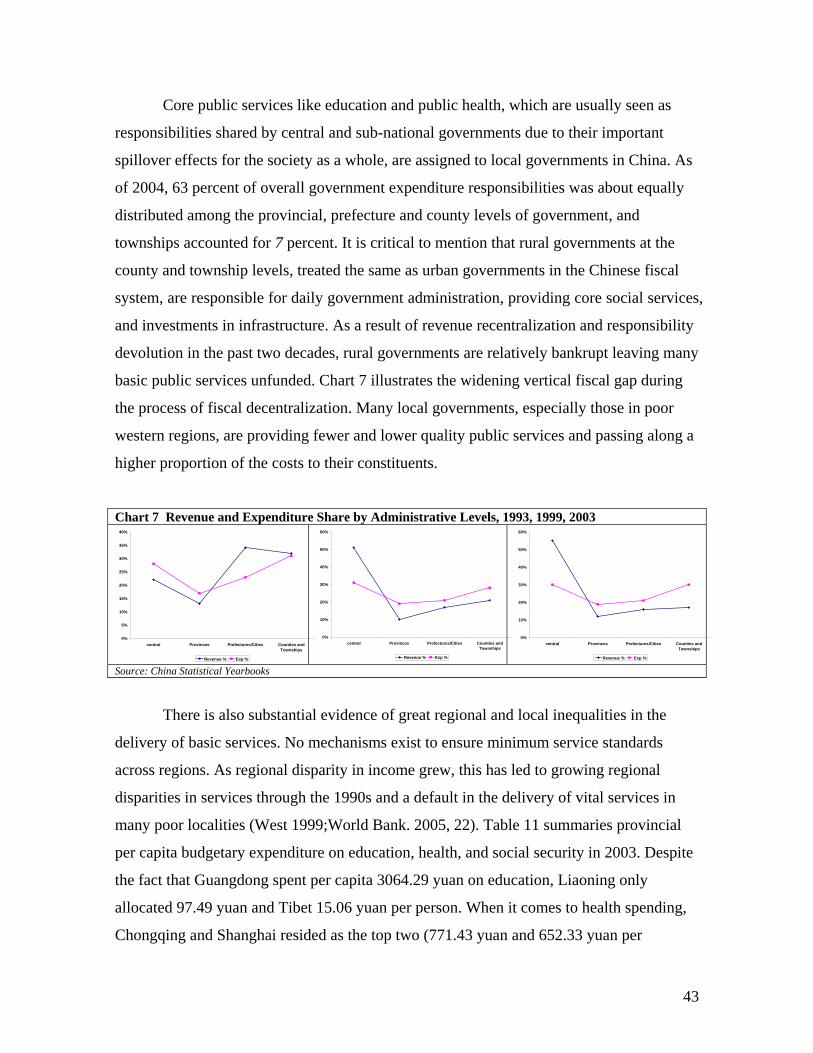
43
Core public services like education and public health, which are usually seen as
responsibilities shared by central and sub-national governments due to their important
spillover effects for the society as a whole, are assigned to local governments in China. As
of 2004, 63 percent of overall government expenditure responsibilities was about equally
distributed among the provincial, prefecture and county levels of government, and
townships accounted for 7 percent. It is critical to mention that rural governments at the
county and township levels, treated the same as urban governments in the Chinese fiscal
system, are responsible for daily government administration, providing core social services,
and investments in infrastructure. As a result of revenue recentralization and responsibility
devolution in the past two decades, rural governments are relatively bankrupt leaving many
basic public services unfunded. Chart 7 illustrates the widening vertical fiscal gap during
the process of fiscal decentralization. Many local governments, especially those in poor
western regions, are providing fewer and lower quality public services and passing along a
higher proportion of the costs to their constituents.
Chart 7 Revenue and Expenditure Share by Administrative Levels, 1993, 1999, 2003
0%
5%
10%
15%
20%
25%
30%
35%
40%
central Provinces Prefectures/Cities Counties andTownships
Revenue % Exp %
0%
10%
20%
30%
40%
50%
60%
central Provinces Prefectures/Cities Counties andTownships
Revenue % Exp %
0%
10%
20%
30%
40%
50%
60%
central Provinces Prefectures/Cities Counties andTownships
Revenue % Exp %
Source: China Statistical Yearbooks
There is also substantial evidence of great regional and local inequalities in the
delivery of basic services. No mechanisms exist to ensure minimum service standards
across regions. As regional disparity in income grew, this has led to growing regional
disparities in services through the 1990s and a default in the delivery of vital services in
many poor localities (West 1999;World Bank. 2005, 22). Table 11 summaries provincial
per capita budgetary expenditure on education, health, and social security in 2003. Despite
the fact that Guangdong spent per capita 3064.29 yuan on education, Liaoning only
allocated 97.49 yuan and Tibet 15.06 yuan per person. When it comes to health spending,
Chongqing and Shanghai resided as the top two (771.43 yuan and 652.33 yuan per
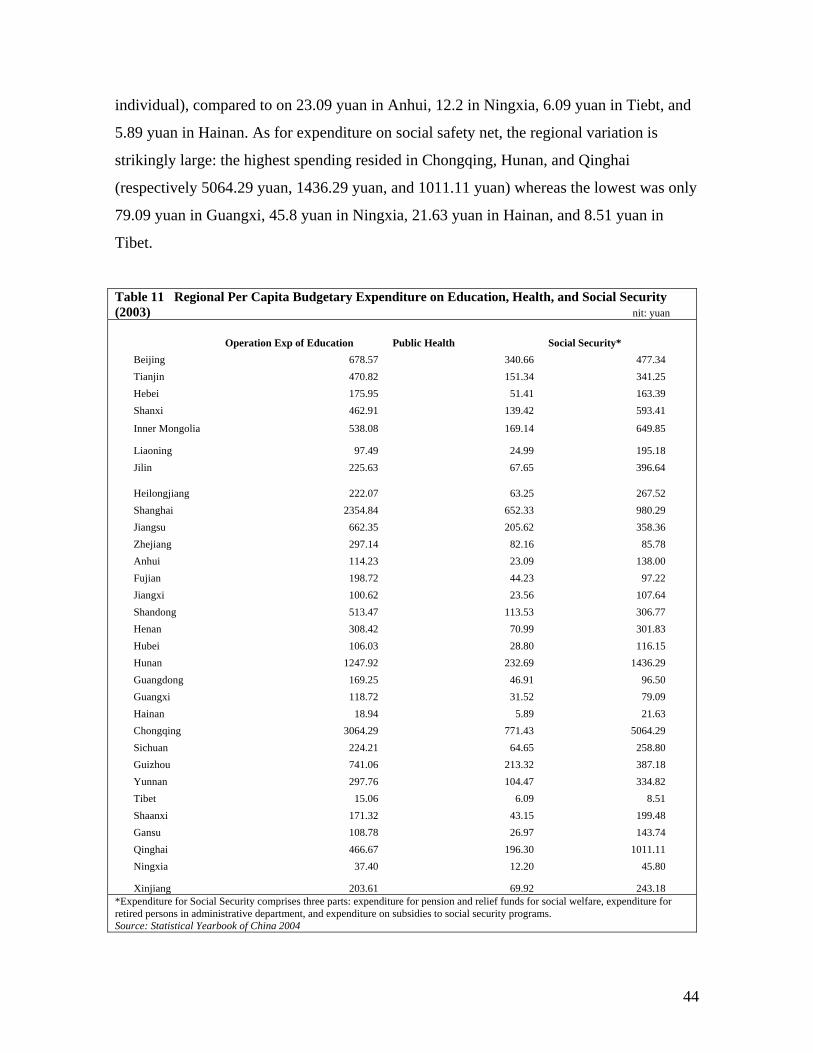
44
individual), compared to on 23.09 yuan in Anhui, 12.2 in Ningxia, 6.09 yuan in Tiebt, and
5.89 yuan in Hainan. As for expenditure on social safety net, the regional variation is
strikingly large: the highest spending resided in Chongqing, Hunan, and Qinghai
(respectively 5064.29 yuan, 1436.29 yuan, and 1011.11 yuan) whereas the lowest was only
79.09 yuan in Guangxi, 45.8 yuan in Ningxia, 21.63 yuan in Hainan, and 8.51 yuan in
Tibet.
Table 11 Regional Per Capita Budgetary Expenditure on Education, Health, and Social Security (2003) nit: yuan
Operation Exp of Education Public Health Social Security* Beijing 678.57 340.66 477.34 Tianjin 470.82 151.34 341.25 Hebei 175.95 51.41 163.39 Shanxi 462.91 139.42 593.41
Inner Mongolia 538.08 169.14 649.85
Liaoning 97.49 24.99 195.18 Jilin 225.63 67.65 396.64
Heilongjiang 222.07 63.25 267.52 Shanghai 2354.84 652.33 980.29 Jiangsu 662.35 205.62 358.36 Zhejiang 297.14 82.16 85.78 Anhui 114.23 23.09 138.00 Fujian 198.72 44.23 97.22 Jiangxi 100.62 23.56 107.64 Shandong 513.47 113.53 306.77 Henan 308.42 70.99 301.83 Hubei 106.03 28.80 116.15 Hunan 1247.92 232.69 1436.29 Guangdong 169.25 46.91 96.50 Guangxi 118.72 31.52 79.09 Hainan 18.94 5.89 21.63 Chongqing 3064.29 771.43 5064.29 Sichuan 224.21 64.65 258.80 Guizhou 741.06 213.32 387.18 Yunnan 297.76 104.47 334.82 Tibet 15.06 6.09 8.51 Shaanxi 171.32 43.15 199.48 Gansu 108.78 26.97 143.74 Qinghai 466.67 196.30 1011.11 Ningxia 37.40 12.20 45.80
Xinjiang 203.61 69.92 243.18 *Expenditure for Social Security comprises three parts: expenditure for pension and relief funds for social welfare, expenditure for retired persons in administrative department, and expenditure on subsidies to social security programs. Source: Statistical Yearbook of China 2004
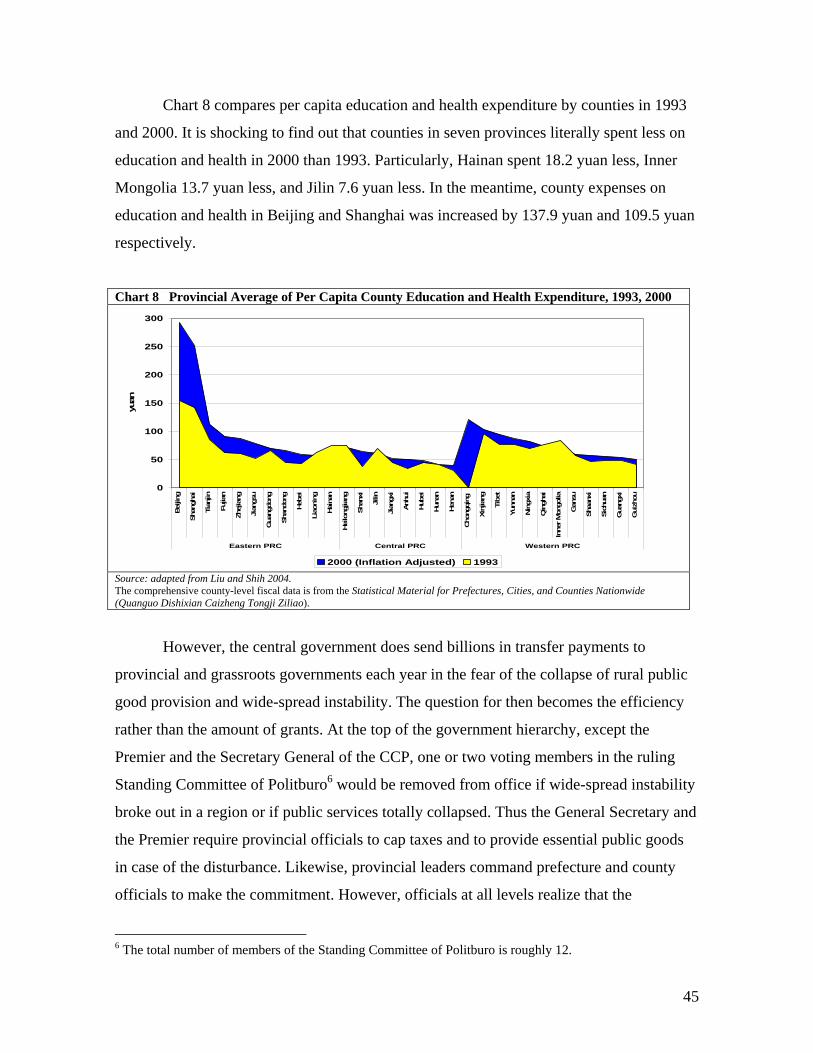
45
Chart 8 compares per capita education and health expenditure by counties in 1993
and 2000. It is shocking to find out that counties in seven provinces literally spent less on
education and health in 2000 than 1993. Particularly, Hainan spent 18.2 yuan less, Inner
Mongolia 13.7 yuan less, and Jilin 7.6 yuan less. In the meantime, county expenses on
education and health in Beijing and Shanghai was increased by 137.9 yuan and 109.5 yuan
respectively.
Chart 8 Provincial Average of Per Capita County Education and Health Expenditure, 1993, 2000
0
50
100
150
200
250
300
Bei
jing
Shan
ghai
Tian
jin
Fujia
n
Zhej
iang
Jian
gsu
Gua
ngdo
ng
Shan
dong
Heb
ei
Liao
ning
Hai
nan
Hei
long
jiang
Shan
xi
Jilin
Jian
gxi
Anh
ui
Hub
ei
Hun
an
Hen
an
Cho
ngqi
ng
Xinj
iang
Tibe
t
Yunn
an
Nin
gxia
Qin
ghai
Inne
r Mon
golia
Gan
su
Shaa
nxi
Sich
uan
Gua
ngxi
Gui
zhou
Eastern PRC Central PRC Western PRC
yuan
2000 (Inflation Adjusted) 1993 Source: adapted from Liu and Shih 2004. The comprehensive county-level fiscal data is from the Statistical Material for Prefectures, Cities, and Counties Nationwide (Quanguo Dishixian Caizheng Tongji Ziliao).
However, the central government does send billions in transfer payments to
provincial and grassroots governments each year in the fear of the collapse of rural public
good provision and wide-spread instability. The question for then becomes the efficiency
rather than the amount of grants. At the top of the government hierarchy, except the
Premier and the Secretary General of the CCP, one or two voting members in the ruling
Standing Committee of Politburo6 would be removed from office if wide-spread instability
broke out in a region or if public services totally collapsed. Thus the General Secretary and
the Premier require provincial officials to cap taxes and to provide essential public goods
in case of the disturbance. Likewise, provincial leaders command prefecture and county
officials to make the commitment. However, officials at all levels realize that the
6 The total number of members of the Standing Committee of Politburo is roughly 12.
46
requirement is only meant to prevent the worst scenarios from occurring. Therefore,
despite the huge amount of resources transferred from the center, the revenue predation at
higher tiers of government remains and grassroots governments simply struggle to get their
ends meet (Shih, et al. 2004, 6-9).
4) Farmers’ Burden and Rural Unrest
The farmer burden has landed at the center of the political debate as complaints, petitions,
and even violent unrest are spreading as a consequence of grassroots governments passing
their financial stress to local residents through indirect borrowing, heavier taxation and
informal fees (Li 2001;Ren 2002;Tao, et al. 2005). Since the banking reform of 1998
when the power to appoint bank managers was removed from local authorities, taxation
and informal charges became the few means of fulfilling their fiscal obligations (Bernstein
and Lu 2003).
Throughout the reform-era, the center has launched several campaigns to limit the
administrative fees collected by grassroots governments. These reforms culminated to the
recent tax-for-fees (feigaishui) reform in March 2000, which attempted to remove all local
informal charges and lift the rates of formal agricultural taxes. Then a provincial pilot
program of rural taxation reform in Anhui was initiated, but very soon the local budgets in
Anhui were under great financial strain due to significant reduction of revenues.
Complaints from local officials were accumulating; in some districts of Anhui, taxation
rate surged up again and after a short-term reduction, local fees re-emerged (Ren 2002). In
2002, the rural taxation reform in 20 provinces across China was carried out, accompanied
by a central transfer of RMB 25 billion and provincial transfers of about the same amount.
However, the issue of peasant burden and the risk of rural unrest are still haunting
the regime. Tao, et al. (2005) argued that the burden problem lies in the intrinsic nature of
the Chinese predatory fiscal federalism. The authoritarian regime is able to embolden
insufficiently funded state mandates in the countryside; in the meantime, the decentralized
system impeded the government to monitor the behavior of local cadres who can impose
charges on farmers in the name of implementing these central government mandates. Their
empirical analysis, based upon field interviews in 2003-2004 and a panel data set across 8
provinces from 1986-2002, revealed that the increase of rural income disparity and the
47
uneven tax and fee distribution among different income groups explained the increasingly
severe rural taxation after 1990s.
8. Conclusion and Policy Options Given the objective of improving local public services and promoting economic growth,
the present system of fiscal decentralization may not be sustainable in the long run. The
way forward will almost certainly embrace a significant modification and reforms of the
existing intergovernmental fiscal system. We explore a few general policy options for
China in this concluding section.
(1) Set up formal and stable expenditure assignment to clarify the responsibilities of
governments
China has made dramatic progress in separating government from SOEs and re-defining
the function and responsibility of government in the economy in last two decades with the
economic reform and fiscal decentralization, but there are still many problems from the
expenditure assignment perspective. In particular, a stable and transparent expenditure
assignment with less concurrent responsibilities is in need. It has significant meaning in
China’s political framework because (a) it will significantly improve the accountabilities of
both the central and local governments; (b) it can effectively prohibit government from
encroaching private sectors; and (c) sound expenditure assignment is also a key component
to solve the horizontal fiscal disparities as the expenditure follows with proper fiscal
revenue.
It is necessary to stress that local government should focus on the public services
and social affairs while the central government has the expenditure responsibilities on such
national issues as national defense, foreign affairs, economic development, and improving
regional equality besides the public services and social affairs. This is the prerequisite for
building the sound system of expenditure assignment. The central government should
implement macroeconomic policies such as monetary policy, fiscal policy, exchange rate
etc, and create a harmony macroeconomic atmosphere and environment for the stable and
healthy development of society and economy. The local governments are mainly in charge
of managing social affairs, organizing and delivering public services. Apparently, local
48
governments need to switch the focus from economic construction to public services
gradually.
It is important to build broad and formal coordinating institutions to deal with
concurrent assignment. The responsibilities should be defined for a multi-dimensional
array of attributes, including: (i) actually producing a good or delivering a service, (ii)
providing or administering the service, (iii) financing a service, and (iv) setting standards,
regulations, and policies guiding the provision of government services. While there is no
problem, with assigning competencies over these attributes in the case of exclusive
assignments, there is a need to be explicit about their assignment in the case of concurrent
expenditure assignments.
(2) Align the decentralized fiscal system properly to guarantee all citizens have access
to basic public service
First, it is necessary to start to build national minimal standard of basic public services.
The wide and increasing regional disparity in China could be harmful for the cohesive of
the country. A national minimal standard of public services can play significant role in
improve national cohesive. Basic public services should cover nine years compulsory
education, basic hygiene medical treatment, basic unemployment compensation and
endowment insurance and essential communal facilities services in rural public services.
Second, it should be the central government’s responsibility to guarantee all
citizens have access to basic public service. Although equalization transfer can be regarded
as an important approach to address the issue of regional disparity, it should be more
important in China to through setting national minimal standard and centralizing basic
public services. Most of governments at and under county level cannot provide adequately
basic public services, such as education, health care and social security net. Meanwhile, the
provision of basic public services by the governments at and under county level also
causes the equity problem. With wide economic disparity across provinces, it is also not a
good choice to assign the responsibility to provincial governments.
(3) Provide sound local autonomy to improve local fiscal capacity
49
International experience suggests that local governments are more efficient and effective in
implementing their responsibilities when they are also responsible for raising the revenues
that they spend. In most federal and unitary but decentralized countries, decentralization
reaches local governments quite fully, with these entities having different degrees of
revenue autonomy and exclusive responsibility for an array of functions and services. This
status for local governments is the result of explicit legislation in unitary decentralized
countries. The most important issue in China is how to balance the legislative revenue
autonomy and the administrative revenue autonomy. Apparently there is no such a political
mechanism to prevent the local government from practicing wide administrative revenue
autonomy or abuse legislations. Improve current system to provide local government
reasonable tax autonomy and formalize the administrative autonomy is one of the most
important tasks.
First, the revenue autonomy should be built based on the right balance between
devolution of responsibilities according to economies of scale, the internalization of costs,
and available administrative capacity. There is no consensus on the degree of autonomy
that should be devolved to local governments. However, most federal systems provide
local governments with their own sources of revenue, with autonomy to change at the
margin, tax rates or other elements of the structure of the tax. A tentative list of the most
widely used local taxes across countries would include property taxes, user charges,
business license fees, permits and excise taxes, motor vehicle taxation, income taxes, and
sales taxes.
Second, an asymmetric approach can be explored as a means to allow major cities
and other local governments with more developed capacity to introduce piggyback income
taxes and other forms of local tax autonomy. Greater revenue autonomy must be
considered an important reform in putting decentralization to work at the local level in any
decentralized country. Most sub-national governments need to augment their revenues due
to the large share of committed expenditures and increasing needs. This can be
accomplished in a number of ways, including increasing own source revenues, improved
tax administration, and increasing intergovernmental transfers. Enhancing the revenue
autonomy of sub-national governments would have the added advantage of tightening the
50
Wicksellian link between costs and benefits which would help foster greater fiscal
discipline.
Third, it is necessary to increase the share rates of local part in major taxes such as
VAT and income taxes to improve the fiscal capacity of local government. The framework
of current tax sharing system is consistent with international good practice in revenue
assignment since multiple uses of the same base, if properly coordinated, is found to
simplify administration and reduce compliance costs. However, China’s tax sharing system
has showed significant differences. The major difference is that the tax rates are
determined by the central government, and local governments do not have autonomy to
alter rate. The advantage is that it may eliminate the horizontal tax competitions, but the
disadvantage is that uniform arrangement of tax sharing cannot fit all jurisdictions.
Fourth, it is necessary to continue to reform tax system. The main objective is that
governments at each level should have a stable tax base and main taxes, either exclusively
or shared with other governments. Good property tax for governments at and under county
level should be a reasonable approach. It not only provides a main fiscal resource for richer
jurisdictions, but also simplified currently over-complicated local tax system. Technically,
current VAT and enterprise income tax have serious problem. Production type VAT
generates distortion to market, and the enterprise income tax based on ownership further
enlarge the distortion. In addition, the problem of tax mobility across province has not
been seriously recognized in China. Current revenue assignment is not able to deal with the
increasing tax competition.
(4) Formalize local borrowing system to support sustainable development
First, decentralize the authority of local borrowing to jurisdictions with reasonable fiscal
capacity. International experience suggests that local borrowing has the potential to
generate significant benefits for local governments by allowing them to finance public
capital projects. Current budget law prohibited local governments from borrowing.
However, it did not effectively prevent local government from informal borrowing, and
caused various issues. In future reforms, first, it is necessary to consider to permit local
borrowing. Second, set strict central control on local borrowing. Currently, China’s bond
market is not well developed, and therefore, the municipal bond market should not be
51
regarded as the main approach of local borrowing although it is necessary to start to build
the system.
(5) Standardize intergovernmental transfer to meet the goals of governments
Generally speaking, intergovernmental fiscal transfers are used to correct for vertical and
horizontal imbalances, inter-jurisdictional spillovers, and promote national objectives. All
countries use special purpose grants of one type or another to promote national priorities
and address inter-jurisdictional spillovers. Equalization grants and special purpose
transfers also help reduce vertical imbalances or the mismatch between expenditure
responsibilities and own sources of revenues for sub-national governments. Often different
forms of revenue sharing, in themselves a type of transfer, are used to address vertical
imbalances. However, the only fail proof way to address vertical imbalances is to provide
sub-national governments with an adequate level of revenue autonomy. In summary, a
system of transfers is needed for many good reasons, but it can easily be misused, and
transfers are not a substitute for a healthy degree of tax autonomy.
First, central transfer should focus on national minimal standard of public services
and provincial transfer should focus on equity of local service provision. Current revenue
assignment cannot guarantee all citizens have access to basic public services. On other
hand, requiring sub-national governments to rely too heavily on own revenues to close
vertical imbalances may give rise to economically and/or politically unacceptable
differences in the quality and quantity of critical social and economic services among
jurisdictions. Although in practice countries differ in how, and if, they use measures of
expenditure needs and/or fiscal capacity in their equalization formulae, a well-designed
equalization grant is often used in many countries to reduce horizontal fiscal disparities
among sub-national governments arising from differences in expenditure needs and fiscal
capacity. The intergovernmental transfer should be designed to focus on national minimal
standard of public services.
The design of transfers is of critical importance for efficiency and equity of local
service provision, revenues autonomy, and fiscal health of local governments. In China,
one of the priorities in public finance is to allow all citizens to have access to basic public
services. Consequently, intergovernmental transfer for both decreasing the regional
52
disparity and solving the vertical fiscal imbalance should be based on national minimal
standard of public services.
Second, it is necessary to improve the transparency of transfers. To achieve the
goal of transparency, a couple of measures should be in the agenda.
(a). it is very important to build an intergovernmental transfer system to make sure
the predictability of local budget. The formula-driven intergovernmental transfer is the key
in the design of future reform in intergovernmental transfer to match current budget law. It
also helps to align the behavior of governments and improve governments’ accountabilities.
(b). capital transfers should address externalities across local governments, assist
with financing constraints for lumpy capital, ameliorate significantly different
infrastructure endowments when these are not the result of voluntary decisions, and pursue
sectoral objectives. Two major policy biases need to be openly addressed. First, the belief
by some central authorities that capital expenditures are always more efficient than
recurrent expenditures and second, the lack of maintenance of existing infrastructure.
Conditional matching grant arrangements can help sub-national governments to take
ownership and more properly maintain infrastructure. Capital grants vary by the degree of
flexibility in the use of the funds. They can either be specific project-based grants, which
tend to be closely administered and monitored by line ministries, and categorical or block
grants. Capital grants also vary by the way funds are allocated. The approaches include ad
hoc decisions and negotiations, use of a pre-established formula, and competition
processes with defined application procedures. There is no single best approach to the
design of capital transfers, but non-transparent, highly detailed, and discretionary
procedures should be avoided. Formulas based on needs and clients are often quite feasible.
In Australia, for example, funding for school buildings based on the number of students is
available. Although a few countries use a loan and grant combination for the
implementation of capital grants, the vast majority of countries just use a grant formula
often accompanied by matching arrangements. Matching arrangements can raise some
liquidity problems for low income sub-national governments, but the matching rate can
also be adjusted for fiscal capacity.
(c). it is necessary to formalize conditional grants. The centrally sponsored schemes
are an important source of revenue for local governments in China, and they are justified
53
on the same bases as conditional grants are in other countries: addressing externalities,
pursuing national objectives, and so on. It is generally recognized, however, that there are
too many schemes in China. There, the trend has been in the opposite direction of the
international trend, with a continued growth in the number of schemes. In fact, the schemes
provide a backdoor for the federal government to micro-manage decisions that are
ostensibly the responsibility of the states, and burden the administrative capacity of the
states, reduce their budgetary autonomy, and distort state decision-making and priorities.
Furthermore, these schemes blur the lines of responsibility.
Conditional grants can be block grants for health, social services, and other areas,
while categorical grants require states to apply them to particular narrower areas of
expenditure. These categorical grants act as central mandates on the provincial receiving
the central assistance. The criteria of distribution include measures of need of the
community, capacity of providing services, cost of providing services, and tax effort. The
formulas can be very simple or very complicated, but they are generally related to
population and per capita income.
In summary, transfers to local governments should be clear, transparent, and
formula based. The methodologies should be simple and use available measures, such as
population and property taxation. With time, as data on reliable developmental indicators
are compiled, transfers could also be related to other proxies of revenue capacity and
expenditure need. Given the types of services that are provided at the local level (i.e., water
supply, sanitation, and streetlights) a simple formula with population could be initially
used.
References:
Agarwala, Ramgopal. 1992. "China: Reforming Intergovernmental Fiscal Relations." Discussion Paper No.178. The World Bank: Washington, D.C.
Ahmad, Ehtisham, Li Keping, Thomas Richardson, and Raju Singh. 2002. "Recentralization in China?" IMF working paper WP/02/168. International Monetary Fund: Washington, D.C.
Ahmad, Ehtisham, Raju Singh, and Mario Fortuna. 2004. "Toward More Effective Redistribution: Reform Options for Intergovernmental Transfers in China." IMF working Paper WP/04/98. International Monetary Fund: Washington, D.C.
Bahl, Roy. 1999. Fiscal Policy in China: Taxation and Intergovernmental Fiscal Relations. San Francisco.: The 1990 Institute.
54
Bernstein, Thomas P. and Xiaobo Lu. 2003. Taxation without Representation in Contemporary Rural China. Cambridge, UK; New York: Cambridge University Press.
China Atlas. 2005: China Mapping Publishing House. Huang, Yasheng. 1996. "Central-Local Relations in China During the Reform Era: The
Economic and Institutional Dimensions." World Development, 24:4, pp. 655-72. Jin, Hehui, Yingyi Qian, and Barry R. Weingast. 2005. "Regional decentralization and
fiscal incentives: Federalism, Chinese style." Journal of Public Economics, 89, pp. 1719 - 42.
Jin, Jing and Heng-fu Zou. 2003. "Soft-Budget Constraints and Local Government in China," in Fiscal Decentralization and the Challenge of Hard Budget Constraints. Jonathan Rodden, Gunnar S. Eskeland and Jennie Litvack eds. Cambridge, MA; London, England: The MIT Press.
Jin, Jing and Heng-fu Zou. 2005. "Fiscal decentralization, revenue and expenditure assignments, and growth in China." Journal of Asian Economics, 16, pp. 1047–64.
Kanbur, R. and Xiaobo Zhang. 2001. "Fifty Years of Regional Inequality in China: A Journey through Revolution, Reform and Openness." Cornell University.
Lardy, Nicholas R. 1978. Economic Growth and Income Distribution in the People's Republic of China. Cambridge and New York: Cambridge University Press.
Li, Junsheng. 2002. "Methods to Realize Public Service Equalization." Zhongwai Zhuanjia Lun Caizheng Zhuanyi Zhifu (A Discussion of China and Foreign Experts on Fiscal Transfer System).
Li, Lianjiang. 2001. "Elections and Popular Resistance in Rural China." China Information, Vol. XV:2.
Lin, Justin Yifu and Zhiqiang Liu. 2000. "Fiscal Decentralization and Economic Growth in China." Economic Development and Cultural Change, 49:1.
Liu, Mingxing and Victor Shih. 2004. "Research Note: Gauging the Deficit and Welfare Effects of the 1994 Fiscal Reform at the County Level."
Ma, Jun. 1997a. "China’s Fiscal Reform: An Overview." Asian Economic Journal, 11:4, pp. 443-58.
Ma, Jun. 1997b. Intergovernmental Relations and Economic Management in China. England: Macmillan Press.
Ma, Jun and John Norregaard. 1998. "China’s Fiscal Decentralization." Martinez, Jorge, Baoyun Qiao, Shuilin Wang, and Heng-fu Zou. 2006. China
Decentralization Finance Issues: Lessons from International Experiences. Working paper, the World Bank, Washington, D.C.
Mehran, Hassanali, Marc Quintyn, Tom Nordman, and Bernard Laurens. 1996. Monetary and Exchange System Reforms in China: An Experiment in Gradualism. Washington, D.C.: International Monetary Fund.
Ministry of Finance, China. 2004. Fiance Yearbook of China. National Bureau of Statistics of China. 2004. China Statistical Yearbook. Beijing: China
Statistics Press. Oi, J. C. 1992. "Fiscal reform and the economic foundations of local state corporatism in
China." World Politics, 45:1, pp. 99-126. Oksenberg, Michel and James Tong. 1991. "The evolution of central-provincial fiscal
relations in China, 1971-1984: the formal system." China Quarterly, 125, pp. 1-32.
55
Park, Albert, Scott Rozelle, Christine Wong, and Changqing Ren. 1996. "Distributional Consequences of Reforming Local Public Finance in China." The China Quarterly, 147, pp. 751-78.
Qian, Y. Y. and B. R. Weingast. 1997. "Federalism as a commitment to preserving market incentives." The Journal of Economic Perspectives, 11:4, pp. 83-92.
Qian, Yingyi. 1999. "The institutional foundations of China’s market transition." Annual World Bank Conference on Development Economics.
Qiao, Baoyun and Anwar Shah. 2006. "Local Government Organization and Finance: China." Pp. 137-168 in Local Governance in Developing Countries, ed. Shah, Anwar. Washington, D.C.: The World Bank.
Qiu, Dong. 2005. "China Fiscal Federalism." Central University of Finance and Economics, China.
Qiu, L., J. Li, and Q. Sun. 2003. "Interregional Protection of Fiscal Decentralization and Trade Liberalization." China Economic Review, 14, pp. 227-45.
Ren, Bo. 2002. "The Changes in Rural Taxation System." Caijing Magazine, Vol. 14. Riskin, Carl. 2000. "Decentralization in China's Transition." BRATISLAVA POLICY
PAPERS #4. UNDP: Bratislava. Shah, Anwar, and Chunli Shen. 2006. "Fine Tuning the Intergovernmental Transfer
System to Achieve a Harmonious Society and A Level Playing Field for Regional Development in China." in Public Finance for a Harmonious Society in China, eds. Lou, Jiwei, Shuilin Wang, and Heng-fu Zou, forthcoming.
Shih, Victor, Mingxing Liu, and Qi Zhang. 2004. "“Eating Budget”: The Logic of Fiscal Transfers under Predatory Fiscal Federalism."
Su, Ming. 2003. China: Fiscal Policies and Rural Development (zhongguo nongcun fazhan yu caizheng zhengce xuanze). Beijing: China Finance and Economy Publishing House.
Tao, Ran, Mingxing Liu, Wei Shan, and Qi Zhang. 2005. "Bureaucratic Politics, State Mandates, and Rural Tax Burden in China." the International Studies Association Annul Meeting: Hawaii.
Tsui, Kai-yuen. 2005. "Local Tax System, Intergovernmental Transfers and China's Local Fiscal Disparities." Journal of Comparative Economics, 33, pp. 173-96.
Wang, Shaoguang. 2001. "For National Unity: The Political Logic of Fiscal Transfer in China." Department of Government & Public Administration, The Chinese University of Hong Kong.
Wang, Shaoguang and Angang Hu. 1999. The Political Economy of Uneven Development: The Case of China. Armonk, NY: M. E. Sharpe.
Wedeman, Andrew. 1999. "Agency and fiscal dependence in cental-provincial relations in china." Journal of Contemporary China, 8:20, pp. 103-22.
Wei, Jianing. 2004. "Local Debt and Policy Options." State Council Research Center, China.
West, Lorraine. 1999. "Fiscal autonomy and local initiatives: unequal capacity across regions in China." paper presented at annual meeting of Association for Asian Studies: Boston, MA.
Wong, Christine. 2000. "Central-local relations revisited: the 1994 tax sharing reform and public expenditure management in China." prepared for the international conference
56
on "Central-Periphery Relations in China: Integration, Disintegration or Reshaping of an Empire?" Chinese University of Hong Kong.
Wong, Christine. 2005. "Public sector budget management issues in China." Working Party of Senior Budget Officials. OECD: Paris.
Wong, Christine, Christopher Heady, and Wing T. Woo. 1995. Fiscal Management and Economic Reform in the People's Republic of China. Oxford and New York: Oxford University Press.
World Bank. 2002. China: National Development and Sub-National Finance. Washington, D.C.
World Bank. 2003. China: Promoting Growth with Equity. Washington, D.C. World Bank. 2005. China: Deepening Public Service Unit Reform to Improve Service
Delivery. Washington, D.C. Yang, Dali. 1997. Beyond Beijing: Liberalization and the regions in China. London:
Routledge. Yang, Dali L. 2004. Remaking the CHinese Leviathan: Market Transition and the Politics
of Governance in China. Stanford, CA: Stanford University Press. Yao, Yang and Lei Yang. 2003. "Zhidu gonggei shiheng he zhongguo caizheng fenquan de
houguo (The consequences of the institutional supply imbalance and fiscal federalism in China)." Zhanlue yu Guanli (Strategy and Mangement, 3.
Yao, Yi. 2005a. "Equalizing or not? Assessing the Intergovernmental Grants and their Incentive Effects in China’s Fiscal Reform."
Yao, Yi. 2005b. "Evolution of Income and Fiscal Disparity in Rural China." Young, Alwyn. 2000. "The Razor’s Edge: Distortions and incremental Reform in the
People’s Republic of China." Quarterly Journal of Economics, 115:4, pp. 1091—135. Zhang, Tao and Heng-fu Zou. 1998. "Fiscal decentralization, public spending, and
economic growth in China." Journal of Public Economics, 67, pp. 221-40. Zhang, Yuande. 2003. "'bishui' hai zai jixu ('forced taxation' continues)." Gaige Neican
(Internal Reference of Reform, 31, pp. 20-24. Zhang, Zhihua and Jorge Martinez-Vazquez. 2003. "The System of Equalization Transfers
in China." International Studies Program Working Paper 03-12. Andrew Young School of Policy Studies. Georgia State University.
Zhou, Xiaojin. 2003. "Xiangzhen zhengfu feifa shengcun huanjing xu jiejue (we need to resolve the problem of township governments surviving through illegal means)." Gaige Neican (Internal Reference of Reform), 31, pp. 17-20.
Zhu, Mingxi and Zirong Ye. 2001. "Xibu pinkun diqu jiceng caizheng kunnan diaocha (Investigation into grassroots fiscal difficulties in western poverty region)." Caijing Kexue, April.