firm characteristic determinants of sme participation … characteristic... · · 2016-07-12it...
TRANSCRIPT

Firm Characteristic Determinants of SME
Participation in Production Networks
Charles HARVIE Centre for Small Business and Regional Research
School of Economics, University of Wollongong, Australia
Dionisius NARJOKO
Economic Research Institute for ASEAN and East Asia (ERIA)
Sothea OUM Economic Research Institute for ASEAN and East Asia (ERIA)
August 2014
Abstract: This paper provides an empirical analysis of small and medium enterprise (SME) participation in
production networks. It gauges firm characteristic determinants of SME participation in production networks.
The empirical investigation utilizes results obtained from an ERIA Survey on SME Participation in Production
Networks, conducted over a three month period at the end 2009 in most ASEAN countries (i.e., Thailand,
Indonesia, Malaysia, Philippines, Vietnam, Cambodia, and Laos PDR) and China.
The results suggest that productivity, foreign ownership, financial characteristics, innovation efforts, and
managerial/entrepreneurial attitudes are the important firm characteristics that determine SME participation in
production networks. The paper extends the analysis to identify the determinants that allow SMEs to move
from low to high quality or value adding participation in production networks. The results suggest that size,
productivity, foreign ownership, and, to some extent, innovation efforts and managerial attitudes, are the
important firm characteristics needed by SMEs to upgrade their positions in production networks. The finding
suggests that SMEs really exploit competitiveness from economies of scale only when they are able to engage
in production networks.
Keywords: Small and Medium Enterprises (SMEs), Production Networks, Firm characteristics, East Asia.
JEL Classification: L20, L25
1. Introduction
Corresponding author. Address: ERIA (Economic Research Institute for Asian and East Asia),
Sentral Senayan II Building, 6th fl., Jl. Asia Afrika No.8, Gelora Bung Karno-Senayan, Jakarta
Pusat 10270, Indonesia, Tel: +6221-5797-4460. Email: [email protected]

1
It is generally a well accepted argument among policy makers and scholars that
small and medium enterprises (SMEs) play pivotal role in economic development of a
country. Generating employment, alleviating poverty, and distributing wealth are,
among others, the commonly cited benefits arising from the growth of the SME sector.
Promoting a sustained and strong growth of SMEs, however, has always been, and
continues to be, a challenging task. SMEs are inherently constrained by their capacity
to grow and they usually face much stronger business challenges relative to their large
counterparts.1 More importantly, and this is particularly important in the globalisation
era, is the challenge of an increase in the threat of survival that comes from much
tougher competition among firms in a globalised business environment.
It is commonly argued that globalisation does not necessarily pose a threat for
SMEs; in fact, it could present favourable business opportunities. An ideal way for
this to occur is by increasing the extent of SME participation in regional production
networks. As a number of scholars have put forward regional production networks
have uniquely been developed in the past few decades, particularly in East Asia.2 A
better understanding of firm characteristics that likely determine greater SME
participations in production networks is, therefore, needed. This paper aims to gauge
some of these characteristics, utilizing the results of a firm-level survey conducted in
some ASEAN member countries.3
1 Many, if not most, of these benefits are well covered by the literature. See, for example, Harvie
(2002; 2008), Harvie and Lee (2002; 2005), and Asasen et al. (2003).
2 See, for example, Ng and Yeats (2003), Kimura and Ando (2005a; 2005b), Ando (2006), and
Athukorala and Yamashita (2006) for studies that document evidence on increased production
networks between countries in East Asia.
3 The surveys were conducted as a part of ERIA research on SMEs in 2009.

2
The rest of this paper is organised as follows. Section 2 discusses pertinent
literature to provide a framework for our analysis and to establish some testable
hypotheses. Section 3 presents the methodology for the empirical exercise, including
a brief description of the survey from which the data for this study was drawn.
Section 4 and 5 presents the results of the empirical exercises and Section 6
summarises the key findings and presents the key conclusions from these findings.
2. Analytical Framework and Testable Hypotheses
The trade pattern in East Asia has changed from the traditional pattern where final
products, such as consumer goods, intermediate goods, and capital goods, were
predominant in trade, to one where predominance is now given to parts and
components (Lim and Kimura, 2009; Athukorala and Kohpaiboon, 2009).
Intermediate goods trade amongst Asian countries has expanded intra-industry and
intra regional trade.
Trade patterns have now become quite different from the traditional pattern based
on static comparative advantage. Production processes now involve sequential
production blocks that locate across countries. Different stages of production are
located in different countries and undertaken by different firms, consequently products
traded between different firms in different countries are components instead of final
products. While networks can be formed in various industries the most important ones
in East Asia are those in the machinery industries, including general machinery,

3
electric machinery, transport equipment and precision machinery (HS 84-92) (Kimura,
2009).
This phenomenon is known as cross border production sharing or fragmentation of
production. The literature on fragmentation theory and its empirical verification
expanded rapidly after the seminal contribution of Jones and Kierzkowski (1990)4,
proving its applicability in analysing cross border production sharing at the production
process level (Kimura and Ando, 2005a). Looking from an East Asian perspective,
however, production/ distribution networks have become quite distinctive and the
most developed in the world (Kimura and Ando, 2005b) as measured by their
significance for each economy in the region, their extensiveness in terms of country
coverage, and their sophistication which can involve subtle combinations of intra-firm
and arm’s length (inter-firm) transactions. Consequently, these networks have
developed beyond the original idea of fragmentation, requiring a re-appraisal and
expansion of the original analytical framework in order to capture more subtle and
sophisticated intra-firm and arm’s length (inter-firm) transactions. In this context
Kimura and Ando (2005a) propose the concept of two dimensional fragmentations to
analyse the mechanics of production/ distribution networks in East Asia5.
Fragmentation theory focuses on the location of production processes, where
processes are fragmented or separated into multiple slices and located in different
countries to lower total production costs of firms. The fragmentation occurs for the
following reasons. First, there must be production cost saving in fragmented
production blocks where firms can take advantage of differences in location
4 See also Arndt and Kierzkowski (2001), Deardorff (2001) and Cheng and Kierzkowski (2001)
for further elaboration of the fragmentation theory.
5 See Kimura and Ando (2005a), especially pages 7-13.

4
advantages between the original position and a new position. Second, the service link
costs involved in connecting remotely located production blocks must be low. Finally,
the cost of setting up the network must be small. The feasibility of fragmented
production/distribution (location and by firm) in an industry is heavily influenced by:
the number of parts and components required in the production of the final product,
the greater the variety of technologies utilized in the production of these parts and
components, and the economic environment within individual countries and for the
region as a whole.
Kimura and Ando (2005a) organise and categorise various type of fragmentation
activities into two groups: fragmentation based on distance and fragmentation based
on firm disintegration. There are advantages and disadvantages arising from both
these forms of fragmentation. Table 1 shows that fragmentation by distance,
involving intra and/or inter firm fragmentation (both domestic and cross border), is
likely to increase service link costs (greater transportation, telecommunications,
logistics, distribution, coordination and cross border) but have the potential to reduce
production costs from location advantage (wages, access to resources, lower utility
costs, access to technological capability). Fragmentation by firm disintegration,
involving intra and/or inter firm fragmentation (both domestic and cross border), is
likely to increase service link costs (related to loss of control and lack of trust) which
include additional information costs in seeking a suitable partner, monitoring cost,
contract costs, dispute settlement costs, legal costs, legal and institutional system
deficiencies. However, this is potentially offset by reduced production costs due to the
increased availability of business partners, both domestic and foreign, the development
of supportive industry, institutional capacity for various types of contracts and the

5
degree of complete information. It is, therefore, apparent that reductions in service
link and production costs can trigger a further rapid expansion in product
fragmentation.
Table 1. Trade-offs in Two Dimensional Fragmentation
Service link cost connecting
production blocks
Production cost in production
blocks
Fragmentation by
distance (intra and inter
firm, domestic and
foreign)
Cost will increase with
geographical distance:
Transportation,
telecommunications,
logistics and distribution
(inefficiency)
Trade impediments
Coordination cost
Cost reduction from location
advantage:
Wage costs
Access to resources
Infrastructure service inputs
(utilities, industrial estates)
Technology capability
Fragmentation by firm
disintegration
Increased transaction costs from
loss of control/trust:
Information cost from
seeking suitable business
partner.
Monitoring cost
Contract costs
Dispute settlement cost
Legal system and
institutional system
deficiencies
Cost reductions from
disintegration:
Availability of various types
of potential business partners
including foreign and
indigenous firms
Development of supporting
industry
Institutional capacity for
various types of contracts
Degree of complete
information
Source: Kimura and Ando (2005a).
As production/distribution networks and their sophistication expand, SMEs have
the opportunity to play a crucial role both as indigenous and foreign based firms in the
network on an arm’s length basis in various forms, including subcontracting
arrangements and OEM contracts. SMEs are also essential components of industrial
agglomeration. In this context, not only multi-national SMEs but also local SMEs can
be important participants in a vertical arm’s length division of labour.

6
SMEs need to overcome barriers related to their size and to develop capacities
enabling them to become more intrinsically engaged and competitive in global
markets, in order for them to fully participate in regional production networks. Their
capacity constraints, or barriers, are multi-dimensional in nature and can be usefully
highlighted and explored in the context of the integrative analytical framework
summarized in Figure 1. We adapt this framework with application to the case of
SME participation in production networks.

7
Figure 1. SMEs and Production Networks – Framework Outline
Context SME barriers/capabilities Business strategy Outcome
i) Internal factors
SME sector
1. Resource factors: skill and resources
Market access
Technology
Skilled labour
Finance/resources
Market information
Network embeddedness
Knowledge and innovation
ii). External factors
Government policy
Domestic market conditions
Overseas market conditions
Business Strategy
Production
network(s)
strategy.
Innovation
strategy.
Information
technology
strategy.
Niche strategy
Network
strategy.
Cluster strategy.
Foreign direct
investment
strategy.
Participation in a
production network(s)
Firm characteristics
(general)
High quality (tier 1
and tier 2
characteristics)
Low quality (tier 3 and
tier 4 characteristics)
Moving from low to
high quality
production network
Non participation in a
production network
Firm characteristics
Participation in a
production network -
lessons
2. Psychological factors: attitudes and
perceptions, based on entrepreneur/
manager characteristics (age, education/
training, work experience gender, travel,
languages)
Risk
Perceived benefits
Trust
Self esteem
Self efficacy
Receptivity to new ideas
Desire/commitment/
motivation
Business culture

8
The framework emphasizes the importance of factors bearing upon the capability
and capacity of an SME, and its ability to overcome barriers arising from its small
size. These factors can be usefully classified into the two broad headings of internal
and external factors. The internal factors can be further usefully broken down into two
sub factors. The first is directly related to the small size and limited resources of
SMEs. These resource factors relate to access to: markets, technology, skilled labour,
finance, market information, network embeddedness and knowledge and innovation.
The second internal factor relates to psychological factors, based on the characteristics
of the entrepreneur, that determines the attitudes and perceptions of the SME towards
risk, the benefits of participating in a production network, trust, self-esteem, self-
efficacy, receptivity to new ideas, desire, commitment and motivation towards
achieving outcomes from participation in a production networks etc. as well as the
overall business culture of the SME. In addition to these internal factors, we must also
consider external environment factors (government policy, domestic market conditions
and overseas market conditions). These combine to determine the business strategy
adopted by the SME, which include: a production network strategy, a niche strategy,
an innovation strategy, an information technology strategy, a network strategy, a
cluster strategy, and foreign investment strategy. It is the former which is of particular
concern in the context of this study. However, these strategies are unlikely to be
mutually exclusive. SMEs can adopt a niche strategy aimed at producing high quality
products that could facilitate high value adding participation in a production network.
Similarly, adoption of an innovation, network or cluster strategy could increase the
competitiveness of an SME and facilitate its participation in a production network etc.
The framework provides the basis for the empirical analysis, hypotheses testing and

9
profiling aimed at highlighting the key characteristics of SMEs that participate in
production networks.
2.1. Hypotheses Relating to Firm Characteristics of SME Participation in
Production Networks
a. Size6
Larger SMEs have a higher likelihood of participating and performing better in
production networks. Traditionally, the importance of size is related to scale
economies in production. If economies of scale in production exist, large firms may
outperform small ones in a low demand situation by setting lower prices.7 Access to
resources is likely to be stronger for larger firms. In general, it is reasonable to argue
that larger firms have greater access to resources, including those deemed important
for SME growth. Consider, for example, access to finance. Larger firms tend to be
better connected to banks or other formal sources of finance. Supporting this,
Claessens et al. (2000) found that bank-dependent firms in Asian countries are mostly
large firms.
6 This study addresses small and medium firms, and therefore it does not seem logical to consider
size as a determinant of SME participation and performance in production networks. However,
and as indicated in our sample and other studies, there is still large variation in size across even the
very narrowly-defined small and medium firms. Hence, it turns out that size could still be an
important determinant.
7 While theoretically sound this argument sometimes is not fully backed up by evidence. The
literature suggests mixed findings on a positive relationship between firm size and performance.

10
b. Age
It seems reasonable to hypothesize that a positive relationship exists between firm
age and SME performance, as well as participation in production networks. First,
older firms have accumulated more experience than younger firms. Theoretical
explanations can be derived from Jovanovic (1982) who postulates that, over time,
firms learn and improve their efficiency. Experience and knowledge essentially come
from many sources, but, in the context of this study, the most likely source is from
participation in a network of firms. These networks are particularly important because
they facilitate peer-based learning and allow SMEs to reconfigure relations with
suppliers. Firm age is also important because credit rationing can be expected to more
adversely affect younger firms. Central to this proposition is the idea that the risk
associated with any loan varies with the duration of the relationship between the firm
and financial institutions (Diamond, 1991).
Having mentioned the arguments above, however, a negative relationship
involving firm age might also be observed. This is because adjustment generally is
more difficult to be achieved in older firms. Therefore, one could predict that it is
much easier for younger SMEs to join a production network, compared to older ones.
c. Foreign Ownership
Foreign ownership is hypothesized to be positively related to an SME’s
performance and its participation in production networks. Forming a joint venture
arrangement with foreign firms is clearly a favorable strategy for any SME wishing to
engage and perform well in production networks. Doing so allows SMEs to exploit
firm-specific assets owned by the foreign partners, and hence improve the

11
competitiveness of the SMEs in global markets. In practice, the advantage of this
mechanism usually comes from technology transfers and sometimes from financial
support.8 The significance of foreign ownership, however, may depend on the share of
the ownership. Foreign parent companies may restrict the transfer of the firm-specific
assets if they do not hold a significant controlling interest over domestic firms.
d. Productivity
Firm-level productivity is hypothesized to improve both the chance of SME
participation and performance in production networks. This draws from the findings
of research on firm exporting that finds exporters are more productive than non-
exporters.9 This is often termed the ‘selection hypothesis’, which argues that only the
most productive firms are able to survive in highly competitive export markets. This
hypothesis is based on the presumption that there are additional costs involved in
participating in export markets (Bernard and Jensen, 1999). Even when a firm has
managed to grow from non-exporter to become an exporter, productivity still matters
for the exporter’s overall performance. This comes from a learning effect as a result
of participating in export markets.10
8 In a more general firm performance context, Desai et al. (2004) and Blalock and Gertler (2005),
for example, argue and show that domestic firms with some foreign ownership were able to better
overcome financial difficulties during the 1997 Asian financial crisis. 9 Bernard et al. (1995) and Bernard and Jensen (1999), for example, documented this for US
manufacturing firms, while Aw and Hwang (1995) and Sjoholm and Takii (2003) document the
same fact for Taiwanese and Indonesian manufacturing, respectively.
10 One example is that exporters are often argued to be able to gain access to technical expertise,
including product design and methods, from their foreign buyers (Aw et al., 2000, p.67).

12
The logic coming from the exporting literature can be applied in the context of
SME participation in production networks, and hence it justifies our hypotheses.
SMEs tend to suffer from many competitiveness issues, compared to larger firms, and
the fact that most end products produced by networks of production are exported final
goods, it is sensible to argue that SMEs wanting to participate in production networks
need to mimic the characteristics of exporters in general. In the context of SMEs and
production networks, this may be reflected in the ability of SMEs to meet the strict
requirements of the higher – and larger – firms in networks of production. The
reasoning above also justifies our hypothesis that productivity is not only expected to
improve the likelihood that SMEs will participate in production networks, but also to
improve the SMEs’ performance once they are already in the networks, and/or
exporting at the same time.
e. Financial Characteristics: Access to Finance and Financial Leverage
SMEs with better access to finance are hypothesized to have a higher probability
of engaging and performing well in production networks. The potential for credit
rationing – defined as the degree to which credit or loans are rationed, as a result of
imperfections in the capital market (Stiglitz and Weiss, 1981) – is thought to be higher
for smaller firms. Petersen and Rajan (1994) argue that the amount of information that
banks can acquire is usually much less in the case of small firms, because banks have
little information about these firms’ managerial capabilities and investment
opportunities. The extent of credit rationing to small firms may also occur simply
because they are not usually well collateralized (Gertler and Gilchrist, 1994).
13
The ability of a firm to get a loan depends on how well the firm is able to service
the debt. This, in turn, depends on the net worth of the firm, such as the value of cash
inflow and the liquid assets that the firm is able to generate. Lower net worth implies
lower ability to service debt and hence it reduces the chance of a firm getting a loan or
a higher amount of credit. Banks, or any other lending institutions, are likely to attach
a high-risk premium to a firm with a low net worth position.
SMEs that participate in production networks have the probability of better cash
flows than those that do not. SMEs in production networks have more certainty in
terms of their production, since most of the time they operate based on larger, stable,
and more certain buying orders from other firms in the networks. More formal and
modern managerial practice by firms operating in production networks, in addition to
the likelihood of more interactions with banks, also helps SMEs that operate in
production networks to gain more ‘trust’ from banks or other formal financial
institutions. All these suggest that highly leveraged SMEs are expected to have lower
probabilities of engaging and performing well in production networks.11
f. Innovation Efforts
SMEs that have made significant efforts to innovate are expected to have higher
probabilities of engaging and performing well in production networks. Drawing from
innovation literature, this study considers some innovation efforts falling under
11
See Bernanke (1993) for a review of the literature and discussion about the ‘balance-sheet
channel’ as well as other relevant topics.
14
process and product innovation.12
Process-innovation efforts include those that
improve the quality of output or reduce the costs of production and distribution.
Emphasis is given to efforts that improve various aspects of the business strategies
necessitated by firms who want to participate and grow in production networks.
Meanwhile, Product-innovation efforts include those that improve a firm’s production
capability. The efforts should be able to significantly improve the products (goods or
services) with respect to their characteristics or intended uses (e.g. technical
specifications, components and materials, etc.). SMEs are usually located in the lower
tiers of production networks; hence an improved or better production capability is
critical, because the high-tiers firm demands set out strict requirements for the goods
supplied by SMEs.
g. Location
As in the fragmentation model of Kimura and Ando (2005a), ‘distance’ creates
service-link costs which arise because of the geographical distance between
production blocks. In other words, some cost-saving can actually be generated from
where firms are located. These advantages include not only the traditional economic
factors, such as wage-level and resource availability, but also the existence and quality
of infrastructure and infrastructure services, and the policies of the host-country’s
governments.13
SMEs located near production blocks or ports are offered these cost
12
The categorization of process and product innovation is commonly adopted in empirical studies
on innovation, following the recommendation of Oslo Manual on the approach to measure the
extent of innovation (see OECD and Eurostat (2005) for the latest edition of the Oslo Manual).
13 These policies include a favourable investment climate, a liberal trade policy, a flexible labour
policy, etc. (Kimura and Ando, 2005a).

15
savings. Some saving of service-link costs can be generated by geographical distance.
This study, therefore, hypothesizes that SMEs located near industrial parks or export
processing zones (EPZs), as well as located near ports, will have higher likelihoods of
participating and performing well in production networks. Industrial parks or EPZs
are frequently chosen for the establishment of production blocks.
h. Entrepreneurial and Managerial Attitudes
This study considers these attitudes as potential determinants of SME participation
and performance in production networks. Specifically, it hypothesizes that willingness
to take risks or to use new business ideas will improve the probability of an SME
participating and performing well in production networks. A positive attitude towards
risks and new business ideas is clearly necessary for SME managers, given the tight
competition for operation in production networks. As explained, SMEs operating in
production networks tend to face a constant and high survival threat, owing to the
nature of their involvement in production networks that usually entails entering into
contracts with larger firms in the networks.
3. Methodology
3.1. Questionnaire and Sample
Empirical work documented in this paper is based on the results of a questionnaire
survey conducted during three months at the end of 2009. The questionnaire aimed at
collecting information on SME characteristics, and the perceptions of their managers

16
of the factors that constrain SME growth. The questionnaire is divided into two parts,
each of which addresses each of the survey’s objectives. The first part tries to collect
information on the characteristics of the SME, focusing on collecting information on
the following characteristics: basic characteristics (i.e., size, age), ownership, cost and
input structure, performance (i.e., sales, sales growth, profit rate, etc.), location in
terms of distance to ports or industrial parks/economic processing zones (EPZs),
sources of finance, and capability to innovate. The second part addresses the
manager’s perception of barriers to growth. The second part of the questionnaire
follows OECD (2008). All SMEs in the sample were asked to assess the importance
of 44 barriers using a five-point Likert scale (“(1) very significant” to “(5) not
significant”) and they were also asked to rank their constraints by 8 main categories,
ranging from “very important” (1) to “less important” (8).
Firm size is defined in terms of employment and large firms are defined as those
with employment of more than 200. In other words the sample contains observations
of firms with a maximum employment of 200. There are 780 surveyed firms that fall
into this definition. Table 2 summarizes the key characteristics of the surveyed SMEs.
SMEs with persons employed between 6 to 49 accounted for 52% of the total,
followed by 18.3%, 18%, and 11.3% for the employment groups of 100 to 199, 50 to
99, and 1 to 5, respectively. The average age of the SMEs was more than 10 years.
More than 70% of the SMEs in the survey were domestically owned.

17
Table 2. Characteristics of the Surveyed SMEs
Characteristics 1 – 5 Persons 6 – 49 Persons 50 – 99 Persons 100 – 199 Persons
N Mean S.D N Mean S.D N Mean S.D N Mean S.D
Age (year) 87 13.6 10.5 384 11.3 9.9 128 13.8 11.0 126 15.6 10.4
Ownership (%)
Domestic 89 96.0 18.9 413 93.3 23.1 141 83.8 34.5 144 74.2 40.4
Foreign 89 4.0 18.9 413 6.2 22.6 141 14.5 33.5 144 22.4 39.6
Sale growth (%)
2007 80 13.5 52.7 364 16.7 26.1 116 18.3 61.4 125 45.2 281.5
2008 81 6.4 23.4 365 32.5 206.6 117 28.6 100.9 127 16.1 29.2
Profit (%)
2007 83 18.3 11.0 382 13.9 14.2 123 8.3 17.5 129 7.1 16.4
2008 84 18.5 15.2 398 11.7 27.3 135 6.2 27.2 141 8.8 17.9
Cost Structure 2008 (%)
Labor 84 19.0 13.6 384 21.2 15.1 113 21.5 16.9 120 20.7 13.3
Raw Materials 84 48.0 17.6 392 53.2 19.8 129 58.4 21.7 137 57.7 20.6
Utilities 85 12.9 11.5 387 12.5 12.8 118 13.4 17.2 122 12.0 15.9
Interest 56 3.6 6.2 237 3.7 5.9 78 3.7 5.0 102 4.4 6.3
Other costs 76 9.4 8.7 348 10.8 10.8 99 12.0 15.8 106 12.0 15.4
Employees by Education (%)
Tertiary 89 6.6 20.2 413 15.6 24.1 141 28.0 25.9 144 24.3 25.4
Vocational 89 14.5 30.5 413 23.8 29.5 141 18.9 18.6 144 21.3 21.7
High school or less 89 76.9 38.2 413 59.6 37.2 141 50.7 34.2 144 52.3 34.4
Source of Working Capital (%)
Retained Earning 89 72.7 36.2 413 59.8 38.0 141 53.3 42.3 144 48.5 38.3
Bank 89 8.4 18.4 413 10.2 21.2 141 12.8 23.3 144 18.3 26.3
Other Financial Institutions 89 0.6 3.4 413 1.4 8.0 141 1.6 7.9 144 2.7 9.5
Others 89 18.4 33.2 413 25.6 34.0 141 24.4 36.5 144 27.1 37.9
Average Cost of Borrowing (%) 54 5.4 9.0 192 8.6 9.0 76 7.7 4.4 87 8.2 4.7
Sale Destination (%)
Domestic 88 96.9 16.5 382 93.1 22.3 114 75.9 32.3 117 60.2 39.7
Export 2 90.0 14.1 49 56.2 36.2 55 54.3 29.7 82 60.5 34.9
Source: ERIA – SMEs Survey 2009.
Some adjustments have been made to prepare the data for this study. In most
cases, this involved adjustments to make the data consistent and comparable across the
surveyed countries. Adjustments were made for some obvious errors in the data entry

18
process. This is typical for a firm-level survey, where there is always incomplete or
missing information. This study, however, did not attempt to replace the missing
information with a predicted value. This approach is taken to minimize potential
errors from the prediction values, given that sometimes there is no certainty of whether
or not the existing information from the survey is sufficient to produce reliable
predictions. The adjustments made, and the missing information, reduce quite
significantly the number of observations for econometric analysis, from about 700 to
350 small and medium sized firms.
3.2. Statistical Method
The determinants of SME participation in production networks are examined by
way of statistical regression. The statistical model in its general form is given as
follows:
0i i iPN X (1)
where (1) is the equation for participation in production networks. i represent firm i
and iX is a set of explanatory variables that capture firm characteristic determinants.
Industry and country-group dummy variables are included for differences across
industries and countries. The industry dummy variables identify whether firms are in
the following sectors: garments, auto parts and components, electronics –including
electronics parts and components, or other sectors. Meanwhile, country-group dummy
variables identify whether a firm operates in the group of developed ASEAN countries
(i.e., Thailand, Malaysia, Indonesia, and Philippines) or the group of new ASEAN
member countries (i.e., Cambodia, Lao PDR, and Vietnam).

19
The dependent variable, is a binary variable and identifies whether or not a firm
participates in a production network. A participating firm is defined if it meets the
following requirements: first, it supplies to any tier in a production network as defined
by Abonyi (2005), and, second, it either imports intermediate inputs or exports some
of its products.14
Equation (1) is estimated within the framework of binary choice models (i.e.,
probit or logit model), instead of a linear probability model (LPM). This is mainly
because the predicted probability derived from an LPM may lie outside the 0-1 region,
which is clearly not reasonable in practice. Despite this, a binary response model also
has a number of shortcomings. One important shortcoming is that the potential for
bias arising from neglected heterogeneity (i.e. omitted variables) is larger in a binary
choice model than in a linear model. Nevertheless, Wooldridge (2002) points out that
estimating a binary response model by a binary choice model still gives reliable
estimates, particularly if the estimation purpose is to obtain the direction of the effect
of the explanatory variables.
3.3. Measurement of Variables
The following variables are employed to account for the hypothesized firm
characteristics. Firm size is proxied by the number of employees. The other common
alternatives, such as output or profits, are not used as they tend to be more sensitive to
changes in the business cycle or macroeconomic variables. The head-count measure is
chosen because the number of hours worked, which is the ideal measure of
14
See Figure 2 for a description of the tiers and the location of SMEs in a production network.

20
employment, is not available. Meanwhile, the age of the firm is proxied by the
number of years the plant has been in commercial production.
Foreign ownership is proxied by the percentage share of foreign ownership. This
study does not consider the discrete measure of foreign ownership (i.e., a dummy
variable that identifies whether a firm has a foreign ownership share) because, as
suggested by the literature, the behavior of foreign business partners in sharing their
firm-specific assets depends on the extent of ownership of the foreign investors in a
joint venture firm.
This study employs output per unit of labour as a proxy for labour productivity.
Output is proxied by the sales revenue of firms. The more traditional approach of
using value- added as the numerator is not adopted because value-added information is
not available. However, the use of output is acceptable, and in fact more appropriate,
because output is measured at the firm level.
The loan interest rate is measured by the interest rate on the loans that SMEs in the
sample were able to obtain. This tends to be firm-specific since it reflects the risk
premium value assessed by the banks or other lending institutions that advance loans
to the SMEs.
This study employs the interest coverage ratio, or ICR, to measure a firm’s
financial leverage situation. It is defined as
i
i
(EBIT)(Interest coverage ratio)
(interest payments)i
where EBIT is equal to sales (or earnings) before deduction of interest payments and
income taxes.

21
ICR measures the number of times a firm’s earnings exceeds its debt payments.
In other words, it indicates how well a firm’s earnings can cover interest payments. In
general, a low ICR implies a firm is highly leveraged and has low capacity to take on
additional debt (i.e. is more financially constrained).
It is worth mentioning that ICR is very approximate. This is because the ratio
tends to understate the true extent of a firm’s financial leverage. It focuses only on
servicing the interest liability and does not take into account debt repayment. Usually,
repayment of debt principal is higher than the interest payment, and therefore drains a
larger amount of cash than the interest payment. In addition, the ratio does not take
into account other mandatory and discretionary items, such as dividends and capital
commitments, which are not included in the earnings figure.
Distance to industrial parks or EPZs and distance to ports are employed to
measure the location characteristic. As the questionnaire asks, the distance variables
are measured in terms of physical distance (i.e., kilometers) and time (i.e. hours). This
study experiments with these two types of unit measurements in its empirical analysis.
As has been commonly applied in other empirical works, this study employs a
skill intensity variable to proxy the human capital resources of firms. It is defined as
the ratio of employees with tertiary or vocational education to the total number of
employees,
(total number of employees with tertiary or vocational education status)(Skill intensity)
(total number of employees)
ii
i
To measure the extent of a firm’s process-innovation efforts, four dummy variables
are created to identify whether a firm: (1) meets international quality standards, (2) has
introduced ICT, (3) has established new divisions or plants, and (4) is involved in

22
business networking activities (e.g. business association membership, cooperation
with other firms, R&D networks, etc.).
To measure the extent of a firm’s product-innovation efforts, four dummy
variables are created to identify whether a firm: (1) has bought new machines, (2) has
improved its existing machinery, (3) has introduced new know-how or knowledge into
its production, and (4) has introduced new products or services onto the market.
The value of each of these variables is equal to unity if a firm has conducted effort
attached to each of these variables in the previous three months from the survey, or
zero otherwise.
Two dummy variables are created to measure firm managerial and entrepreneurial
attitudes. The first dummy variable is created to identify perceptions about taking
business risks. It takes the value of unity if managers/owners have a positive attitude
towards taking business risks or zero otherwise. The second dummy variable is
created to identify willingness of the managers/owners to adopt a new business
strategy. The variable takes the value of unity if there is a positive attitude towards
adopting a new business strategy or zero otherwise.
4. Results and Analyses
It is useful to show some descriptive analysis before presenting and discussing the
econometric results. To do so we compare the ‘average’ value of SME characteristics
between SMEs that participate and do not participate in production networks. Table 3
shows the mean values of some characteristics for these two groups. The table also

23
compares the mean values and determines whether or not they are statistically
different.
Table 3. Average Value of SME Characteristics, between SMEs Participating
and Not-Participating in Production Networks
Characteristic In Production Not in Production Statistically
Networks Networks different
Size (employees) 66.2 52.1 Yes+
Age (years) 10.6 13.8 Yes**
Share of foreign ownership (%) 18.2 7.2 Yes**
Labor productivity (sales/employee, thousand USD) 26.8 23.0 No2
Loan interest rate (%) 6.1 8.9 Yes**
Interest Coverage Ratio, ICR4 250.0 77.5 Yes*
Credit interest rate (%) 6.2 8.9 Yes**
Distance to industrial parks or EPZs (hours) 1.0 0.9 No3
Distance to port (hours) 1.3 1.2 No3
Skill intensity5 0.4 0.3 Yes**
Notes:
1. + Significant at 10%; * significant at 5%; ** significant at 1%.
2. Significant at 65% confidence level.
3. Significant at 60% confidence level.
4. ICR is defined as the ration of sales to payment for interest.
5. Skill intensity is defined as the proportion of skilled labor (i.e., employees with tertiary and
vocational education level) in a firm total employment.
Source: ERIA Survey on SME Participation in Production Networks.
Results in Table 3 indicate that SMEs participating in production networks are
significantly different from those that do not participate. As shown, participating

24
SMEs in the sample are larger, younger, and have more foreign ownership than non-
participating SMEs. All these characteristics are statistically different. In terms of
foreign ownership the difference is quite substantial; that is, the share of foreign
ownership in SMEs in the participating group, on average, is about two times greater
than that of SMEs in the non-participating group.
It is important to mention that although larger, the average foreign ownership
share in the participating group is below 51%. This means that, on average,
foreigners/parent companies or foreign partners are not likely be the dominant owner.
The implication of this is that SMEs may not have a strong information spillover from
their foreign partners. Nonetheless, the higher foreign ownership share in the
participating group indicates that, somehow, SMEs still benefit from their foreign
partners by their participation in production networks.
The descriptive results, surprisingly, do not show much difference in SME
productivity levels between the two groups. This is rather puzzling given that one
would expect that productivity should be one of the most important firm-characteristic
determinants. The final inference on the importance of productivity, however, needs
to be confirmed by the econometric analysis.
Results in Table 3 suggest that SMEs in production networks are less financially
constrained. The ICR is significantly larger for these SMEs. The difference in the
mean ICR for these two groups is also statistically significant. The larger ICR
suggests that SMEs in production networks are more able to service their loans than
SMEs that are not part of a production network. The results further suggest that SMEs
in production networks are better connected to the financial sector. This is indicated
by the realized interest rate on the loans, which, on average, is lower for SMEs in this

25
group, compared to the average interest rate for SMEs not in production networks.
The difference in the interest rate is statistically significant. Moreover, the difference
is suggested to be quite large. Of the SMEs in the sample, on average, those in the
participating group managed to get three percentage point lower interest rates
compared to those in the non-participating group.
Differences in average firm financial characteristics give some support to the
argument that SMEs in production networks have better cash flows, due to large,
stable and more certain purchase orders from other firms in the production network.
Moreover, it also supports the idea that SMEs in production networks are able to
convey more information to their banks, which reduces the extent of asymmetric
information. This improves the trust of banks, or other financial institutions, in these
SMEs, which then reduces the risk premiums assigned to the SMEs.
The results in Table 3 do not seem to support the importance of location in
determining SME participation in production networks. There is not much difference
in the distance to industrial parks or EPZs, and to ports when measured in terms of
time (i.e., in terms of journey time). This study experimented with distance in terms
of geographical distance (i.e., in terms of kilometers) but the same results were
achieved.
Tables 4 and 5 present attempts to show the ‘average’ characteristics of process-
and product-innovation efforts and managerial/entrepreneurial attitudes. These
characteristics are represented by dummy variables, and therefore the tables present
the frequencies for SMEs with a unity value for the dummy variables. The
frequencies are produced for two groups, that is for SMEs that participate in
production networks and for SMEs that do not participate in production networks.

26
Table 4. Innovation Effort Characteristics, Frequency (in %) of SMEs
Participating and Not Participating in Production Networks
Characteristic In Production Not in Production Statistically
Networks Networks different
Met international standards (e.g. ISO, etc.) 44.4 36.5 Yes*
Introduced information and communication technology 35.5 36,0 No2
Established new divisions or plants 27.0 18.8 Yes*
Involved in business network activities 52.6 47.1 No3
Bought new machinery with new functionality 58.4 47.9 Yes**
Improving the existing machinery 72.5 59.1 Yes**
Introduced new know-how in production method 49.6 40.7 Yes*
Recently introduced new products 63.4 55.1 Yes*
Notes:
1. + significant at 10%; * significant at 5%; ** significant at 1%
2. Significant at 10% confidence level.
3. Significant at 84% confidence level.
Source: ERIA Survey on SME Participation in production networks.
Table 4 indicates that SMEs in production networks have superior characteristics
in terms of their process innovation efforts. It shows that the number of SMEs
carrying out a wide range of process innovation over the last three months is mostly
larger for this group. The table suggests that SMEs in and not in production networks
are not different in terms of introducing ICT nor being involved in business network
activities, such as business associations, R&D networks, etc. However, SMEs in these

27
two groups are quite different in terms of their efforts to meet international standards,
or to establish new divisions/plants.
SMEs that operate in production networks seem to make stronger product-
innovation efforts. Table 4 shows that SMEs in this group adopted new production
methods, bought more new machinery, and upgraded their existing machinery over the
three months prior to the survey. Over this period these SMEs also introduced new
production know-how and knowledge to a greater extent than those not participating in
production networks.
Table 5 suggests that SMEs participating in production networks are different
from those not in networks, in terms of managerial/entrepreneurial characteristics.
There is a larger number of SMEs that acknowledge the risks of doing business in the
participating group. In other words, more SMEs in the participating group have
positive attitudes towards business risks, compared to those in the non-participating
group. The table also shows that there is a larger number of SMEs willing to adopt a
new business strategy in the production network participating group compared to those
in the non-participating group.
Table 5. Managerial/Entrepreneurial Characteristics: Frequency (in %) of
SMEs Participating and Not Participating in Production Networks
Characteristic In Production Not in Production Statistically
Networks Networks different
Considering risk in business operation 52.7 30.7 Yes**
Willingness to adopt new business strategy 42.3 26.6 Yes**
Notes: + significant at 10%; *significant at 5%; ** significant at 1%.
Source: ERIA Survey on SME Participation in Production Networks.

28
Table 6 reports the results of a maximum likelihood estimation of Equation (1) for
the subset of the sample that consists of all firms/SMEs with a maximum size of 200
employees. The table reports the final specifications that give the best results, while
the other specifications estimated during the experimental stage are not reported here.
The Wald test of overall significance in all specifications passes at the 1 % level. The
table reports robust standard errors for the reason of heteroscedastic variance.
29
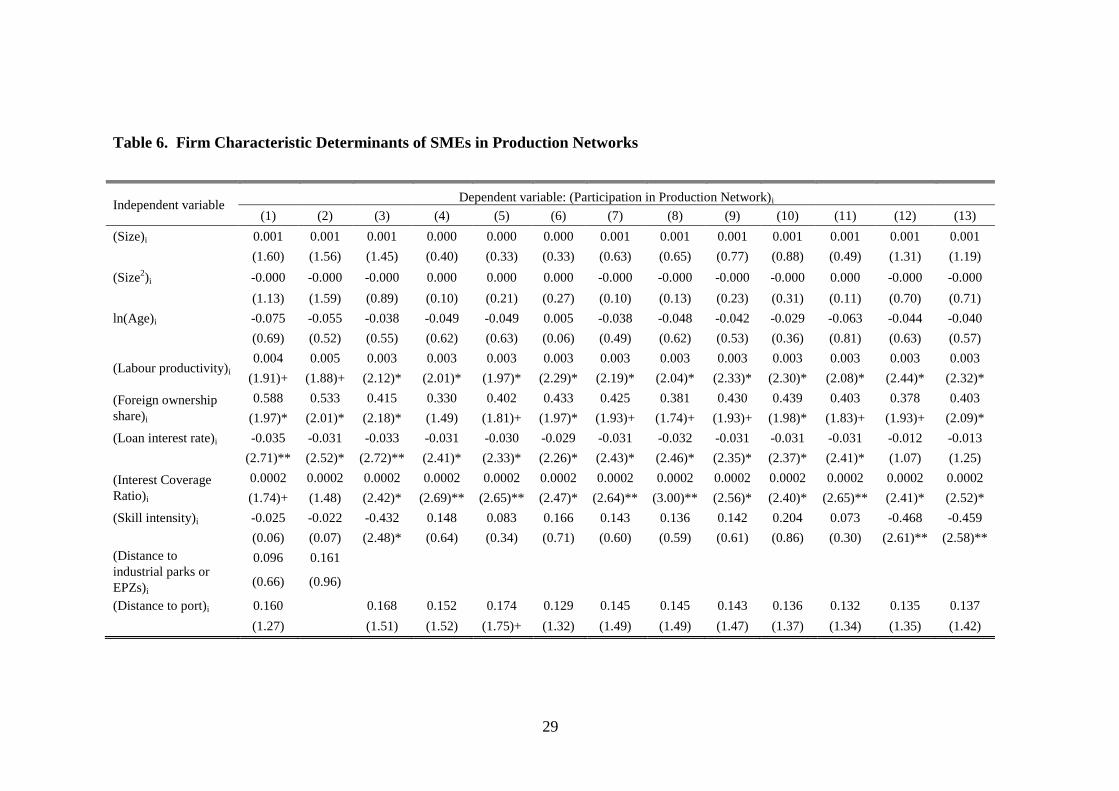
Table 6. Firm Characteristic Determinants of SMEs in Production Networks
Independent variable Dependent variable: (Participation in Production Network)i
(1) (2) (3) (4) (5) (6) (7) (8) (9) (10) (11) (12) (13)
(Size)i 0.001 0.001 0.001 0.000 0.000 0.000 0.001 0.001 0.001 0.001 0.001 0.001 0.001
(1.60) (1.56) (1.45) (0.40) (0.33) (0.33) (0.63) (0.65) (0.77) (0.88) (0.49) (1.31) (1.19)
(Size2)i -0.000 -0.000 -0.000 0.000 0.000 0.000 -0.000 -0.000 -0.000 -0.000 0.000 -0.000 -0.000
(1.13) (1.59) (0.89) (0.10) (0.21) (0.27) (0.10) (0.13) (0.23) (0.31) (0.11) (0.70) (0.71)
ln(Age)i -0.075 -0.055 -0.038 -0.049 -0.049 0.005 -0.038 -0.048 -0.042 -0.029 -0.063 -0.044 -0.040
(0.69) (0.52) (0.55) (0.62) (0.63) (0.06) (0.49) (0.62) (0.53) (0.36) (0.81) (0.63) (0.57)
(Labour productivity)i 0.004 0.005 0.003 0.003 0.003 0.003 0.003 0.003 0.003 0.003 0.003 0.003 0.003
(1.91)+ (1.88)+ (2.12)* (2.01)* (1.97)* (2.29)* (2.19)* (2.04)* (2.33)* (2.30)* (2.08)* (2.44)* (2.32)*
(Foreign ownership
share)i
0.588 0.533 0.415 0.330 0.402 0.433 0.425 0.381 0.430 0.439 0.403 0.378 0.403
(1.97)* (2.01)* (2.18)* (1.49) (1.81)+ (1.97)* (1.93)+ (1.74)+ (1.93)+ (1.98)* (1.83)+ (1.93)+ (2.09)*
(Loan interest rate)i -0.035 -0.031 -0.033 -0.031 -0.030 -0.029 -0.031 -0.032 -0.031 -0.031 -0.031 -0.012 -0.013
(2.71)** (2.52)* (2.72)** (2.41)* (2.33)* (2.26)* (2.43)* (2.46)* (2.35)* (2.37)* (2.41)* (1.07) (1.25)
(Interest Coverage
Ratio)i
0.0002 0.0002 0.0002 0.0002 0.0002 0.0002 0.0002 0.0002 0.0002 0.0002 0.0002 0.0002 0.0002
(1.74)+ (1.48) (2.42)* (2.69)** (2.65)** (2.47)* (2.64)** (3.00)** (2.56)* (2.40)* (2.65)** (2.41)* (2.52)*
(Skill intensity)i -0.025 -0.022 -0.432 0.148 0.083 0.166 0.143 0.136 0.142 0.204 0.073 -0.468 -0.459
(0.06) (0.07) (2.48)* (0.64) (0.34) (0.71) (0.60) (0.59) (0.61) (0.86) (0.30) (2.61)** (2.58)**
(Distance to
industrial parks or
EPZs)i
0.096 0.161
(0.66) (0.96)
(Distance to port)i 0.160
0.168 0.152 0.174 0.129 0.145 0.145 0.143 0.136 0.132 0.135 0.137
(1.27)
(1.51) (1.52) (1.75)+ (1.32) (1.49) (1.49) (1.47) (1.37) (1.34) (1.35) (1.42)

30
Table 6. Continued
Independent variable Dependent variable: (Participation in Production Network)i
(1) (2) (3) (4) (5) (6) (7) (8) (9) (10) (11) (12) (13)
(Dummy variable for meeting international standard)i 0.298
(2.14)*
(Dummy variable for have introduced ICT)i
0.352
(2.30)*
(Dummy variable for have established new divisions)i 0.603
(3.69)**
(Dummy variable for involving in business networks)i
0.151
(1.11)
(Dummy variable for acquiring new machinery)i 0.256
(2.05)*
(Dummy variable for improving existing machinery)i
0.414
(3.31)**
(Dummy variable for acquiring production knowledge)i 0.417
(3.18)**
(Dummy variable for ability of introducing new products)i
0.312
(2.36)*
(Dummy variable for considering risk in business operation)i 0.361
(3.25)**
(Dummy variable for willingness to adopt new business strategy)i
0.238
(2.06)*

31
Table 6. Concluded
Independent variable Dependent variable: (Participation in Production Network)i
(1) (2) (3) (4) (5) (6) (7) (8) (9) (10) (11) (12) (13)
(Dummy var. for garment sector)i -0.047 0.048 0.042 0.039 0.002 -0.014 -0.004 0.079 -0.015 -0.057 -0.052
(0.33) (0.30) (0.25) (0.24) (0.01) (0.08) (0.02) (0.47) (0.09) (0.40) (0.37)
(Dummy var. for auto parts and
components)i
0.394 0.289 0.378 0.305 0.263 0.232 0.272 0.365 0.208 0.408 0.398
(2.29)* (1.41) (1.81)+ (1.44) (1.26) (1.12) (1.30) (1.71)+ (0.98) (2.35)* (2.31)*
(Dummy var. for electronics, and
electronics parts and component)i
0.259 0.355 0.400 0.394 0.372 0.334 0.352 0.447 0.307 0.264 0.259
(1.55) (1.88)+ (2.12)* (2.08)* (1.98)* (1.81)+ (1.88)+ (2.36)* (1.64) (1.56) (1.54)
(Dummy var. for country group)i 1.163 1.210 1.319 1.273 1.238 1.168 1.148 1.264 1.166 1.092 1.139
(8.27)** (7.77)** (8.32)** (8.02)** (7.93)** (7.47)** (7.34)** (8.01)** (7.45)** (7.65)** (8.09)**
Constant
-1.259 -1.769 -1.862 -2.014 -1.803 -1.781 -2.030 -2.550 -1.689 -1.330 -1.303
(5.21)** (3.13)** (3.29)** (3.69)** (3.10)** (3.20)** (3.45)** (3.84)** (2.98)** (5.50)** (5.42)**
Observations 543 543 713 543 543 542 541 543 543 539 540 713 713
Notes: 1. Robust z statistics in parentheses.
2. **significant at 1%; *significant at 5%; +significant at 10%.
32
Specifications (1) to (3) are the baseline. They consider all variables except the
dummy variables for innovation efforts and managerial/entrepreneurial attitudes.
These specifications are different in the way in which distance variables are included
in the regression. Specification (1) includes both of the distance variables, i.e., the
distance to industrial parks or EPZs, while specifications (2) and (3) enter each of
these variables separately. Specifications (1) and (2) are motivated because of the
potential collinearity of the two distance variables.
The key point coming from these specifications is the evidence that location is not
an important determinant of SME participation in production networks. The estimated
coefficients of the two distance variables are all statistically insignificant across the
specifications. In addition, all of these coefficients are positive, which is not as
hypothesized.
A possible explanation points to the role of infrastructure. If theory and other
empirical studies underline that distance matters because it increases ‘service-link
costs’, good transport infrastructure could reduce the disadvantage of being far from
clusters of firms, such as in industrial parks or EPZs, which usually shelter firms
involved in production networks. This proposition deserves some support. According
to the ‘flowchart approach’ of cluster development (Kuchiki, 2005), good
infrastructure facilities are necessary to attract both so-called ‘anchor firms’ as well as
other firms that support these firms. Firms that support these anchor firms are, in
many cases, SMEs.
Firm productivity determines the participation of SMEs in production networks.
The estimated coefficients of labor productivity are positive and, more importantly,
statistically significant at the 5 % level in most of the specifications. This is one of the

33
robust findings coming from the regressions. This finding supports our hypothesis of
a positive relationship between productivity and SME participation in production
networks. Moreover, it accords with our argument that SMEs who plan to participate
in production networks need to prepare themselves by mimicking the characteristics of
exporting firms in general, and one of the most important characteristics to mimic is
superior productivity – compared to non-exporting firms. As an example, a superior
productivity level for SMEs operating in production networks is clearly needed given
the usually strict specifications for goods produced that are demanded by other firms
in the higher tiers of production networks.
The results suggest that foreign ownership significantly determines the
participation of SMEs in production networks. This accords with our hypothesis on
this characteristic and is consistent with the key observation from the descriptive
statistics presented earlier. Moreover, the magnitude of the foreign ownership effect
in determining participation is large, as indicated by the larger value of the estimated
coefficients across all specifications. Foreign ownership, however, is not as important
as labour productivity in determining SME participation. The statistical significance
of the estimated coefficient is only moderately high, switching either at the 5 or 10 %
significance level across the specifications.
Nonetheless, this finding, together with that from the descriptive analysis,
supports the argument that SMEs are able to exploit firm-specific assets owned by
their foreign partners to improve their competitiveness – something that is really
needed for the SMEs’ successful performance in production networks. The high
impact of the foreign ownership variable, meanwhile, indicates that SMEs are able to
get high marginal benefit from having a greater involvement of foreign investment in

34
their firms. This clearly underlines a strong dependency of how much firm-specific
assets or knowledge can be shared with SMEs based on foreign ownership shares.
SMEs that conduct process-innovation activities more actively are suggested to
have a higher likelihood or opportunity of participating in production networks. The
estimated coefficients of the three – out of four – dummy variables of process-
innovation efforts is positive and statistically significant. These are shown in the
results of specifications (4) to (7). The only process-innovation effort variable that is
not significant is the dummy variable for participating in business networks (e.g.
business associations). This confirms the earlier observation from the descriptive
analysis, which indicates that SMEs participating in production networks are not much
different from those not in the networks in terms of their process innovation activities.
Strong efforts in conducting product innovation significantly determine SME
participation in production networks. The estimated coefficients of all dummy
variables that represent these efforts are positive and statistically significant. These
are shown in the results of specifications (8) to (11). The results suggest that the
efforts of SMEs in more actively conducting product innovation significantly increase
their probability of participation in production networks. Moreover, the impact of the
innovation efforts is quite large, as indicated by the large value of the estimated
coefficients.
The finding on the innovation efforts underlines the importance of having all the
necessary technology and know-how for both getting invited to participate as well as
surviving better in production networks. As previously noted production networks
bring a hostile environment to SMEs, mostly stemming from strict product
requirements that clearly call for the adoption of advanced technology.

35
The results suggest that the attitudes of firms toward risk or the adoption of new
business ideas is an important determinant of SMEs’ participation in production
networks. The estimated coefficients of the two dummy variables that represent this,
i.e., consideration of risk in business operations and a willingness to adopt a new
business strategy are all positive and statistically significant. The magnitude of the
coefficient further suggests the importance of this characteristic. This finding is
consistent with the view that SMEs in production networks operate in a tough business
environment and face a constant and continuous threat to their survival.
The result in relation to the skill intensity variable does not accord with our
prediction. The estimated coefficient changes sign across the specifications. In most
cases the coefficients are usually not statistically significant when they are positive
(i.e., the predicted sign) but they are statistically significant when the sign is not as
predicted. This is rather surprising given the results of the other variables. However,
this may be caused by strong correlation of the skill intensity variable with the other
variables, in particular the dummy variables for innovation efforts. It is natural to
expect that firms with strong innovation efforts will tend to employ more skilled
workers than those with weak technological capability.
The econometric results confirm our earlier observation on the relationship
between, on the one hand, access to finance or financial leverage and, on the other,
SME participation in production networks. We can now more convincingly conclude
that both of these characteristics determine the probability of SME participation in
production networks. In particular, better access to financial institutions increase the
probability of SMEs participating in production networks. As previously noted, the
results indicate that SMEs participating in production networks suffer from the credit-

36
rationing problem, which arises from incomplete information, to a lesser extent than
those operating outside these networks. This is another important characteristic to
bear in mind. Meanwhile, a higher likelihood of participation in a production network
is attached to SMEs that are able to service their debts. This is apparent from the
results for the ICR variable. However, the impact of the financial leverage
characteristic is small, as is indicated by the very small estimated coefficient of this
variable.
5. The Determinants of Higher-quality SME Participation in
Production Networks
An important issue given further emphasis in this study, beyond entry to a
production network, is the quality upgrading of production network participation.
SME participation can be at a variety of levels or tiers in the production process (see
Figure 2). Higher level tiers, defined in this study to be tier 1 and tier 2, are likely to
involve greater skill, technology, knowledge, innovative and value adding and creation
activity, as well as pricing power and brand presence (Abonyi, 2005). Production
network participation at lower tiers, defined to be tier 3 and tier 4, can be reasonably
anticipated to involve lower skill, technology, knowledge, innovative and value adding
activity, and the need to compete on cost. In the case of the latter this could involve
simple assembly activity requiring unskilled labour and standardised low level
technology. Consequently, it is an important issue to consider.

37
Figure 2. Global and Regional Production Networks and SMEs
-------------------------------------------------------------------------------------------------------
1st Tier
Suppliers
-------------------------------------------------------------------------------------------------------
2nd
Tier
Suppliers
-------------------------------------------------------------------------------------------------------
3rd
Tier
Suppliers
-------------------------------------------------------------------------------------------------------
4th
Tier
Suppliers
-------------------------------------------------------------------------------------------------------
LE – Large Enterprise
SME – Small or Medium Sized Enterprise
Source: Abonyi, (2005).
This section extends the previous analysis by gauging firm characteristics that
allow SMEs to move from low to high quality participation in production networks, or
from tier 3 or 4 to tier 1 or 2. This is done by utilizing the ordered logit model
estimation which allows an identification of a firm/SME according to the different
Original product
manufacturer
Supplier (LE) Supplier (SME) Supplier (LE)
Supplier (LE) Supplier (SME) Supplier (LE)
Supplier (SME) Supplier (SME) Supplier (LE)
Supplier (SME) Supplier (SME)

38
quality of its participation in production networks. Thus, the following general form
of a statistical model is estimated:
0i i iQPN X (2)
where iQPN is a discrete choice variable and 1iQPN if an SME operates in Tier 3
or 4 as a low-quality SME and 2iQPN if an SME operates in Tier 1 or 2 as a high-
quality SME. i represents firm i as in the previous section and iX is a set of
explanatory variables that captures firm characteristic determinants. Estimations also
include dummy variables for industries and country groups. Estimations are
conducted only on the sample of SMEs that participate in production networks, which
give observations of about 190 firms/SMEs.
The results of the estimation are presented in Table 7. Larger participating SMEs
have a chance to improve their position in production networks, or to move to higher
tiers. The estimated coefficient for size is positive and very statistically significant at
the 1% level. This finding is in contrast with the role of size in determining SME
participation in production networks (i.e., the econometric analysis in the previous
section). This suggests that SMEs only exploit competitiveness arising from
economies of scale when they have successfully established their operations in
production networks; they do not really exploit economies of scale at the stage when
they are about to join a production network. This is consistent with the view that the
competitive struggle among firms is more intensive or severe inside production
networks, compared to that outside production networks.

39
Table 7. Firm Characteristic Determinants of Better-quality SMEs Participating in Production Networks
(1) (2) (3) (4) (5) (6) (7) (8) (9) (10)
(Size)i 0.010 0.009 0.011 0.010 0.011 0.011 0.013 0.011 0.011 0.010
(2.60)** (2.23)* (2.93)** (2.67)** (2.86)** (2.87)** (3.32)** (2.89)** (2.85)** (2.70)**
(Size2)i -0.000 -0.000 -0.000 -0.000 -0.000 -0.000 -0.000 -0.000 -0.000 -0.000
(0.68) (0.55) (0.80) (0.67) (0.85) (0.76) (0.77) (0.76) (0.73) (0.63)
ln(Age)i 0.102 0.090 0.089 0.138 0.138 0.112 0.073 0.086 0.078 0.096
(0.47) (0.41) (0.41) (0.63) (0.63) (0.52) (0.33) (0.40) (0.36) (0.44)
(Labour productivity)i 0.010 0.010 0.009 0.009 0.010 0.010 0.009 0.009 0.010 0.009
(1.96)* (2.00)* (1.91)+ (1.97)* (2.07)* (2.06)* (1.97)* (1.92)+ (2.06)* (1.97)*
(Foreign ownership share)i 1.276 1.438 1.329 1.336 1.278 1.320 1.226 1.279 1.294 1.401
(2.66)** (2.96)** (2.78)** (2.80)** (2.67)** (2.75)** (2.56)* (2.67)** (2.72)** (2.90)**
(Loan interest rate)i -0.067 -0.070 -0.073 -0.076 -0.074 -0.070 -0.077 -0.063 -0.063 -0.066
(1.66)+ (1.71)+ (1.79)+ (1.84)+ (1.82)+ (1.70)+ (1.81)+ (1.58) (1.60) (1.59)
(Interest Coverage Ratio)i -0.0001 -0.0001 -0.0001 -0.0001 -0.0001 -0.0001 -0.0001 -0.0001 -0.0001 -0.0001
(0.32) (0.39) (0.16) (0.35) (0.30) (0.27) (0.58) (0.33) (0.31) (0.12)
(Skill intensity)i -0.018 -0.420 0.051 0.107 0.132 0.041 0.210 0.104 0.058 0.167
(0.03) (0.66) (0.09) (0.18) (0.22) (0.07) (0.35) (0.18) (0.10) (0.28)
(Distance to port)i -0.144 -0.095 -0.132 -0.201 -0.189 -0.153 -0.062 -0.157 -0.185 -0.228
(0.78) (0.51) (0.72) (1.08) (1.02) (0.84) (0.33) (0.83) (1.04) (1.24)
Dependent variable: (Dummy variable for the quality of participation in production networks)i

40
Table 7. Continued
(1) (2) (3) (4) (5) (6) (7) (8) (9) (10)
(Dummy variable for meeting international standard)i 0.210
(0.56)
(Dummy variable for have introduced ICT)i 0.976
(2.41)*
(Dummy variable for have established new divisions)i -0.168
(0.44)
(Dummy variable for involving in business networks)i 0.457
(1.36)
(Dummy variable for acquiring new machinery)i 0.197
(0.58)
(Dummy variable for improving existing machinery)i 0.036
(0.10)
(Dummy variable for acquiring production knowledge)i 0.908
(2.51)*
(Dummy variable for ability of introducing new products)i -0.106
(0.30)
(Dummy variable for considering risk in business operation)i 0.078
(0.24)
(Dummy variable for willingness to adopt new business strategy)i 0.646
(1.94)+
Dependent variable: (Dummy variable for the quality of participation in production networks)i
41
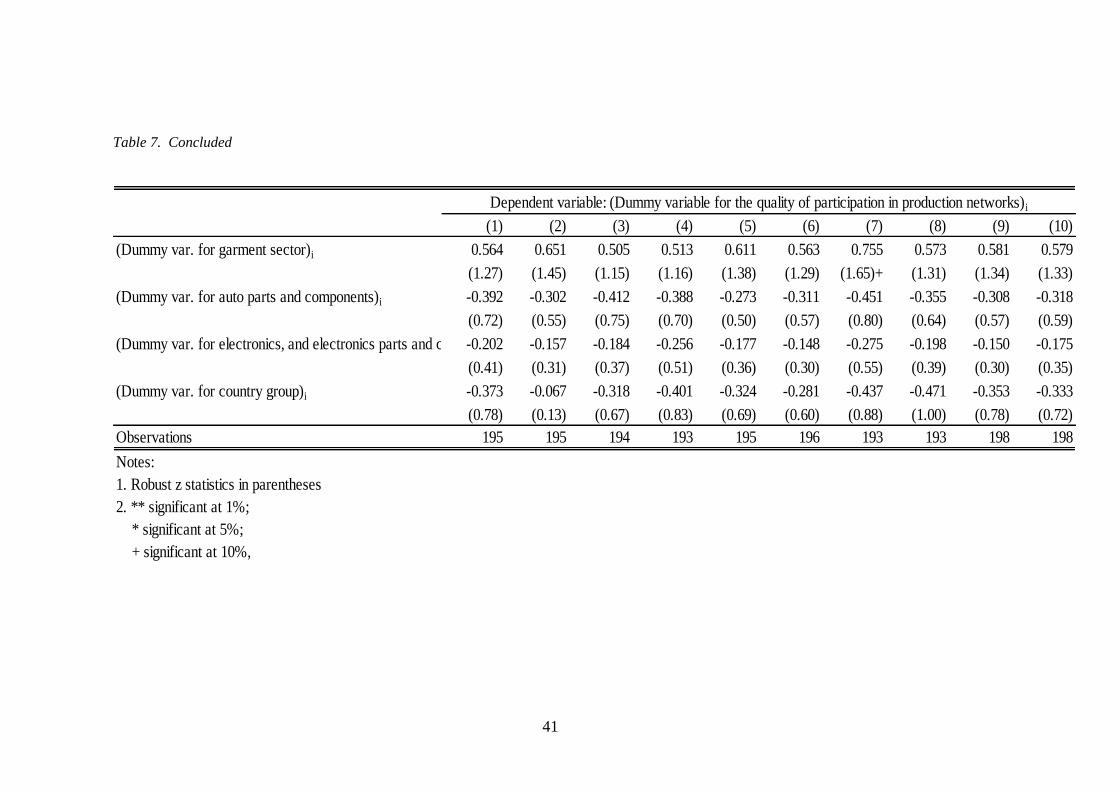
Table 7. Concluded
(1) (2) (3) (4) (5) (6) (7) (8) (9) (10)
(Dummy var. for garment sector)i 0.564 0.651 0.505 0.513 0.611 0.563 0.755 0.573 0.581 0.579
(1.27) (1.45) (1.15) (1.16) (1.38) (1.29) (1.65)+ (1.31) (1.34) (1.33)
(Dummy var. for auto parts and components)i -0.392 -0.302 -0.412 -0.388 -0.273 -0.311 -0.451 -0.355 -0.308 -0.318
(0.72) (0.55) (0.75) (0.70) (0.50) (0.57) (0.80) (0.64) (0.57) (0.59)
(Dummy var. for electronics, and electronics parts and component)i-0.202 -0.157 -0.184 -0.256 -0.177 -0.148 -0.275 -0.198 -0.150 -0.175
(0.41) (0.31) (0.37) (0.51) (0.36) (0.30) (0.55) (0.39) (0.30) (0.35)
(Dummy var. for country group)i -0.373 -0.067 -0.318 -0.401 -0.324 -0.281 -0.437 -0.471 -0.353 -0.333
(0.78) (0.13) (0.67) (0.83) (0.69) (0.60) (0.88) (1.00) (0.78) (0.72)
Observations 195 195 194 193 195 196 193 193 198 198
Notes:
1. Robust z statistics in parentheses
2. ** significant at 1%;
* significant at 5%;
+ significant at 10%,
Dependent variable: (Dummy variable for the quality of participation in production networks)i

42
Foreign ownership seems to be really important for upgrading the level of tier
involvement by SMEs in a production network. The estimated coefficient of foreign
ownership is very large and statistically significant across the specifications.
Moreover, the value of the estimated coefficients suggests that the effect of foreign
ownership is significant. The estimated coefficients across the specifications suggest
that a 10 percentage point increase in foreign ownership share, ceteris paribus,
increases the possibility of an SME moving to higher tiers in a production network by
about 12 times. This is a sensible finding given the more intensive firm competition
inside the networks, which makes the marginal value of every unit of shared foreign-
specific competitiveness much larger than that outside production networks.
However, as the previous analysis shows, foreign ownership still plays a crucial role in
increasing the probability of SME participation in production networks.
Productivity still matters even where SMEs have successfully established their
operations in a production network. The estimated coefficients of labour productivity
across the specifications are positive and statistically significant, mostly at the 5 %
level. Higher productivity facilitates SMEs moving to higher tiers, and becoming
higher value adding contributors in the production network. The finding on
productivity is consistent with the finding on foreign ownership. Analytically, this
suggests that SMEs tend to mimic the characteristics of strong exporting firms. The
fact that foreign ownership and labour productivity still play an important role
indicates a continuously learning process even after firms/SMEs have already
established their position in production networks.
There is rather weak evidence on the impact of innovation efforts, at least when
one compares it with the finding on innovation and its role as a determinant of SME

43
entry into production networks. This is because, unlike the earlier finding, only two
out of the eight innovation-effort variables are positive and statistically important, and
these are the dummy variables for “introduced ICT” and “acquiring production
knowledge”. Nevertheless, these positive and statistically significant dummy
variables suggest that efforts to innovate by SMEs that have already participated in
production networks to some extent still matter in upgrading SMEs to higher tiers in
the network.
The characteristic of firm attitude towards risk does not seem to exert a strong
influence on SMEs upgrading into a higher tier. While the estimated coefficient of the
two variables that represent this characteristic are positive there is only one estimated
coefficient that is statistically significant, and this is the estimated coefficient of the
dummy variable for “willingness to adopt a new business strategy”.
Besides revealing key characteristic determinants for higher quality SME
participation in production networks, the results presented in Table 7 also imply that
there is indeed room for improvement for SME to achieve higher quality participation.
This is important from the perspective of policy makers, because there could be many
problems for developing economies whose SMEs are involved in low value adding
activities. Activities in tier 3 and 4 parts of production networks may be easier to
enter but they may lock the country into low technology, basic assembly, low skill and
value adding activities, and involve intensive competition from other low cost labour
intensive developing economies. Placement at such a point in the production process
makes them easier to replace, due to relatively easy switching by customers to other
sources of supply. It is likely to involve intense competition on the basis of price and
labour cost and constrain overall economic development. Having put forward this

44
argument, it is important to note that promoting SME participation even at the lower
quality level is still worth pursuing. Participation at lower tiers does represent a
starting point and it can be viewed as an opportunity to move up the production
network value chain, by increasing the value content of activities and strengthening
pricing power (Abonyi, 2005).
6. Summary and Conclusion
This paper has provided an empirical investigation on the participation of SMEs in
production networks. It has attempted to reveal key firm characteristic determinants
of SME participation in production networks. It builds on the analytical framework
that considers the mechanics of production networks as well as the capability and
capacity of SMEs in overcoming the barriers from their size disadvantages. The
empirical investigation utilized results from an ERIA Survey on SME Participation in
Production Networks, which was conducted over a period of two to three month
period at the end 2009, in most of the ASEAN countries (i.e., Thailand, Indonesia,
Malaysia, Philippines, Vietnam, Cambodia, and Laos PDR) and China. The approach
has been to examine the difference in the firm characteristics of different groups of
SMEs defined by participation status in production networks and to estimate the firm
characteristic determinants of SME participation in these networks.
The descriptive and econometric analyses suggested that productivity, foreign
ownership, financial characteristics, innovation efforts, and managerial/entrepreneurial
attitude are the important firm characteristics that determine SME participation in

45
production networks. The descriptive analysis particularly finds that SMEs
participating in production networks are larger, younger, and involve more foreign
ownership than non-participating SMEs.
The econometric analysis strengthens the descriptive results. The robust findings
from the estimations suggest the significance of firm-level productivity. It suggests
that SMEs who plan to participate in production networks need to prepare themselves
by mimicking the characteristics of exporting firms, one of which is a high level of
productivity. Superiority in productivity is needed given the strict requirements of on
goods produced by and used by other firms in participating in production networks.
SMEs that actively conduct innovation activities seem to have a higher probability of
participating in production networks. The characteristic of firm attitude toward risk,
or the adoption of a new business idea, is another important determinant. This finding
is consistent with the view that SMEs in production networks operate in a tough
business environment and face a constant survival threat, because SMEs will not have
a favourable survival chance if they are reluctant to accept new ideas and are not
willing to face the business risks from participating in a production network.
The results meanwhile show that SMEs in production networks are less financially
constrained and have better access to the financial sector. The latter is indicated in the
descriptive analysis by the lower loan interest rate reported by these SMEs, compared
to those not participating in such a network. These findings, particularly the former,
suggest that SMEs in production networks have better cash-flow, which is most likely
due to their large, stable, and more certain purchase orders from other firms in the
network.

46
The empirical analysis was extended to gauge firm characteristics that allow
SMEs to move from low to high quality participation in a production network, or from
tier 3 or 4 to tier 1 or 2. The estimations reveal that size, productivity, foreign
ownership, and, to some extent, innovation efforts and managerial attitudes, are the
important firm characteristics needed by SMEs to upgrade their positions in
production networks. The findings suggest that SMEs really exploit competitiveness
from economies of scale only when they are able to engage in production networks.
This behavior is also implied by foreign ownership and productivity.
47
References
Abonyi, G. (2005), ‘Transformation of Global Production, Trade and Investment:
Global Value Chains and International Production Networks’, paper presented to
the Expert Group Meeting on SMEs’ Participation in Global and Regional
Supply Chains, UNESCAP, Bangkok, November.
Ando, M. (2006), ‘Fragmentation and Vertical Intra-industry Trade in East Asia’,
North American Journal of Economics and Finance, 17, pp.257-81.
Arndt, S.W. and Kierzkowski, H. (2001), Fragmentation: New Production Patterns in
the World Economy. Oxford, UK, Oxford University press.
Asasen, C., Asasen, K.and Chuangcham, N. (2003), ‘A Proposed ASEAN Policy
Blueprint for SME Development 2004–2014’, REPSF Project 02/005 33, 145
pp.
Athukorala, P. and N. Yamashita (2006), ‘Product Fragmentation Trade Integration:
East Asia in Global Context’, North American Journal of Economics and
Finance, 17, pp.233-56.
Athukorala, P.C. and Kohpaiboon, A. (2009), ‘Intra-regional Trade in East Asia: the
Decoupling Fallacy, Crisis and Policy Challenges’, ANU Working Paper in
Trade and Development, 2009/09.
Aw, Bee Y. and A.R. Hwang (1995), ‘Productivity and Export Market: A Firm-level
Analysis’, Journal of Development Economics, 47(2), pp.313-32.
Aw, Bee Y., Sukkyun, Chung and Mark J. Roberts (2000), ‘Productivity and Turnover
in the Export Market: Micro-level Evidence from the Republic of Korea and
Taiwan (China)’, The World Bank Economic Review, 14, pp.65-90.
Bernanke, B. (1993), ‘Credit in the Macro Economy’, Federal Reserve Bank of New
York Quarterly Review, 18(1), pp.50-70.
Bernard, A.B. and J.B. Jensen (1999), ‘Exceptional Exporter Performance: Cause,
Effect, or Both?’ Journal of International Economics, 47(1), pp.1-25.
Bernard, A.B., J.B. Jensen and R.Z. Lawrence (1995), ‘Exporters, Jobs, and Wages in
U.S. Manufacturing: 1976-1987’, Brookings Papers on Economic Activity,
Microeconomics, pp.67-119.

48
Blalock, G. and P. Gertler (2005), ‘Learning from Exporting Revisited in a Less
Developed Setting’, Journal of Development Economics, 75(2), pp.397-416.
Cheng, L.K. and Kierzkowski, H. (2001), Global Production and Trade in East Asia.
Boston, Kluwer Academic Publishers.
Claessens, S., S. Djankov and L.C. Xu (2000), ‘Corporate Performance in the East
Asian Financial Crisis,’ World Bank Research Observer, 15(1), pp.23-46.
Deardorff, A.V. (2001), ‘Fragmentation in Simple Trade Models’, North American
Journal of Economics and Finance, 12, pp.121-137.
Desai, M., C.F. Foley and K.J. Forbes (2004), ‘Financial Constraints and Growth:
Multinational and Local Firm Responses to Currency Crisis’, NBER Working
Paper Series, No. 10545, Cambridge, MA: NBER.
Diamond, D. (1991), ‘Monitoring and Reputation: The Choice between Bank Loans
and Directly Placed Debt’, Journal of Political Economy, 99(4), pp.688-721.
Gertler, M. and S. Gilchrist (1994), ‘Monetary Policy, Business Cycles and the
Behavior of Small Manufacturing Firms’, Quarterly Journal of Economics,
109(2), pp.309-340.
Harvie, C. (2002), ‘The Asian Financial and Economic Crisis and Its Impact on
Regional SMEs’, in C. Harvie and B.C. Lee (eds.), Globalization and Small and
Medium Enterprises in East Asia, Edward Elgar, Cheltenham, UK, Chapter 2,
pp.10-42.
Harvie, C. (2008), ‘SMEs in Regional Trade and Investment Development’, in Tran
Van Hoa and C. Harvie, Regional Trade Agreements in East Asia, Chapter 9,
pp. 149-186, Edward Elgar, Cheltenham, UK.
Harvie, C. and Lee, B.C. (2002) (eds.), ‘The Role of Small and Medium Enterprises in
National Economies in East Asia’, Cheltenham, UK, Edward Elgar.
Harvie, C. and Lee, B.C. (2005), ‘Introduction: the Role of Small and Medium-sized
Enterprises in Achieving and Sustaining Growth and Performance (with B.C.
Lee)’, in C.Harvie and B.C. Lee (eds.), Sustaining Growth and Performance in
East Asia: the Role of Small and Medium Sized Enterprises, Studies of Small and
Medium sized Enterprises in East Asia, Volume III, Chapter 1, pp. 3-27,
Cheltenham, UK, Edward Elgar.

49
Jones, R.W. and Kierzkowski, H. (1990), ‘The Role of Services in Production and
International Trade: a Theoretical Framework’, in R.W. Jones and A.O. Krueger
(eds.), The Political Economy of International Trade: Essays in Honour of R.E.
Baldwin, pp.31-48, Oxford, UK, Basil Blackwell.
Jovanovic, B. (1982), ‘Selection and the Evolution of Industry’, Econometrica, 50
(3):649-70.
Kimura, F. (2009), ‘The Nature and Characteristics of Production Networks in East
Asia: Evidences from Micro/Panel Data Analyses, Research Unit for Statistical
and Empirical Analysis in Social Sciences (Hi-Stat)’, Discussion paper series
093.
Kimura, F. and M. Ando (2005a), ‘Two-dimensional Fragmentation in East Asia:
Conceptual Framework and Empirics’, International Review of Economics and
Finance, 14, pp.317-48.
Kimura, F. and M. Ando (2005b), ‘The Economic Analysis of International
Production/Distribution Networks in East Asia and Latin America: The
Implication of Regional Trade Arrangement’, Business and Politics, 7(1), pp.1-
36.
Kuchiki, A. (2005), ‘A Flowchart Approach’, In A. Kuchiki and M. Tsuji (eds.),
Industrial Cluster in Asia: Analyses of Their Competition and Cooperation.
New York: Palgrave MacMillan, pp.169-199.
Lim, H. and Kimura, F. (2009), ‘The Internationalisation of SMEs in Regional and
Global Value Chains’, paper presented at the LAEBA Fifth Annual Conference,
Singapore.
Ng, F. and A. Yeats (2003), ‘Major Trade Trends in East Asia: What are Their
Implications for Regional Cooperation and Growth?’ Policy Research Working
Paper No. 3084, Washington DC: The World Bank.
Organization for Economic Cooperation and Development (OECD) (2008), Removing
Barriers to SME access to International Markets. Paris, OECD.
Organization for Economic Cooperation and Development (OECD) and Eurostat
(2005), Oslo Manual: Proposed Guidelines for Collecting and Interpreting
Technological Innovation Data, 3rd
edition. Paris, OECD.
50
Petersen, M.A. And R.G. Rajan (1994), ‘The Benefits of Firm-creditor Relationship:
Evidence from Small Business Data’, Journal of Finance, 49(1), pp.3-37.
Sjoholm, F. and S. Takii (2003), ‘Foreign Networks and Exports: Results from
Indonesian Panel Data’, ICSEAD Working Paper Series, Vol. 2003-33,
Kitakyushu: ICSEAD.
Stiglitz, J.E. And A. Weiss (1981), ‘Credit Rationing in Markets with Imperfect
Information’, American Economic Review, 71 (3), pp.393-410.
Wooldridge, Jeffrey M. (2002), Econometric Analysis of Cross Section and Panel
Data. Cambridge, MA: MIT Press.