fire detection using smoke and gas sensors · final manuscript submitted to the fire safety journal...
TRANSCRIPT
Final Manuscript submitted to the Fire Safety JournalChen et. al., Fire detection using smoke and gas sensors
Final Manuscript
Fire detection using smoke and gas sensorsShin-Juh Chen1, Chris Hovde1, Kristen A. Peterson1, and
André Marshall2
1 Southwest Sciences Inc., 1570 Pacheco Street, Suite E-11Santa Fe, NM 87505, USA
2 Department of Fire Protection EngineeringUniversity of Maryland, College Park, MD 20742-3031, USA
Submitted to Fire Safety Journal
Paper No. 1298Manuscript No. U161
January 17, 2007 (2:07pm)
Corresponding Author:Shin-Juh Chen, Ph.D.Southwest Sciences, Inc.1570 Pacheco Street, Suite E-11Santa Fe, NM 87505
TEL: (505) 984-1322FAX: (505) 988-9230EMAIL: [email protected]
Final Manuscript submitted to the Fire Safety JournalChen et. al., Fire detection using smoke and gas sensors
1
TABLE OF CONTENTS
Abstract . . . . . . . . . . . . . . . . . . . . . . . . . . . . . . . . . . . . . . . . . . . . . . . . . . . . . . . . . . . . . . 2
1. Introduction . . . . . . . . . . . . . . . . . . . . . . . . . . . . . . . . . . . . . . . . . . . . . . . . . . . . . 3
2. Experimental Methods . . . . . . . . . . . . . . . . . . . . . . . . . . . . . . . . . . . . . . . . . . . . 4
3. Fire Alarm Algorithm . . . . . . . . . . . . . . . . . . . . . . . . . . . . . . . . . . . . . . . . . . . . . . 6
4. Results and Discussions . . . . . . . . . . . . . . . . . . . . . . . . . . . . . . . . . . . . . . . . . . . 74.1 Fire signatures of selected materials . . . . . . . . . . . . . . . . . . . . . . . . . . . 74.3 Performance of three-component based fire alarm algorithm . . . . . . . . 104.4 Effects of nuisances on fire alarm algorithm . . . . . . . . . . . . . . . . . . . . . 13
5. Summary . . . . . . . . . . . . . . . . . . . . . . . . . . . . . . . . . . . . . . . . . . . . . . . . . . . . . . 14
Acknowledgments . . . . . . . . . . . . . . . . . . . . . . . . . . . . . . . . . . . . . . . . . . . . . . . . . . . . . 15
Table 1: Fire Alarm Algorithm Performance . . . . . . . . . . . . . . . . . . . . . . . . . . . . . . . . . 16
References . . . . . . . . . . . . . . . . . . . . . . . . . . . . . . . . . . . . . . . . . . . . . . . . . . . . . . . . . . 17
Legends to Illustrations . . . . . . . . . . . . . . . . . . . . . . . . . . . . . . . . . . . . . . . . . . . . . . . . . 19
Figure 1 . . . . . . . . . . . . . . . . . . . . . . . . . . . . . . . . . . . . . . . . . . . . . . . . . . . . . . . . . . . . . 20Figure 2 . . . . . . . . . . . . . . . . . . . . . . . . . . . . . . . . . . . . . . . . . . . . . . . . . . . . . . . . . . . . . 21Figure 3 . . . . . . . . . . . . . . . . . . . . . . . . . . . . . . . . . . . . . . . . . . . . . . . . . . . . . . . . . . . . . 22Figure 4 . . . . . . . . . . . . . . . . . . . . . . . . . . . . . . . . . . . . . . . . . . . . . . . . . . . . . . . . . . . . . 23Figure 5 . . . . . . . . . . . . . . . . . . . . . . . . . . . . . . . . . . . . . . . . . . . . . . . . . . . . . . . . . . . . . 24Figure 6 . . . . . . . . . . . . . . . . . . . . . . . . . . . . . . . . . . . . . . . . . . . . . . . . . . . . . . . . . . . . . 25Figure 7 . . . . . . . . . . . . . . . . . . . . . . . . . . . . . . . . . . . . . . . . . . . . . . . . . . . . . . . . . . . . . 26Figure 8 . . . . . . . . . . . . . . . . . . . . . . . . . . . . . . . . . . . . . . . . . . . . . . . . . . . . . . . . . . . . . 27Figure 9 . . . . . . . . . . . . . . . . . . . . . . . . . . . . . . . . . . . . . . . . . . . . . . . . . . . . . . . . . . . . . 29
Final Manuscript submitted to the Fire Safety JournalChen et. al., Fire detection using smoke and gas sensors
2
Fire detection using smoke and gas sensors
Shin-Juh Chen1, Chris Hovde1, Kristen A. Peterson1, andAndré Marshall2
1 Southwest Sciences Inc., Santa Fe, NM 87505, USA2 Department of Fire Protection Engineering
University of Maryland, College Park, MD 20742-3031, USA
Abstract
Fire detection systems located in aircraft cargo compartments are currently
based only on smoke detectors. They generate about 200 false alarms per year for U.S.
registered aircraft. The number of false alarms is growing as more planes are outfitted
with smoke detectors and air travel expands. Moreover, the survivability of an aircraft in
a fire scenario depends on the early detection of the fire. A fire detection system is
developed based on the simultaneous measurements of carbon monoxide, carbon
dioxide, and smoke. The combination of the rates of rise of smoke and either carbon
monoxide or carbon dioxide concentration provides a potential fire alarm algorithm to
increase the reliability of aircraft smoke detectors, and to reduce the time to alarm. The
fire detection system with the alarm algorithm detected fires that were not alarmed by
smoke sensors, and alarmed in shorter times than smoke sensors operating alone.
Keywords: fire detection, gas sensor, smoke, carbon monoxide, carbon dioxide, rate
of rise, alarm algorithm, nuisance sources, fire signatures, aircraft cargo
Final Manuscript submitted to the Fire Safety JournalChen et. al., Fire detection using smoke and gas sensors
3
1. Introduction
Fire detection systems of current aircraft cargo compartments are primarily smoke
detectors. Existing smoke detectors have never failed to indicate an actual fire onboard
an aircraft. The false alarm rates, defined as the percentage of alarms with no verified
smoke in the cargo compartment, are as high as 99 percent. The cost of a false alarm is
estimated between $30,000 to $50,000 per incident [1]. Moreover, there are safety
issues associated with false alarms. Unfortunately, the cause of a false alarm is usually
not known. Regulations mandate that the alarm sounds within one minute after the
onset of a fire condition. Pilots may have only about ten or fifteen minutes in which to
land before smoke or damage to the structure from an uncontained fire prevents the pilot
from controlling the aircraft. Reducing the time to alarm will allow the pilot to suppress
the fire at an earlier stage and permit more time to land the aircraft safely.
Previous fire detection algorithms used data from sensors for temperature, smoke,
and combustion products. Some of the chemical species included oxygen (O2), carbon
monoxide (CO), carbon dioxide (CO2), water vapor (H2O), hydrogen cyanide (HCN),
acetylene (C2H2), and nitric oxide (NO). Simple fire alarm algorithms are based on
thresholds for maximum values, rates of increase, and combinations thereof from
multiple sensors. Alarm algorithms based on threshold values are highly sensitive to
signal offsets (due to background concentration fluctuations or slow drift in calibration),
demand measurements of high accuracy, and require accurate and frequent
calibrations. To remedy some of these deficiencies, threshold values that adapt to the
changing conditions of the environment were based on a comparison between the
predicted and measured values in a time sliding window [2]. Rates of rise of CO2 and
CO have been used to identify flaming and non-flaming fires, and were compared to a
Final Manuscript submitted to the Fire Safety JournalChen et. al., Fire detection using smoke and gas sensors
4
commercial smoke detector [3]. Fire alarm algorithms that use CO and smoke [4], and
CO2 and smoke [5] have shown reduction in nuisance alarms and response times.
Ionization and photoelectric detectors, CO and CO2 sensors using magnitude and slope
information, and background subtraction were used to evaluate a fire alarm algorithm
based on a probabilistic neural network [6]. Flaming fires were identified correctly, but
smoldering fires were problematic. A fire detection system having a multi-criteria alarm
algorithm and multi-component sensor system has the potential to reduce false alarms
generated by individual fire detectors, and to reduce the time to alarm in the presence of
fires.
A potential method to reduce or eliminate false alarms generated by aircraft smoke
detector operating alone and to reduce the time to alarm is described here. The fire
detection system combines the simultaneous measurements of smoke, carbon
monoxide, and carbon dioxide. A simple fire alarm algorithm, based on the rates of
increase of these three components, is developed and assessed using fire tests of
combustible materials, liquid fuels, and nuisance sources.
2. Experimental Methods
Experimental data to test the fire alarm algorithm and compare its performance
with a commercial aircraft smoke detector were obtained at the University of Maryland.
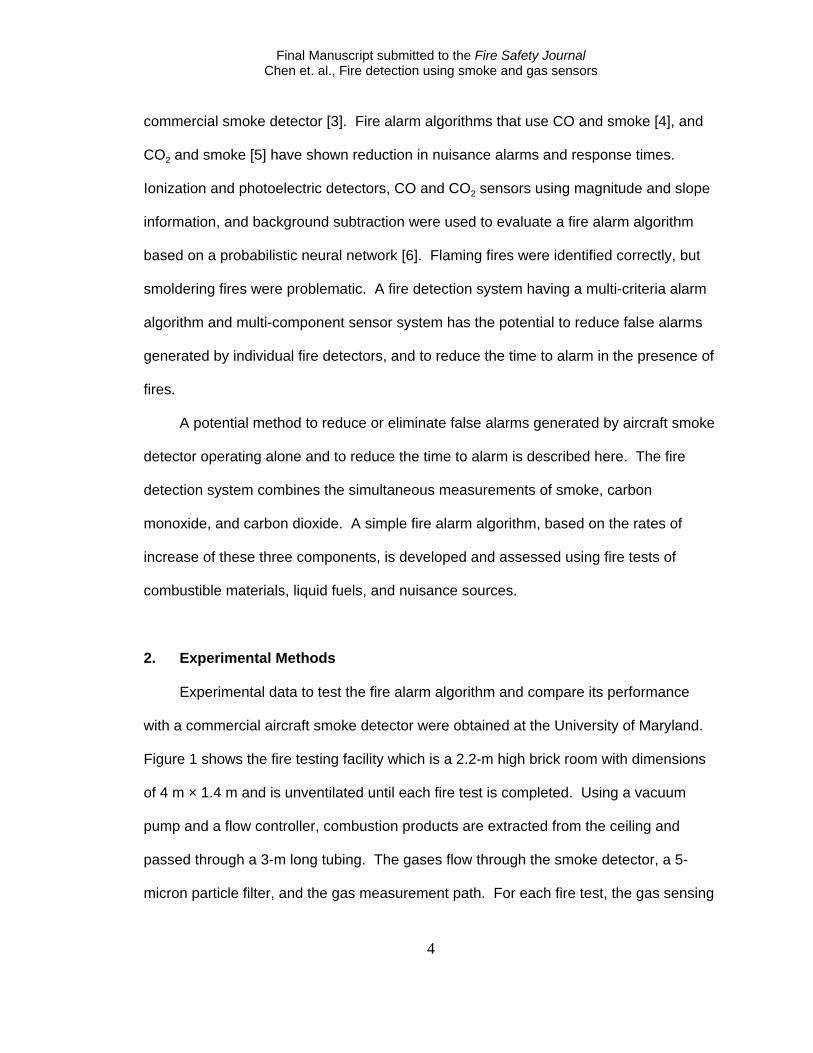
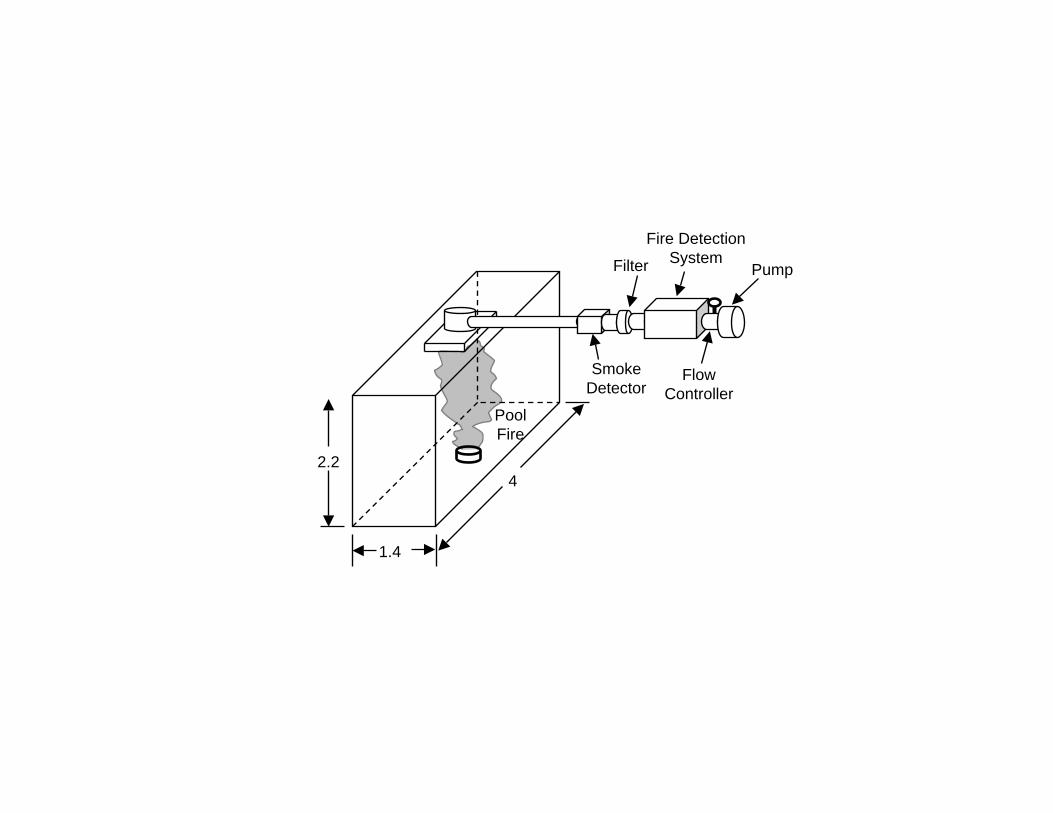
Figure 1 shows the fire testing facility which is a 2.2-m high brick room with dimensions
of 4 m × 1.4 m and is unventilated until each fire test is completed. Using a vacuum
pump and a flow controller, combustion products are extracted from the ceiling and
passed through a 3-m long tubing. The gases flow through the smoke detector, a 5-
micron particle filter, and the gas measurement path. For each fire test, the gas sensing
Final Manuscript submitted to the Fire Safety JournalChen et. al., Fire detection using smoke and gas sensors
5
system provides concentrations of CO and CO2, and levels of smoke are reported using
a commercial aircraft smoke detector.
The smoke detector, based on the method of light scattering, is used to measure
smoke concentration which is reported in volt (V) once a second through an analog
output. The factory setting for the smoke detector to alarm in a fire scenario is 5 V
(threshold value) which corresponds to 15 percent per meter attenuation. The noise
level, obtained from the experimental data, is 0.2 mV for an averaging time of 10
seconds. The smoke sensor alarms when the analog output signal exceeds or equal the
threshold value. In the fire alarm algorithm described here, the output voltage signals
are continuously recorded and the rates of increase are computed and used in the
algorithm.
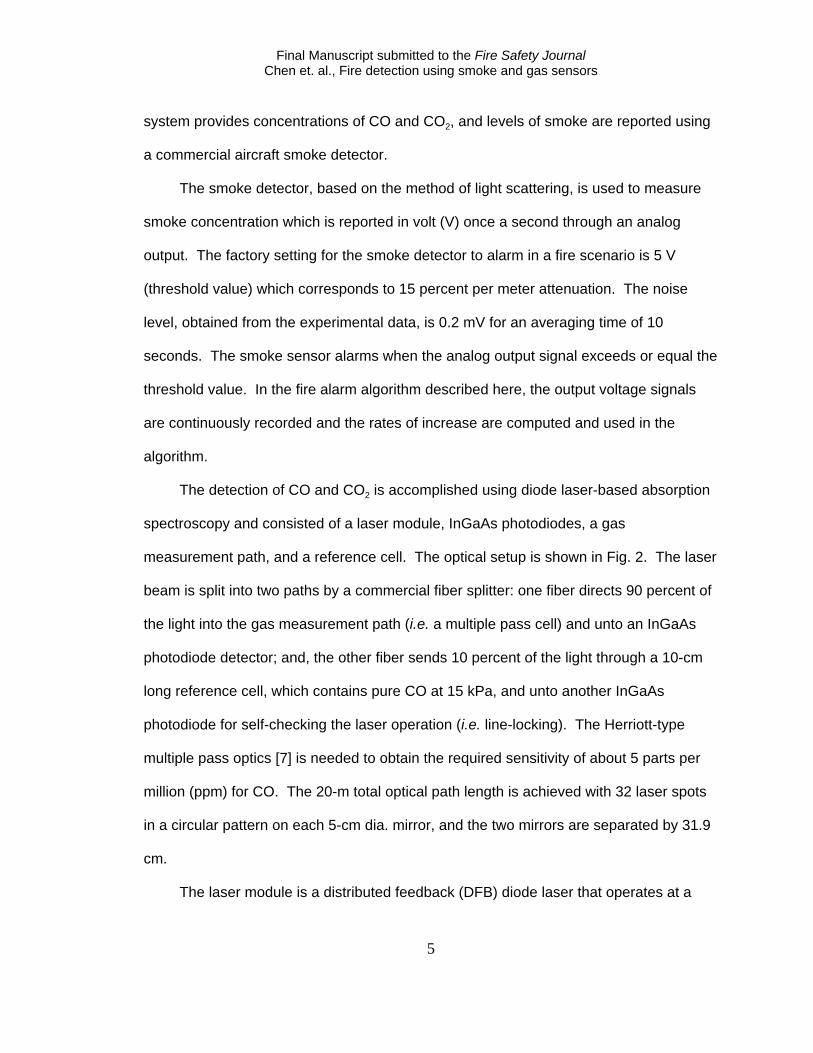
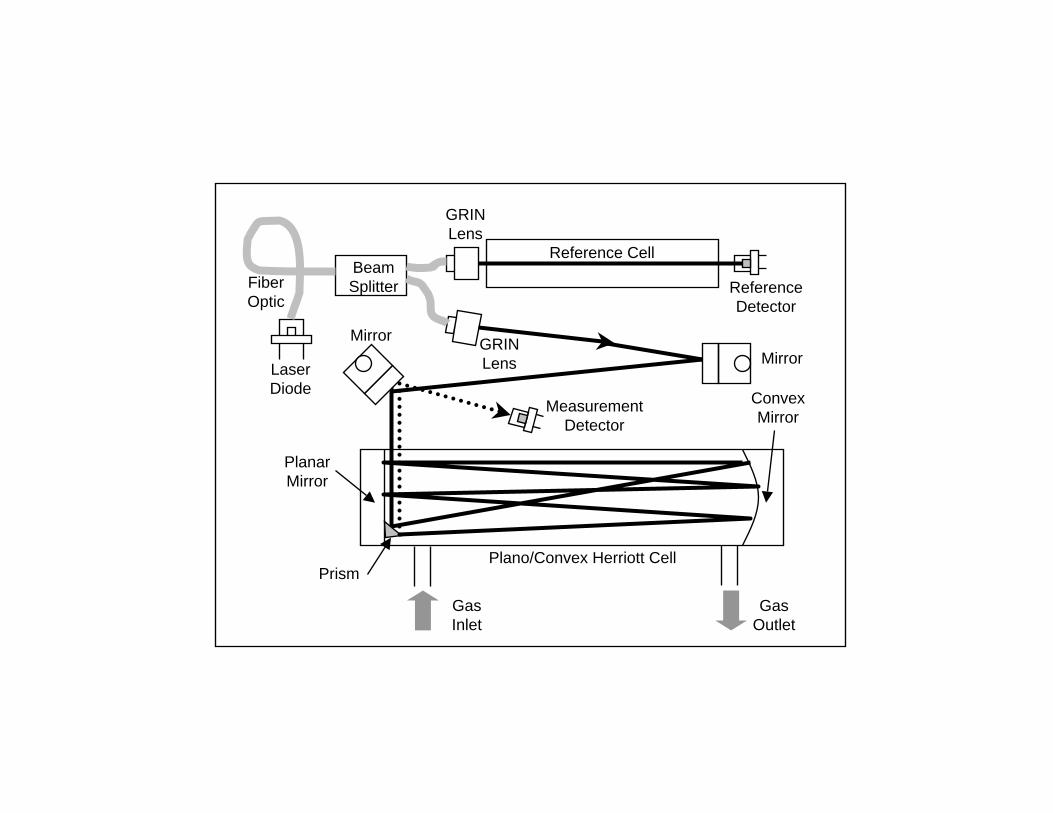
The detection of CO and CO2 is accomplished using diode laser-based absorption
spectroscopy and consisted of a laser module, InGaAs photodiodes, a gas
measurement path, and a reference cell. The optical setup is shown in Fig. 2. The laser
beam is split into two paths by a commercial fiber splitter: one fiber directs 90 percent of
the light into the gas measurement path (i.e. a multiple pass cell) and unto an InGaAs
photodiode detector; and, the other fiber sends 10 percent of the light through a 10-cm
long reference cell, which contains pure CO at 15 kPa, and unto another InGaAs
photodiode for self-checking the laser operation (i.e. line-locking). The Herriott-type
multiple pass optics [7] is needed to obtain the required sensitivity of about 5 parts per
million (ppm) for CO. The 20-m total optical path length is achieved with 32 laser spots
in a circular pattern on each 5-cm dia. mirror, and the two mirrors are separated by 31.9
cm.
The laser module is a distributed feedback (DFB) diode laser that operates at a
Final Manuscript submitted to the Fire Safety JournalChen et. al., Fire detection using smoke and gas sensors
6
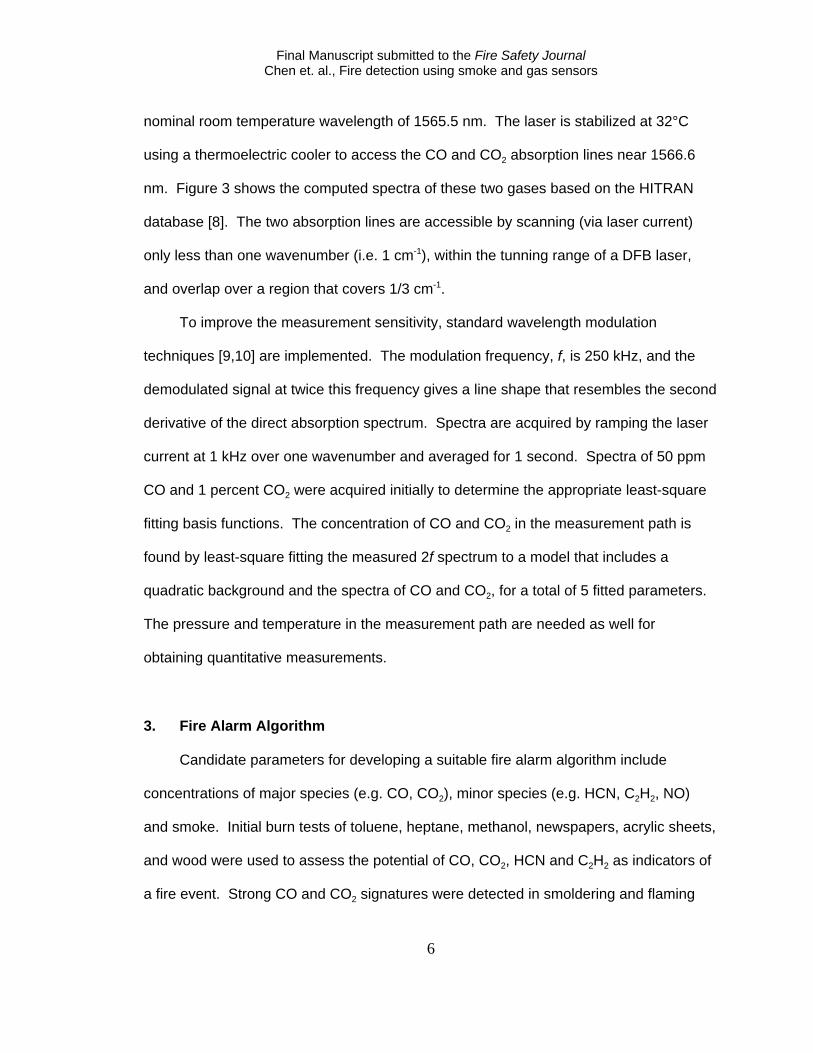
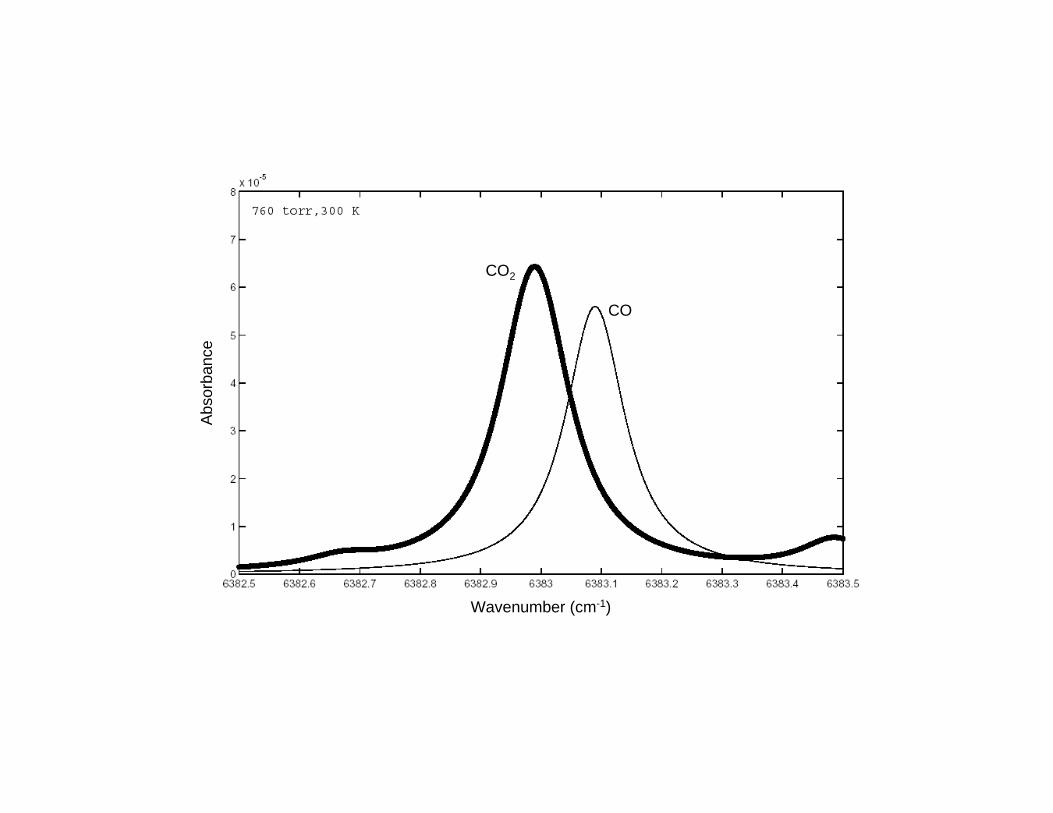
nominal room temperature wavelength of 1565.5 nm. The laser is stabilized at 32°C
using a thermoelectric cooler to access the CO and CO2 absorption lines near 1566.6
nm. Figure 3 shows the computed spectra of these two gases based on the HITRAN
database [8]. The two absorption lines are accessible by scanning (via laser current)
only less than one wavenumber (i.e. 1 cm-1), within the tunning range of a DFB laser,
and overlap over a region that covers 1/3 cm-1.
To improve the measurement sensitivity, standard wavelength modulation
techniques [9,10] are implemented. The modulation frequency, f, is 250 kHz, and the
demodulated signal at twice this frequency gives a line shape that resembles the second
derivative of the direct absorption spectrum. Spectra are acquired by ramping the laser
current at 1 kHz over one wavenumber and averaged for 1 second. Spectra of 50 ppm
CO and 1 percent CO2 were acquired initially to determine the appropriate least-square
fitting basis functions. The concentration of CO and CO2 in the measurement path is
found by least-square fitting the measured 2f spectrum to a model that includes a
quadratic background and the spectra of CO and CO2, for a total of 5 fitted parameters.
The pressure and temperature in the measurement path are needed as well for
obtaining quantitative measurements.
3. Fire Alarm Algorithm
Candidate parameters for developing a suitable fire alarm algorithm include
concentrations of major species (e.g. CO, CO2), minor species (e.g. HCN, C2H2, NO)
and smoke. Initial burn tests of toluene, heptane, methanol, newspapers, acrylic sheets,
and wood were used to assess the potential of CO, CO2, HCN and C2H2 as indicators of
a fire event. Strong CO and CO2 signatures were detected in smoldering and flaming
Final Manuscript submitted to the Fire Safety JournalChen et. al., Fire detection using smoke and gas sensors
7
fires, respectively. Weak C2H2 signature was detected for a short time, and no HCN
signature was detected by the instrument. Based on these measurements, only
concentrations of CO, CO2 and smoke are used a parameters in the fire alarm algorithm.
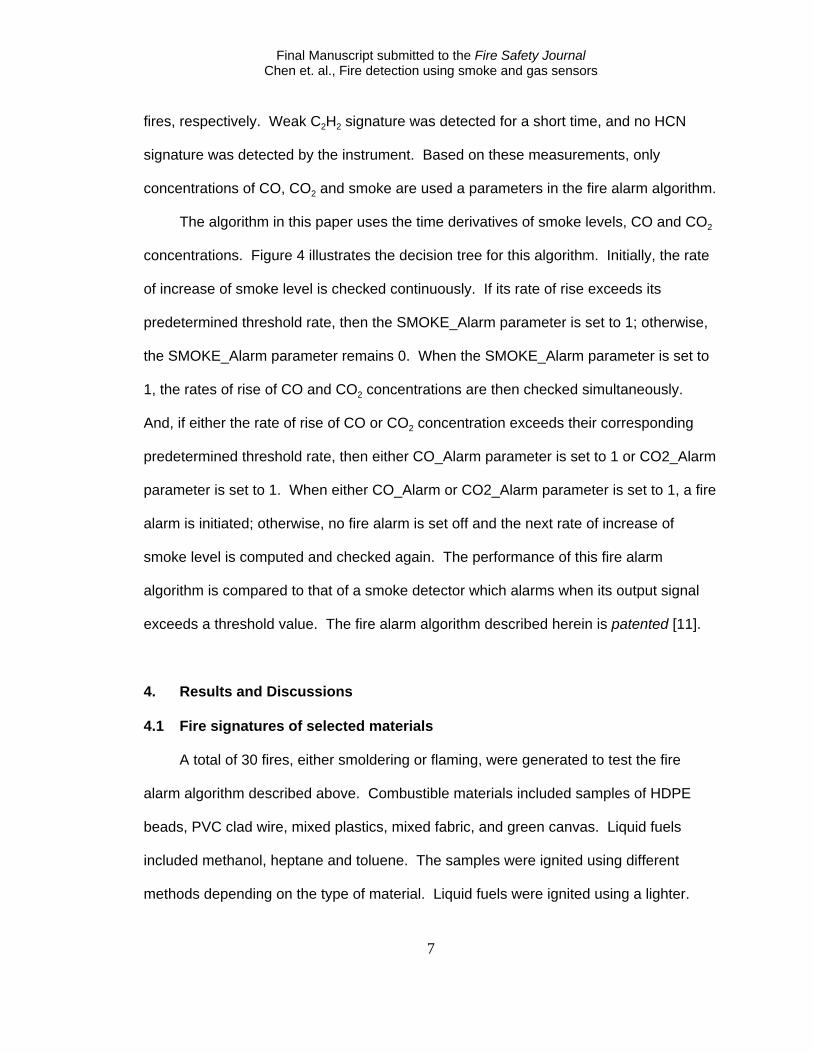
The algorithm in this paper uses the time derivatives of smoke levels, CO and CO2
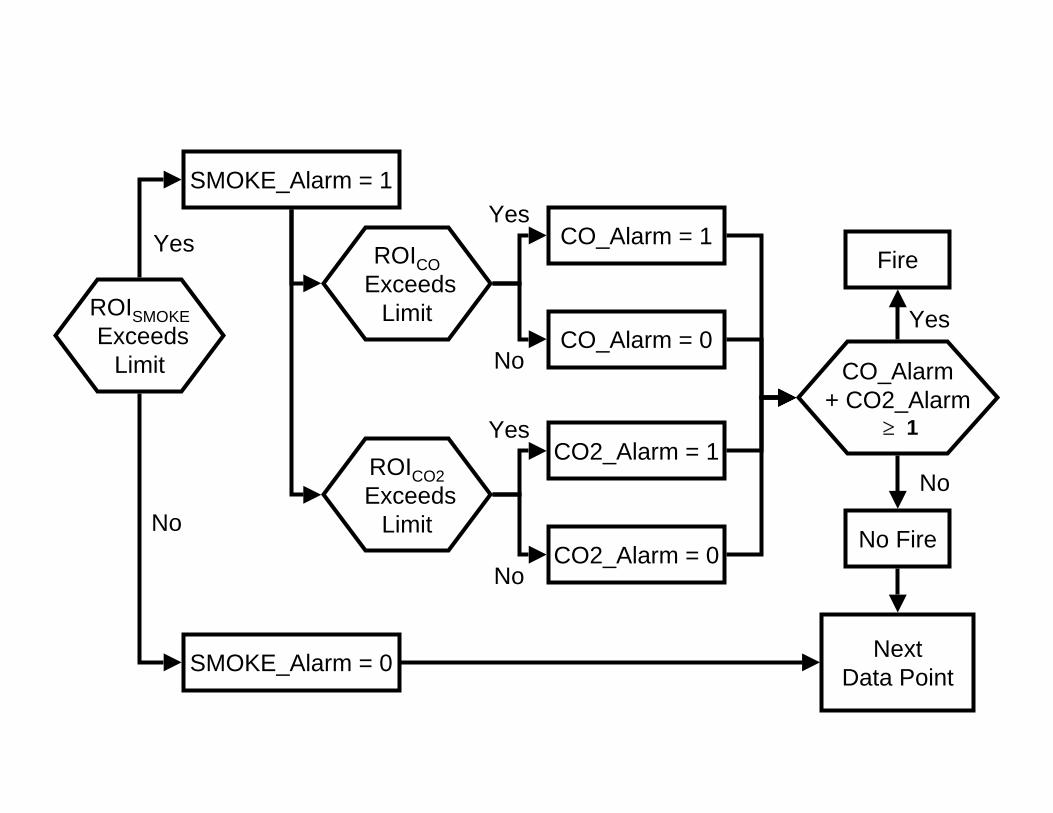
concentrations. Figure 4 illustrates the decision tree for this algorithm. Initially, the rate
of increase of smoke level is checked continuously. If its rate of rise exceeds its
predetermined threshold rate, then the SMOKE_Alarm parameter is set to 1; otherwise,
the SMOKE_Alarm parameter remains 0. When the SMOKE_Alarm parameter is set to
1, the rates of rise of CO and CO2 concentrations are then checked simultaneously.
And, if either the rate of rise of CO or CO2 concentration exceeds their corresponding
predetermined threshold rate, then either CO_Alarm parameter is set to 1 or CO2_Alarm
parameter is set to 1. When either CO_Alarm or CO2_Alarm parameter is set to 1, a fire
alarm is initiated; otherwise, no fire alarm is set off and the next rate of increase of
smoke level is computed and checked again. The performance of this fire alarm
algorithm is compared to that of a smoke detector which alarms when its output signal
exceeds a threshold value. The fire alarm algorithm described herein is patented [11].
4. Results and Discussions
4.1 Fire signatures of selected materials
A total of 30 fires, either smoldering or flaming, were generated to test the fire
alarm algorithm described above. Combustible materials included samples of HDPE
beads, PVC clad wire, mixed plastics, mixed fabric, and green canvas. Liquid fuels
included methanol, heptane and toluene. The samples were ignited using different
methods depending on the type of material. Liquid fuels were ignited using a lighter.
Final Manuscript submitted to the Fire Safety JournalChen et. al., Fire detection using smoke and gas sensors
8
Other materials were ignited using a glowbar or a small pilot flame from a butane torch.
Two to three burn tests were conducted for each material, and two methods of ignition
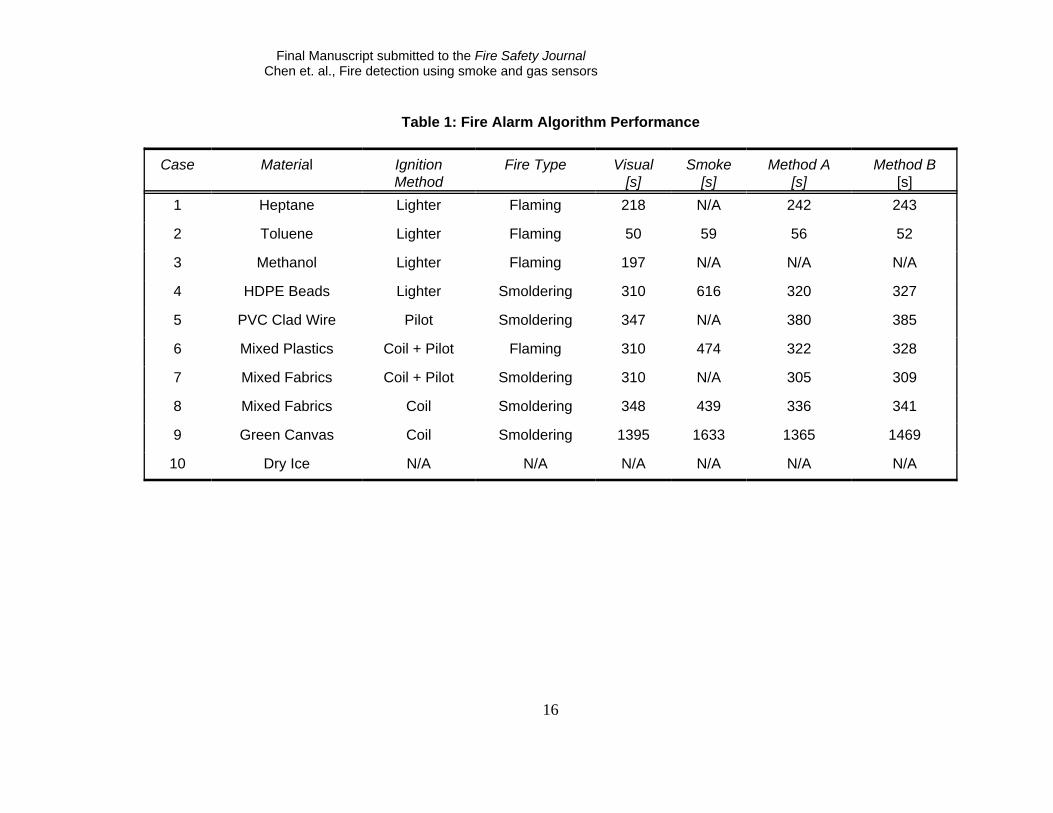
were used for some of the materials. Table 1 shows the list of materials tested, the
ignition method employed, and the type of fires generated.
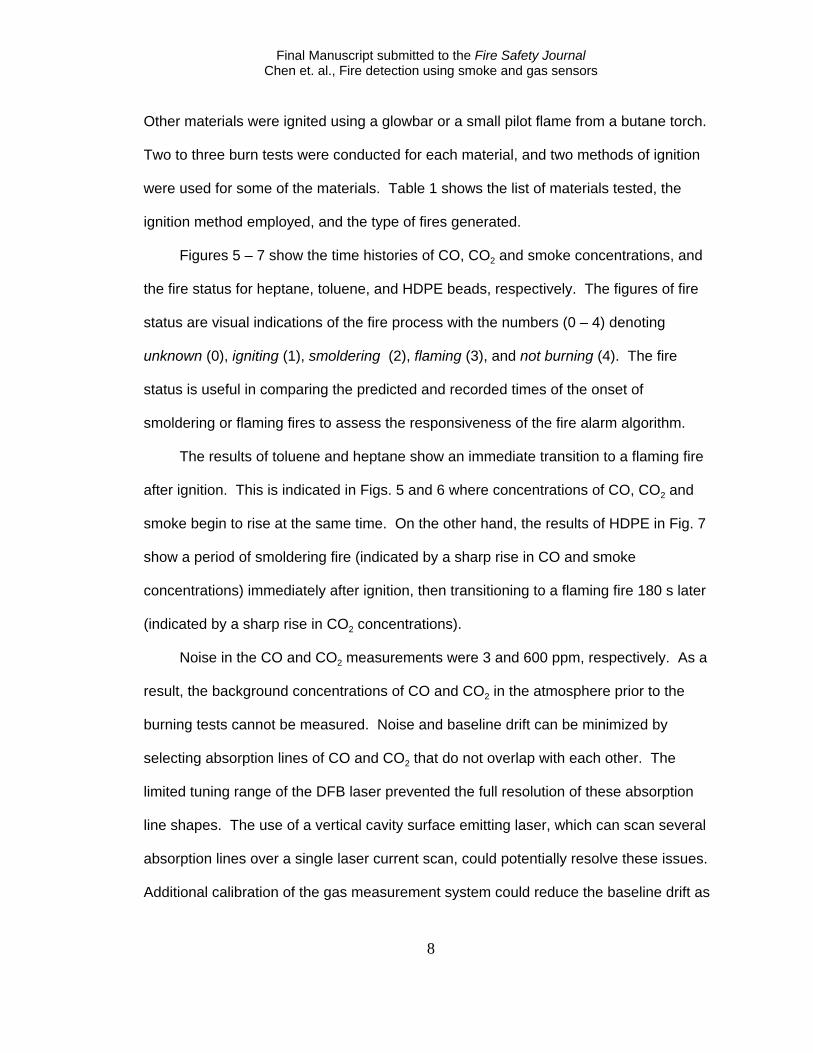
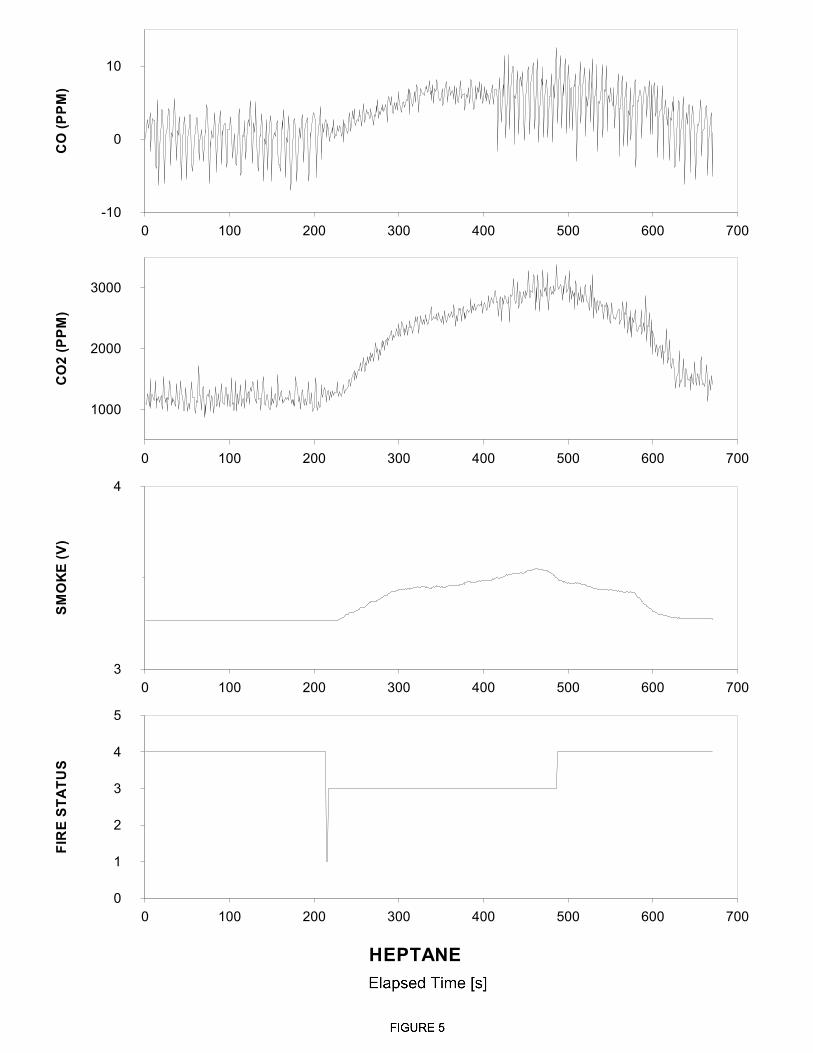
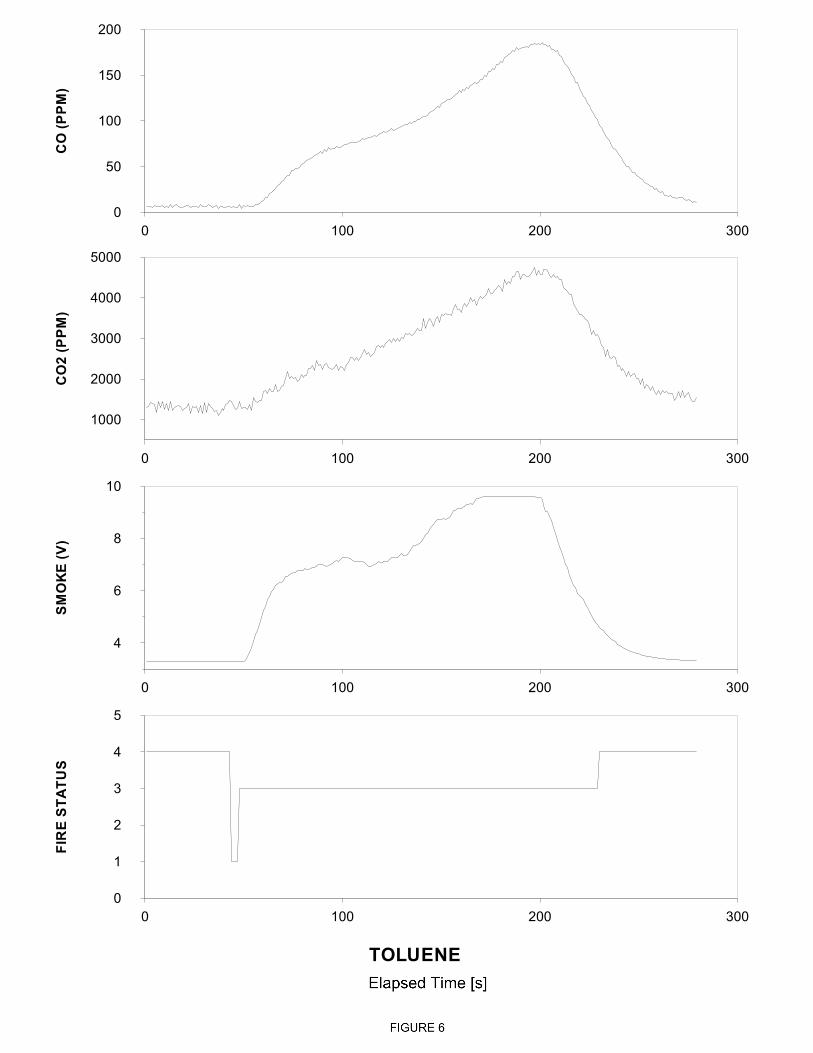
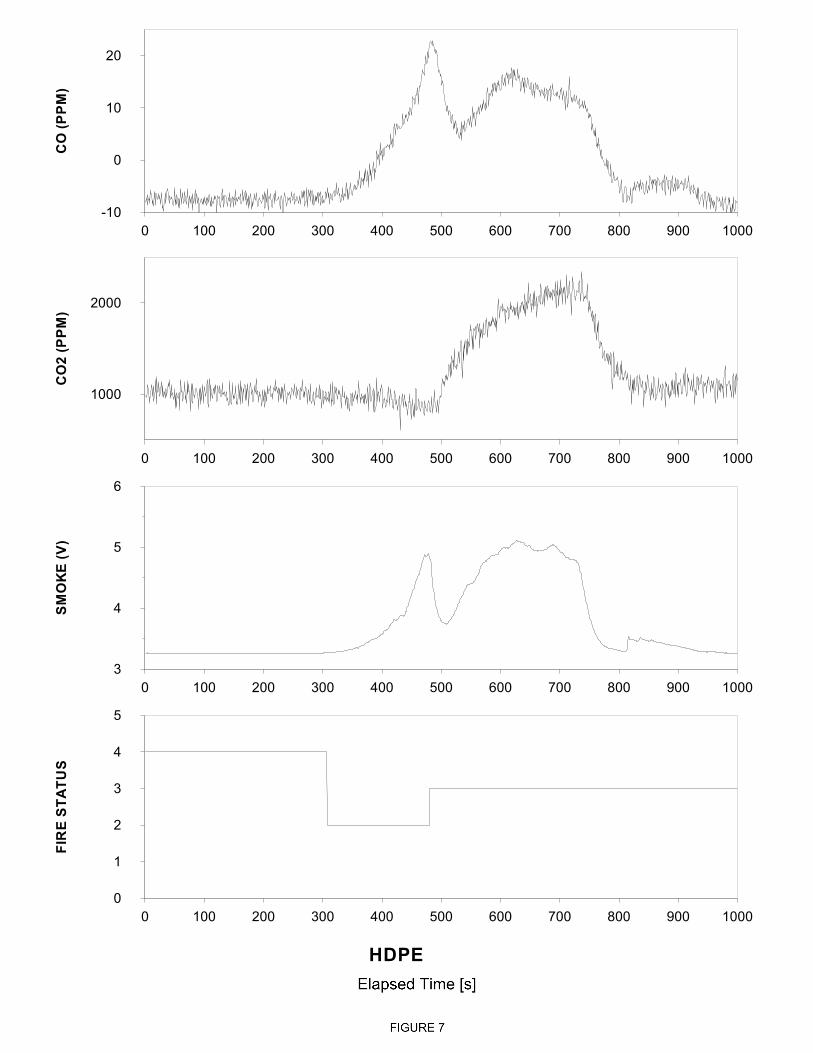
Figures 5 – 7 show the time histories of CO, CO2 and smoke concentrations, and
the fire status for heptane, toluene, and HDPE beads, respectively. The figures of fire
status are visual indications of the fire process with the numbers (0 – 4) denoting
unknown (0), igniting (1), smoldering (2), flaming (3), and not burning (4). The fire
status is useful in comparing the predicted and recorded times of the onset of
smoldering or flaming fires to assess the responsiveness of the fire alarm algorithm.
The results of toluene and heptane show an immediate transition to a flaming fire
after ignition. This is indicated in Figs. 5 and 6 where concentrations of CO, CO2 and
smoke begin to rise at the same time. On the other hand, the results of HDPE in Fig. 7
show a period of smoldering fire (indicated by a sharp rise in CO and smoke
concentrations) immediately after ignition, then transitioning to a flaming fire 180 s later
(indicated by a sharp rise in CO2 concentrations).
Noise in the CO and CO2 measurements were 3 and 600 ppm, respectively. As a
result, the background concentrations of CO and CO2 in the atmosphere prior to the
burning tests cannot be measured. Noise and baseline drift can be minimized by
selecting absorption lines of CO and CO2 that do not overlap with each other. The
limited tuning range of the DFB laser prevented the full resolution of these absorption
line shapes. The use of a vertical cavity surface emitting laser, which can scan several
absorption lines over a single laser current scan, could potentially resolve these issues.
Additional calibration of the gas measurement system could reduce the baseline drift as
Final Manuscript submitted to the Fire Safety JournalChen et. al., Fire detection using smoke and gas sensors
9
well.
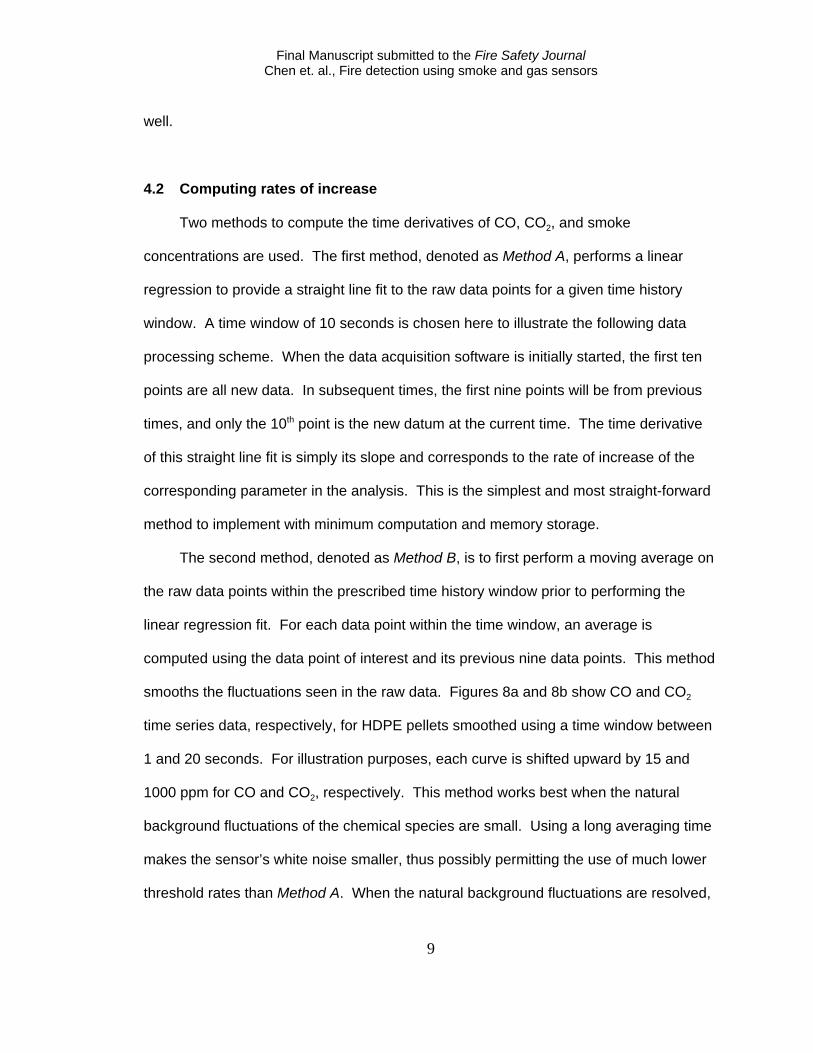
4.2 Computing rates of increase
Two methods to compute the time derivatives of CO, CO2, and smoke
concentrations are used. The first method, denoted as Method A, performs a linear
regression to provide a straight line fit to the raw data points for a given time history
window. A time window of 10 seconds is chosen here to illustrate the following data
processing scheme. When the data acquisition software is initially started, the first ten
points are all new data. In subsequent times, the first nine points will be from previous
times, and only the 10th point is the new datum at the current time. The time derivative
of this straight line fit is simply its slope and corresponds to the rate of increase of the
corresponding parameter in the analysis. This is the simplest and most straight-forward
method to implement with minimum computation and memory storage.
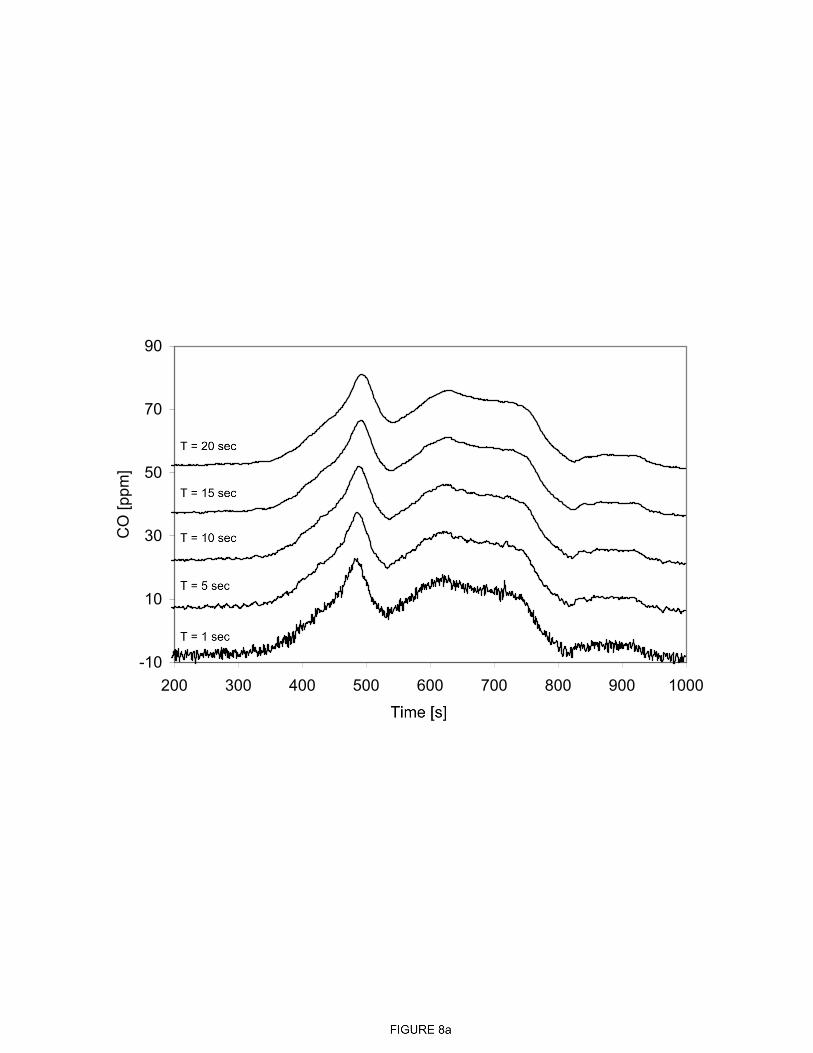
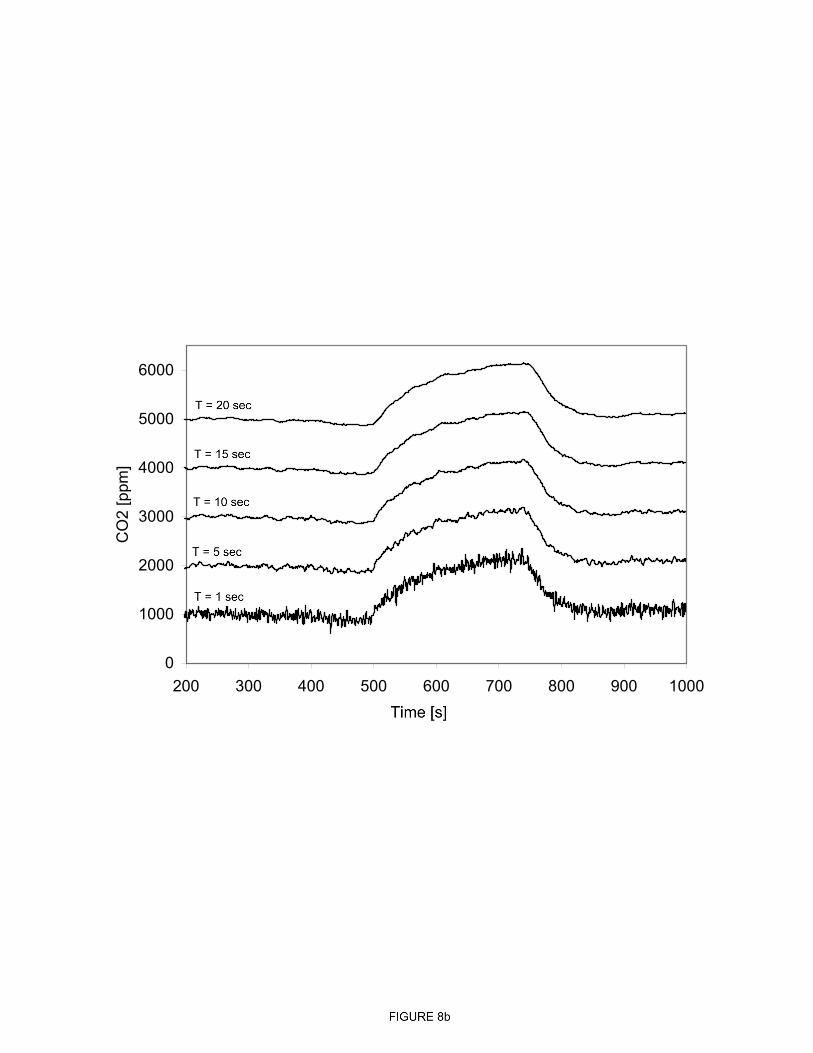
The second method, denoted as Method B, is to first perform a moving average on
the raw data points within the prescribed time history window prior to performing the
linear regression fit. For each data point within the time window, an average is
computed using the data point of interest and its previous nine data points. This method
smooths the fluctuations seen in the raw data. Figures 8a and 8b show CO and CO2
time series data, respectively, for HDPE pellets smoothed using a time window between
1 and 20 seconds. For illustration purposes, each curve is shifted upward by 15 and
1000 ppm for CO and CO2, respectively. This method works best when the natural
background fluctuations of the chemical species are small. Using a long averaging time
makes the sensor’s white noise smaller, thus possibly permitting the use of much lower
threshold rates than Method A. When the natural background fluctuations are resolved,
Final Manuscript submitted to the Fire Safety JournalChen et. al., Fire detection using smoke and gas sensors
10
there is no advantage in using a longer time window, since the thresholds cannot be
further reduced without causing false alarms. This method increases the required
computation and memory storage as compared to Method A.
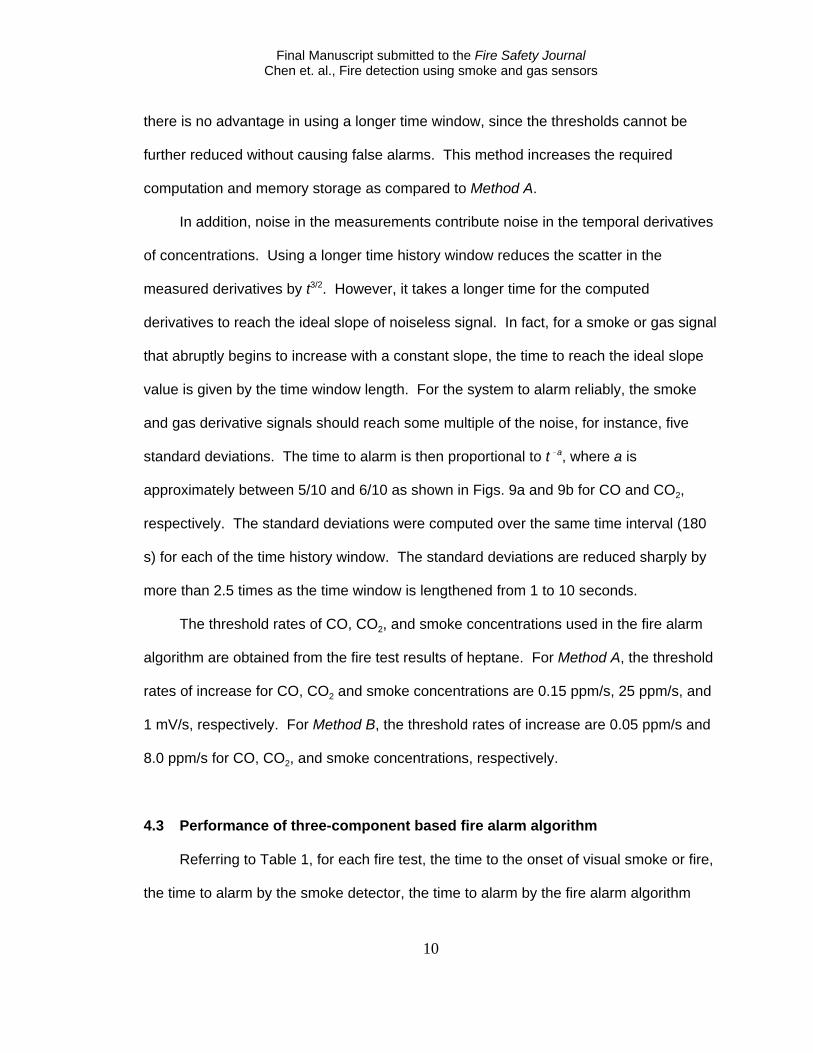
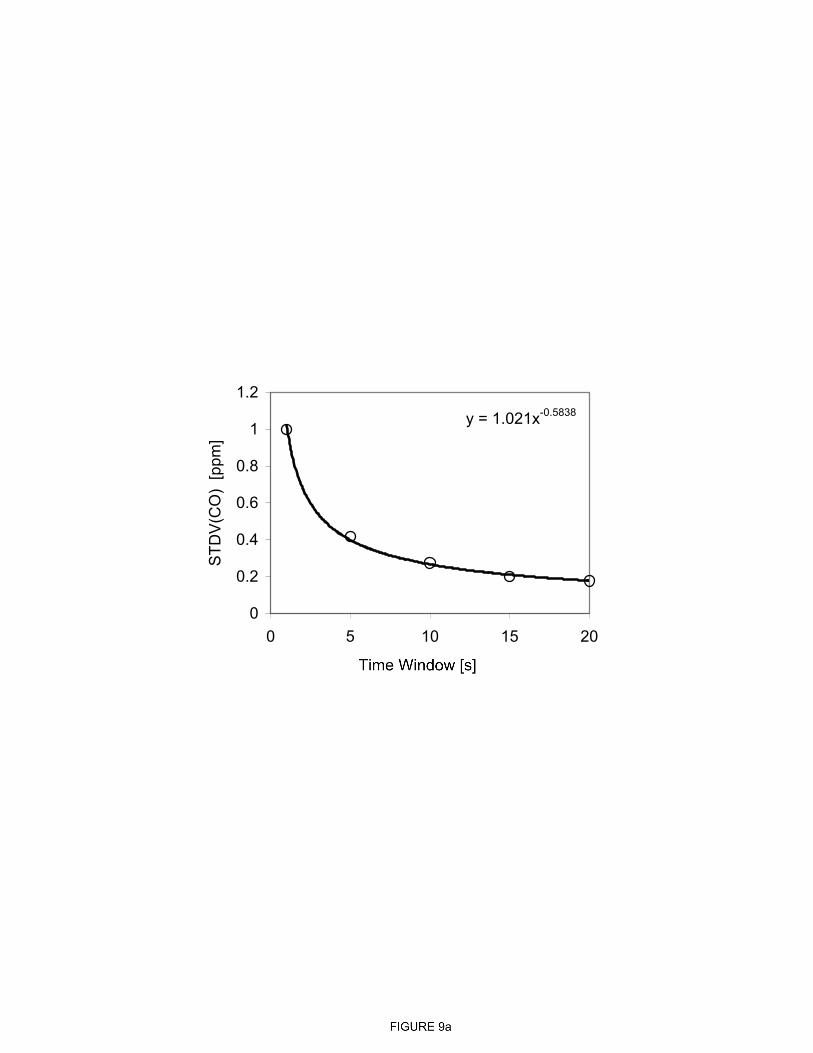
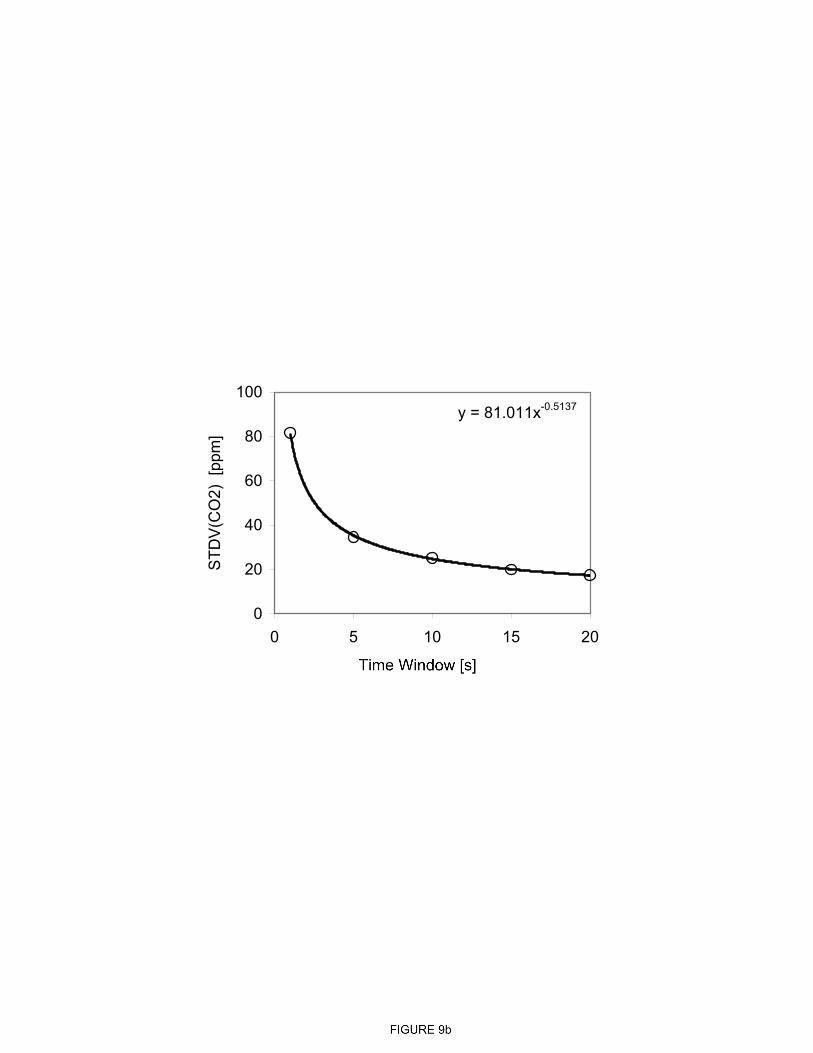
In addition, noise in the measurements contribute noise in the temporal derivatives
of concentrations. Using a longer time history window reduces the scatter in the
measured derivatives by t3/2. However, it takes a longer time for the computed
derivatives to reach the ideal slope of noiseless signal. In fact, for a smoke or gas signal
that abruptly begins to increase with a constant slope, the time to reach the ideal slope
value is given by the time window length. For the system to alarm reliably, the smoke
and gas derivative signals should reach some multiple of the noise, for instance, five
standard deviations. The time to alarm is then proportional to t !a, where a is
approximately between 5/10 and 6/10 as shown in Figs. 9a and 9b for CO and CO2,
respectively. The standard deviations were computed over the same time interval (180
s) for each of the time history window. The standard deviations are reduced sharply by
more than 2.5 times as the time window is lengthened from 1 to 10 seconds.
The threshold rates of CO, CO2, and smoke concentrations used in the fire alarm
algorithm are obtained from the fire test results of heptane. For Method A, the threshold
rates of increase for CO, CO2 and smoke concentrations are 0.15 ppm/s, 25 ppm/s, and
1 mV/s, respectively. For Method B, the threshold rates of increase are 0.05 ppm/s and
8.0 ppm/s for CO, CO2, and smoke concentrations, respectively.
4.3 Performance of three-component based fire alarm algorithm
Referring to Table 1, for each fire test, the time to the onset of visual smoke or fire,
the time to alarm by the smoke detector, the time to alarm by the fire alarm algorithm
Final Manuscript submitted to the Fire Safety JournalChen et. al., Fire detection using smoke and gas sensors
11
using Method A, and the time to alarm by the fire alarm algorithm using Method B are
recorded. The times for observed onset of fires were recorded for all experiments. All
reported times are referred to time equal zero when the data acquisition system starts
collecting sensor signals. A time window of 10 seconds is used for the fire alarm
algorithms.
Comparing fire alarm algorithms using Methods A and B, the times to alarm for the
combustible materials do not differ considerably for both methods, except for the green
canvas where it took 104 s longer for Method B to detect the presence of a fire. Both
methods are suitable for implementation in a fire alarm algorithm.
The possibility of the smoke sensor to fail to alarm when operating alone (using a
threshold method) is demonstrated by the four fire tests of heptane, methanol, PVC clad
wire, and mixed fabrics. Because of low level of smoke present, the smoke sensor did
not alarm in these tests. However, for the fire tests of toluene, HDPE beads, mixed
plastics, mixed fabrics, and green canvas, the smoke sensor did alarm. The times to
alarm by the smoke sensor can be as short as 9 s (toluene) and as long as 316 s
(HDPE) when compared to the observed onset of the fires. The smoke sensor does not
reliably and quickly detect the presence of fires when operating alone as a fire detection
system.
The fire alarm algorithms using Methods A and B alarmed in cases where the
smoke sensor did not even alarm, except for the fire test of methanol. Moreover, the fire
alarm algorithms took much shorter times to alarm in cases where the smoke detector
did alarm. For example, the fire test of toluene indicated that the smoke sensor detected
the fire at 59 s, the fire alarm algorithm detected it at 56 s, and the fire was visually
recorded at 50 s after the data acquisition started. In another example, the fire test of
Final Manuscript submitted to the Fire Safety JournalChen et. al., Fire detection using smoke and gas sensors
12
green canvas indicated that the smoke sensor detected the fire at 1633 s, the fire alarm
algorithm detected it at 1365 s, and the visual onset of fire was at 1395 s. Clearly, the
fire alarm algorithm that incorporates both gas sensors and smoke detector alarmed at a
time closer to the visual onset of the fire.
A fire alarm algorithm based on the detections of smoke, and CO or CO2
concentrations will be sufficient for the heptane and toluene fires as shown in Figs. 5
and 6, since all three measured components rise at about the same time. However, for
the fire test of HDPE in Fig. 7, a fire alarm algorithm must be based on the detections of
smoke, CO and CO2 concentrations in order to detect this fire on time. Certainly, a fire
alarm algorithm based solely on the detections of smoke and CO2 concentrations will
detect the fire at a much later time after the visual onset of the fire, since CO2
concentration rise at a much later time compared to smoke concentration. Moreover,
the smoke sensor alarmed 316 s after the visual onset of fire.
Neither the fire alarm algorithms nor the smoke detector operating alone detected
the methanol fire. No visible smoke was generated by this fire, so the smoke detector
did not show any rise in voltage. Thus, the fire alarm algorithm based on first detecting a
rate of increase of smoke exceeding a predetermined threshold rate and then checking
the rates of increase of CO and CO2 concentrations cannot detect this type of fire. That
is, a fire alarm algorithm based on [CO_Alarm + SMOKE_Alarm = 2] or [CO2_Alarm +
SMOKE_Alarm = 2] cannot detect the methanol fire. Note that [CO_Alarm = 1] indicates
that the rate of increase of CO concentration has exceeded its predetermined threshold
rate, and [CO_Alarm = 0] means the threshold rate has not been exceeded. However,
the time traces of CO and CO2 concentrations do indicate sharp rises. By modifying the
fire alarm algorithm to be [CO_Alarm + CO2_Alarm + SMOKE_Alarm $ 2], the methanol
Final Manuscript submitted to the Fire Safety JournalChen et. al., Fire detection using smoke and gas sensors
13
fire was actually detected at 248 s; that is 51 s after the visual indication of a fire (t = 197
s). An algorithm based on based on CO and CO2, that is [CO_Alarm + CO2_Alarm = 2],
will alarm promptly for the cases of Heptane and Toluene in which concentrations of CO
and CO2 rise at about the same time, but not for smoldering fires (e.g. HDPE).
4.4 Effects of nuisances on fire alarm algorithm
The effects of possible nuisances found in cargo compartments were used to
assess the robustness of the fire alarm algorithm. The nuisances included dry ice,
insecticide bomb, halon, and vapors of water, methanol, ethanol, acetone, and
ammonia.
Insecticide bomb, which uses an aerosol to dispense a thick cloud of insecticide, is
routinely used in aircraft cargo compartments on certain overseas flight to avoid
spreading agricultural pests. The bomb caused a large signal on the smoke detector,
but no noticeable rise in the CO and CO2 signals. On the contrary, dry ice generated a
rise in the CO2 signal, but no rise in the smoke or CO signals. These nuisance sources
caused no false alarm. However, the combination of dry ice and insecticide could
potentially generate a false alarm. The intentional release of an insecticide bomb in
flight is an unlikely scenario, but dry ice will be present in most flights for refrigeration
purposes.
Of all the vapors tested, a small interference between methanol and CO2 was
observed. High methanol concentrations could make the instrument susceptible to false
alarms, but this may reduce the real hazards associated with high concentrations of this
flammable vapor. In a scenario where methanol, ethanol, and acetone vapors are high
enough to trigger the smoke detector, and a fire is occurring at the same time, the
Final Manuscript submitted to the Fire Safety JournalChen et. al., Fire detection using smoke and gas sensors
14
algorithm would have detected the fire since CO2 concentrations would have risen due to
the fire.
More significant is the observation that the laser through-put drops dramatically as
a result of broad-band absorption by the halon mixture (halons 1301 and 1211). The
decrease in transmitted laser through halon vapor is so severe that CO and CO2
concentrations could not be measured. Because halon 1301 is used onboard aircraft to
suppress fires, it will be present after a fire is detected and the agent is released. The
ability of the fire sensor system to continue monitoring the cargo compartments after the
release of extinguishing agents could be compromised.
For each of the nuisance sources tested, there was no interference with both
smoke and trace gas. As a consequence, no false alarms were generated by any of
these sources released alone. The fire detection system with the alarm algorithm is
immune to these nuisance sources which could be found in-flight.
5. Summary
A fire sensor system based on the simultaneous detection CO, CO2, and smoke
concentrations, is demonstrated. The rates of increase of these three components are
used in the fire alarm algorithm to determine the presence of a fire. The algorithm
monitors the rate of increase of smoke level, and when this rate exceeds its threshold
rate, the rates of increase of CO and CO2 concentrations are checked. When either the
rate of increase of CO or CO2 concentration exceeds its threshold rate, a fire alarm is
initiated. The fire detection system was found to perform better than a smoke detector
operating alone. In cases where the smoke detector did not alarm, the algorithm was
able detect the fire. However, in cases where the smoke detector did alarm, the
Final Manuscript submitted to the Fire Safety JournalChen et. al., Fire detection using smoke and gas sensors
15
algorithm detected the fire in a much shorter time. The nuisance sources did not cause
the fire detection system to generate false alarms.
An advantage of the fire alarm algorithm is that the signal to noise ratio for the
temporal derivatives of measurements improves more rapidly with increasing time
window length than does the signal to noise ratio for the mean of data points within the
time window; this allows the alarm threshold to be set at a more sensitive value without
causing noise-generated false alarm. A second advantage is that the alarm point is
insensitive to constant offsets in the gas concentration measurements.
Although, the fire detection system was originally conceived to be deployed in
cargo compartments of aircraft, it can also be applied to buildings, ship compartments,
submarines, living compartments in space, and concealed cavities used for running
electrical wires and plumbing. Future work will focus on the improvement of the
minimum detection of CO and CO2 concentrations by using separate lasers for each
chemical species, and selecting stronger absorption lines where these two chemical
species do not overlap.
Acknowledgments
This research is supported by NASA Small Business Innovative Research (SBIR)
program under contract NAS3-01125, with Robert Anderson of NASA Glenn Research
Center as the technical monitor.
Final Manuscript submitted to the Fire Safety JournalChen et. al., Fire detection using smoke and gas sensors
16
Table 1: Fire Alarm Algorithm Performance
Case Material IgnitionMethod
Fire Type Visual[s]
Smoke[s]
Method A[s]
Method B[s]
1 Heptane Lighter Flaming 218 N/A 242 243
2 Toluene Lighter Flaming 50 59 56 52
3 Methanol Lighter Flaming 197 N/A N/A N/A
4 HDPE Beads Lighter Smoldering 310 616 320 327
5 PVC Clad Wire Pilot Smoldering 347 N/A 380 385
6 Mixed Plastics Coil + Pilot Flaming 310 474 322 328
7 Mixed Fabrics Coil + Pilot Smoldering 310 N/A 305 309
8 Mixed Fabrics Coil Smoldering 348 439 336 341
9 Green Canvas Coil Smoldering 1395 1633 1365 1469
10 Dry Ice N/A N/A N/A N/A N/A N/A
Final Manuscript submitted to the Fire Safety JournalChen et. al., Fire detection using smoke and gas sensors
17
References
[1] Blake, D. (2000), Aircraft Cargo Compartment Smoke Detector Alarm Incidents on
U.S.-Registered Aircraft, 1974-1999, DOT/FAA/AR-TN00/29.
[2] Blagojevich M., Petkovich D., and Simich, D. (2001), New Algorithm for Adaptive
Alarm Threshold in Fire Detection System, 12th International Conference on
Automatic Fire Detection.
[3] Milke, J. A. (1999), Using Multiple Sensors for Discriminating Fire Detection, Fire
Technol. 35:195-209.
[4] Gottuk D. T., Peatross M. J., Roby, R. J., and Beyler, C. L. (2002), Advanced Fire
Detection Using Multi-Signature Alarm Algorithms, Fire Safety Journal 37:381-394.
[5] Marman, D. H, Peltier, M. A., and Wong, J. Y. (1999), Fire and Smoke Detection
and Control System, US Patent No. 5,945,924.
[6] Rose-Pehrsson, S. L., Hart, S. J., Street, T. T., Tatem, P. A., Williams, F.,
Hammond, M. H, Gottuk, D. T., Wright, M. T. and Wong, J. Y. (2001), Real-Time
Probabilistic Neural Network Performance and Optimization for Fired Detection and
Nuisance Alarm Rejection, 12th International Conference on Automatic Fire
Detection.
[7] Herriott, D.R., et al. (1964), Off-Axis Paths in Spherical Mirror Interferometers,
Appl. Opt.3:523-526.
[8] Rothmann, L.S., Gamache, R.R., et al. (2001), J. Quant. Spectrosc. Radiat.
Transfer 48:469.
[9] Silver, J.A. (1992), Frequency Modulation Spectroscopy for Trace Species
Detection: Theory and Comparison, Appl. Opt. 31:707-717.
[10] Bomse, D.S., et al. (1992), Frequency Modulation Spectroscopy for Trace Species

Final Manuscript submitted to the Fire Safety JournalChen et. al., Fire detection using smoke and gas sensors
18
Detection: Experimental Comparison of Methods, Appl. Opt., vol. 31, 718-731.
[11] Chen, S.-J. (2006), Fire Alarm Algorithm Using Smoke and Gas Sensors, U.S.
Patent No. 7,142,105.
Final Manuscript submitted to the Fire Safety JournalChen et. al., Fire detection using smoke and gas sensors
19
Legends to Illustrations
Figure 1. Schematic of the fire testing facility.
Figure 2. Schematic of optical setup for diode laser-based detection of carbon dioxide andcarbon monoxide.
Figure 3. Absorption lines of CO and CO2 calculated from HITRAN database.
Figure 4. Decision tree of fire alarm algorithm. ROI denotes rate of increase.
Figure 5. Heptane combustion. Time histories of CO, CO2, smoke, and fire status.
Figure 6. Toluene combustion. Time histories of CO, CO2, smoke, and fire status.
Figure 7. HDPE beads combustion. Time histories of CO, CO2, smoke, and fire status.
Figure 8. Moving-averaged time histories of CO (a) and CO2 (b). Traces are offset forclarity. Bottom to top: time window of 1, 5, 10, 15, and 20 s. Longer windows reduce noisebut introduce a delay in the response, most notable at the CO peak in Fig. 8a.
Figure 9. Standard deviations versus time window of moving-average for CO (a) and CO2(b)

PoolFire
Filter
Fire DetectionSystem
Pump
1.4
42.2
FlowController
SmokeDetector
LaserDiode
BeamSplitterFiber
Optic
GRINLens
GRINLens
Reference Cell
ReferenceDetector
MeasurementDetector
MirrorMirror
Plano/Convex Herriott CellPrism
PlanarMirror
ConvexMirror
GasInlet
GasOutlet
CO2
CO
Wavenumber (cm-1)
Abso
rban
ce
PoolFire
Filter
Fire DetectionSystem
Pump
1.4
42.2
FlowController
SmokeDetector
ROISMOKEExceeds
Limit
ROICOExceeds
Limit
ROICO2Exceeds
Limit
SMOKE_Alarm = 1
SMOKE_Alarm = 0
CO_Alarm = 1
CO_Alarm = 0
CO2_Alarm = 1
CO2_Alarm = 0
CO_Alarm+ CO2_Alarm
≥ 1
Fire
No Fire
NextData Point
Yes
No
Yes
No
Yes
No
No
Yes
CO(PPM)
0 100 200 300 400 500 600 700-10
0
10CO2(PPM)
0 100 200 300 400 500 600 700
1000
2000
3000
SMOKE(V)
0 100 200 300 400 500 600 7003
4
HEPTANE
FIRESTATUS
0 100 200 300 400 500 600 7000
1
2
3
4
5
CO(PPM)
0 100 200 3000
50
100
150
200
FIRESTATUS
0 100 200 3000
1
2
3
4
5
SMOKE(V)
0 100 200 300
4
6
8
10
CO2(PPM)
0 100 200 300
1000
2000
3000
4000
5000
TOLUENE
CO(PPM)
0 100 200 300 400 500 600 700 800 900 1000-10
0
10
20SMOKE(V)
0 100 200 300 400 500 600 700 800 900 10003
4
5
6
FIRESTATUS
0 100 200 300 400 500 600 700 800 900 10000
1
2
3
4
5
CO2(PPM)
0 100 200 300 400 500 600 700 800 900 1000
1000
2000
HDPE
-10
10
30
50
70
90
200 300 400 500 600 700 800 900 1000
Time [sec]
CO
[ppm
]
0
1000
2000
3000
4000
5000
6000
200 300 400 500 600 700 800 900 1000
Time [sec]
CO
2 [p
pm]
y = 1.021x-0.5838
0
0.2
0.4
0.6
0.8
1
1.2
0 5 10 15 20
Time Window [sec]
STD
V(C
O)
[ppm
]
y = 81.011x-0.5137
0
20
40
60
80
100
0 5 10 15 20
Time Window [sec]
STD
V(C
O2)
[pp
m]