fintech market insights india - frost & sullivan increase in monthly ... significant market...
TRANSCRIPT
FinTech Market Insights – India With investments of over $1.9B from 2015-2017, Indian FinTech industry is booming and is poised for
an exponential growth enabled by steady economic growth and supportive government incentives

2
Executive Summary

3
Disruptive Trends in 2017
Disruptive Themes
1
An increased pace of investment and innovation will spur mainstream adoption of blockchain to
replace traditional services spanning transmission and exchange of digital identities and assets.
Regulatory frameworks are being more aggressively defined to drive commercial adoption.
2
Community finance and P2P Lending is fast growing to be as big as the conventional bank
lending. The average annual market rate for such offline and unsecured loans is approximately
30%, which is almost 2–2.5 times the rate of an average personal loan charged by banks and
other lending platforms.
3
With increased adoption of smartphones and access to internet, Financial service providers will
more aggressively adopt biometric and cybersecurity solutions for services authentication, credit
profiling and customer experience enhancement
4
Open Banking will see a rise where 3rd party permission based apps can access your banking
data to recommend real-time curated offers and offer frictionless payment and reward redemptions
process.
5
With wide-spread adoption of adopting internet usage as a habit, mobile-only and digital-only
services will grow. This will enable start-up and incumbents to adopt new business models and
partnerships to maintain relevance in the new FinTech ecosystem.

4
Key Highlights of 2016 and 2017
Overview
1
Demonetization – Demonetization triggered shift from a traditional cash-driven economy to a
cashless one. Post Demonetization, over 1.1 Million POS terminals have been setup and a
surge in adoption of mobile wallets and debit cards for merchant payments.
2
Supportive Government Initiatives – Government has announced multiple proactive policies
like tax rebates for merchants accepting more than 50% as electronic payment, withdrawal od
surcharge for card payments etc. in order to reduce use of cash for day-today transactions.
3
Friction-less Payment Technology – Secure and easy to use Unified Payment Interface
applications such as BHIM, Phone Pe, SBI Pay etc. has found strong favor among consumers.
Since its launch, there has been a growth of over 100x in usage and over 1000x in transactions
value.
4
Growing Industry Investments – There is an upsurge in investment attention by established
incumbents and VC firms. From 2015 onwards the FinTech space in India has had investments
over $1.9 Billion. Funding momentum is back to 2015 peaks after experiencing a drop in 2016.
5
Aadhaar Enablement - The Reserve Bank of India has regulated the usage of Aadhaar based
biometric authentication. This will allow faster roll-out and enablement of KYC dependent
financial services at a lower overall transaction costs for customers.

5
Industry Overview

6
Industry Overview
What is FinTech
Financial Services Technology or commonly referenced as ‘FinTech’ is the application of new-age
technologies to deliver traditional financial services such as Consumer Banking, Payments, Lending,
Insurance, Remittances and wealth management.
In last few years, the FinTech technology has significantly disrupted the way traditional financial services
are perceived and delivered due to emergence of innovative startups and supportive government
incentives. In-order to remain competitive in this extremely fast and evolving landscape, established
incumbents are also aggressively exploring partnership and acquisitions strategy in order to better
leverage existing customer data to improve customer engagement and setup new range of products and
services.
Global FinTech software services market is expected to reach $45 Billion by 2020* and India is expected
to play a crucial role in sustaining this growth momentum. Buoyed by the continued investments and
supportive government regulatory frameworks, India FinTech software market is estimated to become
$2.4 Billion by 2020* from about $1.2 Billion in 2016. Future growth in India will not only be led by
innovation alone, but through collaboration between FinTech service providers and traditional banking and
lending organizations to design and deliver solutions for under catered non-digitized market in India.
* Source: NASSCOM, Press Releases
7
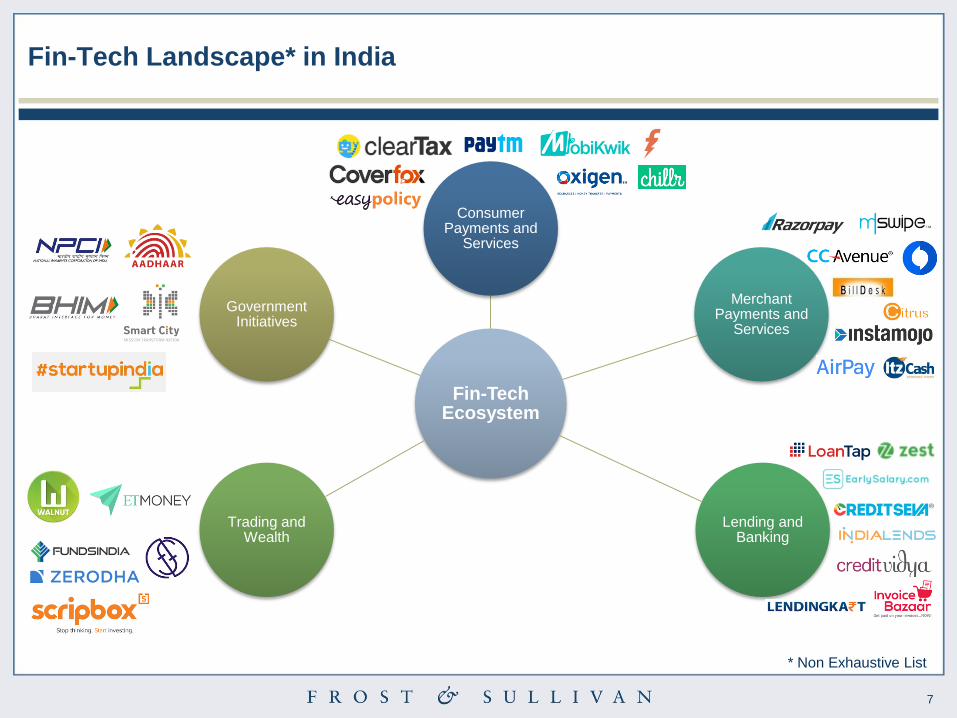
Fin-Tech Landscape* in India
Fin-Tech Ecosystem
Consumer Payments and
Services
Merchant Payments and
Services
Lending and Banking
Trading and Wealth
Government Initiatives
* Non Exhaustive List

8
Drivers and Restraints for FinTech in India
Increasing smartphone
penetration
Affordable
data access
Supporting
Government Incentives Aggressive
Investor Funding
Growing Financial
Inclusion
Low awareness
among consumers
Low trust on digital
Financial transactions
Complex Regulatory
Guidelines
Limited ecosystem
collaboration
Fragmented
customer needs

9
Industry Snapshot
Population
1.3 BILLION
Number of Mobile
Connections
940 Million
Number of
Smartphone Users
300 Million
Number of
Internet Users
432 Million
Number of Bank
Accounts
650 Million
Number of Active
Debit Cards
793 Million
Number of Active
Credit Cards
31.4 Million
Mobile Banking
Transactions
116 Million
Number of Monthly Mobile
Wallets Transactions
222 Million
Number of
POS
2.7 Million
GDP per
Capita
1, 710 USD
Number of
Households
250 Million
Source: World Bank, Reserve Bank of India, COAI, Press Releases
10
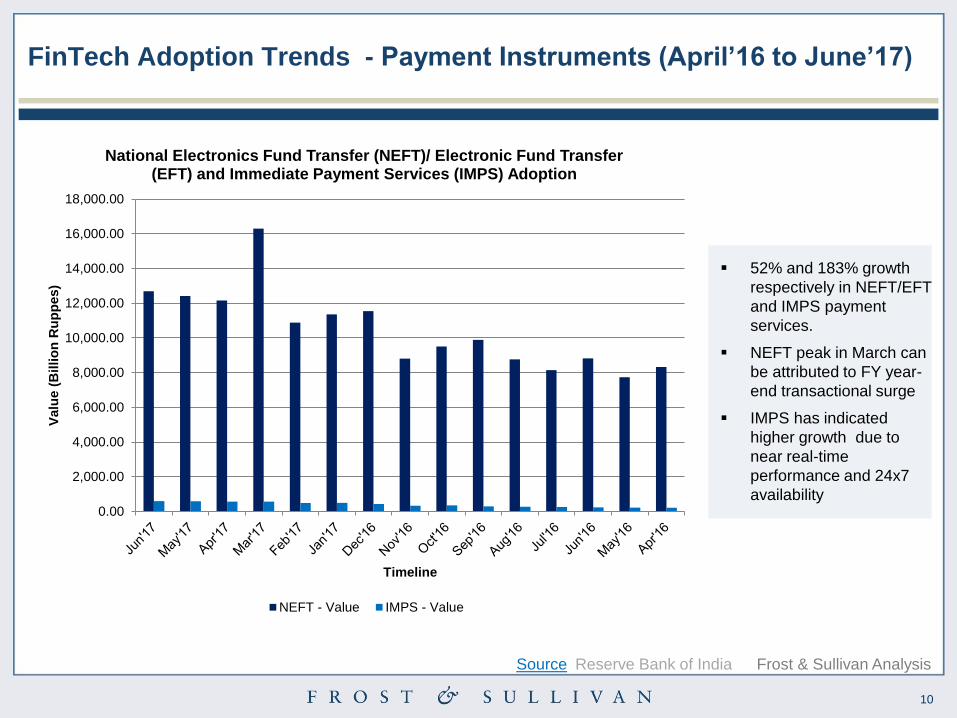
FinTech Adoption Trends - Payment Instruments (April’16 to June’17)
0.00
2,000.00
4,000.00
6,000.00
8,000.00
10,000.00
12,000.00
14,000.00
16,000.00
18,000.00
Valu
e (
Billio
n R
up
pes)
Timeline
National Electronics Fund Transfer (NEFT)/ Electronic Fund Transfer (EFT) and Immediate Payment Services (IMPS) Adoption
NEFT - Value IMPS - Value
52% and 183% growth
respectively in NEFT/EFT
and IMPS payment
services.
NEFT peak in March can
be attributed to FY year-
end transactional surge
IMPS has indicated
higher growth due to
near real-time
performance and 24x7
availability
Source Reserve Bank of India Frost & Sullivan Analysis

11
FinTech Adoption Trends - Mobile Banking (April’16 to June’17)
Source Reserve Bank of India Frost & Sullivan Analysis
0
20
40
60
80
100
120
140
0.00
500.00
1,000.00
1,500.00
2,000.00
2,500.00
Vo
lum
e (
Millio
n T
ran
sacti
on
s)
Valu
e (
Billio
n R
up
pes)
Timeline
Mobile Banking Adoption
M-Banking - Value M-Banking - Volume
140 % CAGR in m-
banking transactions,
primarily driven by
affordable access to data
138% increase in monthly
m-banking transactions
M-banking has been able
to sustain demonetization
catalyzed growth
12
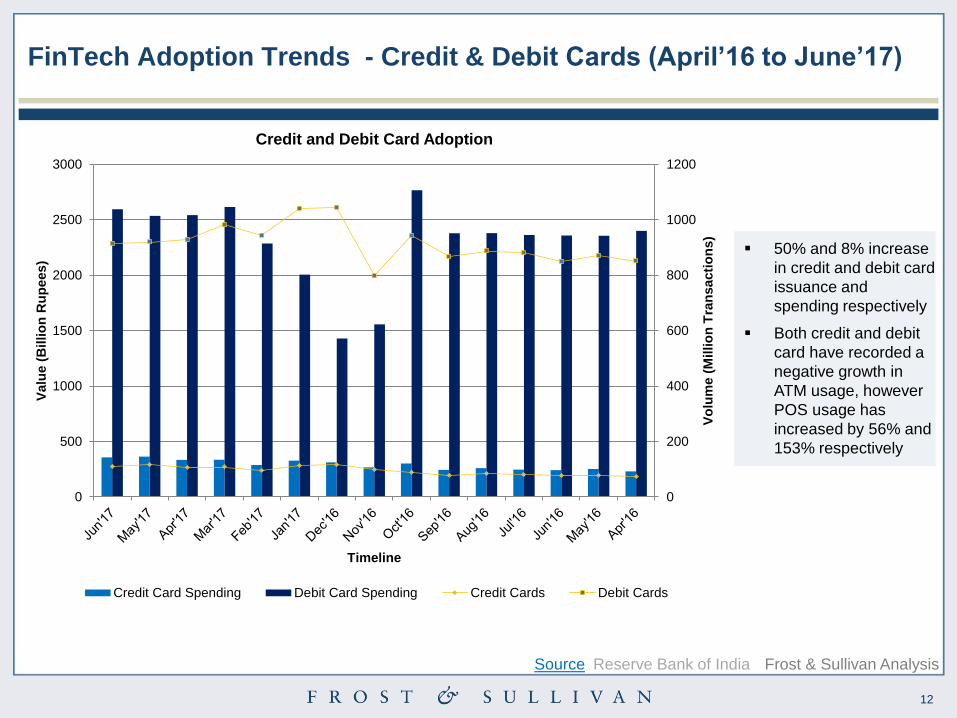
FinTech Adoption Trends - Credit & Debit Cards (April’16 to June’17)
Source Reserve Bank of India Frost & Sullivan Analysis
0
200
400
600
800
1000
1200
0
500
1000
1500
2000
2500
3000
Vo
lum
e (
Millio
n T
ran
sacti
on
s)
Valu
e (
Billio
n R
up
ees)
Timeline
Credit and Debit Card Adoption
Credit Card Spending Debit Card Spending Credit Cards Debit Cards
50% and 8% increase
in credit and debit card
issuance and
spending respectively
Both credit and debit
card have recorded a
negative growth in
ATM usage, however
POS usage has
increased by 56% and
153% respectively

13
FinTech Adoption Trends - Mobile Wallets (April’16 to June’17)
Source Reserve Bank of India Frost & Sullivan Analysis
0
50
100
150
200
250
300
350
0
10
20
30
40
50
60
70
80
90
Vo
lum
e (
Millio
ns T
ran
sacti
on
s)
Valu
e (
Billio
n R
up
pes)
Timeline
M-Wallet Adoption
M-Wallet - Value M-Wallet - Volume
At peak, accomplished
a staggering 558%
increase in M-Wallet
transacts led by
demonization initiative
May’17 recorded a drop
in mobile wallet
transactions however
there was an increase
in average transaction
value.
In last 2 month, m-
wallet transactions
have dropped by nearly
100 million

14
FinTech Adoption Trends - Prepaid Instruments (April’16 to June’17)
Source Reserve Bank of India Frost & Sullivan Analysis
269% growth in
transactions using Pre
Paid Instruments. During
the month of Mar and Apr ,
400% growth was
recorded.
Despite the exponential
growth in transactions, in
terms of value a peak of
135% was achieved in
Jun’17.
0
50
100
150
200
250
300
350
400
0
20
40
60
80
100
120
Vo
lum
e (
Millio
n T
ran
sacti
on
s)
Valu
e (
Billio
n R
up
ees)
Prepaid Instruments Adoption
PPI - Value PPI - Volume

15
FinTech Adoption Trends – Point Of Sale Terminals (April’16 to
June’17)
Source Reserve Bank of India Frost & Sullivan Analysis
0.00
500,000.00
1,000,000.00
1,500,000.00
2,000,000.00
2,500,000.00
3,000,000.00
Vo
lum
e (
Nu
mb
er
of
PO
S u
nit
s)
Timeline
Number of POS 98% increase in number
of POS terminals in last
15 months. This was
driven by Government’s
thrust towards cash-less
India
Nearly equal split of
transaction between
debit and credit card
spending

16
FinTech Adoption Trends – Automated Teller Machine (ATM) (April’16
to June’17)
Source Reserve Bank of India Frost & Sullivan Analysis
208,000.00
210,000.00
212,000.00
214,000.00
216,000.00
218,000.00
220,000.00
222,000.00
224,000.00
Vo
lum
e (
Nu
mb
er
of
AT
MS
)
Timeline
Number of ATMS
Only 5% increase in
number of ATM in
operation in last 15
months
There has been a
negative growth in usage
of debit and credit cards
at ATMs – This can be
attributed to easy
availability of POS
terminals for all merchant
services.

17
FinTech Adoption Trends - Unified Payment Interface (UPI) (August’16
to June’17)
National Payments Centre of India Frost & Sullivan Analysis
-
5,000
10,000
15,000
20,000
25,000
30,000
35,000
Jun'17 May'17 Apr'17 Mar'17 Feb'17 Jan'17 Dec'16 Nov'16 Oct'16 Sep'16 Aug'16
Valu
e (
Millio
n R
up
ees)
Timeline
UPI Adoption
UPI- Value
Source
Since the launch of UPI
platform in Aug’16 ,it has
seen more than 100x
increase in usage and
1000x increase in value
transacted.
Government enabled
BHIM has the most
significant market share,
followed by Chillr and
PhonePe

18
FinTech Adoption Across Key Industry Enablers – Mobile Wallets:
PayTM
122
230
0
50
100
150
200
250
Jan'16 Jun'17
Nu
mb
er
of
Users
User Adoption
89%
80 Million Monthly Active Users in Dec’16
106 Million Wallets with money or saved
cards
84 Rupees Average Balance per wallet
Source Company Website, Press Releases
19
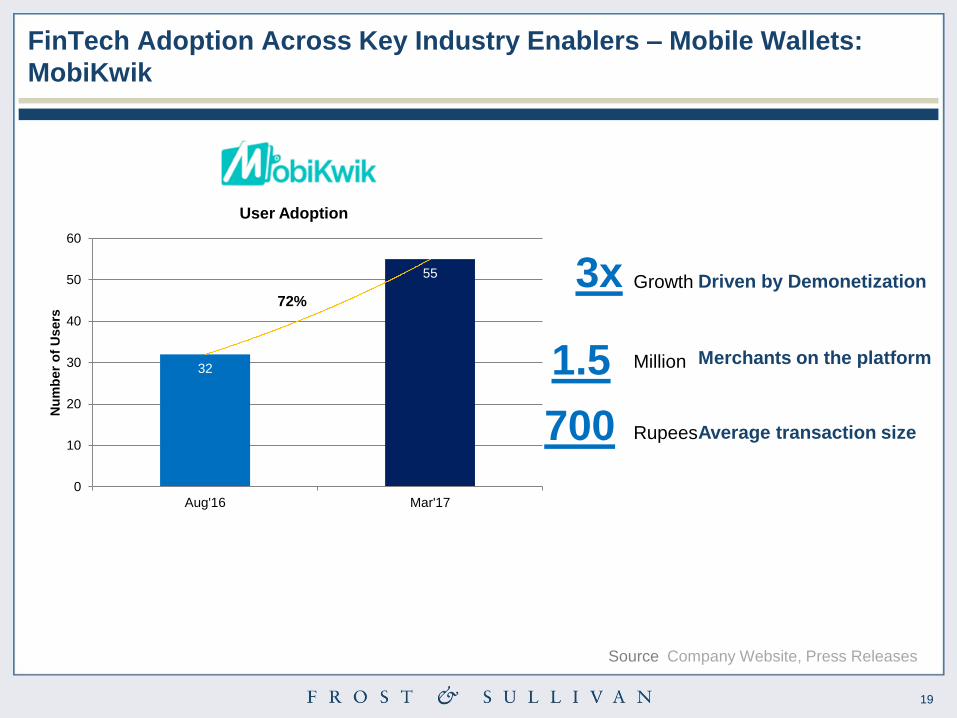
FinTech Adoption Across Key Industry Enablers – Mobile Wallets:
MobiKwik
32
55
0
10
20
30
40
50
60
Aug'16 Mar'17
Nu
mb
er
of
Users
User Adoption
72%
700 Rupees Average transaction size
3x Growth Driven by Demonetization
1.5 Million Merchants on the platform
Source Company Website, Press Releases
20
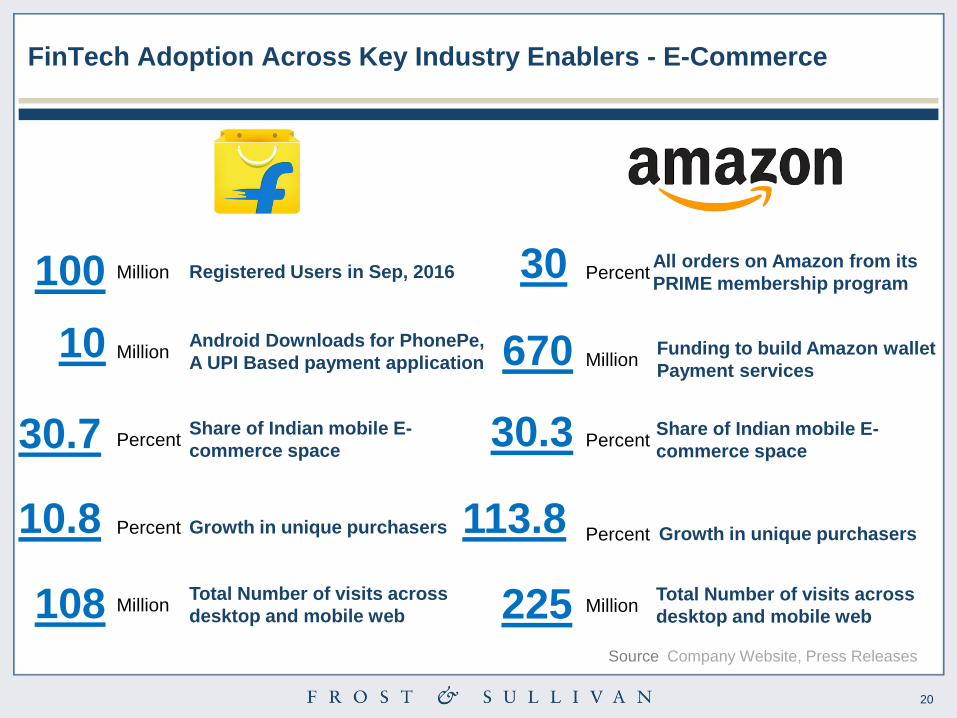
FinTech Adoption Across Key Industry Enablers - E-Commerce
10 Million Android Downloads for PhonePe,
A UPI Based payment application
100 Million Registered Users in Sep, 2016
30.7 Percent Share of Indian mobile E-
commerce space
10.8 Percent Growth in unique purchasers
108 Million Total Number of visits across
desktop and mobile web
30 Percent All orders on Amazon from its
PRIME membership program
30.3 Percent Share of Indian mobile E-
commerce space
670 Million Funding to build Amazon wallet
Payment services
225 Million Total Number of visits across
desktop and mobile web
113.8 Percent Growth in unique purchasers
Source Company Website, Press Releases

21
FinTech Adoption Across Key Industry Enablers – Banking: SBI
40.1
49.3
0
10
20
30
40
50
60
Sep'16 Jun'17
Vo
lum
e (
Millio
n)
Number of Debit Cards
212.2
261.7
0
50
100
150
200
250
300
Sep'16 Jun'17
Vo
lum
e (
Millio
ns)
Number of Credit Cards
693.1
1066
0
200
400
600
800
1000
1200
Sep'16 Jun'17
Valu
e (
Rs B
illio
n)
Debit Card Spending*
30.76
60.4
0
10
20
30
40
50
60
70
Sep'16 Jun'17
Valu
e (
Rs B
illio
n)
Credit Card Spending*
23% 23%
54%
96%
Source * Spending only refers to POS and ATM usage
Reserve Bank of India

22
FinTech Adoption Across Key Industry Enablers – Banking: HDFC
24.5
24.3
24.2
24.25
24.3
24.35
24.4
24.45
24.5
24.55
Sep'16 Jun'17
Vo
lum
e (
Millio
n)
Number of Debit Cards
201
191
185
190
195
200
205
Sep'16 Jun'17
Valu
e (
Billio
n)
Debit Card Spending*
8.11
9.03
7.5
8
8.5
9
9.5
Sep'16 Jun'17
Vo
lum
e (
Millio
n)
Number of Credit Cards
71.8
101.7
0
20
40
60
80
100
120
Sep'16 Jun'17
Valu
e (
Billio
n)
Credit Card Spending*
-1%
-5%
11%
42%
Source * Spending only refers to POS and ATM usage
Reserve Bank of India

23
Adoption Across Key Industry Enablers – Banking: ICICI
35.14
37.5
33
34
35
36
37
38
Sep'16 Jun'17
Vo
lulm
e (
Milio
n)
Number of Debit Cards
3.9
4.3
3.7
3.8
3.9
4
4.1
4.2
4.3
4.4
Sep'16 Jun'17
Vo
lum
e (
Millio
n)
Number of Credit Cards
189.5
186.8
185
186
187
188
189
190
Sep'16 Jun'17
Valu
e (
Billio
n R
s)
Debit Card Spending*
26.9
39.8
0
10
20
30
40
50
Sep'16 Jun'17
Valu
e (
Billio
n R
s)
Credit Card Spending*
Source
10%
48% -1%
7%
* Spending only refers to POS and ATM usage Reserve Bank of India

24
Thank You