finolex industries limited investor … · contents disclaimer: no part of this presentation is to...
TRANSCRIPT

FINOLEX INDUSTRIES LIMITED
INVESTOR PRESENTATIONJUNE 2016
Contents
Disclaimer: No part of this presentation is to be circulated, quoted, or reproduced for any distribution without prior written approval from Finolex Industries Limited, Chinchwad, Pune-411 019, India. Certain part of this presentation describing estimates,objectives and projections may be a “forward looking statement”within the meaning of applicable laws and regulations. Actual results might differ materially from those either expressed or implied.
Government Policies 17Overview 3
Milestones 4
Business Segments 5
Products 6
Manufacturing Plants 7
Pan India Reach 9
Value Chain 13
Business Model 14
Key Strategies 15
Union Budget Highlights 2016-17 16
Branding 19
Balance Sheet 21
Profit and Loss Account 22
Q4 & FY16 Results Summary 24
Green Initiatives 31
Corporate Social Responsibility (CSR) 32
Accolades and awards 33
Shareholding Pattern 34
Financial Highlights 10
Segmental – Profit and Loss 23
2
Key Performance Indicators 11
Quarterly - Profit and Loss 29
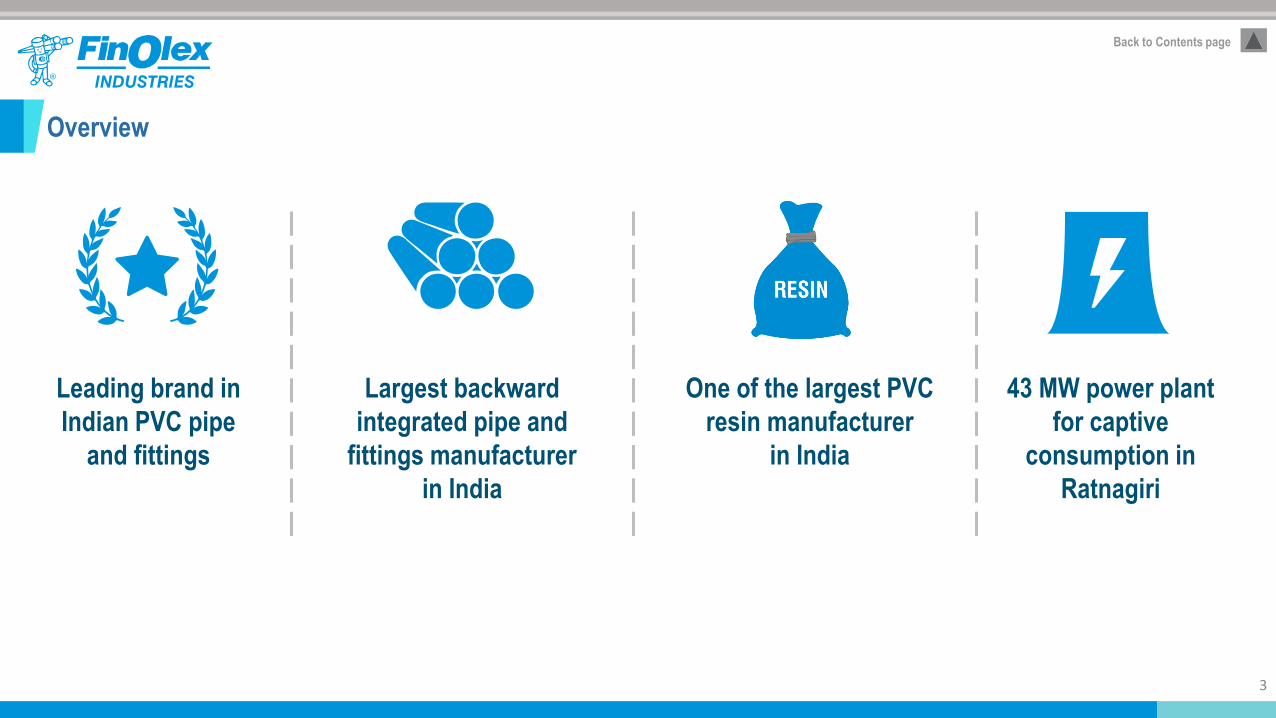
Overview
Leading brand in
Indian PVC pipe
and fittings
One of the largest PVC
resin manufacturer
in India
Largest backward
integrated pipe and
fittings manufacturer
in India
43 MW power plant
for captive
consumption in
Ratnagiri
3
Back to Contents page
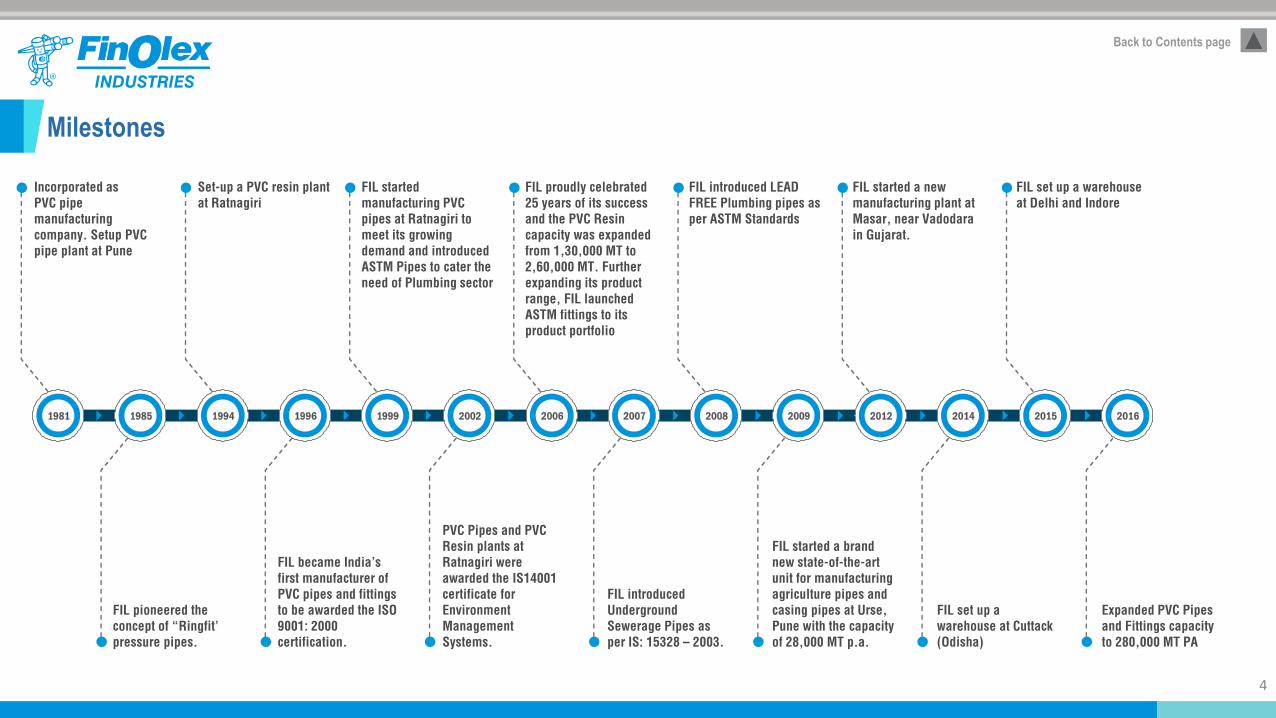
Milestones
4
Back to Contents page
1981 1985 1994 1996 1999 2002 2006 2007 2008 2009 2012 2014 2015 2016
Incorporated as
PVC pipe
manufacturing
company. Setup PVC
pipe plant at Pune
Set-up a PVC resin plant
at Ratnagiri
FIL started
manufacturing PVC
pipes at Ratnagiri to
meet its growing
demand and introduced
ASTM Pipes to cater the
need of Plumbing sector
FIL proudly celebrated
25 years of its success
and the PVC Resin
capacity was expanded
from 1,30,000 MT to
2,60,000 MT. Further
expanding its product
range, FIL launched
ASTM fittings to its
product portfolio
FIL introduced LEAD
FREE Plumbing pipes as
per ASTM Standards
FIL started a new
manufacturing plant at
Masar, near Vadodara
in Gujarat.
FIL set up a warehouse
at Delhi and Indore
FIL pioneered the
concept of “Ringfit’
pressure pipes.
FIL became India’s
first manufacturer of
PVC pipes and fittings
to be awarded the ISO
9001: 2000
certification.
PVC Pipes and PVC
Resin plants at
Ratnagiri were
awarded the IS14001
certificate for
Environment
Management
Systems.
FIL introduced
Underground
Sewerage Pipes as
per IS: 15328 – 2003.
FIL started a brand
new state-of-the-art
unit for manufacturing
agriculture pipes and
casing pipes at Urse,
Pune with the capacity
of 28,000 MT p.a.
FIL set up a
warehouse at Cuttack
(Odisha)
Expanded PVC Pipes
and Fittings capacity
to 280,000 MT PA
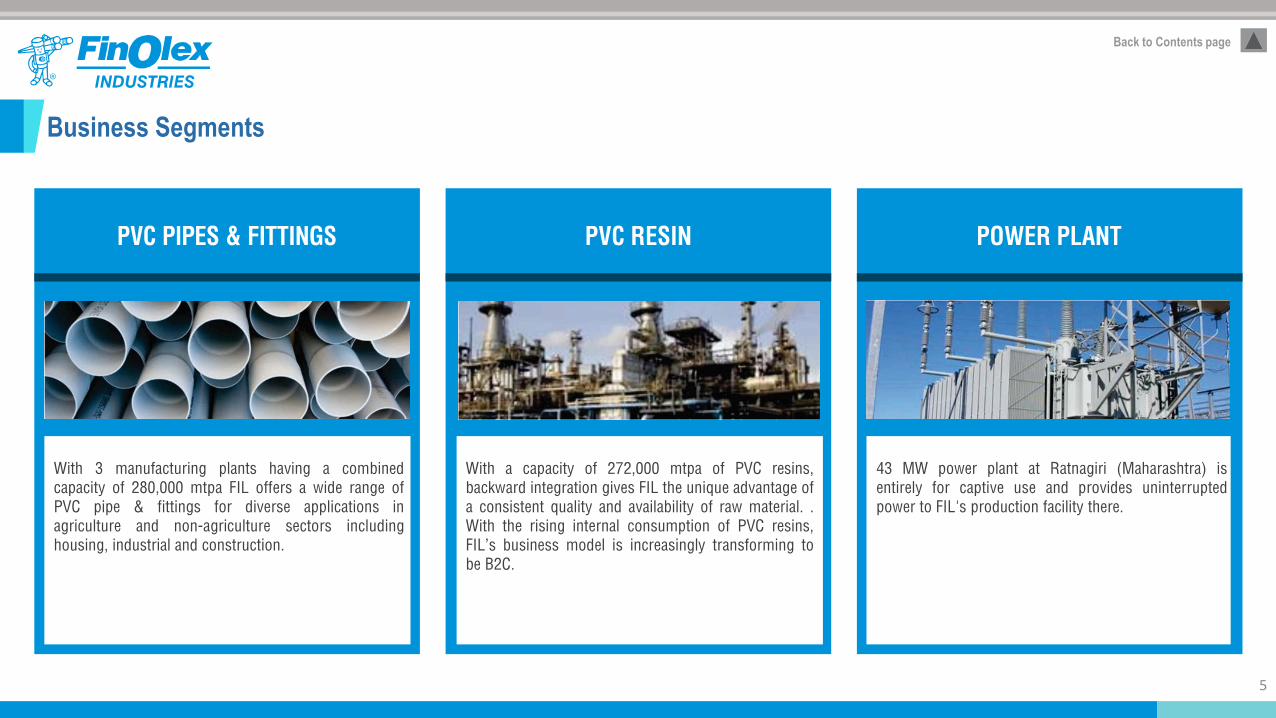
Business Segments
With 3 manufacturing plants having a combined
capacity of 280,000 mtpa FIL offers a wide range of
PVC pipe & fittings for diverse applications in
agriculture and non-agriculture sectors including
housing, industrial and construction.
With a capacity of 272,000 mtpa of PVC resins,
backward integration gives FIL the unique advantage of
a consistent quality and availability of raw material. .
With the rising internal consumption of PVC resins,
FIL’s business model is increasingly transforming to
be B2C.
43 MW power plant at Ratnagiri (Maharashtra) is
entirely for captive use and provides uninterrupted
power to FIL's production facility there.
5
Back to Contents page
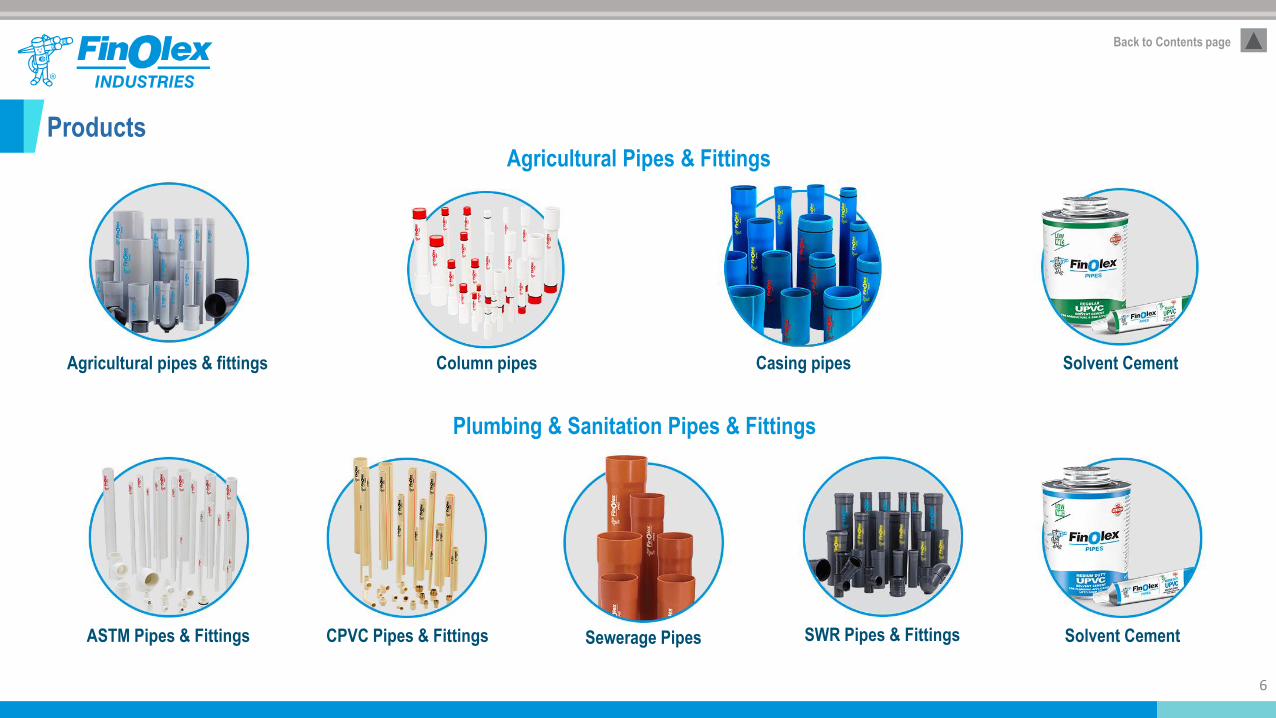
ProductsAgricultural Pipes & Fittings
Agricultural pipes & fittings Column pipes Casing pipes Solvent Cement
Plumbing & Sanitation Pipes & Fittings
ASTM Pipes & Fittings CPVC Pipes & Fittings Sewerage Pipes SWR Pipes & Fittings Solvent Cement
6
Back to Contents page
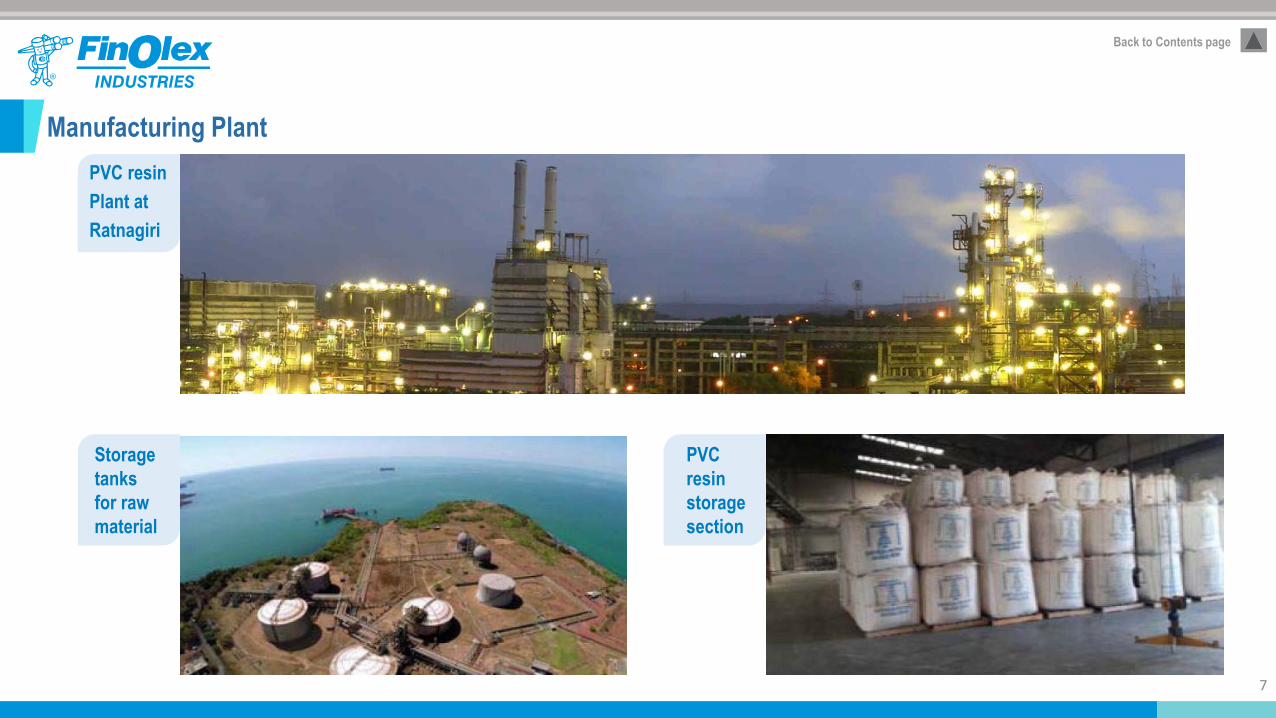
Manufacturing Plant
Storage
tanks
for raw
material
PVC resin
Plant at
Ratnagiri
7
Back to Contents page
PVC
resin
storage
section
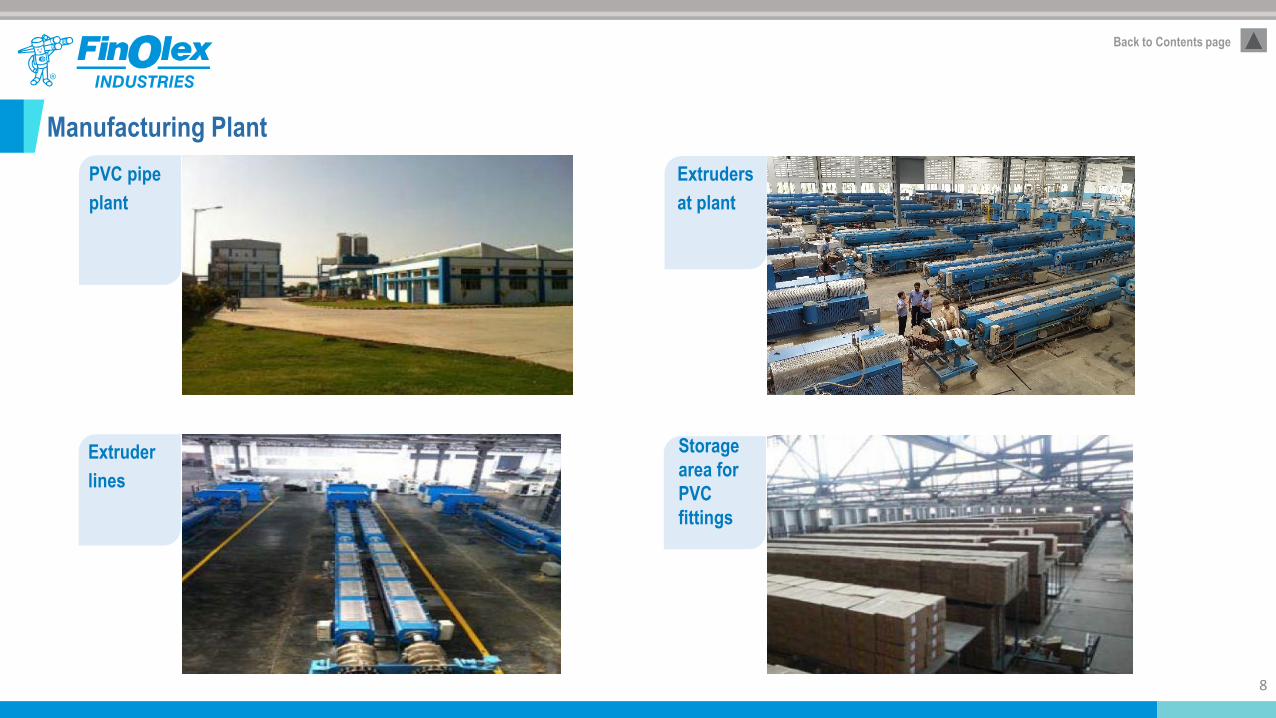
Manufacturing Plant
PVC pipe
plant
Extruders
at plant
Extruder
lines
Storage
area for
PVC
fittings
8
Back to Contents page
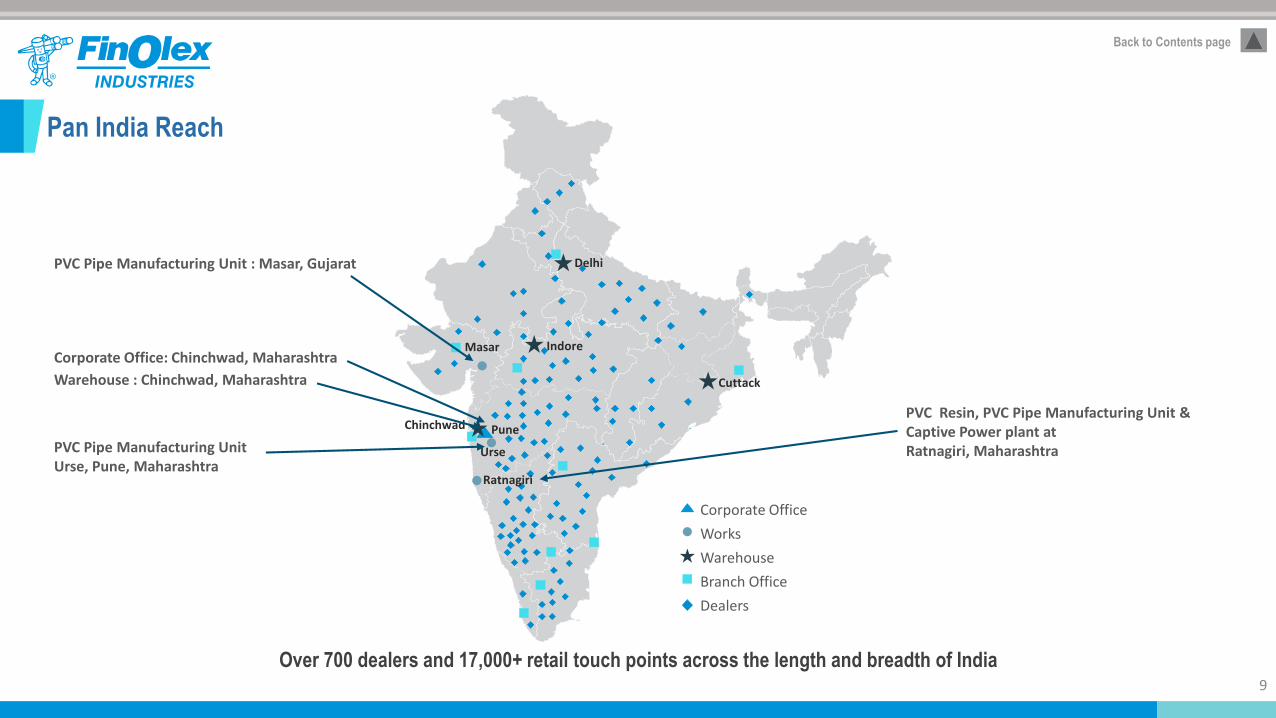
Pan India Reach
Over 700 dealers and 17,000+ retail touch points across the length and breadth of India9
Back to Contents page
Corporate Office
Works
Warehouse
Branch Office
Dealers
Delhi
Masar Indore
Urse
PuneChinchwad
Cuttack
Ratnagiri
PVC Pipe Manufacturing Unit : Masar, Gujarat
PVC Pipe Manufacturing UnitUrse, Pune, Maharashtra
Corporate Office: Chinchwad, Maharashtra
PVC Resin, PVC Pipe Manufacturing Unit & Captive Power plant atRatnagiri, Maharashtra
Warehouse : Chinchwad, Maharashtra
FY11 FY12 FY13 FY14 FY15 FY16
12
9,3
24
14
0,3
68
16
4,0
18
16
5,9
98
17
3,8
84
19
4,2
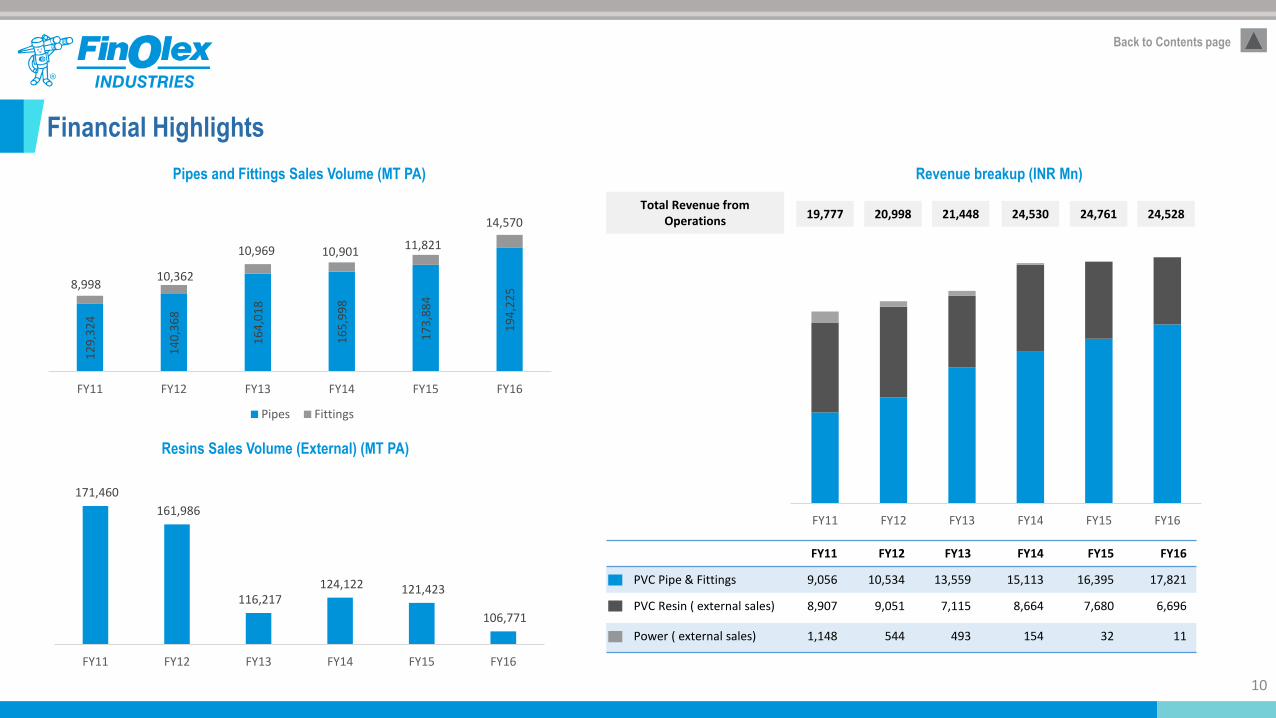
258,998
10,362
10,969 10,90111,821
14,570
FY11 FY12 FY13 FY14 FY15 FY16
Pipes Fittings
Financial Highlights
171,460
161,986
116,217 124,122 121,423
106,771
FY11 FY12 FY13 FY14 FY15 FY16
Revenue breakup (INR Mn)
24,76124,53021,44820,99819,777
Pipes and Fittings Sales Volume (MT PA)
Resins Sales Volume (External) (MT PA)
FY11 FY12 FY13 FY14 FY15 FY16
PVC Pipe & Fittings 9,056 10,534 13,559 15,113 16,395 17,821
PVC Resin ( external sales) 8,907 9,051 7,115 8,664 7,680 6,696
Power ( external sales) 1,148 544 493 154 32 11
Total Revenue from Operations
10
Back to Contents page
24,528
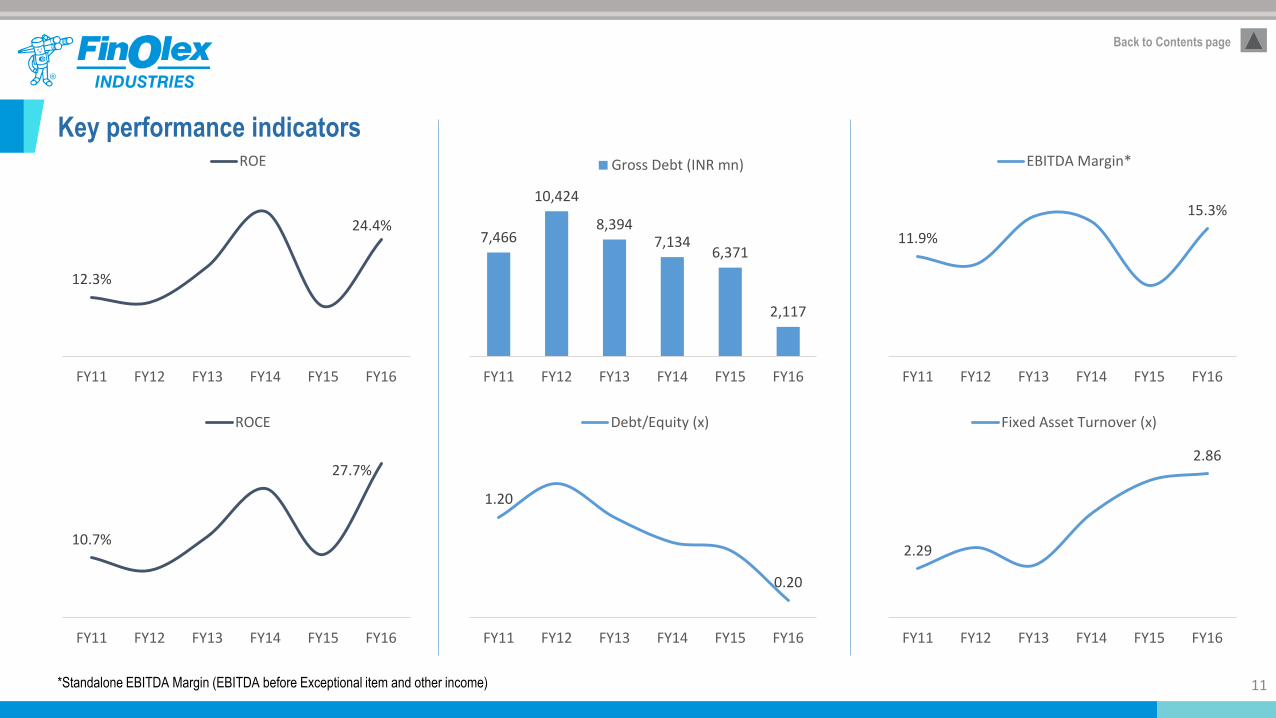
Key performance indicators
11
Back to Contents page
12.3%
24.4%
FY11 FY12 FY13 FY14 FY15 FY16
ROE
11.9%
15.3%
FY11 FY12 FY13 FY14 FY15 FY16
EBITDA Margin*
1.20
0.20
FY11 FY12 FY13 FY14 FY15 FY16
Debt/Equity (x)
2.29
2.86
FY11 FY12 FY13 FY14 FY15 FY16
Fixed Asset Turnover (x)
*Standalone EBITDA Margin (EBITDA before Exceptional item and other income)
7,466
10,424
8,3947,134
6,371
2,117
FY11 FY12 FY13 FY14 FY15 FY16
Gross Debt (INR mn)
10.7%
27.7%
FY11 FY12 FY13 FY14 FY15 FY16
ROCE
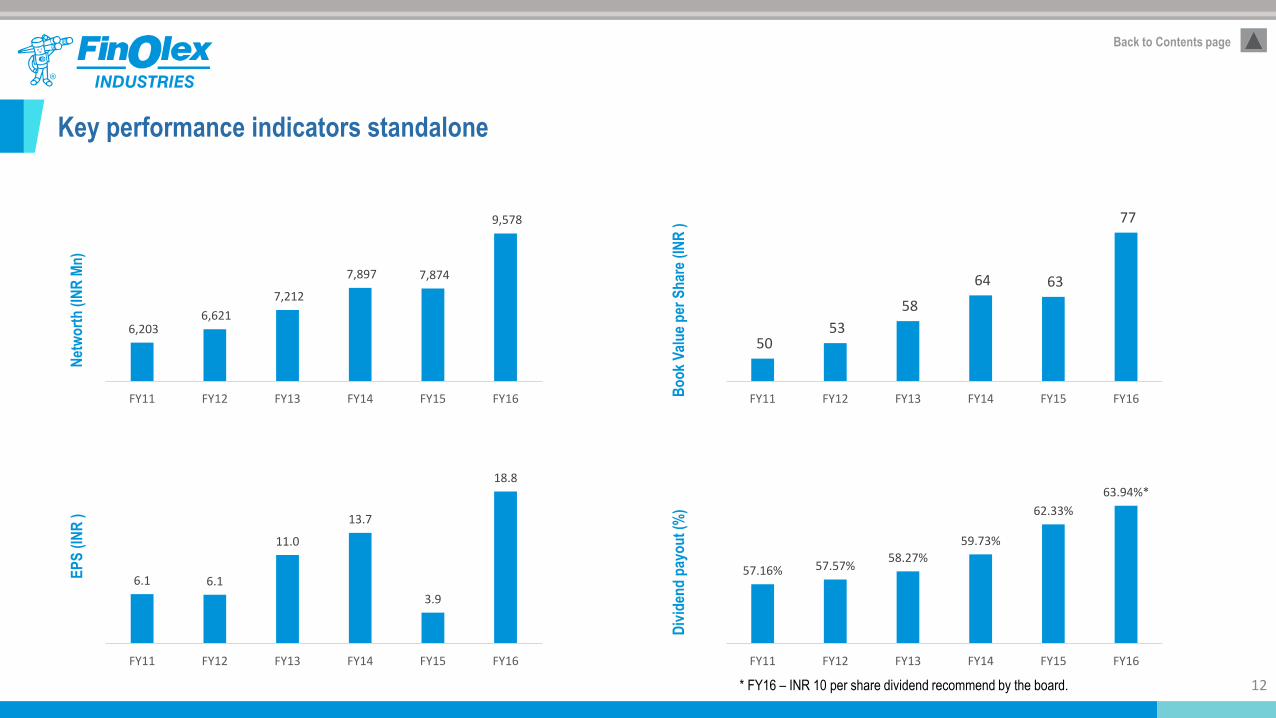
6,203 6,621
7,212
7,897 7,874
9,578
FY11 FY12 FY13 FY14 FY15 FY16
Net
wo
rth
(IN
R M
n)
6.1 6.1
11.0
13.7
3.9
18.8
FY11 FY12 FY13 FY14 FY15 FY16
EP
S (
INR
)
50 53
58
64 63
77
FY11 FY12 FY13 FY14 FY15 FY16Bo
ok
Val
ue
per
Sh
are
(IN
R )
57.16% 57.57%58.27%
59.73%
62.33%
63.94%*
FY11 FY12 FY13 FY14 FY15 FY16
Div
iden
d p
ayo
ut
(%)
Key performance indicators standalone
12
Back to Contents page
* FY16 – INR 10 per share dividend recommend by the board.

Value chain
13
Back to Contents page
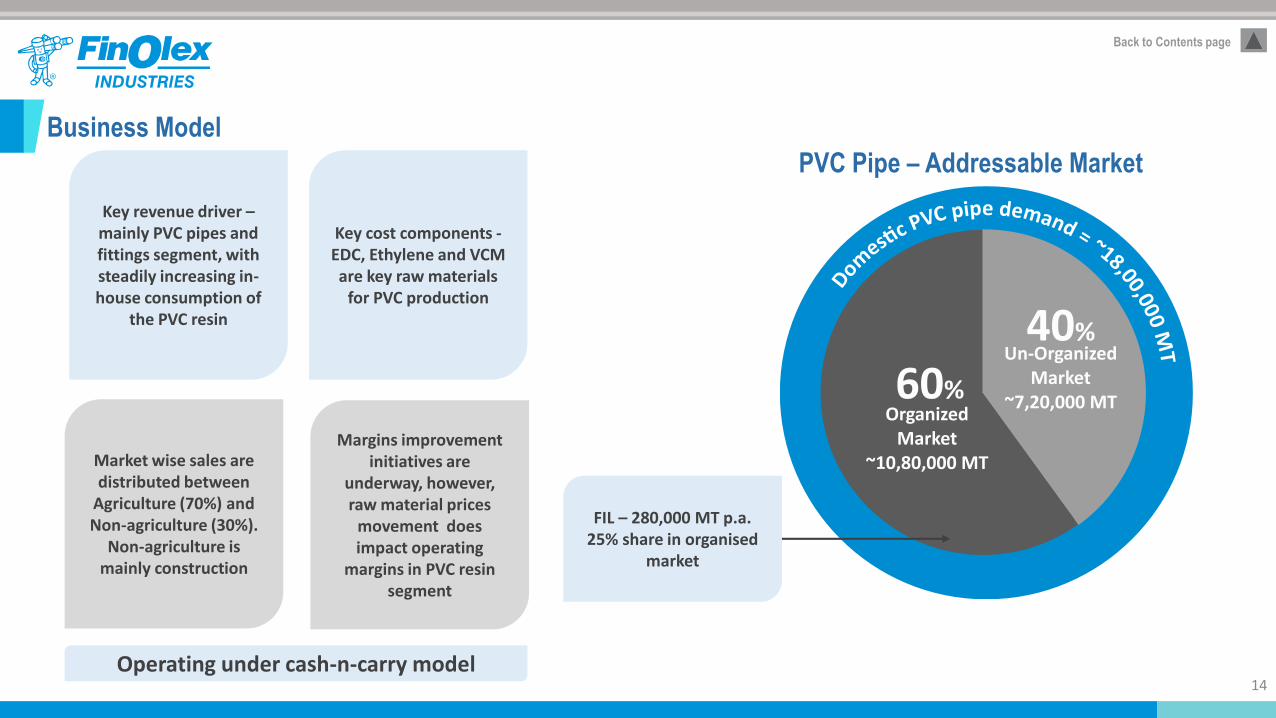
Business Model
Key revenue driver –mainly PVC pipes and fittings segment, with steadily increasing in-house consumption of
the PVC resin
Market wise sales are distributed between
Agriculture (70%) and Non-agriculture (30%).
Non-agriculture is mainly construction
Key cost components -EDC, Ethylene and VCM are key raw materials
for PVC production
Margins improvement initiatives are
underway, however, raw material prices
movement does impact operating
margins in PVC resin segment
PVC Pipe – Addressable Market
Operating under cash-n-carry model
FIL – 280,000 MT p.a.25% share in organised
market
14
Back to Contents page
Key Strategies
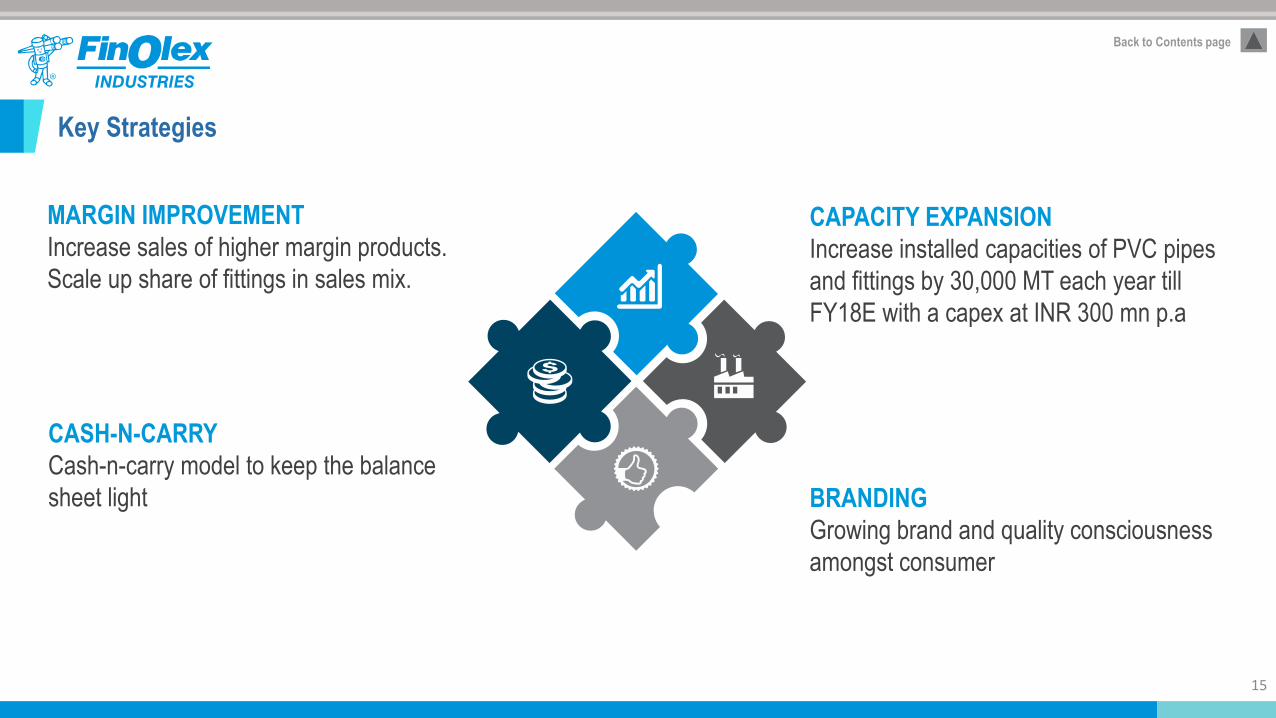
MARGIN IMPROVEMENT
Increase sales of higher margin products.
Scale up share of fittings in sales mix.
CAPACITY EXPANSION
Increase installed capacities of PVC pipes
and fittings by 30,000 MT each year till
FY18E with a capex at INR 300 mn p.a
CASH-N-CARRY
Cash-n-carry model to keep the balance
sheet light BRANDING
Growing brand and quality consciousness
amongst consumer
15
Back to Contents page
Union Budget 2016-17 Highlights
Focus on enhancing expenditure in priority areas of - farm and rural sector, social sector, infrastructure sector employment generation and
recapitalisation of the banks.
Agriculture Sector Agriculture Sector Other highlights
• Allocation for Agriculture and Farmers’ welfare is INR
35,984 crore
• ‘Pradhan Mantri Krishi Sinchai Yojana’ to be
implemented in mission mode. 28.5 lakh hectares will
be brought under irrigation.
• A dedicated Long Term Irrigation Fund will be created in
NABARD with an initial corpus of about INR 20,000
crore
• Programme for sustainable management of ground
water resources with an estimated cost of INR 6,000
crore will be implemented through multilateral funding
• A provision of INR 15,000 crore has been made in the
BE 2016-17 towards interest subvention Allocation
under Prime Minister Fasal Bima Yojana INR 5,500
crore
• Allocation for rural sector - INR 87,765 crore.
• Every block under drought and rural distress will be
taken up as an intensive Block under the Deen Dayal
Antyodaya Mission
• Krishi Kalyan Cess, @ 0.5% on all taxable services,
w.e.f. 1 June 2016 for resource mobilisation
• Surcharge levied at 7.5% of undisclosed income will be
called Krishi Kalyan surcharge to be used for
agriculture and rural economy
• Implementation of 89 irrigation projects under AIBP will
be fast tracked. This will help to irrigate 80.6 lakh
hectares. These projects require INR 17,000 crore next
year and INR 86,500 crore in the next five years. To
ensure that 23 of these projects are completed before
31st March, 2017
• To support farmers in the aftermath of natural
calamities, Government has revised the norms of
assistance under the National Disaster Response Fund
in April 2015
• Special focus has been given to ensure adequate and
timely flow of credit to the farmers. Against the target of
INR 8.5 lakh crore in 2015-16, the target for agricultural
credit in 2016-17 will be an all-time high of INR 9 lakh
crore
16
Back to Contents page
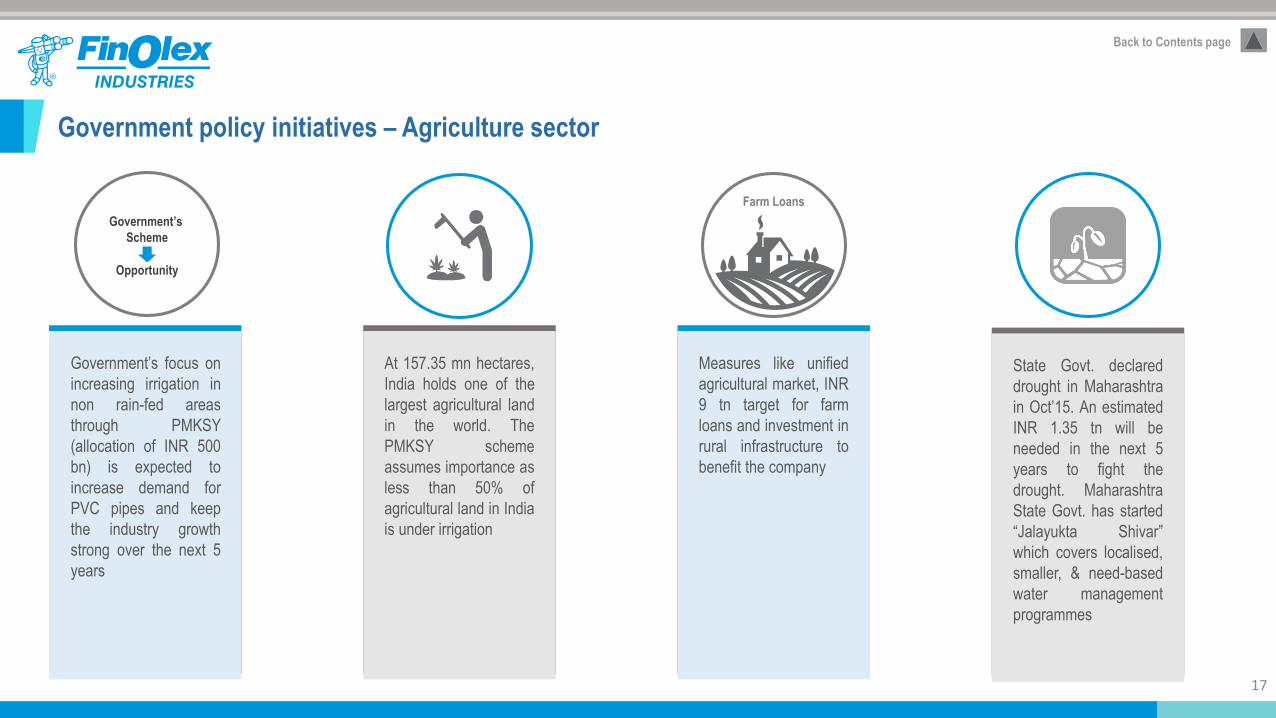
Government policy initiatives – Agriculture sector
Government’s focus on
increasing irrigation in
non rain-fed areas
through PMKSY
(allocation of INR 500
bn) is expected to
increase demand for
PVC pipes and keep
the industry growth
strong over the next 5
years
Government’s
Scheme
Opportunity
At 157.35 mn hectares,
India holds one of the
largest agricultural land
in the world. The
PMKSY scheme
assumes importance as
less than 50% of
agricultural land in India
is under irrigation
Farm Loans
Measures like unified
agricultural market, INR
9 tn target for farm
loans and investment in
rural infrastructure to
benefit the company
State Govt. declared
drought in Maharashtra
in Oct’15. An estimated
INR 1.35 tn will be
needed in the next 5
years to fight the
drought. Maharashtra
State Govt. has started
“Jalayukta Shivar”
which covers localised,
smaller, & need-based
water management
programmes
17
Back to Contents page
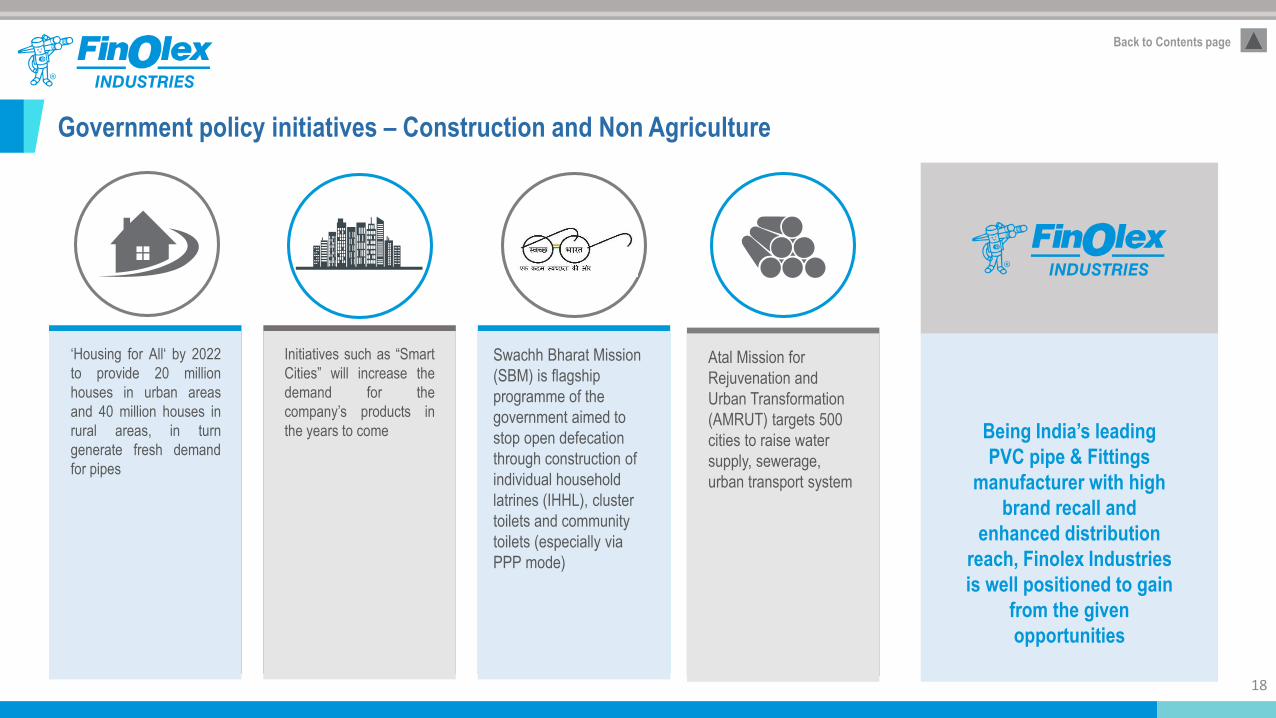
Government policy initiatives – Construction and Non Agriculture
‘Housing for All‘ by 2022
to provide 20 million
houses in urban areas
and 40 million houses in
rural areas, in turn
generate fresh demand
for pipes
Initiatives such as “Smart
Cities” will increase the
demand for the
company’s products in
the years to come
Swachh Bharat Mission
(SBM) is flagship
programme of the
government aimed to
stop open defecation
through construction of
individual household
latrines (IHHL), cluster
toilets and community
toilets (especially via
PPP mode)
Atal Mission for
Rejuvenation and
Urban Transformation
(AMRUT) targets 500
cities to raise water
supply, sewerage,
urban transport system
Being India’s leading
PVC pipe & Fittings
manufacturer with high
brand recall and
enhanced distribution
reach, Finolex Industries
is well positioned to gain
from the given
opportunities
18
Back to Contents page

#FlyingWithFinolex twitter campaign
Branding & advertisements – exhibitions, events & social media
Advertisement in regional newspapers
Sponsoring agri awards
on ABP Majha channel 19
Back to Contents page
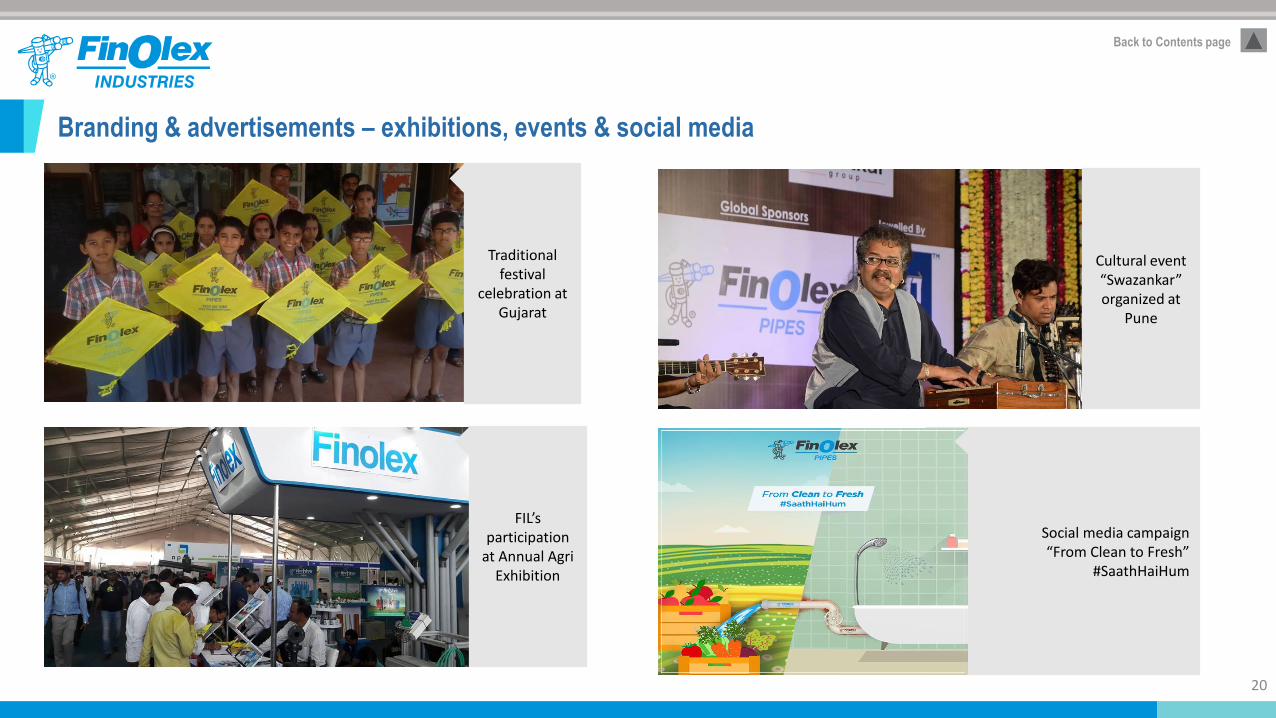
Branding & advertisements – exhibitions, events & social media
20
Back to Contents page
Social media campaign“From Clean to Fresh”
#SaathHaiHum
Traditional festival
celebration at Gujarat
FIL’s participation
at Annual AgriExhibition
Cultural event “Swazankar” organized at
Pune
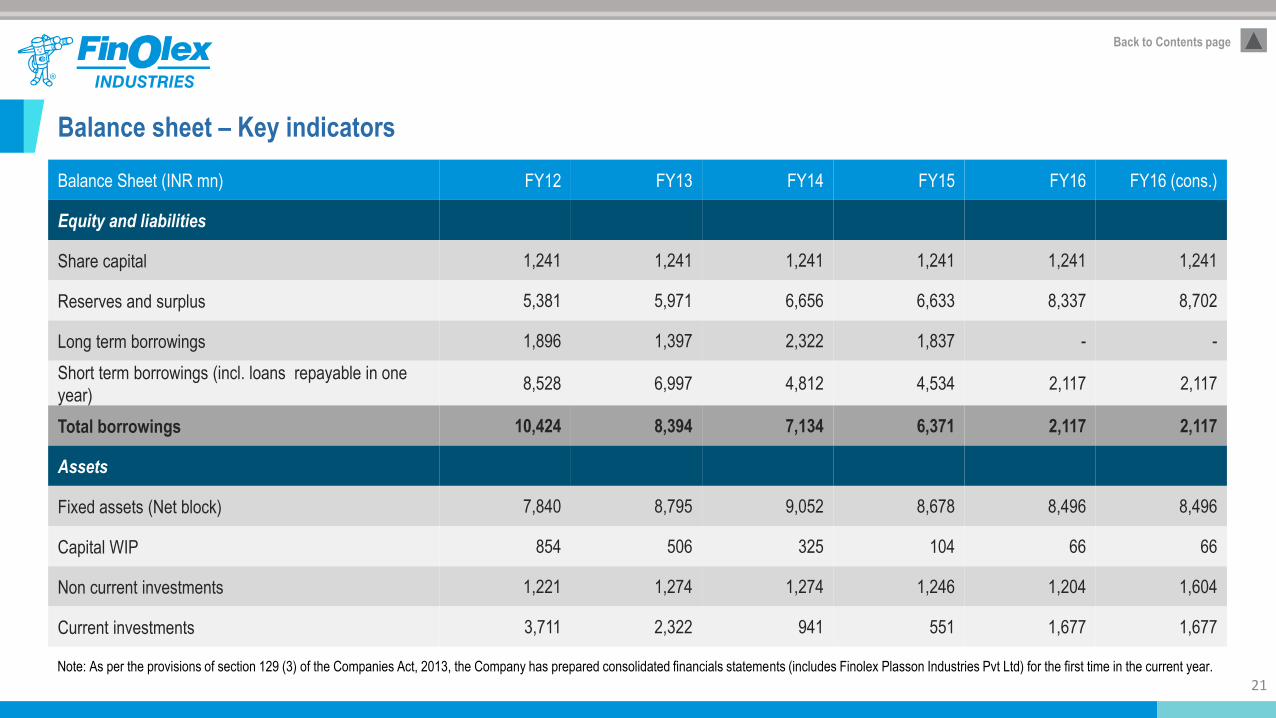
Balance sheet – Key indicators
21
Back to Contents page
Balance Sheet (INR mn) FY12 FY13 FY14 FY15 FY16 FY16 (cons.)
Equity and liabilities
Share capital 1,241 1,241 1,241 1,241 1,241 1,241
Reserves and surplus 5,381 5,971 6,656 6,633 8,337 8,702
Long term borrowings 1,896 1,397 2,322 1,837 - -
Short term borrowings (incl. loans repayable in one
year) 8,528 6,997 4,812 4,534 2,117 2,117
Total borrowings 10,424 8,394 7,134 6,371 2,117 2,117
Assets
Fixed assets (Net block) 7,840 8,795 9,052 8,678 8,496 8,496
Capital WIP 854 506 325 104 66 66
Non current investments 1,221 1,274 1,274 1,246 1,204 1,604
Current investments 3,711 2,322 941 551 1,677 1,677
Note: As per the provisions of section 129 (3) of the Companies Act, 2013, the Company has prepared consolidated financials statements (includes Finolex Plasson Industries Pvt Ltd) for the first time in the current year.
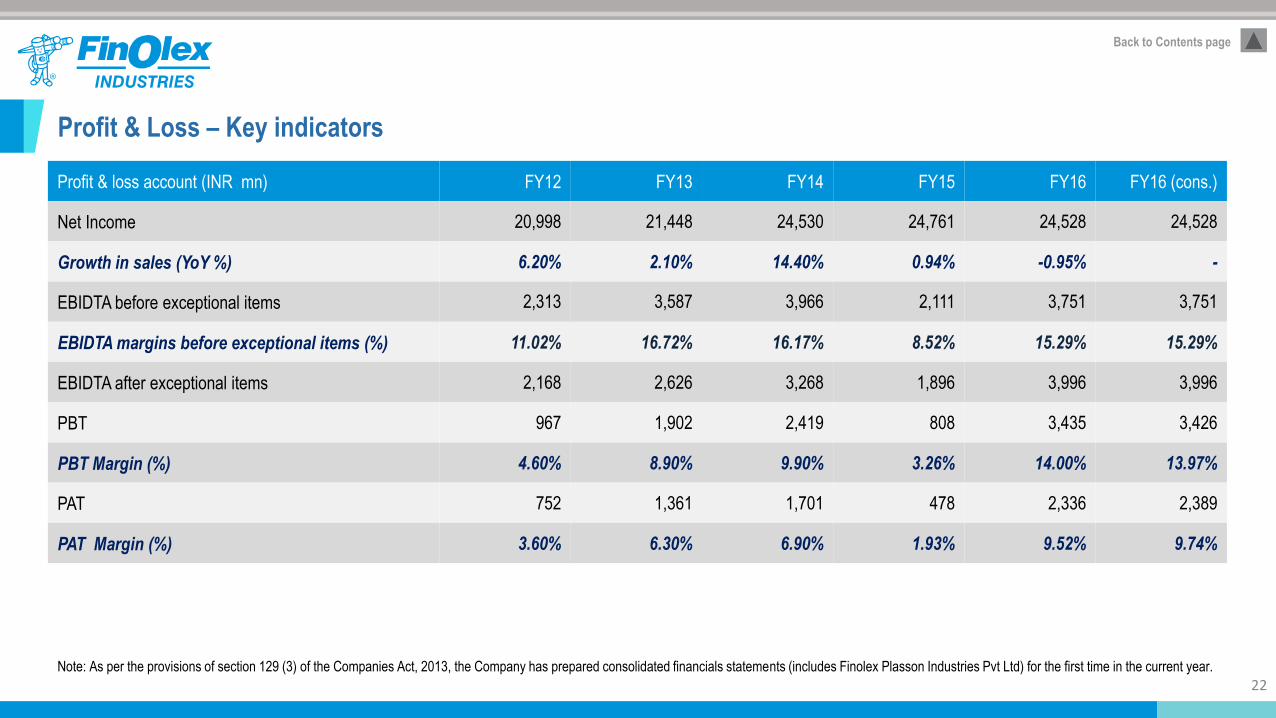
Profit & Loss – Key indicators
22
Back to Contents page
Profit & loss account (INR mn) FY12 FY13 FY14 FY15 FY16 FY16 (cons.)
Net Income 20,998 21,448 24,530 24,761 24,528 24,528
Growth in sales (YoY %) 6.20% 2.10% 14.40% 0.94% -0.95% -
EBIDTA before exceptional items 2,313 3,587 3,966 2,111 3,751 3,751
EBIDTA margins before exceptional items (%) 11.02% 16.72% 16.17% 8.52% 15.29% 15.29%
EBIDTA after exceptional items 2,168 2,626 3,268 1,896 3,996 3,996
PBT 967 1,902 2,419 808 3,435 3,426
PBT Margin (%) 4.60% 8.90% 9.90% 3.26% 14.00% 13.97%
PAT 752 1,361 1,701 478 2,336 2,389
PAT Margin (%) 3.60% 6.30% 6.90% 1.93% 9.52% 9.74%
Note: As per the provisions of section 129 (3) of the Companies Act, 2013, the Company has prepared consolidated financials statements (includes Finolex Plasson Industries Pvt Ltd) for the first time in the current year.
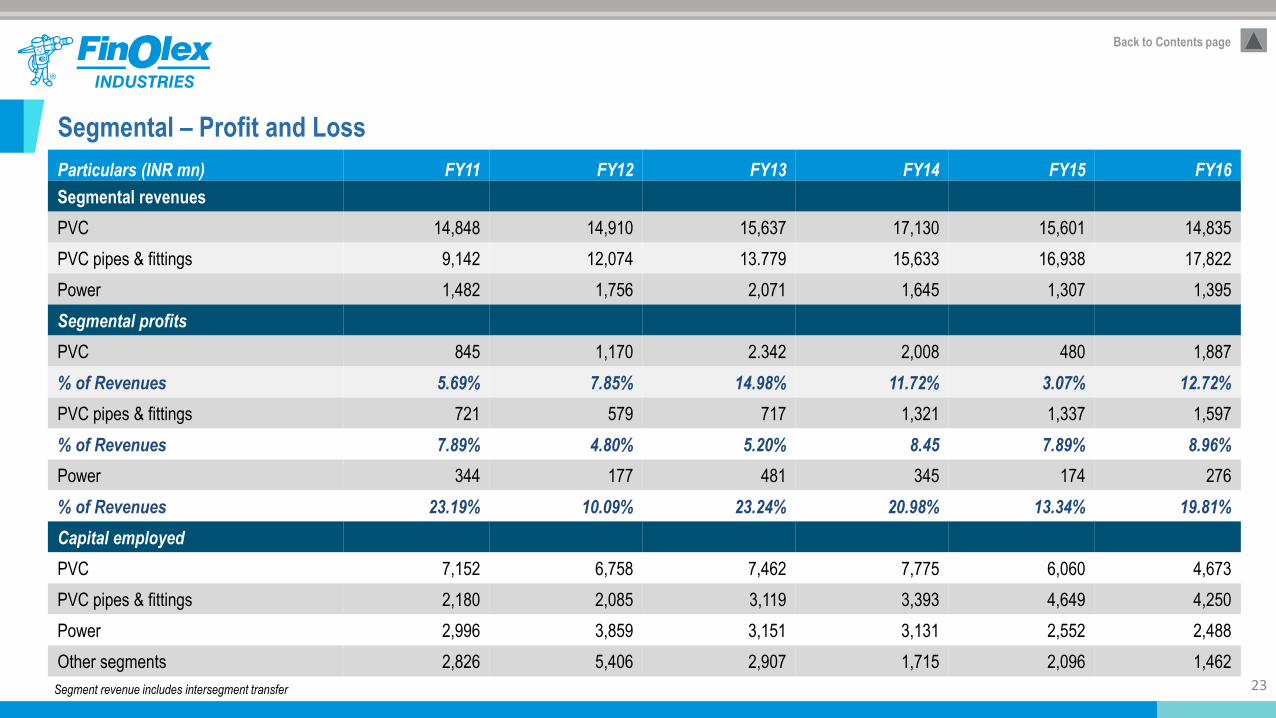
Segmental – Profit and Loss
Particulars (INR mn) FY11 FY12 FY13 FY14 FY15 FY16
Segmental revenues
PVC 14,848 14,910 15,637 17,130 15,601 14,835
PVC pipes & fittings 9,142 12,074 13.779 15,633 16,938 17,822
Power 1,482 1,756 2,071 1,645 1,307 1,395
Segmental profits
PVC 845 1,170 2.342 2,008 480 1,887
% of Revenues 5.69% 7.85% 14.98% 11.72% 3.07% 12.72%
PVC pipes & fittings 721 579 717 1,321 1,337 1,597
% of Revenues 7.89% 4.80% 5.20% 8.45 7.89% 8.96%
Power 344 177 481 345 174 276
% of Revenues 23.19% 10.09% 23.24% 20.98% 13.34% 19.81%
Capital employed
PVC 7,152 6,758 7,462 7,775 6,060 4,673
PVC pipes & fittings 2,180 2,085 3,119 3,393 4,649 4,250
Power 2,996 3,859 3,151 3,131 2,552 2,488
Other segments 2,826 5,406 2,907 1,715 2,096 1,462
Segment revenue includes intersegment transfer 23
Back to Contents page
# P&F represents Pipes and Fittings* Including inter segment transfer 24
Back to Contents page
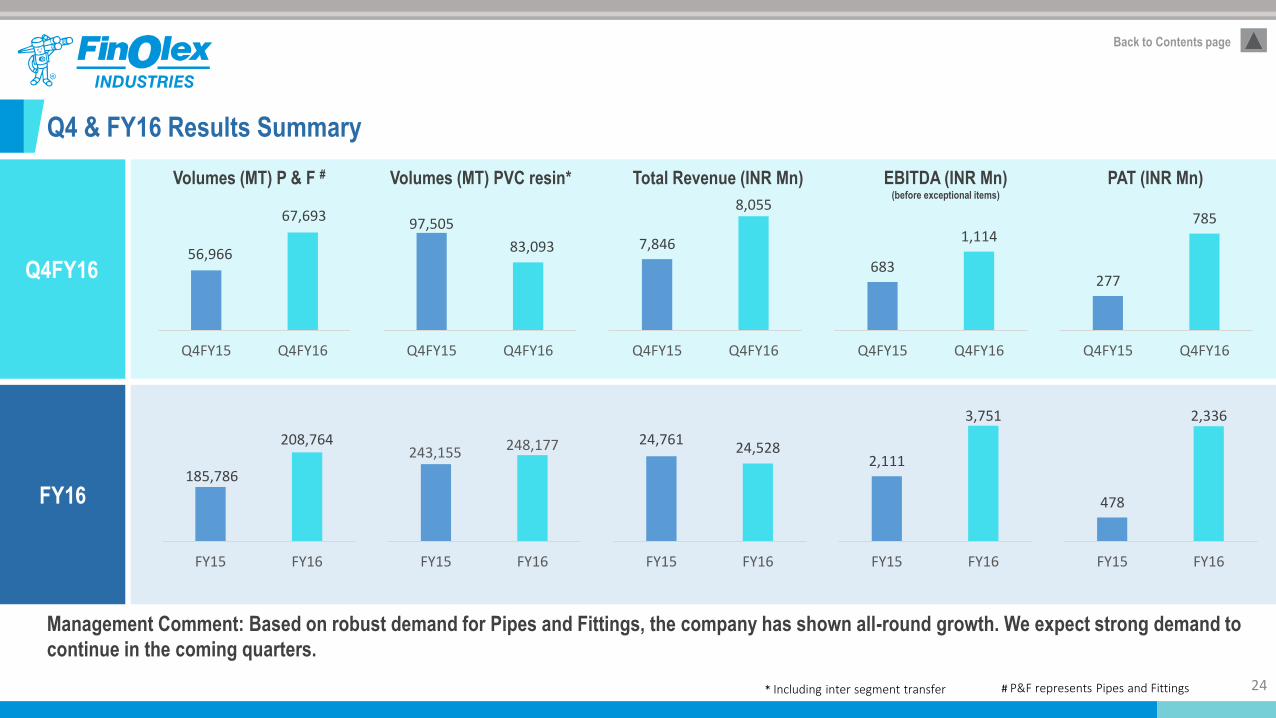
Management Comment: Based on robust demand for Pipes and Fittings, the company has shown all-round growth. We expect strong demand to
continue in the coming quarters.
Q4 & FY16 Results Summary
Volumes (MT) P & F # EBITDA (INR Mn)(before exceptional items)
PAT (INR Mn)Total Revenue (INR Mn)Volumes (MT) PVC resin*
Q4FY16
FY16
56,966
67,693
Q4FY15 Q4FY16
97,505
83,093
Q4FY15 Q4FY16
7,846
8,055
Q4FY15 Q4FY16
683
1,114
Q4FY15 Q4FY16
277
785
Q4FY15 Q4FY16
185,786
208,764
FY15 FY16
243,155 248,177
FY15 FY16
24,76124,528
FY15 FY16
2,111
3,751
FY15 FY16
478
2,336
FY15 FY16
Profit & Loss Account
25
Back to Contents page
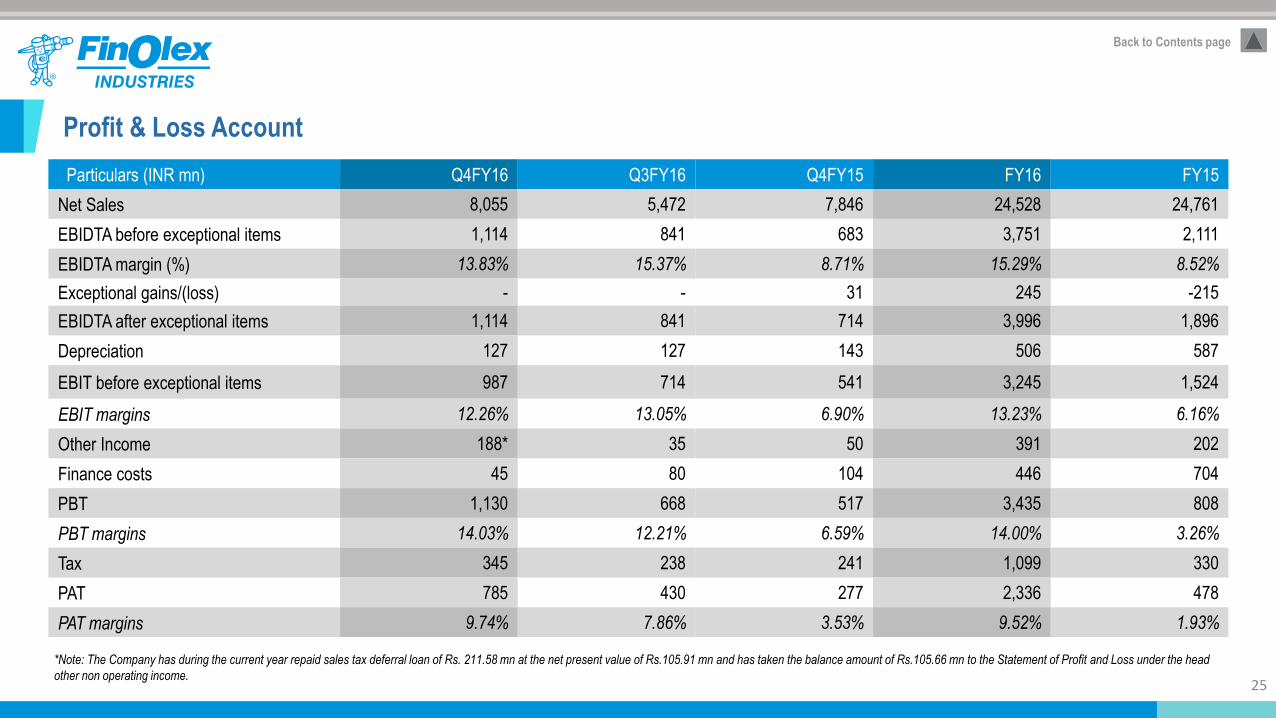
Particulars (INR mn) Q4FY16 Q3FY16 Q4FY15 FY16 FY15
Net Sales 8,055 5,472 7,846 24,528 24,761
EBIDTA before exceptional items 1,114 841 683 3,751 2,111
EBIDTA margin (%) 13.83% 15.37% 8.71% 15.29% 8.52%
Exceptional gains/(loss) - - 31 245 -215
EBIDTA after exceptional items 1,114 841 714 3,996 1,896
Depreciation 127 127 143 506 587
EBIT before exceptional items 987 714 541 3,245 1,524
EBIT margins 12.26% 13.05% 6.90% 13.23% 6.16%
Other Income 188* 35 50 391 202
Finance costs 45 80 104 446 704
PBT 1,130 668 517 3,435 808
PBT margins 14.03% 12.21% 6.59% 14.00% 3.26%
Tax 345 238 241 1,099 330
PAT 785 430 277 2,336 478
PAT margins 9.74% 7.86% 3.53% 9.52% 1.93%
*Note: The Company has during the current year repaid sales tax deferral loan of Rs. 211.58 mn at the net present value of Rs.105.91 mn and has taken the balance amount of Rs.105.66 mn to the Statement of Profit and Loss under the head
other non operating income.
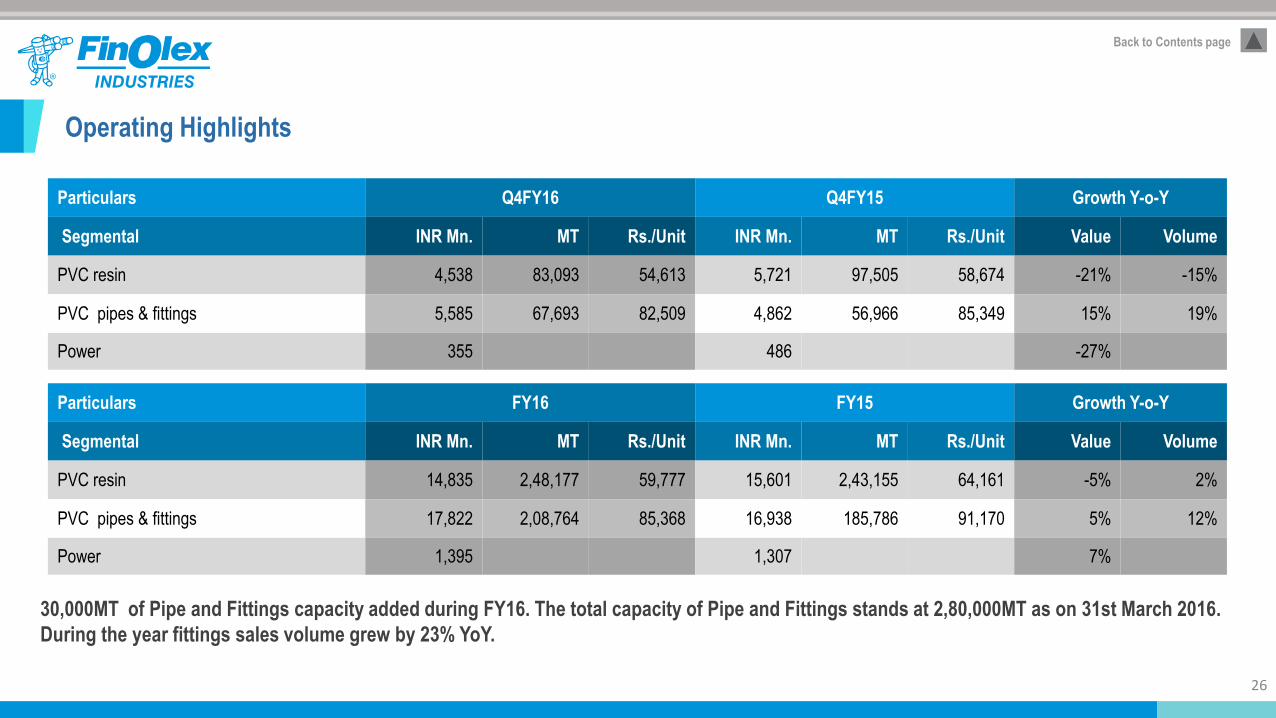
Operating Highlights
26
Back to Contents page
Particulars Q4FY16 Q4FY15 Growth Y-o-Y
Segmental INR Mn. MT Rs./Unit INR Mn. MT Rs./Unit Value Volume
PVC resin 4,538 83,093 54,613 5,721 97,505 58,674 -21% -15%
PVC pipes & fittings 5,585 67,693 82,509 4,862 56,966 85,349 15% 19%
Power 355 486 -27%
Particulars FY16 FY15 Growth Y-o-Y
Segmental INR Mn. MT Rs./Unit INR Mn. MT Rs./Unit Value Volume
PVC resin 14,835 2,48,177 59,777 15,601 2,43,155 64,161 -5% 2%
PVC pipes & fittings 17,822 2,08,764 85,368 16,938 185,786 91,170 5% 12%
Power 1,395 1,307 7%
30,000MT of Pipe and Fittings capacity added during FY16. The total capacity of Pipe and Fittings stands at 2,80,000MT as on 31st March 2016.
During the year fittings sales volume grew by 23% YoY.
27
Back to Contents page
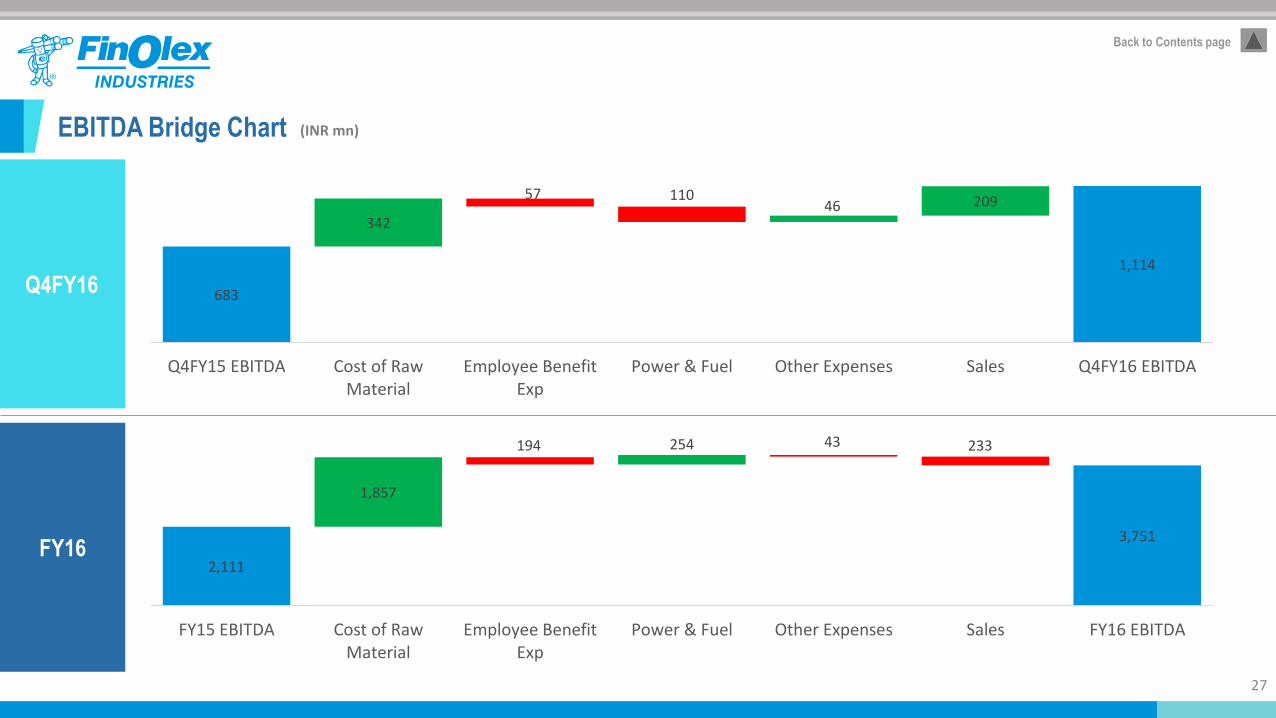
(INR mn) EBITDA Bridge Chart
2,111
3,751
1,857
194 254 43 233
FY15 EBITDA Cost of RawMaterial
Employee BenefitExp
Power & Fuel Other Expenses Sales FY16 EBITDA
683
1,114
342
57 11046 209
Q4FY15 EBITDA Cost of RawMaterial
Employee BenefitExp
Power & Fuel Other Expenses Sales Q4FY16 EBITDA
Q4FY16
FY16

Business Scenario
28
Back to Contents page
58,239
31,644
38,856
56,966 57,967
40,689 42,445
67,693
Q1'15 Q2'15 Q3'15 Q4'15 Q1'16 Q2'16 Q3'16 Q4'16
55,899
27,910
61,826
97,505
63,030
41,512
60,542
83,093
Q1'15 Q2'15 Q3'15 Q4'15 Q1'16 Q2'16 Q3'16 Q4'16
Source: Platts Polymerscan weekly reports
PV
C/E
DC
De
lta
(US
D/M
T)
Pip
es
& F
itti
ngs
Vo
lum
es
(MT
)
PV
C (
US
D/M
T)
PV
C V
olu
mes
(MT
)
618
400
500
600
700
Apr-14 Nov-14 Aug-15 Mar-16
885
500
700
900
1100
Apr-14 Nov-14 Aug-15 Mar-16
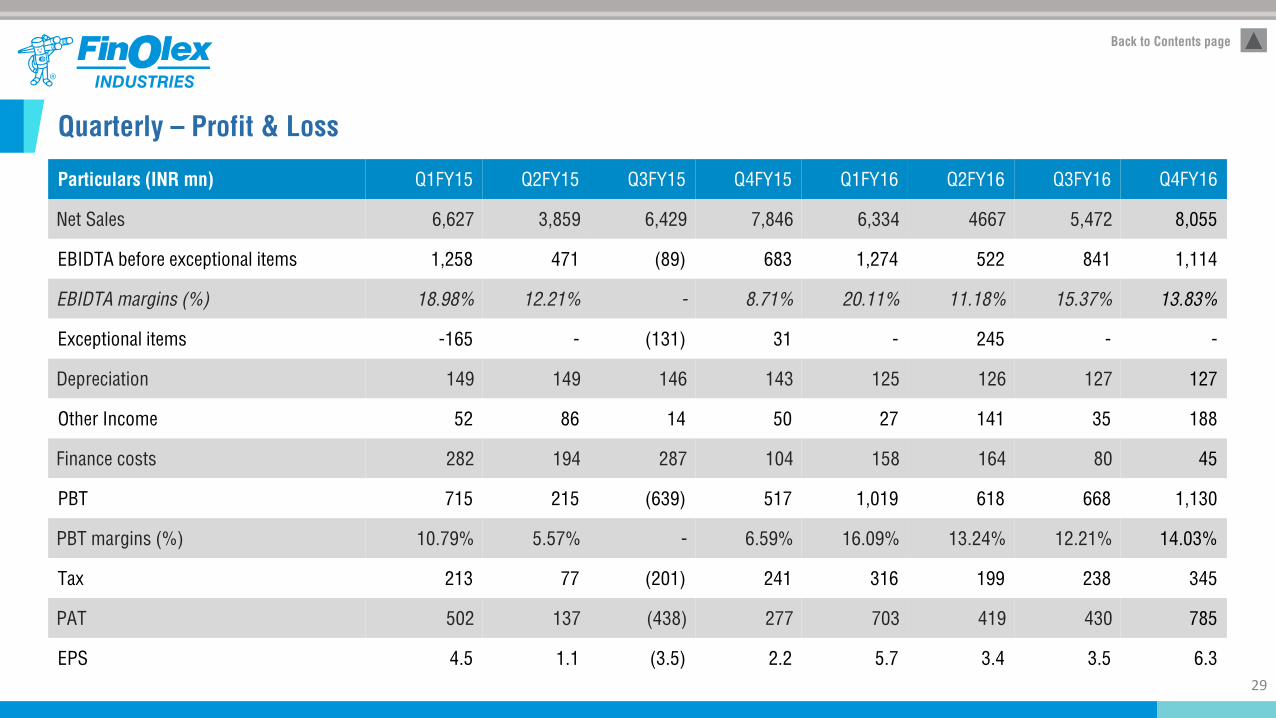
Quarterly – Profit & Loss
29
Back to Contents page
Particulars (INR mn) Q1FY15 Q2FY15 Q3FY15 Q4FY15 Q1FY16 Q2FY16 Q3FY16 Q4FY16
Net Sales 6,627 3,859 6,429 7,846 6,334 4667 5,472 8,055
EBIDTA before exceptional items 1,258 471 (89) 683 1,274 522 841 1,114
EBIDTA margins (%) 18.98% 12.21% - 8.71% 20.11% 11.18% 15.37% 13.83%
Exceptional items -165 - (131) 31 - 245 - -
Depreciation 149 149 146 143 125 126 127 127
Other Income 52 86 14 50 27 141 35 188
Finance costs 282 194 287 104 158 164 80 45
PBT 715 215 (639) 517 1,019 618 668 1,130
PBT margins (%) 10.79% 5.57% - 6.59% 16.09% 13.24% 12.21% 14.03%
Tax 213 77 (201) 241 316 199 238 345
PAT 502 137 (438) 277 703 419 430 785
EPS 4.5 1.1 (3.5) 2.2 5.7 3.4 3.5 6.3
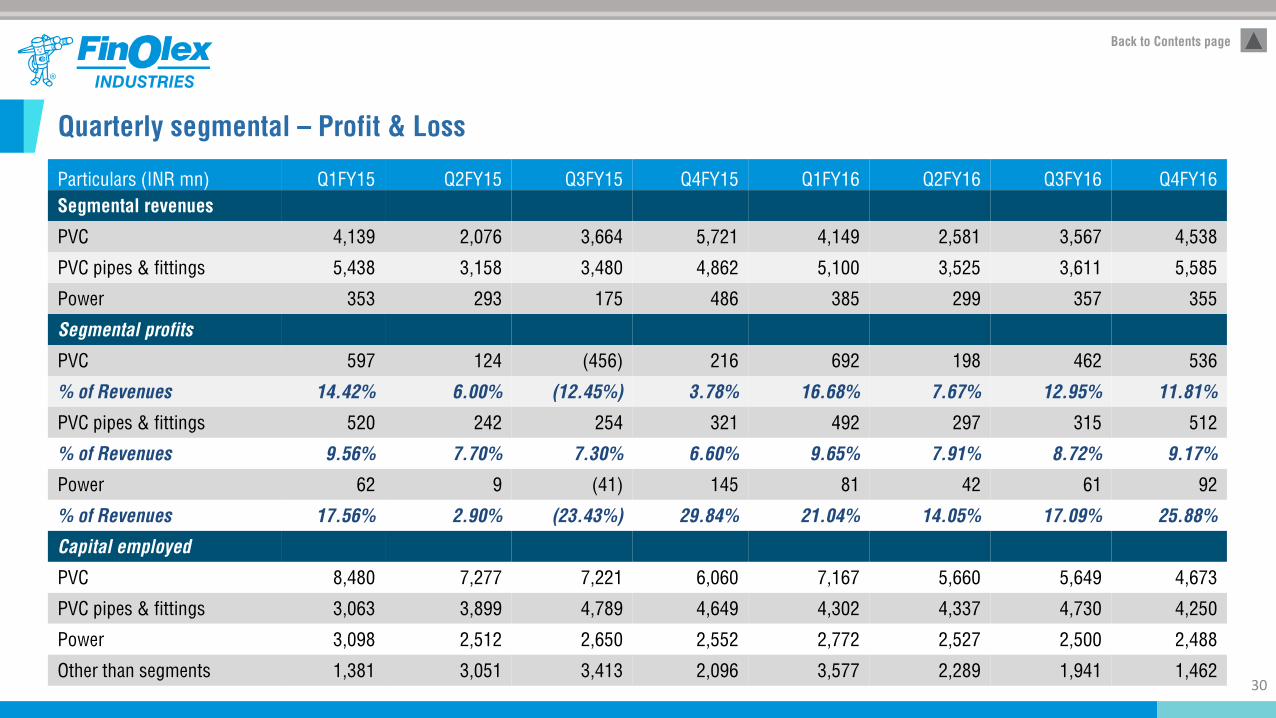
Quarterly segmental – Profit & Loss
30
Back to Contents page
Particulars (INR mn) Q1FY15 Q2FY15 Q3FY15 Q4FY15 Q1FY16 Q2FY16 Q3FY16 Q4FY16
Segmental revenues
PVC 4,139 2,076 3,664 5,721 4,149 2,581 3,567 4,538
PVC pipes & fittings 5,438 3,158 3,480 4,862 5,100 3,525 3,611 5,585
Power 353 293 175 486 385 299 357 355
Segmental profits
PVC 597 124 (456) 216 692 198 462 536
% of Revenues 14.42% 6.00% (12.45%) 3.78% 16.68% 7.67% 12.95% 11.81%
PVC pipes & fittings 520 242 254 321 492 297 315 512
% of Revenues 9.56% 7.70% 7.30% 6.60% 9.65% 7.91% 8.72% 9.17%
Power 62 9 (41) 145 81 42 61 92
% of Revenues 17.56% 2.90% (23.43%) 29.84% 21.04% 14.05% 17.09% 25.88%
Capital employed
PVC 8,480 7,277 7,221 6,060 7,167 5,660 5,649 4,673
PVC pipes & fittings 3,063 3,899 4,789 4,649 4,302 4,337 4,730 4,250
Power 3,098 2,512 2,650 2,552 2,772 2,527 2,500 2,488
Other than segments 1,381 3,051 3,413 2,096 3,577 2,289 1,941 1,462
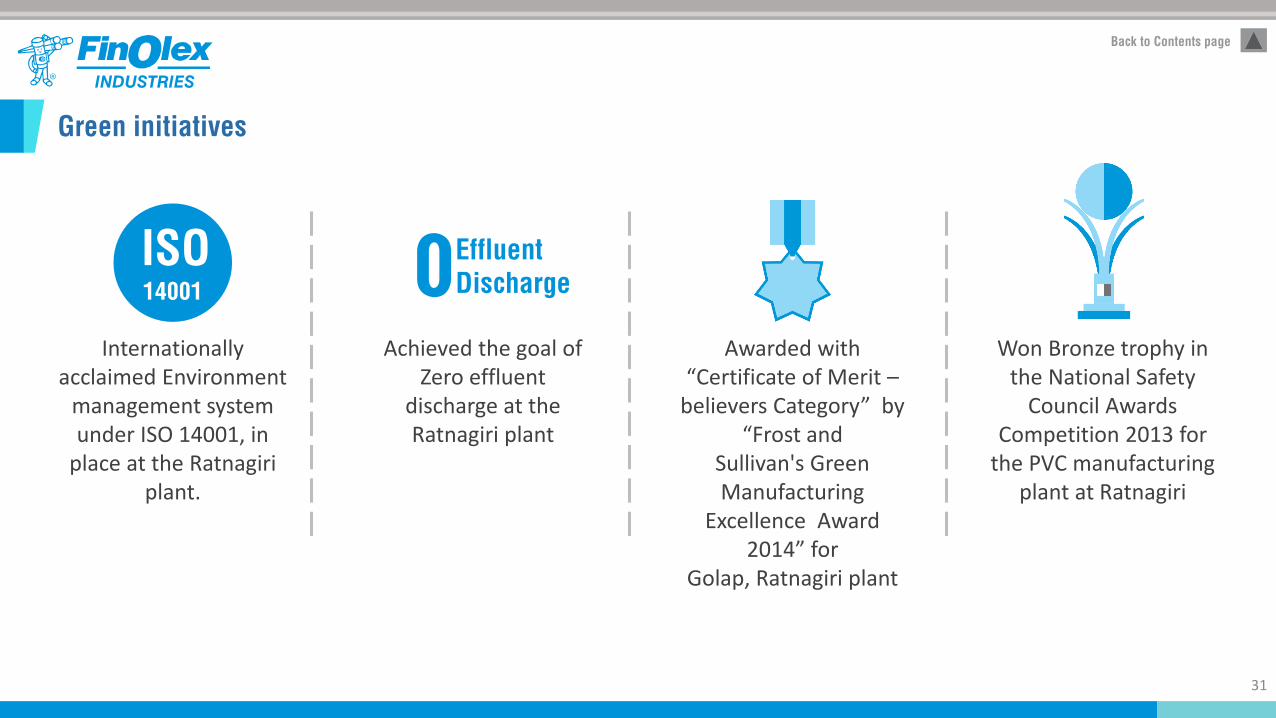
Internationally acclaimed Environment
management system under ISO 14001, in
place at the Ratnagiriplant.
Achieved the goal of Zero effluent
discharge at theRatnagiri plant
Awarded with “Certificate of Merit –
believers Category” by“Frost and
Sullivan's GreenManufacturing
Excellence Award2014” for
Golap, Ratnagiri plant
Won Bronze trophy in the National Safety
Council Awards Competition 2013 for
the PVC manufacturing plant at Ratnagiri
Green initiatives
ISO14001 0Effluent
Discharge
31
Back to Contents page
32
Back to Contents page
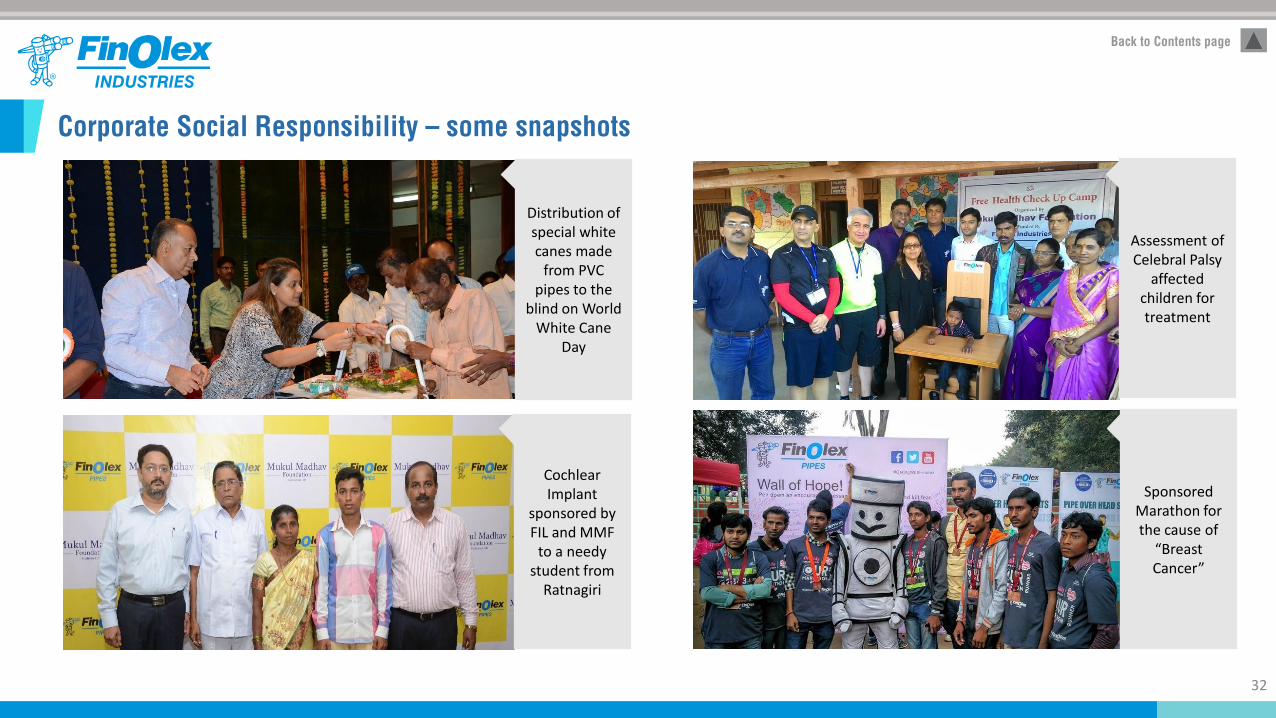
Corporate Social Responsibility – some snapshots
Distribution of special white canes made
from PVC pipes to the
blind on World White Cane
Day
Assessment of Celebral Palsy
affected children for treatment
Sponsored Marathon for the cause of
“Breast Cancer”
Cochlear Implant
sponsored by FIL and MMF
to a needy student from
Ratnagiri
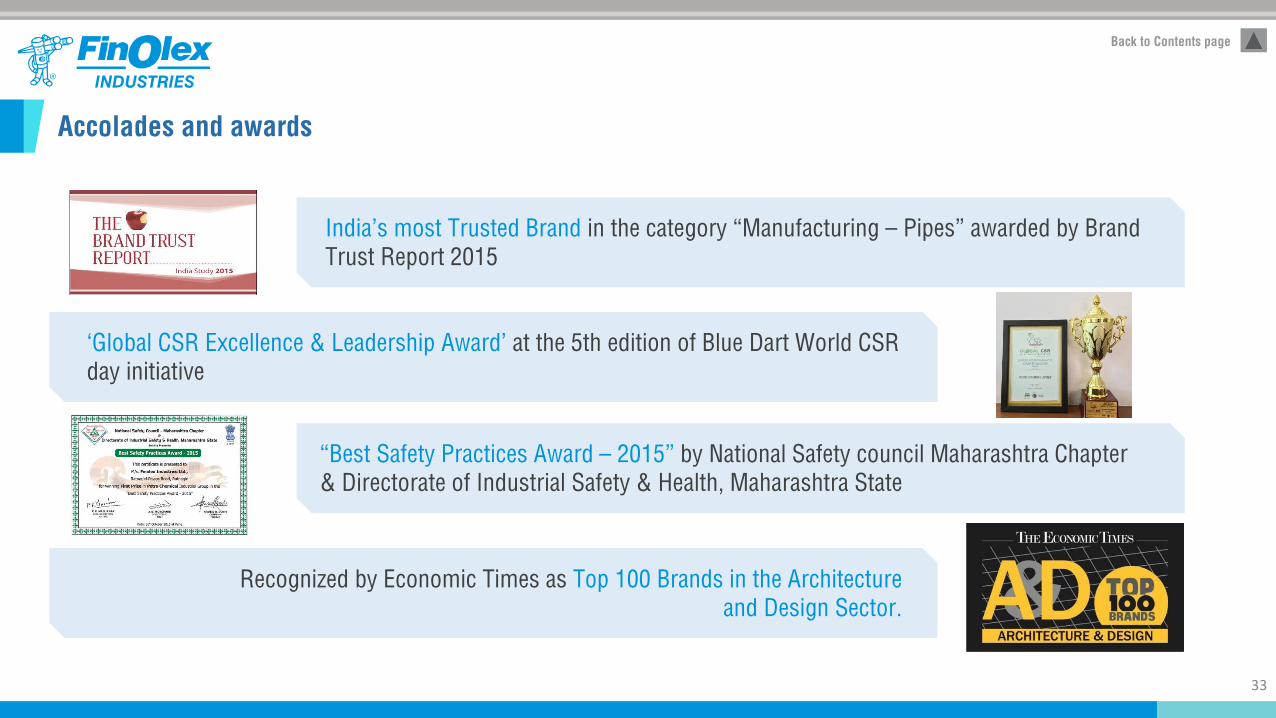
Accolades and awards
33
Back to Contents page
‘Global CSR Excellence & Leadership Award’ at the 5th edition of Blue Dart World CSR
day initiative
Recognized by Economic Times as Top 100 Brands in the Architecture
and Design Sector.
India’s most Trusted Brand in the category “Manufacturing – Pipes” awarded by Brand
Trust Report 2015
“Best Safety Practices Award – 2015” by National Safety council Maharashtra Chapter
& Directorate of Industrial Safety & Health, Maharashtra State
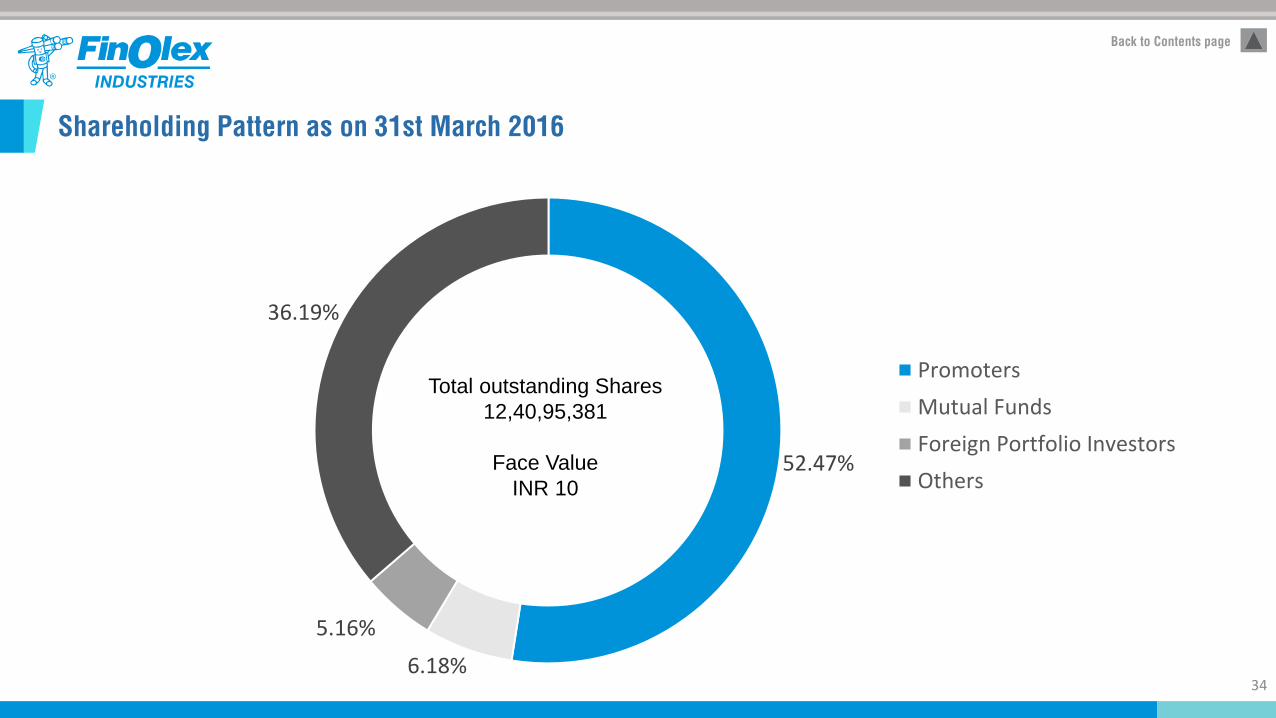
Shareholding Pattern as on 31st March 2016
34
Back to Contents page
52.47%
6.18%
5.16%
36.19%
Promoters
Mutual Funds
Foreign Portfolio Investors
Others
Total outstanding Shares
12,40,95,381
Face Value
INR 10
FINOLEX INDUSTRIES LIMITED
Mr. S. Krishnamoorthy (GM - Accounts & Finance)
D-1/10, M.I.D.C. Chinchwad, Pune 411 019
020 2740 8200 | 1-800-2003466
www.finolexwater.com
Investor RelationsS-Ancial Global Solutions Pvt. Ltd
Contact No.: 022 6143 2352 [email protected]
D-1/10, M.I.D.C. Chinchwad, Pune