finnish technologyindustryjanuary2015
TRANSCRIPT

Technology Industry /
Finnish Economic
Situation and Outlook
January 2015
13.1.2015 2
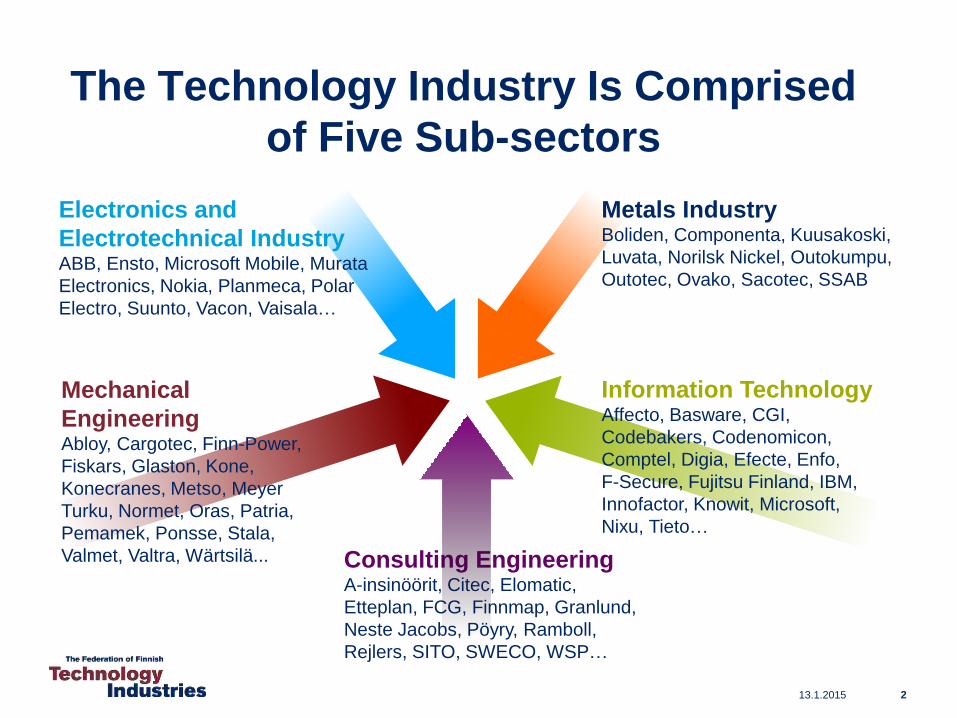
The Technology Industry Is Comprised
of Five Sub-sectors
Metals IndustryBoliden, Componenta, Kuusakoski,
Luvata, Norilsk Nickel, Outokumpu,
Outotec, Ovako, Sacotec, SSAB
Mechanical
EngineeringAbloy, Cargotec, Finn-Power,
Fiskars, Glaston, Kone,
Konecranes, Metso, Meyer
Turku, Normet, Oras, Patria,
Pemamek, Ponsse, Stala,
Valmet, Valtra, Wärtsilä...
Electronics and
Electrotechnical IndustryABB, Ensto, Microsoft Mobile, Murata
Electronics, Nokia, Planmeca, Polar
Electro, Suunto, Vacon, Vaisala…
Information TechnologyAffecto, Basware, CGI,
Codebakers, Codenomicon,
Comptel, Digia, Efecte, Enfo,
F-Secure, Fujitsu Finland, IBM,
Innofactor, Knowit, Microsoft,
Nixu, Tieto…
Consulting EngineeringA-insinöörit, Citec, Elomatic,
Etteplan, FCG, Finnmap, Granlund,
Neste Jacobs, Pöyry, Ramboll,
Rejlers, SITO, SWECO, WSP…
3
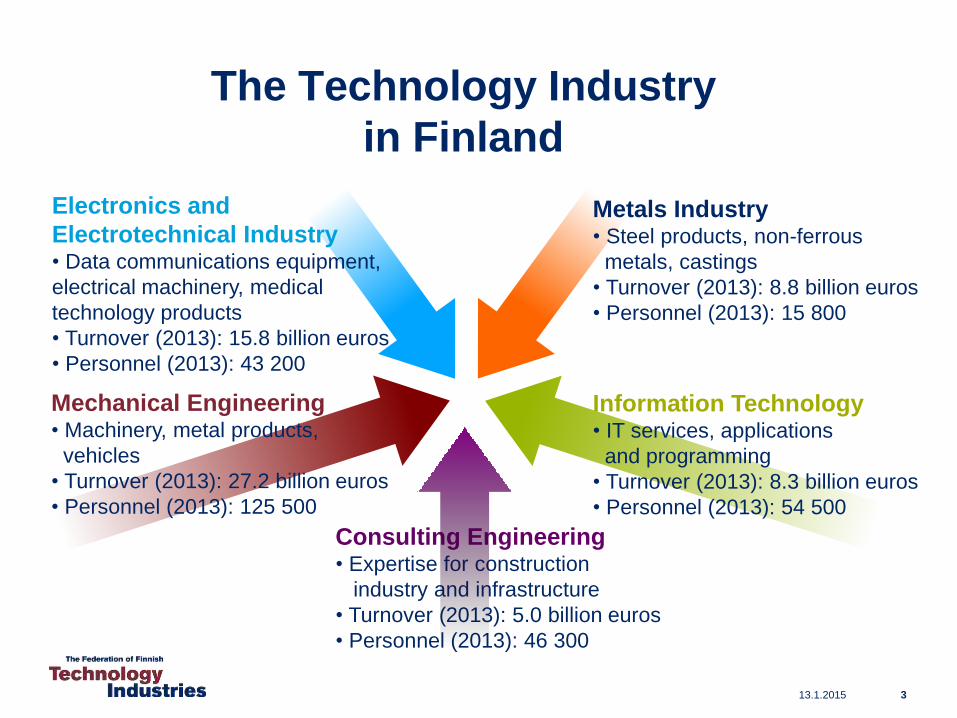
The Technology Industry
in Finland
Mechanical Engineering• Machinery, metal products,
vehicles
• Turnover (2013): 27.2 billion euros
• Personnel (2013): 125 500
Electronics and
Electrotechnical Industry• Data communications equipment,
electrical machinery, medical
technology products
• Turnover (2013): 15.8 billion euros
• Personnel (2013): 43 200
Information Technology• IT services, applications
and programming
• Turnover (2013): 8.3 billion euros
• Personnel (2013): 54 500
Metals Industry• Steel products, non-ferrous
metals, castings
• Turnover (2013): 8.8 billion euros
• Personnel (2013): 15 800
Consulting Engineering• Expertise for construction
industry and infrastructure
• Turnover (2013): 5.0 billion euros
• Personnel (2013): 46 300
13.1.2015
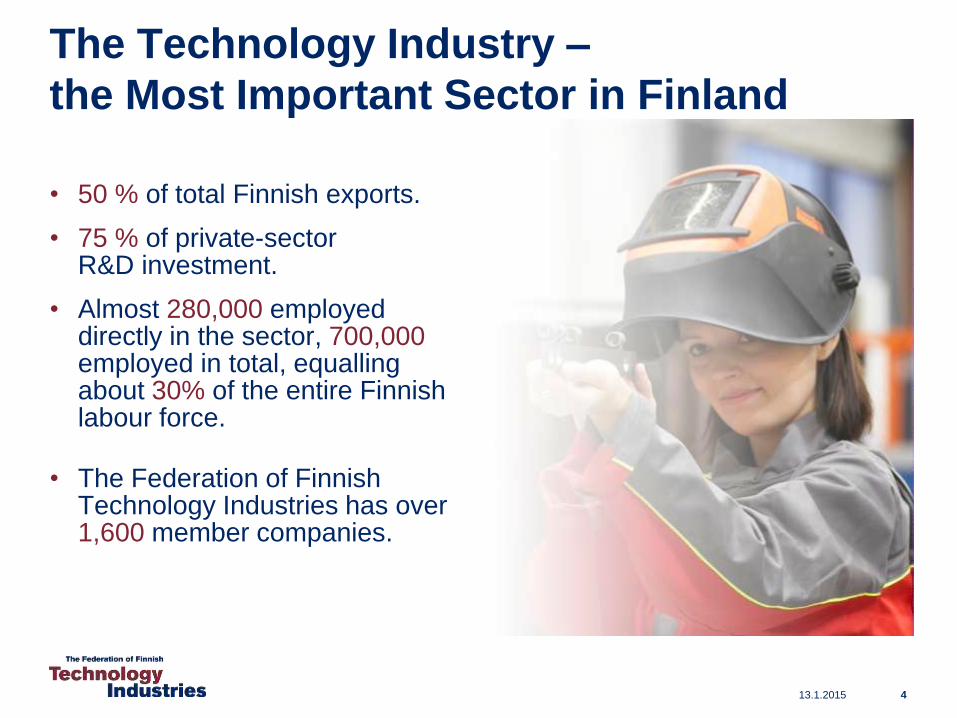
• 50 % of total Finnish exports.
• 75 % of private-sector R&D investment.
• Almost 280,000 employed directly in the sector, 700,000employed in total, equalling about 30% of the entire Finnish labour force.
• The Federation of Finnish Technology Industries has over 1,600 member companies.
13.1.2015 4
The Technology Industry –
the Most Important Sector in Finland
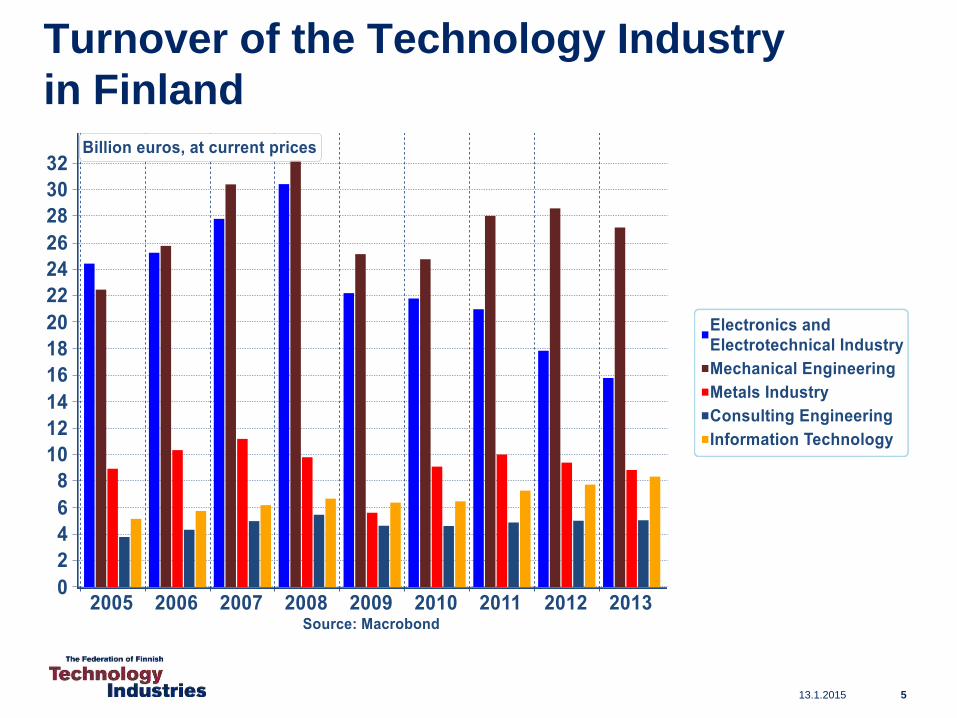
Turnover of the Technology Industry
in Finland
13.1.2015 5
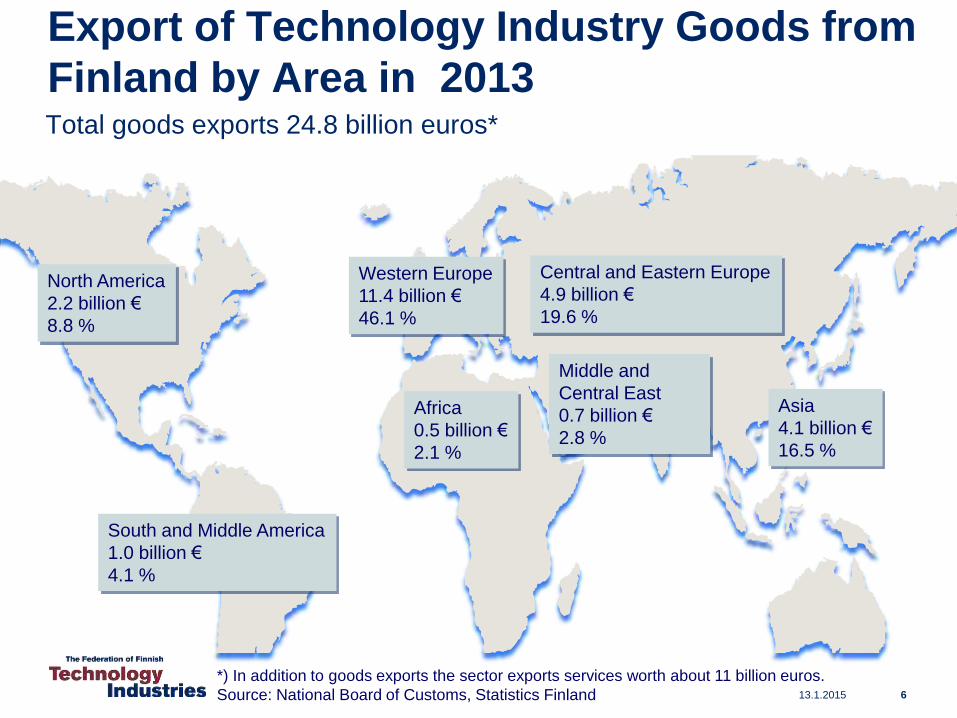
Export of Technology Industry Goods from
Finland by Area in 2013
13.1.2015 6
Total goods exports 24.8 billion euros*
North America
2.2 billion €
8.8 %
Western Europe
11.4 billion €
46.1 %
Middle and
Central East
0.7 billion €
2.8 %
Asia
4.1 billion €
16.5 %
Africa
0.5 billion €
2.1 %
South and Middle America
1.0 billion €
4.1 %
Central and Eastern Europe
4.9 billion €
19.6 %
*) In addition to goods exports the sector exports services worth about 11 billion euros.
Source: National Board of Customs, Statistics Finland
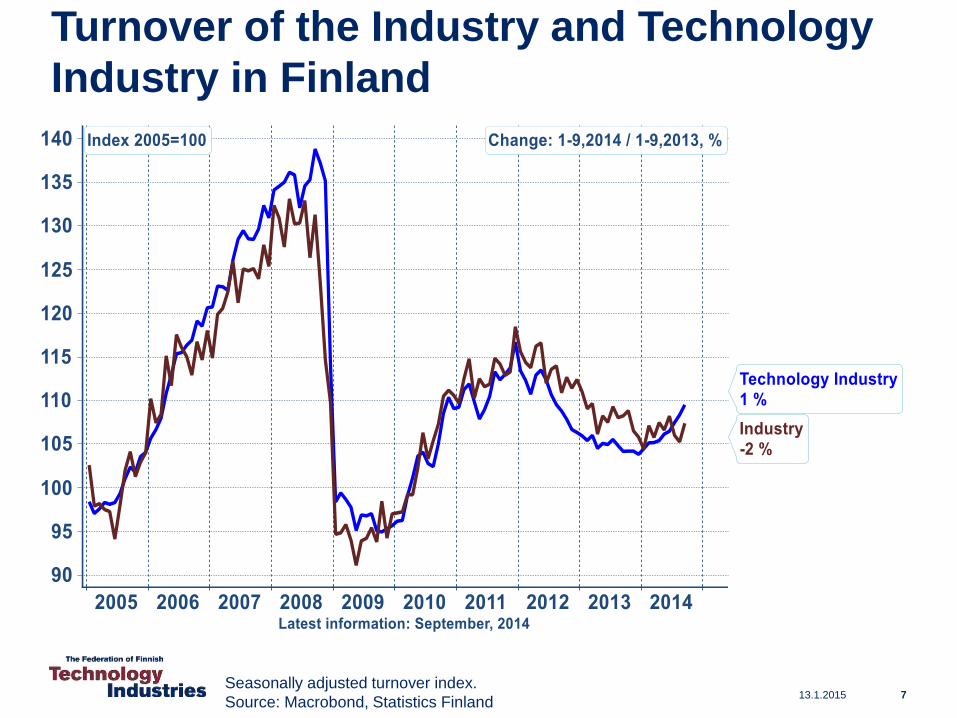
Turnover of the Industry and Technology
Industry in Finland
13.1.2015 7Seasonally adjusted turnover index.
Source: Macrobond, Statistics Finland
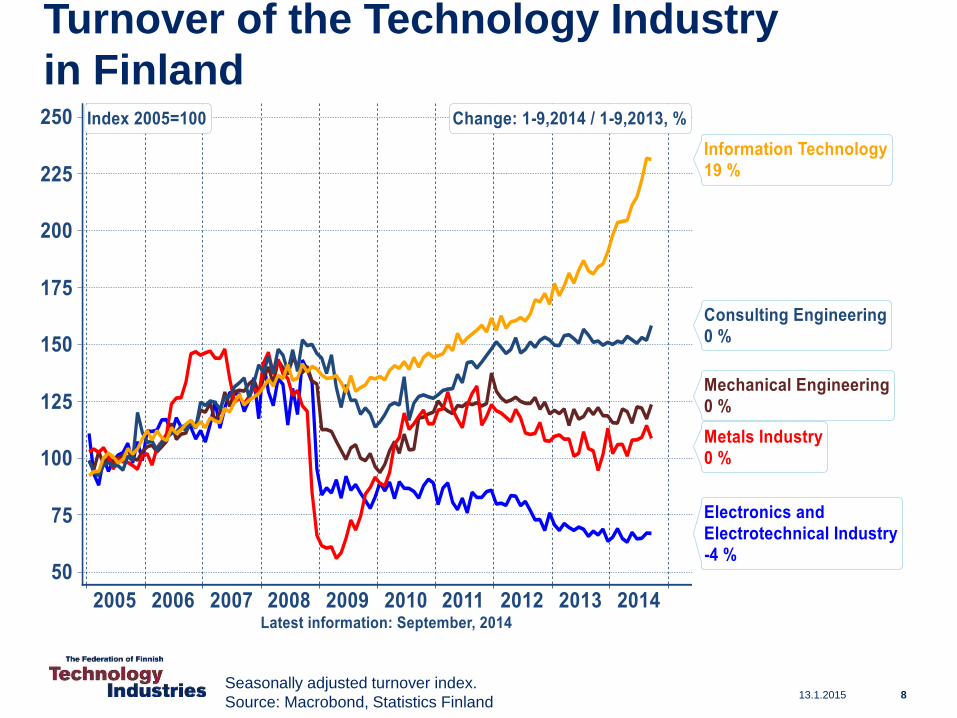
Turnover of the Technology Industry
in Finland
13.1.2015 8Seasonally adjusted turnover index.
Source: Macrobond, Statistics Finland
13.1.2015
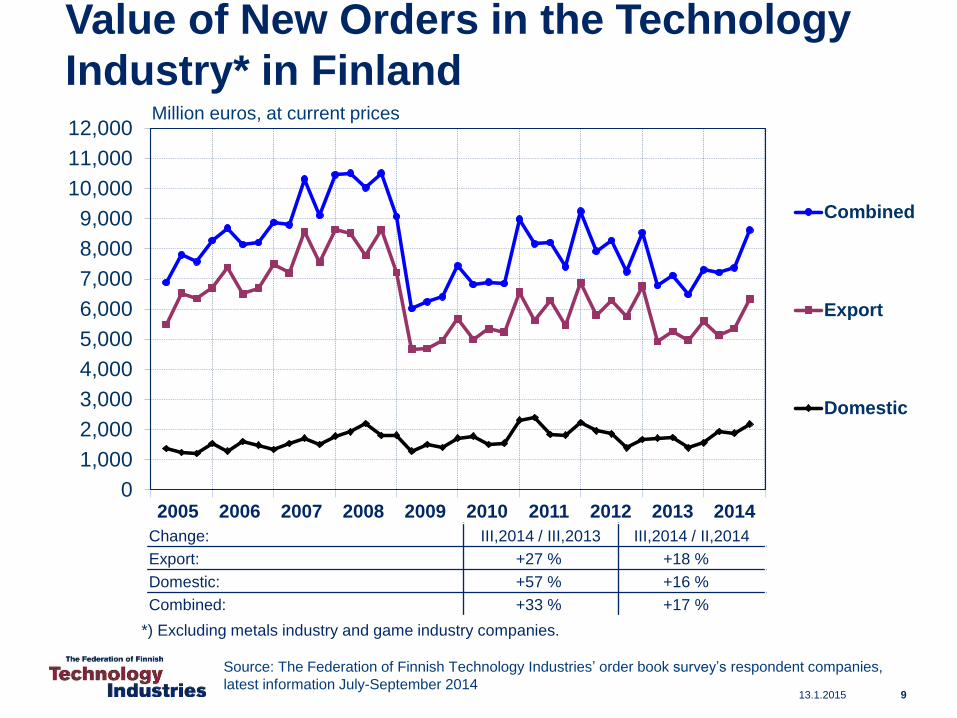
Value of New Orders in the Technology
Industry* in Finland
0
1,000
2,000
3,000
4,000
5,000
6,000
7,000
8,000
9,000
10,000
11,000
12,000
Combined
Export
Domestic
Million euros, at current prices
Source: The Federation of Finnish Technology Industries’ order book survey’s respondent companies,
latest information July-September 2014
*) Excluding metals industry and game industry companies.
2005 2006 2007 2008 2009 2010 2011 2012 2013 2014
Change: III,2014 / III,2013 III,2014 / II,2014
Export: +27 % +18 %
Domestic: +57 % +16 %
Combined: +33 % +17 %
9
13.1.2015
0
2,000
4,000
6,000
8,000
10,000
12,000
14,000
16,000
18,000
20,000
22,000
24,000
Export
Domestic
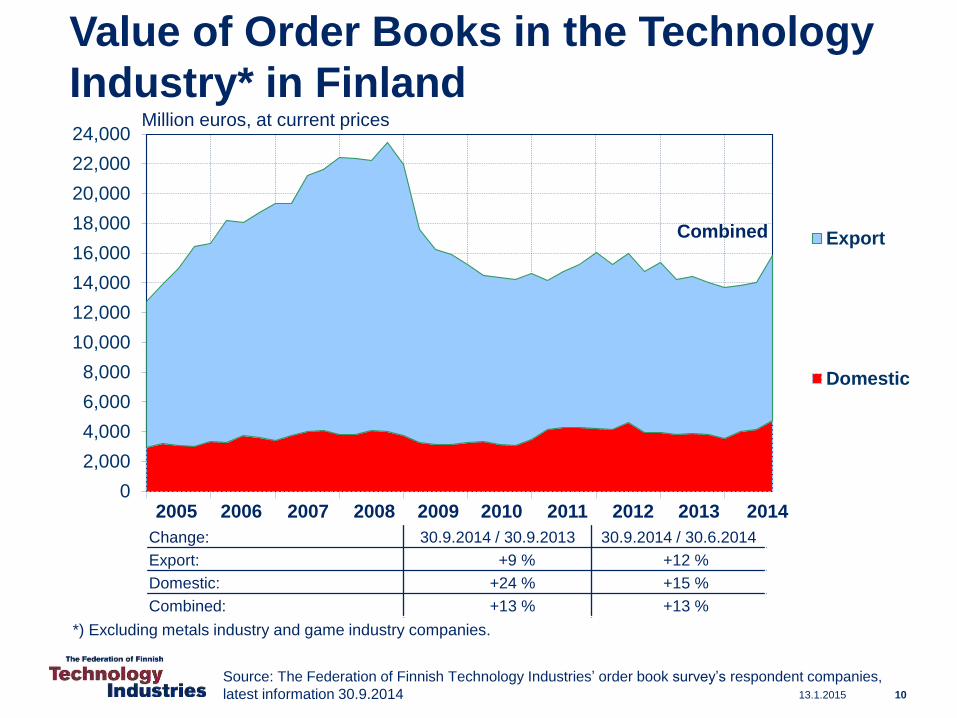
Value of Order Books in the Technology
Industry* in FinlandMillion euros, at current prices
Source: The Federation of Finnish Technology Industries’ order book survey’s respondent companies,
latest information 30.9.2014
*) Excluding metals industry and game industry companies.
Combined
Change: 30.9.2014 / 30.9.2013 30.9.2014 / 30.6.2014
Export: +9 % +12 %
Domestic: +24 % +15 %
Combined: +13 % +13 %
2005 2006 2007 2008 2009 2010 2011 2012 2013 2014
10
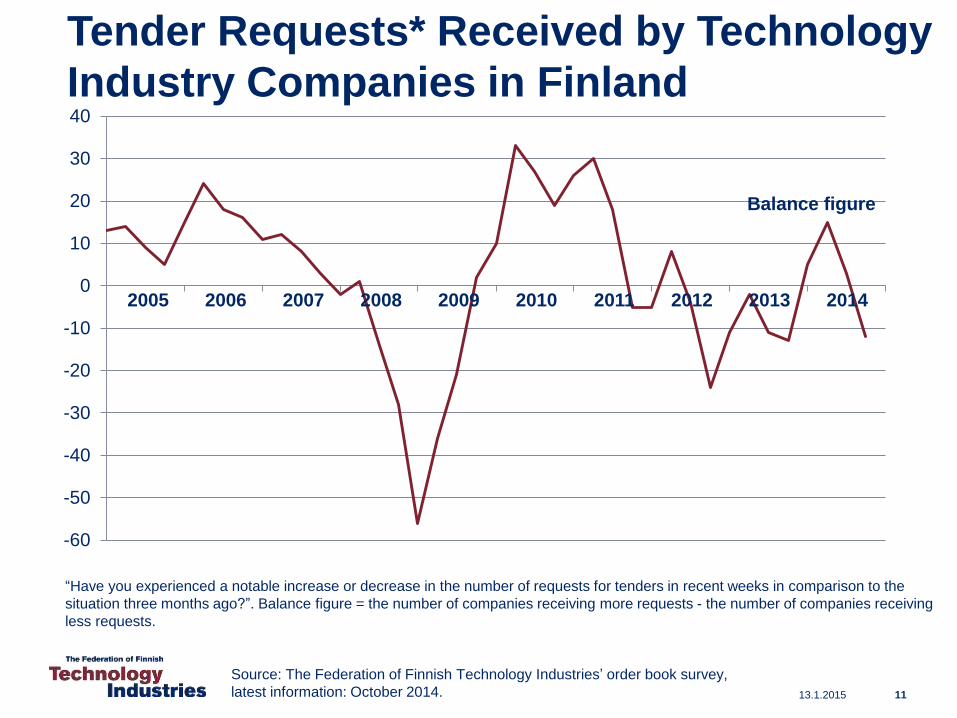
Tender Requests* Received by Technology
Industry Companies in Finland
Source: The Federation of Finnish Technology Industries’ order book survey,
latest information: October 2014.
“Have you experienced a notable increase or decrease in the number of requests for tenders in recent weeks in comparison to the
situation three months ago?”. Balance figure = the number of companies receiving more requests - the number of companies receiving
less requests.
-60
-50
-40
-30
-20
-10
0
10
20
30
40
Balance figure
1113.1.2015
2005 2006 2007 2008 2009 2010 2011 2012 2013 2014
13.1.2015
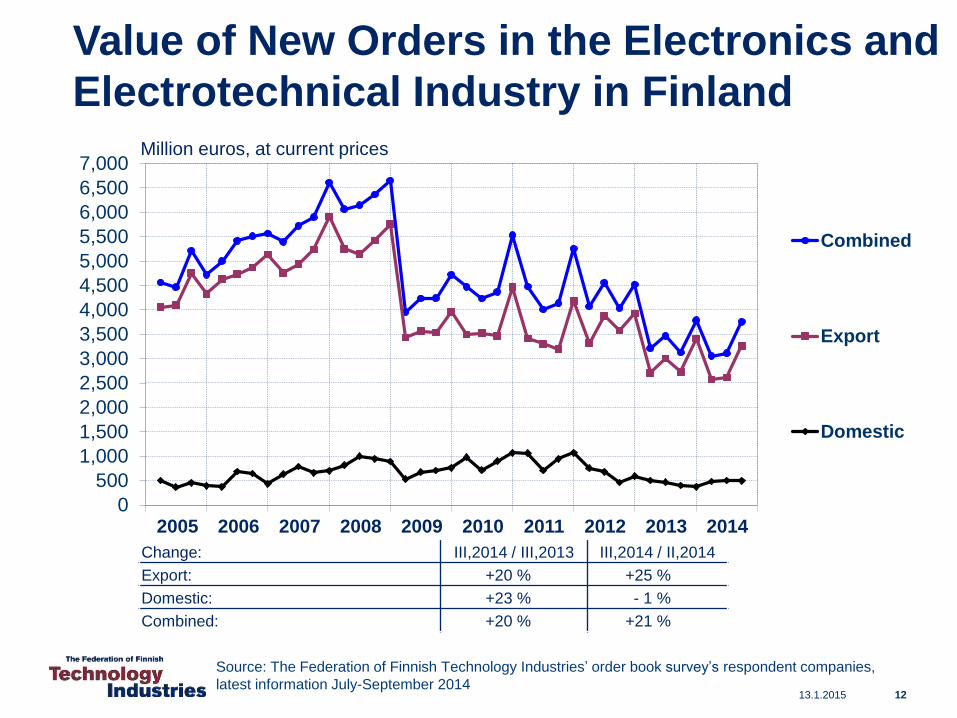
Value of New Orders in the Electronics and
Electrotechnical Industry in Finland
0
500
1,000
1,500
2,000
2,500
3,000
3,500
4,000
4,500
5,000
5,500
6,000
6,500
7,000
Combined
Export
Domestic
Million euros, at current prices
2005 2006 2007 2008 2009 2010 2011 2012 2013 2014
Change: III,2014 / III,2013 III,2014 / II,2014
Export: +20 % +25 %
Domestic: +23 % - 1 %
Combined: +20 % +21 %
Source: The Federation of Finnish Technology Industries’ order book survey’s respondent companies,
latest information July-September 201412
13.1.2015
0
500
1,000
1,500
2,000
2,500
3,000
3,500
4,000
4,500
5,000
5,500
6,000
6,500
7,000
7,500
8,000
Export
Domestic
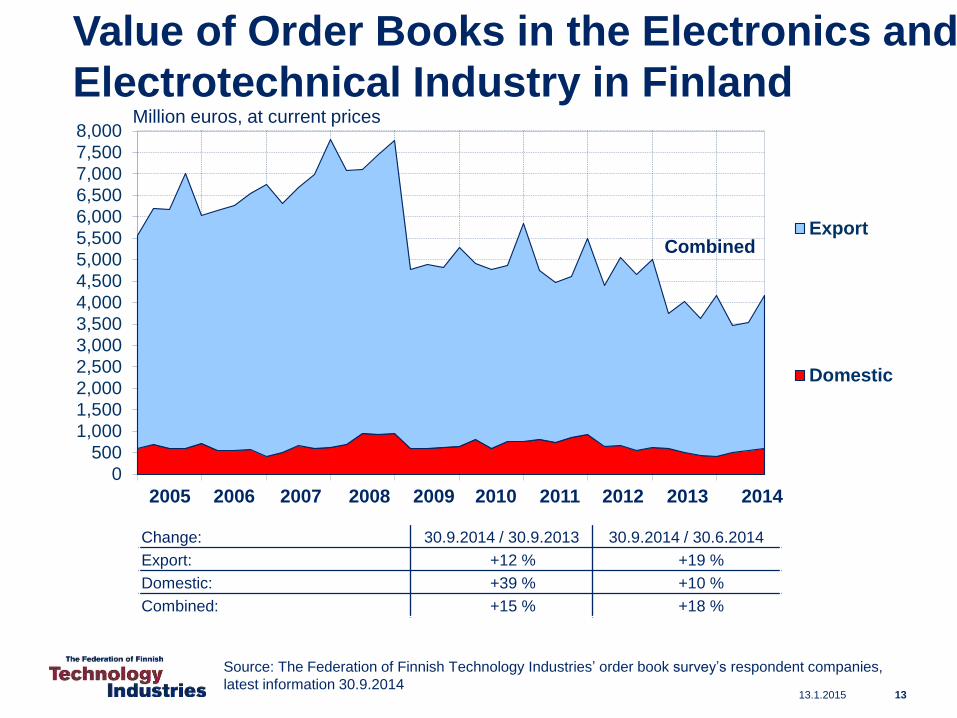
Value of Order Books in the Electronics and
Electrotechnical Industry in Finland
Combined
Million euros, at current prices
Change: 30.9.2014 / 30.9.2013 30.9.2014 / 30.6.2014
Export: +12 % +19 %
Domestic: +39 % +10 %
Combined: +15 % +18 %
Source: The Federation of Finnish Technology Industries’ order book survey’s respondent companies,
latest information 30.9.2014 13
2005 2006 2007 2008 2009 2010 2011 2012 2013 2014
13.1.2015
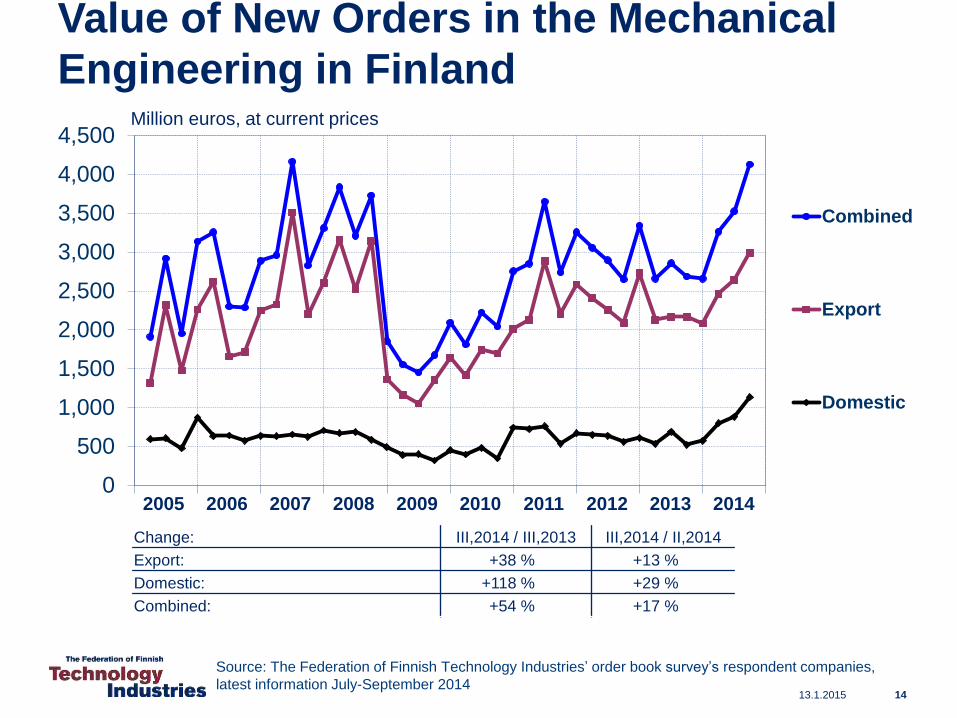
Value of New Orders in the Mechanical
Engineering in Finland
0
500
1,000
1,500
2,000
2,500
3,000
3,500
4,000
4,500
Combined
Export
Domestic
Million euros, at current prices
2005 2006 2007 2008 2009 2010 2011 2012 2013 2014
Change: III,2014 / III,2013 III,2014 / II,2014
Export: +38 % +13 %
Domestic: +118 % +29 %
Combined: +54 % +17 %
Source: The Federation of Finnish Technology Industries’ order book survey’s respondent companies,
latest information July-September 201414
13.1.2015
0
1,000
2,000
3,000
4,000
5,000
6,000
7,000
8,000
9,000
10,000
11,000
12,000
13,000
14,000
15,000
Export
Domestic
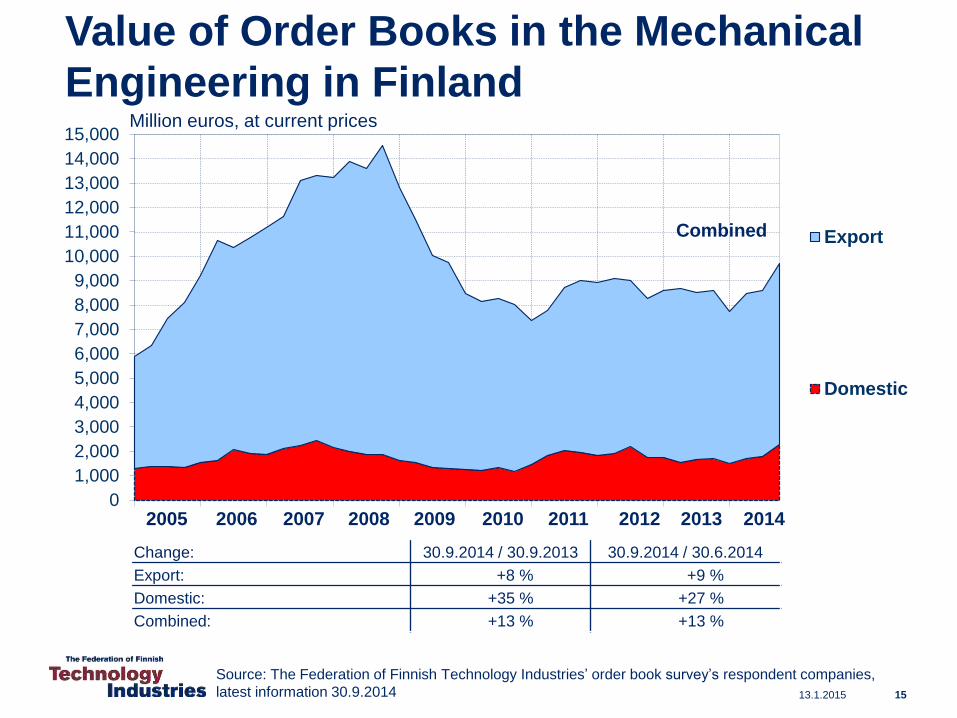
Value of Order Books in the Mechanical
Engineering in Finland
Combined
Million euros, at current prices
Change: 30.9.2014 / 30.9.2013 30.9.2014 / 30.6.2014
Export: +8 % +9 %
Domestic: +35 % +27 %
Combined: +13 % +13 %
2005 2006 2007 2008 2009 2010 2011 2012 2013 2014
Source: The Federation of Finnish Technology Industries’ order book survey’s respondent companies,
latest information 30.9.2014 15
13.1.2015
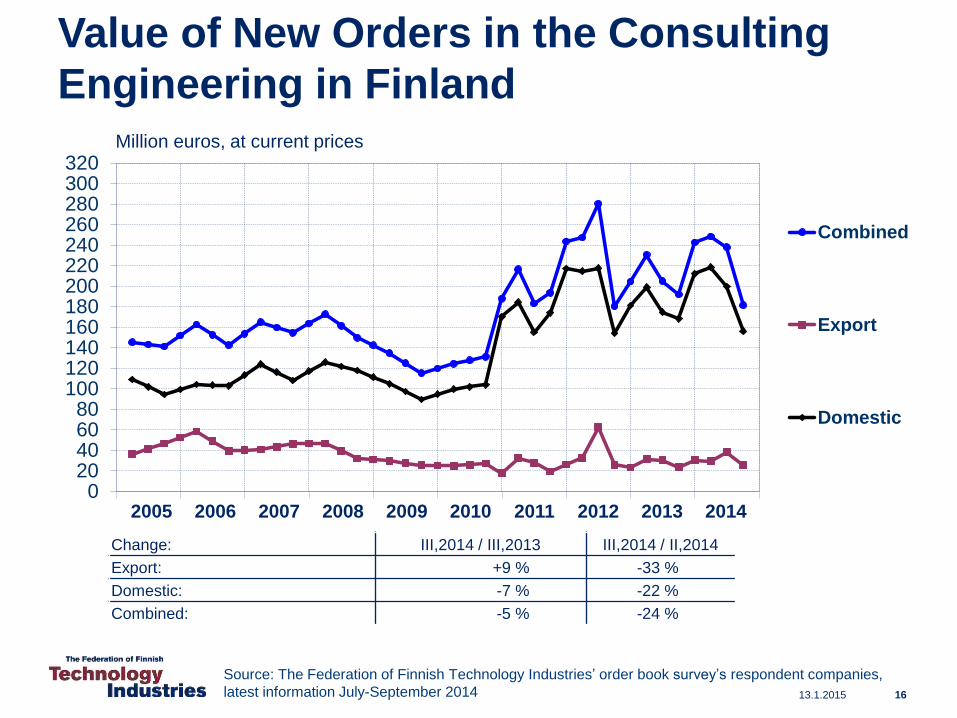
Value of New Orders in the Consulting
Engineering in Finland
020406080
100120140160180200220240260280300320
Combined
Export
Domestic
Million euros, at current prices
2005 2006 2007 2008 2009 2010 2011 2012 2013 2014
Change: III,2014 / III,2013 III,2014 / II,2014
Export: +9 % -33 %
Domestic: -7 % -22 %
Combined: -5 % -24 %
Source: The Federation of Finnish Technology Industries’ order book survey’s respondent companies,
latest information July-September 2014 16
13.1.2015
0
50
100
150
200
250
300
350
400
450
500
550
Export
Domestic
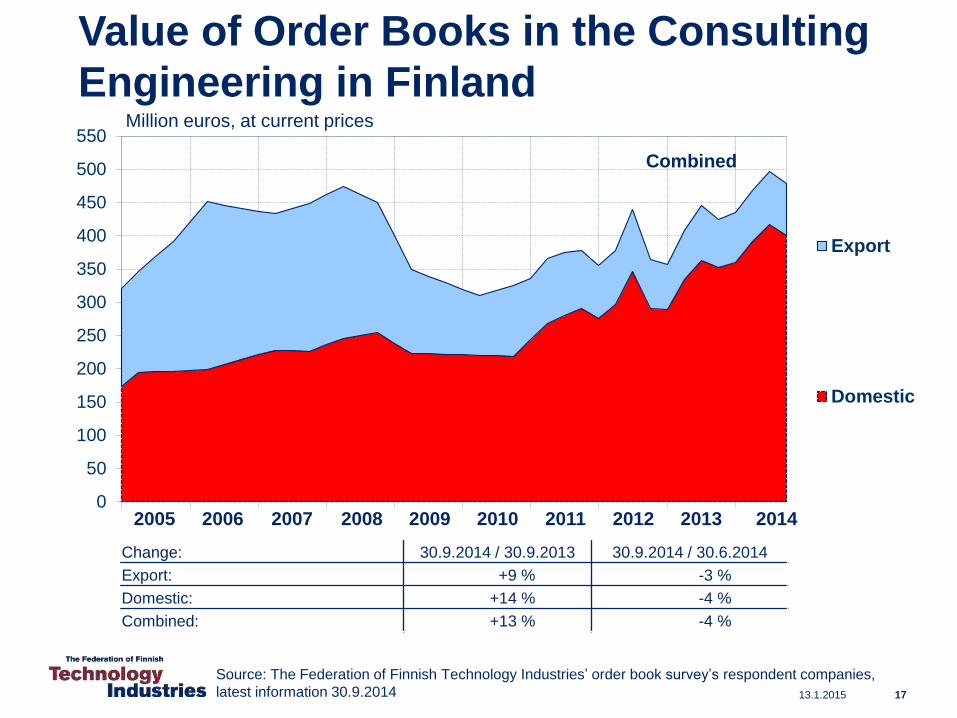
Value of Order Books in the Consulting
Engineering in Finland
Combined
Million euros, at current prices
Source: The Federation of Finnish Technology Industries’ order book survey’s respondent companies,
latest information 30.9.2014
2005 2006 2007 2008 2009 2010 2011 2012 2013 2014
Change: 30.9.2014 / 30.9.2013 30.9.2014 / 30.6.2014
Export: +9 % -3 %
Domestic: +14 % -4 %
Combined: +13 % -4 %
17
13.1.2015
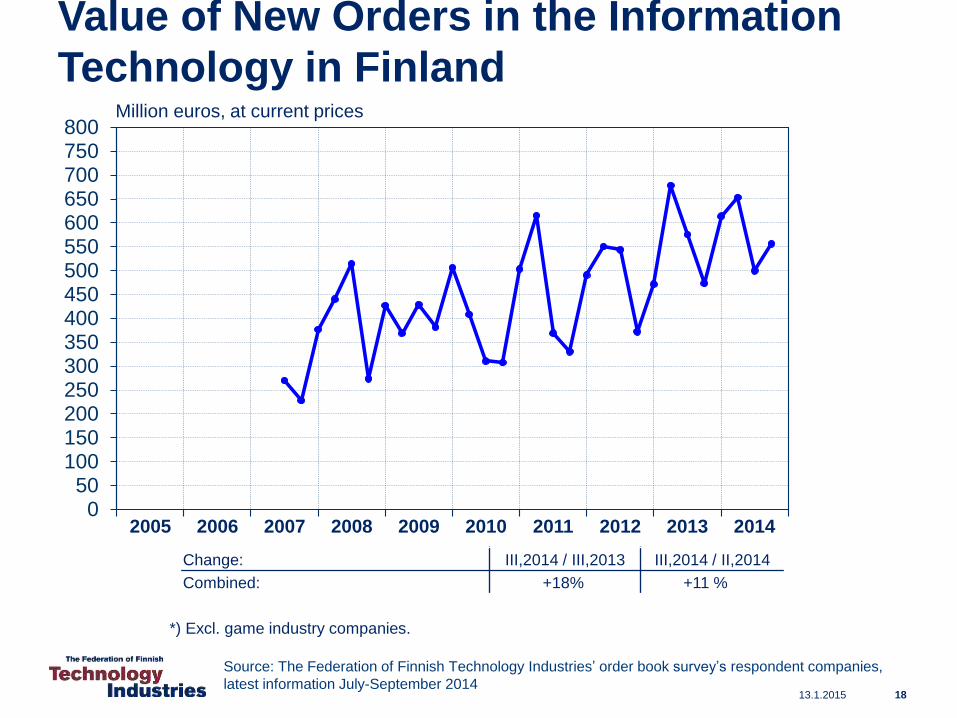
Value of New Orders in the Information
Technology in Finland
050
100150200250300350400450500550600650700750800
Million euros, at current prices
2005 2006 2007 2008 2009 2010 2011 2012 2013 2014
Change: III,2014 / III,2013 III,2014 / II,2014
Combined: +18% +11 %
Source: The Federation of Finnish Technology Industries’ order book survey’s respondent companies,
latest information July-September 201418
*) Excl. game industry companies.
13.1.2015
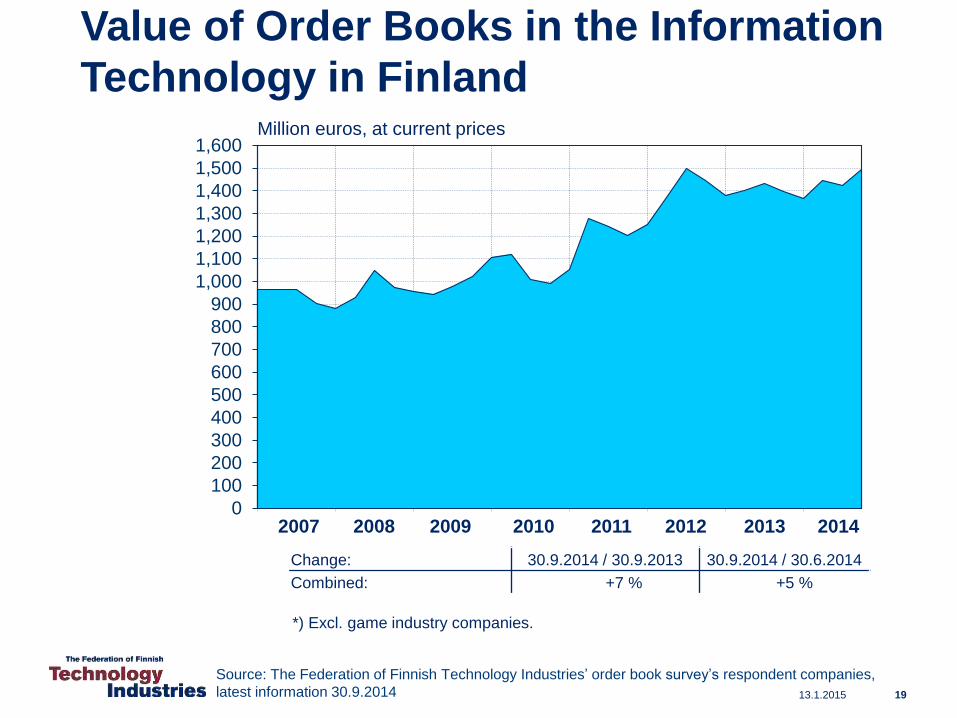
Value of Order Books in the Information
Technology in Finland
0
100
200
300
400
500
600
700
800
900
1,000
1,100
1,200
1,300
1,400
1,500
1,600Million euros, at current prices
2007 2008 2009 2010 2011 2012 2013 2014
Change: 30.9.2014 / 30.9.2013 30.9.2014 / 30.6.2014
Combined: +7 % +5 %
Source: The Federation of Finnish Technology Industries’ order book survey’s respondent companies,
latest information 30.9.2014 19
*) Excl. game industry companies.
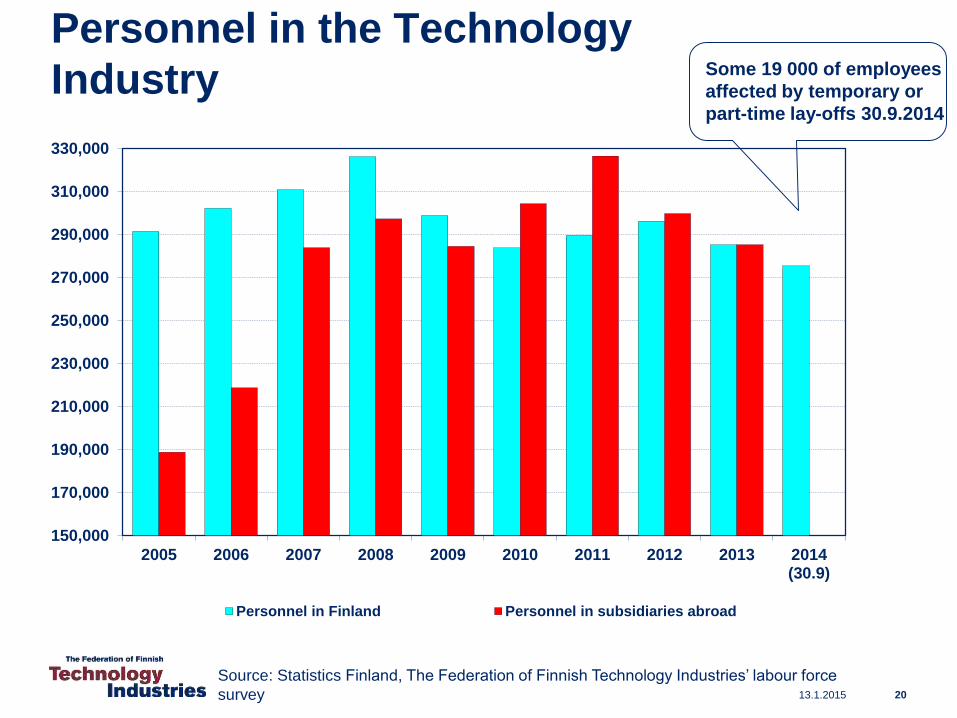
Personnel in the Technology
Industry
150,000
170,000
190,000
210,000
230,000
250,000
270,000
290,000
310,000
330,000
2005 2006 2007 2008 2009 2010 2011 2012 2013 2014(30.9)
Personnel in Finland Personnel in subsidiaries abroad
Source: Statistics Finland, The Federation of Finnish Technology Industries’ labour force
survey
Some 19 000 of employees
affected by temporary or
part-time lay-offs 30.9.2014
13.1.2015 20
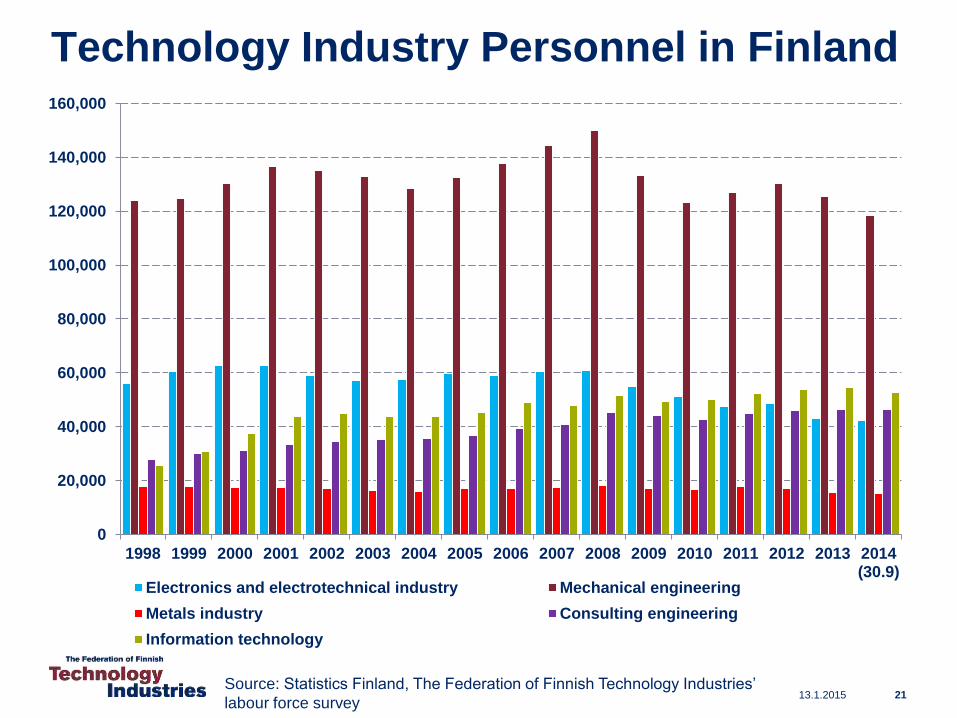
Technology Industry Personnel in Finland
0
20,000
40,000
60,000
80,000
100,000
120,000
140,000
160,000
1998 1999 2000 2001 2002 2003 2004 2005 2006 2007 2008 2009 2010 2011 2012 2013 2014(30.9)
Electronics and electrotechnical industry Mechanical engineering
Metals industry Consulting engineering
Information technology
Source: Statistics Finland, The Federation of Finnish Technology Industries’
labour force survey13.1.2015 21
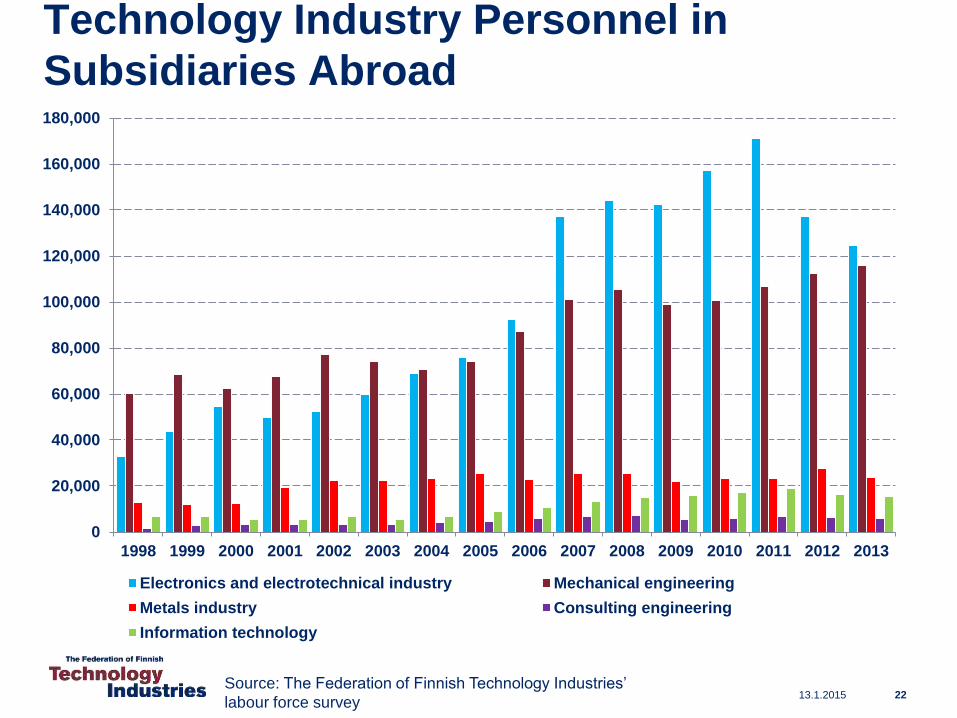
Technology Industry Personnel in
Subsidiaries Abroad
0
20,000
40,000
60,000
80,000
100,000
120,000
140,000
160,000
180,000
1998 1999 2000 2001 2002 2003 2004 2005 2006 2007 2008 2009 2010 2011 2012 2013
Electronics and electrotechnical industry Mechanical engineering
Metals industry Consulting engineering
Information technology
Source: The Federation of Finnish Technology Industries’
labour force survey13.1.2015 22
13.1.2015 23
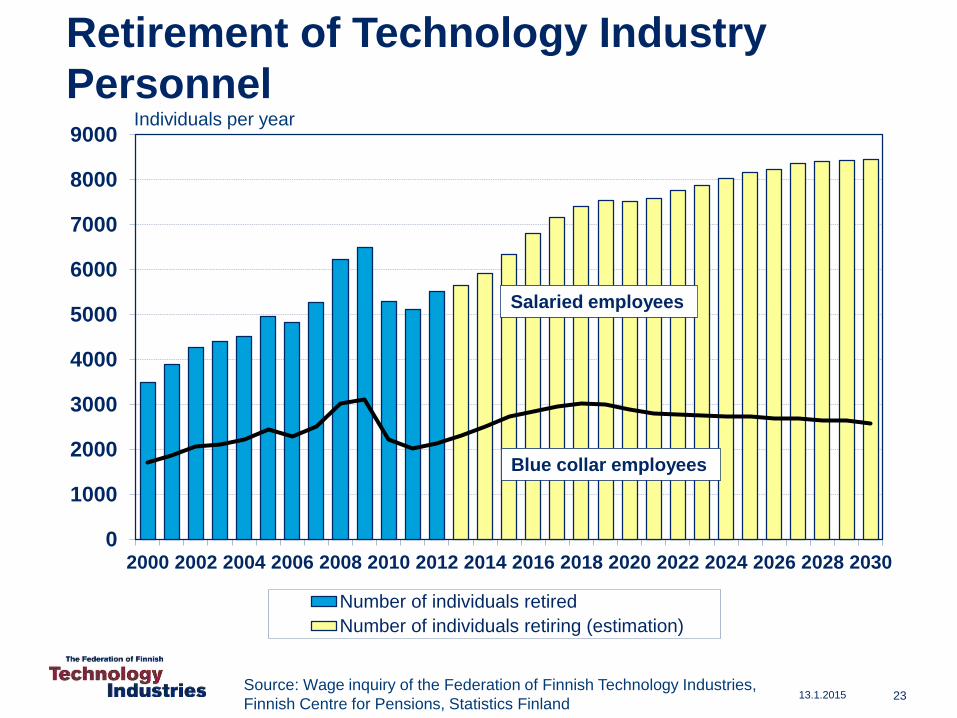
Retirement of Technology Industry
Personnel
0
1000
2000
3000
4000
5000
6000
7000
8000
9000
2000 2002 2004 2006 2008 2010 2012 2014 2016 2018 2020 2022 2024 2026 2028 2030
Number of individuals retired
Number of individuals retiring (estimation)
Source: Wage inquiry of the Federation of Finnish Technology Industries,
Finnish Centre for Pensions, Statistics Finland
Individuals per year
Salaried employees
Blue collar employees
13.1.2015 24
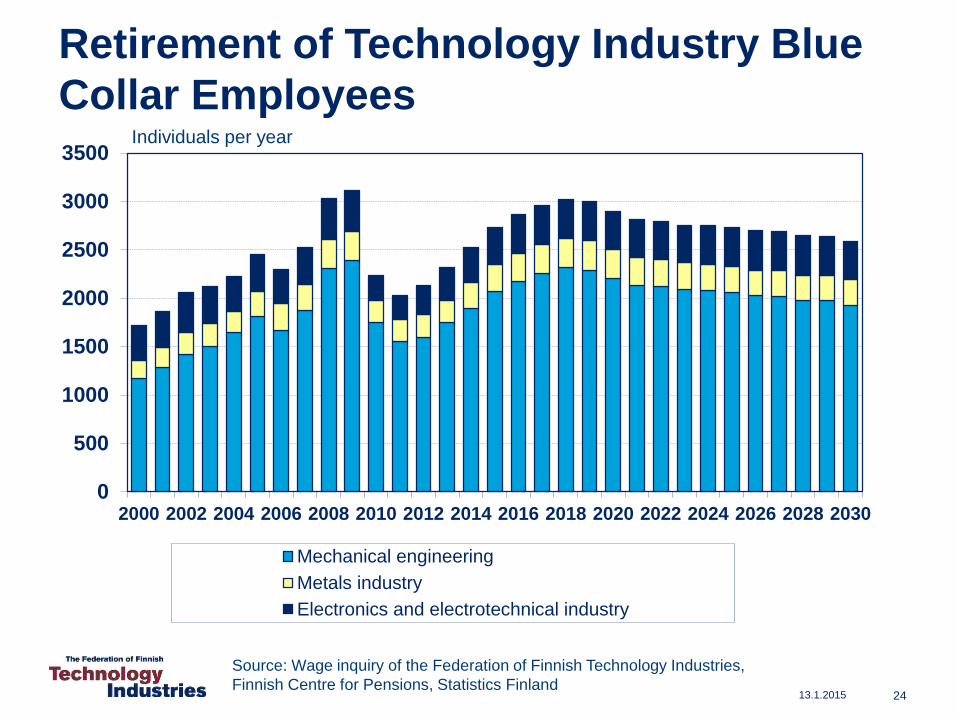
Retirement of Technology Industry Blue
Collar Employees
0
500
1000
1500
2000
2500
3000
3500
2000 2002 2004 2006 2008 2010 2012 2014 2016 2018 2020 2022 2024 2026 2028 2030
Mechanical engineering
Metals industry
Electronics and electrotechnical industry
Source: Wage inquiry of the Federation of Finnish Technology Industries,
Finnish Centre for Pensions, Statistics Finland
Individuals per year
Situational Overview and Outlook
• - Finland is in the grip of structural change. Development remains
uneven between companies.
• - Turnover in Finland in 2013 was some EUR 65 billion. In 2014 turnover
increased slightly compared to 2013. Turnover in the pre-crisis year
2008 was EUR 86 billion.
• - The monetary value of new orders reported between July-September
2014 was 33 % higher than in the corresponding period in 2013, and 17
% higher than in the preceding quarter.
• - At the end of September, the value of order books was 13 % higher
year-on-year, and 13 % above the value reported at the end of June.
• - The turnover of technology industry companies in the beginning of
2015 is expected to be higher than in the corresponding period year
earlier.
• - Since 2008, personnel numbers in Finland have shrunk by 50,000
employees, totalling 276,000 at the end of September 2014.
13.1.2015 25

13.1.2015 26
Increased Uncertainty in
the Global Economy
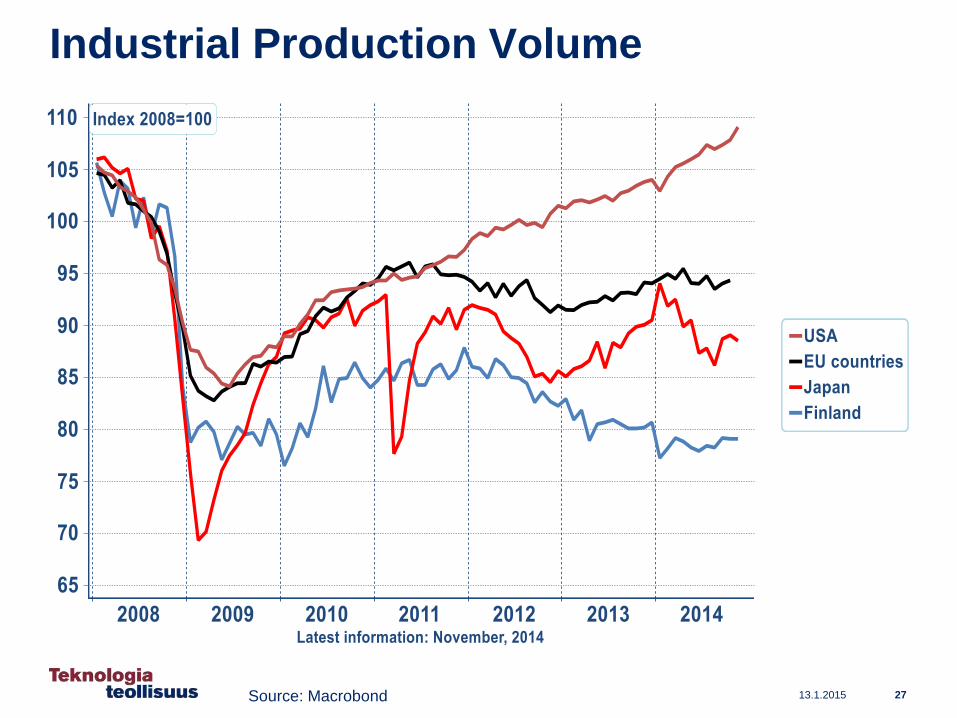
Industrial Production Volume
13.1.2015 27Source: Macrobond
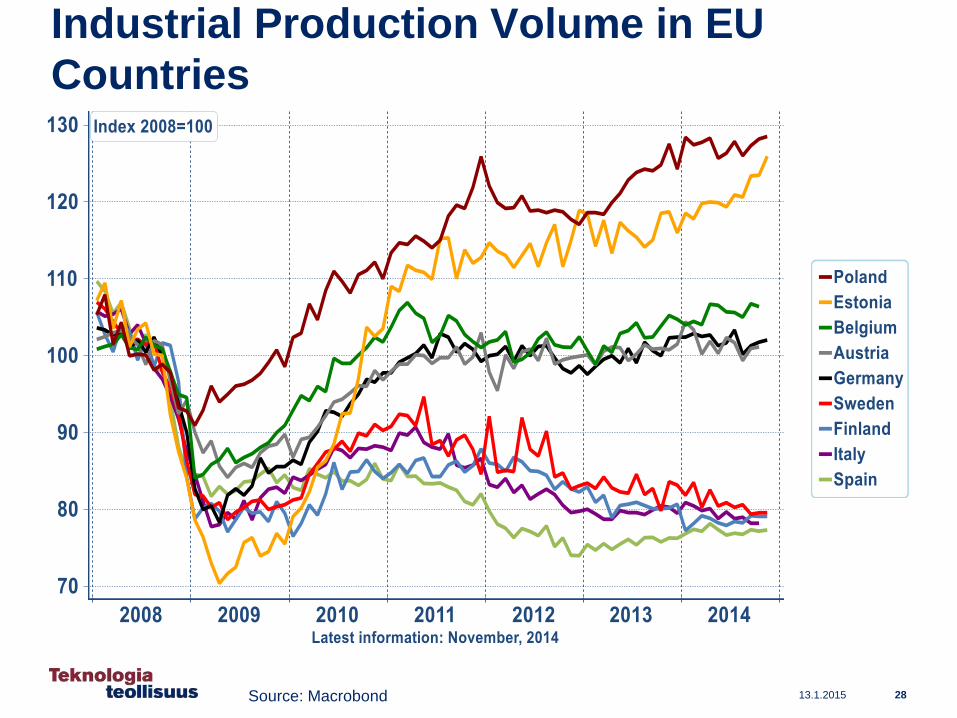
Industrial Production Volume in EU
Countries
13.1.2015 28Source: Macrobond
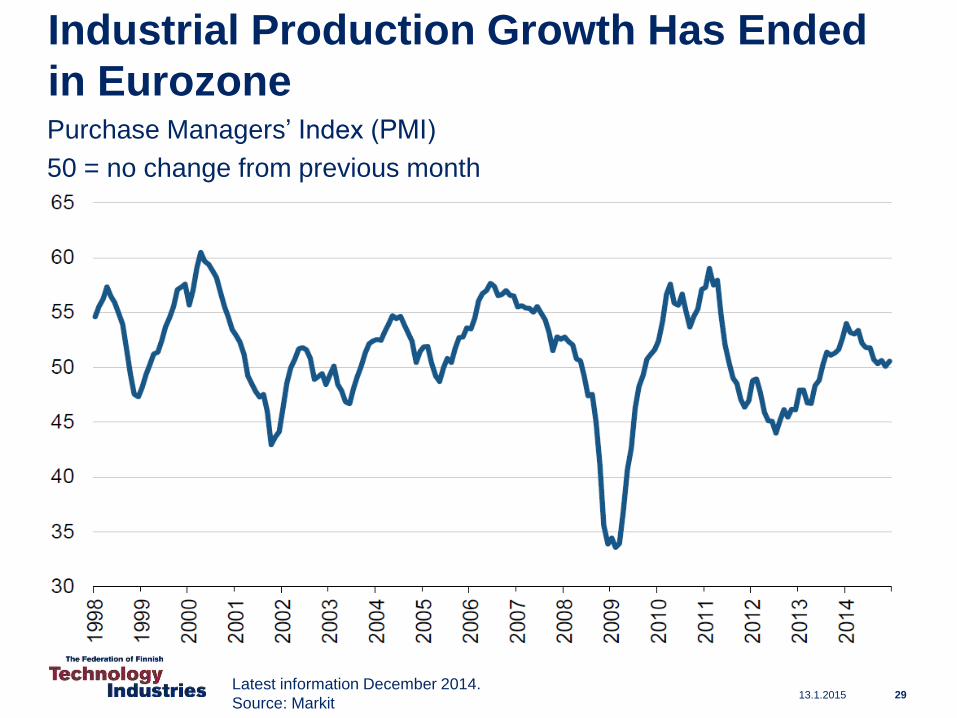
Industrial Production Growth Has Ended
in EurozonePurchase Managers’ Index (PMI)
50 = no change from previous month
13.1.2015 29Latest information December 2014.
Source: Markit
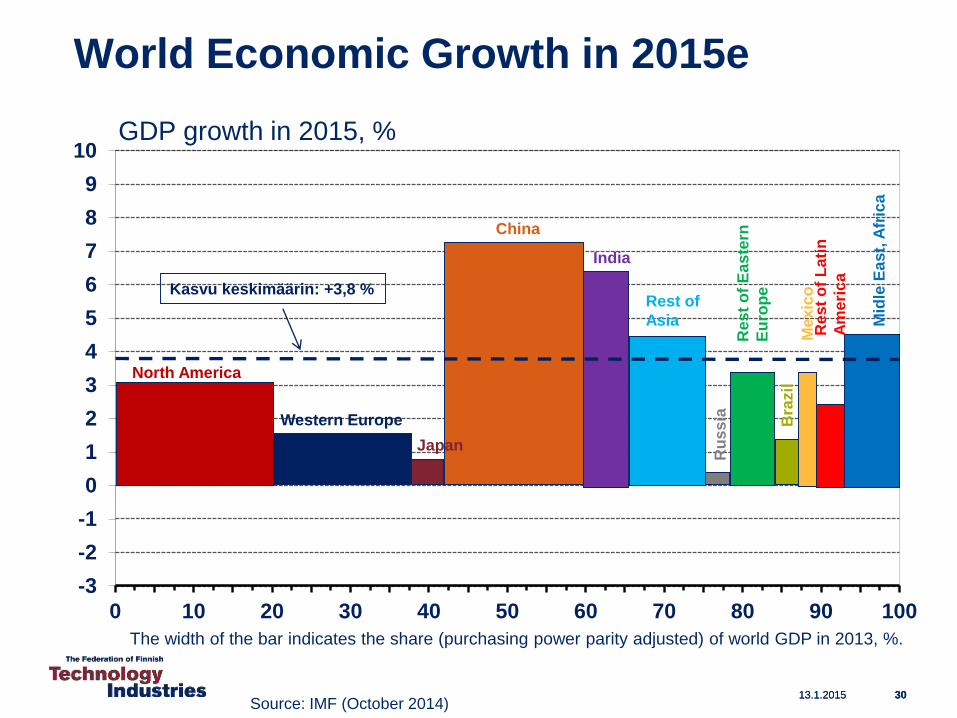
World Economic Growth in 2015e
13.1.2015 30Source: IMF (October 2014)
-3
-2
-1
0
1
2
3
4
5
6
7
8
9
10
0 10 20 30 40 50 60 70 80 90 100
North America
Western Europe
Japan
China
India
Rest of
Asia
Res
to
f E
as
tern
Eu
rop
e
Ru
ss
ia Bra
zil
Me
xic
oR
es
to
f L
ati
n
Am
eri
ca
Mid
leE
as
t, A
fric
a
The width of the bar indicates the share (purchasing power parity adjusted) of world GDP in 2013, %.
Kasvu keskimäärin: +3,8 %
13.1.2015 30
GDP growth in 2015, %
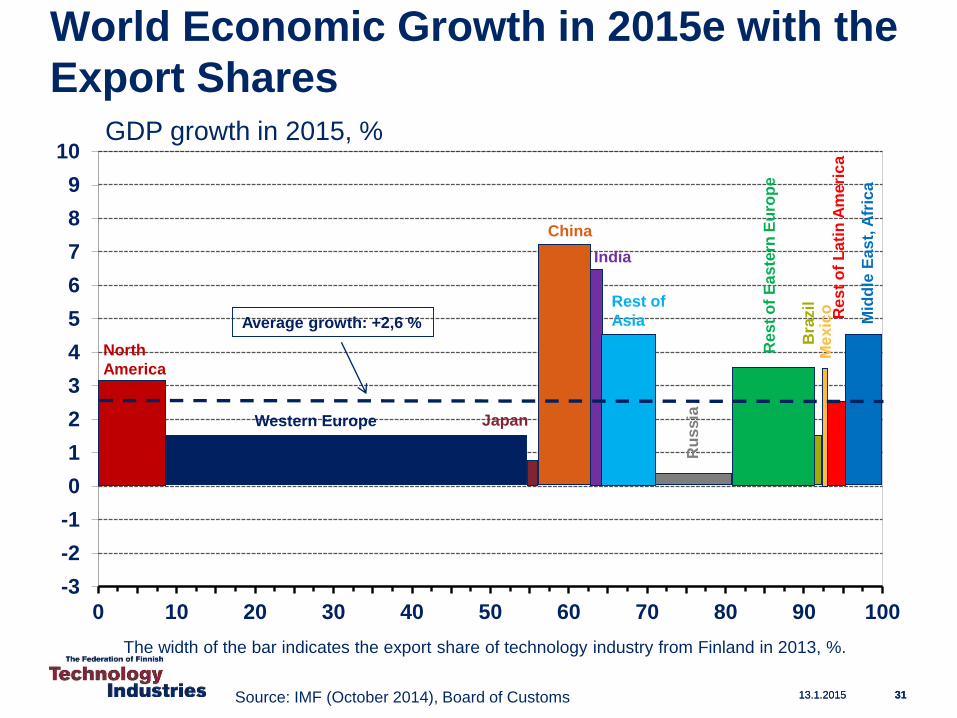
World Economic Growth in 2015e with the
Export Shares
13.1.2015 31
GDP growth in 2015, %
Source: IMF (October 2014), Board of Customs
-3
-2
-1
0
1
2
3
4
5
6
7
8
9
10
0 10 20 30 40 50 60 70 80 90 100
North
America
Western Europe Japan
China
India
Rest of
Asia
Re
st
of
Ea
ste
rn E
uro
pe
Ru
ss
ia
Bra
zil
Me
xic
o Re
st
of
La
tin
Am
eri
ca
Mid
dle
Ea
st,
Afr
ica
The width of the bar indicates the export share of technology industry from Finland in 2013, %.
Average growth: +2,6 %
13.1.2015 31
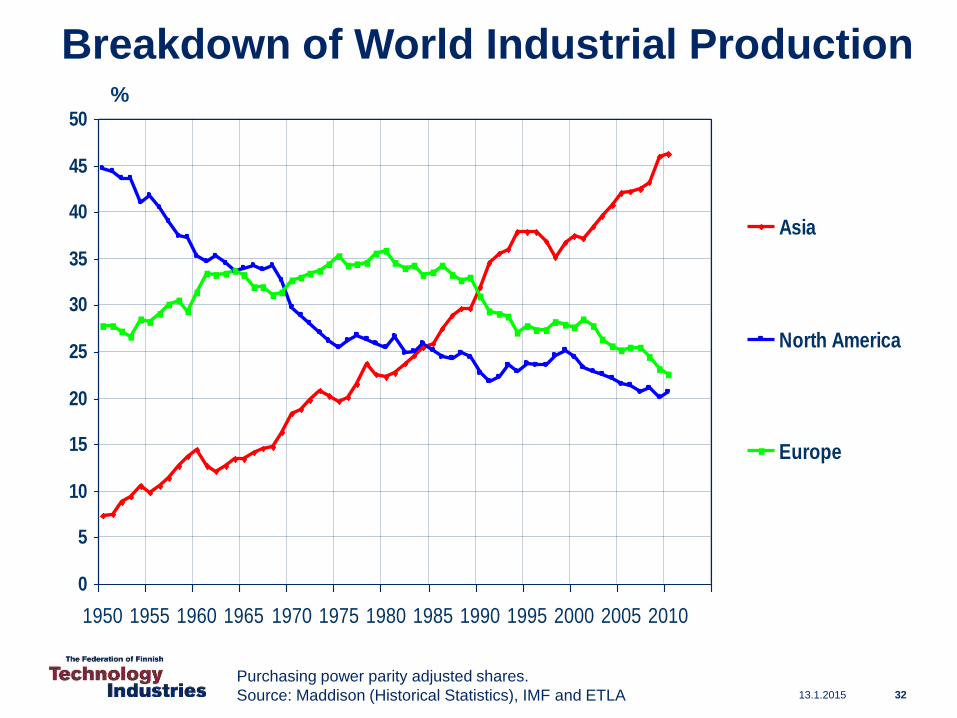
13.1.2015 32
Breakdown of World Industrial Production
0
5
10
15
20
25
30
35
40
45
50
1950 1955 1960 1965 1970 1975 1980 1985 1990 1995 2000 2005 2010
Asia
North America
Europe
Purchasing power parity adjusted shares.
Source: Maddison (Historical Statistics), IMF and ETLA
%
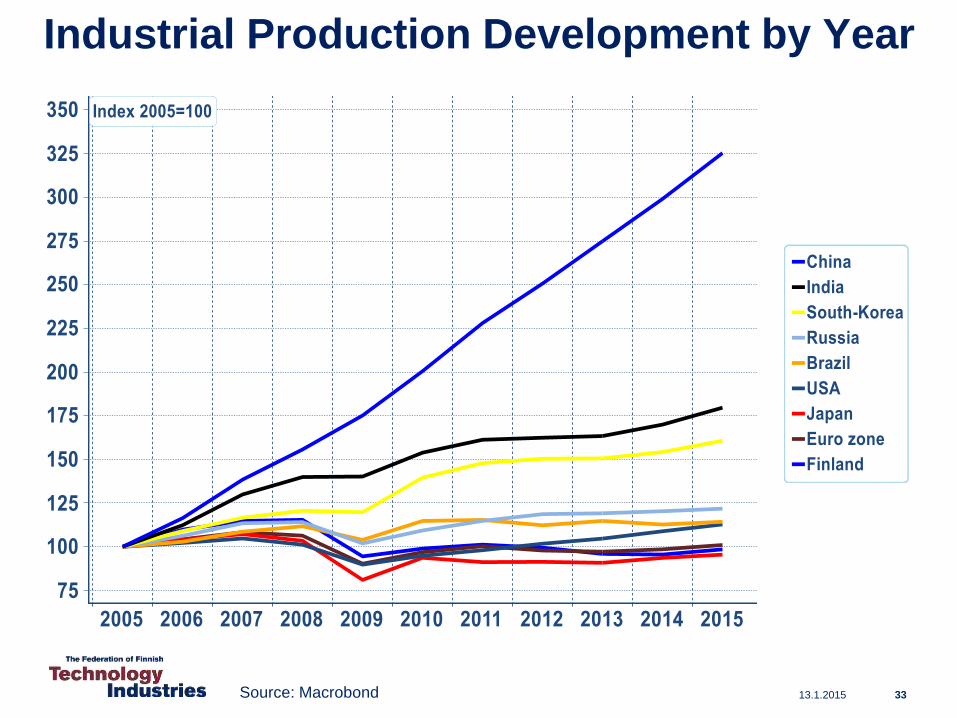
Industrial Production Development by Year
13.1.2015 33Source: Macrobond
13.1.2015 34
The Big Challenge for
Finland after 2008
13.1.2015
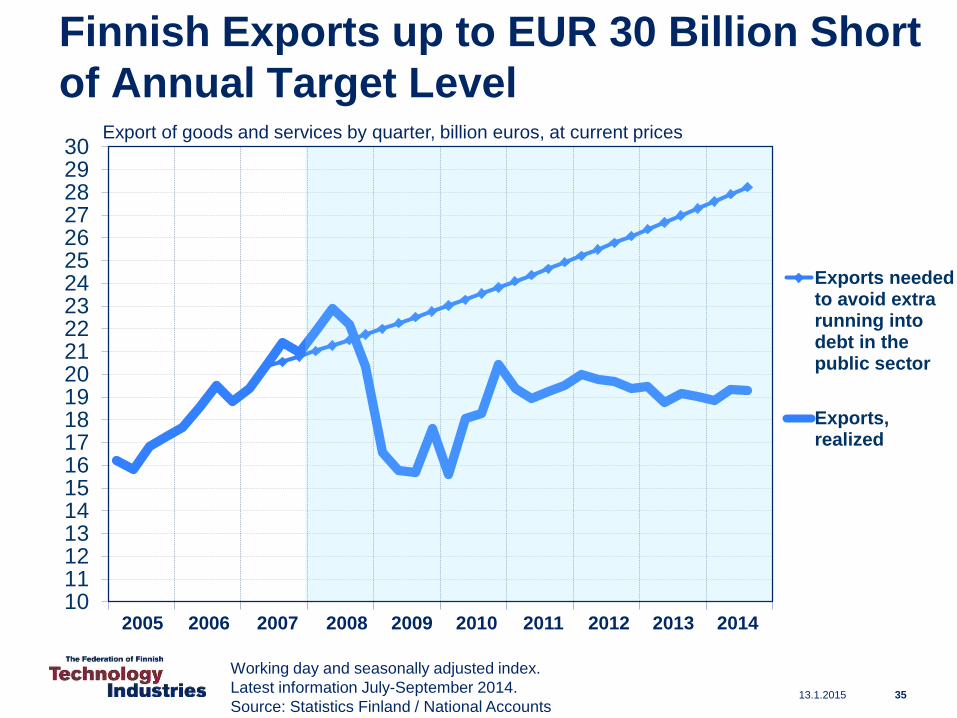
Finnish Exports up to EUR 30 Billion Short
of Annual Target Level
101112131415161718192021222324252627282930
Exports neededto avoid extrarunning intodebt in thepublic sector
Exports,realized
Working day and seasonally adjusted index.
Latest information July-September 2014.
Source: Statistics Finland / National Accounts
Export of goods and services by quarter, billion euros, at current prices
35
2005 2006 2007 2008 2009 2010 2011 2012 2013 2014
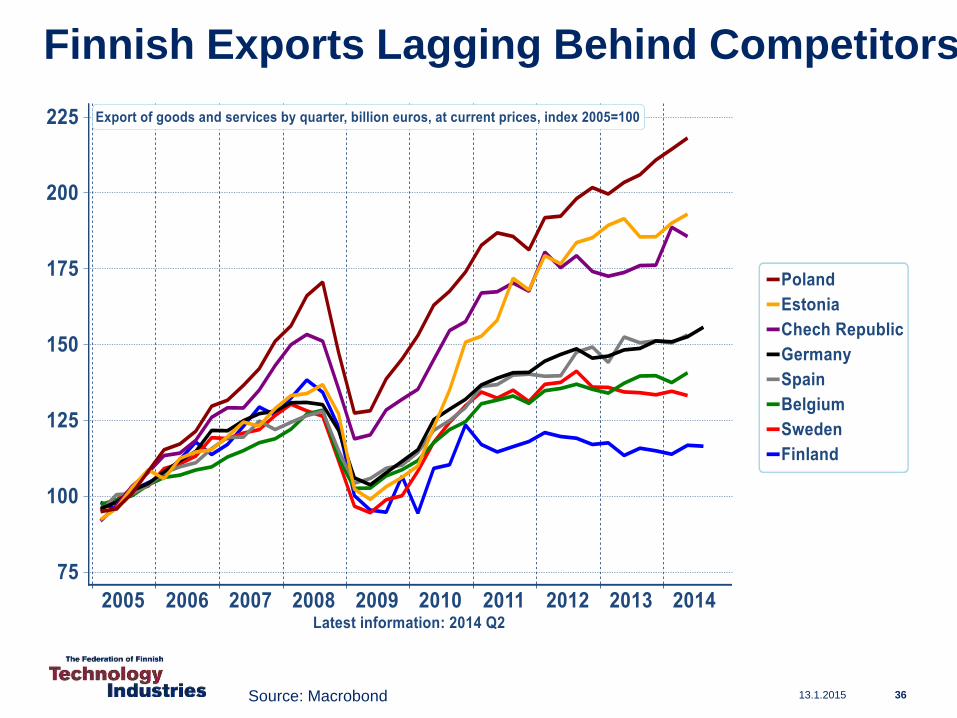
Finnish Exports Lagging Behind Competitors
13.1.2015 36Source: Macrobond
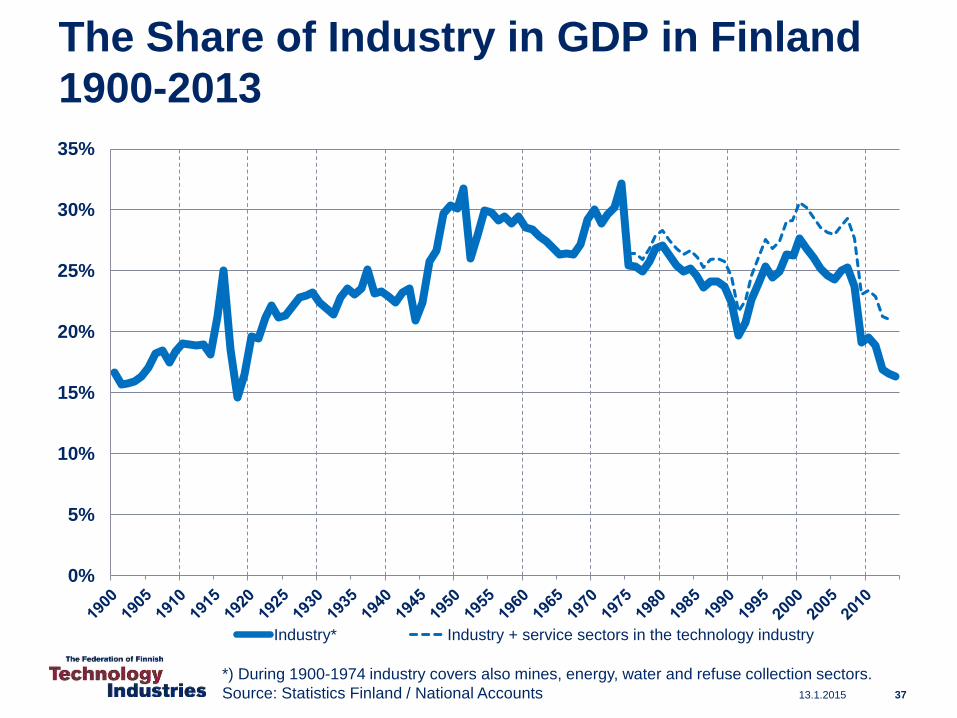
The Share of Industry in GDP in Finland
1900-2013
0%
5%
10%
15%
20%
25%
30%
35%
Industry* Industry + service sectors in the technology industry
*) During 1900-1974 industry covers also mines, energy, water and refuse collection sectors.
Source: Statistics Finland / National Accounts 13.1.2015 37
13.1.2015
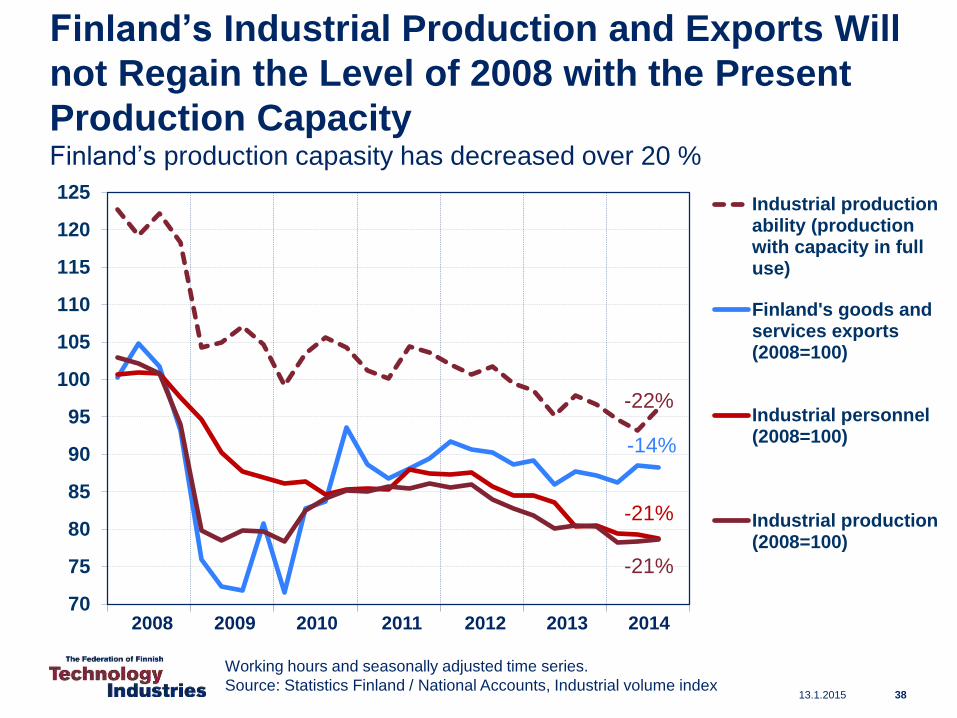
Finland’s Industrial Production and Exports Will
not Regain the Level of 2008 with the Present
Production CapacityFinland’s production capasity has decreased over 20 %
70
75
80
85
90
95
100
105
110
115
120
125Industrial productionability (productionwith capacity in fulluse)
Finland's goods andservices exports(2008=100)
Industrial personnel(2008=100)
Industrial production(2008=100)
-21%
-21%
-14%
Working hours and seasonally adjusted time series.
Source: Statistics Finland / National Accounts, Industrial volume index38
2008 2009 2010 2011 2012 2013 2014
-22%
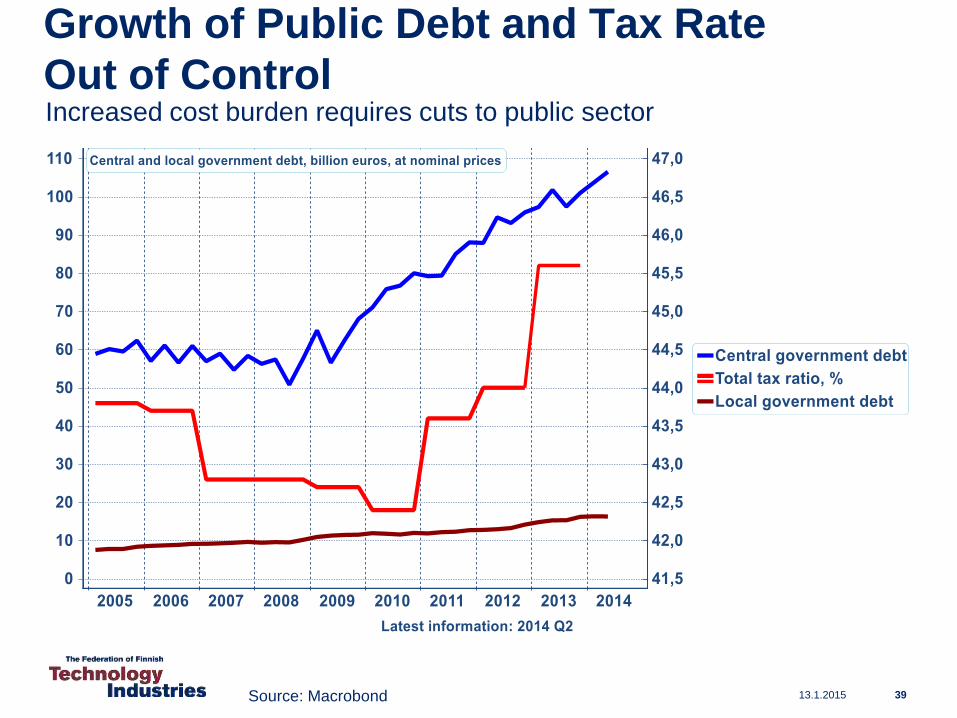
Growth of Public Debt and Tax Rate
Out of Control
13.1.2015 39
Increased cost burden requires cuts to public sector
Source: Macrobond
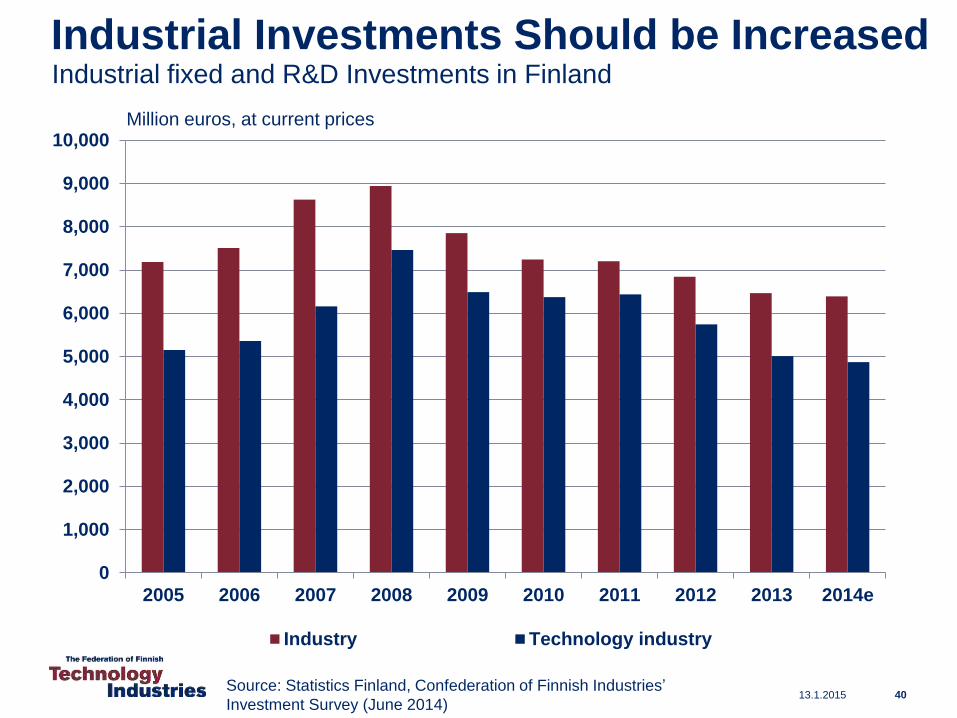
Industrial Investments Should be Increased
0
1,000
2,000
3,000
4,000
5,000
6,000
7,000
8,000
9,000
10,000
2005 2006 2007 2008 2009 2010 2011 2012 2013 2014e
Industry Technology industry
Industrial fixed and R&D Investments in Finland
Source: Statistics Finland, Confederation of Finnish Industries’
Investment Survey (June 2014)13.1.2015 40
Million euros, at current prices
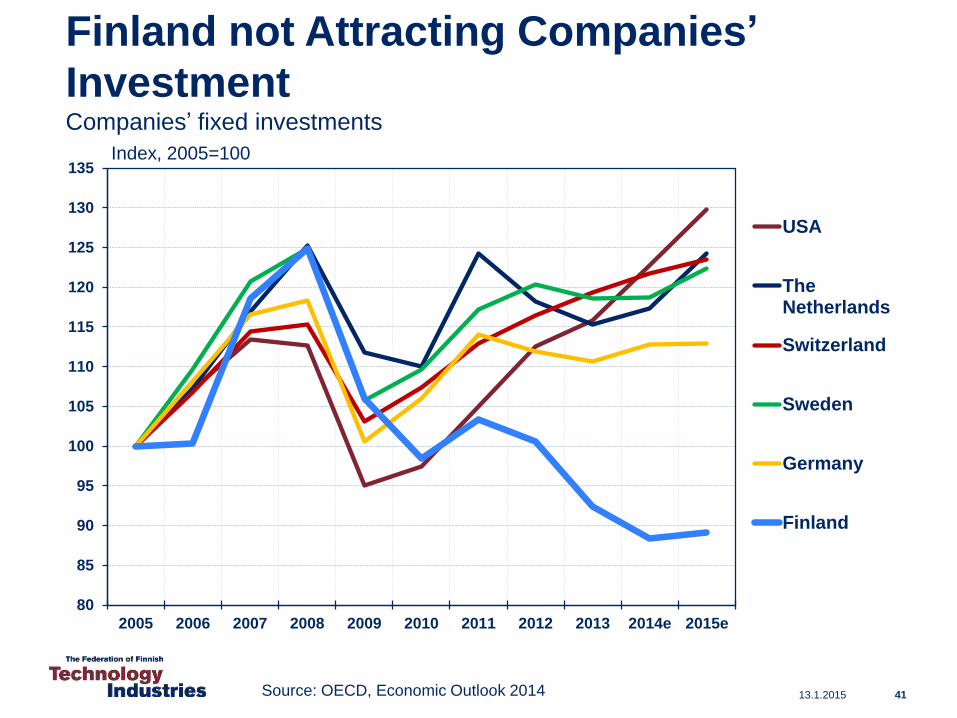
13.1.2015 41
80
85
90
95
100
105
110
115
120
125
130
135
2005 2006 2007 2008 2009 2010 2011 2012 2013 2014e 2015e
USA
TheNetherlands
Switzerland
Sweden
Germany
Finland
Finland not Attracting Companies’
InvestmentCompanies’ fixed investments
Source: OECD, Economic Outlook 2014
Index, 2005=100
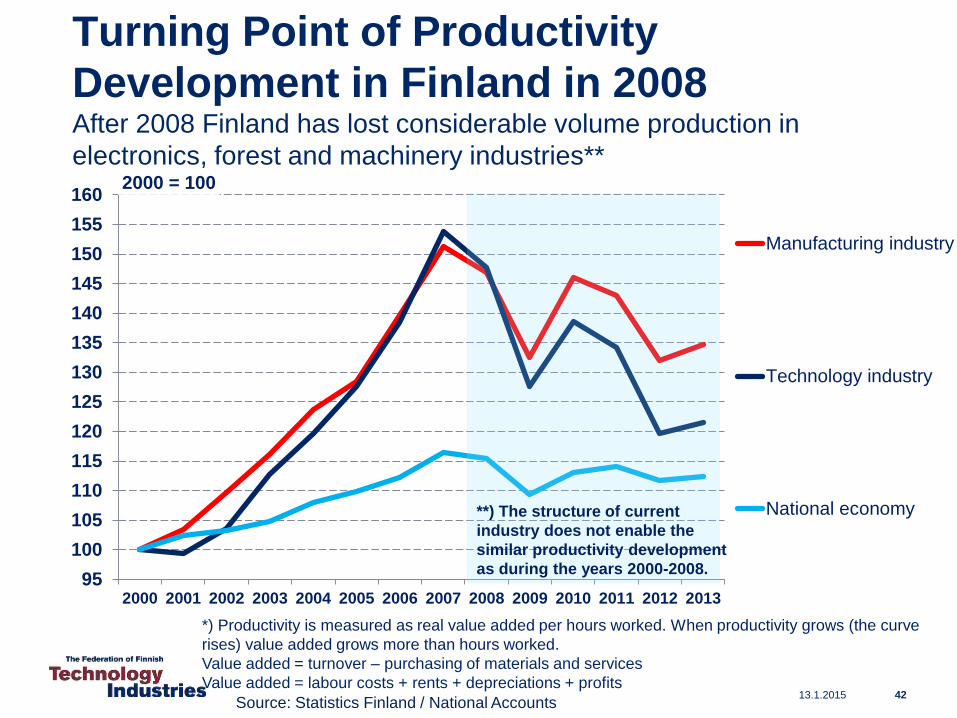
Turning Point of Productivity
Development in Finland in 2008After 2008 Finland has lost considerable volume production in
electronics, forest and machinery industries**
95
100
105
110
115
120
125
130
135
140
145
150
155
160
2000 2001 2002 2003 2004 2005 2006 2007 2008 2009 2010 2011 2012 2013
2000 = 100
Manufacturing industry
Technology industry
National economy
Source: Statistics Finland / National Accounts
*) Productivity is measured as real value added per hours worked. When productivity grows (the curve
rises) value added grows more than hours worked.
Value added = turnover – purchasing of materials and services
Value added = labour costs + rents + depreciations + profits13.1.2015 42
**) The structure of current
industry does not enable the
similar productivity development
as during the years 2000-2008.
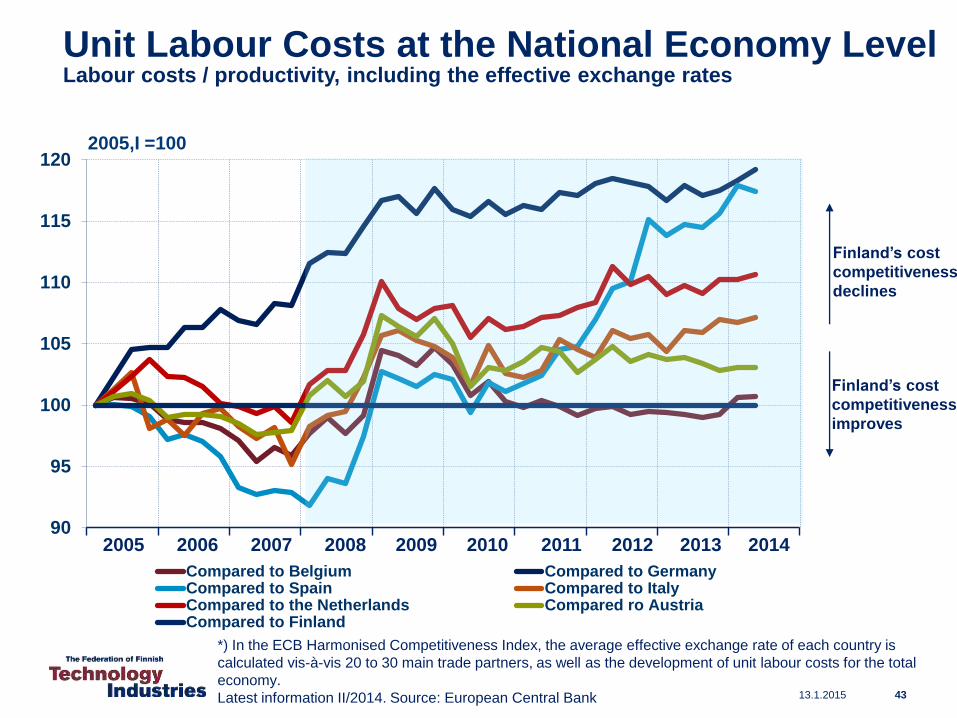
Unit Labour Costs at the National Economy Level Labour costs / productivity, including the effective exchange rates
90
95
100
105
110
115
120
Compared to Belgium Compared to GermanyCompared to Spain Compared to ItalyCompared to the Netherlands Compared ro AustriaCompared to Finland
*) In the ECB Harmonised Competitiveness Index, the average effective exchange rate of each country is
calculated vis-à-vis 20 to 30 main trade partners, as well as the development of unit labour costs for the total
economy.
Latest information II/2014. Source: European Central Bank
Finland’s cost
competitiveness
declines
2005,I =100
Finland’s cost
competitiveness
improves
13.1.2015 43
2005 2006 2007 2008 2009 2010 2011 2012 2013 2014
44
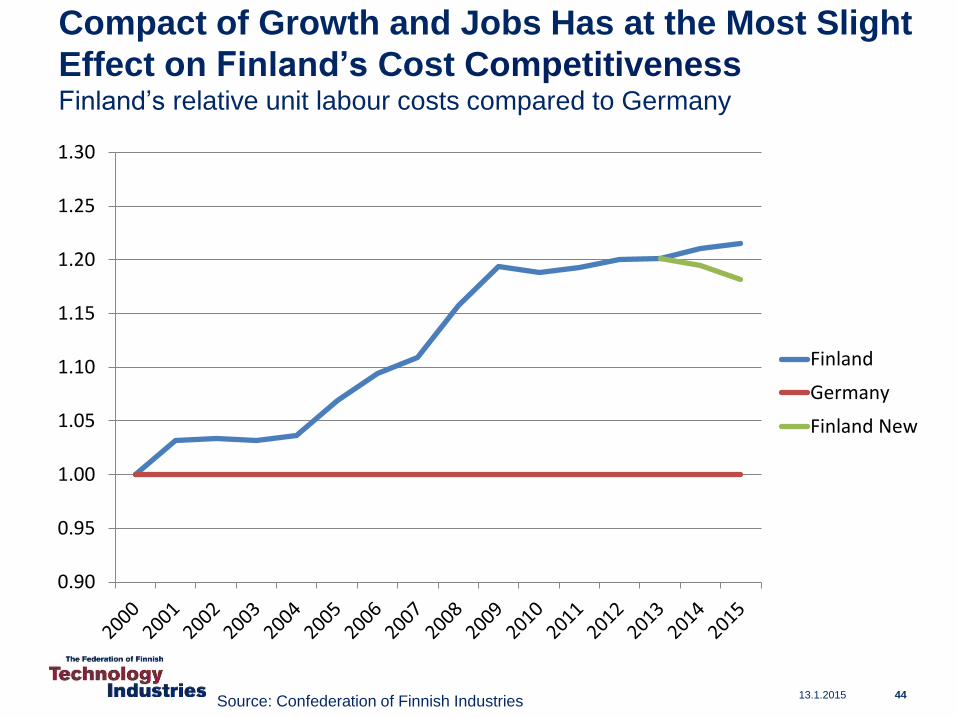
Compact of Growth and Jobs Has at the Most Slight
Effect on Finland’s Cost CompetitivenessFinland’s relative unit labour costs compared to Germany
0.90
0.95
1.00
1.05
1.10
1.15
1.20
1.25
1.30
Finland
Germany
Finland New
Source: Confederation of Finnish Industries13.1.2015
What should be done?
• Support the renewal of the industry
• Taxes should support growth and investment in Finland
• Support decision making in companies related to
compensation and working time
• No new European nor national burdens on companies,
which are deteriorating the competitiveness
13.1.2015 45
Long-Term Outlook and Challenges
• Global Structural Change Set to Continue Apace
– Industrial production and services will relocate to rapidly developing
economic areas
– Strong growth, large markets, cheap labour and increasing expertise will
increase the attractiveness of these regions.
• Competition over Skills and Raw Materials Set to Increase
– Due to an increase in retirement, the sector’s annual recruitment need in
Finland will rise considerably in the coming years.
– The availability of reasonably-priced energy also threatens to become an
investment bottleneck in Finland
• Combating Climate Change
– A challenge as costs are set to grow faster than in competitor countries
– An opportunity for new environmental and energy technologies
13.1.2015 46
The Federation of
Finnish Technology
Industries
13.1.2015 47
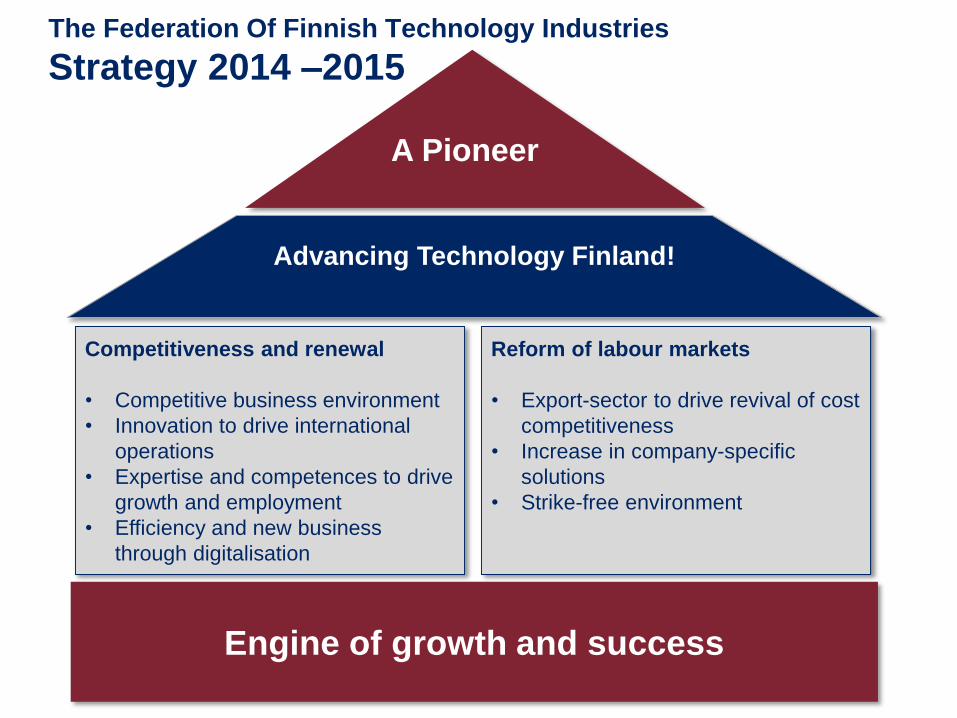
The Federation Of Finnish Technology Industries
Strategy 2014 –2015
Engine of growth and success
Advancing Technology Finland!
A Pioneer
Competitiveness and renewal
• Competitive business environment
• Innovation to drive international
operations
• Expertise and competences to drive
growth and employment
• Efficiency and new business
through digitalisation
Reform of labour markets
• Export-sector to drive revival of cost
competitiveness
• Increase in company-specific
solutions
• Strike-free environment
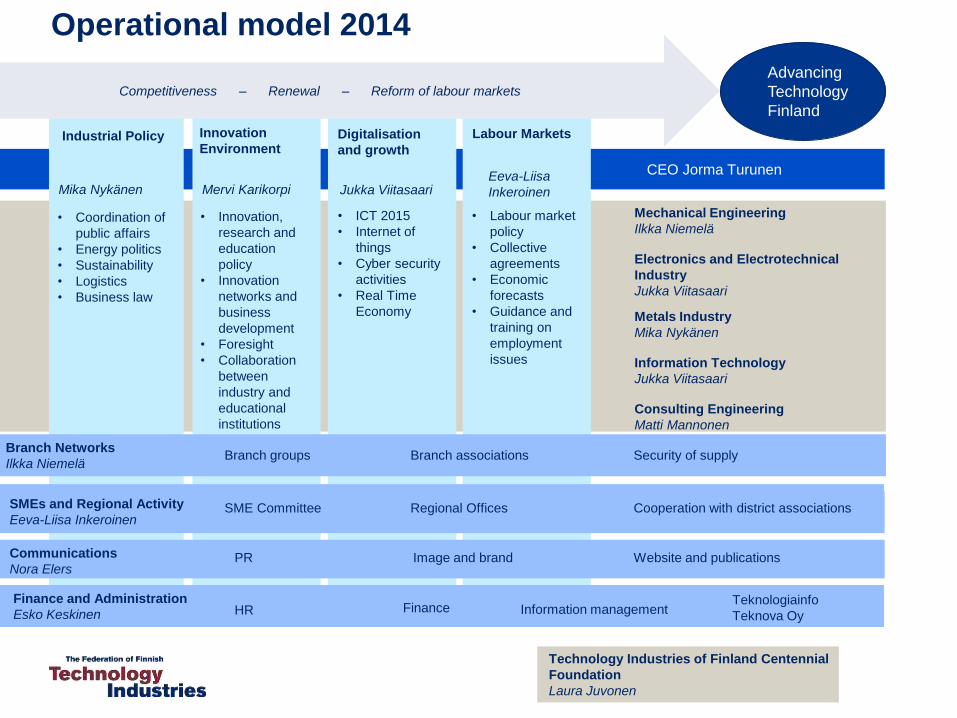
Technology Industries of Finland Centennial
Foundation
Laura Juvonen
Communications
Nora Elers
Operational model 2014
Industrial Policy
• Coordination of
public affairs
• Energy politics
• Sustainability
• Logistics
• Business law
Innovation
Environment
• Innovation,
research and
education
policy
• Innovation
networks and
business
development
• Foresight
• Collaboration
between
industry and
educational
institutions
Communications
Nora Elers
AluetoimistotYrittäjävaliokunta Piiriyhdistysyhteistyö
PR Image and brand
Mechanical Engineering
Ilkka Niemelä
Electronics and Electrotechnical
Industry
Jukka Viitasaari
Metals Industry
Mika Nykänen
Information Technology
Jukka Viitasaari
Consulting Engineering
Matti Mannonen
CEO Jorma Turunen
Advancing
Technology
Finland
Labour Markets
Website and publications
• Labour market
policy
• Collective
agreements
• Economic
forecasts
• Guidance and
training on
employment
issues
Digitalisation
and growth
• ICT 2015
• Internet of
things
• Cyber security
activities
• Real Time
Economy
Competitiveness – Renewal – Reform of labour markets
Eeva-Liisa
InkeroinenJukka ViitasaariMervi KarikorpiMika Nykänen
Regional Activity and Services
Eeva-Liisa Inkeroinen
SMEs and Regional Activity
Eeva-Liisa InkeroinenSME Committee Regional Offices Cooperation with district associations
Finance and Administration
Esko Keskinen HR Finance Information managementTeknologiainfo
Teknova Oy
Branch Networks
Ilkka NiemeläBranch groups Branch associations Security of supply
13.1.2015 50
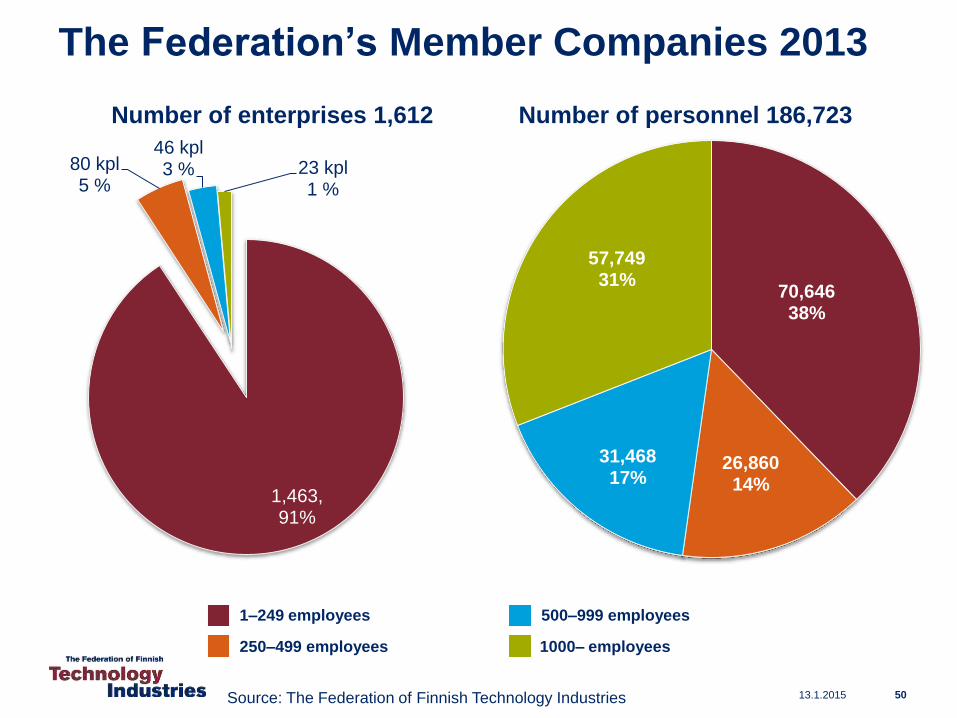
The Federation’s Member Companies 2013
1,463, 91%
80 kpl5 %
46 kpl3 % 23 kpl
1 %
Source: The Federation of Finnish Technology Industries
Number of enterprises 1,612 Number of personnel 186,723
1–249 employees
250–499 employees
500–999 employees
1000– employees
70,64638%
26,86014%
31,46817%
57,74931%
13.1.2015 51
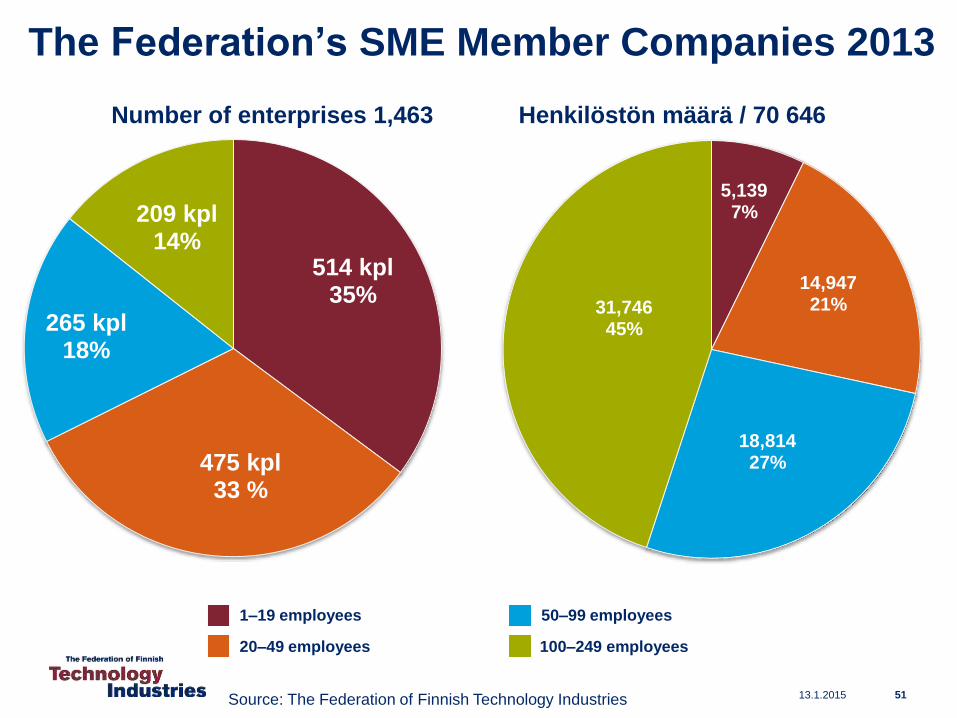
The Federation’s SME Member Companies 2013
514 kpl 35%
475 kpl33 %
265 kpl 18%
209 kpl 14%
Source: The Federation of Finnish Technology Industries
Number of enterprises 1,463 Henkilöstön määrä / 70 646
1–19 employees
20–49 employees
50–99 employees
100–249 employees
5,1397%
14,94721%
18,81427%
31,74645%
13.1.2015 52
Technology Is Everywhere

13.1.2015 53
The Technology Industry is also about Services
13.1.2015 54
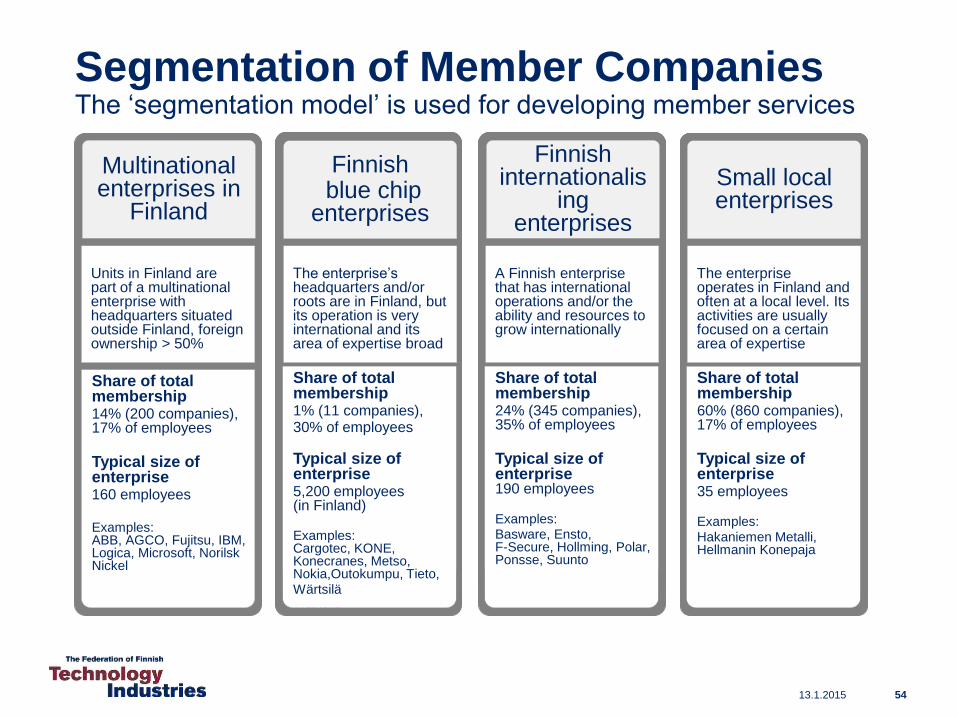
Segmentation of Member CompaniesThe ‘segmentation model’ is used for developing member services
Multinational enterprises in
Finland
Units in Finland are part of a multinational enterprise with headquarters situated outside Finland, foreign ownership > 50%
Share of totalmembership14% (200 companies), 17% of employees
Typical size of enterprise160 employees
Examples: ABB, AGCO, Fujitsu, IBM, Logica, Microsoft, NorilskNickel
Finnishblue chip
enterprises
The enterprise’s headquarters and/or roots are in Finland, but its operation is very international and its area of expertise broad
Share of total membership1 % (11 companies), 30 % of employees
Typical size of enterprise5 200 employees (in
Finland)
Examples: Cargotec, KONE, Konecranes, Metso, Nokia,Outokumpu, Rautaruukki, Tieto, Wärtsilä
Finnishinternationalis
ing enterprises
A Finnish enterprise that has international operations and/or the ability and resources to grow internationally
Share of total membership24 % (345 companies), 35 % of employees
Typical size of enterprise190 employees
Examples:Basware, Ensto, F-Secure, Hollming, Polar, Ponsse, Suunto
Small local enterprises
The enterprise operates in Finland and often at a local level. Its activities are usually focused on a certain area of expertise
Share of totalmembership60% (860 companies), 17% of employees
Typical size of enterprise35 employees
Examples:Hakaniemen Metalli, Hellmanin Konepaja
Share of totalmembership1% (11 companies), 30% of employees
Typical size of enterprise5,200 employees(in Finland)
Examples: Cargotec, KONE, Konecranes, Metso, Nokia,Outokumpu, Tieto, Wärtsilä
Share of totalmembership24% (345 companies), 35% of employees
Typical size of enterprise190 employees
Examples:Basware, Ensto, F-Secure, Hollming, Polar, Ponsse, Suunto
• The Federation - creating a
competitive business environment
– Promotes the interests of SMEs
– Supports expansion abroad
– Influences legislation
– Influences trade and industrial policy
– Promotes a competitive tax system
• Sub-sector and specialist groups
– Manage sub-sector specific
questions
13.1.2015 55
The Federation Promotes Entrepreneurship
13.1.2015 56
Working to Improve the Attractiveness of
the Sector
The Federation
• Provides information on jobs
and training within the sector for
teachers, parents and young
people
• Promotes collaboration between
companies and schools and
universities
• Works to enhance the image of
the sector.
13.1.2015 57
The Federation Is Here to Serve
• Provides labour market services and strives
to reshape working life:
– Guidance on employment issues
– Training and coaching
– Collective bargaining
– Improving productivity
– Influencing EU decision-making
• Publishes professional literature,
economic forecasts and statistics and
arranges seminars
• Provides legal services
Sub-sectors
13.1.2015 58
• 55 per cent of personnel employed
in Finland
• 70-80 per cent of sales from the
EU and neighbouring areas
• Urbanisation, and expansion in the
rapidly developing economies the
motor for growth
• Company presence in these areas
to continue to increase
• Increased R&D investment and
higher automation in production
required to improve
competitiveness
• High skilled and educated
personnel needed to replace
retiring employees
13.1.2015 59
Mechanical Engineering
fixed-investment products: machinery,
metal products,
vehicles
• Strong commitment to R&D
– in many fields over 10 per cent
of turnover
• Exports account for over 80 per
cent of sales
• Industry plays a vital role in the
development of the internet of
things (sensors collecting data)
• Competitiveness of enterprises
in Finland dependent upon:
– availability of university-level
experts
– effective commercial
exploitation of research
– finding the right niche
13.1.2015 60
Electronics and the Electro-technical
Industry
data and communications
equipment, electrical devices,
and instruments
• Rapidly growing economies
maintaining high demand for metals
and metal-based solutions.
• Exports account for 80 per cent of
sales
• Competitiveness of enterprises in
Finland dependent upon:
– the availability of a sufficiently skilled
workforce
– keeping up research of a high
standard
– reasonably-priced energy
– a competitive business environment
in the EU, especially regarding
climate and environmental policy
– reliable and reasonably-priced
logistics
13.1.2015 61
The Metals Industry
Steel products, non-ferrous metals, metal
based solutions, castings
• Thanks to digitalisation, demand for IT solutions is growing in all sectors of society
• IT solutions are needed for example in gaming industry, clean tech and health technology
• Finnish IT sector’s clients predominantly Finnish
• Growth of the sector in Finland requires
– a new customer-oriented approach from the sector’s enterprises
– education of the existing customer base
– new customers
– growth in the size of enterprises
– strong internationalisation
– skilled workforce
13.1.2015 62
Information Technology
IT solutions and services
• Companies are experts and designers in investment and development for industry, society and construction
• Competitiveness in Europe is good, global markets require new approaches
• Consulting engineering services are an important part of industrial company networks
• Over 60 percent of the employees have university degree education
• Competitiveness of the sector require– education and expert knowledge
– international expertise and networking
– investments and innovative solutions
– procurement emphasis on expertiseand quality
13.1.2015 63
Consulting Engineering
Knowledge intensive services for industry, society and construction