finnish pension fund investment cost effectiveness ... · finnish pension fund investment cost...
TRANSCRIPT
Finnish pension fundInvestment cost effectiveness analysis reports 2011
byCEM Benchmarking Inc.
Preface
Finland has a pension system that, in a unique way, combines a compulsory legislative basis, similar benefits for all, partial funding and private organization of the pension provision. It is a hybrid, fulfilling the functions of first and second pillar pensions within the same scheme. The main pension scheme is a legislated and compulsory earnings-related scheme, which is supplemented by the residence-based, flat-rate pension scheme.
In order to get a fresh international view of the Finnish pension system, the Finnish Centre for Pensions decided in 2011 to commission an independent evaluation study of the Finnish pension scheme. The purpose of the evaluation was to get a forward-looking external view of the Finnish pension system from an international perspective, including recommendations.
The evaluation focuses on the following issues:
1. The adequacy of pensions and the financial sustainability of the system:• the roles of the earnings-related pension and the residence-
based flat-rate pension, and the interplay of these• the functioning of the economic and actuarial incentives of the
pension system.
2. The policy design of the Finnish earnings-related pension scheme:• how does the Finnish pension system look from the point of
view of risk-sharing and social insurance? • the impact of the pension system on the economy, the labour
markets (incentives to work and to retire), and society in general
• the roles of the state, labour market organizations and other interest groups in the decision-making (pension legislation).
3. Governance issues in the earnings-related pension scheme:• the functioning of the organization of pension provision (the
roles and relations of various actors in pension provision, including the administrative structures of these organizations)
• the roles of co-operation and competition between pension providers
• the administrative efficiency and cost-efficiency of the earnings-related pension system.
We were very lucky that two distinguished experts agreed to undertake this ambitious task. Professor Nicholas Barr from the London School of Economics agreed to evaluate the first two sets of issues outlined above (adequacy and sustainability issues and policy design), and Professor Keith Ambachtsheer, who is Director of the Rotman International Centre for Pension Management, Rotman School of Management, University of Toronto, to evaluate the governance issues. Both Barr and Ambachtsheer are internationally well-known and highly regarded experts in the pension field, and their services are frequently utilized internationally.
These two evaluations are the first ones of their kind made of the Finnish pension system. They comprise sharp analyses, which deserve broad attention in the public debate as well as among politicians and decision-makers. They emphasize that Finland has a pension system with many strengths deserving appreciation. They also provide suggestions for possibly making the system even better. The Finnish Centre for Pensions wishes to extend very warm thanks to Keith Ambachtsheer and Nicholas Barr for
accepting our invitation, and for having provided thoughtful and fresh ideas to fertilize the pension policy discussion in Finland.In connection with the evaluation reports by Keith Ambachtsheer and Nicholas Barr, three background papers will also be published. The key results of these three studies are utilized in Ambachtsheer’s evaluation, and we wanted to make the results of the studies available in greater detail and hence decided to publish them.
Two of the studies are based on reports provided by CEM Benchmarking Inc. CEM is specialized in providing benchmarking information for pension investment and administration operations. Its clients are pension providers all over the world, who want to benchmark their own performance to the best pension providers in the world. The Finnish Centre for Pensions asked CEM to conduct a comparison of the Finnish pension providers with pension providers using CEM’s databases and services. These studies focus on administrative costs and service levels, as well as investment costs.
We wish to thank Mike Heale from CEM Benchmarking Inc. for managing this assignment for us with high professional expertise. Eight Finnish pension providers participated in these studies, and we wish to thank them for being part of the project.
In CEM’s analysis, eight Finnish pension providers were combined into a single entity, ’the Finnish Pension Fund’, which is compared to individual pension providers. This analysis gives insight into the costs and service levels in Finland compared with those of the peer group chosen from the database of CEM. The report is not meant to describe the costs at the national level, including all first and second pillar pension providers. In order to achieve this broader view, the Finnish Centre for Pensions conducted a
comparative study of the administrative costs of first and second pillar pensions in Denmark, Germany, Finland, the Netherlands, Norway, Sweden and Switzerland. This study, based mainly on publicly available information, was carried out by Antti Mielonen, Eeva Puuperä, Hannu Ramberg and Mika Vidlund from the Finnish Centre for Pensions. We wish to thank them for this essential contribution to the evaluation.
Jukka RantalaManaging Director
Hannu UusitaloDirector, Professor
Finnish pension fundInvestment cost effectiveness analysis reports
Introduction and discussion of results
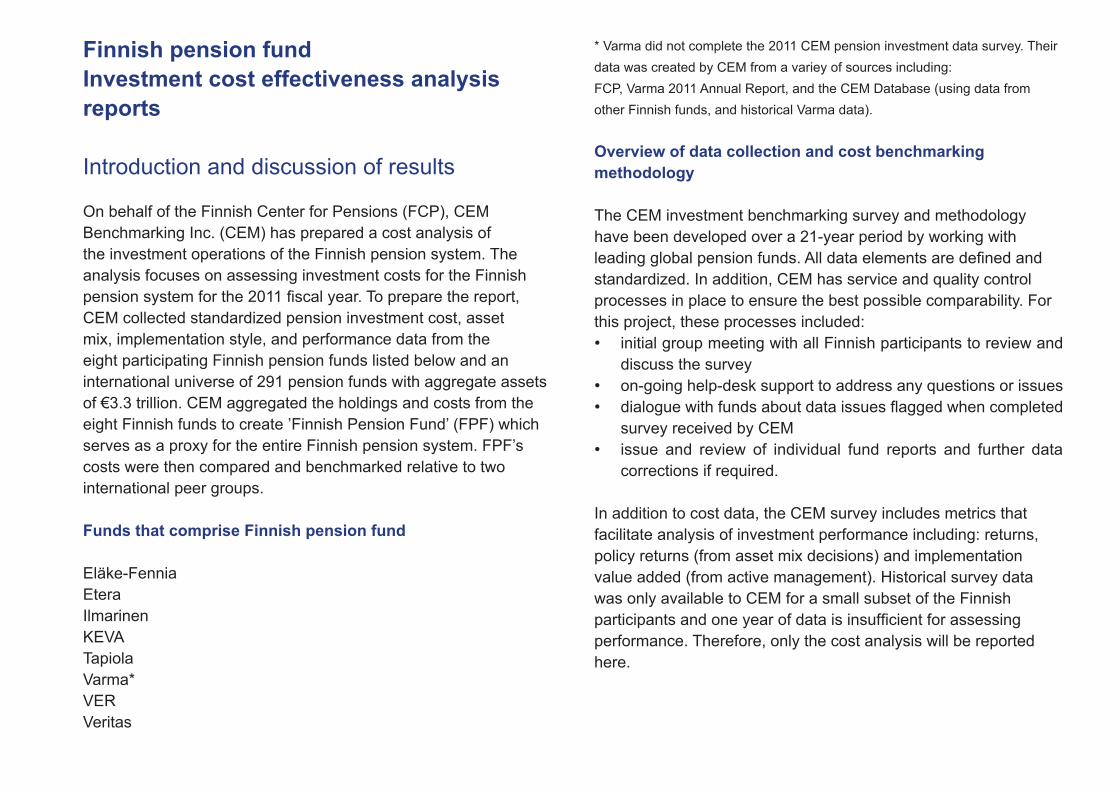
On behalf of the Finnish Center for Pensions (FCP), CEM Benchmarking Inc. (CEM) has prepared a cost analysis of the investment operations of the Finnish pension system. The analysis focuses on assessing investment costs for the Finnish pension system for the 2011 fiscal year. To prepare the report, CEM collected standardized pension investment cost, asset mix, implementation style, and performance data from the eight participating Finnish pension funds listed below and an international universe of 291 pension funds with aggregate assets of €3.3 trillion. CEM aggregated the holdings and costs from the eight Finnish funds to create ’Finnish Pension Fund’ (FPF) which serves as a proxy for the entire Finnish pension system. FPF’s costs were then compared and benchmarked relative to two international peer groups.
Funds that comprise Finnish pension fund
Eläke-Fennia EteraIlmarinenKEVATapiolaVarma*VERVeritas
* Varma did not complete the 2011 CEM pension investment data survey. Their data was created by CEM from a variey of sources including: FCP, Varma 2011 Annual Report, and the CEM Database (using data from other Finnish funds, and historical Varma data).
Overview of data collection and cost benchmarking methodology
The CEM investment benchmarking survey and methodology have been developed over a 21-year period by working with leading global pension funds. All data elements are defined and standardized. In addition, CEM has service and quality control processes in place to ensure the best possible comparability. For this project, these processes included:• initial group meeting with all Finnish participants to review and
discuss the survey• on-going help-desk support to address any questions or issues• dialogue with funds about data issues flagged when completed
survey received by CEM• issue and review of individual fund reports and further data
corrections if required. In addition to cost data, the CEM survey includes metrics that facilitate analysis of investment performance including: returns, policy returns (from asset mix decisions) and implementation value added (from active management). Historical survey data was only available to CEM for a small subset of the Finnish participants and one year of data is insufficient for assessing performance. Therefore, only the cost analysis will be reported here.
All investment costs are included in the CEM benchmarking framework with two exceptions:• Transaction costs (related to buying/selling securities)• Performance fees for private market asset classes (e.g. Private
Equity, Real Estate, Hedge Funds, Infrastructure)
These two costs are excluded because of historical difficulties in obtaining comparable data from participating funds.
The main drivers of pension investment costs are:• Economies of Scale (funds with more assets under management
have a scale advantage) • Asset Mix (E.g. private equity is much more expensive than
public equity)• Implementation Style (E.g. Active is more expensive than
Passive management)• What funds pay relative to peer funds for similar services and
activities.
To assess whether investment costs are reasonable, CEM calculates a benchmark cost for each fund that incorporates these cost drivers. The Benchmark Cost for FPF is an estimate of what FPF’s cost would be given its actual asset mix and the median costs that peers pay for similar services. It represents the cost FPF’s peers would pay if they had FPF’s actual asset mix. Peer groups of 15–20 funds are matched to funds based on size to neutralize scale economies.
FPF’s costs were benchmarked relative to two different Peer groups:1. Large Peer Group: 15 large global funds ranging in size from
€35 billion to €232 billion with an average size of €80 billion versus FPF size of €125 billion. Cost benchmarking relative
to this peer group ignores the fact that FPF does not really have the scale economies of a €125 billion fund. It is really an aggregation of 8 smaller funds.
2. Small Peer Group: 20 global funds ranging in size from €9.2 billion to €20.6 billion with an average size of €15 billion. The geographic mix of funds was similar to Large Peer Group. This peer group is close in size to the average actual size of the 8 funds that comprise FPF. It allows for an evaluation of costs given actual scale economies.
Discussion of cost results
FPF’s total investment costs were 49.2 bps of assets under management. Direct investment management costs, including all implementation styles (internal/external; active/passive) were 46.8 bps. Oversight, Custodial and Other costs associated with the investment operation were 2.4 bps. These costs exclude non-investment costs related to benefit administration and member service operations. Somewhat surprisingly, relative to Large Peer Group, FPF is 0.7 bps below Benchmark Cost. FPF is what CEM would consider ’normal cost’. At least a slightly high cost result was expected because FPF does not truly have the scale advantages of the larger funds in this peer group. This normal cost result was primarily due to implementation style: Finnish funds use more low cost internal management and less high cost external active management and fund of funds for private market asset classes. FPF saved 3.9 bps relative to Large Peer Group because of lower cost implementation. Contrasting this, FPF paid 4.9 bps more than Large Peer Group for external investment management. FPF paid 2.0 bps less for internal investment management and 0.2 bps more for Oversight, Custody and Other costs.
Relative to Small Peer Group, FPF was below Benchmark Cost by 5.2 bps. The Finnish implementation style advantage is even more pronounced relative to this peer group. FPF saved 7.5 bps relative to Small Peer Group because of lower cost implementation. Similar to above, FPF paid 3.3 bps more than Small Peer Group for external investment management. FPF paid 0.2 bps less for internal investment costs. In contrast to above, FPF paid 0.8 bps less for Oversight, Custody and Other costs relative to Small Peer Group.
Large global peers
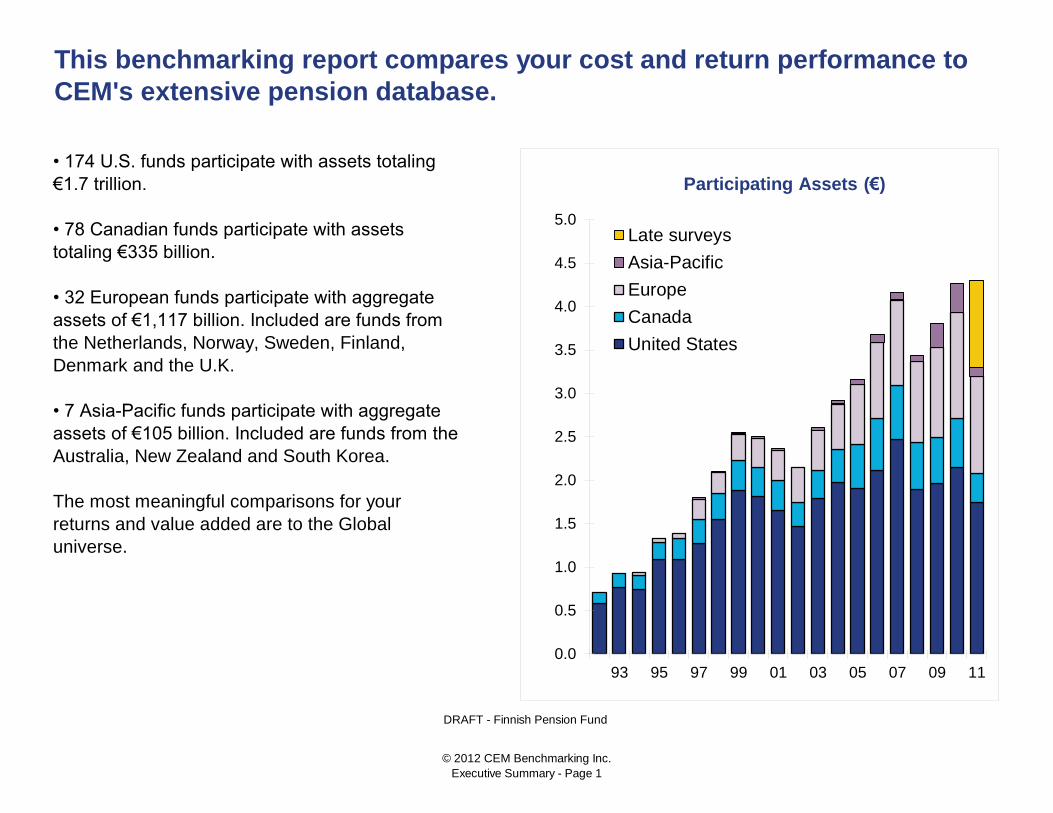
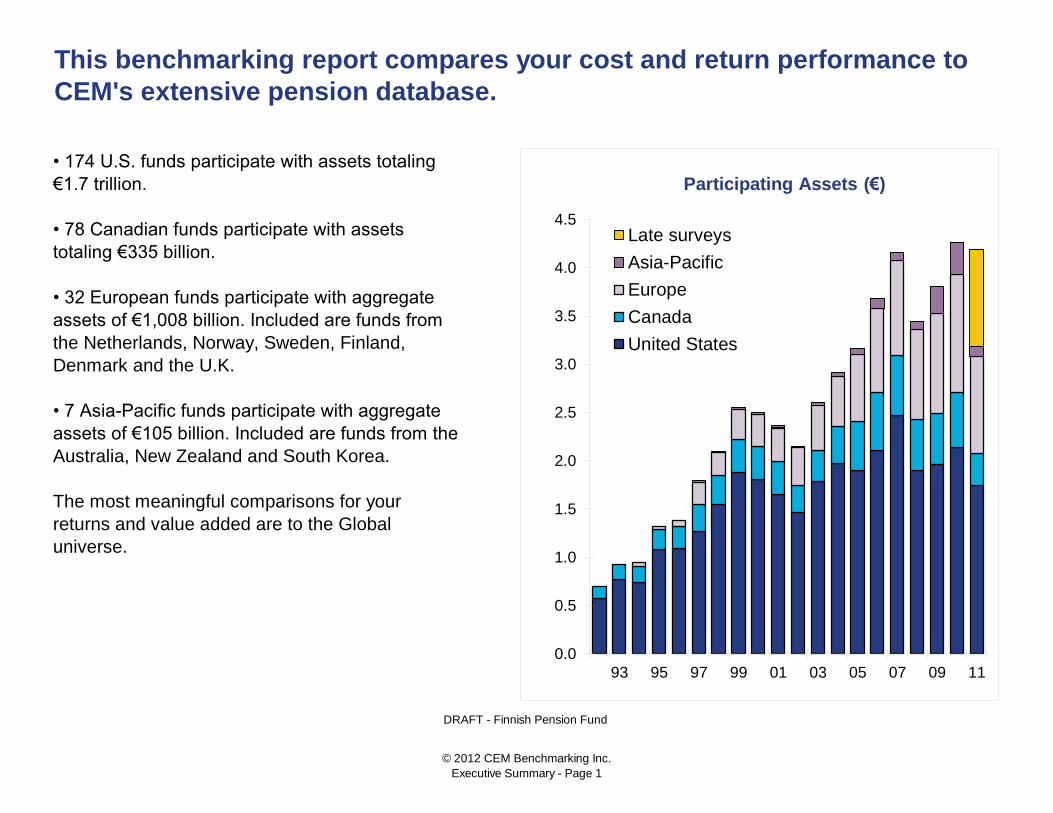
This benchmarking report compares your cost and return performance to
CEM's extensive pension database.
DRAFT - Finnish Pension Fund
• 174 U.S. funds participate with assets totaling
€1.7 trillion.
• 78 Canadian funds participate with assets
totaling €335 billion.
• 32 European funds participate with aggregate
assets of €1,117 billion. Included are funds from
the Netherlands, Norway, Sweden, Finland,
Denmark and the U.K.
• 7 Asia-Pacific funds participate with aggregate
assets of €105 billion. Included are funds from the
Australia, New Zealand and South Korea.
The most meaningful comparisons for your
returns and value added are to the Global
universe.
0.0
0.5
1.0
1.5
2.0
2.5
3.0
3.5
4.0
4.5
5.0
93 95 97 99 01 03 05 07 09 11
Participating Assets (€)
Late surveys
Asia-Pacific
Europe
Canada
United States
© 2012 CEM Benchmarking Inc.
Executive Summary - Page 1
Canada Finnish Pension Fund
BC Investment Management
Ontario Municipal Employees Ret. Sys. Korea Investment Corporation
Ontario Teachers'
United States
ATP Lifelong Pension California State Teachers' Ret. Sys.
Florida State Board of Administration
Netherlands General Motors Corp.
SPF ABP Ohio PERS
SPF Zorg en Welzijn State of Wisconsin Investment Board
STRS Ohio
Washington State Investment Board
All information in this report is confidential and may not be disclosed to third parties without the express written mutual consent of CEM
Benchmarking Inc and FCP.
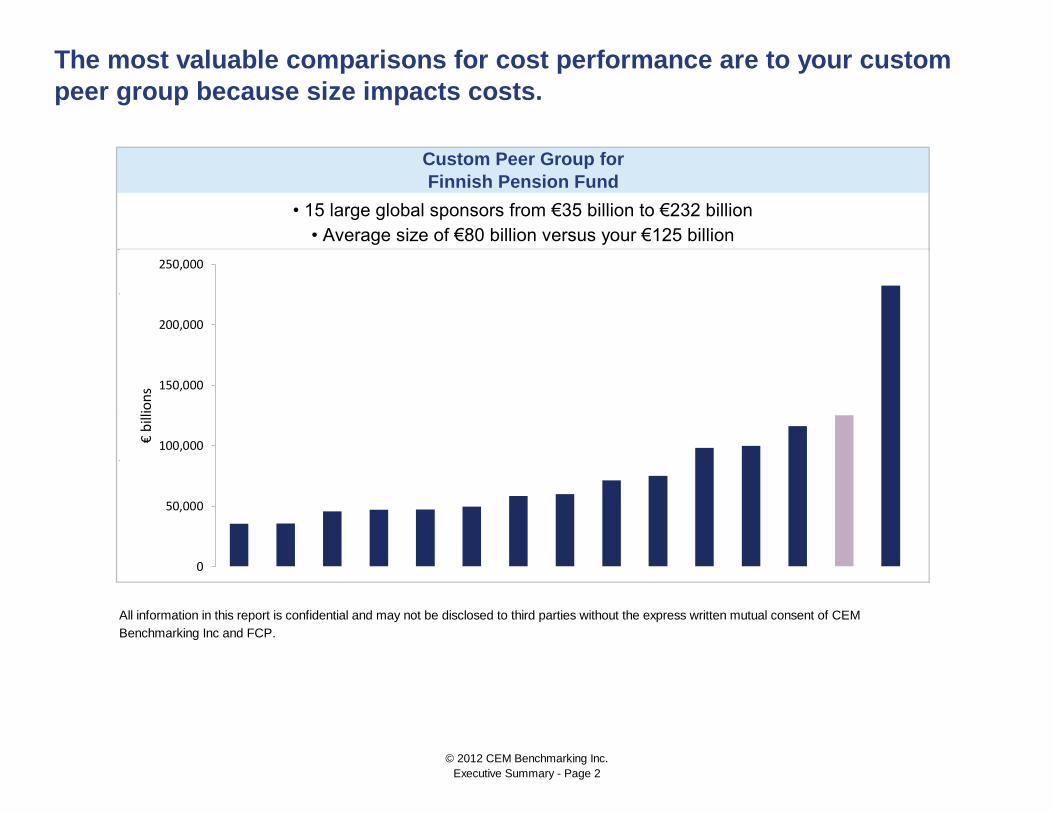
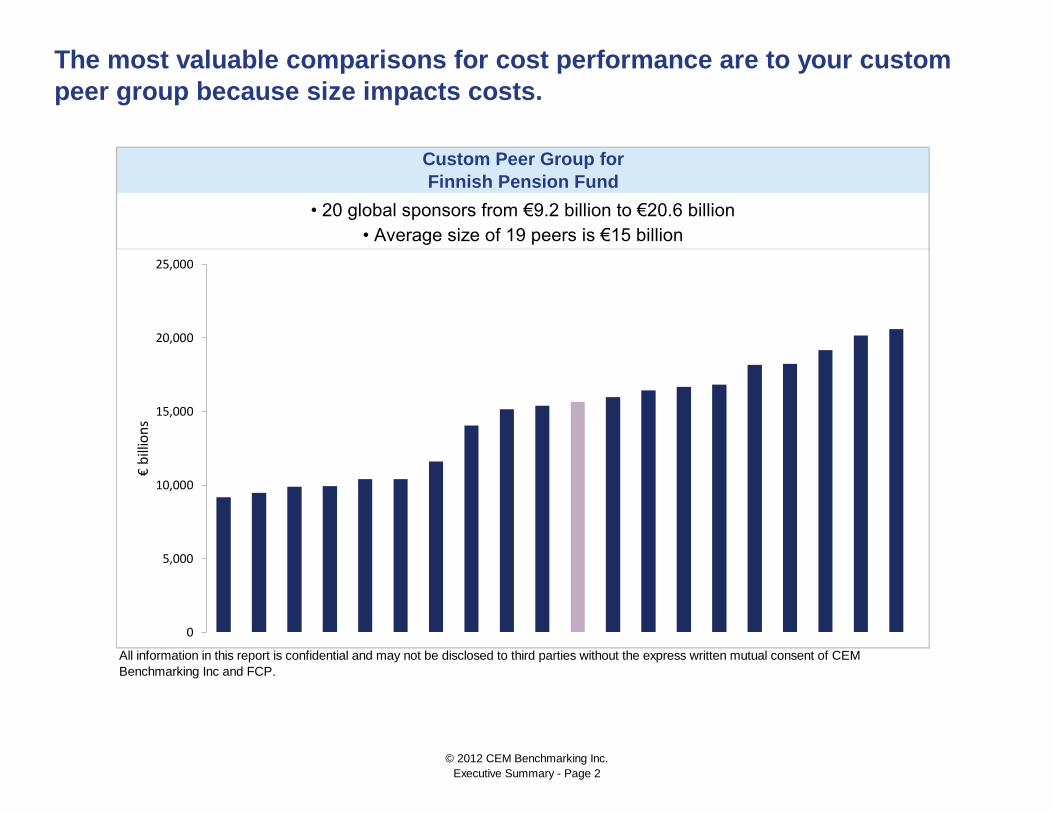
The most valuable comparisons for cost performance are to your custom
peer group because size impacts costs.
Custom Peer Group for
Finnish Pension Fund
• 15 large global sponsors from €35 billion to €232 billion
• Average size of €80 billion versus your €125 billion
0
50,000
100,000
150,000
200,000
250,000
€ b
illio
ns
© 2012 CEM Benchmarking Inc.
Executive Summary - Page 2
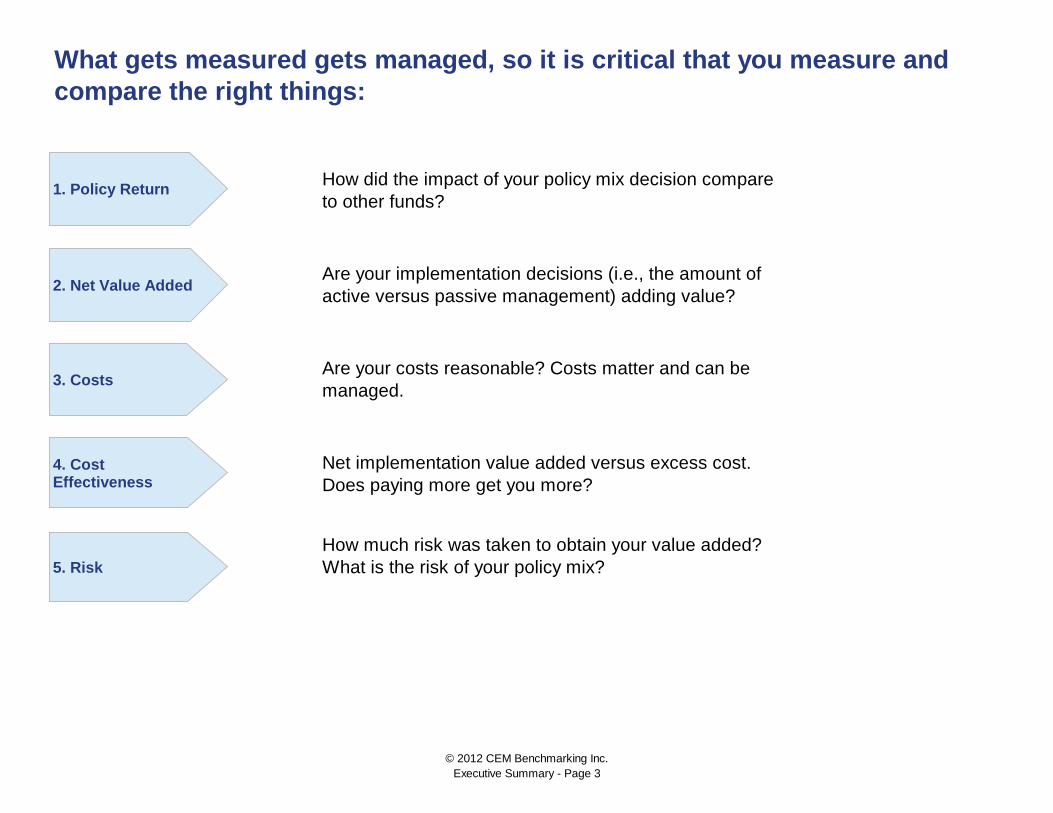
How much risk was taken to obtain your value added?
What is the risk of your policy mix?
What gets measured gets managed, so it is critical that you measure and
compare the right things:
How did the impact of your policy mix decision compare
to other funds?
Are your implementation decisions (i.e., the amount of
active versus passive management) adding value?
Are your costs reasonable? Costs matter and can be
managed.
Net implementation value added versus excess cost.
Does paying more get you more?
2. Net Value Added
3. Costs
4. Cost Effectiveness
5. Risk
1. Policy Return
© 2012 CEM Benchmarking Inc.
Executive Summary - Page 3

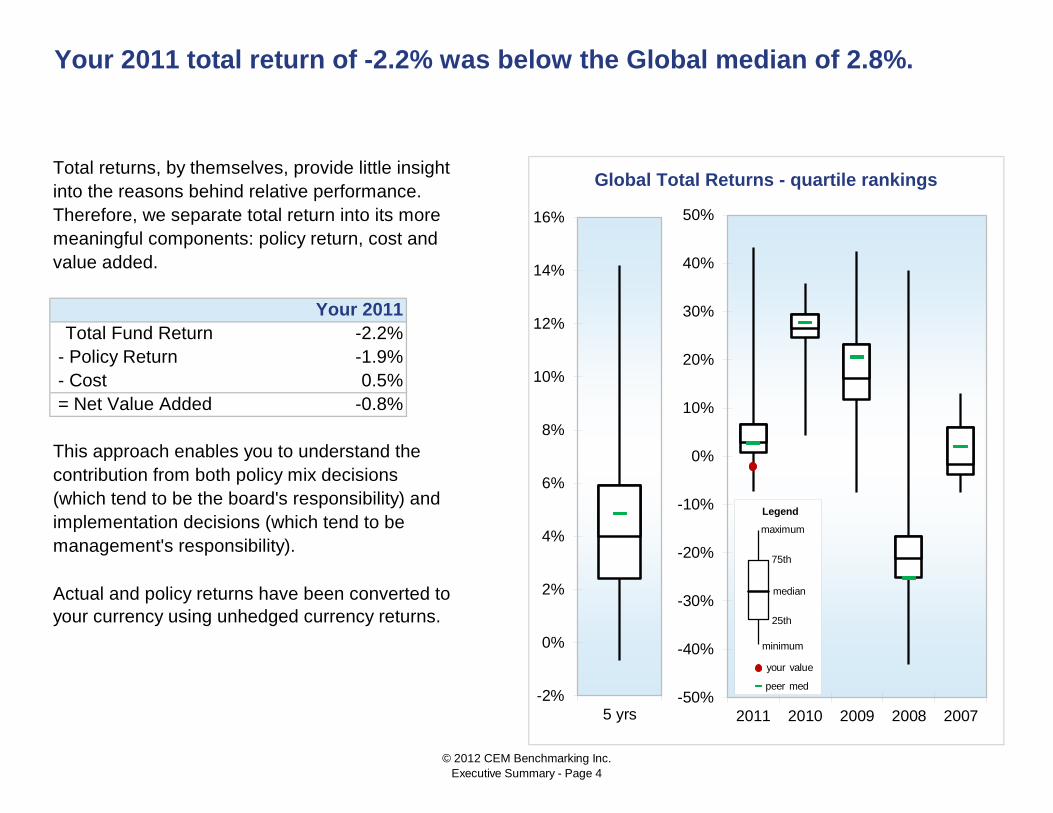
Total returns, by themselves, provide little insight
into the reasons behind relative performance.
Therefore, we separate total return into its more
meaningful components: policy return, cost and
value added.
Your 2011
Total Fund Return -2.2%
- Policy Return -1.9%
- Cost 0.5%
= Net Value Added -0.8%
This approach enables you to understand the
contribution from both policy mix decisions
(which tend to be the board's responsibility) and
implementation decisions (which tend to be
management's responsibility).
Your 2011 total return of -2.2% was below the Global median of 2.8%.
Global Total Returns - quartile rankings
Actual and policy returns have been converted to
your currency using unhedged currency returns.
-50%
-40%
-30%
-20%
-10%
0%
10%
20%
30%
40%
50%
2011 2010 2009 2008 2007
Legend
your value
median
maximum
75th
25th
peer med
minimum
-2%
0%
2%
4%
6%
8%
10%
12%
14%
16%
5 yrs
© 2012 CEM Benchmarking Inc.
Executive Summary - Page 4
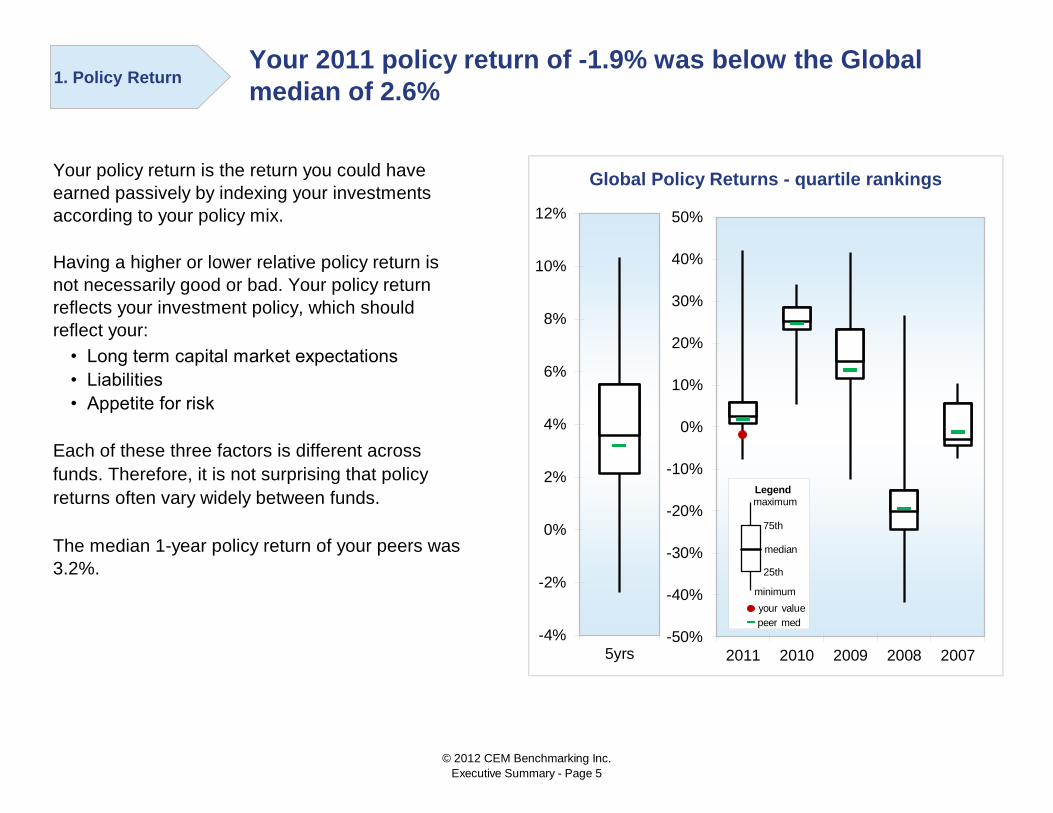
• Long term capital market expectations
• Liabilities
• Appetite for risk
Each of these three factors is different across
funds. Therefore, it is not surprising that policy
returns often vary widely between funds.
The median 1-year policy return of your peers was
3.2%.
Your 2011 policy return of -1.9% was below the Global
median of 2.6%
Global Policy Returns - quartile rankingsYour policy return is the return you could have
earned passively by indexing your investments
according to your policy mix.
Having a higher or lower relative policy return is
not necessarily good or bad. Your policy return
reflects your investment policy, which should
reflect your:
1. Policy Return
-50%
-40%
-30%
-20%
-10%
0%
10%
20%
30%
40%
50%
2011 2010 2009 2008 2007
Legend
your value
median
maximum
75th
25th
peer med
minimum
-4%
-2%
0%
2%
4%
6%
8%
10%
12%
5yrs
© 2012 CEM Benchmarking Inc.
Executive Summary - Page 5
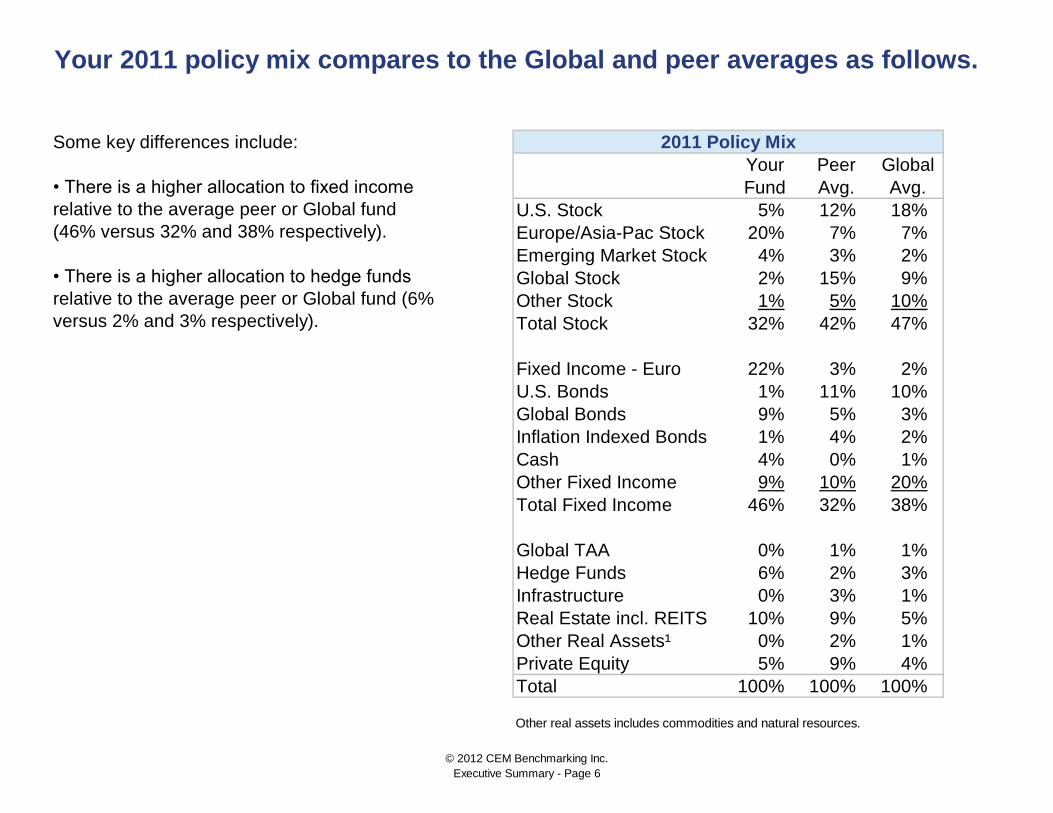
Your Peer Global
Fund Avg. Avg.
U.S. Stock 5% 12% 18%
Europe/Asia-Pac Stock 20% 7% 7%
Emerging Market Stock 4% 3% 2%
Global Stock 2% 15% 9%
Other Stock 1% 5% 10%
Total Stock 32% 42% 47%
Fixed Income - Euro 22% 3% 2%
U.S. Bonds 1% 11% 10%
Global Bonds 9% 5% 3%
Inflation Indexed Bonds 1% 4% 2%
Cash 4% 0% 1%
Other Fixed Income 9% 10% 20%
Total Fixed Income 46% 32% 38%
Global TAA 0% 1% 1%
Hedge Funds 6% 2% 3%
Infrastructure 0% 3% 1%
Real Estate incl. REITS 10% 9% 5%
Other Real Assets¹ 0% 2% 1%
Private Equity 5% 9% 4%
Total 100% 100% 100%
Other real assets includes commodities and natural resources.
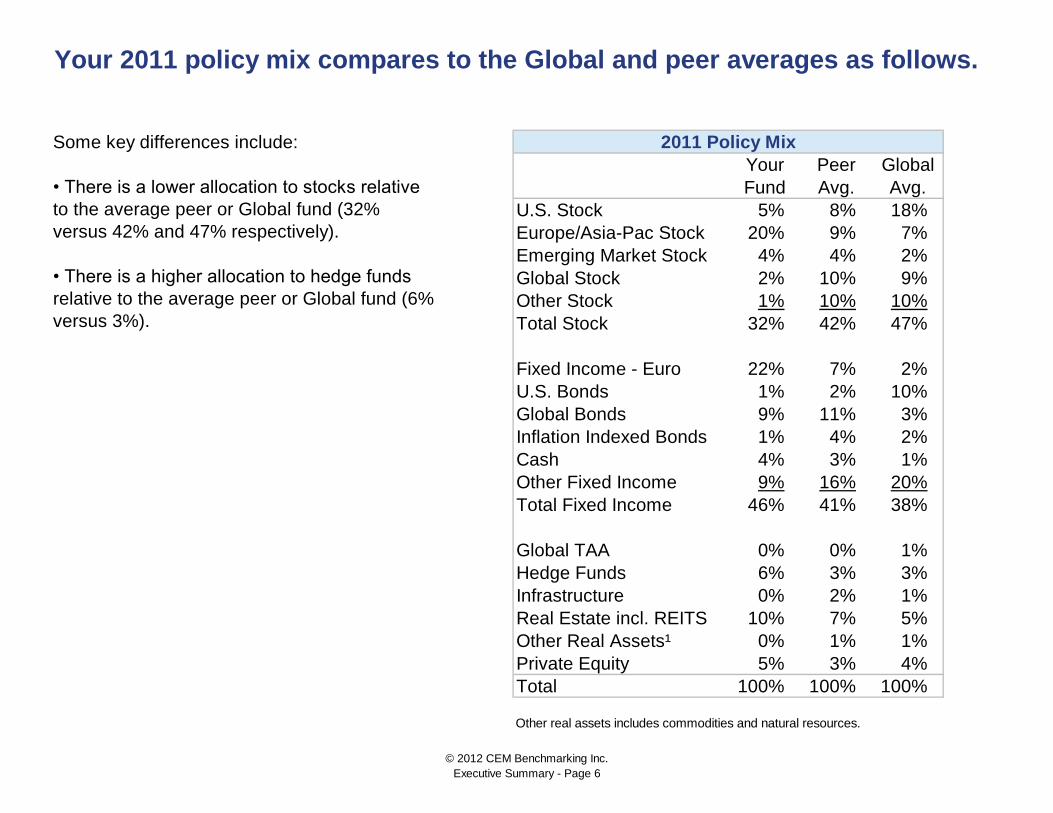
Your 2011 policy mix compares to the Global and peer averages as follows.
2011 Policy MixSome key differences include:
• There is a higher allocation to fixed income
relative to the average peer or Global fund
(46% versus 32% and 38% respectively).
• There is a higher allocation to hedge funds
relative to the average peer or Global fund (6%
versus 2% and 3% respectively).
© 2012 CEM Benchmarking Inc.
Executive Summary - Page 6

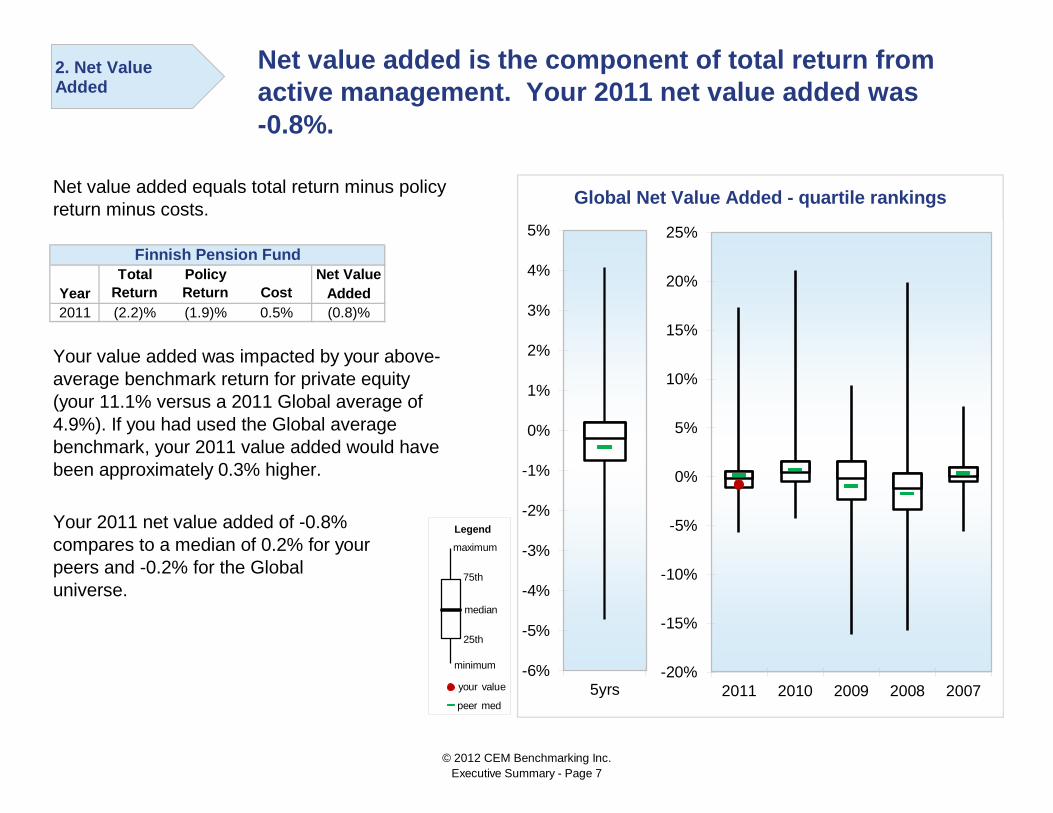
Total Policy Net Value
Year Return Return Cost Added
2011 (2.2)% (1.9)% 0.5% (0.8)%
Your 2011 net value added of -0.8%
compares to a median of 0.4% for your
peers and -0.2% for the Global
universe.
Your value added was impacted by your above-
average benchmark return for private equity
(your 11.1% versus a 2011 Global average of
4.9%). If you had used the Global average
benchmark, your 2011 value added would have
been approximately 0.3% higher.
Global Net Value Added - quartile rankings
Finnish Pension Fund
Net value added equals total return minus policy
return minus costs.
Net value added is the component of total return from
active management. Your 2011 net value added was
-0.8%.
-20%
-15%
-10%
-5%
0%
5%
10%
15%
20%
25%
2011 2010 2009 2008 2007
2. Net Value Added
Legend
your value
median
maximum
75th
25th
peer med
minimum -6%
-5%
-4%
-3%
-2%
-1%
0%
1%
2%
3%
4%
5%
5yrs
© 2012 CEM Benchmarking Inc.
Executive Summary - Page 7

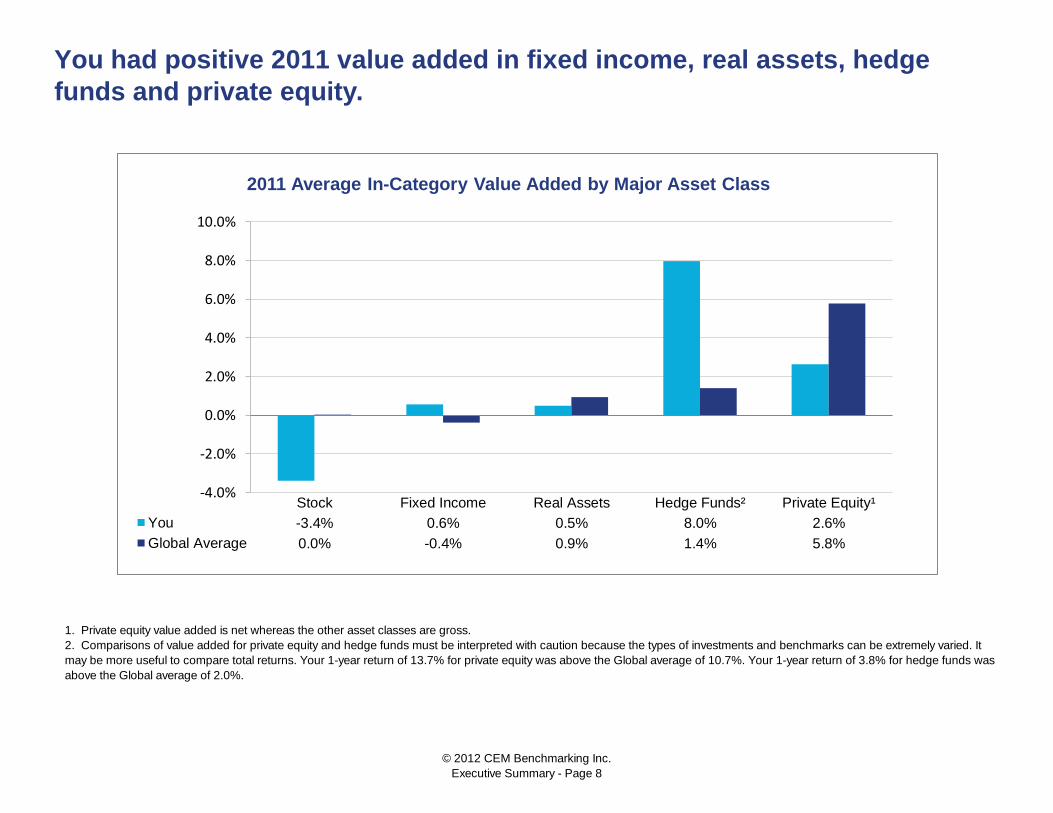
You had positive 2011 value added in fixed income, real assets, hedge
funds and private equity.
1. Private equity value added is net whereas the other asset classes are gross.
2. Comparisons of value added for private equity and hedge funds must be interpreted with caution because the types of investments and benchmarks can be extremely varied. It
may be more useful to compare total returns. Your 1-year return of 13.7% for private equity was above the Global average of 10.7%. Your 1-year return of 3.8% for hedge funds was
above the Global average of 2.0%.
-4.0%
-2.0%
0.0%
2.0%
4.0%
6.0%
8.0%
10.0%
Stock Fixed Income Real Assets Hedge Funds² Private Equity¹
You -3.4% 0.6% 0.5% 8.0% 2.6%
Global Average 0.0% -0.4% 0.9% 1.4% 5.8%
2011 Average In-Category Value Added by Major Asset Class
© 2012 CEM Benchmarking Inc.
Executive Summary - Page 8
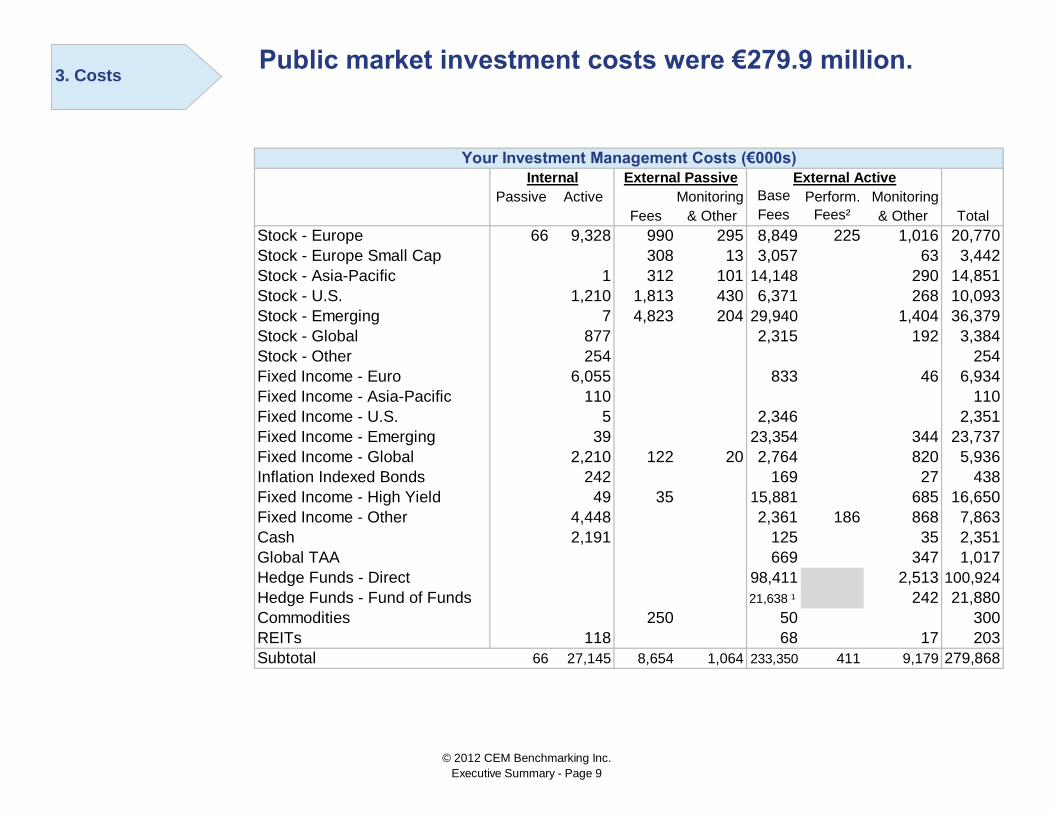
Your Investment Management Costs (€000s)
Internal External Passive External Active
Passive Active Monitoring Base Perform. Monitoring
Fees & Other Fees Fees² & Other Total
Stock - Europe 66 9,328 990 295 8,849 225 1,016 20,770
Stock - Europe Small Cap 308 13 3,057 63 3,442
Stock - Asia-Pacific 1 312 101 14,148 290 14,851
Stock - U.S. 1,210 1,813 430 6,371 268 10,093
Stock - Emerging 7 4,823 204 29,940 1,404 36,379
Stock - Global 877 2,315 192 3,384
Stock - Other 254 254
Fixed Income - Euro 6,055 833 46 6,934
Fixed Income - Asia-Pacific 110 110
Fixed Income - U.S. 5 2,346 2,351
Fixed Income - Emerging 39 23,354 344 23,737
Fixed Income - Global 2,210 122 20 2,764 820 5,936
Inflation Indexed Bonds 242 169 27 438
Fixed Income - High Yield 49 35 15,881 685 16,650
Fixed Income - Other 4,448 2,361 186 868 7,863
Cash 2,191 125 35 2,351
Global TAA 669 347 1,017
Hedge Funds - Direct 98,411 2,513 100,924
Hedge Funds - Fund of Funds 21,638 ¹ 242 21,880
Commodities 250 50 300
REITs 118 68 17 203
Subtotal 66 27,145 8,654 1,064 233,350 411 9,179 279,868
Public market investment costs were €279.9 million.
3. Costs
© 2012 CEM Benchmarking Inc.
Executive Summary - Page 9
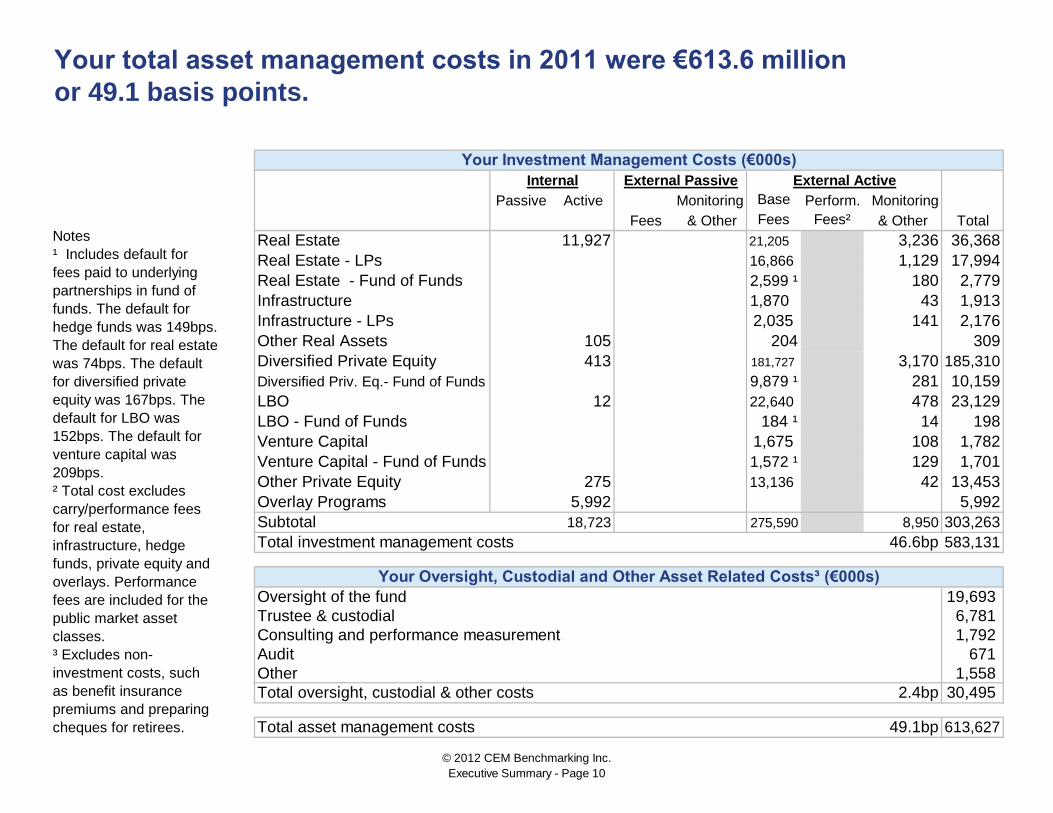
Your Investment Management Costs (€000s)
Internal External Passive External Active
Passive Active Monitoring Base Perform. Monitoring
Fees & Other Fees Fees² & Other Total
Real Estate 11,927 21,205 3,236 36,368
Real Estate - LPs 16,866 1,129 17,994
Real Estate - Fund of Funds 2,599 ¹ 180 2,779
Infrastructure 1,870 43 1,913
Infrastructure - LPs 2,035 141 2,176
Other Real Assets 105 204 309
Diversified Private Equity 413 181,727 3,170 185,310
Diversified Priv. Eq.- Fund of Funds 9,879 ¹ 281 10,159
LBO 12 22,640 478 23,129
LBO - Fund of Funds 184 ¹ 14 198
Venture Capital 1,675 108 1,782
Venture Capital - Fund of Funds 1,572 ¹ 129 1,701
Other Private Equity 275 13,136 42 13,453
Overlay Programs 5,992 5,992
Subtotal 18,723 275,590 8,950 303,263
Total investment management costs 46.6bp 583,131
Your Oversight, Custodial and Other Asset Related Costs³ (€000s)
Oversight of the fund 19,693
Trustee & custodial 6,781
Consulting and performance measurement 1,792
Audit 671
Other 1,558
Total oversight, custodial & other costs 2.4bp 30,495
Total asset management costs 49.1bp 613,627
Your total asset management costs in 2011 were €613.6 million
or 49.1 basis points.
Notes
¹ Includes default for
fees paid to underlying
partnerships in fund of
funds. The default for
hedge funds was 149bps.
The default for real estate
was 74bps. The default
for diversified private
equity was 167bps. The
default for LBO was
152bps. The default for
venture capital was
209bps.
² Total cost excludes
carry/performance fees
for real estate,
infrastructure, hedge
funds, private equity and
overlays. Performance
fees are included for the
public market asset
classes.
³ Excludes non-
investment costs, such
as benefit insurance
premiums and preparing
cheques for retirees.
© 2012 CEM Benchmarking Inc.
Executive Summary - Page 10
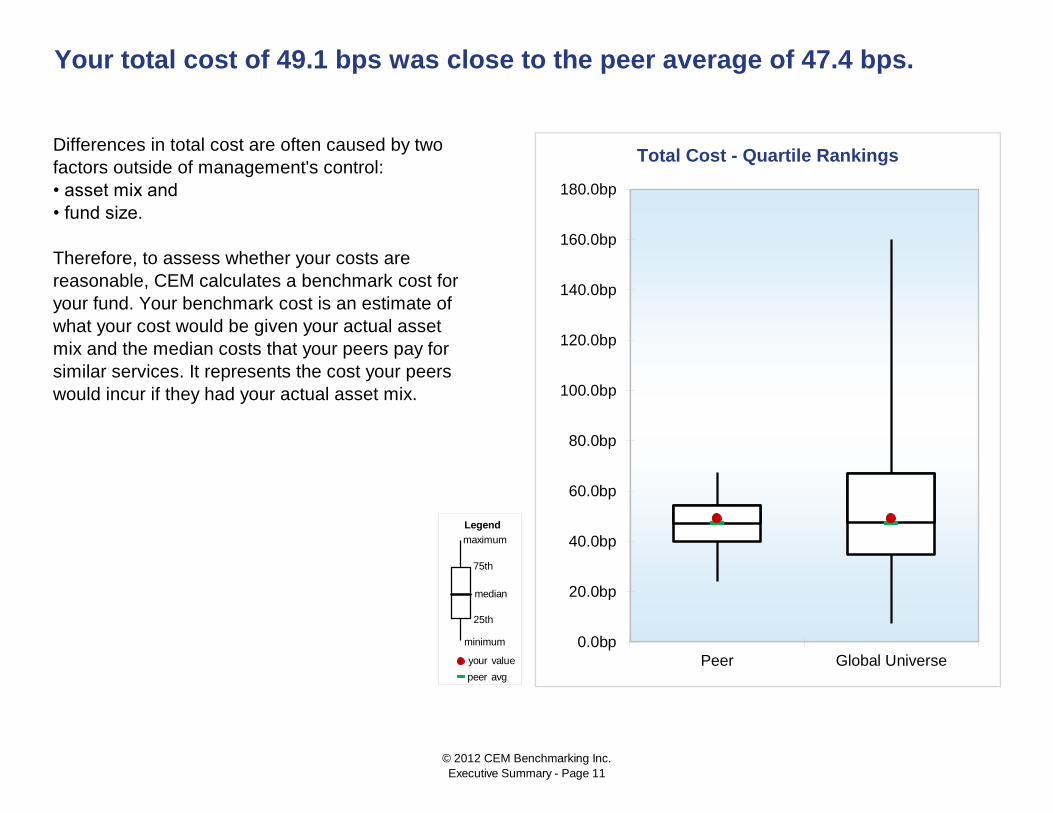
Differences in total cost are often caused by two
factors outside of management's control:
• asset mix and
• fund size.
Therefore, to assess whether your costs are
reasonable, CEM calculates a benchmark cost for
your fund. Your benchmark cost is an estimate of
what your cost would be given your actual asset
mix and the median costs that your peers pay for
similar services. It represents the cost your peers
would incur if they had your actual asset mix.
Your total cost of 49.1 bps was close to the peer average of 47.4 bps.
Total Cost - Quartile Rankings
0.0bp
20.0bp
40.0bp
60.0bp
80.0bp
100.0bp
120.0bp
140.0bp
160.0bp
180.0bp
Peer Global Universe
Legend
your value
median
maximum
75th
25th
peer avg
minimum
© 2012 CEM Benchmarking Inc.
Executive Summary - Page 11
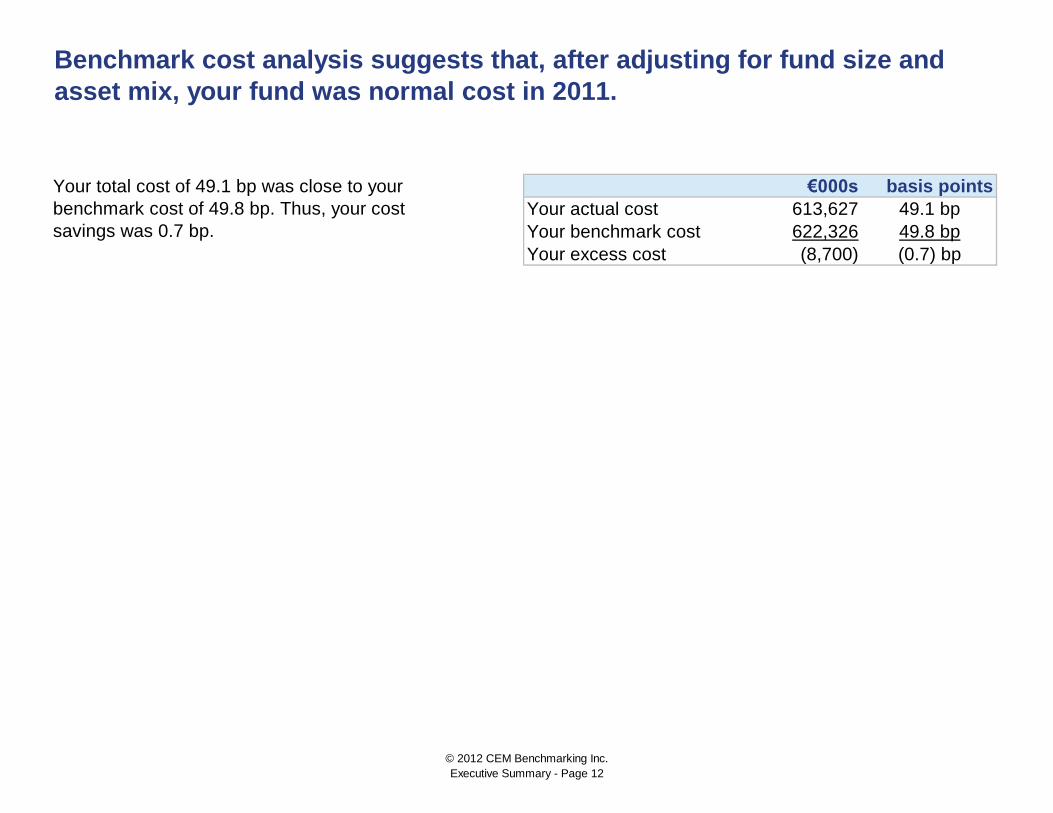
€000s basis points
Your actual cost
Your benchmark cost
Your excess cost (8,700) (0.7) bp
Your total cost of 49.1 bp was close to your
benchmark cost of 49.8 bp. Thus, your cost
savings was 0.7 bp.
Benchmark cost analysis suggests that, after adjusting for fund size and
asset mix, your fund was normal cost in 2011.
613,627 49.1 bp
622,326 49.8 bp
© 2012 CEM Benchmarking Inc.
Executive Summary - Page 12
€000s bps
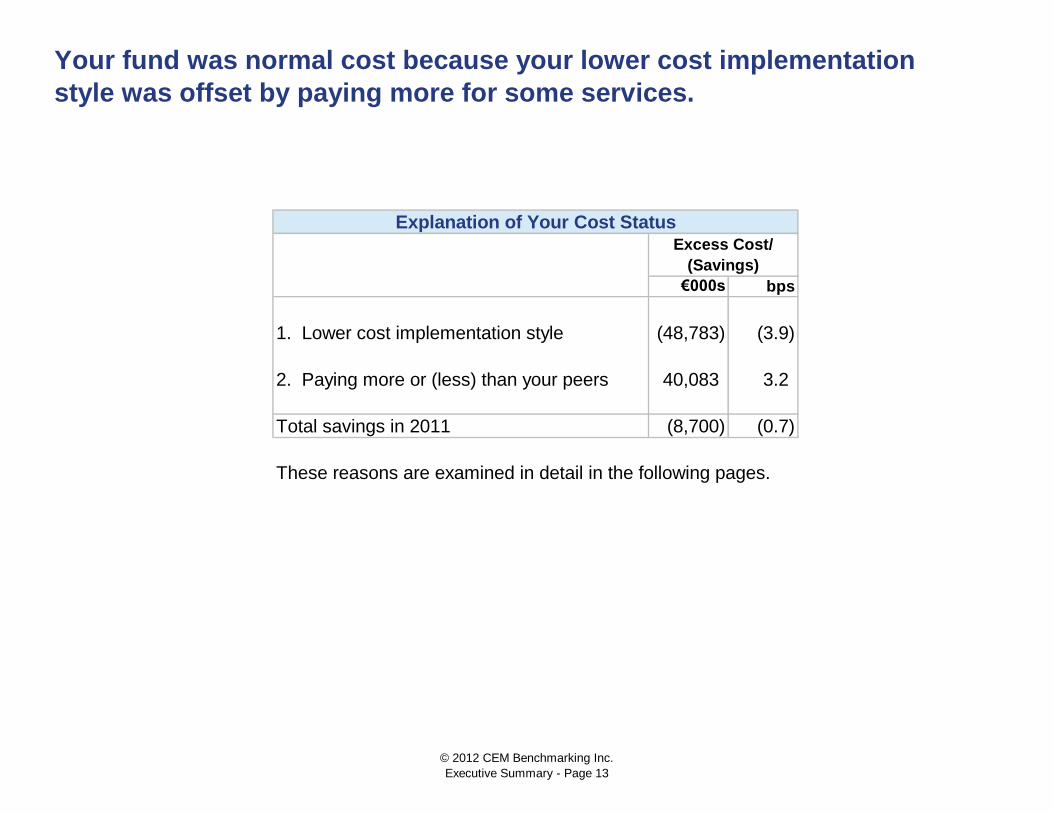
1. Lower cost implementation style (48,783) (3.9)
2. Paying more or (less) than your peers 40,083 3.2
Total savings in 2011 (8,700) (0.7)
These reasons are examined in detail in the following pages.
Your fund was normal cost because your lower cost implementation
style was offset by paying more for some services.
Explanation of Your Cost StatusExcess Cost/
(Savings)
© 2012 CEM Benchmarking Inc.
Executive Summary - Page 13
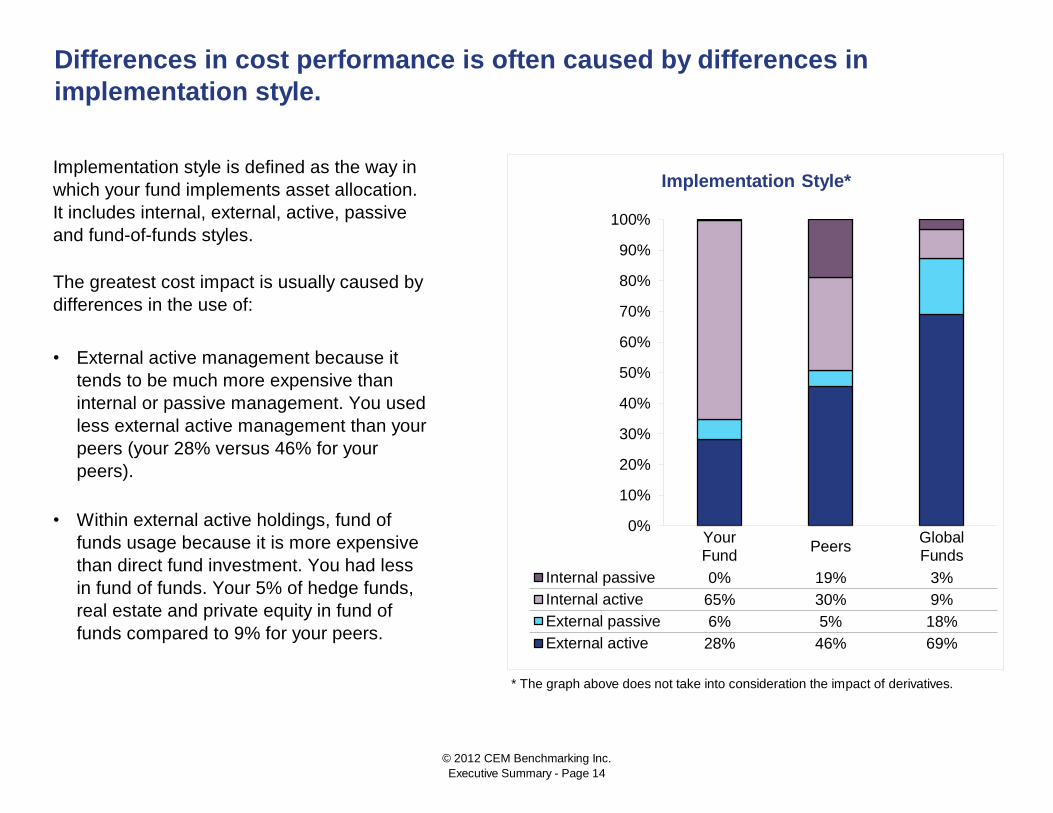
•
•
* The graph above does not take into consideration the impact of derivatives.
Within external active holdings, fund of
funds usage because it is more expensive
than direct fund investment. You had less
in fund of funds. Your 5% of hedge funds,
real estate and private equity in fund of
funds compared to 9% for your peers.
Differences in cost performance is often caused by differences in
implementation style.
Implementation style is defined as the way in
which your fund implements asset allocation.
It includes internal, external, active, passive
and fund-of-funds styles.
The greatest cost impact is usually caused by
differences in the use of:
External active management because it
tends to be much more expensive than
internal or passive management. You used
less external active management than your
peers (your 28% versus 46% for your
peers).
0%
10%
20%
30%
40%
50%
60%
70%
80%
90%
100%
YourFund
PeersGlobalFunds
Internal passive 0% 19% 3%
Internal active 65% 30% 9%
External passive 6% 5% 18%
External active 28% 46% 69%
Implementation Style*
© 2012 CEM Benchmarking Inc.
Executive Summary - Page 14
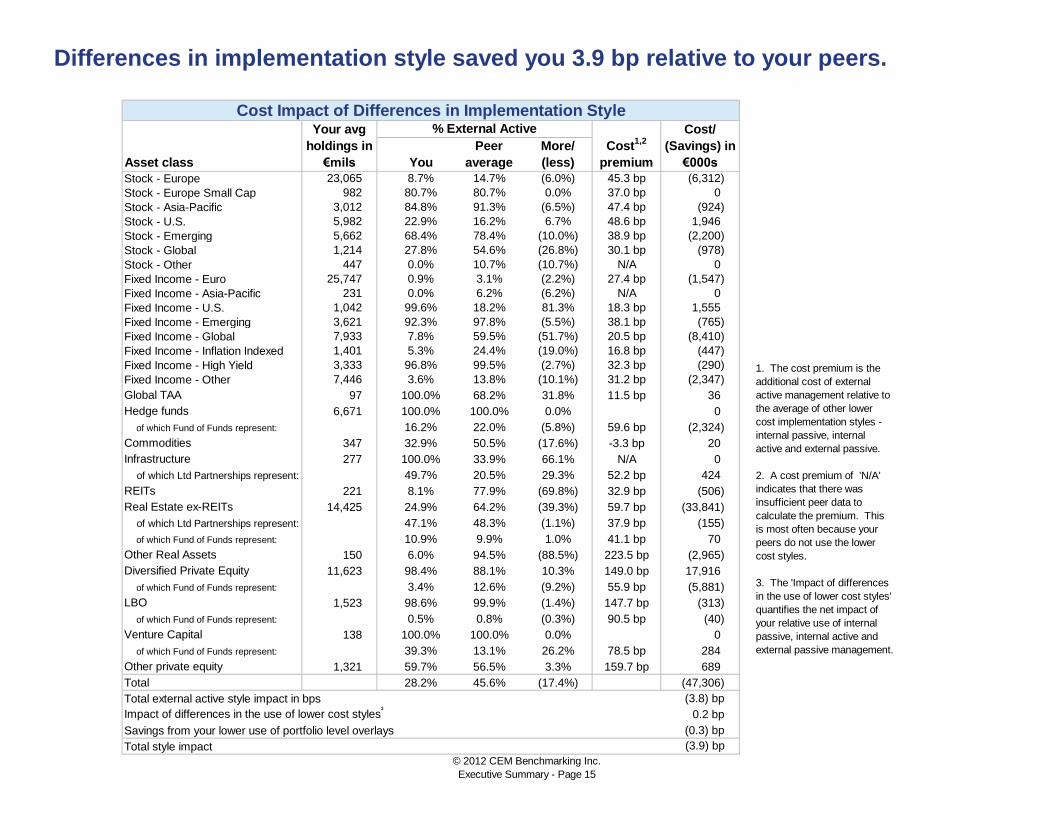
Asset class You
Stock - Europe 23,065 8.7% 14.7% (6.0%) 45.3 bp (6,312)
Stock - Europe Small Cap 982 80.7% 80.7% 0.0% 37.0 bp 0
Stock - Asia-Pacific 3,012 84.8% 91.3% (6.5%) 47.4 bp (924)
Stock - U.S. 5,982 22.9% 16.2% 6.7% 48.6 bp 1,946
Stock - Emerging 5,662 68.4% 78.4% (10.0%) 38.9 bp (2,200)
Stock - Global 1,214 27.8% 54.6% (26.8%) 30.1 bp (978)
Stock - Other 447 0.0% 10.7% (10.7%) N/A 0
Fixed Income - Euro 25,747 0.9% 3.1% (2.2%) 27.4 bp (1,547)
Fixed Income - Asia-Pacific 231 0.0% 6.2% (6.2%) N/A 0
Fixed Income - U.S. 1,042 99.6% 18.2% 81.3% 18.3 bp 1,555
Fixed Income - Emerging 3,621 92.3% 97.8% (5.5%) 38.1 bp (765)
Fixed Income - Global 7,933 7.8% 59.5% (51.7%) 20.5 bp (8,410)
Fixed Income - Inflation Indexed 1,401 5.3% 24.4% (19.0%) 16.8 bp (447)
Fixed Income - High Yield 3,333 96.8% 99.5% (2.7%) 32.3 bp (290)
Fixed Income - Other 7,446 3.6% 13.8% (10.1%) 31.2 bp (2,347)
Global TAA 97 100.0% 68.2% 31.8% 11.5 bp 36
Hedge funds 6,671 100.0% 100.0% 0.0% 0
of which Fund of Funds represent: 6,671 16.2% 22.0% (5.8%) 59.6 bp (2,324)
Commodities 347 32.9% 50.5% (17.6%) -3.3 bp 20
Infrastructure 277 100.0% 33.9% 66.1% N/A 0
of which Ltd Partnerships represent: 277 49.7% 20.5% 29.3% 52.2 bp 424
REITs 221 8.1% 77.9% (69.8%) 32.9 bp (506)
Real Estate ex-REITs 14,425 24.9% 64.2% (39.3%) 59.7 bp (33,841)
of which Ltd Partnerships represent: 3,596 47.1% 48.3% (1.1%) 37.9 bp (155)
of which Fund of Funds represent: 1,695 10.9% 9.9% 1.0% 41.1 bp 70
Other Real Assets 150 6.0% 94.5% (88.5%) 223.5 bp (2,965)
Diversified Private Equity 11,623 98.4% 88.1% 10.3% 149.0 bp 17,916
of which Fund of Funds represent: 11,438 3.4% 12.6% (9.2%) 55.9 bp (5,881)
LBO 1,523 98.6% 99.9% (1.4%) 147.7 bp (313)
of which Fund of Funds represent: 1,500 0.5% 0.8% (0.3%) 90.5 bp (40)
Venture Capital 138 100.0% 100.0% 0.0% 0
of which Fund of Funds represent: 138 39.3% 13.1% 26.2% 78.5 bp 284
Other private equity 1,321 59.7% 56.5% 3.3% 159.7 bp 689
Total 28.2% 45.6% (17.4%) (47,306)
Total external active style impact in bps (3.8) bp
Impact of differences in the use of lower cost styles³
0.2 bp
Savings from your lower use of portfolio level overlays (0.3) bp
Total style impact (3.9) bp
Differences in implementation style saved you 3.9 bp relative to your peers.
Cost Impact of Differences in Implementation StyleYour avg
holdings in
€mils
% External Active
Cost1,2
premium
Cost/
(Savings) in
€000s
Peer
average
More/
(less)
1. The cost premium is the
additional cost of external
active management relative to
the average of other lower
cost implementation styles -
internal passive, internal
active and external passive.
2. A cost premium of 'N/A'
indicates that there was
insufficient peer data to
calculate the premium. This
is most often because your
peers do not use the lower
cost styles.
3. The 'Impact of differences
in the use of lower cost styles'
quantifies the net impact of
your relative use of internal
passive, internal active and
external passive management.
© 2012 CEM Benchmarking Inc.
Executive Summary - Page 15
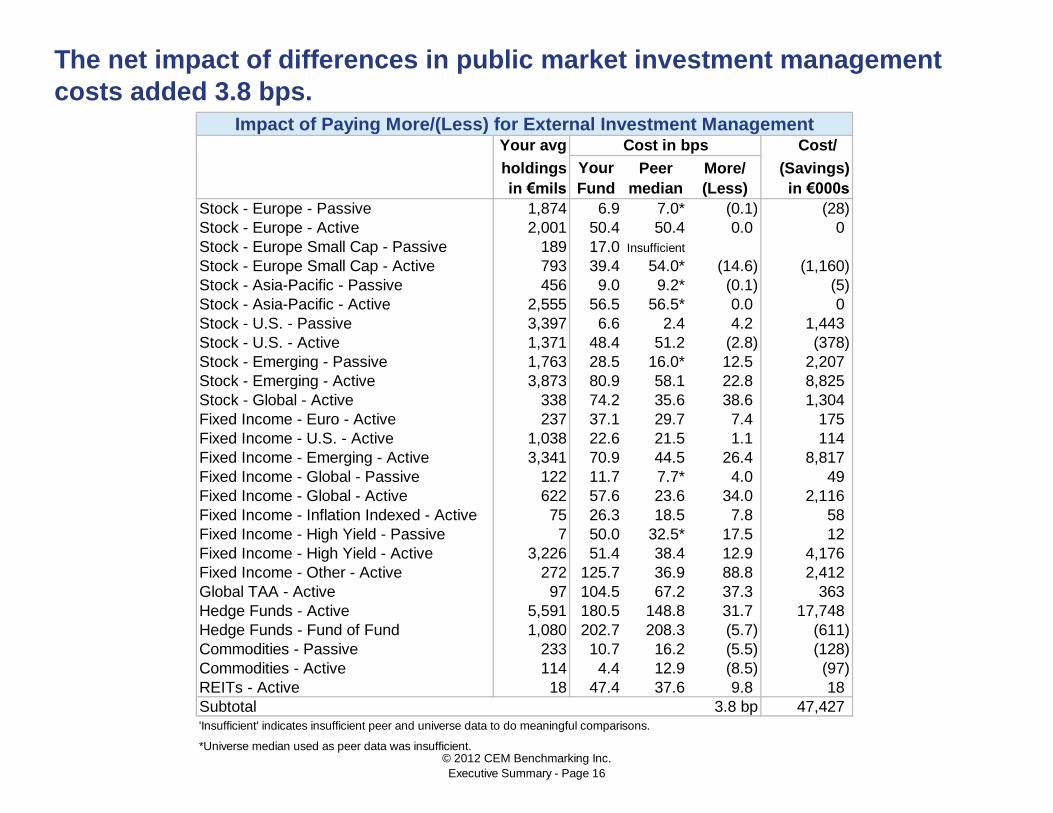
Your avg Cost/
holdings Peer More/ (Savings)
in €mils median (Less) in €000s
Stock - Europe - Passive 1,874 6.9 7.0* (0.1) (28)
Stock - Europe - Active 2,001 50.4 50.4 0.0 0
Stock - Europe Small Cap - Passive 189 17.0 Insufficient
Stock - Europe Small Cap - Active 793 39.4 54.0* (14.6) (1,160)
Stock - Asia-Pacific - Passive 456 9.0 9.2* (0.1) (5)
Stock - Asia-Pacific - Active 2,555 56.5 56.5* 0.0 0
Stock - U.S. - Passive 3,397 6.6 2.4 4.2 1,443
Stock - U.S. - Active 1,371 48.4 51.2 (2.8) (378)
Stock - Emerging - Passive 1,763 28.5 16.0* 12.5 2,207
Stock - Emerging - Active 3,873 80.9 58.1 22.8 8,825
Stock - Global - Active 338 74.2 35.6 38.6 1,304
Fixed Income - Euro - Active 237 37.1 29.7 7.4 175
Fixed Income - U.S. - Active 1,038 22.6 21.5 1.1 114
Fixed Income - Emerging - Active 3,341 70.9 44.5 26.4 8,817
Fixed Income - Global - Passive 122 11.7 7.7* 4.0 49
Fixed Income - Global - Active 622 57.6 23.6 34.0 2,116
Fixed Income - Inflation Indexed - Active 75 26.3 18.5 7.8 58
Fixed Income - High Yield - Passive 7 50.0 32.5* 17.5 12
Fixed Income - High Yield - Active 3,226 51.4 38.4 12.9 4,176
Fixed Income - Other - Active 272 125.7 36.9 88.8 2,412
Global TAA - Active 97 104.5 67.2 37.3 363
Hedge Funds - Active 5,591 180.5 148.8 31.7 17,748
Hedge Funds - Fund of Fund 1,080 202.7 208.3 (5.7) (611)
Commodities - Passive 233 10.7 16.2 (5.5) (128)
Commodities - Active 114 4.4 12.9 (8.5) (97)
REITs - Active 18 47.4 37.6 9.8 18
Subtotal 47,427'Insufficient' indicates insufficient peer and universe data to do meaningful comparisons.
*Universe median used as peer data was insufficient.
Your
Fund
3.8 bp
The net impact of differences in public market investment management
costs added 3.8 bps.Impact of Paying More/(Less) for External Investment Management
Cost in bps
© 2012 CEM Benchmarking Inc.
Executive Summary - Page 16
Your avg Cost/
holdings Peer More/ (Savings)
in €mils median (Less) in €000s
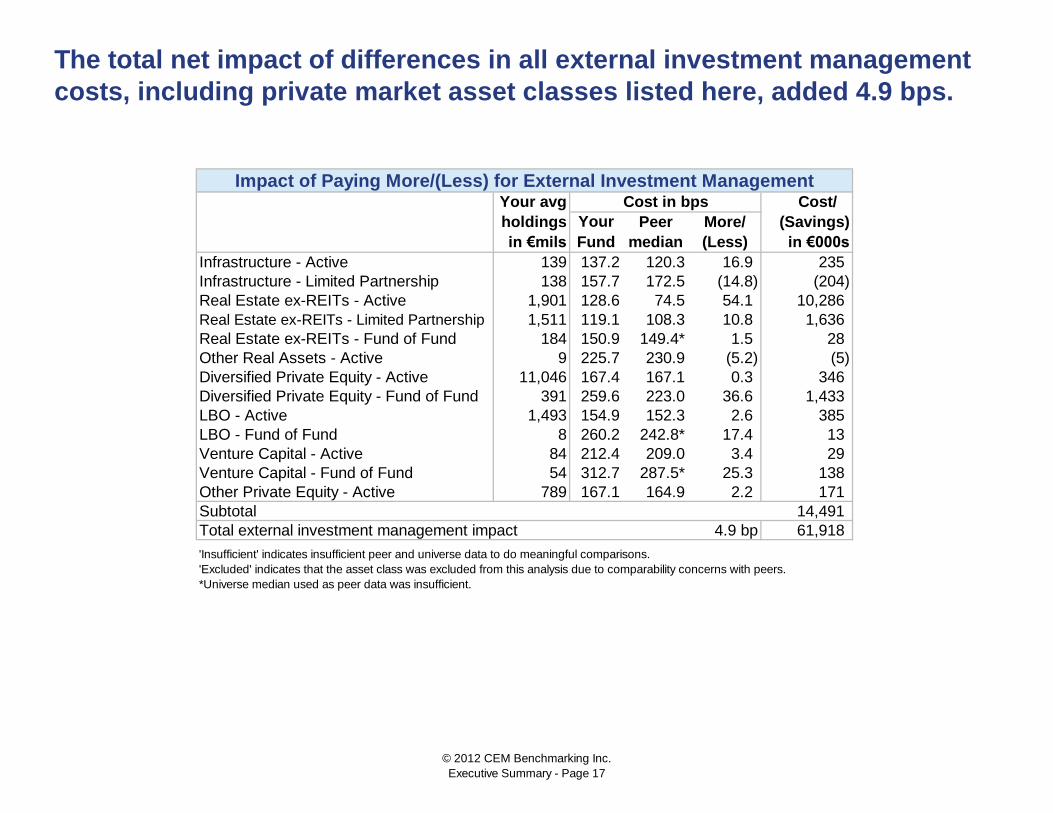
Infrastructure - Active 139 137.2 120.3 16.9 235
Infrastructure - Limited Partnership 138 157.7 172.5 (14.8) (204)
Real Estate ex-REITs - Active 1,901 128.6 74.5 54.1 10,286
Real Estate ex-REITs - Limited Partnership 1,511 119.1 108.3 10.8 1,636
Real Estate ex-REITs - Fund of Fund 184 150.9 149.4* 1.5 28
Other Real Assets - Active 9 225.7 230.9 (5.2) (5)
Diversified Private Equity - Active 11,046 167.4 167.1 0.3 346
Diversified Private Equity - Fund of Fund 391 259.6 223.0 36.6 1,433
LBO - Active 1,493 154.9 152.3 2.6 385
LBO - Fund of Fund 8 260.2 242.8* 17.4 13
Venture Capital - Active 84 212.4 209.0 3.4 29
Venture Capital - Fund of Fund 54 312.7 287.5* 25.3 138
Other Private Equity - Active 789 167.1 164.9 2.2 171
Subtotal 14,491
Total external investment management impact 61,918
'Insufficient' indicates insufficient peer and universe data to do meaningful comparisons.
'Excluded' indicates that the asset class was excluded from this analysis due to comparability concerns with peers.
*Universe median used as peer data was insufficient.
4.9 bp
Impact of Paying More/(Less) for External Investment ManagementCost in bps
Your
Fund
The total net impact of differences in all external investment management
costs, including private market asset classes listed here, added 4.9 bps.
© 2012 CEM Benchmarking Inc.
Executive Summary - Page 17
Your avg Cost/
holdings Peer More/ (Savings)
in €mils median (Less) in €000s
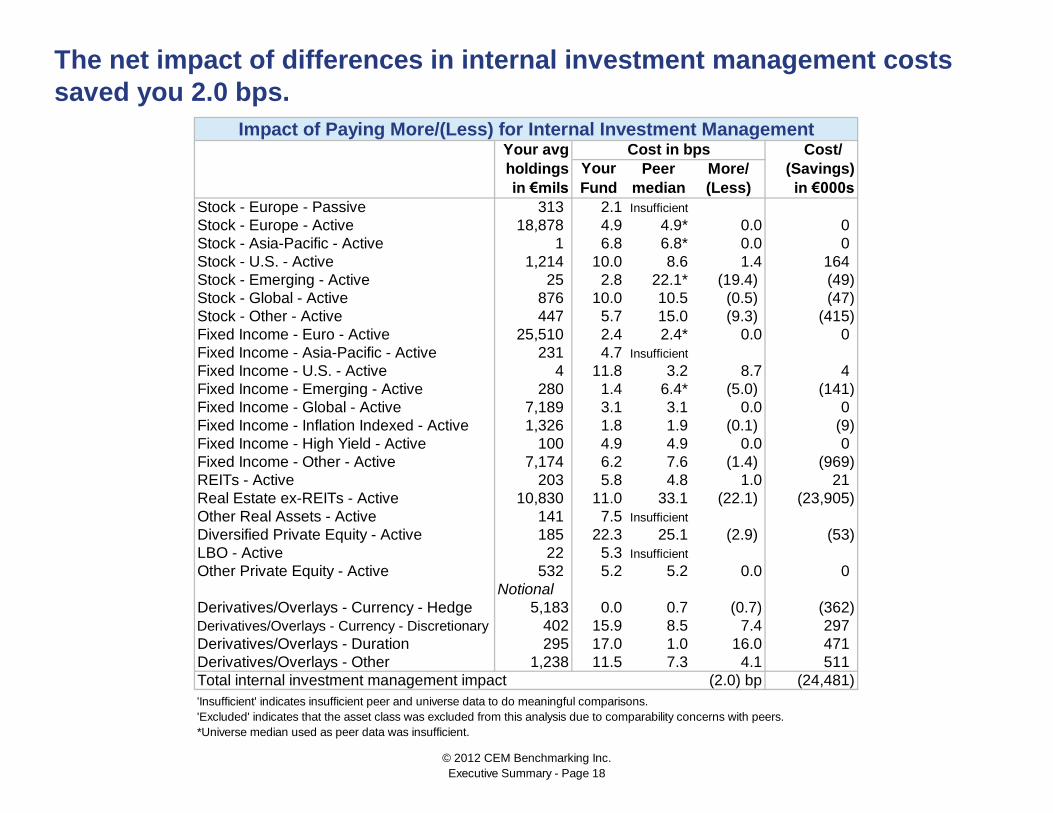
Stock - Europe - Passive 313 2.1 Insufficient
Stock - Europe - Active 18,878 4.9 4.9* 0.0 0
Stock - Asia-Pacific - Active 1 6.8 6.8* 0.0 0
Stock - U.S. - Active 1,214 10.0 8.6 1.4 164
Stock - Emerging - Active 25 2.8 22.1* (19.4) (49)
Stock - Global - Active 876 10.0 10.5 (0.5) (47)
Stock - Other - Active 447 5.7 15.0 (9.3) (415)
Fixed Income - Euro - Active 25,510 2.4 2.4* 0.0 0
Fixed Income - Asia-Pacific - Active 231 4.7 Insufficient
Fixed Income - U.S. - Active 4 11.8 3.2 8.7 4
Fixed Income - Emerging - Active 280 1.4 6.4* (5.0) (141)
Fixed Income - Global - Active 7,189 3.1 3.1 0.0 0
Fixed Income - Inflation Indexed - Active 1,326 1.8 1.9 (0.1) (9)
Fixed Income - High Yield - Active 100 4.9 4.9 0.0 0
Fixed Income - Other - Active 7,174 6.2 7.6 (1.4) (969)
REITs - Active 203 5.8 4.8 1.0 21
Real Estate ex-REITs - Active 10,830 11.0 33.1 (22.1) (23,905)
Other Real Assets - Active 141 7.5 Insufficient
Diversified Private Equity - Active 185 22.3 25.1 (2.9) (53)
LBO - Active 22 5.3 Insufficient
Other Private Equity - Active 532 5.2 5.2 0.0 0
Notional
Derivatives/Overlays - Currency - Hedge 5,183 0.0 0.7 (0.7) (362)
Derivatives/Overlays - Currency - Discretionary 402 15.9 8.5 7.4 297
Derivatives/Overlays - Duration 295 17.0 1.0 16.0 471
Derivatives/Overlays - Other 1,238 11.5 7.3 4.1 511
Total internal investment management impact (24,481)
'Insufficient' indicates insufficient peer and universe data to do meaningful comparisons.
'Excluded' indicates that the asset class was excluded from this analysis due to comparability concerns with peers.
*Universe median used as peer data was insufficient.
Impact of Paying More/(Less) for Internal Investment ManagementCost in bps
(2.0) bp
The net impact of differences in internal investment management costs
saved you 2.0 bps.
Your
Fund
© 2012 CEM Benchmarking Inc.
Executive Summary - Page 18
Your avg Cost/
holdings Peer More/ (Savings)
in €mils median (Less) in €000s
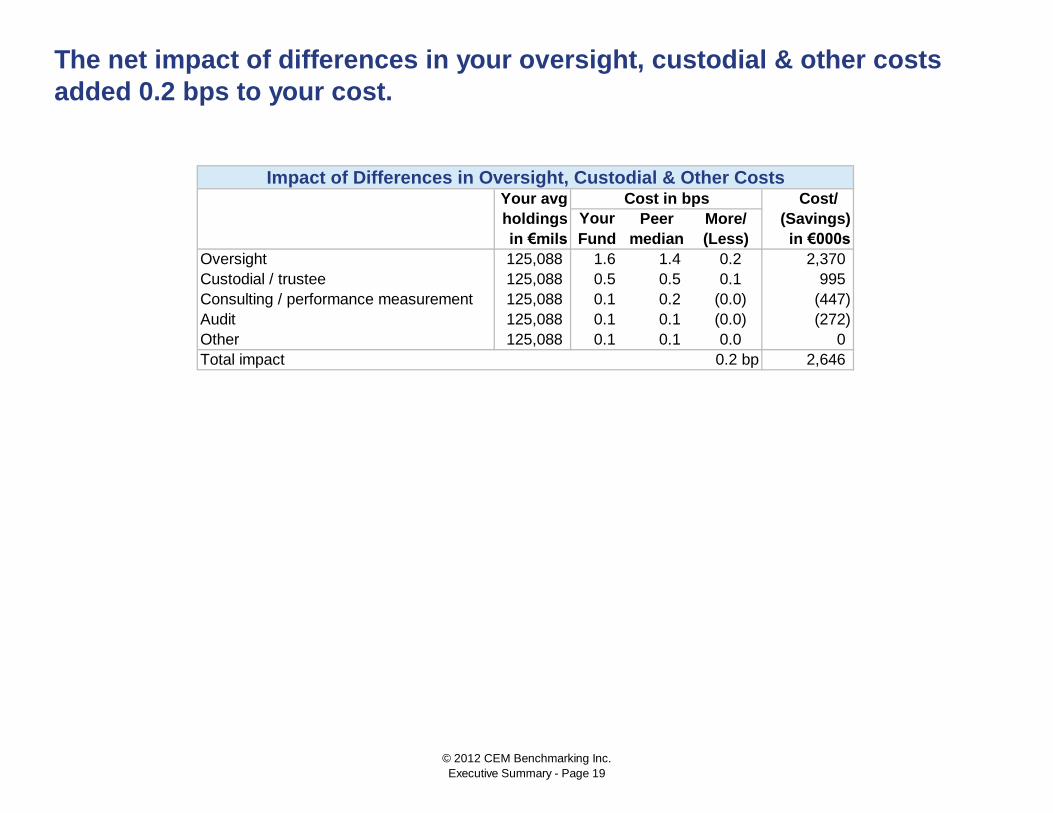
Oversight 125,088 1.6 1.4 0.2 2,370
Custodial / trustee 125,088 0.5 0.5 0.1 995
Consulting / performance measurement 125,088 0.1 0.2 (0.0) (447)
Audit 125,088 0.1 0.1 (0.0) (272)
Other 125,088 0.1 0.1 0.0 0
Total impact 0.2 bp 2,646
The net impact of differences in your oversight, custodial & other costs
added 0.2 bps to your cost.
Impact of Differences in Oversight, Custodial & Other CostsCost in bps
Your
Fund
© 2012 CEM Benchmarking Inc.
Executive Summary - Page 19
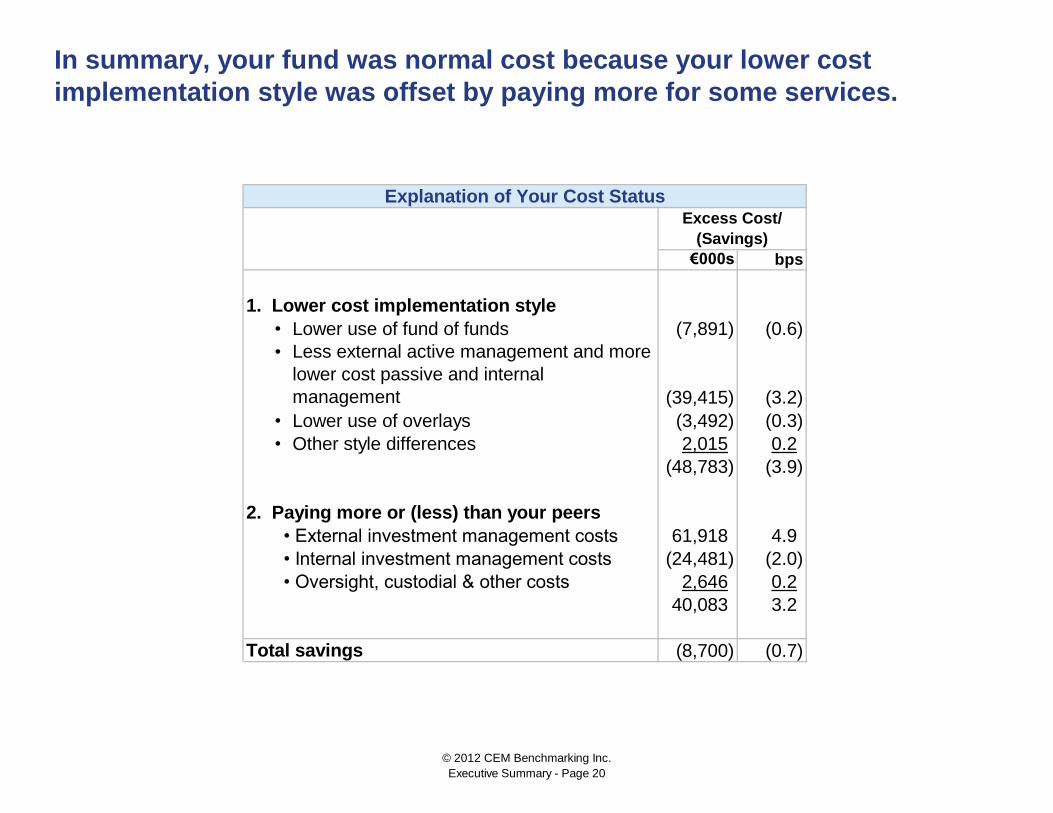
€000s bps
1. Lower cost implementation style
• Lower use of fund of funds (7,891) (0.6)
•
• Lower use of overlays (3,492) (0.3)
• Other style differences 2,015 0.2
(48,783) (3.9)
2. Paying more or (less) than your peers
• External investment management costs 61,918 4.9
• Internal investment management costs (24,481) (2.0)
• Oversight, custodial & other costs 2,646 0.2
40,083 3.2
Total savings (8,700) (0.7)
In summary, your fund was normal cost because your lower cost
implementation style was offset by paying more for some services.
Explanation of Your Cost StatusExcess Cost/
(Savings)
(39,415) (3.2)
Less external active management and more
lower cost passive and internal
management
© 2012 CEM Benchmarking Inc.
Executive Summary - Page 20
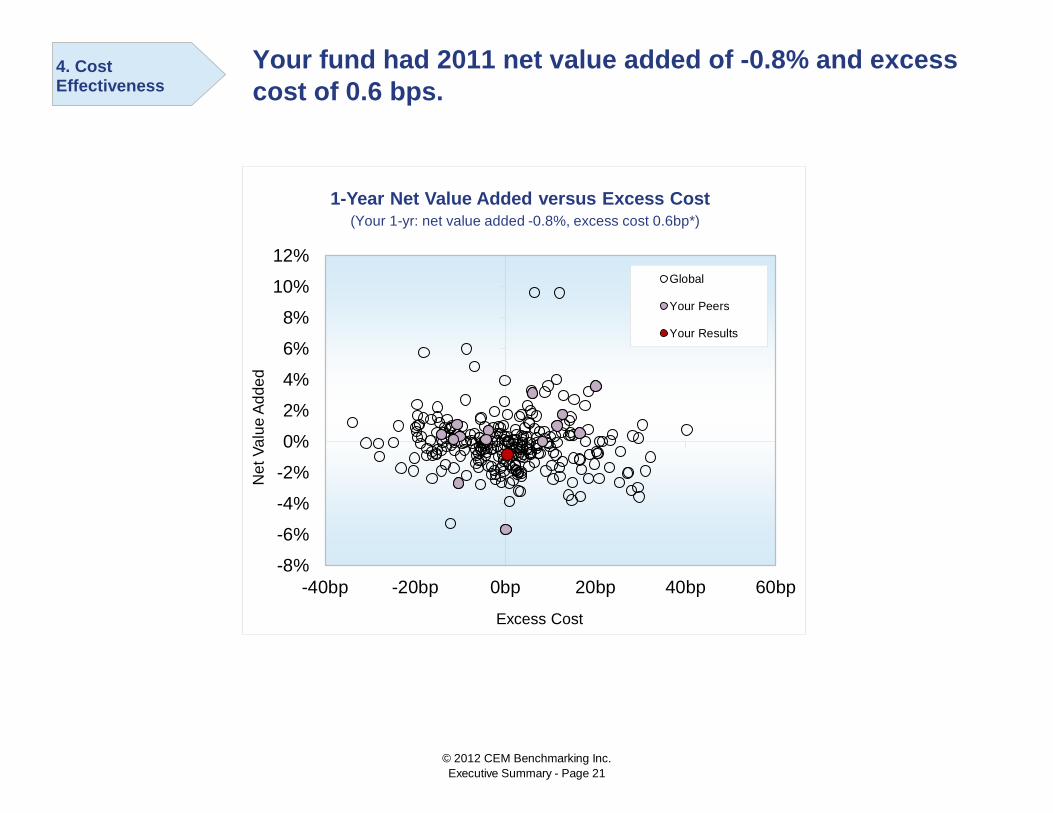
Your fund had 2011 net value added of -0.8% and excess
cost of 0.6 bps.
-8%
-6%
-4%
-2%
0%
2%
4%
6%
8%
10%
12%
-40bp -20bp 0bp 20bp 40bp 60bp
Net
Va
lue
Ad
de
d
Excess Cost
1-Year Net Value Added versus Excess Cost
Global
Your Peers
Your Results
(Your 1-yr: net value added -0.8%, excess cost 0.6bp*)
4. Cost Effectiveness
© 2012 CEM Benchmarking Inc.
Executive Summary - Page 21

Comparison of risk levels
Your asset risk of 7.3% was below the Global
median of 9.5%. Asset risk is the expected
standard deviation of your policy return. It is based
on the historical variance of, and covariance
between, the asset classes in your policy mix.
Your fund's tracking error was unavailable because
CEM does not have 5-years of data for your fund.
0%
5%
10%
15%
20%
25%
AssetRisk
TrackingError (5-yr)
Global Risk Levels at December 31, 2011
5. Risk
Legend
your value
median
maximum
75th
25th
peer med
minimum
© 2012 CEM Benchmarking Inc.
Executive Summary - Page 22

During the 5-year period ending 2011, Global funds were not rewarded for
taking risk. More risk resulted in worse performance.
Higher asset risk was associated with lower policy
returns.
There was no meaningful relationship between
tracking error and net value added.
-8%
-6%
-4%
-2%
0%
2%
4%
6%
8%
10%
12%
0% 2% 4% 6% 8% 10%
5yr
Ne
t V
alu
e A
dd
ed
Tracking Error
Tracking Error versus Net Value Added
-20.0%0.0%20.0%5 y r N
Implementation Risk Implementation Risk vs Value Added Global Peers You Linear (Global)
-6%
-4%
-2%
0%
2%
4%
6%
8%
10%
12%
0% 5% 10% 15% 20%
5yr
Po
licy R
etu
rn
Asset Risk (5yr avg)
Asset Risk versus Policy Return
© 2012 CEM Benchmarking Inc.
Executive Summary - Page 23
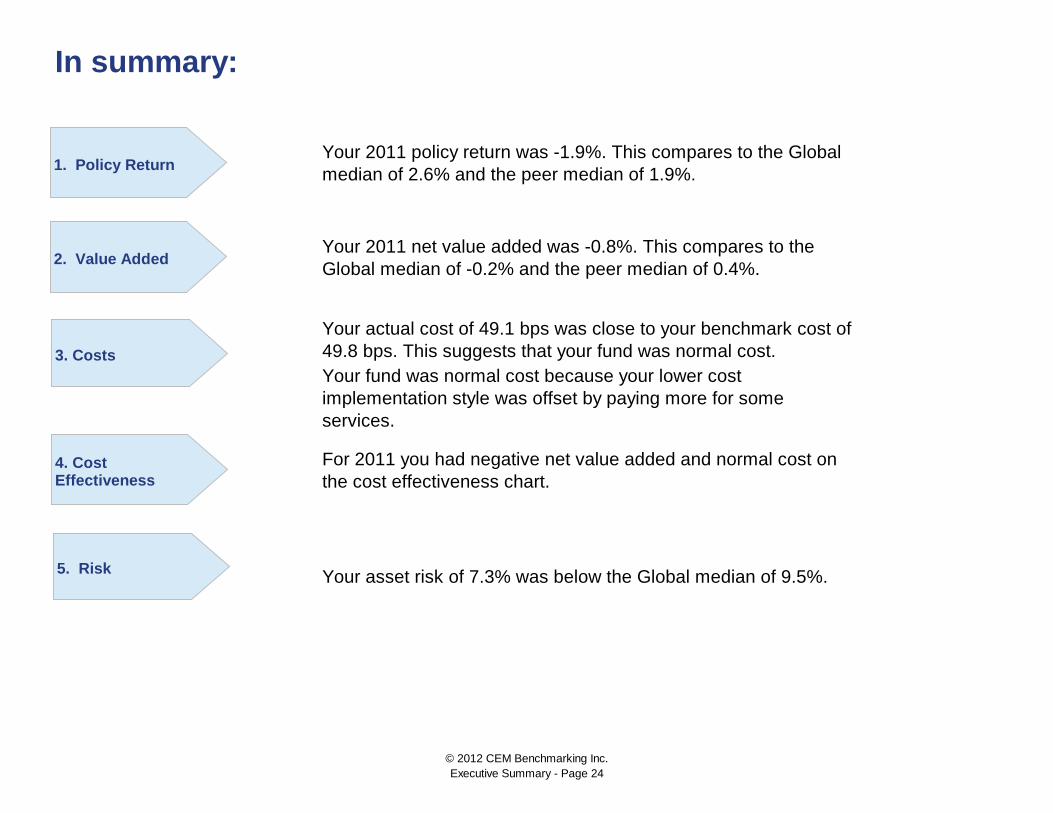
In summary:
For 2011 you had negative net value added and normal cost on
the cost effectiveness chart.
Your asset risk of 7.3% was below the Global median of 9.5%.
Your 2011 policy return was -1.9%. This compares to the Global
median of 2.6% and the peer median of 1.9%.
Your 2011 net value added was -0.8%. This compares to the
Global median of -0.2% and the peer median of 0.4%.
Your actual cost of 49.1 bps was close to your benchmark cost of
49.8 bps. This suggests that your fund was normal cost.
Your fund was normal cost because your lower cost
implementation style was offset by paying more for some
services.
1. Policy Return
2. Value Added
3. Costs
4. Cost Effectiveness
5. Risk
© 2012 CEM Benchmarking Inc.
Executive Summary - Page 24

Global peers
This benchmarking report compares your cost and return performance to
CEM's extensive pension database.
DRAFT - Finnish Pension Fund
• 174 U.S. funds participate with assets totaling
€1.7 trillion.
• 78 Canadian funds participate with assets
totaling €335 billion.
• 32 European funds participate with aggregate
assets of €1,008 billion. Included are funds from
the Netherlands, Norway, Sweden, Finland,
Denmark and the U.K.
• 7 Asia-Pacific funds participate with aggregate
assets of €105 billion. Included are funds from the
Australia, New Zealand and South Korea.
The most meaningful comparisons for your
returns and value added are to the Global
universe.
0.0
0.5
1.0
1.5
2.0
2.5
3.0
3.5
4.0
4.5
93 95 97 99 01 03 05 07 09 11
Participating Assets (€)
Late surveys
Asia-Pacific
Europe
Canada
United States
© 2012 CEM Benchmarking Inc.
Executive Summary - Page 1
Canada Finnish Pension Fund
Canadian National
Hydro Québec National Grid UK Pension Scheme
Canada Post Corporation
Sweden
Australia/New Zealand Andra AP-fonden
Qsuper Tredje AP-fonden
AustralianSuper
SAS Trustee Corporation SAMPENSION (Denmark)
New Zealand Superannuation Fund
United States
Netherlands PERS of Mississippi
Pensioenfonds Vervoer Chrysler LLC
Stpf voor de Grafische Bedrijven Utah Retirement Systems
ABN AMRO Bank N.V. United Parcel Service Inc.
Stichting Shell Pensioenfonds
All information in this report is confidential and may not be disclosed to third parties without the express written mutual consent of CEM
Benchmarking Inc and FCP.
The most valuable comparisons for cost performance are to your custom
peer group because size impacts costs.
Custom Peer Group for
Finnish Pension Fund
• 20 global sponsors from €9.2 billion to €20.6 billion
• Average size of 19 peers is €15 billion
0
5,000
10,000
15,000
20,000
25,000
€ b
illio
ns
© 2012 CEM Benchmarking Inc.
Executive Summary - Page 2

How much risk was taken to obtain your value added?
What is the risk of your policy mix?
What gets measured gets managed, so it is critical that you measure and
compare the right things:
How did the impact of your policy mix decision compare
to other funds?
Are your implementation decisions (i.e., the amount of
active versus passive management) adding value?
Are your costs reasonable? Costs matter and can be
managed.
Net implementation value added versus excess cost.
Does paying more get you more?
2. Net Value Added
3. Costs
4. Cost Effectiveness
5. Risk
1. Policy Return
© 2012 CEM Benchmarking Inc.
Executive Summary - Page 3
Total returns, by themselves, provide little insight
into the reasons behind relative performance.
Therefore, we separate total return into its more
meaningful components: policy return, cost and
value added.
Your 2011
Total Fund Return -2.2%
- Policy Return -1.9%
- Cost 0.5%
= Net Value Added -0.8%
This approach enables you to understand the
contribution from both policy mix decisions
(which tend to be the board's responsibility) and
implementation decisions (which tend to be
management's responsibility).
Your 2011 total return of -2.2% was below the Global median of 2.8%.
Global Total Returns - quartile rankings
Actual and policy returns have been converted to
your currency using unhedged currency returns.
-50%
-40%
-30%
-20%
-10%
0%
10%
20%
30%
40%
50%
2011 2010 2009 2008 2007
Legend
your value
median
maximum
75th
25th
peer med
minimum
-2%
0%
2%
4%
6%
8%
10%
12%
14%
16%
5 yrs
© 2012 CEM Benchmarking Inc.
Executive Summary - Page 4

• Long term capital market expectations
• Liabilities
• Appetite for risk
Each of these three factors is different across
funds. Therefore, it is not surprising that policy
returns often vary widely between funds.
The median 1-year policy return of your peers was
5.1%.
Your 2011 policy return of -1.9% was below the Global
median of 2.6%
Global Policy Returns - quartile rankingsYour policy return is the return you could have
earned passively by indexing your investments
according to your policy mix.
Having a higher or lower relative policy return is
not necessarily good or bad. Your policy return
reflects your investment policy, which should
reflect your:
1. Policy Return
-50%
-40%
-30%
-20%
-10%
0%
10%
20%
30%
40%
50%
2011 2010 2009 2008 2007
Legend
your value
median
maximum
75th
25th
peer med
minimum
-4%
-2%
0%
2%
4%
6%
8%
10%
12%
5yrs
© 2012 CEM Benchmarking Inc.
Executive Summary - Page 5
Your Peer Global
Fund Avg. Avg.
U.S. Stock 5% 8% 18%
Europe/Asia-Pac Stock 20% 9% 7%
Emerging Market Stock 4% 4% 2%
Global Stock 2% 10% 9%
Other Stock 1% 10% 10%
Total Stock 32% 42% 47%
Fixed Income - Euro 22% 7% 2%
U.S. Bonds 1% 2% 10%
Global Bonds 9% 11% 3%
Inflation Indexed Bonds 1% 4% 2%
Cash 4% 3% 1%
Other Fixed Income 9% 16% 20%
Total Fixed Income 46% 41% 38%
Global TAA 0% 0% 1%
Hedge Funds 6% 3% 3%
Infrastructure 0% 2% 1%
Real Estate incl. REITS 10% 7% 5%
Other Real Assets¹ 0% 1% 1%
Private Equity 5% 3% 4%
Total 100% 100% 100%
Other real assets includes commodities and natural resources.
Your 2011 policy mix compares to the Global and peer averages as follows.
2011 Policy MixSome key differences include:
• There is a lower allocation to stocks relative
to the average peer or Global fund (32%
versus 42% and 47% respectively).
• There is a higher allocation to hedge funds
relative to the average peer or Global fund (6%
versus 3%).
© 2012 CEM Benchmarking Inc.
Executive Summary - Page 6
Total Policy Net Value
Year Return Return Cost Added
2011 (2.2)% (1.9)% 0.5% (0.8)%
Your 2011 net value added of -0.8%
compares to a median of 0.2% for your
peers and -0.2% for the Global
universe.
Your value added was impacted by your above-
average benchmark return for private equity
(your 11.1% versus a 2011 Global average of
4.9%). If you had used the Global average
benchmark, your 2011 value added would have
been approximately 0.3% higher.
Global Net Value Added - quartile rankings
Finnish Pension Fund
Net value added equals total return minus policy
return minus costs.
Net value added is the component of total return from
active management. Your 2011 net value added was
-0.8%.
-20%
-15%
-10%
-5%
0%
5%
10%
15%
20%
25%
2011 2010 2009 2008 2007
2. Net Value Added
Legend
your value
median
maximum
75th
25th
peer med
minimum -6%
-5%
-4%
-3%
-2%
-1%
0%
1%
2%
3%
4%
5%
5yrs
© 2012 CEM Benchmarking Inc.
Executive Summary - Page 7
You had positive 2011 value added in fixed income, real assets, hedge
funds and private equity.
1. Private equity value added is net whereas the other asset classes are gross.
2. Comparisons of value added for private equity and hedge funds must be interpreted with caution because the types of investments and benchmarks can be extremely varied. It
may be more useful to compare total returns. Your 1-year return of 13.7% for private equity was above the Global average of 10.7%. Your 1-year return of 3.8% for hedge funds was
above the Global average of 2.0%.
-4.0%
-2.0%
0.0%
2.0%
4.0%
6.0%
8.0%
10.0%
Stock Fixed Income Real Assets Hedge Funds² Private Equity¹
You -3.4% 0.6% 0.5% 8.0% 2.6%
Global Average 0.0% -0.4% 0.9% 1.4% 5.8%
2011 Average In-Category Value Added by Major Asset Class
© 2012 CEM Benchmarking Inc.
Executive Summary - Page 8
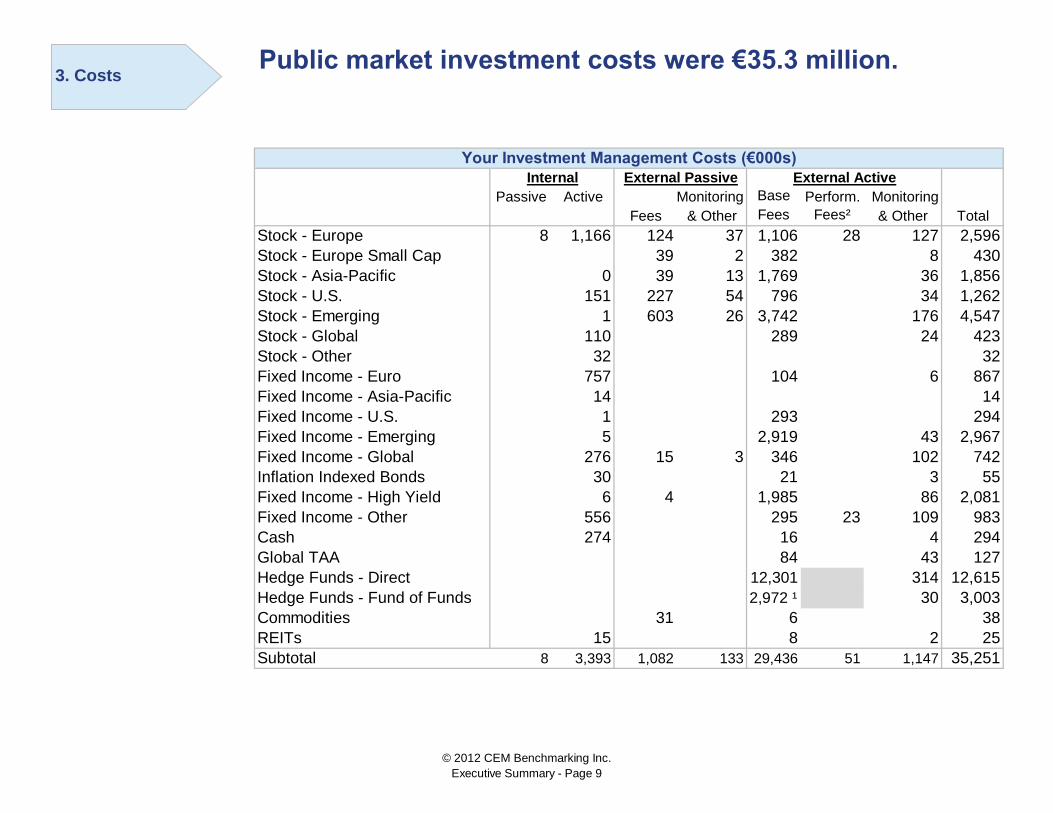
Your Investment Management Costs (€000s)
Internal External Passive External Active
Passive Active Monitoring Base Perform. Monitoring
Fees & Other Fees Fees² & Other Total
Stock - Europe 8 1,166 124 37 1,106 28 127 2,596
Stock - Europe Small Cap 39 2 382 8 430
Stock - Asia-Pacific 0 39 13 1,769 36 1,856
Stock - U.S. 151 227 54 796 34 1,262
Stock - Emerging 1 603 26 3,742 176 4,547
Stock - Global 110 289 24 423
Stock - Other 32 32
Fixed Income - Euro 757 104 6 867
Fixed Income - Asia-Pacific 14 14
Fixed Income - U.S. 1 293 294
Fixed Income - Emerging 5 2,919 43 2,967
Fixed Income - Global 276 15 3 346 102 742
Inflation Indexed Bonds 30 21 3 55
Fixed Income - High Yield 6 4 1,985 86 2,081
Fixed Income - Other 556 295 23 109 983
Cash 274 16 4 294
Global TAA 84 43 127
Hedge Funds - Direct 12,301 314 12,615
Hedge Funds - Fund of Funds 2,972 ¹ 30 3,003
Commodities 31 6 38
REITs 15 8 2 25
Subtotal 8 3,393 1,082 133 29,436 51 1,147 35,251
Public market investment costs were €35.3 million.
3. Costs
© 2012 CEM Benchmarking Inc.
Executive Summary - Page 9

Your Investment Management Costs (€000s)
Internal External Passive External Active
Passive Active Monitoring Base Perform. Monitoring
Fees & Other Fees Fees² & Other Total
Real Estate 1,491 2,651 405 4,546
Real Estate - LPs 2,108 141 2,249
Real Estate - Fund of Funds 289 ¹ 22 311
Infrastructure 234 5 239
Infrastructure - LPs 254 18 272
Other Real Assets 13 26 39
Diversified Private Equity 52 22,716 396 23,164
Diversified Priv. Eq.- Fund of Funds 1,225 ¹ 35 1,260
LBO 1 2,830 60 2,891
LBO - Fund of Funds 24 ¹ 2 26
Venture Capital 209 13 223
Venture Capital - Fund of Funds 194 ¹ 16 210
Other Private Equity 34 1,642 5 1,682
Overlay Programs 749 749
Subtotal 2,340 34,401 1,119 37,860
Total investment management costs 46.8bp 73,111
Your Oversight, Custodial and Other Asset Related Costs³ (€000s)
Oversight of the fund 2,462
Trustee & custodial 848
Consulting and performance measurement 224
Audit 84
Other 195
Total oversight, custodial & other costs 2.4bp 3,812
Total asset management costs 49.2bp 76,923
Notes
¹ Includes default for
fees paid to underlying
partnerships in fund of
funds. The default for
hedge funds was 169bps.
The default for real estate
was 59bps. The default
for diversified private
equity was 165bps. The
default for LBO was
163bps. The default for
venture capital was
205bps.
² Total cost excludes
carry/performance fees
for real estate,
infrastructure, hedge
funds, private equity and
overlays. Performance
fees are included for the
public market asset
classes.
³ Excludes non-
investment costs, such
as benefit insurance
premiums and preparing
cheques for retirees.
Your total asset management costs in 2011 were €76.9 million or 49.2
basis points.
© 2012 CEM Benchmarking Inc.
Executive Summary - Page 10
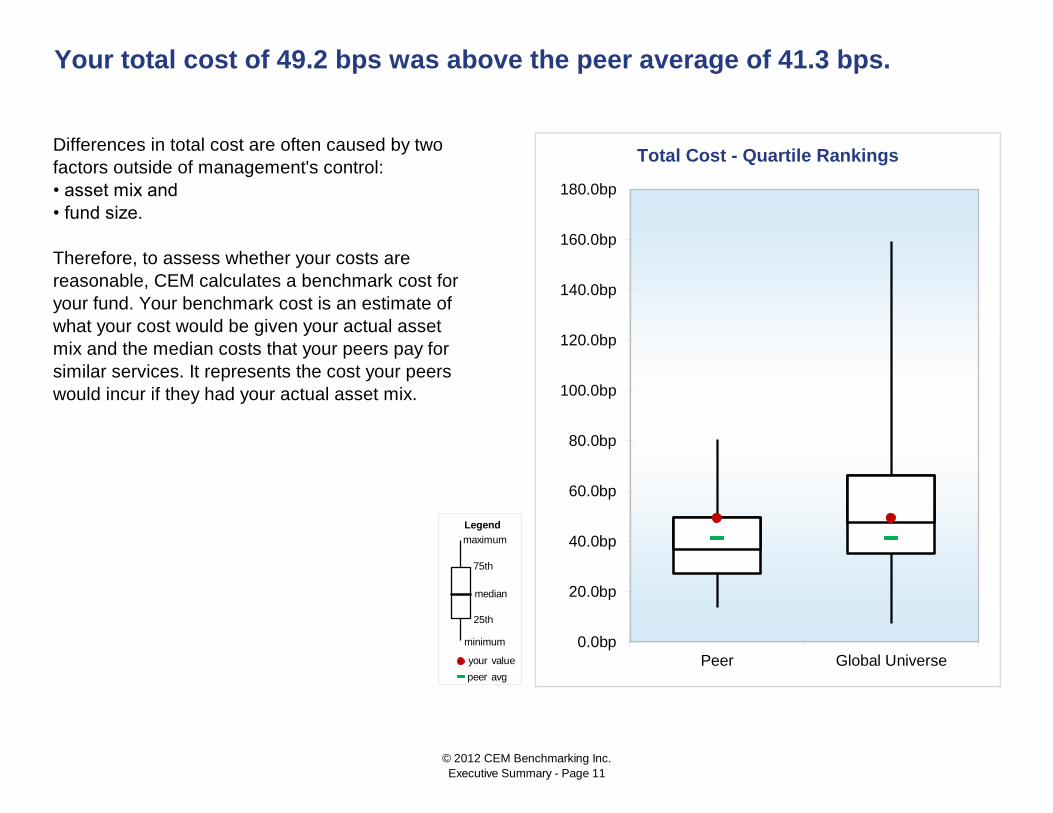
Differences in total cost are often caused by two
factors outside of management's control:
• asset mix and
• fund size.
Therefore, to assess whether your costs are
reasonable, CEM calculates a benchmark cost for
your fund. Your benchmark cost is an estimate of
what your cost would be given your actual asset
mix and the median costs that your peers pay for
similar services. It represents the cost your peers
would incur if they had your actual asset mix.
Your total cost of 49.2 bps was above the peer average of 41.3 bps.
Total Cost - Quartile Rankings
0.0bp
20.0bp
40.0bp
60.0bp
80.0bp
100.0bp
120.0bp
140.0bp
160.0bp
180.0bp
Peer Global Universe
Legend
your value
median
maximum
75th
25th
peer avg
minimum
© 2012 CEM Benchmarking Inc.
Executive Summary - Page 11
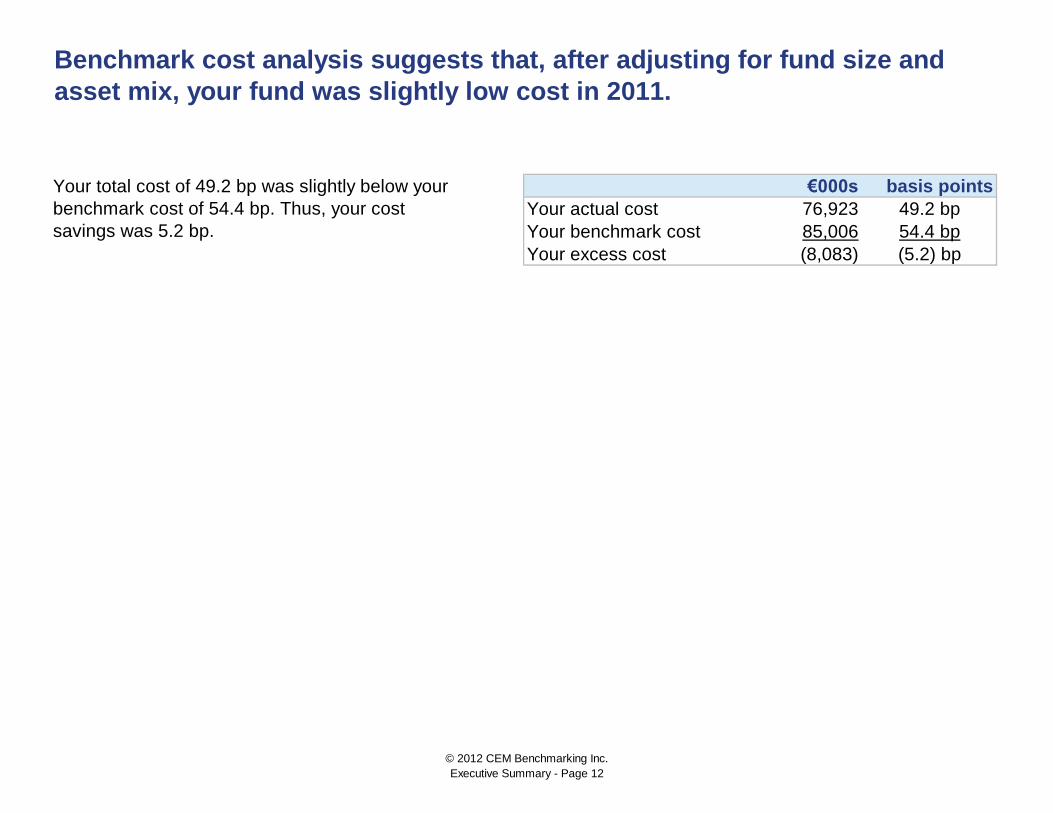
€000s basis points
Your actual cost
Your benchmark cost
Your excess cost (8,083) (5.2) bp
Your total cost of 49.2 bp was slightly below your
benchmark cost of 54.4 bp. Thus, your cost
savings was 5.2 bp.
Benchmark cost analysis suggests that, after adjusting for fund size and
asset mix, your fund was slightly low cost in 2011.
76,923 49.2 bp
85,006 54.4 bp
© 2012 CEM Benchmarking Inc.
Executive Summary - Page 12
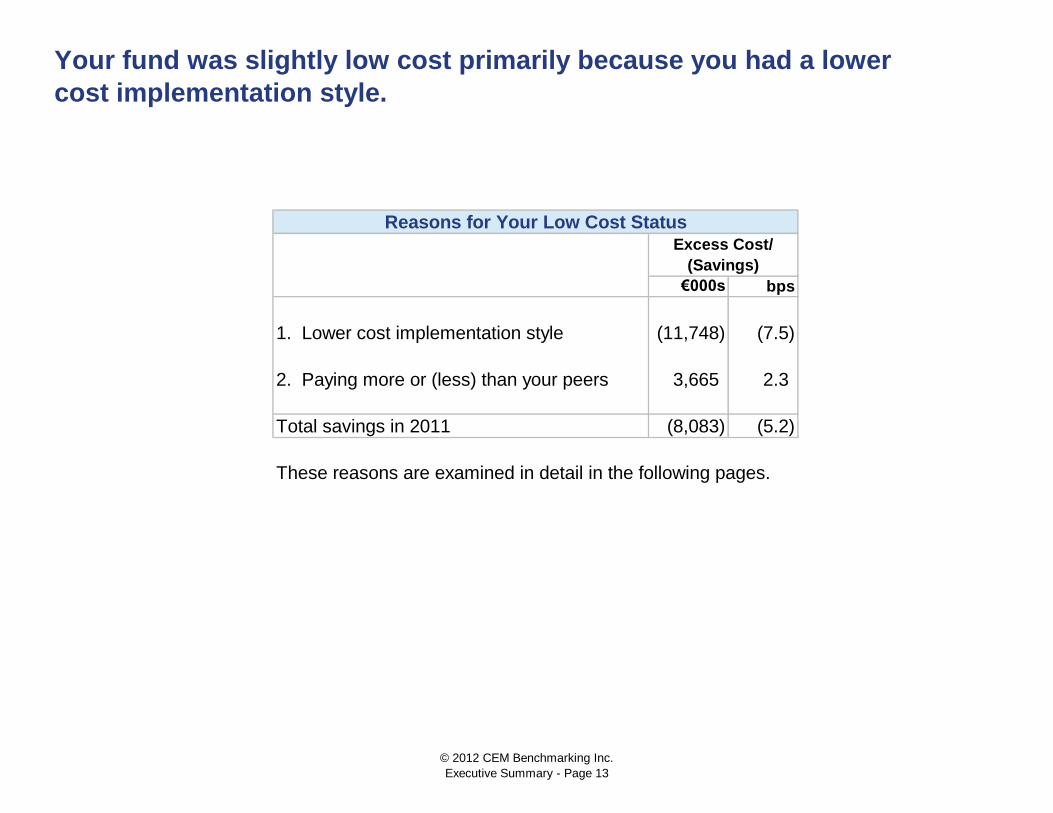
€000s bps
1. Lower cost implementation style (11,748) (7.5)
2. Paying more or (less) than your peers 3,665 2.3
Total savings in 2011 (8,083) (5.2)
These reasons are examined in detail in the following pages.
Your fund was slightly low cost primarily because you had a lower
cost implementation style.
Reasons for Your Low Cost StatusExcess Cost/
(Savings)
© 2012 CEM Benchmarking Inc.
Executive Summary - Page 13
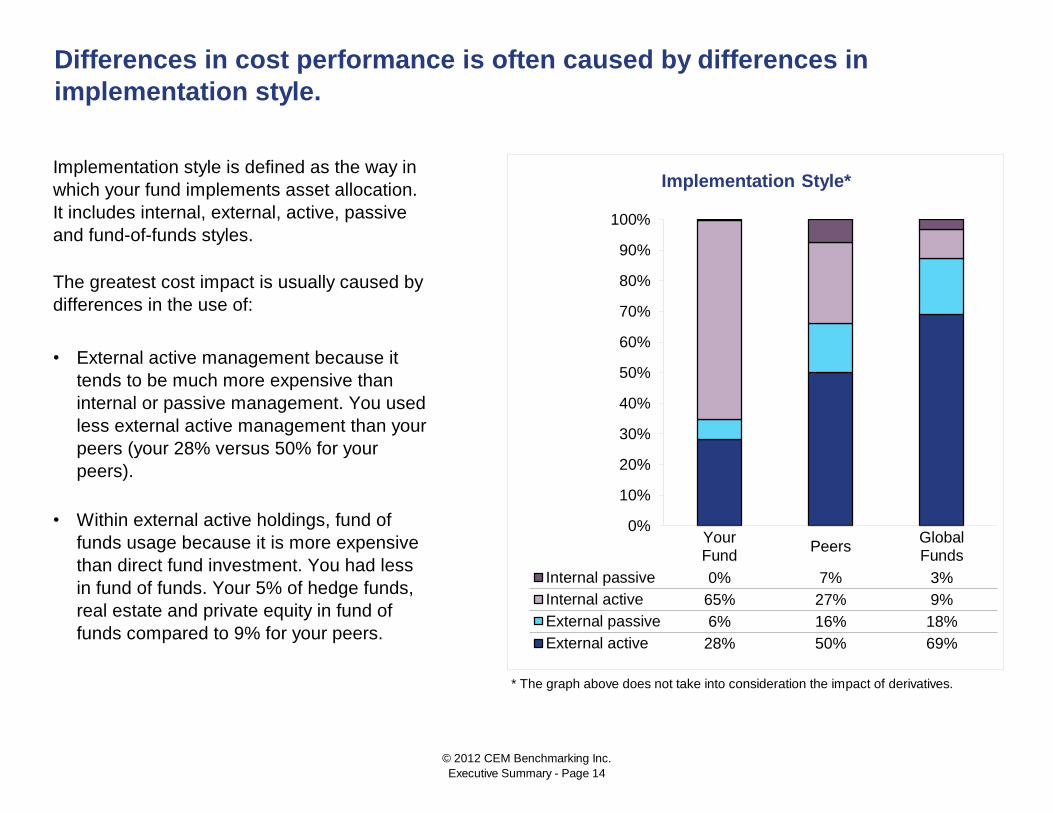
•
•
* The graph above does not take into consideration the impact of derivatives.
Within external active holdings, fund of
funds usage because it is more expensive
than direct fund investment. You had less
in fund of funds. Your 5% of hedge funds,
real estate and private equity in fund of
funds compared to 9% for your peers.
Differences in cost performance is often caused by differences in
implementation style.
Implementation style is defined as the way in
which your fund implements asset allocation.
It includes internal, external, active, passive
and fund-of-funds styles.
The greatest cost impact is usually caused by
differences in the use of:
External active management because it
tends to be much more expensive than
internal or passive management. You used
less external active management than your
peers (your 28% versus 50% for your
peers).
0%
10%
20%
30%
40%
50%
60%
70%
80%
90%
100%
YourFund
PeersGlobalFunds
Internal passive 0% 7% 3%
Internal active 65% 27% 9%
External passive 6% 16% 18%
External active 28% 50% 69%
Implementation Style*
© 2012 CEM Benchmarking Inc.
Executive Summary - Page 14
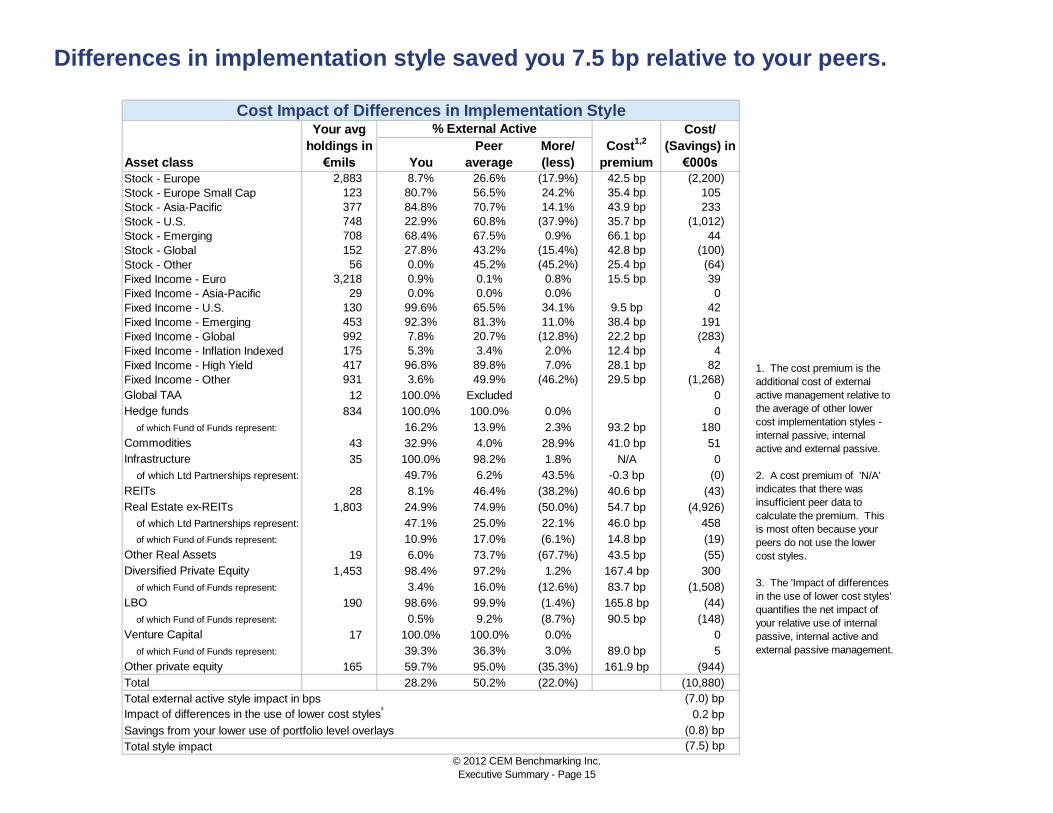
Asset class You
Stock - Europe 2,883 8.7% 26.6% (17.9%) 42.5 bp (2,200)
Stock - Europe Small Cap 123 80.7% 56.5% 24.2% 35.4 bp 105
Stock - Asia-Pacific 377 84.8% 70.7% 14.1% 43.9 bp 233
Stock - U.S. 748 22.9% 60.8% (37.9%) 35.7 bp (1,012)
Stock - Emerging 708 68.4% 67.5% 0.9% 66.1 bp 44
Stock - Global 152 27.8% 43.2% (15.4%) 42.8 bp (100)
Stock - Other 56 0.0% 45.2% (45.2%) 25.4 bp (64)
Fixed Income - Euro 3,218 0.9% 0.1% 0.8% 15.5 bp 39
Fixed Income - Asia-Pacific 29 0.0% 0.0% 0.0% 0
Fixed Income - U.S. 130 99.6% 65.5% 34.1% 9.5 bp 42
Fixed Income - Emerging 453 92.3% 81.3% 11.0% 38.4 bp 191
Fixed Income - Global 992 7.8% 20.7% (12.8%) 22.2 bp (283)
Fixed Income - Inflation Indexed 175 5.3% 3.4% 2.0% 12.4 bp 4
Fixed Income - High Yield 417 96.8% 89.8% 7.0% 28.1 bp 82
Fixed Income - Other 931 3.6% 49.9% (46.2%) 29.5 bp (1,268)
Global TAA 12 100.0% Excluded 0
Hedge funds 834 100.0% 100.0% 0.0% 0
of which Fund of Funds represent: 834 16.2% 13.9% 2.3% 93.2 bp 180
Commodities 43 32.9% 4.0% 28.9% 41.0 bp 51
Infrastructure 35 100.0% 98.2% 1.8% N/A 0
of which Ltd Partnerships represent: 35 49.7% 6.2% 43.5% -0.3 bp (0)
REITs 28 8.1% 46.4% (38.2%) 40.6 bp (43)
Real Estate ex-REITs 1,803 24.9% 74.9% (50.0%) 54.7 bp (4,926)
of which Ltd Partnerships represent: 449 47.1% 25.0% 22.1% 46.0 bp 458
of which Fund of Funds represent: 212 10.9% 17.0% (6.1%) 14.8 bp (19)
Other Real Assets 19 6.0% 73.7% (67.7%) 43.5 bp (55)
Diversified Private Equity 1,453 98.4% 97.2% 1.2% 167.4 bp 300
of which Fund of Funds represent: 1,430 3.4% 16.0% (12.6%) 83.7 bp (1,508)
LBO 190 98.6% 99.9% (1.4%) 165.8 bp (44)
of which Fund of Funds represent: 188 0.5% 9.2% (8.7%) 90.5 bp (148)
Venture Capital 17 100.0% 100.0% 0.0% 0
of which Fund of Funds represent: 17 39.3% 36.3% 3.0% 89.0 bp 5
Other private equity 165 59.7% 95.0% (35.3%) 161.9 bp (944)
Total 28.2% 50.2% (22.0%) (10,880)
Total external active style impact in bps (7.0) bp
Impact of differences in the use of lower cost styles³
0.2 bp
Savings from your lower use of portfolio level overlays (0.8) bp
Total style impact (7.5) bp
Differences in implementation style saved you 7.5 bp relative to your peers.
Cost Impact of Differences in Implementation StyleYour avg
holdings in
€mils
% External Active
Cost1,2
premium
Cost/
(Savings) in
€000s
Peer
average
More/
(less)
1. The cost premium is the
additional cost of external
active management relative to
the average of other lower
cost implementation styles -
internal passive, internal
active and external passive.
2. A cost premium of 'N/A'
indicates that there was
insufficient peer data to
calculate the premium. This
is most often because your
peers do not use the lower
cost styles.
3. The 'Impact of differences
in the use of lower cost styles'
quantifies the net impact of
your relative use of internal
passive, internal active and
external passive management.
© 2012 CEM Benchmarking Inc.
Executive Summary - Page 15
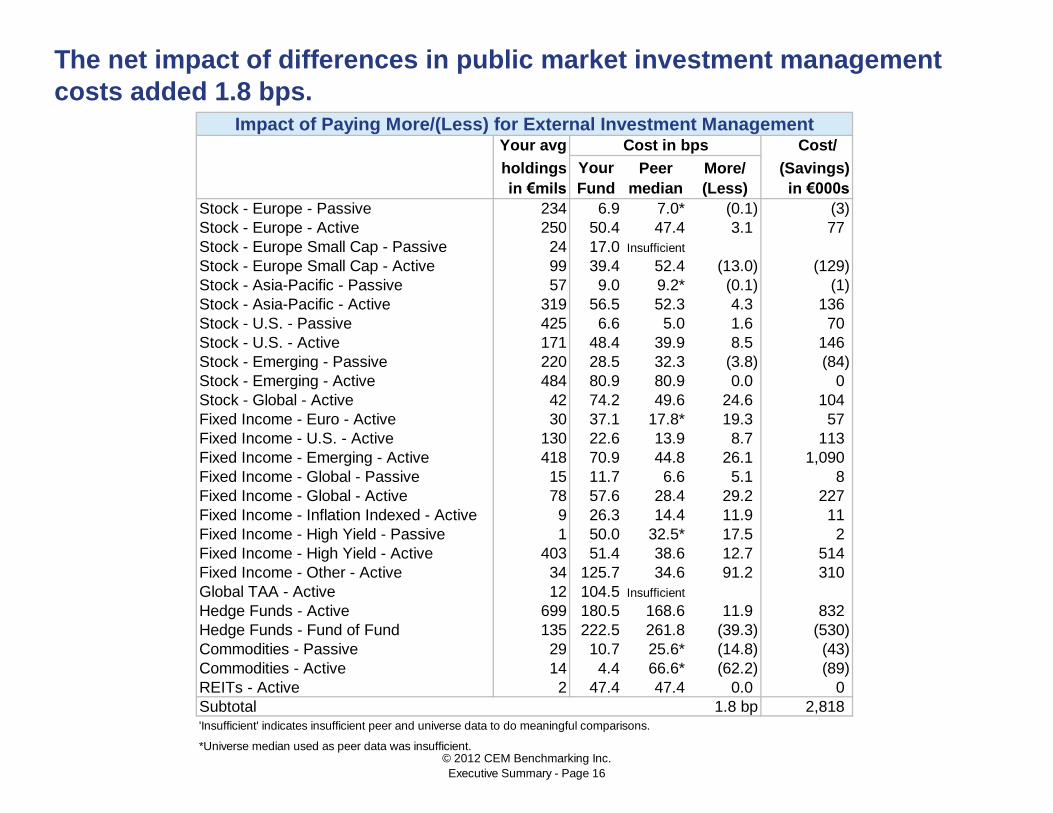
Your avg Cost/
holdings Peer More/ (Savings)
in €mils median (Less) in €000s
Stock - Europe - Passive 234 6.9 7.0* (0.1) (3)
Stock - Europe - Active 250 50.4 47.4 3.1 77
Stock - Europe Small Cap - Passive 24 17.0 Insufficient
Stock - Europe Small Cap - Active 99 39.4 52.4 (13.0) (129)
Stock - Asia-Pacific - Passive 57 9.0 9.2* (0.1) (1)
Stock - Asia-Pacific - Active 319 56.5 52.3 4.3 136
Stock - U.S. - Passive 425 6.6 5.0 1.6 70
Stock - U.S. - Active 171 48.4 39.9 8.5 146
Stock - Emerging - Passive 220 28.5 32.3 (3.8) (84)
Stock - Emerging - Active 484 80.9 80.9 0.0 0
Stock - Global - Active 42 74.2 49.6 24.6 104
Fixed Income - Euro - Active 30 37.1 17.8* 19.3 57
Fixed Income - U.S. - Active 130 22.6 13.9 8.7 113
Fixed Income - Emerging - Active 418 70.9 44.8 26.1 1,090
Fixed Income - Global - Passive 15 11.7 6.6 5.1 8
Fixed Income - Global - Active 78 57.6 28.4 29.2 227
Fixed Income - Inflation Indexed - Active 9 26.3 14.4 11.9 11
Fixed Income - High Yield - Passive 1 50.0 32.5* 17.5 2
Fixed Income - High Yield - Active 403 51.4 38.6 12.7 514
Fixed Income - Other - Active 34 125.7 34.6 91.2 310
Global TAA - Active 12 104.5 Insufficient
Hedge Funds - Active 699 180.5 168.6 11.9 832
Hedge Funds - Fund of Fund 135 222.5 261.8 (39.3) (530)
Commodities - Passive 29 10.7 25.6* (14.8) (43)
Commodities - Active 14 4.4 66.6* (62.2) (89)
REITs - Active 2 47.4 47.4 0.0 0
Subtotal 2,818'Insufficient' indicates insufficient peer and universe data to do meaningful comparisons.
*Universe median used as peer data was insufficient.
Your
Fund
1.8 bp
The net impact of differences in public market investment management
costs added 1.8 bps.Impact of Paying More/(Less) for External Investment Management
Cost in bps
© 2012 CEM Benchmarking Inc.
Executive Summary - Page 16
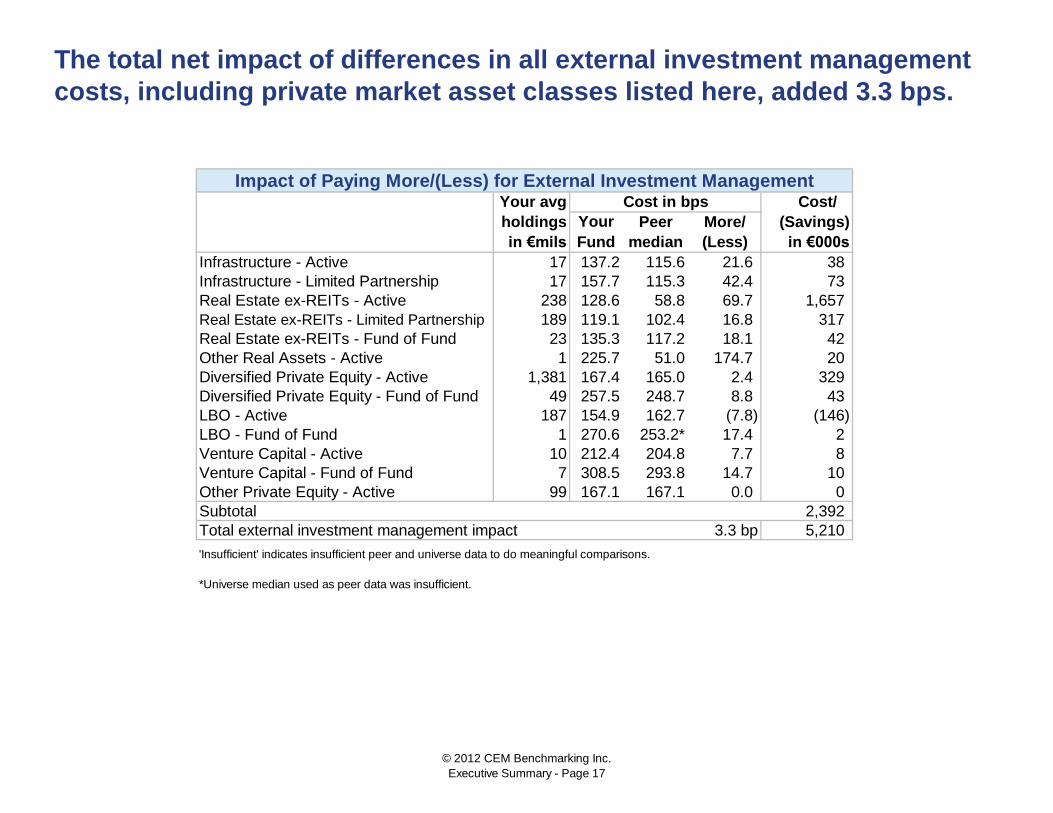
Your avg Cost/
holdings Peer More/ (Savings)
in €mils median (Less) in €000s
Infrastructure - Active 17 137.2 115.6 21.6 38
Infrastructure - Limited Partnership 17 157.7 115.3 42.4 73
Real Estate ex-REITs - Active 238 128.6 58.8 69.7 1,657
Real Estate ex-REITs - Limited Partnership 189 119.1 102.4 16.8 317
Real Estate ex-REITs - Fund of Fund 23 135.3 117.2 18.1 42
Other Real Assets - Active 1 225.7 51.0 174.7 20
Diversified Private Equity - Active 1,381 167.4 165.0 2.4 329
Diversified Private Equity - Fund of Fund 49 257.5 248.7 8.8 43
LBO - Active 187 154.9 162.7 (7.8) (146)
LBO - Fund of Fund 1 270.6 253.2* 17.4 2
Venture Capital - Active 10 212.4 204.8 7.7 8
Venture Capital - Fund of Fund 7 308.5 293.8 14.7 10
Other Private Equity - Active 99 167.1 167.1 0.0 0
Subtotal 2,392
Total external investment management impact 5,210
'Insufficient' indicates insufficient peer and universe data to do meaningful comparisons.
*Universe median used as peer data was insufficient.
3.3 bp
Impact of Paying More/(Less) for External Investment ManagementCost in bps
Your
Fund
The total net impact of differences in all external investment management
costs, including private market asset classes listed here, added 3.3 bps.
© 2012 CEM Benchmarking Inc.
Executive Summary - Page 17
Your avg Cost/
holdings Peer More/ (Savings)
in €mils median (Less) in €000s
Stock - Europe - Passive 39 2.1 Insufficient
Stock - Europe - Active 2,360 4.9 4.9* 0.0 0
Stock - Asia-Pacific - Active 0 6.8 6.8 0.0 0
Stock - U.S. - Active 152 10.0 7.7 2.2 34
Stock - Emerging - Active 3 2.8 2.8 0.0 0
Stock - Global - Active 110 10.0 7.9 2.1 23
Stock - Other - Active 56 5.7 7.6 (2.0) (11)
Fixed Income - Euro - Active 3,189 2.4 2.3 0.0 15
Fixed Income - Asia-Pacific - Active 29 4.7 Insufficient
Fixed Income - U.S. - Active 1 11.8 4.0* 7.8 0
Fixed Income - Emerging - Active 35 1.4 6.4* (5.0) (18)
Fixed Income - Global - Active 899 3.1 4.1 (1.0) (93)
Fixed Income - Inflation Indexed - Active 166 1.8 2.0 (0.2) (4)
Fixed Income - High Yield - Active 13 4.9 10.5* (5.6) (7)
Fixed Income - Other - Active 897 6.2 4.3 1.9 166
REITs - Active 25 5.8 6.9* (1.0) (3)
Real Estate ex-REITs - Active 1,354 11.0 15.7 (4.7) (632)
Other Real Assets - Active 18 7.5 Insufficient
Diversified Private Equity - Active 23 22.3 11.1 11.2 26
LBO - Active 3 5.3 Insufficient
Other Private Equity - Active 67 5.2 5.2 0.0 0
Notional
Derivatives/Overlays - Currency - Hedge 648 0.0 N/A N/A N/A
Derivatives/Overlays - Currency - Discretionary 50 15.9 8.5 7.4 37
Derivatives/Overlays - Duration 37 17.0 1.0 16.0 59
Derivatives/Overlays - Other 155 11.5 7.3 4.1 64
Total internal investment management impact (342)
'Insufficient' indicates insufficient peer and universe data to do meaningful comparisons.
'Excluded' indicates that the asset class was excluded from this analysis due to comparability concerns with peers.
*Universe median used as peer data was insufficient.
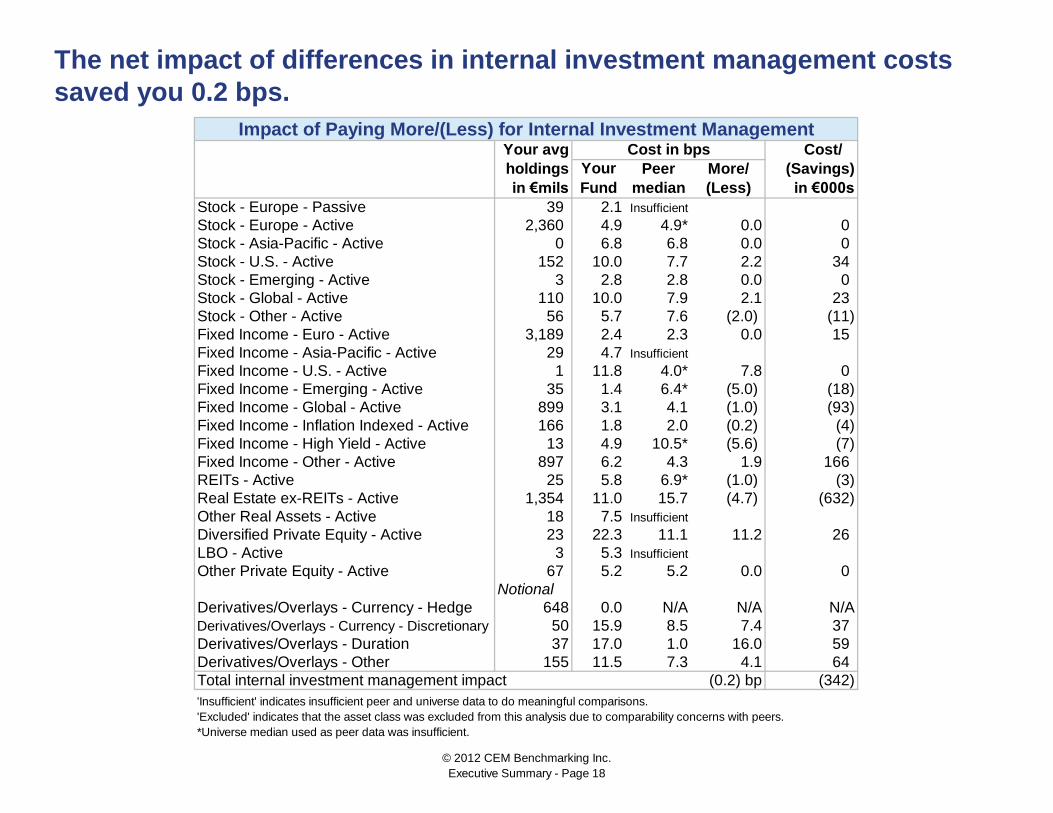
Impact of Paying More/(Less) for Internal Investment ManagementCost in bps
(0.2) bp
The net impact of differences in internal investment management costs
saved you 0.2 bps.
Your
Fund
© 2012 CEM Benchmarking Inc.
Executive Summary - Page 18
Your avg Cost/
holdings Peer More/ (Savings)
in €mils median (Less) in €000s
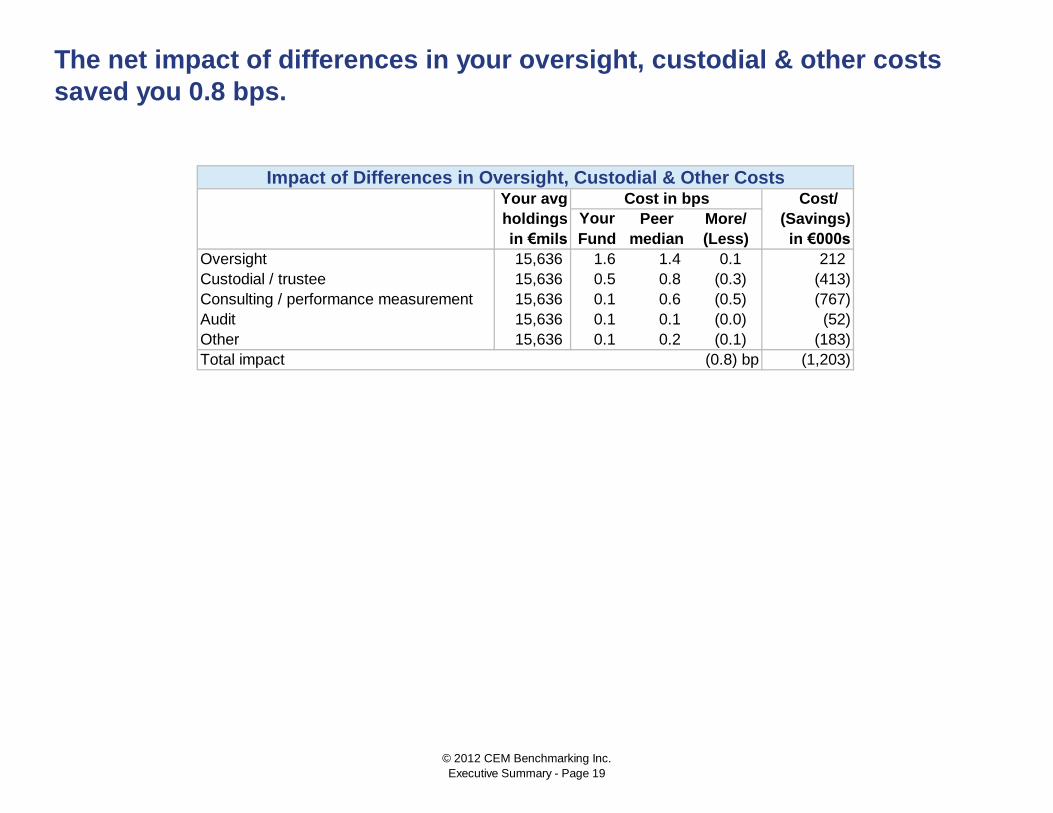
Oversight 15,636 1.6 1.4 0.1 212
Custodial / trustee 15,636 0.5 0.8 (0.3) (413)
Consulting / performance measurement 15,636 0.1 0.6 (0.5) (767)
Audit 15,636 0.1 0.1 (0.0) (52)
Other 15,636 0.1 0.2 (0.1) (183)
Total impact (0.8) bp (1,203)
The net impact of differences in your oversight, custodial & other costs
saved you 0.8 bps.
Impact of Differences in Oversight, Custodial & Other CostsCost in bps
Your
Fund
© 2012 CEM Benchmarking Inc.
Executive Summary - Page 19
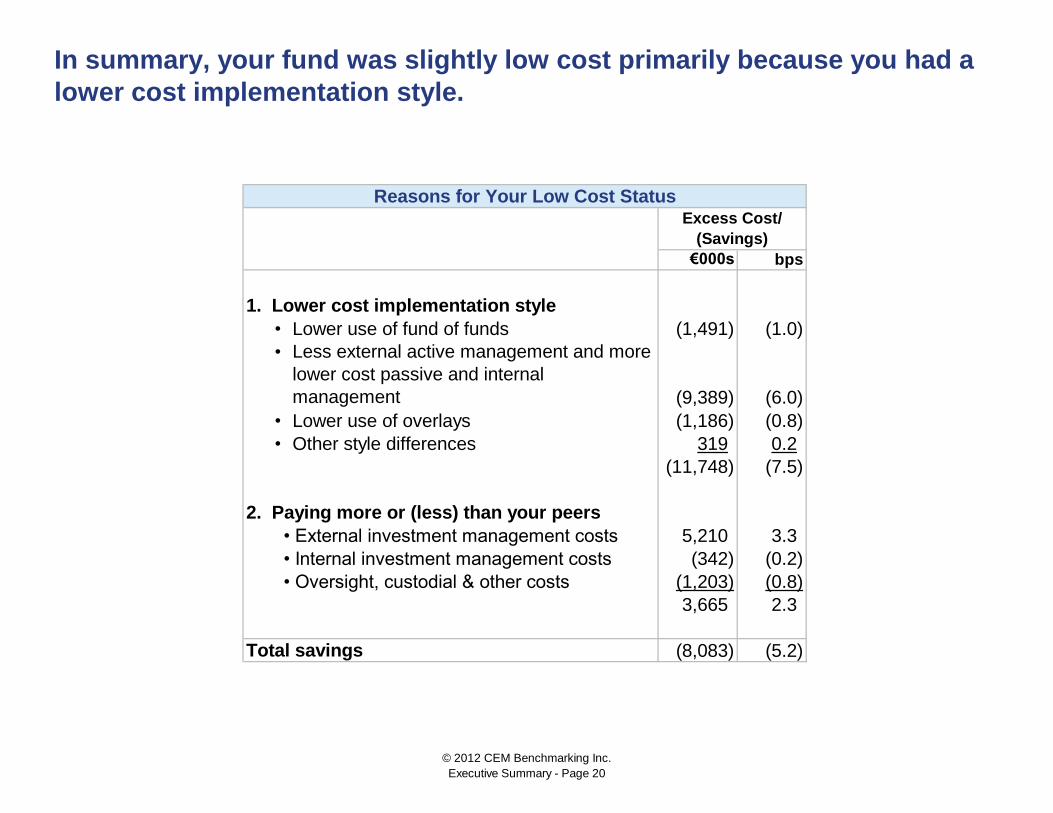
€000s bps
1. Lower cost implementation style
• Lower use of fund of funds (1,491) (1.0)
•
• Lower use of overlays (1,186) (0.8)
• Other style differences 319 0.2
(11,748) (7.5)
2. Paying more or (less) than your peers
• External investment management costs 5,210 3.3
• Internal investment management costs (342) (0.2)
• Oversight, custodial & other costs (1,203) (0.8)
3,665 2.3
Total savings (8,083) (5.2)
In summary, your fund was slightly low cost primarily because you had a
lower cost implementation style.
Reasons for Your Low Cost StatusExcess Cost/
(Savings)
(9,389) (6.0)
Less external active management and more
lower cost passive and internal
management
© 2012 CEM Benchmarking Inc.
Executive Summary - Page 20
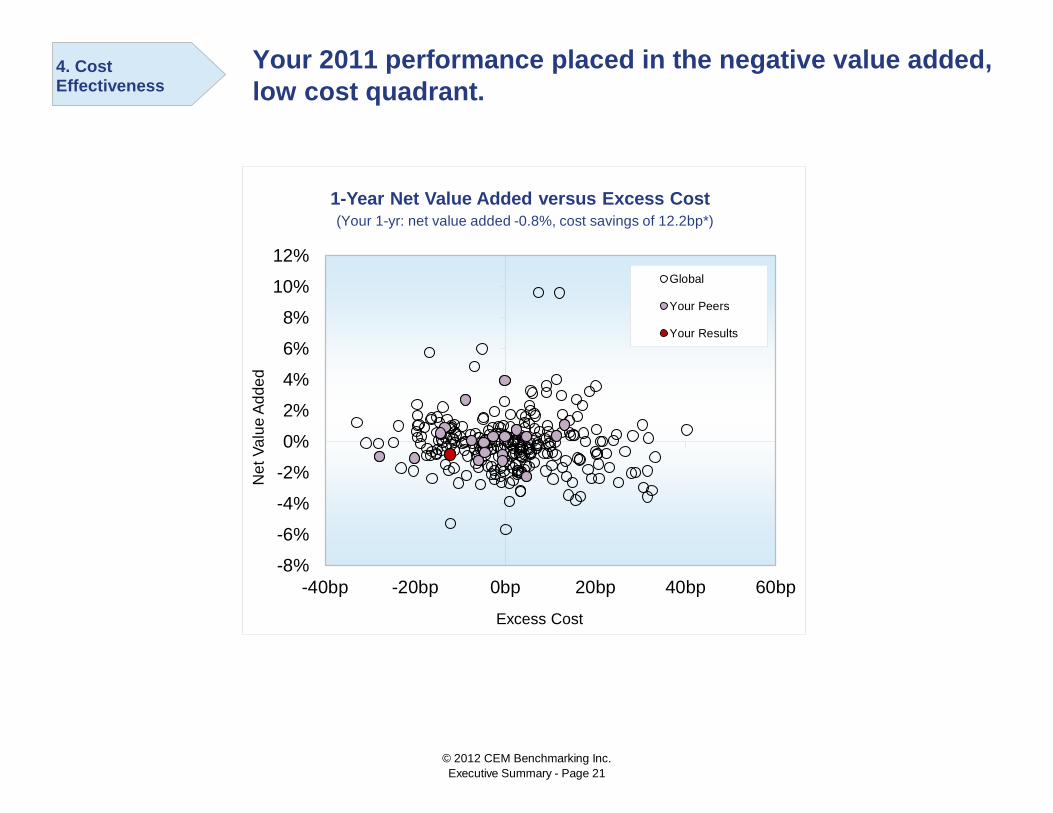
Your 2011 performance placed in the negative value added,
low cost quadrant.
-8%
-6%
-4%
-2%
0%
2%
4%
6%
8%
10%
12%
-40bp -20bp 0bp 20bp 40bp 60bp
Net
Va
lue
Ad
de
d
Excess Cost
1-Year Net Value Added versus Excess Cost
Global
Your Peers
Your Results
(Your 1-yr: net value added -0.8%, cost savings of 12.2bp*)
4. Cost Effectiveness
© 2012 CEM Benchmarking Inc.
Executive Summary - Page 21
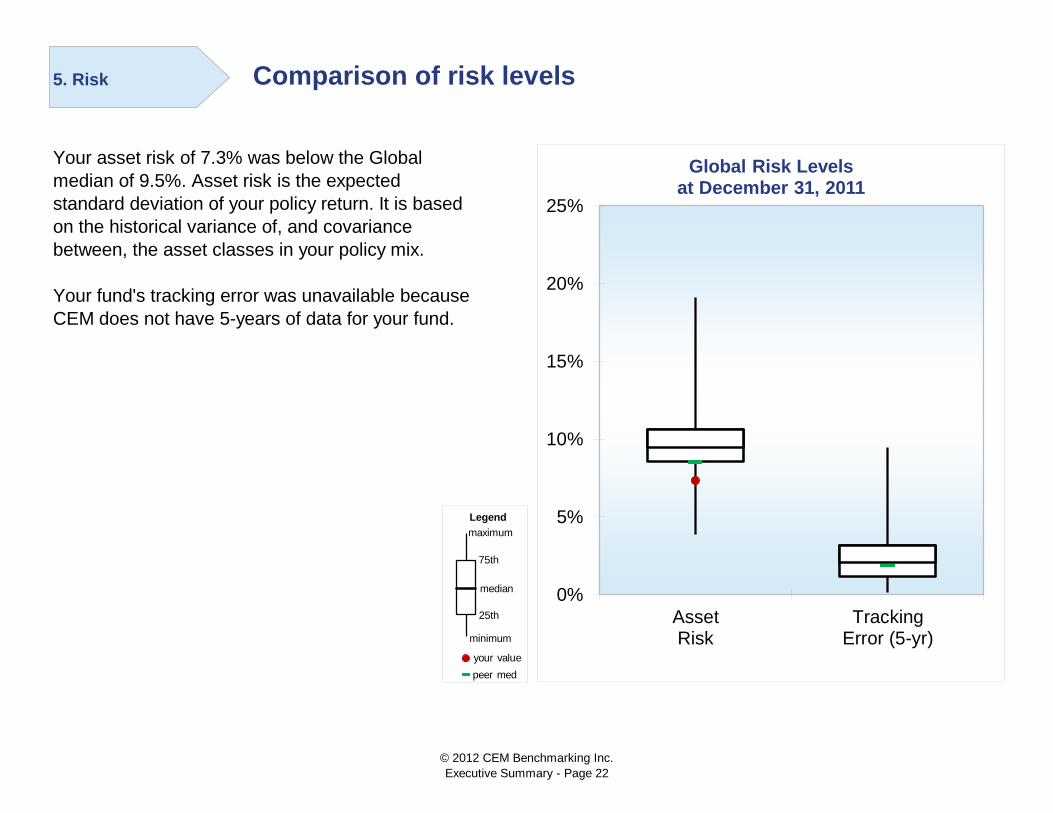
Comparison of risk levels
Your asset risk of 7.3% was below the Global
median of 9.5%. Asset risk is the expected
standard deviation of your policy return. It is based
on the historical variance of, and covariance
between, the asset classes in your policy mix.
Your fund's tracking error was unavailable because
CEM does not have 5-years of data for your fund.
0%
5%
10%
15%
20%
25%
AssetRisk
TrackingError (5-yr)
Global Risk Levels at December 31, 2011
5. Risk
Legend
your value
median
maximum
75th
25th
peer med
minimum
© 2012 CEM Benchmarking Inc.
Executive Summary - Page 22
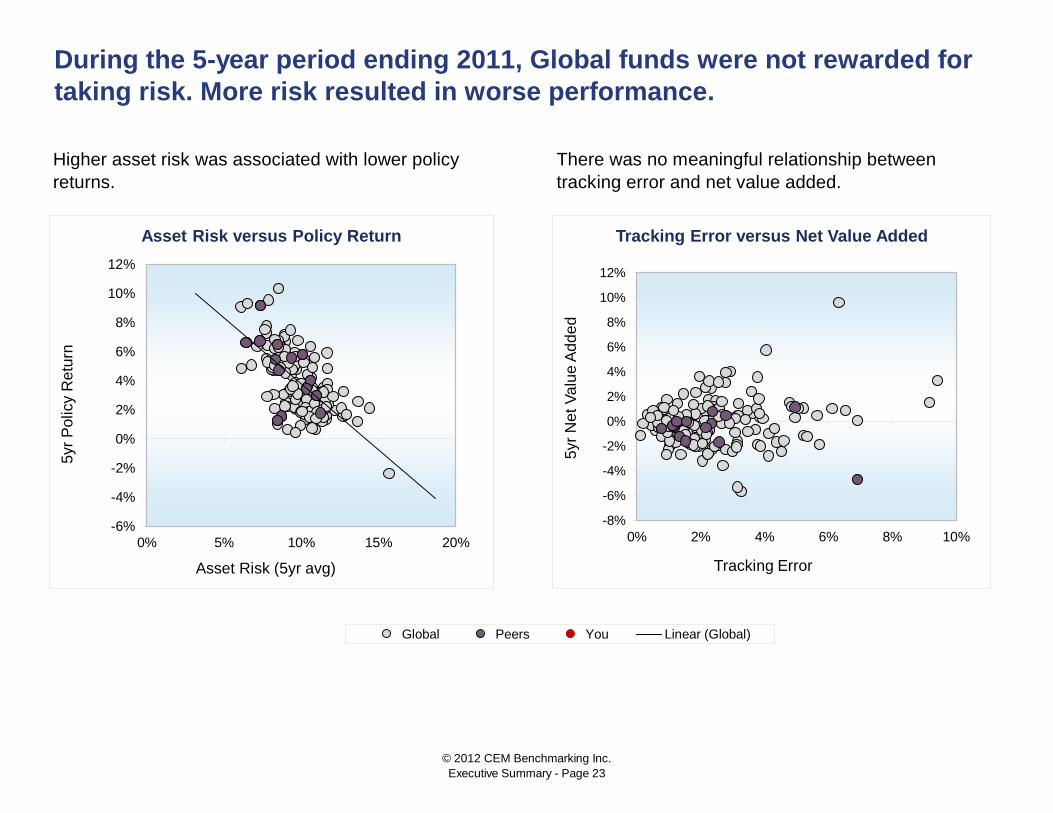
During the 5-year period ending 2011, Global funds were not rewarded for
taking risk. More risk resulted in worse performance.
Higher asset risk was associated with lower policy
returns.
There was no meaningful relationship between
tracking error and net value added.
-8%
-6%
-4%
-2%
0%
2%
4%
6%
8%
10%
12%
0% 2% 4% 6% 8% 10%
5yr
Ne
t V
alu
e A
dd
ed
Tracking Error
Tracking Error versus Net Value Added
-20.0%0.0%20.0%5 y r N
Implementation Risk Implementation Risk vs Value Added Global Peers You Linear (Global)
-6%
-4%
-2%
0%
2%
4%
6%
8%
10%
12%
0% 5% 10% 15% 20%
5yr
Po
licy R
etu
rn
Asset Risk (5yr avg)
Asset Risk versus Policy Return
© 2012 CEM Benchmarking Inc.
Executive Summary - Page 23
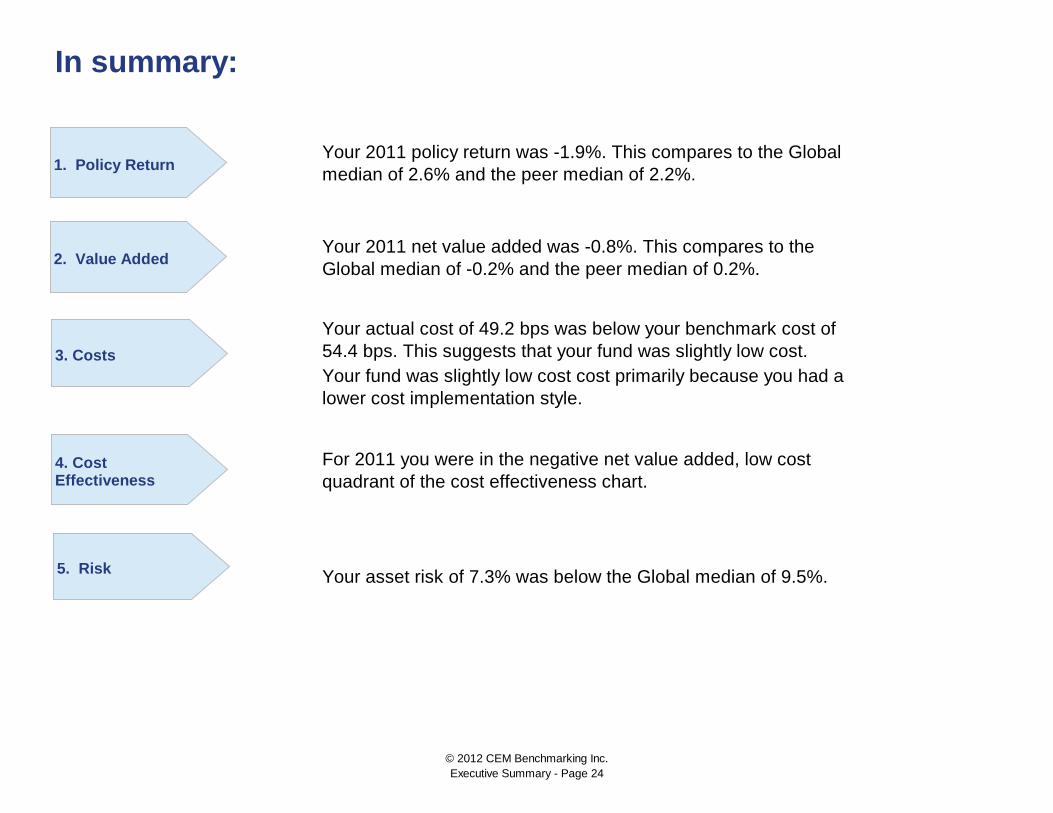
In summary:
For 2011 you were in the negative net value added, low cost
quadrant of the cost effectiveness chart.
Your asset risk of 7.3% was below the Global median of 9.5%.
Your 2011 policy return was -1.9%. This compares to the Global
median of 2.6% and the peer median of 2.2%.
Your 2011 net value added was -0.8%. This compares to the
Global median of -0.2% and the peer median of 0.2%.
Your actual cost of 49.2 bps was below your benchmark cost of
54.4 bps. This suggests that your fund was slightly low cost.
Your fund was slightly low cost cost primarily because you had a
lower cost implementation style.
1. Policy Return
2. Value Added
3. Costs
4. Cost Effectiveness
5. Risk
© 2012 CEM Benchmarking Inc.
Executive Summary - Page 24