fine and ultrafine particle emissions from microwave popcorn
TRANSCRIPT
Fine and ultrafine particle emissions from microwave popcorn
Abstract This study characterized fine (PM2.5) and ultrafine particle (UFP,diameter < 100 nm) emissions from microwave popcorn and analyzedinfluential factors. Each pre-packed popcorn bag was cooked in a microwaveoven enclosed in a stainless steel chamber for 3 min. The number concentrationand size distribution of UFPs and PM2.5 mass concentration were measuredinside the chamber repeatedly for five different flavors under four increasingpower settings using either the foil-lined original package or a brown paper bag.UFPs and PM2.5 generated by microwaving popcorn were 150–560 and 350–800times higher than the emissions from microwaving water, respectively. About90% of the total particles emitted were in the ultrafine size range. The emittedPM concentrations varied significantly with flavor. Replacing the foil-linedoriginal package with a brown paper bag significantly reduced the peakconcentration by 24–87% for total particle number and 36–70% for PM2.5. Apositive relationship was observed between both UFP number and PM2.5 massand power setting. The emission rates of microwave popcorn ranged from1.9 9 1010 to 8.0 9 1010 No./min for total particle number and from 134 to249 lg/min for PM2.5.
Q. Zhang, J. Avalos, Y. Zhu
Department of Environmental Health Sciences, Jonathanand Karin Fielding School of Public Health, University ofCalifornia, Los Angeles, CA, USA
Key words: Ultrafine particles; Microwave popcorn; Cha-mber; Emission rate; Flavor; Power setting.
Y. ZhuDepartment of Environmental Health SciencesJonathan and Karin Fielding School of Public HealthUniversity of CaliforniaLos Angeles, CA90095, USATel.: +1-310-825-4324Fax: +1-310-794-2106e-mail: [email protected]
Received for review 14 May 2013. Accepted forpublication 14 September 2013.
Practical ImplicationsPopcorn is frequently microwaved and consumed in households, schools, and businesses worldwide. Exposure to airpollutants generated from microwave popcorn may increase the burden of health risks. This study reported levels offine and ultrafine particle emissions from microwave popcorn. The results can facilitate the estimation of total particleexposures in indoor environments.
Introduction
Many human activities have been identified to increaseindoor air pollutant levels (He et al., 2004; Morawskaet al., 2013; Mullen et al., 2011; Wallace and Ott,2011). Air pollutants generated indoors can contributeto a significant portion of total daily exposure. A USstudy estimated the total exposure to particles was172 000 No. h/cm3, of which about 47% was due toindoor sources (Wallace and Ott, 2011). Similarly, astudy in seven Californian residences found the totalexposure was 244 000 No. h/cm3, and about 59% wasdue to indoor sources (Bhangar et al., 2011). Greatefforts have been made to characterize particulate mat-ter (PM) emissions from various indoor combustionsources including smoking, cooking, burning wood,candles, and incenses, as well as from residential andoffice appliance usage such as gas dryers and printers(Afshari et al., 2005; Buonanno et al., 2009; He et al.,2004; Long et al., 2000; Mullen et al., 2011; Nazaroff
and Singer, 2004; Schripp et al., 2011; See et al., 2007;Wallace, 2005; Zhang et al., 2010). However, there arestill many less understood indoor sources, amongwhich microwave popcorn has been shown to adverselyaffect health. Yet, little is known about its PM emis-sions, especially for ultrafine particles (UFPs, diameter<100 nm).
Exposure to the chemicals released from microwavepopcorn has been linked to lung disease since 2000when eight former workers of a microwave popcornproduction plant were reported to have severe bron-chiolitis obliterans, or so-called popcorn worker lung(Kreiss et al., 2002). A survey indicated that the work-ers in this plant had much higher risk of chronic cough,shortness of breath, asthma, chronic bronchitis, andskin problems than the national average (Kreiss et al.,2002). High levels of PM and over 100 different volatileorganic compounds (VOCs) were found in the air ofthis plant (Kullman et al., 2005). Health effects relatedto the exposures to air pollutants from microwave
190
Indoor Air 2014; 24: 190–198 © 2013 John Wiley & Sons A/S. Published by John Wiley & Sons Ltdwileyonlinelibrary.com/journal/inaPrinted in Singapore. All rights reserved INDOOR AIR
doi:10.1111/ina.12069
popcorn were observed not only under occupationalsetting, but also in homes. In 2007, a pulmonaryspecialist reported that a heavy, daily consumer of but-ter-flavored microwave popcorn had bronchiolitisobliterans, and excess exposure to air pollutantsreleased by microwave popcorn may be the explana-tion (Rose, 2007).
Diacetyl, a predominant organic compound in theflavorings of microwave popcorn, was suggested to bethe agent responsible for the respiratory diseasesrelated to microwave popcorn. High concentrations ofPM were also found in the emissions of microwavepopcorn. A chamber study found that the averagemass concentration of particles emitted during poppingand opening one bag of microwave popcorn was1900 lg/m3, more than 50 times higher than thenational ambient air standard for PM2.5. In addition,99% of the measured particles was in the respirablerange (Rosati et al., 2007). A school study observedrapid increase in total particle number concentrationsinside a classroom when the teacher microwaved onebag of popcorn (Zhang and Zhu, 2012). Exposure toPM has been associated with respiratory and cardio-vascular problems (Brauner et al., 2008; Nemmaret al., 2004). Due to their smaller size and larger sur-face area, UFPs have been suggested to be more toxicto laboratory animals than larger particles on an equalmass basis (Gilmour et al., 2004; Oberdorster et al.,2005). Therefore, PM emitted from microwave pop-corn may have significant health impacts by workingeither independently or synergistically with diacetyland other VOCs.
However, the knowledge on PM emissions frommicrowave popcorn is limited, especially on a numberbasis. The factors that affect the emissions are alsounclear. The goal of this study was to quantify andcharacterize PM emissions from microwave popcornand to analyze factors affecting the emissions, includ-ing flavor, package, and power setting.
Methods
Chamber, microwave oven, and popcorn
A stainless steel chamber of 69 cm 9 69 cm 9 69 cmwas used to host the microwave oven in this study. Thechamber was connected to laboratory compress airthrough a high-efficiency particulate air (HEPA) filterto ensure low concentration of particles in the supplyair. A glass door on the front side of the chamberallowed access and visibility to the interior space. Sev-eral 3/8” (1 cm) diameter conductive tubing, each con-nected to a sampling instrument, was secured to portson the side wall to sample air inside the chamber. Airwas exhausted through a pipe on the top of the cham-ber to a fume hood in the laboratory. The average airexchange rate in the chamber was 16.0 h�1, determined
by the CO2 decay method as described in Zhang et al.(2013). This air exchange rate is substantially higherthan typically observed in indoor environments, but isneeded to dilute the emissions to within the detectionranges of the instruments.
A moderately used microwave oven (modelMW8995W; Emerson Radio Corp., Hackensack, NJ,USA) was enclosed in the center of the chamber.The dimension of the microwave is 51 cm 928 cm 9 41 cm. On its control panel, there is a buttonto set the cooking power from 1 to 10, where highernumbers refer to higher power input. The highestpower setting (level 10) was used in the study unlessspecified otherwise. The microwave was cleaned withdamp cloth to remove dust and grease on the interiorand exterior surface prior to the study.
Popcorn was purchased from a local chain grocerystore. One popular brand with a large market wasselected. All popcorn flavors available in this storewere obtained, including fat-free, butter, movie-the-ater-butter, natural, and kettle-corn. Each flavor wastested for six times. One box contained three individualbags, and each bag weighted around 115 g. The ingre-dients as shown on the boxes included popcorn, par-tially hydrogenated soybean oil, salt, natural andartificial flavors, and color. The contents of total fat,sodium, and total hydrocarbon varied slightly amongdifferent flavors.
Instruments
Real-time air-quality measurements in this studyincluded total particle number concentration, fine andultrafine particle size distribution, and PM2.5 mass con-centration. Total particle number concentration wasmeasured using a water-based condensation particlecounter (WCPC, Model 3785; TSI, Inc., St. Paul, MN,USA) at a sampling flow rate of 1.0 l/min. WCPC canmeasure from 0 to 107 No./cm3 with an accuracy of�10% at <2 9 104 No./cm3. Fine and ultrafine particlesize distributions in the size range of 7–289 nm weremeasured using a scanning mobility particle sizer(SMPS) at 2-min intervals. A SMPS consists of twocomponents, an electrostatic classifier (EC, Model3080; TSI, Inc.) with a long differential mobility ana-lyzer (DMA, Model 3081; TSI, Inc.), to select particlesof a given size and a WCPC 3785 to count the particles.The SMPS system was automated with a personalcomputer that controlled the individual componentsand performed data logging and reduction. In addi-tion, an Aerodynamic Particle Sizer (APS, Model3321; TSI, Inc.) was used to measure particle size dis-tributions in the size range of 0.54–20 lm at a 20-sinterval. As the SMPS classifies particles by theirmobility in an electric field, and the APS measuresaerodynamic size, to merge the size distributions fromthese two instruments, the mobility diameter measured
191
PM emissions from microwave popcorn
using the SMPS were converted to the aerodynamicdiameter by the following equation (Hinds, 1999):
Da ¼ Dm
ffiffiffiffiffiffiffiffiffiffiffiffiffiffiffiffiffiffiffiffiffiffiffiffixCsðDmÞqpCsðDaÞq0
sð1Þ
where Da and Dm are the aerodynamic and mobilitydiameters (nm), respectively; v is the shape factor,which was 1.0 assuming particles from popcorn arespherical; Cs is the Cunningham slip correction factor,which was assumed negligible; q0 is the reference density,1.0 g/cm3; qp is the density of particles, for which thedensity of oil, 0.9 g/cm3 was used. Particles were assumedspherical when calculating surface area and volume.
PM2.5 mass concentration was measured using aDustTrak photometer (Model 8520, TSI, Inc.). Pow-ered by an internal battery, the DustTrak samples airat a constant flow rate of 1.7 l/min by means of abuilt-in diaphragm pump. The DustTrak covers a con-centration range from 1 lg/m3 to 100 mg/m3 with aresolution of �0.1% of reading or �0.001 mg/m3
whichever is greater. Due to small amount of particlesemitted from each bag of popcorn, insufficient amountof particles can be collected on a filter to allow directgravimetric comparison in this study. Therefore, theDustTrak data were corrected using the particles of asimilar source, cooking emissions, following themethod of Buonanno et al. (2012). A single correctionfactor of 2.4 was applied for DustTrak measurements,which was similar to the correction factors reported inprevious studies (Fujita et al., 2007; Wallace et al.,2011; Yanosky et al., 2002). Although interpretationof the absolute PM2.5 mass concentration was limitedby the fact that the DustTrak was not calibrated by thespecific aerosol studied, the DustTrak measurementswere still useful to analyze the variations of PM2.5 andstudy the influential factors.
Study design
The sampling inlets on the side wall of the chamberwere connected with conductive tubing to measure theconcentrations of air pollutants inside the chamber.The background concentrations were measured for15 min when the microwave oven was not working.Then one bag of popcorn was placed on its side in themicrowave oven and cooked for 3 min, as suggestedon the package by the manufacturer. Once the micro-wave oven started working, the chamber door wasimmediately closed tightly. After 3-min’s popping, thepopcorn bag was left in the microwave oven forapproximately 15 min, while all sampling instrumentswere still measuring. Then, the chamber was openedand aired out, and a new test was repeated. In addi-tion, a glass cup with 80 ml of water was microwavedwith the chamber door closed for 3 min as a control.
To study the effect of popcorn package, uncookedpopcorn was removed from the original package to aclean, microwave-safe brown paper lunch bag. Theopening was folded over twice to simulate a sealed bag.The bag was put on its side in the microwave oven andcooked for 3 min. The tests in paper bag were repeatedsix times for each studied flavor. The emissions frompopping in a brown paper bag were compared with theemissions from popping in the original package.
The effect of power setting was also studied. As morethan half popcorn cannot be popped at power settingslower than level 5 within the manufacturer-recom-mended cooking time, the studied power input startedfrom level 5. Power settings were increased from low tohigh at levels 5, 7, 9, and 10. Popcorn of natural, fat-free, and kettle-corn flavor were tested. Each flavorwas tested once at each power level. It should be notedthis study only provided a qualitative comparison ofvarious levels of power input, and no data about powerusage were collected.
Emission rate
Particulate matter emission rate of microwave popcornwas calculated for each test using a material-balanceapproach as following (Bhangar et al., 2011):
dCðtÞdt
¼ EðtÞV
þ CoaP� kCðtÞ ð2Þ
where E(t) (No./min) is the emission rate; V(cm3) is theinterior volume of the test chamber; C(t) is the concen-tration at time t inside the chamber, and Co (No./cm3)is the particle concentration of the air coming into thechamber; P is the penetration efficiency; k (min�1) isthe total removal rate due to coagulation, deposition,and air exchange; a (min�1) is the air exchange rate. AsCo was around 0.3 9 103 No./cm3, negligible com-pared with the emissions from popcorn, equation 2was simplified as follows:
dCðtÞdt
¼ EðtÞV
� kCðtÞ: ð3Þ
Based on the assumption that when Dt is smallenough, DC (t) is a good approximation of dC(t), andequation 3 was further simplified as follows:
DCðtÞDt
¼ CðtÞ � Cðt� 1Þt� ðt� 1Þ
¼ EðtÞV
� kCðtÞ þ Cðt� 1Þ
2
� �: ð4Þ
One second was used for Dt. A 10-s moving averageof total particle number concentration inside the cham-ber was used for C(t) to reduce the effect of random
192
Zhang et al.
variation. Second-by-second emission rate was calcu-lated using equation 4, and their average value duringthe 3-min cooking episode was used as the averageemission rate. The emission rates of PM2.5 were alsocalculated using the same method.
The total removal rate k was determined using themethod described by Zhang et al. (2010). Briefly, thetime series of total particle number concentrationbetween the peak and the end of each test was fittedinto a natural exponential decay curve to determine kusing equation 5:
Ct ¼ Cpe�kt ð5Þ
where Cp (No./cm3) is the peak concentration, andCt (No./cm3) is the concentration at time t (min)after the peak concentration was measured.
Results and discussion
Emission profiles
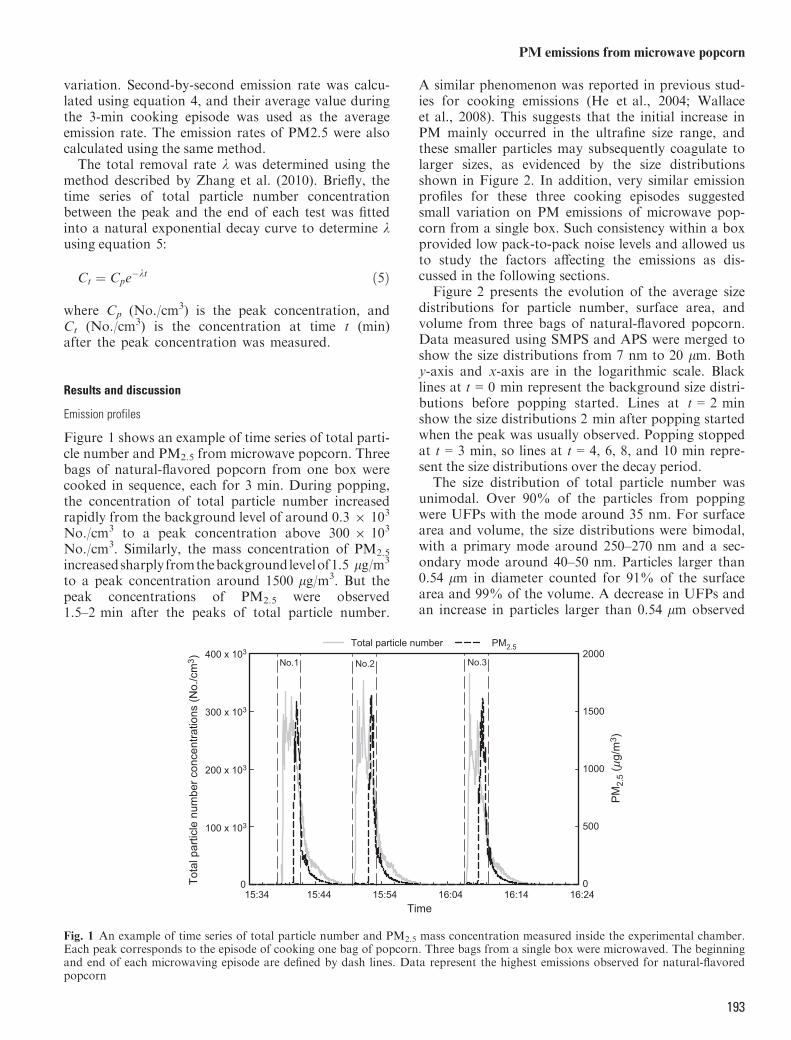
Figure 1 shows an example of time series of total parti-cle number and PM2.5 from microwave popcorn. Threebags of natural-flavored popcorn from one box werecooked in sequence, each for 3 min. During popping,the concentration of total particle number increasedrapidly from the background level of around 0.3 9 103
No./cm3 to a peak concentration above 300 9 103
No./cm3. Similarly, the mass concentration of PM2.5
increasedsharplyfromthebackgroundlevelof1.5 lg/m3
to a peak concentration around 1500 lg/m3. But thepeak concentrations of PM2.5 were observed1.5–2 min after the peaks of total particle number.
A similar phenomenon was reported in previous stud-ies for cooking emissions (He et al., 2004; Wallaceet al., 2008). This suggests that the initial increase inPM mainly occurred in the ultrafine size range, andthese smaller particles may subsequently coagulate tolarger sizes, as evidenced by the size distributionsshown in Figure 2. In addition, very similar emissionprofiles for these three cooking episodes suggestedsmall variation on PM emissions of microwave pop-corn from a single box. Such consistency within a boxprovided low pack-to-pack noise levels and allowed usto study the factors affecting the emissions as dis-cussed in the following sections.
Figure 2 presents the evolution of the average sizedistributions for particle number, surface area, andvolume from three bags of natural-flavored popcorn.Data measured using SMPS and APS were merged toshow the size distributions from 7 nm to 20 lm. Bothy-axis and x-axis are in the logarithmic scale. Blacklines at t = 0 min represent the background size distri-butions before popping started. Lines at t = 2 minshow the size distributions 2 min after popping startedwhen the peak was usually observed. Popping stoppedat t = 3 min, so lines at t = 4, 6, 8, and 10 min repre-sent the size distributions over the decay period.
The size distribution of total particle number wasunimodal. Over 90% of the particles from poppingwere UFPs with the mode around 35 nm. For surfacearea and volume, the size distributions were bimodal,with a primary mode around 250–270 nm and a sec-ondary mode around 40–50 nm. Particles larger than0.54 lm in diameter counted for 91% of the surfacearea and 99% of the volume. A decrease in UFPs andan increase in particles larger than 0.54 lm observed
Time15:34 15:44 15:54 16:04 16:14 16:24
Tota
l par
ticle
num
ber c
once
ntra
tions
(No.
/cm
3 )
0
100 x 103
200 x 103
300 x 103
400 x 103
PM
2.5
( µg/
m3 )
0
500
1000
1500
2000Total particle number PM2.5
No.1 No.2 No.3
Fig. 1 An example of time series of total particle number and PM2.5 mass concentration measured inside the experimental chamber.Each peak corresponds to the episode of cooking one bag of popcorn. Three bags from a single box were microwaved. The beginningand end of each microwaving episode are defined by dash lines. Data represent the highest emissions observed for natural-flavoredpopcorn
193
PM emissions from microwave popcorn
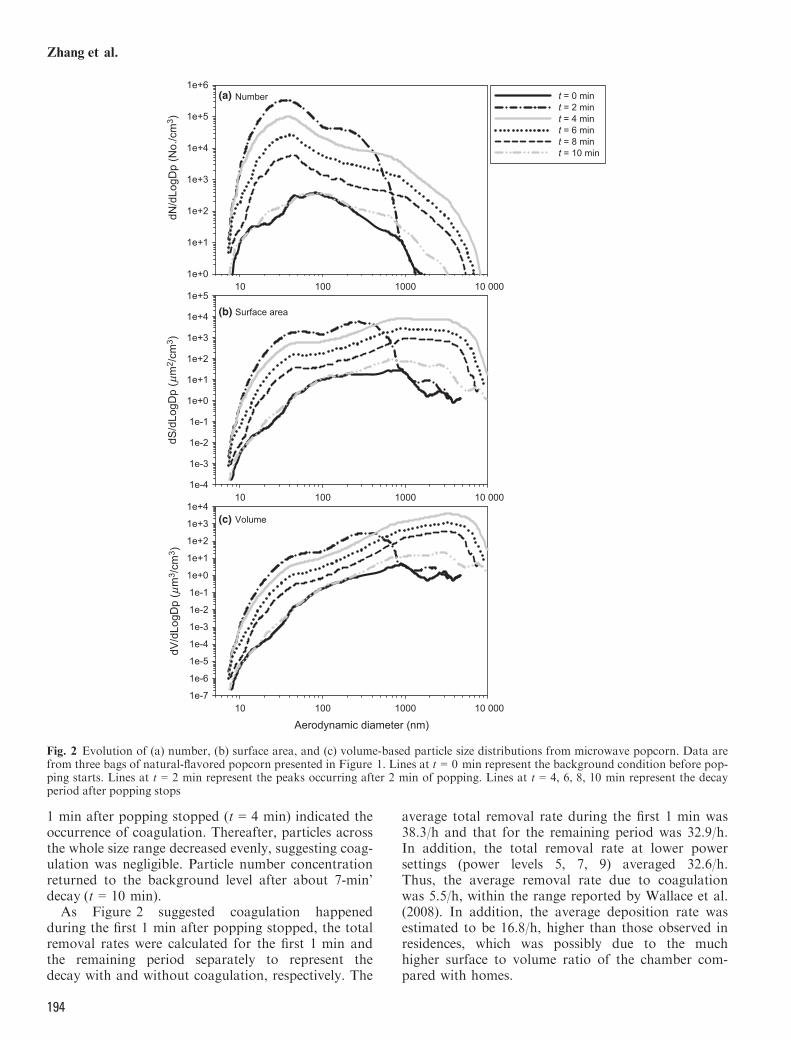
1 min after popping stopped (t = 4 min) indicated theoccurrence of coagulation. Thereafter, particles acrossthe whole size range decreased evenly, suggesting coag-ulation was negligible. Particle number concentrationreturned to the background level after about 7-min’decay (t = 10 min).
As Figure 2 suggested coagulation happenedduring the first 1 min after popping stopped, the totalremoval rates were calculated for the first 1 min andthe remaining period separately to represent thedecay with and without coagulation, respectively. The
average total removal rate during the first 1 min was38.3/h and that for the remaining period was 32.9/h.In addition, the total removal rate at lower powersettings (power levels 5, 7, 9) averaged 32.6/h.Thus, the average removal rate due to coagulationwas 5.5/h, within the range reported by Wallace et al.(2008). In addition, the average deposition rate wasestimated to be 16.8/h, higher than those observed inresidences, which was possibly due to the muchhigher surface to volume ratio of the chamber com-pared with homes.
dN/d
LogD
p (N
o./c
m3 )
1e+0
1e+1
1e+2
1e+3
1e+4
1e+5
1e+6t = 0 mint = 2 mint = 4 mint = 6 mint = 8 mint = 10 min
Number
dS/d
LogD
p ( µ
m2 /
cm3 )
1e-4
1e-3
1e-2
1e-1
1e+0
1e+1
1e+2
1e+3
1e+4
1e+5
Surface area
Aerodynamic diameter (nm)
dV/d
LogD
p ( µ
m3 /
cm3 )
1e-7
1e-6
1e-5
1e-4
1e-3
1e-2
1e-1
1e+0
1e+1
1e+2
1e+3
1e+4Volume
10 100 1000 10 000
10 100 1000 10 000
10 100 1000 10 000
(a)
(b)
(c)
Fig. 2 Evolution of (a) number, (b) surface area, and (c) volume-based particle size distributions from microwave popcorn. Data arefrom three bags of natural-flavored popcorn presented in Figure 1. Lines at t = 0 min represent the background condition before pop-ping starts. Lines at t = 2 min represent the peaks occurring after 2 min of popping. Lines at t = 4, 6, 8, 10 min represent the decayperiod after popping stops
194
Zhang et al.
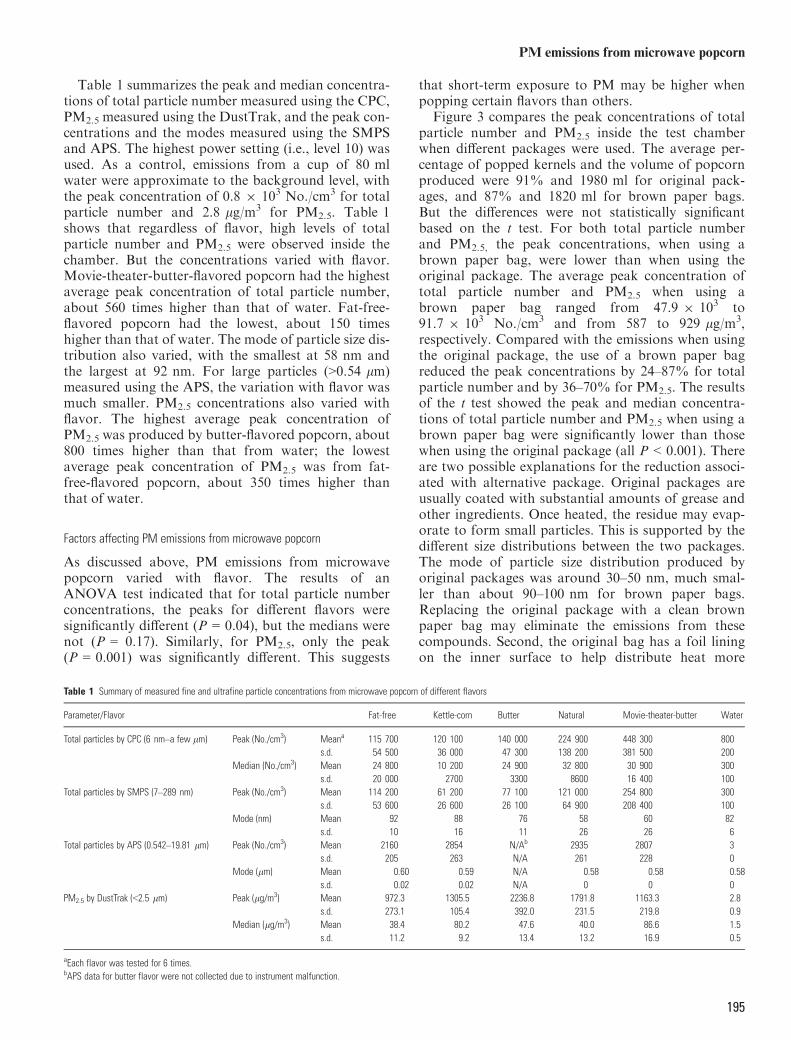
Table 1 summarizes the peak and median concentra-tions of total particle number measured using the CPC,PM2.5 measured using the DustTrak, and the peak con-centrations and the modes measured using the SMPSand APS. The highest power setting (i.e., level 10) wasused. As a control, emissions from a cup of 80 mlwater were approximate to the background level, withthe peak concentration of 0.8 9 103 No./cm3 for totalparticle number and 2.8 lg/m3 for PM2.5. Table 1shows that regardless of flavor, high levels of totalparticle number and PM2.5 were observed inside thechamber. But the concentrations varied with flavor.Movie-theater-butter-flavored popcorn had the highestaverage peak concentration of total particle number,about 560 times higher than that of water. Fat-free-flavored popcorn had the lowest, about 150 timeshigher than that of water. The mode of particle size dis-tribution also varied, with the smallest at 58 nm andthe largest at 92 nm. For large particles (>0.54 lm)measured using the APS, the variation with flavor wasmuch smaller. PM2.5 concentrations also varied withflavor. The highest average peak concentration ofPM2.5 was produced by butter-flavored popcorn, about800 times higher than that from water; the lowestaverage peak concentration of PM2.5 was from fat-free-flavored popcorn, about 350 times higher thanthat of water.
Factors affecting PM emissions from microwave popcorn
As discussed above, PM emissions from microwavepopcorn varied with flavor. The results of anANOVA test indicated that for total particle numberconcentrations, the peaks for different flavors weresignificantly different (P = 0.04), but the medians werenot (P = 0.17). Similarly, for PM2.5, only the peak(P = 0.001) was significantly different. This suggests
that short-term exposure to PM may be higher whenpopping certain flavors than others.
Figure 3 compares the peak concentrations of totalparticle number and PM2.5 inside the test chamberwhen different packages were used. The average per-centage of popped kernels and the volume of popcornproduced were 91% and 1980 ml for original pack-ages, and 87% and 1820 ml for brown paper bags.But the differences were not statistically significantbased on the t test. For both total particle numberand PM2.5, the peak concentrations, when using abrown paper bag, were lower than when using theoriginal package. The average peak concentration oftotal particle number and PM2.5 when using abrown paper bag ranged from 47.9 9 103 to91.7 9 103 No./cm3 and from 587 to 929 lg/m3,respectively. Compared with the emissions when usingthe original package, the use of a brown paper bagreduced the peak concentrations by 24–87% for totalparticle number and by 36–70% for PM2.5. The resultsof the t test showed the peak and median concentra-tions of total particle number and PM2.5 when using abrown paper bag were significantly lower than thosewhen using the original package (all P < 0.001). Thereare two possible explanations for the reduction associ-ated with alternative package. Original packages areusually coated with substantial amounts of grease andother ingredients. Once heated, the residue may evap-orate to form small particles. This is supported by thedifferent size distributions between the two packages.The mode of particle size distribution produced byoriginal packages was around 30–50 nm, much smal-ler than about 90–100 nm for brown paper bags.Replacing the original package with a clean brownpaper bag may eliminate the emissions from thesecompounds. Second, the original bag has a foil liningon the inner surface to help distribute heat more
Table 1 Summary of measured fine and ultrafine particle concentrations from microwave popcorn of different flavors
Parameter/Flavor Fat-free Kettle-corn Butter Natural Movie-theater-butter Water
Total particles by CPC (6 nm–a few lm) Peak (No./cm3) Meana 115 700 120 100 140 000 224 900 448 300 800s.d. 54 500 36 000 47 300 138 200 381 500 200
Median (No./cm3) Mean 24 800 10 200 24 900 32 800 30 900 300s.d. 20 000 2700 3300 8600 16 400 100
Total particles by SMPS (7–289 nm) Peak (No./cm3) Mean 114 200 61 200 77 100 121 000 254 800 300s.d. 53 600 26 600 26 100 64 900 208 400 100
Mode (nm) Mean 92 88 76 58 60 82s.d. 10 16 11 26 26 6
Total particles by APS (0.542–19.81 lm) Peak (No./cm3) Mean 2160 2854 N/Ab 2935 2807 3s.d. 205 263 N/A 261 228 0
Mode (lm) Mean 0.60 0.59 N/A 0.58 0.58 0.58s.d. 0.02 0.02 N/A 0 0 0
PM2.5 by DustTrak (<2.5 lm) Peak (lg/m3) Mean 972.3 1305.5 2236.8 1791.8 1163.3 2.8s.d. 273.1 105.4 392.0 231.5 219.8 0.9
Median (lg/m3) Mean 38.4 80.2 47.6 40.0 86.6 1.5s.d. 11.2 9.2 13.4 13.2 16.9 0.5
aEach flavor was tested for 6 times.bAPS data for butter flavor were not collected due to instrument malfunction.
195
PM emissions from microwave popcorn

evenly. This lining material may increase the tempera-ture inside the package to a point so that more com-pounds evaporate to form particles. Although thereasons behind such reduction need more effort toidentify, Figure 3 suggests that innovative packagemight reduce consumers’ exposures to PM emittedfrom microwave popcorn.
Figure 4 shows the time series of total particle num-ber emitted from microwaving one bag of natural-flavored popcorn at different levels of power input.The profiles of total particle number concentration atthree power settings were similar to each other, but atdifferent magnitudes. Higher power input resulted inhigher peak concentration and therefore higher expo-sure. For example, the peak concentration at powerlevel 9 was about two times of that at power level 5.
Figure 5 presents the relative peak levels of totalparticle number and PM2.5 compared with the emis-sions at power level 10. Again, natural-flavored pop-corn was microwaved for comparison. When cooking
at power level less than 7, the peak concentrations were<10% of that observed at power level 10. At powerlevel 9, the peak concentrations were about 20% and27% of those at power level 10 for total particle num-ber and PM2.5, respectively. Higher emissions associ-ated with higher power setting were also observed forfat-free-flavored popcorn and kettle-corn-flavoredpopcorn. Thus, lowering power setting might reducePM emissions from microwave popcorn. It should benoted, lowering microwave power did not have anynoticeable impacts on the quality and quantity of pop-corn produced as measured using the percentage ofpopped kernels and the volume of popcorn produced.However, very low power setting may not be able toachieve appropriate popping within recommendedcooking time by the manufacturers. Even though itcould be offset by prolonged cooking time, longercooking time also increases the duration of exposure.Limited by study design, power input at each level was
Flavor
Tota
l par
ticle
num
ber c
once
ntra
tion
(No.
/cm
3 )
0
200 x 103
400 x 103
600 x 103
800 x 103
1 x 10⁶
Original packageBrown paper bag
Total particle number
Flavor
PM
2.5
( µg/
m3 )
0
500
1000
1500
2000
2500
3000
3500Original packageBrown paper bag
Butter Fat free Kettle corn Natural Movie theaterbutter
Butter Fat free Kettle corn Natural Movie theaterbutter
PM2.5
(a)
(b)
Fig. 3 Effects of package on the peak concentrations of (a) totalparticle number and (b) PM2.5 from microwaving popcorn.Total particle number concentrations were collected by theCPC. Error bars indicate one standard deviation
Elapsed time (min)00 02 04 06 08 10 12 14 16 18To
tal p
artic
le n
umbe
r con
cent
ratio
n (N
o./c
m3 )
0
10x103
20x103
30x103
40x103
50x103
Power level 9Power level 7Power level 5
Fig. 4 Effects of power setting on total particle number concen-tration from microwaving popcorn. Natural-flavored popcornwas cooked at power levels 5, 7, and 9 corresponding to low,medium, and high power settings
Fig. 5 Relative peak concentrations of total particle numberand PM2.5 from microwaving natural-flavored popcorn com-pared with emissions at power level 10
196
Zhang et al.
not quantified. The results presented in Figures 4 and5 should only be viewed as proof of concept. Theabsolute value of PM emissions associated with eachpower level may be only applicable for the model ofmicrowave oven used in this study.
Emission rates
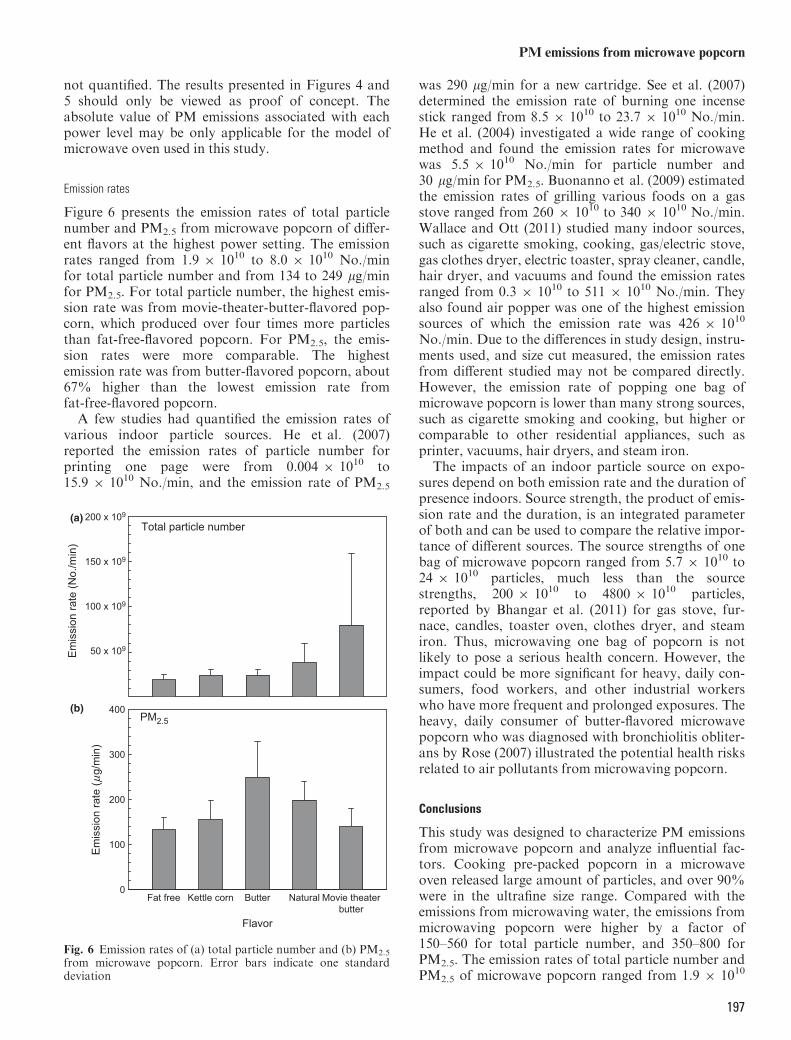
Figure 6 presents the emission rates of total particlenumber and PM2.5 from microwave popcorn of differ-ent flavors at the highest power setting. The emissionrates ranged from 1.9 9 1010 to 8.0 9 1010 No./minfor total particle number and from 134 to 249 lg/minfor PM2.5. For total particle number, the highest emis-sion rate was from movie-theater-butter-flavored pop-corn, which produced over four times more particlesthan fat-free-flavored popcorn. For PM2.5, the emis-sion rates were more comparable. The highestemission rate was from butter-flavored popcorn, about67% higher than the lowest emission rate fromfat-free-flavored popcorn.
A few studies had quantified the emission rates ofvarious indoor particle sources. He et al. (2007)reported the emission rates of particle number forprinting one page were from 0.004 9 1010 to15.9 9 1010 No./min, and the emission rate of PM2.5
was 290 lg/min for a new cartridge. See et al. (2007)determined the emission rate of burning one incensestick ranged from 8.5 9 1010 to 23.7 9 1010 No./min.He et al. (2004) investigated a wide range of cookingmethod and found the emission rates for microwavewas 5.5 9 1010 No./min for particle number and30 lg/min for PM2.5. Buonanno et al. (2009) estimatedthe emission rates of grilling various foods on a gasstove ranged from 260 9 1010 to 340 9 1010 No./min.Wallace and Ott (2011) studied many indoor sources,such as cigarette smoking, cooking, gas/electric stove,gas clothes dryer, electric toaster, spray cleaner, candle,hair dryer, and vacuums and found the emission ratesranged from 0.3 9 1010 to 511 9 1010 No./min. Theyalso found air popper was one of the highest emissionsources of which the emission rate was 426 9 1010
No./min. Due to the differences in study design, instru-ments used, and size cut measured, the emission ratesfrom different studied may not be compared directly.However, the emission rate of popping one bag ofmicrowave popcorn is lower than many strong sources,such as cigarette smoking and cooking, but higher orcomparable to other residential appliances, such asprinter, vacuums, hair dryers, and steam iron.
The impacts of an indoor particle source on expo-sures depend on both emission rate and the duration ofpresence indoors. Source strength, the product of emis-sion rate and the duration, is an integrated parameterof both and can be used to compare the relative impor-tance of different sources. The source strengths of onebag of microwave popcorn ranged from 5.7 9 1010 to24 9 1010 particles, much less than the sourcestrengths, 200 9 1010 to 4800 9 1010 particles,reported by Bhangar et al. (2011) for gas stove, fur-nace, candles, toaster oven, clothes dryer, and steamiron. Thus, microwaving one bag of popcorn is notlikely to pose a serious health concern. However, theimpact could be more significant for heavy, daily con-sumers, food workers, and other industrial workerswho have more frequent and prolonged exposures. Theheavy, daily consumer of butter-flavored microwavepopcorn who was diagnosed with bronchiolitis obliter-ans by Rose (2007) illustrated the potential health risksrelated to air pollutants from microwaving popcorn.
Conclusions
This study was designed to characterize PM emissionsfrom microwave popcorn and analyze influential fac-tors. Cooking pre-packed popcorn in a microwaveoven released large amount of particles, and over 90%were in the ultrafine size range. Compared with theemissions from microwaving water, the emissions frommicrowaving popcorn were higher by a factor of150–560 for total particle number, and 350–800 forPM2.5. The emission rates of total particle number andPM2.5 of microwave popcorn ranged from 1.9 9 1010
Em
issi
on ra
te (N
o./m
in)
50 x 109
100 x 109
150 x 109
200 x 109
Em
issi
on ra
te ( µ
g/m
in)
0
100
200
300
400
Flavor
ButterFat free Kettle corn Natural Movie theaterbutter
Total particle number
PM2.5
(a)
(b)
Fig. 6 Emission rates of (a) total particle number and (b) PM2.5
from microwave popcorn. Error bars indicate one standarddeviation
197
PM emissions from microwave popcorn
to 8.0 9 1010 No./min and from 134 to 249 lg/min,respectively. The peak concentrations of total particlenumber and PM2.5 varied with flavor significantly.Popcorn package was found to be a significant factoraffecting PM emissions. Replacing the foil-linedoriginal package with a brown paper bag reduced thepeak concentrations by 24–87% for total particle num-ber and by 36–70% for PM2.5. This suggested that an
alternative package might reduce exposure to PM frommicrowave popcorn. Cooking popcorn at higher powersetting was related to higher emissions for both totalparticle number and PM2.5. Particles produced by pop-ping one bag of microwave popcorn were lower thanmany indoor sources studied previously, but theimpact could be more significant for people with morefrequent and prolonged exposures.
References
Afshari, A., Matson, U. and Ekberg, L.E.(2005) Characterization of indoor sourcesof fine and ultrafine particles: a studyconducted in a full-scale chamber, IndoorAir, 15, 141–150.
Bhangar, S., Mullen, N.A., Hering, S.V., Kre-isberg, N.M. and Nazaroff, W.W. (2011)Ultrafine particle concentrations andexposures in seven residences in northernCalifornia, Indoor Air, 21, 132–144.
Brauner, E.V., Forchhammer, L., Moller, P.,Barregard, L., Gunnarsen, L., Afshari,A., Wahlin, P., Glasius, M., Dragsted,L.O., Basu, S., Raaschou-Nielsen, O. andLoft, S. (2008) Indoor particles affect vas-cular function in the aged, Am. J. Resp.Crit. Care, 177, 419–425.
Buonanno, G., Morawska, L. and Stabile, L.(2009) Particle emission factors duringcooking activities, Atmos. Environ., 43,3235–3242.
Buonanno, G., Fuoco, F., Marini, S. andStabile, L. (2012) Particle resuspension inschool gyms during physical activities,Aerosol Air Qual. Res., 12, 803–813.
Fujita, E.M., Campbell, D.E., Arnott, W.P.,Chow, J.C. and Zielinska, B. (2007) Eval-uations of the chemical mass balancemethod for determining contributions ofgasoline and diesel exhaust to ambientcarbonaceous aerosols, J. Air WasteManag. Assoc., 57, 721–740.
Gilmour, P.S., Ziesenis, A., Morrison, E.R.,Vickers, M.A., Drost, E.M., Ford, I.,Karg, E., Mossa, C., Schroeppel, A.,Ferron, G.A., Heyder, J., Greaves, M.,Macnee, W. and Donaldson, K. (2004)Pulmonary and systemic effects of short-term inhalation exposure to ultrafinecarbon black particles, Toxicol. Appl.Pharm., 195, 35–44.
He, C., Morawska, L., Hitchins, J. and Gil-bert, D. (2004) Contribution from indoorsources to particle number and mass con-centrations in residential houses, Atmos.Environ., 38, 3405–3415.
He, C., Morawska, L. and Taplin, L. (2007) Par-ticle emission characteristics of office printers,Environ. Sci. Technol., 41, 6039–6045.
Hinds, W.C. (1999) Aerosol Technology:Properties, Behavior, and Measurement of
Airborne Particles, 2nd edn. New York,Wiley, 54.
Kreiss, K., Gomaa, A., Kullman, G., Fedan,K., Simoes, E.J. and Enright, P.L. (2002)Clinical bronchiolitis obliterans in work-ers at a microwave-popcorn plant, NewEngl. J. Med., 347, 330–338.
Kullman, G., Boylstein, R., Jones, W.,Piacitelli, C., Pendergrass, S. and Kreiss,K. (2005) Characterization of respiratoryexposures at a microwave popcornplant with cases of bronchiolitisobliterans, J. Occup. Environ. Hyg., 2,169–178.
Long, C.M., Suh, H.H. and Koutrakis, P.(2000) Characterization of indoor particlesources using continuous mass and sizemonitors, J. Air Waste Manag. Assoc.,50, 1236–1250.
Morawska, L., Afshari, A., Bae, G.N., Buon-anno, G., Chao, C.Y.H., H€anninen, O.,Hofmann, W., Isaxon, C., Jayaratne, E.R.,Pasanen, P., Salthammer, T., Waring, M.and Wierzbicka, A. (2013) Indoor aero-sols: from personal exposure to risk assess-ment, Indoor Air, 23, 462–487.
Mullen, N.A., Liu, C., Zhang, Y., Wang, S.and Nazaroff, W.W. (2011) Ultrafine par-ticle concentrations and exposures in fourhigh-rise Beijing apartments, Atmos.Environ., 45, 7574–7582.
Nazaroff, W.W. and Singer, B.C. (2004)Inhalation of hazardous air pollutantsfrom environmental tobacco smoke inUS residences, J. Expo. Anal. Env. Epid.,14(Suppl 1), S71–S77.
Nemmar, A., Hoylaerts, M.F., Hoet,P.H.M. and Nemery, B. (2004) Possiblemechanisms of the cardiovascular effectsof inhaled particles: systemic transloca-tion and prothrombotic effects, Toxicol.Lett., 149, 243–253.
Oberdorster, G., Oberdorster, E. and Ober-dorster, J. (2005) Nanotoxicology: anemerging discipline evolving from studiesof ultrafine particles, Environ. HealthPersp., 113, 823–839.
Rosati, J.A., Krebs, K.A. and Liu, X. (2007)Emissions from cooking microwavepopcorn, Cr. Rev. Food Sci., 47,701–709.
Rose, C. (2007) Letter from Cecile Rose,M.D., National Jewish Medical andResearch Center, Available at: http://defendingscience.org/sites/default/files/upload/National_Jewish_FDA_Letter.pdf
Schripp, T., Kirsch, I. and Salthammer, T.(2011) Characterization of particle emis-sion from household electrical appliances,Sci. Total Environ., 409, 2534–2540.
See, S.W., Balasubramanian, R. and Joshi,U.M. (2007) Physical characteristics ofnanoparticles emitted from incensesmoke, Sci. Technol. Adv. Mat., 8, 25–32.
Wallace, L. (2005) Ultrafine particles from avented gas clothes dryer, Atmos. Environ.,39, 5777–5786.
Wallace, L. and Ott, W. (2011) Personalexposure to ultrafine particles, J. Expo.Sci. Environ. Epidemiol., 21, 20–30.
Wallace, L., Wang, F., Howard-Reed, C.and Persily, A. (2008) Contribution ofgas and electric stoves to residential ultra-fine particle concentrations between 2and 64 nm: size distributions and emis-sion and coagulation rates, Environ. Sci.Technol., 42, 8641–8647.
Wallace, L.A., Wheeler, A.J., Kearney, J.,Van Ryswyk, K., You, H., Kulka, R.H.,Rasmussen, P.E., Brook, J.R. and Xu, X.(2011) Validation of continuous particlemonitors for personal, indoor, and out-door exposures, J. Expos. Sci. Environ.Epidemiol., 21, 49–64.
Yanosky, J.D., Williams, P.L. and Macin-tosh, D.L. (2002) A comparison of twodirect-reading aerosol monitors with thefederal reference method for PM2.5 inindoor air, Atmos. Environ., 36, 107–113.
Zhang, Q. and Zhu, Y. (2012) Characterizingultrafine particles and other air pollutantsat five schools in South Texas, Indoor Air,22, 33–42.
Zhang, Q., Gangupomu, R.H., Ramirez, D.and Zhu, Y. (2010) Measurement ofultrafine particles and other air pollutantsemitted by cooking activities, Int. J. Envi-ron. Res. Public Health, 7, 1744–1759.
Zhang, Q., Fischer, H.J., Weiss, R.E. andZhu, Y. (2013) Ultrafine particle concen-trations in and around idling schoolbuses, Atmos. Environ., 69, 65–75.
198
Zhang et al.