finding thalamic bold correlates to posterior alpha eeg
TRANSCRIPT
NeuroImage 63 (2012) 1060–1069
Contents lists available at SciVerse ScienceDirect
NeuroImage
j ourna l homepage: www.e lsev ie r .com/ locate /yn img
Finding thalamic BOLD correlates to posterior alpha EEG
Zhongming Liu ⁎, Jacco A. de Zwart, Bing Yao, Peter van Gelderen, Li-Wei Kuo, Jeff H. DuynAdvanced Magnetic Resonance Imaging Section, Laboratory of Functional and Molecular Imaging, National Institute of Neurological Disorders and Stroke, National Institutes of Health,Bethesda, MD, USA
⁎ Corresponding author at: Advanced MRI Section, LFMIB1D-723, 9000 Rockville Pike, MSC 1065, Bethesda, MD 2091981.
E-mail address: [email protected] (Z. Liu).
1053-8119/$ – see front matter. Published by Elsevier Ihttp://dx.doi.org/10.1016/j.neuroimage.2012.08.025
a b s t r a c t
a r t i c l e i n f oArticle history:Accepted 7 August 2012Available online 17 August 2012
Keywords:EEG–fMRIAlphaThalamusPulvinarLateral geniculate nucleus
Oscillatory electrical brain activity in the alpha (8–13 Hz) band is a prominent feature of human electroenceph-alography (EEG) during alert wakefulness, and is commonly thought to arise primarily from the occipital andparietal parts of the cortex. While the thalamus is considered to play a supportive role in the generation andmodulation of cortical alpha rhythms, its precise function remains controversial and incompletely understood. Toaddress this, we evaluated the correlation between the blood oxygenation level dependent (BOLD) functionalmagnetic resonance imaging (fMRI) signals in the thalamus and the spontaneous modulation of posterior alpharhythms based on EEG–fMRI data acquired concurrently during an eyes-closed task-free condition. We observedboth negative and positive correlations in the thalamus. The negative correlations were mostly seen within thevisual thalamus, with a preference for the pulvinar over lateral geniculate nuclei. The positive correlations werefound at the anterior and medial dorsal nuclei. Through functional connectivity analysis of the fMRI data, thepulvinar was found to be functionally associated with the same widespread cortical visual areas where the fMRIsignals were negatively correlatedwith the posterior alphamodulation. In contrast, the dorsal nuclei were part of adistinct functional network that included brain stem, cingulate cortex and cerebellum. These observations areconsistentwith previous animal electrophysiology studies and the notion that the visual thalamus, and the pulvinarin particular, is intimately involved in the generation and spontaneous modulation of posterior alpha rhythms,facilitated by its reciprocal and widespread interaction with the cortical visual areas. We further postulate that theanterior and medial dorsal nuclei, being part of the ascending neuromodulatory system, may indirectly modulatecortical alpha rhythms by affecting vigilance and arousal levels.
Published by Elsevier Inc.
Introduction
In human EEG, alpha activity (i.e. electrical activity in the 8–13 Hzfrequency range) is most prominent in occipital and parietal regionswhen the subject is resting wakefully with eyes closed, and is sup-pressed with opening of the eyes (Berger, 1929) or falling into sleep(Niedermeyer, 1997). The occipital dominance of alpha-band EEGactivity is thought to reflect primarily cortical dendritic activity syn-chronized across a large part of the visual cortex, which is situated inthe occipital lobe. The neural circuitry underlying this synchroniza-tion has not been firmly established and likely includes not onlycortico-cortical but also thalamo-cortical connections. Specifically, theinvolvement of the thalamus remains difficult to assess non-invasivelywith scalp-recorded EEG alone due to its very low sensitivity to signalsources situated deeper in the brain, as is the thalamus.
Invasive electrophysiological recordings from animals have shedlight on an important role of the visual thalamus in the generation,modulation and synchronization of alpha rhythms observed from the
, NINDS, NIH, Building 10, Room82‐1065, USA. Fax: +1 301 480
nc.
visual cortex (Hughes and Crunelli, 2005). During natural wakeful-ness, local field potentials (LFP) recorded from the visual cortex ofdogs and cats exhibit robust oscillatory activity centered at 10 Hz(Chatila et al., 1993; Lopes da Silva et al., 1973; Lorincz et al., 2009).Like the human posterior alpha rhythm, its amplitude was shown toreact in a similar fashion to opening and closing the eyes (Chatila etal., 1992). Importantly, alpha oscillations were also observed spe-cifically within the visual thalamus, including both the lateral geni-culate nucleus (LGN) and pulvinar (Pul). Comparison between thealpha rhythms recorded from the thalamic and cortical parts of theanimal visual system showed a strong degree of phase-locking andamplitude covariation (Chatila et al., 1993; Lopes da Silva et al., 1973;Lopes da Silva et al., 1980; Lorincz et al., 2009). In addition, coherenceanalysis after simulated removal of the visual thalamus by parcelingout its contributions to thalamo-cortical synchrony showed a sig-nificant decrease of intra-cortical alpha coherence (Lopes da Silva etal., 1980).
Extrapolating these findings from animals to humans, one mayhypothesize that the reciprocal (i.e. feedforward and feedback) in-teractions between the visual thalamus and the visual cortex give riseto the human posterior alpha rhythm. A unique and non-invasiveapproach to test this hypothesis is to use concurrently recorded fMRI–EEGto search the entire brain formetabolic and/or hemodynamic correlates of
1061Z. Liu et al. / NeuroImage 63 (2012) 1060–1069
the posterior alpha rhythm. This approach benefits from the whole braincoverage and relatively high spatial resolution provided by fMRI. Utilizingthis approach, several groups have assessed the correlation betweensimultaneously acquired BOLD fMRI and alpha EEG primarily in the ab-sence of overt subject activity (de Munck et al., 2007; Feige et al., 2005;Goldman et al., 2002; Laufs et al., 2003; Moosmann et al., 2003;Sadaghiani et al., 2010). Likewise, other groups combining positronemission tomography (PET) and EEG have also attempted to localizechanges in regional cerebral blood flow (CBF) and cerebral metabolicrate of glucose consumption (CMRglu) that were correlated with thevariation of alpha amplitude or power (Buchsbaum et al., 1984; Danoset al., 2001; Larson et al., 1998; Lindgren et al., 1999; Sadato et al.,1998). The results from these studies were generally consistent incortical regions but notably variable in the thalamus. The correlationbetween the posterior alphamodulation and the BOLD, CBF or CMRglusignal in the thalamus has been reported to be positive (Danos et al.,2001; de Munck et al., 2007; Feige et al., 2005; Goldman et al., 2002;Moosmann et al., 2003; Sadaghiani et al., 2010; Sadato et al., 1998),negative (Larson et al., 1998; Lindgren et al., 1999; Moosmann et al.,2003) or near-zero (Laufs et al., 2003), as opposed to more reliablynegative correlations in the visual cortex reported in most of thesestudies, except one (Laufs et al., 2003).
One possible source for the discrepancies among these studiesrelates to the structural and functional heterogeneity of the thalamus.Based on histology (Morel et al., 1997), the thalamus can be dividedinto a number of sub-regions (often called nuclei), many of whichhave been shown to serve specific functions (Sherman and Guillery,2006). Numerous tracing studies in animals (Jones, 2007) havedemonstrated uniquely specific connectional patterns of thalamicnuclei with cortical functional areas; in humans, this specificity hasbeen confirmed with tract-tracing based on diffusion MRI (Behrens etal., 2003; Johansen-Berg et al., 2005), resting-state fMRI (Zhang et al.,2008) as well as by a recent electrophysiological study (Elias et al.,2012). For this reason, it is quite possible that individual thalamicsub-regions may also bear a unique relationship with alpha activity.Unfortunately, none of the previous neuroimaging studies was able toregister its EEG–fMRI or EEG–PET correlation results to specificthalamic sub-regions, in part due to an inability to localize them tospecific thalamic nuclei (e.g. LGN and Pul). Therefore, the precisenature of thalamic involvement in cortical alpha signals in humansremains poorly understood.
Toward filling this gap, we revisited the sub-cortical and corticalcorrelations between BOLD fMRI and alpha EEG using recent technicaladvances for artifact removal from concurrent fMRI–EEG recordings (Liuet al., 2012), high-field anatomical MRI (Duyn et al., 2007), physiologicalnoise correction (Birn et al., 2008; Chang et al., 2009) and functionalto structural image alignment (Saad et al., 2009). We aimed to answera) whether BOLD signals within the visual thalamus were correlated(either negatively or positively) with the spontaneous modulation ofposterior alpha rhythms, b) if so, to which nuclei of the visual thalamus(LGN or Pul) these correlations localized. To address the latter, thereference locations of LGN and Pul were respectively defined using afunctional localizer with visual stimulation and high-resolution anatom-ical imaging, in addition to the use of a histology-based atlas of thethalamus (Morel, 2007). We also evaluated the intrinsic functionalconnectivity between the thalamus and the cortex to test whetherthose alpha-correlated thalamic and cortical regions would constitute acoherent functional network.
Methods and materials
Experimental design
In order to localize the neural circuitry underlying spontaneous mo-dulation of posterior alpha rhythms, we measured simultaneous EEGand fMRI signals from15healthy volunteers under various experimental
conditions and computed the correlation between the BOLD signal andthe occipital EEG power at each volunteer's specific alpha frequency. Thevalidity of this approach is based on the assumption that changes in alphapower have a metabolic correlate that leads to a BOLD effect throughneurovascular coupling.
Three separate runs were performed to find the BOLD correlate toEEG alpha power, to measure an individual alpha frequency for eachsubject, and to functionally localize the LGN. Specifically, each subjectwas instructed to perform the following three tasks: 1) rest wakefullywith eyes closed for 10 min, 2) rest while alternatingly keeping eyesclosed or open in a self-paced manner (about 30 s for each period and4 min in total), and 3) view checkerboard-patterned stimuli (full-screen, black-and-white, 6 Hz reversal frequency) presented with ablock design (30 s on and 30 s off repeated for 3 cycles) combinedwith a continuous fixation task (pressing a button to report randomcolor changes of a central dot). Some subjects participated in multiplescans of the same protocol on the same or a different day. At the end ofeach 10-min resting session, we explicitly asked the subject for feedbackabout his/her ability to stay wakeful during the entire scan. The sessionwas excluded from further analysis if the subject reported falling asleepor feeling drowsy or if excessive headmotionwas observed. In total, thisstudy included 35 scans for eyes-closed rest, 21 scans for the eyes-closed–eyes-open task and 21 scans for the visual stimulation.
To co-register functionally defined regions (e.g. alpha-BOLD cor-related areas) to specific thalamic nuclei, we also performed high-resolution structural imaging based on GRE phase data and used ahistology-based atlas of the thalamus. The former was used to de-scribe the in vivo anatomical contrast and details, while the latter wasused to identify the names of the nuclei underlying the thalamicalpha-BOLD correlation.
Environmental light exposure was minimized throughout the ex-periment. All of the subjects had normal or corrected-to-normal vi-sion and gave informedwritten consent in accordance with a protocolapproved by the Institutional Review Board of the National Instituteof Neurological Disorders and Stroke at the National Institutes ofHealth.
Data acquisition
We acquired concurrent EEG (32-channel EEG, international 10–20montage, two unipolar electrodes for electrocardiogram (ECG) andelectrooculography (EOG), 16-bit BrainAmp MR, BrainProducts GmbH,Germany) and BOLD fMRI using a single-shot gradient echo (GRE)echo-planar imaging (EPI) sequence on a 3 T SignaMRI system(GeneralElectric Health Care, Milwaukee, WI, USA) equipped with a 16-channelreceive-only coil array (NOVA Medical, Wilmington, MA, USA).
Continuously acquired EEG data were referenced to the FCz chan-nel and sampled at 5 kHz with a resolution of 0.5 μV/bit and an analogbandwidth from 0.1 to 250 Hz. The EEG sampling clock was synchro-nized with an external reference signal extracted from the 10 MHzmaster clock of the MRI scanner. The onset time of every EPI sliceacquisition was also recorded based on a 5 V TTL signal from thescanner. Cardiac and respiratory signals were recorded using a pulseoximeter on the left index finger and a pneumatic belt around theupper abdomen, respectively.
The GRE-EPI data were acquired with 90° flip angle (FA), 30 msecho time (TE), 1.5 s repetition time (TR), 30 axial slices with 4 mmthickness and no inter-slice gap, 220×165 mm2
field of view (FOV) for64×48 matrix and sensitivity encoding (SENSE) parallel imaging withan acceleration factor of two (rate-2) as described earlier (de Zwart etal., 2002). The last imaging volumewas acquiredwith slightly longer TEto measure the spatial variation of the B0 field. T1-weighted anatomicalimages covering thewhole headwere acquiredwith 3-Dmagnetizationprepared rapid gradient echo (3-D MPRAGE) (FA=12°, TE=2.25 ms,TR=5ms, inversion time=725 ms, 200 sagittal slices, 1 mm3 isotropicresolution, rate-2 SENSE).
1062 Z. Liu et al. / NeuroImage 63 (2012) 1060–1069
From 10 subjects, T2*-weighted magnitude and phase imageswere also acquired with 2-D multi-echo GRE (rate-2 SENSE,TE=15.5/30/40.5 ms, TR=2 s, 90 axial slices with 0.31×0.31 mm2
in-plane resolution, 0.8 mm slice thickness and 0.2 mm gap) using a7 T Signa MRI system (General Electric Health Care, Milwaukee,WI, USA) with a 32-channel receive coil array (NOVA Medical,Wilmington, MA, USA). These 10 subjects were part of an unrelatedanatomical study and did not completely match the subject groupscanned at 3 T.
Data preprocessing
EEG artifacts related to MRI gradient switching and cardiac pul-sation were removed by using a Matlab-based toolbox as described inLiu et al. (2012). The EEG signals were then band-pass filtered from0.5 to 70 Hz and down-sampled to 250 Hz. Independent componentanalysis (ICA) was further applied to the EEG data in order to removeartifacts related to eye and muscle activities, which were identifiedthrough visual inspection of the time course and spatial pattern ofindividual components.
Geometric distortion in fMRI images was corrected using the B0field map measured with EPI. Physiological effects related to cardiac andrespiratory cycles were removed on a slice-by-slice basis by using aretrospective image-based correction method (RETROICOR) as describedelsewhere (Glover et al., 2000). The time series of EPI images werecorrected for slice timing differences and realigned to the first volume toaccount for subtle head motion by using FSL (FMRIB, Oxford, UK) (Smithet al., 2004). Linear regression was then performed to remove nuisancevariables including a third-order polynomial function modeling the slowsignal drift and two additional regressors derived from variations inrespiratory volume per time (RVT) and heart rate (HR) using twomodel-based methods described in Birn et al. (2008) and Chang et al. (2009),respectively. Spatial smoothing was then applied by using a 3-DGaussian kernel with 4 mm isotropic full width at half maximum(FWHM). An improvedmethod for T2*-to-T1weighted image alignment(Saad et al., 2009), using align_epi_anat.py in AFNI (NIMH, NIH, USA)(Cox, 1996), was used to register the EPI images to the MPRAGE imageswith a rigid-body transformation. This method was beneficial for thepresent study, providing an accurate alignment of internal brain struc-tures (e.g. the thalamus) between the functional and structural imagesfor every individual subject. The structural images were further trans-formed to the standard Montreal Neurological Institute (MNI) stereo-tactic space using a nonlinear registration tool (FNIRT) in FSL. Thisnonlinear transformation was subsequently applied to the normaliza-tion of functional images or maps from individuals' brain to the MNIspace for group analysis (to be explained below).
Alpha-BOLD correlation
For each subject, the individual alpha frequency (IAF) was deter-mined based on the greatest spectral contrast within the alpha bandbetween the eyes-closed and eyes-open periods, using a 0.2-Hz spec-tral resolution. During the eyes-closed rest, the temporal power fluc-tuation at IAF was extracted from the spectrogram (i.e. EEG power asa function of time and frequency) computed with a 2 s time windowsliding in 1 s steps. The spectrogramwas estimated with 0.5 Hz spectralresolution by using a multitaper algorithm implemented in Chronux(Mitra and Bokil, 2008). The posterior alpha modulation was obtainedby averaging the alpha power signals extracted from three occipitalelectrodes (O1, O2 and Oz). An alpha regressor was derived from theconvolution of the posterior alpha power with a canonical hemody-namic response function (HRF) in SPM8 (Wellcome Trust Centre forNeuroimaging, University College London, UK). The same nuisancevariables (including RVT and HR) excluded from the fMRI signals werealso regressed out from the alpha regressor. After that, the alpharegressor was correlated with the BOLD signals throughout the brain.
The resulting correlation coefficients were converted to z-values usingthe Fisher's r-to-z transform. After normalizing the z-map to the MNIspace, the alpha-BOLD correlation was first averaged across multiplesessions for the same subject. Then individual subjects' results wereaveraged and tested for the group-level statistical significance usingone-sample t-test (3dttest++in AFNI). The t-threshold was chosensuch that the false discovery rate (FDR), denoted as pwas less than 0.02.
Functional localization of LGN
The locations of bilateral LGN were defined based on the visualstimulation experiment. The BOLD activation maps associated withthe full-field visual stimulation were obtained through conventionalgeneral linear model (GLM) analysis as implemented in FSL. For eachsubject, the statistical parametric map (in terms of z-values) wasnormalized to the MNI space. Individual subjects' results were aver-aged and tested for group-level significance using the aforemen-tioned one-sample t-test with pb0.02 (corrected for FDR). Thesignificantly activated voxels within the thalamus were considered torepresent LGN instead of Pul, since passive viewing of visual stimulationwhile maintaining fixation has been previously shown not to inducesignificant activation within Pul (Kastner et al., 2004). Note that the useof visual stimulationwas to functionally localize LGN for the comparisonwith the thalamic regions where the BOLD signals were negativelycorrelated with posterior alpha power. This comparison was free ofpotential systematic errors or biases in the functional–structural imageregistration or functional–histological registration.
Anatomical imaging of thalamic sub-divisions
For 10 of the subjects, high-resolution phase images were ob-tained from high-resolution multi-echo GRE data acquired at 7 T. Thephase data for the first echo (TE=15.5 ms) were unwrapped usingPRELUDE in FSL. Macroscopic phase variations were removed from theunwrapped phase to yield phase images showing local susceptibility-weighted contrast. The unit of phase images was converted to frequencyin Hz after divided by 2π and TE.
For comparison with functional images, the phase images werealso normalized to the MNI space. This was achieved by first aligningthe magnitude images at TE=30 ms to the T1*-weighted images(using align_epi_anat.py in AFNI), which was in turn aligned to theMNI T1*-weighted template (using FNIRT in FSL). The resulting trans-formational operationswere sequentially applied to the phase images toallow for the alignment and averaging of individual subjects' phaseimages in theMNI space. The average phase images of these 10 subjectsin the MNI space served as an MRI-based anatomical atlas of the thal-amus for the entire 15 subjects' functional data set, offering much morestructural detail than the conventional T1-weighted MRI atlas, whichappeared largely homogeneous in the thalamus. We used the phaseimages to address whether the thalamic regions functionally identifiedwith alpha-BOLD correlation and visual activation analyses were struc-turally distinct.
Comparison to thalamic atlas
In addition, we used the Morel atlas of the human thalamus (Morel,2007) to confirm the structure–function relationship addressedwithMRIand EEG as aforementioned, and to further relate fMRI–EEG findings tospecifically namedgroups of thalamic nuclei. TheMorel atlas is based on acomprehensive histological study of subcortical structures (Morel et al.,1997), and consists of named subgroups of nuclei with defined bound-aries. We digitized 59 subgroups of nuclei on 26 drawings of horizontalsections of the thalamus, which were parallel to the intercommissuralplane with an intersectional spacing of 0.9 mm (Morel, 2007). We co-registered the digitized drawings to the MNI brain template byaligning their intercommissural planes and corresponding locations
1063Z. Liu et al. / NeuroImage 63 (2012) 1060–1069
for the anterior and posterior commissure. As the atlas only includedthe right half of the thalamus, the left half was added to be symmetricto the right half. Such co-registered Morel atlas delineated ROIs in theMNI space for the 59 thalamic nuclei.
In order to comparatively attribute the negative alpha-BOLD cor-relations and visually evoked BOLD responses to specific subgroups ofthe visual thalamus, we performed receiver operating characteristic(ROC) analysis. This analysis was performed to separately characterizetwo functional maps (i.e. the alpha-BOLD correlation map and visuallyevoked activationmap), with either Pul or LGN serving as the “receiver”for each of thesemaps. The alpha-BOLD correlationmapwas subject toa negative statistical threshold, whereas the visual activation mapwassubject to a positive statistical threshold. For either case, the thresholdused for the selection of voxels within the thalamus was variedstepwise. For each threshold chosen, we computed the true positiverate (TPR) as the number of selected thalamic voxels within the“receiver” divided by the total number of voxels in the “receiver”.Similarly, we computed the false positive rate (FPR) as the number ofselected thalamic voxels outside the “receiver” divided by the totalnumber of thalamic voxels outside the “receiver”. Note that thecomputation was based on voxels covering the entire thalamus. TheTPR values found for the various thresholds were then plotted as afunction of their corresponding FPR value, giving rise to an ROC curve.For a non-receiver specific process, the ROC curve is an identity line.The better the “receiver” characterizes a process (i.e. a spatialdistribution in this context), the higher the ROC curve runs above theidentity line.
Resting-state functional connectivity
From the group-level result of alpha-BOLD correlation (see Results),two thalamic ROIs were defined for further functional connectivity anal-ysis. The first ROI consisted of the lateral and posterior clusters of voxelsshowing significantly negative correlation with the posterior alpha; thesecond ROI was the anterior and medial dorsal region showing sig-nificantly positive correlation with the posterior alpha modulation. BothROIs served separately as the seed ROI from which the functional con-nectivity to the rest of the brain was evaluated by computing the seededcross correlation in the resting-state BOLD signal. This analysis was con-ducted in order to reveal the thalamocortical functional networks inwhich these two thalamic ROIs were individually involved.
Results
To find the hemodynamic correlates of posterior alpha EEG, wesimultaneously measured EEG and fMRI signals from subjects restingwith eyes closed. As the peak frequency in the alpha band varied acrosssubjects, we first determined the individual alpha frequency (IAF) basedon each subject's spectral contrast between the eyes-closed and eyes-open periods as shown in Fig. 1. The mean and standard deviation of IAFwere 10.1 and 0.9 Hz, respectively. Linear correlation was evaluatedbetween the spontaneous power fluctuation of the occipital EEG signal atthe IAF and the BOLD-fMRI signal at every voxel in the brain. Fig. 2 showsthe map of either positive or negative correlations that were statisticallysignificant at the group level (pb0.02 for n=15, corrected for FDR). Inthe cortex, only negative correlations were consistently found acrosssubjects, being the strongest in the occipital lobe (r=−0.21±0.04,4803 voxels for a 3×3×3 mm3 voxel size), and still significant butweaker in the parietal (r=−0.16±0.04, 4673 voxels), temporal (r=−0.15±0.03, 2071 voxels) and frontal (r=−0.14±0.03, 3914voxels) lobes. These negatively correlated regions covered 55% of thevisual cortex, including primary and higher visual areas distributedalong both dorsal and ventral pathways. Some non-visual areas, suchas the somatosensory and auditory cortices, also showed negativecorrelations. Interestingly, in the thalamus, we observed both negativeand positive BOLD correlates to the posterior alpha power. The lateral
and posterior parts of the left and right thalamus showed negativecorrelations (r=−0.15±0.02, 168 voxels), whereas the anterior andmedial dorsal parts of the thalamus showed positive correlations(r=0.19±0.02, 154 voxels).
In light of previous animal electrophysiology studies (some of whichwere mentioned in the Introduction section), we questioned whethersuch negatively correlated thalamic regions were within the visualthalamus.While the visual thalamus is known to include LGN and Pul, wefirst targeted the comparison with the LGN functionally localized withvisual stimulation. Fig. 3 shows the group-level comparison between theBOLD activationwith visual stimulation and the resting-state alpha-BOLDcorrelations. The bilateral LGN were clearly seen as two activation foci inthe thalamus (Fig. 3a). In contrast, the thalamic regions showing negativealpha-BOLD correlations were more extended, and appeared to be moremedial and extend more dorsally (Fig. 3b). Quantitatively, the thalamicregions showing significantly negative alpha-BOLD correlations differedfrom the functionally localized LGN: it was four times larger and its peakcorrelation level was displaced by 7.5 mm relative to the peak of LGNactivity in the localizer; furthermore, only 17% of the region was over-lapped by the LGN. This difference in location and extent led us to pos-tulate that the negative alpha-BOLD correlations were not confined toLGN, but rather involved other thalamic structures.
To further compare the thalamic localization of stimulus-evokedactivity and the BOLD-correlate of alpha activity during rest, we overlaidthe respective functional maps on high-resolution GRE phase images(Fig. 4). Unlike T1-weighted images, the T2*-weighted phase imagesprovided rich anatomical contrast among distinct thalamic sub-regionsand surrounding tissues. The purpose of using the phase images was totest whether the negative alpha-BOLD correlations and the visuallyactivated response occurred at different parts of the same nuclei ordifferent nuclei, which should be indicated as homogeneous or inho-mogeneous phase distribution, respectively. It was shown that thefunctionally localized LGNbased on visual stimulationwas located at themost lateral and inferior part of the posterior thalamus and close to thejuncture of optic tract and radiation (Fig. 4a). The regions negativelycorrelatedwith alphaweremoremedial and showed positive frequencyshift (i.e. lower intensity in the underlying phase images) (Fig. 4b), asopposed to negative frequency shift at the functionally localized LGN(Fig. 4a). These phase images indicated that there are anatomicallydistinct structures in the thalamus underlying these two functionalregions. From these results, we further hypothesized that the thalamicstructures showing the negative alpha-BOLD correlations localize to Pul.
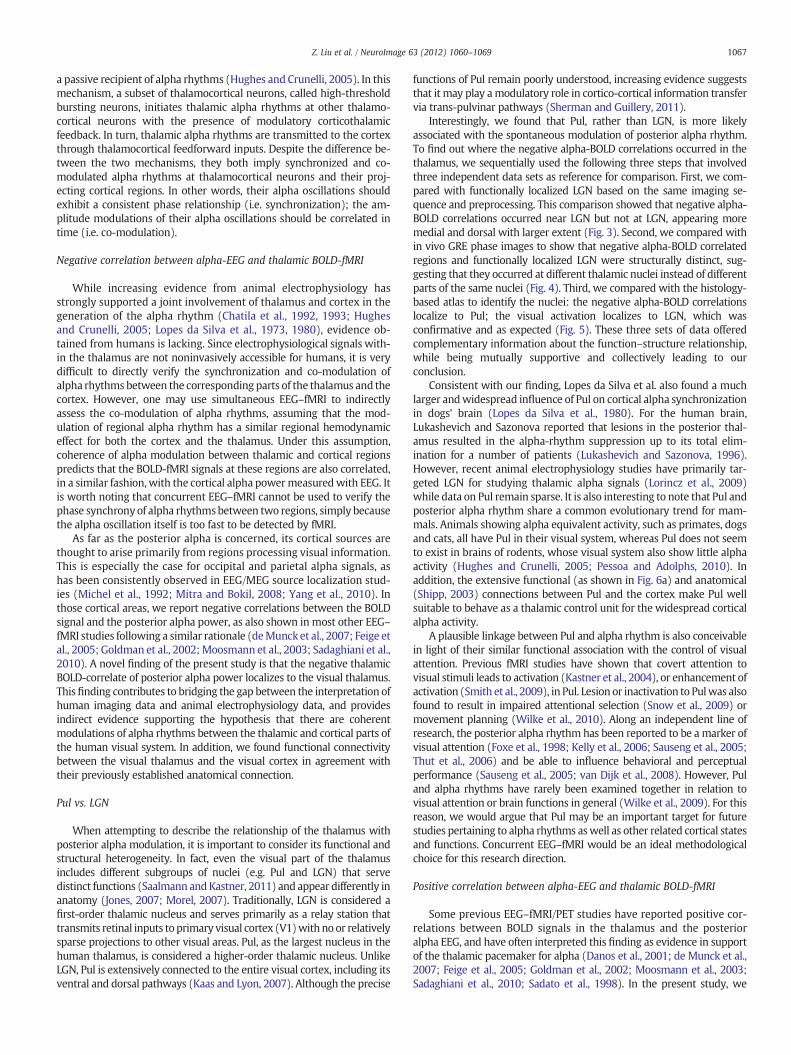
To test this hypothesis, we co-registered these functional maps withthe so-calledMorel atlas (Morel, 2007). As shown in Fig. 5a), the negativeBOLD correlates to the posterior alpha power weremostly locatedwithinor close to Pul, whereas the BOLD responses induced by the visualstimulationweremostly confined to LGN.We also plotted the ROC curvesfor Pul (Fig. 5b) and LGN (Fig. 5c) with varying thresholds applied to thenegative alpha-BOLD correlations (in blue) and the positive visualactivations (in red) within the thalamus. Note that the ROC curve inblue runs above the red curve in Fig. 5b, but below the red curve in Fig. 5c.This result supports our hypothesis that negative alpha-BOLD correlationprimarily localizes to Pul whereas visually evoked activity primarilylocalizes to LGN.
A thalamic region where the BOLD signal is correlated with theposterior alpha power may not contribute to the genesis of posterioralpha rhythms, unless this region is connected directly or indirectly tothe cortical regions that actually generate alpha rhythms measurablewith scalp EEG, which has very low sensitivity to thalamic sources.Therefore, we further evaluated thalamo-cortical functional connec-tivity with seed ROIs within regions that were correlated either neg-atively or positively with the posterior alpha power. We first defined aseed ROI including the left and right Pul, where significantly negativealpha-BOLD correlations were found. As can be seen from Fig. 6a), thecortical regions that were functionally connected to this Pul ROI largelycoincided with the cortical regions that were negatively correlated with
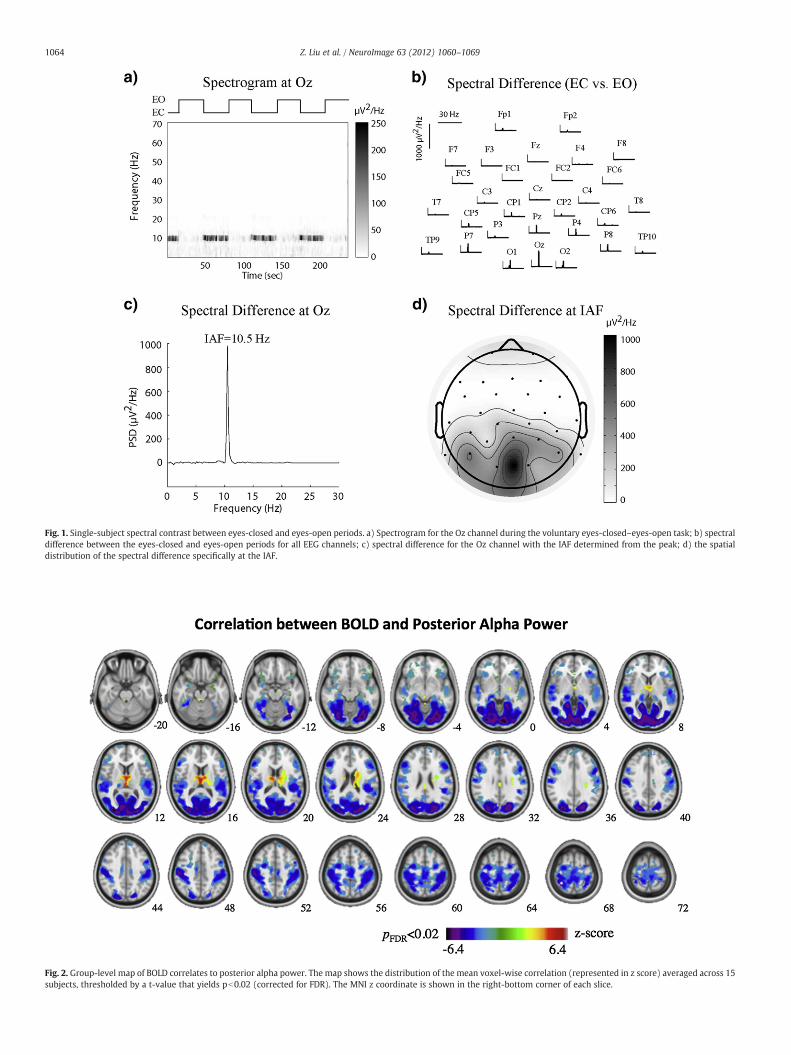
Fig. 2. Group-level map of BOLD correlates to posterior alpha power. The map shows the distribution of the mean voxel-wise correlation (represented in z score) averaged across 15subjects, thresholded by a t-value that yields pb0.02 (corrected for FDR). The MNI z coordinate is shown in the right-bottom corner of each slice.
Fig. 1. Single-subject spectral contrast between eyes-closed and eyes-open periods. a) Spectrogram for the Oz channel during the voluntary eyes-closed–eyes-open task; b) spectraldifference between the eyes-closed and eyes-open periods for all EEG channels; c) spectral difference for the Oz channel with the IAF determined from the peak; d) the spatialdistribution of the spectral difference specifically at the IAF.
1064 Z. Liu et al. / NeuroImage 63 (2012) 1060–1069
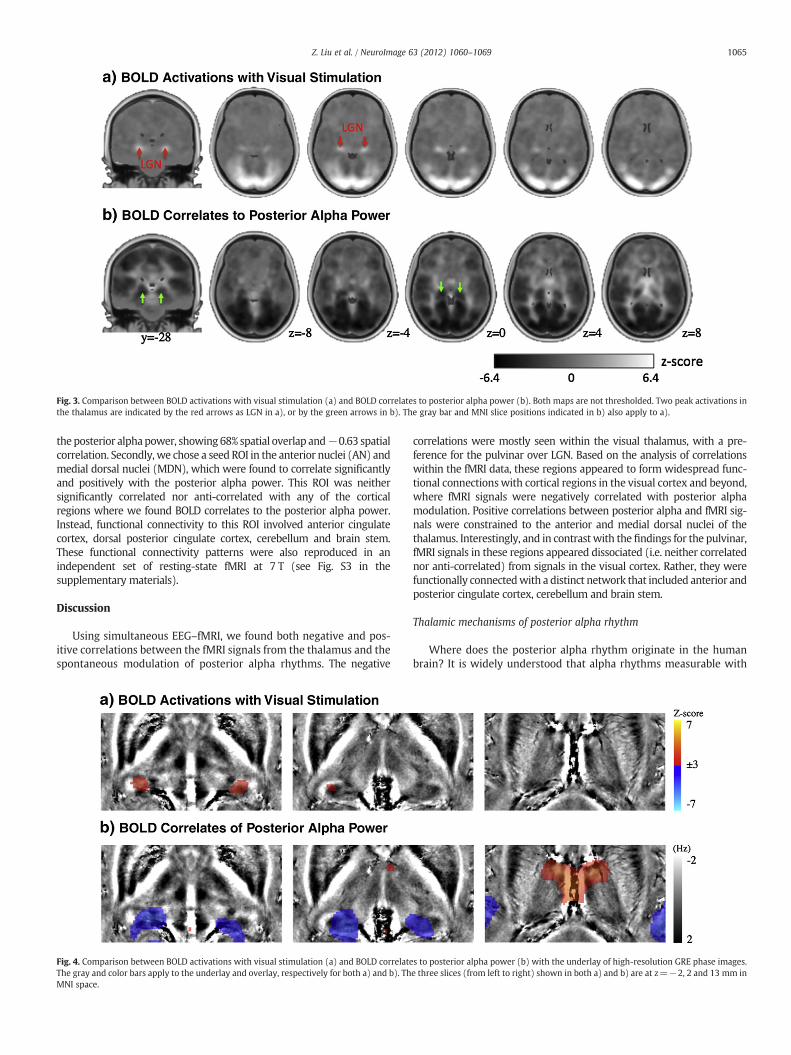
Fig. 3. Comparison between BOLD activations with visual stimulation (a) and BOLD correlates to posterior alpha power (b). Both maps are not thresholded. Two peak activations inthe thalamus are indicated by the red arrows as LGN in a), or by the green arrows in b). The gray bar and MNI slice positions indicated in b) also apply to a).
1065Z. Liu et al. / NeuroImage 63 (2012) 1060–1069
the posterior alphapower, showing 68% spatial overlap and−0.63 spatialcorrelation. Secondly, we chose a seed ROI in the anterior nuclei (AN) andmedial dorsal nuclei (MDN), which were found to correlate significantlyand positively with the posterior alpha power. This ROI was neithersignificantly correlated nor anti-correlated with any of the corticalregions where we found BOLD correlates to the posterior alpha power.Instead, functional connectivity to this ROI involved anterior cingulatecortex, dorsal posterior cingulate cortex, cerebellum and brain stem.These functional connectivity patterns were also reproduced in anindependent set of resting-state fMRI at 7 T (see Fig. S3 in thesupplementary materials).
Discussion
Using simultaneous EEG–fMRI, we found both negative and pos-itive correlations between the fMRI signals from the thalamus and thespontaneous modulation of posterior alpha rhythms. The negative
Fig. 4. Comparison between BOLD activations with visual stimulation (a) and BOLD correlateThe gray and color bars apply to the underlay and overlay, respectively for both a) and b). ThMNI space.
correlations were mostly seen within the visual thalamus, with a pre-ference for the pulvinar over LGN. Based on the analysis of correlationswithin the fMRI data, these regions appeared to form widespread func-tional connectionswith cortical regions in the visual cortex and beyond,where fMRI signals were negatively correlated with posterior alphamodulation. Positive correlations between posterior alpha and fMRI sig-nals were constrained to the anterior and medial dorsal nuclei of thethalamus. Interestingly, and in contrast with the findings for the pulvinar,fMRI signals in these regions appeared dissociated (i.e. neither correlatednor anti-correlated) from signals in the visual cortex. Rather, they werefunctionally connectedwith a distinct network that included anterior andposterior cingulate cortex, cerebellum and brain stem.
Thalamic mechanisms of posterior alpha rhythm
Where does the posterior alpha rhythm originate in the humanbrain? It is widely understood that alpha rhythms measurable with
s to posterior alpha power (b) with the underlay of high-resolution GRE phase images.e three slices (from left to right) shown in both a) and b) are at z=−2, 2 and 13 mm in
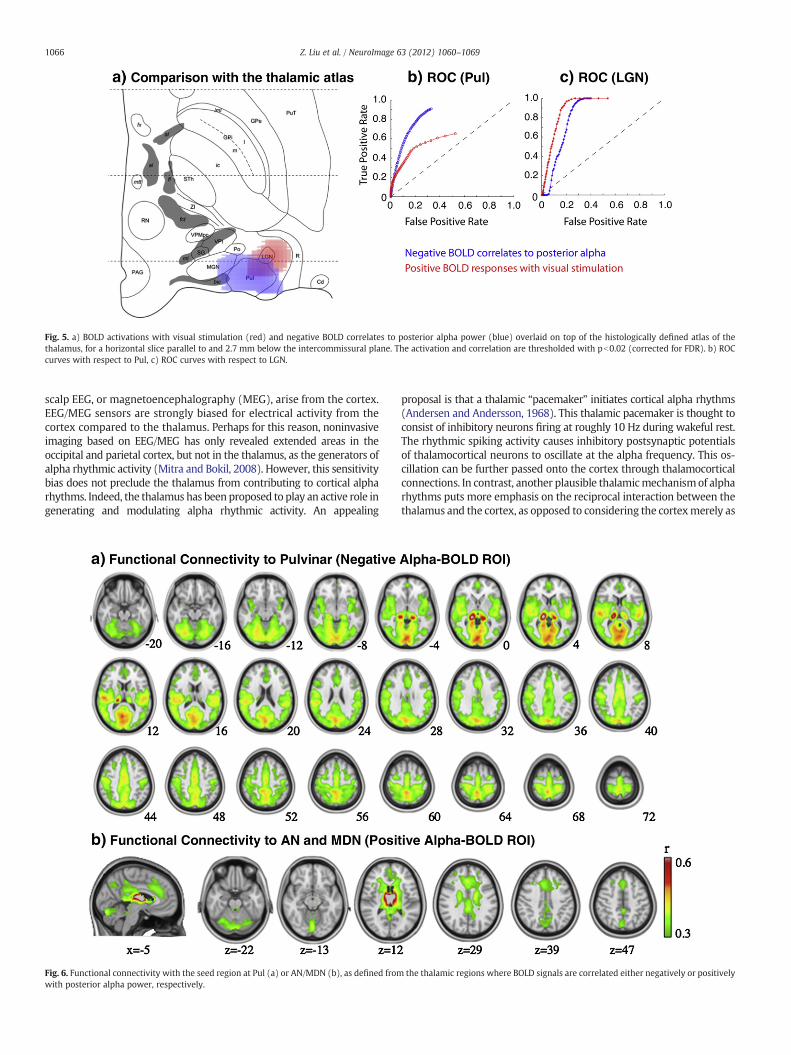
Fig. 5. a) BOLD activations with visual stimulation (red) and negative BOLD correlates to posterior alpha power (blue) overlaid on top of the histologically defined atlas of thethalamus, for a horizontal slice parallel to and 2.7 mm below the intercommissural plane. The activation and correlation are thresholded with pb0.02 (corrected for FDR). b) ROCcurves with respect to Pul, c) ROC curves with respect to LGN.
1066 Z. Liu et al. / NeuroImage 63 (2012) 1060–1069
scalp EEG, or magnetoencephalography (MEG), arise from the cortex.EEG/MEG sensors are strongly biased for electrical activity from thecortex compared to the thalamus. Perhaps for this reason, noninvasiveimaging based on EEG/MEG has only revealed extended areas in theoccipital and parietal cortex, but not in the thalamus, as the generators ofalpha rhythmic activity (Mitra and Bokil, 2008). However, this sensitivitybias does not preclude the thalamus from contributing to cortical alpharhythms. Indeed, the thalamus has been proposed to play an active role ingenerating and modulating alpha rhythmic activity. An appealing
Fig. 6. Functional connectivity with the seed region at Pul (a) or AN/MDN (b), as defined fromwith posterior alpha power, respectively.
proposal is that a thalamic “pacemaker” initiates cortical alpha rhythms(Andersen and Andersson, 1968). This thalamic pacemaker is thought toconsist of inhibitory neurons firing at roughly 10 Hz during wakeful rest.The rhythmic spiking activity causes inhibitory postsynaptic potentialsof thalamocortical neurons to oscillate at the alpha frequency. This os-cillation can be further passed onto the cortex through thalamocorticalconnections. In contrast, another plausible thalamicmechanismof alpharhythms puts more emphasis on the reciprocal interaction between thethalamus and the cortex, as opposed to considering the cortexmerely as
the thalamic regions where BOLD signals are correlated either negatively or positively
1067Z. Liu et al. / NeuroImage 63 (2012) 1060–1069
a passive recipient of alpha rhythms (Hughes and Crunelli, 2005). In thismechanism, a subset of thalamocortical neurons, called high-thresholdbursting neurons, initiates thalamic alpha rhythms at other thalamo-cortical neurons with the presence of modulatory corticothalamicfeedback. In turn, thalamic alpha rhythms are transmitted to the cortexthrough thalamocortical feedforward inputs. Despite the difference be-tween the two mechanisms, they both imply synchronized and co-modulated alpha rhythms at thalamocortical neurons and their proj-ecting cortical regions. In other words, their alpha oscillations shouldexhibit a consistent phase relationship (i.e. synchronization); the am-plitude modulations of their alpha oscillations should be correlated intime (i.e. co-modulation).
Negative correlation between alpha-EEG and thalamic BOLD-fMRI
While increasing evidence from animal electrophysiology hasstrongly supported a joint involvement of thalamus and cortex in thegeneration of the alpha rhythm (Chatila et al., 1992, 1993; Hughesand Crunelli, 2005; Lopes da Silva et al., 1973, 1980), evidence ob-tained from humans is lacking. Since electrophysiological signals with-in the thalamus are not noninvasively accessible for humans, it is verydifficult to directly verify the synchronization and co-modulation ofalpha rhythms between the corresponding parts of the thalamus and thecortex. However, one may use simultaneous EEG–fMRI to indirectlyassess the co-modulation of alpha rhythms, assuming that the mod-ulation of regional alpha rhythm has a similar regional hemodynamiceffect for both the cortex and the thalamus. Under this assumption,coherence of alpha modulation between thalamic and cortical regionspredicts that the BOLD-fMRI signals at these regions are also correlated,in a similar fashion,with the cortical alpha powermeasuredwith EEG. Itis worth noting that concurrent EEG–fMRI cannot be used to verify thephase synchronyof alpha rhythmsbetween two regions, simply becausethe alpha oscillation itself is too fast to be detected by fMRI.
As far as the posterior alpha is concerned, its cortical sources arethought to arise primarily from regions processing visual information.This is especially the case for occipital and parietal alpha signals, ashas been consistently observed in EEG/MEG source localization stud-ies (Michel et al., 1992; Mitra and Bokil, 2008; Yang et al., 2010). Inthose cortical areas, we report negative correlations between the BOLDsignal and the posterior alpha power, as also shown in most other EEG–fMRI studies following a similar rationale (deMunck et al., 2007; Feige etal., 2005; Goldman et al., 2002;Moosmann et al., 2003; Sadaghiani et al.,2010). A novel finding of the present study is that the negative thalamicBOLD-correlate of posterior alpha power localizes to the visual thalamus.Thisfinding contributes to bridging the gap between the interpretation ofhuman imaging data and animal electrophysiology data, and providesindirect evidence supporting the hypothesis that there are coherentmodulations of alpha rhythms between the thalamic and cortical parts ofthe human visual system. In addition, we found functional connectivitybetween the visual thalamus and the visual cortex in agreement withtheir previously established anatomical connection.
Pul vs. LGN
When attempting to describe the relationship of the thalamus withposterior alpha modulation, it is important to consider its functional andstructural heterogeneity. In fact, even the visual part of the thalamusincludes different subgroups of nuclei (e.g. Pul and LGN) that servedistinct functions (Saalmann andKastner, 2011) and appear differently inanatomy (Jones, 2007; Morel, 2007). Traditionally, LGN is considered afirst-order thalamic nucleus and serves primarily as a relay station thattransmits retinal inputs to primary visual cortex (V1)withno or relativelysparse projections to other visual areas. Pul, as the largest nucleus in thehuman thalamus, is considered a higher-order thalamic nucleus. UnlikeLGN, Pul is extensively connected to the entire visual cortex, including itsventral and dorsal pathways (Kaas and Lyon, 2007). Although the precise
functions of Pul remain poorly understood, increasing evidence suggeststhat it may play amodulatory role in cortico-cortical information transfervia trans-pulvinar pathways (Sherman and Guillery, 2011).
Interestingly, we found that Pul, rather than LGN, is more likelyassociated with the spontaneous modulation of posterior alpha rhythm.To find out where the negative alpha-BOLD correlations occurred in thethalamus, we sequentially used the following three steps that involvedthree independent data sets as reference for comparison. First, we com-pared with functionally localized LGN based on the same imaging se-quence and preprocessing. This comparison showed that negative alpha-BOLD correlations occurred near LGN but not at LGN, appearing moremedial and dorsal with larger extent (Fig. 3). Second, we compared within vivo GRE phase images to show that negative alpha-BOLD correlatedregions and functionally localized LGN were structurally distinct, sug-gesting that they occurred at different thalamic nuclei instead of differentparts of the same nuclei (Fig. 4). Third, we compared with the histology-based atlas to identify the nuclei: the negative alpha-BOLD correlationslocalize to Pul; the visual activation localizes to LGN, which wasconfirmative and as expected (Fig. 5). These three sets of data offeredcomplementary information about the function–structure relationship,while being mutually supportive and collectively leading to ourconclusion.
Consistent with our finding, Lopes da Silva et al. also found a muchlarger andwidespread influence of Pul on cortical alpha synchronizationin dogs' brain (Lopes da Silva et al., 1980). For the human brain,Lukashevich and Sazonova reported that lesions in the posterior thal-amus resulted in the alpha-rhythm suppression up to its total elim-ination for a number of patients (Lukashevich and Sazonova, 1996).However, recent animal electrophysiology studies have primarily tar-geted LGN for studying thalamic alpha signals (Lorincz et al., 2009)while data on Pul remain sparse. It is also interesting to note that Pul andposterior alpha rhythm share a common evolutionary trend for mam-mals. Animals showing alpha equivalent activity, such as primates, dogsand cats, all have Pul in their visual system, whereas Pul does not seemto exist in brains of rodents, whose visual system also show little alphaactivity (Hughes and Crunelli, 2005; Pessoa and Adolphs, 2010). Inaddition, the extensive functional (as shown in Fig. 6a) and anatomical(Shipp, 2003) connections between Pul and the cortex make Pul wellsuitable to behave as a thalamic control unit for the widespread corticalalpha activity.
A plausible linkage between Pul and alpha rhythm is also conceivablein light of their similar functional association with the control of visualattention. Previous fMRI studies have shown that covert attention tovisual stimuli leads to activation (Kastner et al., 2004), or enhancement ofactivation (Smith et al., 2009), in Pul. Lesion or inactivation to Pulwas alsofound to result in impaired attentional selection (Snow et al., 2009) ormovement planning (Wilke et al., 2010). Along an independent line ofresearch, the posterior alpha rhythm has been reported to be a marker ofvisual attention (Foxe et al., 1998; Kelly et al., 2006; Sauseng et al., 2005;Thut et al., 2006) and be able to influence behavioral and perceptualperformance (Sauseng et al., 2005; van Dijk et al., 2008). However, Puland alpha rhythms have rarely been examined together in relation tovisual attention or brain functions in general (Wilke et al., 2009). For thisreason, we would argue that Pul may be an important target for futurestudies pertaining to alpha rhythms aswell as other related cortical statesand functions. Concurrent EEG–fMRI would be an ideal methodologicalchoice for this research direction.
Positive correlation between alpha-EEG and thalamic BOLD-fMRI
Some previous EEG–fMRI/PET studies have reported positive cor-relations between BOLD signals in the thalamus and the posterioralpha EEG, and have often interpreted this finding as evidence in supportof the thalamic pacemaker for alpha (Danos et al., 2001; de Munck et al.,2007; Feige et al., 2005; Goldman et al., 2002; Moosmann et al., 2003;Sadaghiani et al., 2010; Sadato et al., 1998). In the present study, we
1068 Z. Liu et al. / NeuroImage 63 (2012) 1060–1069
confirmed this finding and further pinpointed such positive correlationsspecifically to anterior and medial dorsal nuclei. However, interpretingthis result as supporting evidence of the thalamic pacemakermechanismmay be questionable for the following reasons. First, anterior and medialdorsal nuclei are not known to contain many inhibitory neurons, whichwould be anticipated if they would serve as pacemakers. Secondly,pacemaker cells should be connected, either directly or indirectly throughLGN and/or Pul, to the visual cortex, which shows strong alpha activity.Here, we tested the second point by evaluating resting-state functionalconnectivity from the fMRI data. Our results (Fig. 6b) showno evidence offunctional connectivity between the anterior and medial dorsal nucleiand the visual cortex. Instead, these thalamic nuclei appear functionallyconnected to the anterior cingulate cortex, dorsal posterior cingulatecortex, brain stem and cerebellum. This network has been known tomediate a variety of brain functions, such as cortical arousal (Saper et al.,2005; Steriade, 1996), emotional processing (Metzger et al., 2010) andtonic alertness (Sadaghiani et al., 2010). Therefore, our finding calls forcaution with simply interpreting positive alpha-BOLD correlation as ev-idence for the hypothesis that alpha rhythms originate from a thalamic“pacemaker”.
However, we do not rule out the possibility that activity at an-terior and medial dorsal nuclei may take part in a modulatory control,related to vigilance or arousal, which also influences cortical alpharhythms (Olbrich et al., 2009). Indeed, the location of thalamic nucleiwith positive BOLD-alpha correlation overlaps with that of the as-cending reticular activating system (ARAS) (Moruzzi and Magoun,1949), and in particular its cholinergic component (Shute and Lewis,1967). This ascending component also serves as a part of a largercholinergic limbic system that includes cingulate cortex and is able toprofoundly affect cortical activity (Lewis and Shute, 1967), behavior andemotion (Bush et al., 2000). In addition, the ascending modulatorysystem also sends inputs to other thalamic relay nuclei (e.g. Pul) as wellas reticular nuclei, which has been suggested to play an important role inregulating thalamocortical oscillation and transmission in the sleepingand aroused brain (Steriade et al., 1993). Therefore, we speculate thatwhile the pulvinar may be intimately involved in the generation of thealpha rhythm in the occipital cortex, such rhythmic activities may beunder central modulatory control (Steriade, 1993) effectuated throughthe midline and anterior parts of the thalamus (Saper et al., 2005).
Limitations
Since the thalamus is known to contain distinct nuclei closely packedwithin a relatively small volume, it would be preferable to use higherspatial resolution than used in this study for optimal distinction be-tween different functional subgroups of the thalamus. However com-pared to the cortex, the thalamus is a more challenging target for fMRIdue to its deeper location and longer distance from the receive coil array.This physically limits the sensitivity (quantified by the signal to noiseratio, or SNR) inside the thalamus. SNR is further reduced when in-creasing the spatial resolution, as it is inversely proportional to voxelvolume. Moreover, simultaneous EEG–fMRI places additional technicalconstraints. The higher spatial resolution requires longer time for eachslice acquisition, which in turn results in a higher level of gradientartifacts in EEG.While fMRI sensitivity could be improved by scanning athigher field strength, currently no commercial EEG systems are ap-proved for use at higher field strength due to safety concerns. In light ofthese considerations, we used relatively low spatial resolution (3.4 mmin-plane resolution with 4 mm slice thickness) for the 15 subjects re-ported in this paper. To explore potential benefits of higher resolution,we repeated the experiments described above with 3 mm and 2 mmisotropic voxels on a single subject on a 3 T scanner (Skyra, Siemens,Germany) using a 64-channel EEG system. We were able to reproduceour previous finding with 3 mm resolution, showing that negativecorrelates to posterior alpha power and positive responses to visualstimulation occurred at different thalamic subregions with little spatial
overlap (Fig. S1). At 2 mm resolution, the sensitivity to thalamic signalswas too low to reliably reveal either LGN or Pul based on visual ac-tivation or alpha correlation (Fig. S2).
Although the present study contributes to finding the thalamicsubstrates involved in the alphamodulation, it does not answerwhy sucha modulation occurs spontaneously or what its functional significance is.The modulation of alpha rhythms may in part be associated with fluc-tuations in the arousal level or cognitive load. Another outstanding ques-tion is whether the fMRI correlates of alpha differ between sleep andawake states, for example between rapid eyemovement (REM) sleep andwakefulness, which show similar EEG signals. The distinction betweenthese two conditions in terms of alpha modulation mechanism remainsto be addressed in the future.
Conclusion
Analysis of EEG–fMRI and fMRI–fMRI correlation patterns in humanresting state data suggests that the pulvinar nucleus in the thalamus isintimately involved in the generation and spontaneous modulation ofposterior alpha rhythms, consistent with its reciprocal and widespreadanatomical connectivity to cortical visual areas. In contrast, the anteriorand medial dorsal nuclei, as part of the ascending neuromodulatorysystem, may indirectly modulate cortical alpha rhythms as a way tomodulate vigilance and arousal levels, or as a result thereof.
Acknowledgments
This research was supported by the Intramural Research Programof the National Institute of Neurological Disorders and Stroke, NationalInstitutes of Health.
Appendix A. Supplementary data
Supplementary data to this article can be found online at http://dx.doi.org/10.1016/j.neuroimage.2012.08.025.
References
Andersen, P., Andersson, S., 1968. Physiological Basis of the Alpha Rhythm. Appleton-Century-Crofts, New York.
Behrens, T.E., Johansen-Berg, H., Woolrich, M.W., Smith, S.M., Wheeler-Kingshott, C.A.,Boulby, P.A., Barker, G.J., Sillery, E.L., Sheehan, K., Ciccarelli, O., Thompson, A.J.,Brady, J.M., Matthews, P.M., 2003. Non-invasive mapping of connections betweenhuman thalamus and cortex using diffusion imaging. Nat. Neurosci. 6, 750–757.
Berger, H., 1929. U¨ ber das Elektrenkephalogramm des Menschen. Arch. Psychiatr.Nervenkr. 87, 527–570.
Birn, R.M., Smith, M.A., Jones, T.B., Bandettini, P.A., 2008. The respiration responsefunction: the temporal dynamics of fMRI signal fluctuations related to changes inrespiration. NeuroImage 40, 644–654.
Buchsbaum, M.S., Kessler, R., King, A., Johnson, J., Cappelletti, J., 1984. Simultaneouscerebral glucography with positron emission tomography and topographicelectroencephalography. Prog. Brain Res. 62, 263–269.
Bush, G., Luu, P., Posner, M.I., 2000. Cognitive and emotional influences in anteriorcingulate cortex. Trends Cogn. Sci. 4, 215–222.
Chang, C., Cunningham, J.P., Glover, G.H., 2009. Influence of heart rate on the BOLDsignal: the cardiac response function. NeuroImage 44, 857–869.
Chatila, M., Milleret, C., Buser, P., Rougeul, A., 1992. A 10 Hz “alpha-like” rhythm in thevisual cortex of the waking cat. Electroencephalogr. Clin. Neurophysiol. 83,217–222.
Chatila, M., Milleret, C., Rougeul, A., Buser, P., 1993. Alpha rhythm in the cat thalamus.C. R. Acad. Sci. III 316, 51–58.
Cox, R.W., 1996. AFNI: software for analysis and visualization of functional magneticresonance neuroimages. Comput. Biomed. Res. 29, 162–173.
Danos, P., Guich, S., Abel, L., Buchsbaum, M.S., 2001. EEG alpha rhythm and glucosemetabolic rate in the thalamus in schizophrenia. Neuropsychobiology 43, 265–272.
de Munck, J.C., Goncalves, S.I., Huijboom, L., Kuijer, J.P., Pouwels, P.J., Heethaar, R.M.,Lopes da Silva, F.H., 2007. The hemodynamic response of the alpha rhythm: anEEG/fMRI study. NeuroImage 35, 1142–1151.
de Zwart, J.A., van Gelderen, P., Kellman, P., Duyn, J.H., 2002. Application of sensitivity-encoded echo-planar imaging for blood oxygen level-dependent functional brainimaging. Magn. Reson. Med. 48, 1011–1020.
Duyn, J.H., van Gelderen, P., Li, T.Q., de Zwart, J.A., Koretsky, A.P., Fukunaga, M., 2007.High-field MRI of brain cortical substructure based on signal phase. Proc. Natl.Acad. Sci. U. S. A. 104, 11796–11801.
1069Z. Liu et al. / NeuroImage 63 (2012) 1060–1069
Elias, W.J., Zheng, Z.A., Domer, P., Quigg, M., Pouratian, N., 2012. Validation ofconnectivity-based thalamic segmentation with direct electrophysiologic record-ings from human sensory thalamus. NeuroImage 59, 2025–2034.
Feige, B., Scheffler, K., Esposito, F., Di Salle, F., Hennig, J., Seifritz, E., 2005. Corticaland subcortical correlates of electroencephalographic alpha rhythm modulation.J. Neurophysiol. 93, 2864–2872.
Foxe, J.J., Simpson, G.V., Ahlfors, S.P., 1998. Parieto-occipital approximately 10 Hzactivity reflects anticipatory state of visual attention mechanisms. Neuroreport 9,3929–3933.
Glover, G.H., Li, T.Q., Ress, D., 2000. Image-based method for retrospective correction ofphysiological motion effects in fMRI: RETROICOR. Magn. Reson. Med. 44, 162–167.
Goldman, R.I., Stern, J.M., Engel Jr., J., Cohen, M.S., 2002. Simultaneous EEG and fMRI ofthe alpha rhythm. Neuroreport 13, 2487–2492.
Hughes, S.W., Crunelli, V., 2005. Thalamic mechanisms of EEG alpha rhythms and theirpathological implications. Neuroscientist 11, 357–372.
Johansen-Berg, H., Behrens, T.E., Sillery, E., Ciccarelli, O., Thompson, A.J., Smith, S.M.,Matthews, P.M., 2005. Functional–anatomical validation and individual variationof diffusion tractography-based segmentation of the human thalamus. Cereb.Cortex 15, 31–39.
Jones, E.G., 2007. The Thalamus. Cambridge University Press, New York, USA.Kaas, J.H., Lyon, D.C., 2007. Pulvinar contributions to the dorsal and ventral streams of
visual processing in primates. Brain Res. Rev. 55, 285–296.Kastner, S., O'Connor, D.H., Fukui, M.M., Fehd, H.M., Herwig, U., Pinsk,M.A., 2004. Functional
imaging of the human lateral geniculate nucleus and pulvinar. J. Neurophysiol. 91,438–448.
Kelly, S.P., Lalor, E.C., Reilly, R.B., Foxe, J.J., 2006. Increases in alpha oscillatory powerreflect an active retinotopic mechanism for distracter suppression duringsustained visuospatial attention. J. Neurophysiol. 95, 3844–3851.
Larson, C.L., Davidson, R.J., Abercrombie, H.C., Ward, R.T., Schaefer, S.M., Jackson, D.C.,Holden, J.E., Perlman, S.B., 1998. Relations between PET-derived measures ofthalamic glucose metabolism and EEG alpha power. Psychophysiology 35,162–169.
Laufs, H., Kleinschmidt, A., Beyerle, A., Eger, E., Salek-Haddadi, A., Preibisch, C., Krakow,K., 2003. EEG-correlated fMRI of human alpha activity. NeuroImage 19, 1463–1476.
Lewis, P.R., Shute, C.C., 1967. The cholinergic limbic system: projections to hippocampalformation, medial cortex, nuclei of the ascending cholinergic reticular system, and thesubfornical organ and supra-optic crest. Brain 90, 521–540.
Lindgren, K.A., Larson, C.L., Schaefer, S.M., Abercrombie, H.C., Ward, R.T., Oakes, T.R.,Holden, J.E., Perlman, S.B., Benca, R.M., Davidson, R.J., 1999. Thalamic metabolicrate predicts EEG alpha power in healthy control subjects but not in depressedpatients. Biol. Psychiatry 45, 943–952.
Liu, Z., de Zwart, J.A., van Gelderen, P., Kuo, L.W., Duyn, J.H., 2012. Statistical featureextraction for artifact removal from concurrent fMRI–EEG recordings. NeuroImage59, 2073–2087.
Lopes da Silva, F.H., van Lierop, T.H., Schrijer, C.F., van Leeuwen, W.S., 1973.Organization of thalamic and cortical alpha rhythms: spectra and coherences.Electroencephalogr. Clin. Neurophysiol. 35, 627–639.
Lopes da Silva, F.H., Vos, J.E., Mooibroek, J., Van Rotterdam, A., 1980. Relativecontributions of intracortical and thalamo-cortical processes in the generation ofalpha rhythms, revealed by partial coherence analysis. Electroencephalogr. Clin.Neurophysiol. 50, 449–456.
Lorincz, M.L., Kekesi, K.A., Juhasz, G., Crunelli, V., Hughes, S.W., 2009. Temporal framingof thalamic relay-mode firing by phasic inhibition during the alpha rhythm.Neuron 63, 683–696.
Lukashevich, I.P., Sazonova, O.B., 1996. The effect of lesions of different parts of theoptic thalamus on the nature of the bioelectrical activity of the human brain. Zh.Vyssh. Nerv. Deiat. Im. I. P. Pavlova 46, 866–874.
Metzger, C.D., Eckert, U., Steiner, J., Sartorius, A., Buchmann, J.E., Stadler, J., Tempelmann,C., Speck, O., Bogerts, B., Abler, B., Walter, M., 2010. High field FMRI revealsthalamocortical integration of segregated cognitive and emotional processing inmediodorsal and intralaminar thalamic nuclei. Front. Neuroanat. 4, 138.
Michel, C.M., Lehmann, D., Henggeler, B., Brandeis, D., 1992. Localization of the sourcesof EEG delta, theta, alpha and beta frequency bands using the FFT dipoleapproximation. Electroencephalogr. Clin. Neurophysiol. 82, 38–44.
Mitra, P., Bokil, H., 2008. Observed Brain Dynamics. Oxford Univ. Press.Moosmann, M., Ritter, P., Krastel, I., Brink, A., Thees, S., Blankenburg, F., Taskin, B.,
Obrig, H., Villringer, A., 2003. Correlates of alpha rhythm in functional magneticresonance imaging and near infrared spectroscopy. NeuroImage 20, 145–158.
Morel, A., 2007. Stereotactic Atlas of the Human Thalamus and Basal Ganglia. InformaHealthcare USA, New York.
Morel, A., Magnin, M., Jeanmonod, D., 1997. Multiarchitectonic and stereotactic atlas ofthe human thalamus. J. Comp. Neurol. 387, 588–630.
Moruzzi, G., Magoun, H.W., 1949. Brain stem reticular formation and activation of theEEG. Electroencephalogr. Clin. Neurophysiol. 1, 455–473.
Niedermeyer, E., 1997. Alpha rhythms as physiological and abnormal phenomena. Int.J. Psychophysiol. 26, 31–49.
Olbrich, S., Mulert, C., Karch, S., Trenner, M., Leicht, G., Pogarell, O., Hegerl, U., 2009.EEG-vigilance and BOLD effect during simultaneous EEG/fMRI measurement.NeuroImage 45, 319–332.
Pessoa, L., Adolphs, R., 2010. Emotion processing and the amygdala: from a ‘low road’ to‘many roads’ of evaluating biological significance. Nat. Rev. Neurosci. 11, 773–783.
Saad, Z.S., Glen, D.R., Chen, G., Beauchamp, M.S., Desai, R., Cox, R.W., 2009. A newmethod for improving functional-to-structural MRI alignment using local Pearsoncorrelation. NeuroImage 44, 839–848.
Saalmann, Y.B., Kastner, S., 2011. Cognitive and perceptual functions of the visualthalamus. Neuron 71, 209–223.
Sadaghiani, S., Scheeringa, R., Lehongre, K., Morillon, B., Giraud, A.L., Kleinschmidt, A.,2010. Intrinsic connectivity networks, alpha oscillations, and tonic alertness: asimultaneous electroencephalography/functional magnetic resonance imagingstudy. J. Neurosci. 30, 10243–10250.
Sadato, N., Nakamura, S., Oohashi, T., Nishina, E., Fuwamoto, Y., Waki, A., Yonekura, Y.,1998. Neural networks for generation and suppression of alpha rhythm: a PETstudy. Neuroreport 9, 893–897.
Saper, C.B., Scammell, T.E., Lu, J., 2005. Hypothalamic regulation of sleep and circadianrhythms. Nature 437, 1257–1263.
Sauseng, P., Klimesch, W., Stadler, W., Schabus, M., Doppelmayr, M., Hanslmayr, S.,Gruber, W.R., Birbaumer, N., 2005. A shift of visual spatial attention is selectivelyassociated with human EEG alpha activity. Eur. J. Neurosci. 22, 2917–2926.
Sherman, S.M., Guillery, R.W., 2006. Exploring the Thalamus and Its Role in CorticalFunction. MIT Press, Cambridge, MA.
Sherman, S.M., Guillery, R.W., 2011. Distinct functions for direct and transthalamiccorticocortical connections. J. Neurophysiol. 106, 1068–1077.
Shipp, S., 2003. The functional logic of cortico-pulvinar connections. Philos. Trans. R.Soc. Lond. B Biol. Sci. 358, 1605–1624.
Shute, C.C., Lewis, P.R., 1967. The ascending cholinergic reticular system: neocortical,olfactory and subcortical projections. Brain 90, 497–520.
Smith, S.M., Jenkinson, M., Woolrich, M.W., Beckmann, C.F., Behrens, T.E., Johansen-Berg, H., Bannister, P.R., De Luca, M., Drobnjak, I., Flitney, D.E., Niazy, R.K., Saunders,J., Vickers, J., Zhang, Y., De Stefano, N., Brady, J.M., Matthews, P.M., 2004. Advancesin functional and structural MR image analysis and implementation as FSL.NeuroImage 23 (Suppl. 1), S208–S219.
Smith, A.T., Cotton, P.L., Bruno, A., Moutsiana, C., 2009. Dissociating vision and visualattention in the human pulvinar. J. Neurophysiol. 101, 917–925.
Snow, J.C., Allen, H.A., Rafal, R.D., Humphreys, G.W., 2009. Impaired attentionalselection following lesions to human pulvinar: evidence for homology betweenhuman and monkey. Proc. Natl. Acad. Sci. U. S. A. 106, 4054–4059.
Steriade, M., 1993. Central core modulation of spontaneous oscillations and sensorytransmission in thalamocortical systems. Curr. Opin. Neurobiol. 3, 619–625.
Steriade, M., 1996. Arousal: revisiting the reticular activating system. Science 272,225–226.
Steriade, M., McCormick, D.A., Sejnowski, T.J., 1993. Thalamocortical oscillations in thesleeping and aroused brain. Science 262, 679–685.
Thut, G., Nietzel, A., Brandt, S.A., Pascual-Leone, A., 2006. Alpha-band electroenceph-alographic activity over occipital cortex indexes visuospatial attention bias andpredicts visual target detection. J. Neurosci. 26, 9494–9502.
vanDijk, H., Schoffelen, J.M., Oostenveld, R., Jensen,O., 2008. Prestimulus oscillatory activityin the alpha band predicts visual discrimination ability. J. Neurosci. 28, 1816–1823.
Wilke, M., Mueller, K.M., Leopold, D.A., 2009. Neural activity in the visual thalamusreflects perceptual suppression. Proc. Natl. Acad. Sci. U. S. A. 106, 9465–9470.
Wilke, M., Turchi, J., Smith, K., Mishkin, M., Leopold, D.A., 2010. Pulvinar inactivationdisrupts selection of movement plans. J. Neurosci. 30, 8650–8659.
Yang, L., Liu, Z., He, B., 2010. EEG–fMRI reciprocal functional neuroimaging. Clin.Neurophysiol. 121, 1240–1250.
Zhang, D., Snyder, A.Z., Fox, M.D., Sansbury, M.W., Shimony, J.S., Raichle, M.E.,2008. Intrinsic functional relations between human cerebral cortex and thalamus.J. Neurophysiol. 100, 1740–1748.