finding optimal measures of core inflation in the...
TRANSCRIPT
Economics Education and Research Consortium Working Paper Series
ISSN 1561-2422
αааа
No 04/01
Finding Optimal Measures of Core Inflation in the Kyrgyz Republic
Ainura Uzagalieva
This project (00-450) was supported by the Economics Education and Research Consortium
All opinions expressed here are those of the author
and not those of the Economics Education and Research Consortium
Research dissemination by the EERC may include views on policy, but the EERC itself takes no institutional policy positions
Research area: Macro, Financial Markets and Open Economy Macro
JEL Classification: E31, E52 UZAGALIEVA A.A. Finding Optimal Measures of Core Inflation in the Kyrgyz Republic. — Moscow: EERC, 2004. — pp 1–37.
The ideal measure of inflation reflects long-run price movements driven by actual demand in the economy and excludes short-term supply shocks. Considering that CPI does not correspond to such a measure, the purpose of this research is to analyze alternative methods of core (or underlying) inflation and to determine the efficient measure of core inflation suitable for the Kyrgyz Republic. The results of the project are intended for the National Bank of the Kyrgyz Republic (for proper monetary policy reaction to inflationary shifts), the Ministry of Finance (for budget forecasting), for the National Statistics Committee (the concept of core infla-tion does not yet exist in the Kyrgyz economic reporting system).
Keywords. Kyrgyz Republic, inflation, core inflation, monetary policy, smoothing, optimality criteria.
Acknowledgements. The author is grateful to Michael Beenstock, Wojciech W. Charemza, Jacek Cukrowski, Barry Ickes, and Laura Menz for helpful comments, advises and discussions.
Ainura Uzagalieva CASE-Kyrgyzstan, Researcher Monetary policy, macroeconomic modeling P.O.Box # 696, 720017 Bishkek, Kyrgyz Republic E-mail: [email protected]
A.A. Uzagalieva 2004
СОДЕРЖАНИЕ
1. INTRODUCTION 4
2. STATEMENT OF PURPOSE AND PRACTICAL IMPORTANCE 6
3. REVIEW OF LITERATURE/CONCEPTUAL FRAMEWORK 8
4. CPI AS A MEASURE OF INFLATION IN THE KYRGYZ REPUBLIC 9
5. MODEL SPECIFICATION AND ESTIMATION RESULTS. STATISTICAL APPROACH 12
5.1. Core inflation definition 12 5.2. Exclusion Method 13 5.3. Trimmed Means Method 14 5.4. Standard Deviation Trimmed Means Method 15 5.5. Percentile method 16
6. FINDING OPTIMAL MEASURES 17
7. CONCLUSION 20
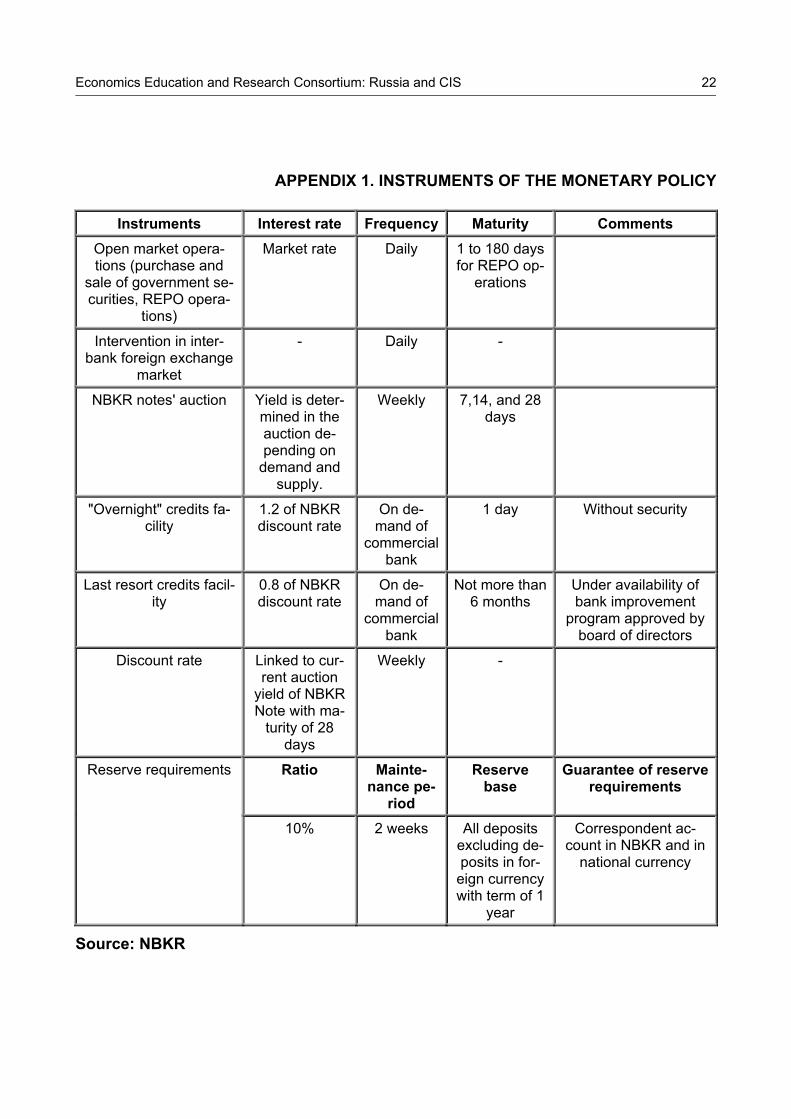
APPENDIX 1. INSTRUMENTS OF THE MONETARY POLICY 22
APPENDIX 2. TABLES 23
APPENDIX 3. FIGURES 28
REFERENCES 36
Economics Education and Research Consortium: Russia and CIS
4
1. INTRODUCTION
Inflation is one of the key issues of macroeconomic instability in transition countries, as it has a strong influence on many economic indicators such as the state budget, exchange rate, interest rate, wages, and level of poverty. Moreover, high inflation undermines the general trust in the political and economic system, impacting on the inflow of direct invest-ments. The success and efficiency of monetary policy in terms of inflation stability depends on whether inflation measure reflects long-term price movements or includes short-term structural shocks as well.
The most popular inflation measure in transition economies is the consumer price index (CPI), which is the average weighted of the set of goods and services included in a con-sumer basket. Such an inflation measure is impacted by both monetary and non-monetary factors. However, if the impact of non-monetary factors is strong, it can lead to significant vulnerability in price changes, raising the question of whether inflation is the result of a persistent, long-term trend or reflects only short-term shifts in prices. If an inflation meas-ure contains short-term shifts it can significantly complicate the task of controlling inflation for policymakers. Therefore, it is important to distinguish long-term price movement, which is driven by actual demand in the economy and does not respond to various short-term shocks.
The inflation measure that reflects long-term price movements, called core inflation, is de-fined as the sustained change of prices induced by monetary factors. The basic motivation for using core inflation is to ignore short-term price shifts of a temporary nature and to con-sider steady inflation. Considering that CPI does not correspond to such a measure, the purpose of this study is to analyze alternative methods of measuring core inflation and to determine the efficient measure of core inflation in the Kyrgyz Republic (KR).
One of the key decisions the government of KR took to eliminate hyperinflation at the be-ginning of the 1990s was the introduction of a national currency1 (KGS) under the floating exchange rate regime. As a result, a typical two-tiered banking system, including the cen-tral bank and commercial banks, was established. According to the law2 on the National Bank of the Kyrgyz Republic (NBKR), the main purpose of the central bank is to control in-flation, which is measured by CPI. NBKR influences the money market through the tradi-tional instruments of monetary policy. Nowadays the most actively used instrument of monetary policy in KR is open market operations (see Appendix 1). The exchange rate is
1 The national currency was introduced on May 10, 1993. 2 The policy-making board of the central bank is insulated from politicians and is given exclusive power in setting the instruments of monetary policy in order to maintain a primary goal, price stability.
Economics Education and Research Consortium: Russia and CIS
5
freely determined on the basis of spot and other exchange rates3 on the foreign exchange market4.
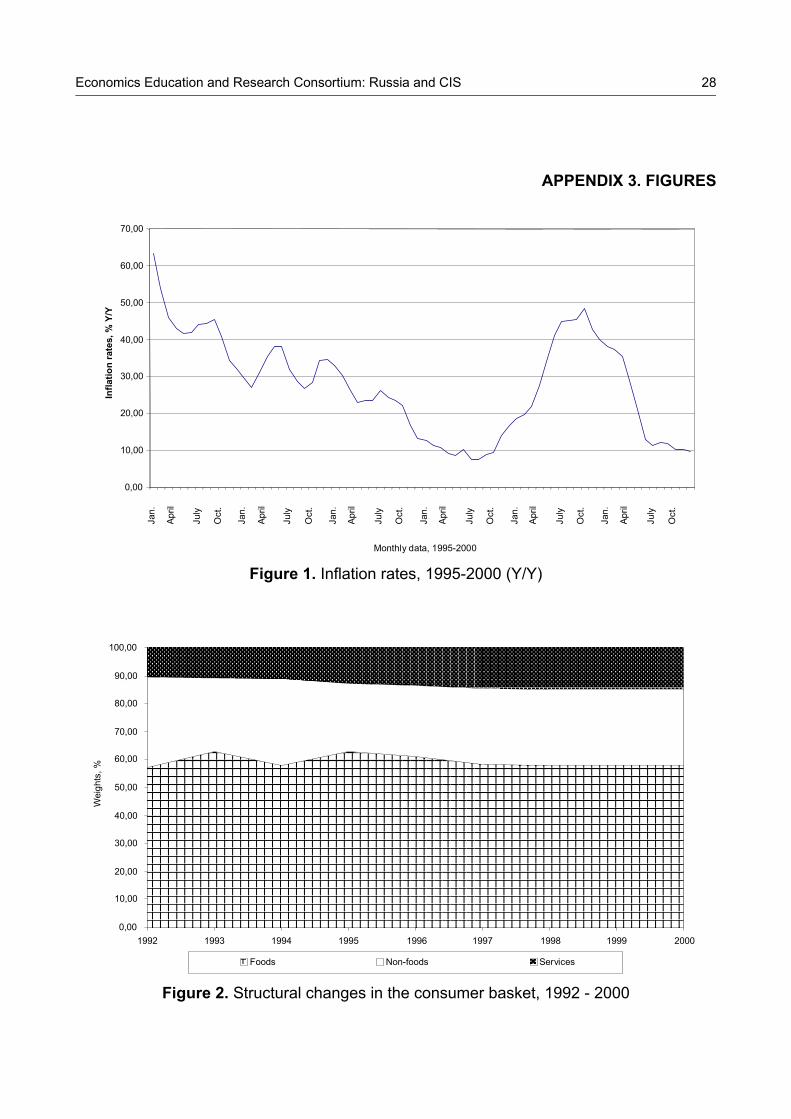
The importance of measuring core inflation in KR stems from the fact that high volatility and irregular fluctuations (see Figure 1, Appendix 3) characterize the dynamic of CPI. Moreover, non-monetary factors, to which NBKR basically does not react or is not capable to influence, have a strong impact on CPI. The key sources of such factors in KR are the high share of agriculture in the economy, structural changes in the economy, the change of state-controlled prices and tariffs, periodicity or delays in price records, exchange rate fluctuations, and a high dependence on energy prices and energy products (oil products, fuel, natural gas and others).
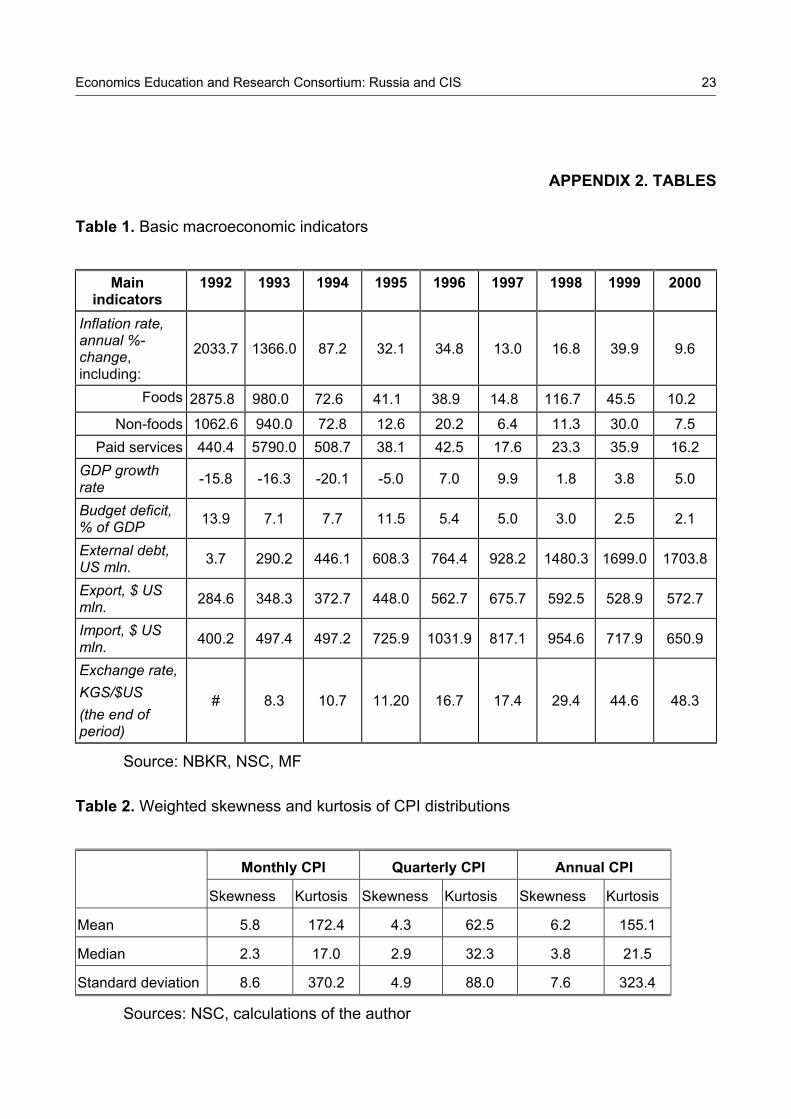
As Table 1 (see Appendix 2) shows, the period of severe hyperinflation and deep struc-tural imbalances is 1992-1994, when annual inflation reached the four-digit level as the immediate result of trade and price liberalization, and the introduction of value added tax. KGS depreciated by almost 3 times over this period. During the period 1995-1997 inflation declined to the two-digit level and most macroeconomic indicators improved significantly. However, in 1998 the economy was heavily hit by an external factor, the financial crisis in Russia, which intensified an internal crisis potential and led again to high inflation. Accord-ing to NBKR5, the effect of monetary policy measures taken to reduce inflation in 1998-1999 was displaced by the influence of non-monetary factors beyond the control of NBKR. As the crisis events faded, prices began to stabilize and the improvement of the external conditions regarding KR in 2000 contributed to inflation reduction. For the period of Janu-ary-December 2000, the inflation rate was 9.6%, compared to 39.9% for the same period in the previous year.
The high volatility of CPI is amplified by the fact that it contains as a cumulative index changes in the prices of all goods in the basket, both independent and related6. Because the weights of individual components in the consumer basket are used as the basis, the prices of goods with greater weights (especially if goods are very sensitive to structural shocks), have a larger degree of influence on the aggregate CPI. Hence, if changes in in-dividual prices are too sensitive to non-monetary factors i.e., to factors that are beyond NBKR direct control, then CPI also reacts with a similar sensitivity to the factors that do not reflect the basic inflation trend and, thus, cause short-term price fluctuations. Thus, it is
3 Pursuant to the Law of the Kyrgyz Republic "On Operations in Foreign Exchange" as of 05.07.95, No 7-1, Article 7. The activity of NBKR on the foreign exchange market is limited to the extent of smoothing abrupt fluctuations in the exchange rate, while keeping international reserves at an adequate level. 4 Between 1997– 1998 the exchange rate was determined on the basis of NBKR’s auctions. 5 see Annual report of NBKR (1998). 6 Independent goods in the consumption basket are those goods, whose prices do not contain the prices of other goods, for example “bread” and “shoes”. Related goods are those, whose prices contain the prices of other goods, for example “bread” and “flour”.
Economics Education and Research Consortium: Russia and CIS
6
obvious that CPI, which is the weighted mean of individual prices (independent and re-lated), does not correspond to the ideal inflation measure. Therefore, while CPI has be-come the most popular inflation measure, it is not the ideal measure of inflation caused by monetary factors.
Undoubtedly, increases in prices caused by the specific factors mentioned above lead to the increase of CPI. And, if CPI increases beyond permissible limits, NBKR will tighten its monetary policy. So, there is the question of whether the action of NBKR in a given situa-tion is correct. Evidently, the presence of shocks, which are directly or indirectly included in CPI, significantly complicates the main objective of NBKR to control inflation. As a whole, CPI is a rather weak indicator for measuring the basic inflation trend due to high volatility and seasonal patterns. This fact especially applies to monthly and quarterly CPI data, which is characterized by huge fluctuations. In this respect the main purpose of measuring and using core inflation in KR is to exclude exogenous factors from the general inflation signal.
The paper consists of seven sections. In section 2 the main purpose, objectives and prac-tical importance of the study are presented. Section 3 provides a brief overview of the theoretical background for measuring core inflation. Section 4 deals with information on the system of CPI measurement in KR and the behavior of individual prices within CPI. In section 5 and 6 alternative methods of core inflation measurement and the criteria of opti-mality are explored. Section 7 summarizes the main findings and concludes with general remarks.
2. STATEMENT OF PURPOSE AND PRACTICAL IMPORTANCE
The purpose of the present study is to analyze the alternative methods of measuring core inflation and to determine the most efficient measure of core inflation in KR. The analysis and tests of KR inflation data are based on the statistical approach, including four alterna-tive methods as follows: 1. Exclusion Method; 2. Trimmed Means Method; 3. Standard Deviation Trimmed Means Method; 4. Percentile Method.
The accuracy of inflation measures derived on the basis of these methods is assessed in accordance with optimality criteria. Since there are no formal criteria by which the accu-racy of core inflation measure can be assessed, it is reasonable to choose the criteria based on their suitability to monetary purposes. The literature considers the following im-portant attributes or criteria desirable for core inflation (Wynne 1999). The suitability of core inflation as the indicator of current and future inflation is necessary. This implies that the ideal inflation measure is a smooth measure that closely approximates the general in-
Economics Education and Research Consortium: Russia and CIS
7
flation trend. Timeliness and computability in real time is another important issue, so that history does not change much upon including new data. It should be transparent enough for the public and policymakers. This attribute suggests that the public might challenge a measure which excludes too many goods from the consumer basket as it can significantly deviate from the true cost of living index. In addition, the core measure should follow the same trend as the headline inflation, i.e. there should be a close relationship between the measured inflation and the core.
Taking into account the above-mentioned attributes, the property of smoothness receives the main attention in this paper. This property is examined by minimizing the deviation of derived inflation measures around a long-run inflation trend using the root mean square er-rors (RMSE) and the mean absolute deviation (MAD). The benchmark trends, which are chosen as the long-run inflation trends, are the Hodrick-Prescott filter with the parameter of smoothing 10, and the linear combination of centered moving average with 12 months and Hodrick-Prescott filter with the parameter of smoothing 35.
The basic idea of using a core inflation measure in KR is to consider long-term and steady inflation while ignoring short-term price movements, which tend to have a temporary na-ture. In this respect the main purpose of measuring and using core inflation in KR is to ex-clude exogenous factors from the general inflation signal. From the viewpoint of monetary policy objectives, the core inflation measure would be a better and more useful tool than CPI for NBKR. This stems from the fact that core inflation is a more suitable indicator for estimating current and, thus, future inflation.
Measuring core inflation is an important issue for NBKR as it carefully monitors all avail-able indicators for effective decision-making, and processes a large volume of information that covers all sectors in the economy. The use of the core inflation measure would allow NBKR to filter out and reject irrelevant information, such as temporary price shifts, from steady inflation. Besides, as monetary policy has a lagged effect on inflation NBKR, as any central bank, is more concerned with the behavior of inflation in the future periods than in the current period. Hence, retrospective inflation that is smoothed enough can be the best information source of future inflation. Consequently, using the core inflation measure would enable to define valid inflationary signals in newly processed data and minimize er-roneous elements that could essentially distort the future trend.
The results of the study are intended, primarily, for NBKR to improve the efficiency of monetary policy, i.e. to ensure information that is necessary for elaborating proper and cor-rect reactions to price changes. Core inflation does not yet exist in the economic reporting of KR. Thus, results are also important for the National Statistics Committee of KR (NSC) to expand inflation parameters published in periodicals, and for the Ministry of Finance (MF) of KR for budget forecasting.
Economics Education and Research Consortium: Russia and CIS
8
3. REVIEW OF LITERATURE/CONCEPTUAL FRAMEWORK
Inflation is a key problem in the economies of both developing (Blejer 1983) and advanced countries (Fischer 1982). As it was already mentioned, inflation is a crucial problem in the economies of transition as well (Blejer and Skreb 1997; Koen and De Masi 1997). There are scores of textbooks and scientific papers devoted to this problem. As an example of these studies we shall indicate the following classical positions: Theil (1967), Fischer (1981), or Ball and Mankiw (1994, 1995).
The problem of measuring core inflation is rather new; for the first time it was described in detail at the beginning of the 1980s by Eckstein (1981). In the 1990s inflation targeting be-came an overall objective for the majority of central banks worldwide and the problem of measuring core inflation became even more urgent. Today, there is a wide literature con-cerning the measure of core inflation. For example, research on measuring core inflation in the United States and Canada are presented by Bryan and Cecchetti (1993, 1994), Bryan, Cecchetti and Wiggins (1997), Cecchetti (1995,1996), and Claus (1997). Core inflation in Western Europe is widely described by Quah and Vahey (1995), Blix (1995), Bjornland (1997), Claus (1997), Dewachter and Lustig (1997), Fase and Folkertsma (1998), and Gartner and Wehinger (1998). The research of core inflation in New Zealand is presented by Roger (1994,1995,1997). At the end of the 1990s, the first work on core inflation ap-peared in the countries of transition (Wozniak 1999; Charemza, Makarova and Par-chomenko 2000).
The methodology of measuring core inflation described in the cited literature can be di-vided into two different approaches: one is based on statistical methods of analysis, and which receives primary focus in this paper. The other approach, the modeling approach, focuses on a conceptual problem – the problem of defining core inflation. The approach based on statistical methods was provided initially in the papers of Cecchetti (1996), Bryan and Cecchetti (1993, 1994), and Bryan, Cecchetti and Wiggins (1997) and tested later on in transition countries by Wozniak (1999).
In a common view of statistical methods, there are two basic categories of problems inher-ent in the time series of prices, noise and bias. Noise refers to all temporary shocks which do not impact prices in the long run and fade away with time; however, such shocks have a strong influence on prices in the short-term period, particularly when time series with shorter frequencies (month, quarter) are analyzed. Bias is related to a change in weights or to measurement errors. The first arises under CPI calculation based on permanent weights (as CPI in KR is calculated on the basis of constant weights, this study does not consider change in weights). The measurement errors arise from the possibility of mis-takes when recording the price of a good. In the literature, four alternative methods of de-fining core inflation are described, i.e., the exclusion method, the trimmed means method, the standard deviation trimmed means method, and the percentile method.
Economics Education and Research Consortium: Russia and CIS
9
The exclusion method omits certain categories or whole groups of goods and services from CPI, prices of which are traditionally highly sensitive to supply shocks and are usually self-transient. Such categories are, for example, agricultural goods, electric power, natural gas, other kinds of fuel, and tobacco. This method zeros out the weights of goods to be excluded when calculating the weighted average. The trimmed means method is the sys-tematic exclusion of the largest jumps in prices no matter to what group of goods they be-long. The standard deviation trimmed means method is based on the exclusion of all ex-traneous price jumps or falls on a period-by-period basis if in a given period some prices increased or decreased too strongly compared to all identical periods. The details are con-sidered in Bryan, Cecchetti and Wiggins (1997), Wozniak (1999). Lastly, the percentile method aims at achieving the unbiased estimator, at which the expected value of the esti-mator is equal to the parameter itself. Since the sample mean is the unbiased estimator of the theoretical mean, the percentile of empirical probability distribution around the true av-erage value (approximately corresponds to sample mean) should be an unbiased estima-tion in distributing average as well (Roger 1997; Wozniak 1999 ).
4. CPI AS A MEASURE OF INFLATION IN THE KYRGYZ REPUBLIC
The official inflation data of KR can be obtained in NSC through publications7 and Web-Pages (http:\\nsc.bishkek.su). The price indexes published by NSC include the producer price index, the agricultural price index, and the consumer price indexes. These indexes are calculated using price observations registered in seven regions of the country, includ-ing 6 prefectures and the capital. The number of observations is selective and ranges from 8 to 10 thousand prices in 1032 enterprises in the retail trade and services every month. Inflation in KR is measured with CPI by the Laspeyres formula as:
=
=
=∑
∑
0 00
1
0 0
0
CPI
tKi
i it i i
K
i ii
pp qp
p q (1)
The consumer basket of the average city dweller in KR includes at present 343 goods (K=343) and services, which are divided into three large groups - foods, non-foods and paid services. The weights of the index (qi
0, i=1,2, …,K) are determined on the basis of ac-
tual consumer expenses in the basis period. The structure of these expenses is estab-
7 See for example the quarterly publication of “Price indexes in Kyrgyz Republic ”
Economics Education and Research Consortium: Russia and CIS
10
lished by the state budget inspections over the whole population of KR. Currently the weights of 1998 are used as the basis index8.
NSC KR changed the structure of the consumer basket three times. The first change took place in 1995 when the Parliament of KR altered the minimum level of the consumption budget. The next change was in 1998 when it included services in the consumer basket (education, public health and notary offices) as separate observations. And, in 2001 the number of components in the basket was increased from 305 to 343. During 1992-1998 the share of paid services increased from 11% to 15%, the share of non-foods decreased from 32% to 27%, and the share of foods stood at the level of 1992, which accounts for 58%. The structural change of the consumer basket for 1992-2000 is presented in Figure 2 (see Appendix 3).
The sample of CPI used in this paper covers 305 categories of consumer goods for the period of July, 1995-December, 2000. CPI is presented as the weighted average of indi-vidual CPIs of 305 components, i.e.:
π=
= ∑ , ,1
CPIK
t i t i ti
w , (2)
where wit is the weight of i’s component of CPI in period t, and πit is individual inflation of i‘s component in period t.
The wi,t in formula (2) is defined as
−
−=
=
∑
0, 1
,0 0, 1
1
i t ii t K
j t jj
p qw
p q. (3)
which means that wi,t is not a constant, but depends on the period chosen as the basis. There are several possibilities: (1) previous month, (2) December of the previous year, and (3) an appropriate month or period of the previous year. The constants are qi’s, which rep-resent the structure of actual consumption expenses in the basis period. Consequently, under the calculation of monthly CPI the weights wi,t change every month because abso-lute and relative prices change every month. The same phenomenon occurs when the quarterly inflation rates are calculated.
To see the rationale for determining core inflation or long–run inflation measure in KR, it is necessary to obtain the picture of individual CPI distributions for all components; in statisti-cal terms it is necessary to calculate the descriptive statistics of those distributions, i.e.:
8 1998=100, this is based on the data inspected in the household budget.
Economics Education and Research Consortium: Russia and CIS
11
Mean: π=
Π = ∑1
Km mt it it
jw ; (4)
Variance: π=
= − Π −∑1
( )K
m m m rrt it it t th
jm w k ; (5)
Skewness: = 3 / 23 2/( )m m m
t t tS m m ; and (6)
Kurtosis: = 24 2/( )m m m
t t tK m m . (7)
The necessity to calculate these moments stems from the fact that they give a basic in-tuition on how individual price changes contribute to the general inflation level. Since the data of KR contain a seasonal pattern that has a period of approximately 12 months, first differencing between periods t and t-12 with monthly data is applied. This allows to de-crease variance caused by the seasonal pattern. Consequently, at a monthly frequency the above-mentioned statistical moments are calculated using the annualized monthly (Y/Y) data, and at quarterly frequency - using the quarterly data (Q/Q). When plotting the distributions of individual price changes in CPI, the weights of the consumption basket are used as the number (or frequency) of having equally weighted individual inflation compo-nents in total CPI. In other words, the weights represent the probability of having a certain level of individual inflation rate in the total CPI. The results of calculations, i.e. the descrip-tive statistics of monthly, quarterly and annual distributions of individual inflation rates are shown in Table 2 (see Appendix 2).
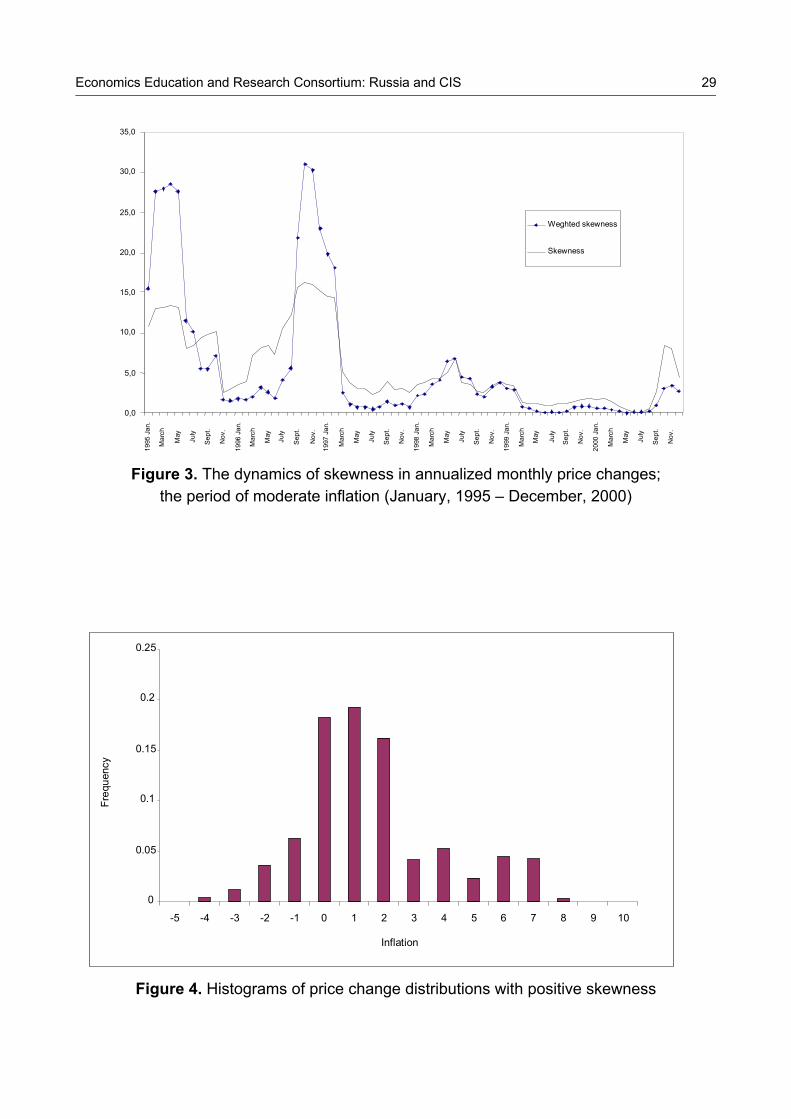
As Table 2 (see Appendix 2) shows, the skewness and kurtosis are characterized by the high level of means and medians. According to the literature, price distributions are normal if they are characterized by the kurtosis equal to 3. However, in the case of KR, the aver-age values of kurtosis at each frequency are much higher than 3, meaning that the sample distributions are not normal. Such price distributions (high kurtosis and excess positive skewness) are the evidence of big price jumps, which dominate the inflation process. To see a more accurate picture of price distributions on the basis of KR data, the dynamic of weighted and unweighted skewnesses is drawn on the basis of annualized monthly infla-tion rates (see Figure 3, Appendix 3).
Figure 3 (see Appendix 3) further demonstrates that the peak of skewnesses is marked in 1996, while the second highest point occurs in 1995. In all subsequent years (except 2000), there is a clear tendency of declining the coefficient of skewness; however, price distributions remain positively skewed. The shape of price distributions, in particular, high points indicated in Figure 3 show the fact that large price adjustment processes in the economy of KR took place in 1995 and 1996. Such shapes indicate just how sensitive in-flation is to various shocks in the economy. The distribution of prices is asymmetric if the inflation level is sensitive either to positive or negative shocks in the economy. For exam-
Economics Education and Research Consortium: Russia and CIS
12
ple, if the distribution of individual prices is symmetric, the effects of positive and negative shocks equal each other and they do not cause increase in inflation. However, if individual price distribution is asymmetric, that means that shocks in the economy have a consider-able impact on prices and, thus, the general inflation level.
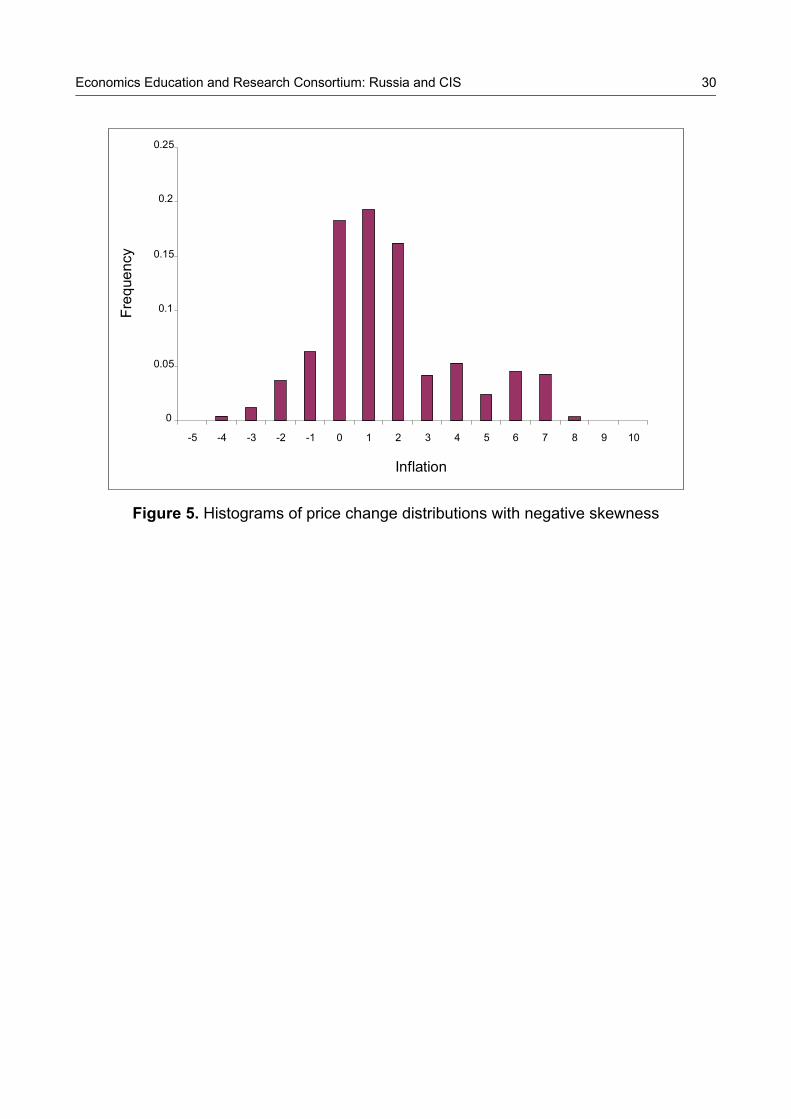
Figure 4(a) (see Appendix 3) illustrates the case when distribution of prices is skewed to the right, which means that CPI level increases as the number of relatively large price in-creases prevails over the number of small price increases (positive coefficient of skew-ness). On the contrary, Figure 4(b) (see Appendix 3) demonstrates that in the case of negative skewness, when price distribution is skewed to the left or when the number of components with large price jumps is dominated by the number of components with small price increases (or decreases), then CPI level reduces. In general, the dynamics of prices within CPI, in particular, strongly asymmetric price distributions, indicate the fact that CPI has high sensitivity to the factors that cause short-term shifts in prices.
5. MODEL SPECIFICATION AND ESTIMATION RESULTS. STATISTICAL APPROACH
5.1. Core inflation definition
As it is described in the previous section, the time series of CPI in KR are characterized by high jumps and short-term shifts or by noises and bias. Cecchetti (1996) provides a rather simple technique, connecting the above-mentioned concepts into the formulas in several steps:
A change in the price of individual good in the consumer basket (i) is defined by the for-mula
= + ,, t i ti tp P x , (8)
where tP is a trend change and a most suitable measure of core inflation, and ,i tx is a relative inflation, which reflects simultaneous burst caused by the change of price of an in-dividual component in the consumer basket.
CPI is the weighted average of all basket components, i.e.
π = ∑ , ,t i t i ti
w p , (9)
Summing up the above mentioned equations, we receive
π = +∑ , ,tt i t i ti
P w x , (10)
Economics Education and Research Consortium: Russia and CIS
13
where the second term represents the group of noises (nt) and bias (bt) tied to core infla-
tion tP for all t, more precisely:
π − = = +∑ ,,t i tt i t t ti
P w x n b , (11)
where nt is a stationary noise with zero mean and bt is a displacement (bias) that could be represented as bt = µb +ωt (µb and ωt are the bias of measurements and weights, respec-tively).
If to determine the inflation of an individual component i in k period as
+ −= , ,
,,
i t k i tki t
i t
p pp
p, (12)
then the result we shall receive will be the following specification of inflation
π µ ϖ +=
= + + +∑1( )
kk kt t b t j t
jP n . (13)
The bias of weights ωt is not considered in KR. At rather large value of k (considering the assumption of zero average value of noise), nt cancel out with each other and the last component turns to zero. The bias of µb measurements can be derived from existing data. Core inflation measure is defined on the basis of the above mentioned four alternative methods.
5.2. Exclusion Method
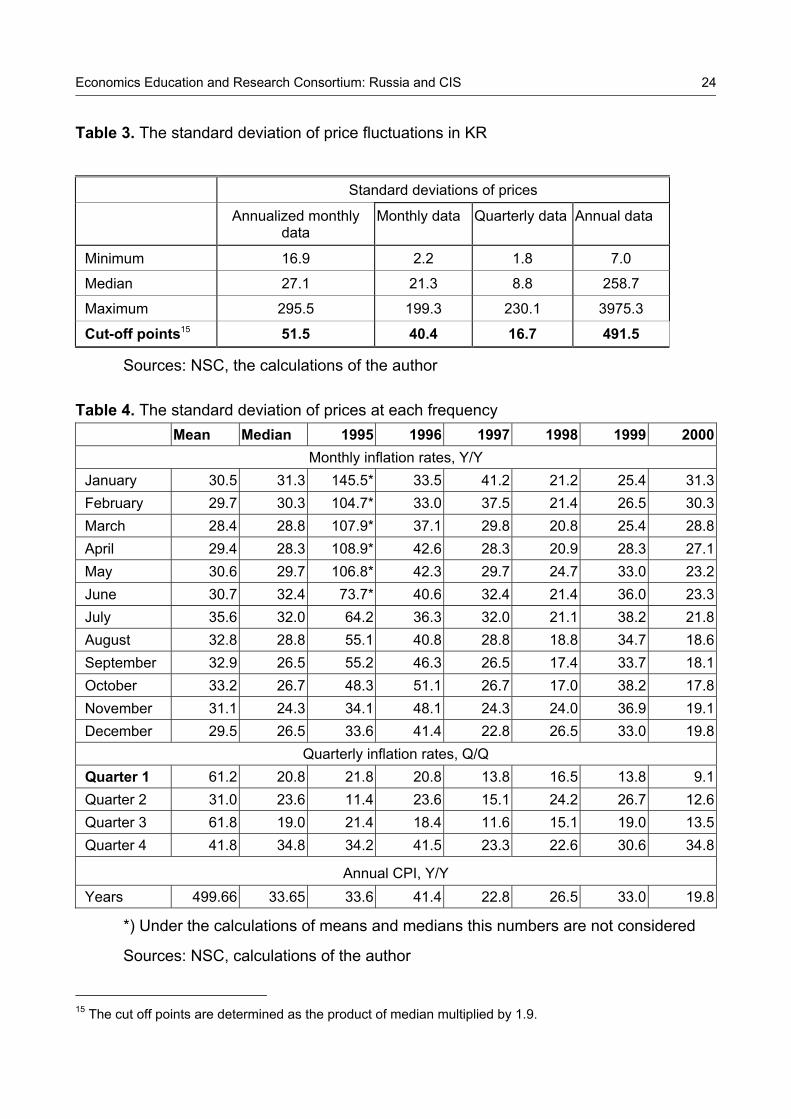
The preliminary analysis of individual price changes in KR for the period 1995 to 2000 shows significant price fluctuations. The standard deviations of individual price changes within CPI calculated at each frequency fluctuate in a very wide range (see Table 3, Ap-pendix 2). Given large differences among these deviations and the seasonal pattern in the data it is found reasonable to exclude components from CPI based on the annualized monthly data (Y/Y). The cut-off points for excluding individual components are defined as the product of the median level of standard deviations and 1.9. This would enable one to exclude too volatile components from the basket. The cut-off point for the annualized monthly inflation is 51.5. Therefore, the components, whose standard deviations exceed this cut-off point, are excluded from CPI.
Goods with the highest standard deviation of prices are, mainly, agricultural products, en-ergy products, and imported consumer goods. The total number of goods excluded from the basket is 26. These goods included seasonal goods (fruits and vegetables), rental fees (rent, water, electricity, repairs, etc.), and imported goods (perfumes, cosmetics, deter-
Economics Education and Research Consortium: Russia and CIS
14
rence, etc.). The exclusion of these components from the basket provides a significant im-provement in the inflation measure, however the suitability of this method to the conditions of KR as questionable. The reason for this is the fact that due to the high share of agricul-ture in the economy of KR policymakers pay a great attention to the seasonal factors of price changes. Besides, expenses on foods, energy and rental fees, which are excluded from the basket, compose the largest portions of families’ budget. Under these circum-stances, the intuitive exclusion of components from the basket might increase the chances of loosing important information and make the concept of core inflation too suspicious for the public.
5.3. Trimmed Means Method
A motivation behind the trimmed means method is both economic and statistical. The eco-nomic motivation is mainly related to the dynamics of relative prices, which temporarily af-fect the aggregate price level, causing upward or downward short-term shifts. The statisti-cal argument is related to the problem of statistical inference. One of the important prob-lems in the statistical inference is point estimation, according to which the value of unknown parameter is estimated on the basis of the observed sample values of CPI1, CPI2,…, CPI305 . Point estimation admits two problems: (1) to devise some means for ob-taining statistics to be used as an estimator; and (2) to select benchmark or criteria for de-fining the “best” estimator among many possible estimators.
A common and simple estimator that puts less weight on observation in the tails of the dis-tribution is the trimmed mean (Wozniak 1999). The method is based on a regular removal of the greatest jumps in prices no matter what group of goods they fall in. By zeroing out weights, the maximal and minimal deviations are excluded from a range of price fluctua-tions in a given period of time, and then the weighted average of the rest is calculated. This method allows one to lower the undesirable properties of sample mean (such as maximal dispersion, bias, abnormal distribution), and therefore, it has attracted the atten-tion of majority central banks in the world during last years. An intuitive explanation: the sample mean gives a distorted estimation of true inflation due to extraneous price distur-bances. Therefore, this approach argues for the symmetric exclusion of a given percent-age of data with extreme jumps (minimum and maximum) from the distribution of prices.
If distribution is symmetric relatively to average prices, the exclusion of extreme means does not change a sample mean. But, if the distribution is asymmetric, exclusion changes a sample mean upward (positive asymmetry) or displaces it downwards (negative asym-metry). The positive asymmetry specifies that distribution is skewed towards positive val-ues, and the negative asymmetry specifies that distribution is skewed towards negative values. If the distributions of prices were approximately normal, then the sample means from that distribution could be the best estimator of the true mean, because it would be unbiased and efficient. But, because the population distributions of CPI changes is non-
Economics Education and Research Consortium: Russia and CIS
15
normal, not known, and vary over time, as in the case of KR, finding a good estimator is problematic. Therefore, using the fact that sample mean in fact is a function of the random variables CPI1,…,CPI305 and considering that theoretically the distribution of sample mean can be found through using two characteristics of distributions, the mean and variance, which do not depend on the density f(.), the trimmed mean estimators, which are devised from means, are examined and compared.
To find the efficient trims, the CPI distributions are trimmed at monthly frequency using the annualized data after one, 12-month differencing, i.e., between t and t-12 periods. Accord-ing to the technique, which is in detail described and tested by Wozniak (1999), Berkmen (1999), and Nyman (1999), the components of CPI are ordered in ascending order (CPI1, …, CPI305) with their appropriate weights (w1,…,wn). Then, Wi is defined as a cumu-lative weight from 1 to i as Wi = ∑wi
j, in order to determine the set of observations for aver-aging, i.e., i’s such that:
α/100 < Wi < (1 – α/100), (14.1)
and this is called Iα From Iα, the weighted trimmed mean can be calculated as
χα = (1/ (1– 2α / 100)) ∑I∈Iα wI* CPIi (14.2)
which can be presented in two special cases: the sample mean, χ0; and the sample me-dian, χ50.
This procedure is performed with the 1% step of trimming, starting from 1% of observation and ending with 49% from both tails by the weights of the consumer basket. By sorting derived means according to RMSE and MAD there are better performing measures are chosen, which are trimmed means obtained after excluding 3%, 6%, and 14% of observa-tion from both tails of distributions.
5.4. Standard Deviation Trimmed Means Method
The basic idea of the method is to omit in a given period all price jumps or falls that are more remote in comparison to the change of prices in the corresponding periods of all years. Thus, for measuring core inflation, the extraneous jumps or falls of prices are ex-cluded from the distribution of individual price changes. At the same time, it is quite possi-ble, that jumps can be thrown out asymmetrically. For example, if in any period, there was a strong inflation resulted from a sharp jump in certain prices (i.e., distribution is skewed towards positive values), then exclusion will eliminate variables only at the one end. Only large jumps are thrown out, leaving for averaging only those that are below the average level of price fluctuations. The details are described in Bryan, Cecchetti and Wiggins (1997), Wozniak (1999).
The literature suggests eliminating all observations, which lie beyond the standard devia-tion range of one to three from the mean. The reason for this is that the normally distrib-
Economics Education and Research Consortium: Russia and CIS
16
uted variables contain 68.2% of observations within one standard deviation from the mean, 95.4% of observation within two standard deviation from the mean, and 99.8% of observa-tion within three standard deviation from the mean (Wozniak, 1999). Thus, it is suggested to exclude outlier price jumps or falls on period-by-period basis.
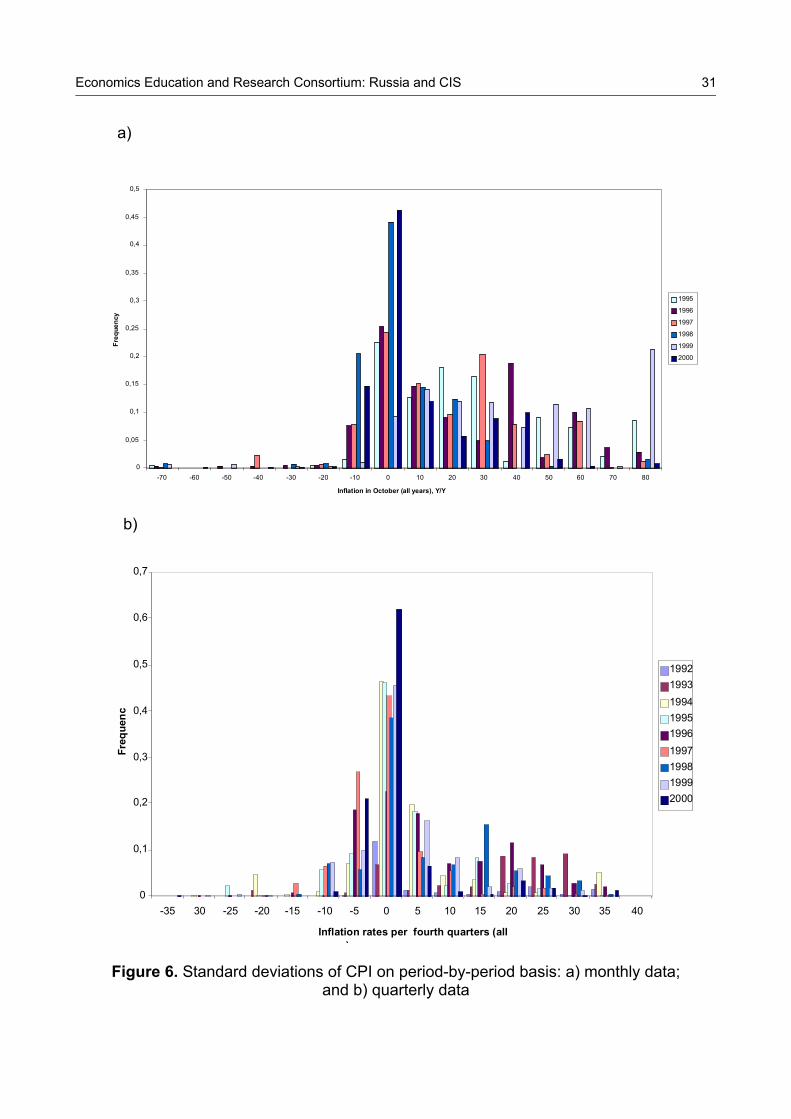
To find the cut of points for the CPI data of KR, first the standard deviations of individual price changes within CPI are calculated on period-by-period basis (see Table 4, Appendix 2). We should remark that the standard deviations of price changes have a very wide range at all frequencies. The examples of standard deviations on period by period basis are presented in Figure 6 (see Appendix 3). The median of standard deviations ranges from 28.4 to 35.6 for annualized monthly data (Y/Y), from 19 to 35 for quarterly data (Q/Q), and from 33.6 for annual data (Y/Y). However the range of the means of standard devia-tions at the same frequency is much wider i.e., from 24.3 to 32.1, from 31 to 62, and 499.66, correspondingly. Therefore, exclusion from CPI, which is applied with varying standard deviations, depends on the range of median standard deviations.
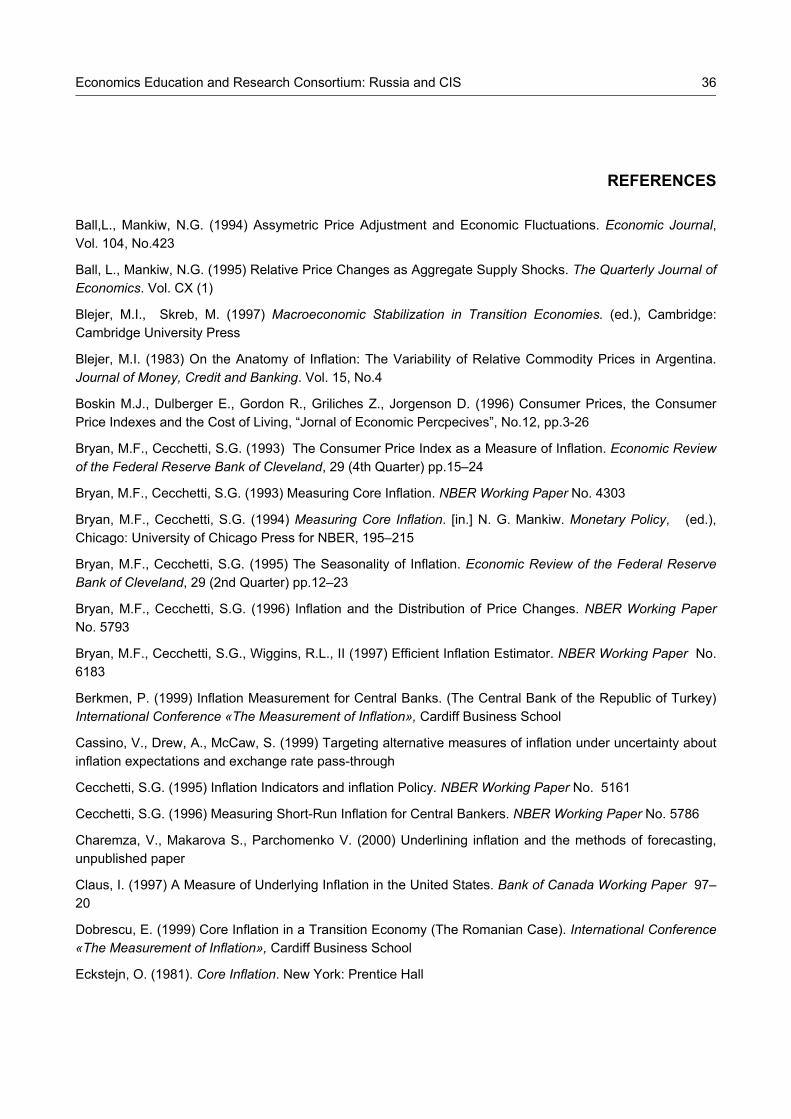
Five alternative measures are calculated for annualized monthly data, i.e., the exclusion above the standard deviation 1, 1.5, 2, 2.5, and 3. For each resulting trimmed set of ob-servations, i.e. for each standard deviation, the weighted average of prices were computed and compared against the long term inflation trend. The comparison shows that exclusion below and above the standard deviation 2.5 improves the behavior of inflation measure. However, the main drawback of the method is the fact that prices are excluded without knowledge on the sources of noises. Consequently, this method can discard a useful source of information if outlier prices contain important news, for example, the change of state controlled prices that play a very important role in forming price expectations in the future periods.
5.5. Percentile method
The basic idea of the given method concerns in achieving the unbiased estimator, at which the expected value of estimator is equal to the true value. Since the sample mean is the unbiased estimator of theoretical mean, the percentile of empirical probability distribution around the true average value (approximately corresponds to the sample mean) should be an unbiased estimation in distributing average (Wozniak 1999; Roger 1997) as well. At the symmetric distribution of probabilities (median), the percentile of underlying inflation is equal to 50. At the positive asymmetry, when the distribution skewed to the right, the per-centile of underlying inflation is higher than 50, and at the negative asymmetry, when the distribution skewed to the left, the percentile is lower than 50. In other words, the k-percentile of core inflation is defined as k-percentile of the weighed distribution of price changes during a given time (the median corresponds to 50-th percentile).
In comparison to other methods described above, this method takes into account all the available observations. The essence of the analysis is based on the assumption that the

Economics Education and Research Consortium: Russia and CIS
17
empirical distribution of price changes, which we observe each month (quarter, year), is the individual sample of the whole population of price changes – a set of changes in un-derlying prices, which should be compared among themselves. The most acceptable way of such comparison is to use the empirical sample of distributions. It is achieved by smoothing all possible normalized observations both by separate parts and by separate periods on each frequency of observation (Roger 1997; Wozniak 1999).
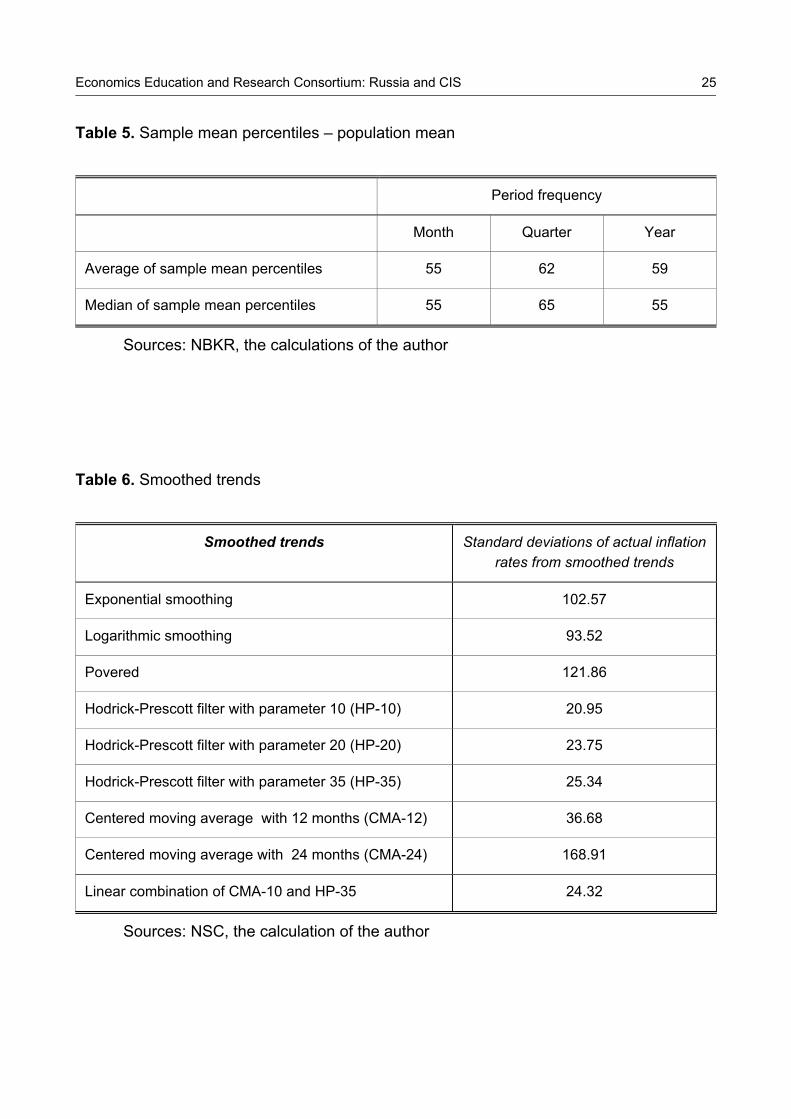
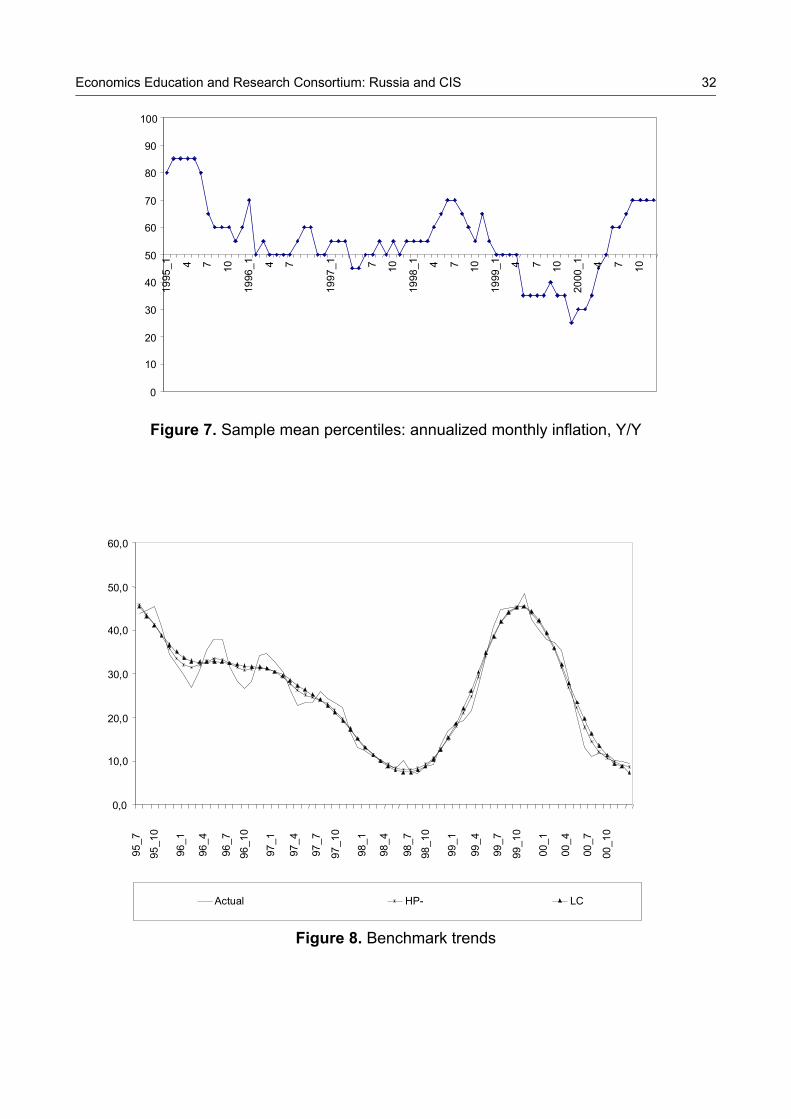
Figure 7 (see Appendix 3) demonstrates the sample mean percentiles calculated over the entire sample period of KR data at monthly frequency. The annualized monthly observa-tion of the sample mean ranges from 25th to 85th percentiles, meaning that as little as 25% or, at other times, as much as 85% of the CPI categories experience price changes that are smaller that the recorded CPI. For quarterly observations, sample mean lies within the range of about 10th and 90th percentiles, and for annual observation in between 25th and 85th percentiles. The lower the frequency of observations the higher their volatility due to seasonal pattern, therefore percentile means are calculated on the basis of annualized monthly data.
As Table 5 (see Appendix 2) shows, there is a difference between the average and the median values of sample mean percentiles. Therefore, the range of prices for percentile values is chosen according to both average and median levels of sample means. For an-nualized monthly data the acceptable range of percentiles is 45-75.
6. FINDING OPTIMAL MEASURES
As it was already mentioned, core inflation should satisfy the property of smoothness. The smoothness property of the derived measures is checked on the basis of the benchmark trend. To find the benchmark trend, the following smoothed trends of the actual inflation are calculated: the centered moving averages9; the Hodrick-Prescott filter10; exponential smoothing11; logarithmic smoothing12; powered smoothing13; and the polynomial trend of order two14. The standard deviations of the mentioned smoothed trends from actual infla-tion rates are presented in Table 6 (see Appendix 2). As Table 6 (see Appendix 2) indi-cates the low values of standard deviations belong to the Hodrick-Prescott filter with the smoothing parameter 10 and the linear combination of the centered moving average with
9 Including 12 and 24 points for monthly data. 10 with smoothing parameter ranging from 10 to 100. 11 Formula: y = 46.8e-0.02t . 12 Formula: y = -11.091Ln(t) + 62.8. 13 Formula: y = 117.47*t-0.52. 14 Formula: y = 0.002*t2 - 0.5*t + 43.1.
Economics Education and Research Consortium: Russia and CIS
18
24 months and the Hodrick-Prescott filter with the smoothing parameter 35. These two trends are chosen as the benchmark trends (Figure 8, Appendix 3).
The alternative inflation measures derived by our four methods are compared with the benchmark trends on the basis of MAD and RMSE, which are defined as follows:
MAD ==∑
1
1 N
ii
xN
and (15)
RMSE ==∑ 2
1
1 ( )N
ii
xN
. (16)
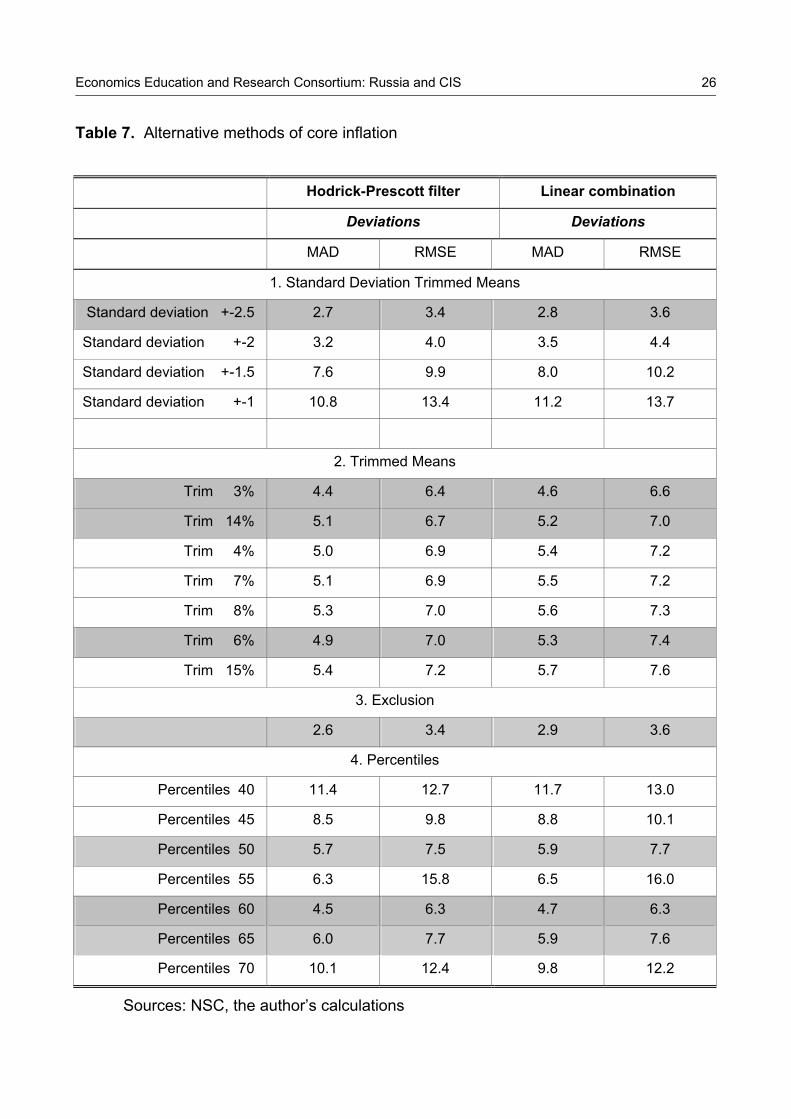
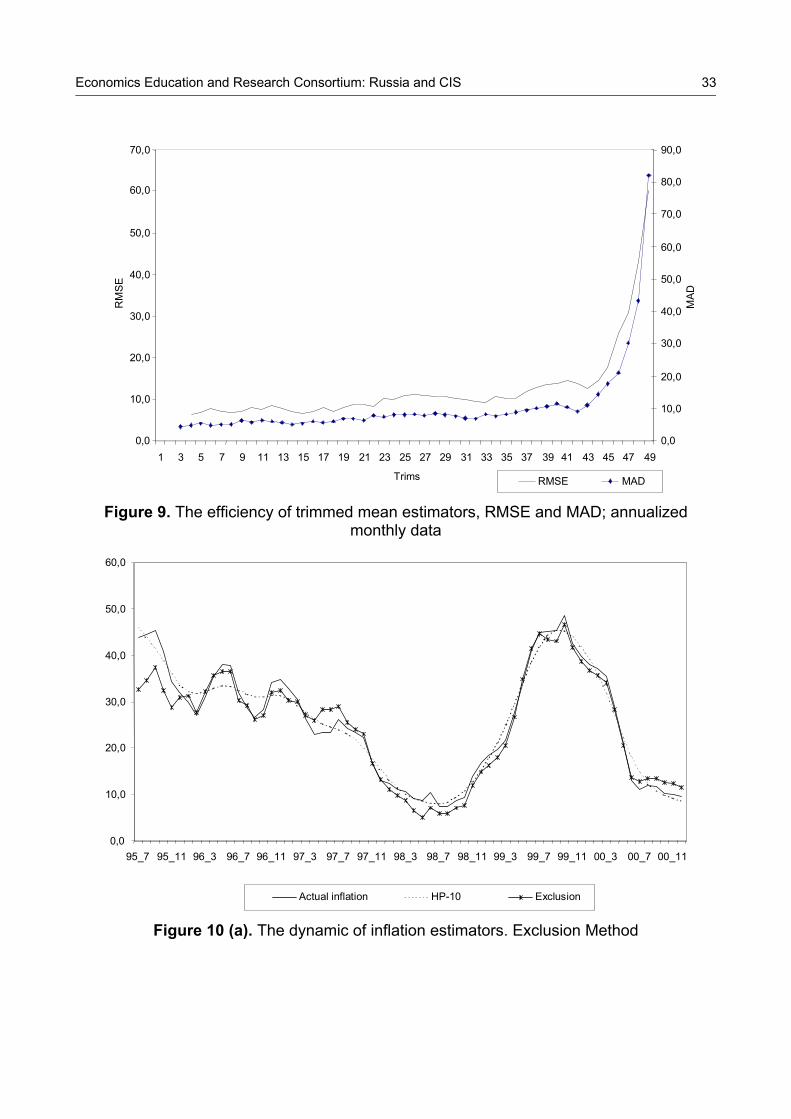
The results of computed MAD and RMSE for all estimators are sorted in ascending order and better measures chosen according to MAD and RMSE (see Table 7, Appendix 2). As Table 7 (see Appendix 2) indicates, the exclusion method and the standard deviation trimmed means method perform better in smoothing inflation measure, while the trimmed means method and the percentile method do not seem to significantly improve the meas-ure. This motivated us to carefully analyze the means obtained by the trimmed means method and the percentile method. In order to get more accurate picture on the efficiency of trimmed means, the graphs of RMSE and MAD values as the function of trims are plot-ted (see Figure 9, Appendix 3).
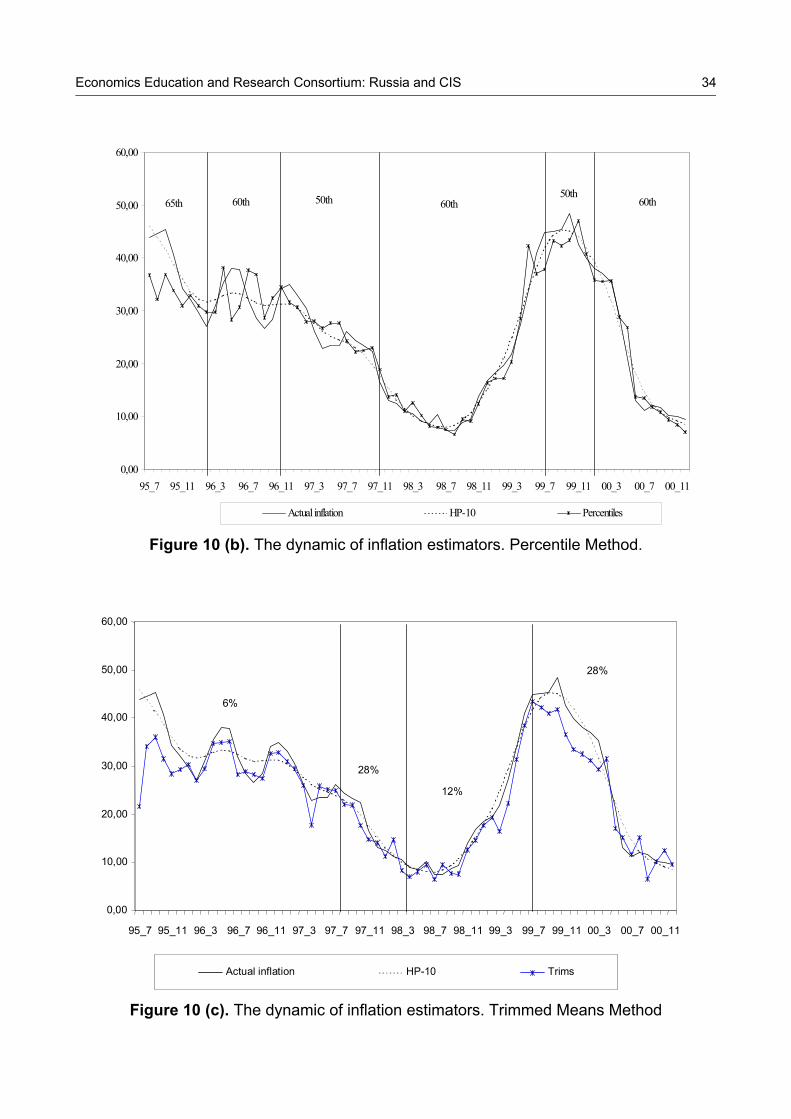
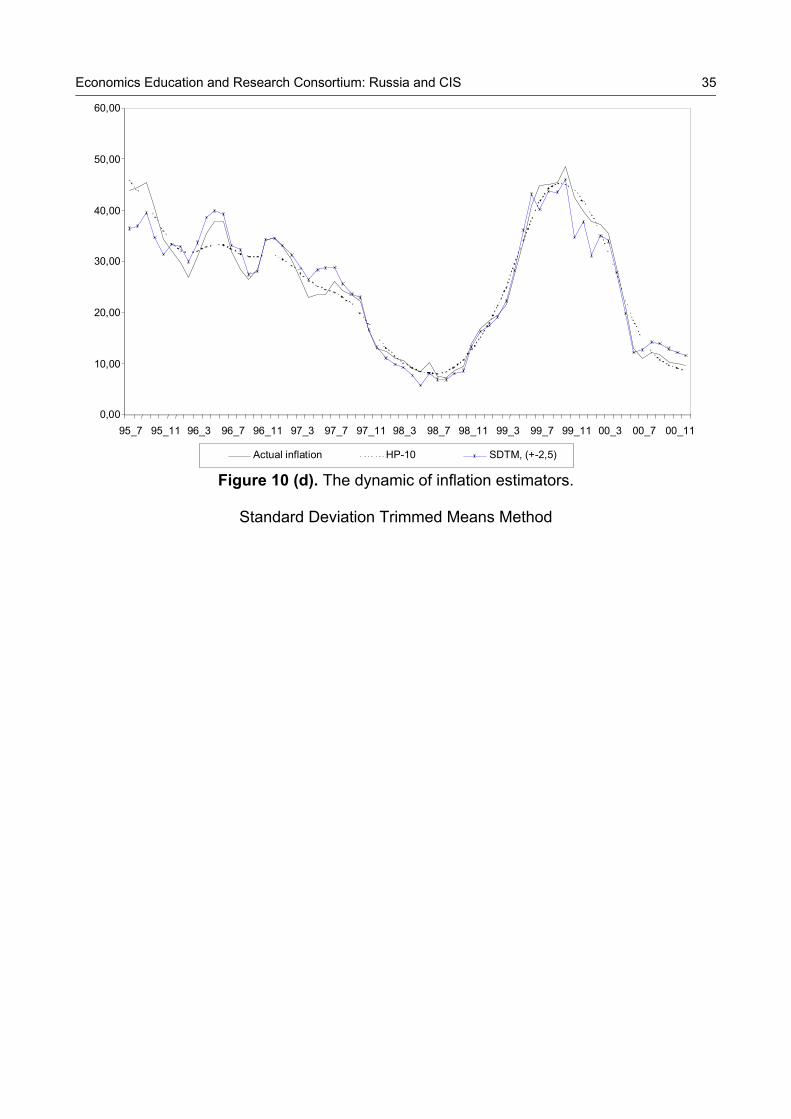
According to the Figure 9 (see Appendix 3), 14%, 6% and 3% of trimming from both tails of distribution are better measures among the set of trimmed means. However, none of these measures smooth inflation measure sufficiently for the whole period of sample. For exam-ple, if one can get a smoothed measure by omitting only 6% of observation during July 1995-July 1997, then excluding 28% of observation is necessary during July1999-December 2000. In general, in the periods of high inflation the larger percentage of trim-ming is preferable, and visa versa, in the periods of moderate inflation trimming with smaller percentages is sufficient for smoothing inflation measure. Another method that provides us with the several version of answer is the percentile method. RMSE and MAD choose the 50th, 60th, and 65th percentile means from the set of inflation estimators ob-tained by the method. However, as in the case of trimmed means, none of these measures taken separately does provide us with the sufficient smoothness of inflation measure for a whole sample period.
Excluding 26 components from the basket by the exclusion method and eliminating extra-neous price jumps and falls from CPI that lie beyond the standard deviation 2.5 from the mean (the standard deviation trimmed means method) allow us to significantly improve in-flation measure in terms of the smoothness property. However, both methods have serious drawbacks in the sense that expenses on goods and services, which are excluded from the basket, compose the largest portions of families’ budget. Besides, the high share of
Economics Education and Research Consortium: Russia and CIS
19
agriculture in the economy of KR does not allow excluding too many seasonal goods as policymakers pay a large attention to the seasonal factors of the economy.
A disadvantage associated with the standard deviation trimmed means method is a high probability of losing important information, because prices are excluded from CPI without knowledge on the source of price jumps or falls. If outlier prices contain information, which is important in forming future price expectations, then excluding of these prices is not de-sirable. In general, the intuitive exclusion of important components from the basket might increase the chances of losing necessary information. Thus, it can make both private and public opinion suspicious to the concept of core inflation as the long-run inflation measure.
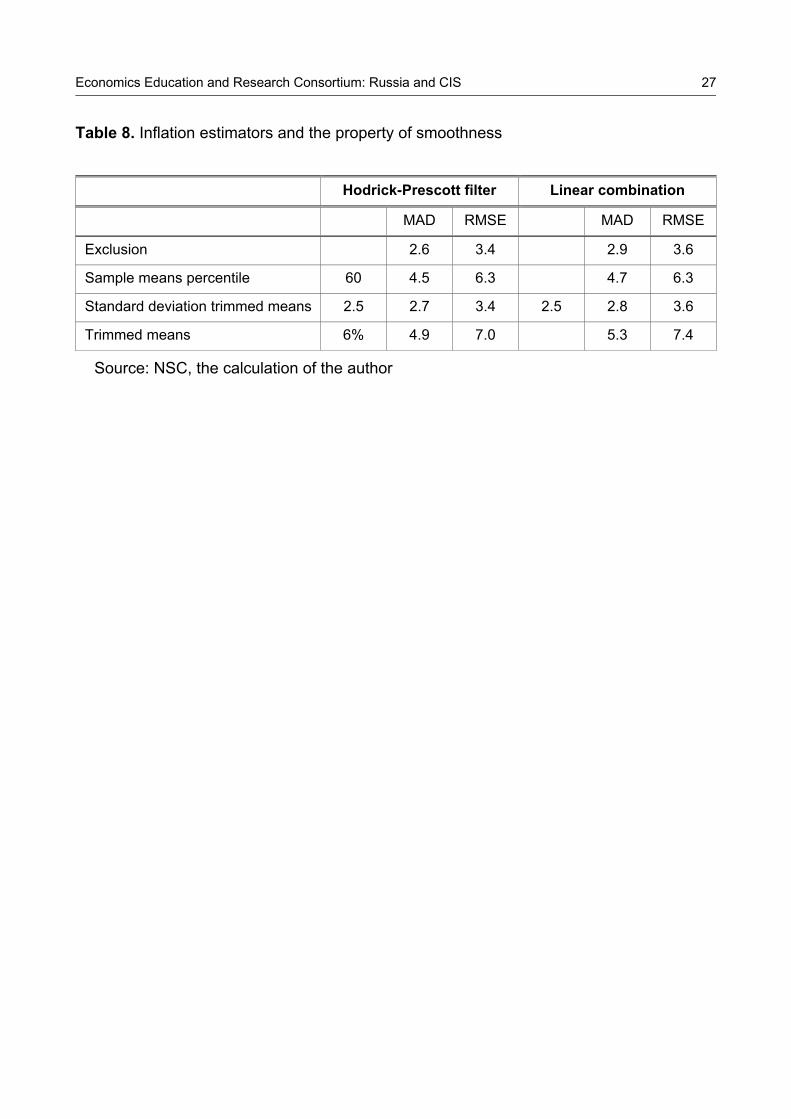
Table 8 (see Appendix 2) presents the summary of comparisons among better performing inflation estimators from each method. Figure 10 (see Appendix 3) shows the dynamic of smoothed inflation measures chosen by RMSE and MAD from the set of measures derived by four alternative methods. According to the Graph 10, the means of simple exclusion perform well, where the values of both MAD and RMSE are the lowest. The second best result is obtained by the standard deviation trimmed means method, at which MAD and RMSE are lower compared to trimmed means and percentiles. However, justification on using these methods for the economy of KR should be carefully addressed and discussed by the appropriate kyrgyz authorities for the above-mentioned reasons.
Other two measures chosen by RMSE and MAD are 60th percentiles from the set of per-centile means and trimmed means obtained by censoring 6% of observations from both tails of price distributions. As demonstrated in the Table 8 (see Appendix 2), both of the measures significantly lose in terms of efficiency. However, given the fact that the percen-tile method has an important advantage compared to other methods as it takes into ac-count all the available observations, one should not decline it completely. The reason is that prices during the period 1995-2000 in KR were still adjusting after price liberalization at the beginning of the 1990s. Therefore, it is desirable to extend the sample period, to perform all methods in low inflationary periods as well, and then to compare with bench-mark trend.
Therefore, means obtained by excluding extraneous jumps with the cut-off point of 2.5 standard deviation and the exclusion of components from both tails of distribution do per-form relatively well, but the main disadvantage associated with these methods is the lack of information about the sources of noises. The exclusion of goods and services form the basket occurs at intuitive level and this can increase the probability of losing important in-formation, especially, if major consumption goods and goods that are crucial in forming price expectations, e.g., state regulated goods, are excluded from the basket.
The comparison of alternative methods, consequently, shows that means obtained by the exclusion method and the exclusion of unusual jumps yield better results compared to the trimmed means and the percentile method, highly satisfying the smoothness property. However, the justification of the methods which are considered in the study for the econ-
Economics Education and Research Consortium: Russia and CIS
20
omy of KR should be clearly addressed and discussed by the monetary authorities to make the measure of core inflation is smooth and, thus, predictable on the one hand and reliable for the public and private sectors, on the other.
7. CONCLUSION
The problem of inflation reduction is one of the main important economic issues in transi-tion countries. Inflation can be caused either by monetary factors or by structural shocks or both. The success and efficiency of monetary policy in terms of inflation stability depends on whether inflation measure reflects long-term price movements or includes short-term structural shocks as well. If inflation reflects short-term structural shocks in the economy, the policy of price stability becomes difficult to implement. Therefore distinguishing and ex-cluding temporary shocks affecting the dynamic of prices in order to derive persistent price movement or the ideal inflation measure is very important.
The main reasons for inflation in KR in recent years are budget deficit, the administrative change of prices and tariffs, the increase of prices on imported energy carriers due to the change of external markets, and the increase of prices on imported consumer goods. These non-monetary factors, which are directly or indirectly included in CPI, together with various supply shocks cause high volatility of CPI and significantly complicate the main goal of the central bank, to control inflation. This research attempts to analyze alternative methods of measuring core (or underlying) inflation in order to filter out noises and short-term shifts in price changes.
The paper provides information on the system of CPI measurement in KR and the dynamic of individual price changes within CPI. Using technique, which have been tested in transi-tion economies and based on their results, it is argued that the CPI measure in KR does not correspond to the ideal inflation measure, because of its high sensitivity to various non-monetary factors in the economy. Based on the statistical approach of defining core infla-tion and using 12 differenced monthly data (or annualized monthly CPI data) for the period of 1995-2000, four alternative methods of measuring core inflation are analyzed. The al-ternative inflation measures, which are derived by the exclusion method, the trimmed means method, the standard deviation trimmed means method, and the percentile method, are examined based on the property of long-term inflation measure – the smooth-ness property.
The smoothness property is evaluated by comparing alternative inflation measures with benchmark trends, through minimizing root mean square error and mean absolute devia-tion. To find the appropriate benchmark trend, the actual inflation rates are smoothed ac-cording to simple techniques and based on the variance and standard deviation of actual
Economics Education and Research Consortium: Russia and CIS
21
inflation trends. The Hodrick-Prescott filter and the linear combination of smoothed trends are chosen as alternative benchmark trends.
According to the comparison, the exclusion method and the standard deviation trimmed means method yield better results, readily satisfying the smoothness property compared to the percentile method and trimmed means method. However, the exclusion method and the standard deviation trimmed means method have disadvantages in the sense that ex-clusion, basically, occurs at the intuitive level, and thus the probability of losing important information is high. The percentile method, on the contrary, takes into account all the available observations. Therefore, the justification of the methods which are considered in the study for the economy of KR should be clearly addressed and discussed by the mone-tary authorities to make the measure of core inflation is smooth and, thus, predictable on the one hand and reliable for the public and private sectors, on the other.
In general, this research is the first attempt to study and test the alternative methods of core inflation measure on the basis of KR data. Therefore, the results of this research should not be considered a definitive answer to what is the appropriate measure of core in-flation in KR. Rather it sheds some light on the way of filtering out noises and short-term shifts in price changes in order to get the smoothed inflation measure. Results show that additional research is necessary; in particular, it is desirable to extend the sample period and to use a more convincing theoretical approach for separating actual time series that are highly sensitive to exogenous shocks into smooth and stationary components.
Economics Education and Research Consortium: Russia and CIS
22
APPENDIX 1. INSTRUMENTS OF THE MONETARY POLICY
Instruments Interest rate Frequency Maturity Comments
Open market opera-tions (purchase and
sale of government se-curities, REPO opera-
tions)
Market rate Daily 1 to 180 days for REPO op-
erations
Intervention in inter-bank foreign exchange
market
- Daily -
NBKR notes' auction Yield is deter-mined in the auction de-pending on
demand and supply.
Weekly 7,14, and 28 days
"Overnight" credits fa-cility
1.2 of NBKR discount rate
On de-mand of
commercial bank
1 day Without security
Last resort credits facil-ity
0.8 of NBKR discount rate
On de-mand of
commercial bank
Not more than 6 months
Under availability of bank improvement
program approved by board of directors
Discount rate Linked to cur-rent auction
yield of NBKR Note with ma-
turity of 28 days
Weekly -
Ratio Mainte-nance pe-
riod
Reserve base
Guarantee of reserve requirements
Reserve requirements
10% 2 weeks All deposits excluding de-posits in for-
eign currency with term of 1
year
Correspondent ac-count in NBKR and in
national currency
Source: NBKR
Economics Education and Research Consortium: Russia and CIS
23
APPENDIX 2. TABLES
Table 1. Basic macroeconomic indicators
Main
indicators 1992 1993 1994 1995 1996 1997 1998 1999 2000
Inflation rate, annual %-change, including:
2033.7 1366.0 87.2 32.1 34.8 13.0 16.8 39.9 9.6
Foods 2875.8 980.0 72.6 41.1 38.9 14.8 116.7 45.5 10.2
Non-foods 1062.6 940.0 72.8 12.6 20.2 6.4 11.3 30.0 7.5 Paid services 440.4 5790.0 508.7 38.1 42.5 17.6 23.3 35.9 16.2
GDP growth rate -15.8 -16.3 -20.1 -5.0 7.0 9.9 1.8 3.8 5.0
Budget deficit, % of GDP 13.9 7.1 7.7 11.5 5.4 5.0 3.0 2.5 2.1
External debt, US mln. 3.7 290.2 446.1 608.3 764.4 928.2 1480.3 1699.0 1703.8
Export, $ US mln. 284.6 348.3 372.7 448.0 562.7 675.7 592.5 528.9 572.7
Import, $ US mln. 400.2 497.4 497.2 725.9 1031.9 817.1 954.6 717.9 650.9
Exchange rate, KGS/$US (the end of period)
# 8.3 10.7 11.20 16.7 17.4 29.4 44.6 48.3
Source: NBKR, NSC, MF
Table 2. Weighted skewness and kurtosis of CPI distributions
Monthly CPI Quarterly CPI Annual CPI
Skewness Kurtosis Skewness Kurtosis Skewness Kurtosis
Mean 5.8 172.4 4.3 62.5 6.2 155.1
Median 2.3 17.0 2.9 32.3 3.8 21.5
Standard deviation 8.6 370.2 4.9 88.0 7.6 323.4
Sources: NSC, calculations of the author
Economics Education and Research Consortium: Russia and CIS
24
Table 3. The standard deviation of price fluctuations in KR
Standard deviations of prices
Annualized monthly data
Monthly data Quarterly data Annual data
Minimum 16.9 2.2 1.8 7.0
Median 27.1 21.3 8.8 258.7
Maximum 295.5 199.3 230.1 3975.3
Cut-off points15 51.5 40.4 16.7 491.5
Sources: NSC, the calculations of the author
Table 4. The standard deviation of prices at each frequency Mean Median 1995 1996 1997 1998 1999 2000
Monthly inflation rates, Y/Y January 30.5 31.3 145.5* 33.5 41.2 21.2 25.4 31.3February 29.7 30.3 104.7* 33.0 37.5 21.4 26.5 30.3March 28.4 28.8 107.9* 37.1 29.8 20.8 25.4 28.8April 29.4 28.3 108.9* 42.6 28.3 20.9 28.3 27.1May 30.6 29.7 106.8* 42.3 29.7 24.7 33.0 23.2June 30.7 32.4 73.7* 40.6 32.4 21.4 36.0 23.3July 35.6 32.0 64.2 36.3 32.0 21.1 38.2 21.8August 32.8 28.8 55.1 40.8 28.8 18.8 34.7 18.6September 32.9 26.5 55.2 46.3 26.5 17.4 33.7 18.1October 33.2 26.7 48.3 51.1 26.7 17.0 38.2 17.8November 31.1 24.3 34.1 48.1 24.3 24.0 36.9 19.1December 29.5 26.5 33.6 41.4 22.8 26.5 33.0 19.8
Quarterly inflation rates, Q/Q Quarter 1 61.2 20.8 21.8 20.8 13.8 16.5 13.8 9.1Quarter 2 31.0 23.6 11.4 23.6 15.1 24.2 26.7 12.6Quarter 3 61.8 19.0 21.4 18.4 11.6 15.1 19.0 13.5Quarter 4 41.8 34.8 34.2 41.5 23.3 22.6 30.6 34.8
Annual CPI, Y/Y Years 499.66 33.65 33.6 41.4 22.8 26.5 33.0 19.8
*) Under the calculations of means and medians this numbers are not considered
Sources: NSC, calculations of the author
15 The cut off points are determined as the product of median multiplied by 1.9.
Economics Education and Research Consortium: Russia and CIS
25
Table 5. Sample mean percentiles – population mean
Period frequency
Month Quarter Year
Average of sample mean percentiles 55 62 59
Median of sample mean percentiles 55 65 55
Sources: NBKR, the calculations of the author
Table 6. Smoothed trends
Smoothed trends Standard deviations of actual inflation rates from smoothed trends
Exponential smoothing 102.57
Logarithmic smoothing 93.52
Povered 121.86
Hodrick-Prescott filter with parameter 10 (HP-10) 20.95
Hodrick-Prescott filter with parameter 20 (HP-20) 23.75
Hodrick-Prescott filter with parameter 35 (HP-35) 25.34
Centered moving average with 12 months (CMA-12) 36.68
Centered moving average with 24 months (CMA-24) 168.91
Linear combination of CMA-10 and HP-35 24.32
Sources: NSC, the calculation of the author
Economics Education and Research Consortium: Russia and CIS
26
Table 7. Alternative methods of core inflation
Hodrick-Prescott filter Linear combination
Deviations Deviations
MAD RMSE MAD RMSE
1. Standard Deviation Trimmed Means
Standard deviation +-2.5 2.7 3.4 2.8 3.6
Standard deviation +-2 3.2 4.0 3.5 4.4
Standard deviation +-1.5 7.6 9.9 8.0 10.2
Standard deviation +-1 10.8 13.4 11.2 13.7
2. Trimmed Means
Trim 3% 4.4 6.4 4.6 6.6
Trim 14% 5.1 6.7 5.2 7.0
Trim 4% 5.0 6.9 5.4 7.2
Trim 7% 5.1 6.9 5.5 7.2
Trim 8% 5.3 7.0 5.6 7.3
Trim 6% 4.9 7.0 5.3 7.4
Trim 15% 5.4 7.2 5.7 7.6
3. Exclusion
2.6 3.4 2.9 3.6
4. Percentiles
Percentiles 40 11.4 12.7 11.7 13.0
Percentiles 45 8.5 9.8 8.8 10.1
Percentiles 50 5.7 7.5 5.9 7.7
Percentiles 55 6.3 15.8 6.5 16.0
Percentiles 60 4.5 6.3 4.7 6.3
Percentiles 65 6.0 7.7 5.9 7.6
Percentiles 70 10.1 12.4 9.8 12.2
Sources: NSC, the author’s calculations
Economics Education and Research Consortium: Russia and CIS
27
Table 8. Inflation estimators and the property of smoothness
Hodrick-Prescott filter Linear combination
MAD RMSE MAD RMSE
Exclusion 2.6 3.4 2.9 3.6
Sample means percentile 60 4.5 6.3 4.7 6.3
Standard deviation trimmed means 2.5 2.7 3.4 2.5 2.8 3.6
Trimmed means 6% 4.9 7.0 5.3 7.4
Source: NSC, the calculation of the author
Economics Education and Research Consortium: Russia and CIS
28
APPENDIX 3. FIGURES
Figure 1. Inflation rates, 1995-2000 (Y/Y)
Figure 2. Structural changes in the consumer basket, 1992 - 2000
0,00
10,00
20,00
30,00
40,00
50,00
60,00
70,00
Jan.
April
July
Oct
.
Jan.
April
July
Oct
.
Jan.
April
July
Oct
.
Jan.
April
July
Oct
.
Jan.
April
July
Oct
.
Jan.
April
July
Oct
.
Monthly data, 1995-2000
Infla
tion
rate
s, %
Y/Y
0,00
10,00
20,00
30,00
40,00
50,00
60,00
70,00
80,00
90,00
100,00
1992 1993 1994 1995 1996 1997 1998 1999 2000
Wei
ghts
, %
Foods Non-foods Services
Economics Education and Research Consortium: Russia and CIS
29
Figure 3. The dynamics of skewness in annualized monthly price changes; the period of moderate inflation (January, 1995 – December, 2000)
Figure 4. Histograms of price change distributions with positive skewness
0,0
5,0
10,0
15,0
20,0
25,0
30,0
35,0 19
95 J
an.
Mar
ch
May
Ju
ly
Sep
t. N
ov.
1996
Jan
. M
arch
M
ay
July
Sep
t. N
ov.
1997
Jan
. M
arch
M
ay
July
Sep
t. N
ov.
1998
Jan
. M
arch
M
ay
July
Sep
t. N
ov.
1999
Jan
. M
arch
M
ay
July
Sep
t. N
ov.
2000
Jan
. M
arch
M
ay
July
Sep
t. N
ov.
Weghted skewness
Skewness
0
0.05
0.1
0.15
0.2
0.25
-5 -4 -3 -2 -1 0 1 2 3 4 5 6 7 8 9 10
Inflation
Freq
uenc
y
Economics Education and Research Consortium: Russia and CIS
30
Figure 5. Histograms of price change distributions with negative skewness
0
0.05
0.1
0.15
0.2
0.25
-5 -4 -3 -2 -1 0 1 2 3 4 5 6 7 8 9 10
Inflation
Freq
uenc
y
Economics Education and Research Consortium: Russia and CIS
31
a)
b)
Figure 6. Standard deviations of CPI on period-by-period basis: a) monthly data; and b) quarterly data
0
0,05
0,1
0,15
0,2
0,25
0,3
0,35
0,4
0,45
0,5
-70 -60 -50 -40 -30 -20 -10 0 10 20 30 40 50 60 70 80 Inflation in October (all years), Y/Y
Freq
uenc
y
1995
1996
1997
1998
1999
2000
0
0,1
0,2
0,3
0,4
0,5
0,6
0,7
-35 30 -25 -20 -15 -10 -5 0 5 10 15 20 25 30 35 40
Inflation rates per fourth quarters (all )
Freq
uenc
199219931994199519961997199819992000
Economics Education and Research Consortium: Russia and CIS
32
Figure 7. Sample mean percentiles: annualized monthly inflation, Y/Y
Figure 8. Benchmark trends
0
10
20
30
40
50
60
70
80
90
100
1995
_1
4 7 10
1996
_1
4 7
1997
_1
7 10
1998
_1
4 7 10
1999
_1
4 7 10
2000
_1
4 7 10
0,0
10,0
20,0
30,0
40,0
50,0
60,0
95_7
95_1
0
96_1
96_4
96_7
96_1
0
97_1
97_4
97_7
97_1
0
98_1
98_4
98_7
98_1
0
99_1
99_4
99_7
99_1
0
00_1
00_4
00_7
00_1
0
Actual HP- LC
Economics Education and Research Consortium: Russia and CIS
33
Figure 9. The efficiency of trimmed mean estimators, RMSE and MAD; annualized monthly data
Figure 10 (a). The dynamic of inflation estimators. Exclusion Method
0,0
10,0
20,0
30,0
40,0
50,0
60,0
70,0
1 3 5 7 9 11 13 15 17 19 21 23 25 27 29 31 33 35 37 39 41 43 45 47 49
Trims
RM
SE
0,0
10,0
20,0
30,0
40,0
50,0
60,0
70,0
80,0
90,0
MA
D
RMSE MAD
0,0
10,0
20,0
30,0
40,0
50,0
60,0
95_7 95_11 96_3 96_7 96_11 97_3 97_7 97_11 98_3 98_7 98_11 99_3 99_7 99_11 00_3 00_7 00_11
Actual inflation HP-10 Exclusion
Economics Education and Research Consortium: Russia and CIS
34
Figure 10 (b). The dynamic of inflation estimators. Percentile Method.
Figure 10 (c). The dynamic of inflation estimators. Trimmed Means Method
60th50th
60th50th60th65th
0,00
10,00
20,00
30,00
40,00
50,00
60,00
95_7 95_11 96_3 96_7 96_11 97_3 97_7 97_11 98_3 98_7 98_11 99_3 99_7 99_11 00_3 00_7 00_11
Actual inflation HP-10 Percentiles
28%
6%
12%
28%
0,00
10,00
20,00
30,00
40,00
50,00
60,00
95_7 95_11 96_3 96_7 96_11 97_3 97_7 97_11 98_3 98_7 98_11 99_3 99_7 99_11 00_3 00_7 00_11
Actual inflation HP-10 Trims
Economics Education and Research Consortium: Russia and CIS
35
Figure 10 (d). The dynamic of inflation estimators.
Standard Deviation Trimmed Means Method
0,00
10,00
20,00
30,00
40,00
50,00
60,00
95_7 95_11 96_3 96_7 96_11 97_3 97_7 97_11 98_3 98_7 98_11 99_3 99_7 99_11 00_3 00_7 00_11
Actual inflation HP-10 SDTM, (+-2,5)
Economics Education and Research Consortium: Russia and CIS
36
REFERENCES
Ball,L., Mankiw, N.G. (1994) Assymetric Price Adjustment and Economic Fluctuations. Economic Journal, Vol. 104, No.423
Ball, L., Mankiw, N.G. (1995) Relative Price Changes as Aggregate Supply Shocks. The Quarterly Journal of Economics. Vol. CX (1)
Blejer, М.I., Skreb, M. (1997) Macroeconomic Stabilization in Transition Economies. (ed.), Cambridge: Cambridge University Press
Blejer, М.I. (1983) On the Anatomy of Inflation: The Variability of Relative Commodity Prices in Argentina. Journal of Money, Credit and Banking. Vol. 15, No.4
Boskin M.J., Dulberger E., Gordon R., Griliches Z., Jorgenson D. (1996) Consumer Prices, the Consumer Price Indexes and the Cost of Living, “Jornal of Economic Percpecives”, No.12, pp.3-26
Bryan, M.F., Cecchetti, S.G. (1993) The Consumer Price Index as a Measure of Inflation. Economic Review of the Federal Reserve Bank of Cleveland, 29 (4th Quarter) pp.15–24
Bryan, M.F., Cecchetti, S.G. (1993) Measuring Core Inflation. NBER Working Paper No. 4303
Bryan, M.F., Cecchetti, S.G. (1994) Measuring Core Inflation. [in.] N. G. Mankiw. Monetary Policy, (ed.), Chicago: University of Chicago Press for NBER, 195–215
Bryan, M.F., Cecchetti, S.G. (1995) The Seasonality of Inflation. Economic Review of the Federal Reserve Bank of Cleveland, 29 (2nd Quarter) pp.12–23
Bryan, M.F., Cecchetti, S.G. (1996) Inflation and the Distribution of Price Changes. NBER Working Paper No. 5793
Bryan, M.F., Cecchetti, S.G., Wiggins, R.L., II (1997) Efficient Inflation Estimator. NBER Working Paper No. 6183
Berkmen, P. (1999) Inflation Measurement for Central Banks. (The Central Bank of the Republic of Turkey) International Conference «The Measurement of Inflation», Cardiff Business School
Cassino, V., Drew, A., McCaw, S. (1999) Targeting alternative measures of inflation under uncertainty about inflation expectations and exchange rate pass-through
Cecchetti, S.G. (1995) Inflation Indicators and inflation Policy. NBER Working Paper No. 5161
Cecchetti, S.G. (1996) Measuring Short-Run Inflation for Central Bankers. NBER Working Paper No. 5786
Charemza, V., Makarova S., Parchomenko V. (2000) Underlining inflation and the methods of forecasting, unpublished paper
Claus, I. (1997) A Measure of Underlying Inflation in the United States. Bank of Canada Working Paper 97–20
Dobrescu, E. (1999) Core Inflation in a Transition Economy (The Romanian Case). International Conference «The Measurement of Inflation», Cardiff Business School
Eckstejn, O. (1981). Core Inflation. New York: Prentice Hall
Economics Education and Research Consortium: Russia and CIS
37
Fischer, S. (1981). Relative Shocks, Relative Price Variability, and Inflation. Brookings Papers on Economic Activity, No.2
Fischer, S. (1982) Relative Price Variability and Inflation in the United States and Germany. European Eco-nomic Review, No.18
Johnson M. (1999) Core Inflation: A measure of inflation for policy purposes. BIS working papers
Koen, V., De Masi, P. (1997) Prices in Transition: Ten Stylized Facts. Washington: International Monetary Found. IMF Working Paper No.158
Nyman, M., (1999) Alternative Measures of Underlying Inflation. Methodological Discussion and empirical re-sults. (Handelsbanken Markets, Economic Research International), Conference «The Measurement of Infla-tion», Cardiff Business School
Roger, S. (1997). A Robust Measure of Underlying Inflation in New Zealand, 1949–1996. Reserve Bank of New Zealand Discussion Paper G97/7
Theil, H. (1967) Economics of Inflation Theory, Amsterdam: North Holland
Wynne, M. (1999) Core inflation: a review of some conceptual issues, DG Research, European Central Bank, Frankfurt am Main
Wozniak, P. (1999) Various Measures of Underlying Inflation, CASE-CEU Working Paper, No. 25
Wozniak, P. (1997) Relative Prices and Inflation in Poland 1989-1977, Studies and Analysis, No. 121, CASE – Center for Social and Economic Research, Warsaw
Ward, M., Dikhanov, Y., (1999) What is inflation? World Bank Working Paper