finca microfinance bank limited microfinance bank limited balance ... appropriations are reflected...
TRANSCRIPT


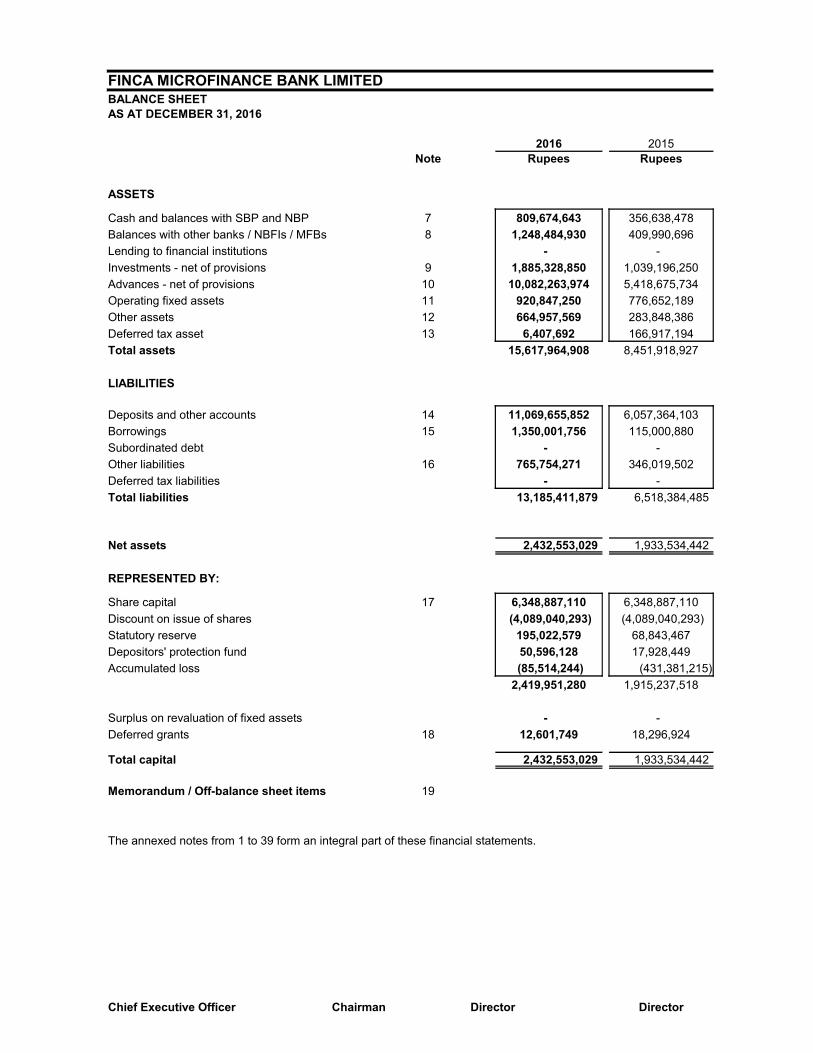
FINCA MICROFINANCE BANK LIMITEDBALANCE SHEETAS AT DECEMBER 31, 2016
2016 2015Note Rupees Rupees
ASSETS
Cash and balances with SBP and NBP 7 809,674,643 356,638,478
Balances with other banks / NBFIs / MFBs 8 1,248,484,930 409,990,696
Lending to financial institutions - -
Investments - net of provisions 9 1,885,328,850 1,039,196,250
Advances - net of provisions 10 10,082,263,974 5,418,675,734
Operating fixed assets 11 920,847,250 776,652,189
Other assets 12 664,957,569 283,848,386
Deferred tax asset 13 6,407,692 166,917,194
Total assets 15,617,964,908 8,451,918,927
###
LIABILITIES ######
Deposits and other accounts 14 11,069,655,852 6,057,364,103
Borrowings 15 1,350,001,756 115,000,880
Subordinated debt - -
Other liabilities 16 765,754,271 346,019,502
Deferred tax liabilities - -
Total liabilities 13,185,411,879 6,518,384,485
Net assets 2,432,553,029 1,933,534,442
REPRESENTED BY:
Share capital 17 6,348,887,110 6,348,887,110
Discount on issue of shares (4,089,040,293) (4,089,040,293)
Statutory reserve 195,022,579 68,843,467
Depositors' protection fund 50,596,128 17,928,449
Accumulated loss (85,514,244) (431,381,215)
2,419,951,280 1,915,237,518
Surplus on revaluation of fixed assets - -
Deferred grants 18 12,601,749 18,296,924
Total capital 2,432,553,029 1,933,534,442
Memorandum / Off-balance sheet items 19
The annexed notes from 1 to 39 form an integral part of these financial statements.
Chief Executive Officer Chairman Director Director

FINCA MICROFINANCE BANK LIMITEDPROFIT AND LOSS ACCOUNT FOR THE YEAR ENDED DECEMBER 31, 2016
2016 2015Note Rupees Rupees
Mark-up / return / interest earned 20 2,986,050,035 1,899,753,877 Mark-up / return / interest expensed 21 (647,592,697) (534,669,450)Net mark-up / interest income 2,338,457,338 1,365,084,427
Provision against non-performing loans and advances 10.5 (156,750,377) (77,511,013)Provision for diminution in the value of investments - - Bad debts written off directly (62,460,438) (28,143,149)
(219,210,815) (105,654,162)Net mark-up / interest income after provisions 2,119,246,523 1,259,430,265
Non mark-up / non interest incomeFee, commission and brokerage income 22 441,395,783 283,396,327 Dividend income - - Other income 23 110,193,663 42,775,745 Total non mark-up / non interest income 551,589,446 326,172,072
2,670,835,969 1,585,602,337 Non mark-up / non interest expensesAdministrative expenses 24 (1,669,760,508) (1,322,012,402)Other charges 25 (13,480,144) (18,369,779)Total non mark-up / non interest expenses (1,683,240,652) (1,340,382,181)Profit before taxation 987,595,317 245,220,156
Taxation - Current year (184,377,277) (21,831,502) Prior years (10,676,354) - Deferred (161,646,128) (56,694,134)
26 (356,699,759) (78,525,636)Profit after taxation 630,895,558 166,694,520
Earnings per share 30 0.99 0.31
Appropriations are reflected in the statement of changes in equity.
The annexed notes from 1 to 39 form an integral part of these financial statements.
Chief Executive Officer Chairman Director Director

FINCA MICROFINANCE BANK LIMITEDSTATEMENT OF COMPREHENSIVE INCOMEFOR THE YEAR ENDED DECEMBER 31, 2016
2016 2015Rupees Rupees
Profit after tax 630,895,558 166,694,520
Other comprehensive income for the year
Items that will not be reclassified subsequently to profit or loss:
Remeasurement of post defined benefit obligation (3,513,550) (1,871,839) Impact of deferred tax 1,229,743 655,144
(2,283,807) (1,216,695)
Items that may be reclassified subsequently to profit or loss - -
Total comprehensive income for the year 628,611,751 165,477,825
The annexed notes from 1 to 39 form an integral part of these financial statements.
Chief Executive Officer Chairman Director Director

FINCA MICROFINANCE BANK LIMITEDCASH FLOW STATEMENTFOR THE YEAR ENDED DECEMBER 31, 2016
2016 2015Note Rupees Rupees
CASH FLOWS FROM OPERATING ACTIVITIESProfit before taxation 987,595,317 245,220,156 Less : Dividend income - -
987,595,317 245,220,156 Adjustments for non-cash charges
Depreciation 11.3 84,078,512 65,547,276 Amortisation 11.2 34,214,881 24,342,007 Provision against non-performing advances 10.5 156,750,377 77,511,013 Provision for diminution in the value of investments/other assets - - Loss on disposal of fixed assets 25 1,813,789 10,881,968 Finance charge on leased assets - - Amortisation of discount on held to maturity investment 20 (54,070,498) (77,477,643)Provision for accumulated compensated absences 16.3 - 2,689,174 Deferred grant recognised as income 23 (5,695,175) (9,167,155)Provision for gratuity 16.2 33,086,690 21,082,557
250,178,576 115,409,197 1,237,773,893 360,629,353
Increase in operating assets Lending to financial institutions - -
Advances (4,820,338,617) (1,501,519,032)Other assets (381,109,183) (69,260,045)
(5,201,447,800) (1,570,779,077)Increase / (decrease) in operating liabilities
Bills payable 8,784,384 918,567 Borrowings from financial institutions 1,235,000,876 (86,098,834)Deposits 5,012,291,749 1,401,187,196 Other liabilities (excluding current taxation and dividend) 164,013,050 76,169,170
6,420,090,059 1,392,176,099 2,456,416,152 182,026,375
Gratuity paid 16.2 (6,932,399) (4,885,042)Income tax paid (77,635,360) (14,665,517)Net cash from operating activities 2,371,848,393 162,475,816
CASH FLOWS FROM INVESTING ACTIVITIESNet investments in held for trading securities - 352,545,759 Net investments in held-to-maturity securities (792,062,102) (866,737,274)Interest income on depositors' protection fund 1,122,901 712,215 Dividend income - - Investments in operating fixed assets (266,118,254) (300,497,718)Sale proceeds from disposal of property and equipment 11.3.1 1,816,011 5,721,062 Net cash used in investing activities (1,055,241,444) (808,255,956)
CASH FLOWS FROM FINANCING ACTIVITIESReceipts / payments of sub-ordinated loan - - Receipts / payments of lease obligations - - Issue of share capital - 485,072,001 Dividend paid (25,076,550) - Grant received from donors 18 - 9,252,453 Net cash used in financing activities (25,076,550) 494,324,454
Increase / (decrease) in cash and cash equivalents 1,291,530,399 (151,455,686)Cash and cash equivalents at beginning of the year 766,629,174 918,084,860 Cash and cash equivalents at end of the year 32 2,058,159,573 766,629,174
The annexed notes from 1 to 39 form an integral part of these financial statements.
Chief Executive Officer Chairman Director Director

FINCA MICROFINANCE BANK LIMITEDSTATEMENT OF CHANGES IN EQUITYFOR THE YEAR ENDED DECEMBER 31, 2016
Capital reserves Revenue reserve
Statutory reserve Accumulated loss Total- - - - - - - - - - - - - - - - - - - - - - - - - - (Rupees) - - - - - - - - - - - - - - - - - - - - - - - - - -
Balance at December 31, 2014 4,731,980,440 (2,957,205,624) 35,504,563 8,881,508 (555,185,410) 1,263,975,477
Profit for the year - - - - 166,694,520 166,694,520
Other comprehensive incomeRemeasurement of post defined benefit obligation - net of tax - - - - (1,216,695) (1,216,695)
Total comprehensive income for the year - - - - 165,477,825 165,477,825
Transfer to statutory reserve - - 33,338,904 ### - (33,338,904)### - Transfer to depositors' protection fund - - - 8,334,726 (8,334,726) - - return on investments - net of tax - - - 712,215 - 712,215
Transactions with owners: - issue of share capital 1,616,906,670 (1,131,834,669) - - - 485,072,001
Balance at December 31, 2015 6,348,887,110 (4,089,040,293) 68,843,467 17,928,449 (431,381,215) 1,915,237,518
Profit for the year - - - - 630,895,558 630,895,558
Other comprehensive income Remeasurement of post defined benefit obligation - net of tax - - - - (2,283,807) (2,283,807)
Total comprehensive income for the year - - - - 628,611,751 628,611,751
Transfer to statutory reserve - - 126,179,112 - (126,179,112) -
Transfer to depositors' protection fund - - - 31,544,778 (31,544,778) - - return on investments - net of tax - - - 1,122,901 - 1,122,901
Transactions with owners: - dividend @ Re. 0.1969 per share - - - - (125,020,890) (125,020,890)
Balance at December 31, 2016 6,348,887,110 (4,089,040,293) 195,022,579 50,596,128 (85,514,244) 2,419,951,280
The annexed notes from 1 to 39 form an integral part of these financial statements.
Chief Executive Officer Chairman Director Director
Share capital
Discount on issue of shares
Depositors' protection
fund

FINCA MICROFINANCE BANK LIMITEDNOTES TO THE FINANCIAL STATEMENTSFOR THE YEAR ENDED DECEMBER 31, 2016
1 STATUS AND NATURE OF BUSINESS
1.1
1.2
2 BASIS OF PRESENTATION
3 STATEMENT OF COMPLIANCE
3.1
3.2 New accounting standards / amendments and IFRS interpretations that are effective for the year ended December 31, 2016
FINCA Microfinance Bank Limited, (the Bank) was incorporated on June 26, 2008 as a public limited company under the Companies Ordinance, 1984. The Bank obtained the Microfinance banking license from the State Bank of Pakistan (SBP) on August 12, 2008 under the provisions of Microfinance Institutions Ordinance, 2001 and certificate of commencement of business on September 4, 2008 from Securities and Exchange Commission of Pakistan. On October 27, 2008 the Bank received the certificate of commencement of business from SBP.
The Bank's principal business is to provide microfinance services to the poor and under-served segments of the society as envisaged under the Microfinance Institutions Ordinance, 2001. The registered office of the Bank is situated at 387E- Johar Town, Lahore, Pakistan. Subsequent to takeover by FINCA International the Bank has changed its name from Kashf Microfinance Bank Limited to FINCA Microfinance Bank Limited with effect from November 25, 2013.
The Bank is licensed to operate nationwide. As at December 31, 2016, the Bank has 105 branches (2015: 79 branches) and no permanent booths (2015: 21) operating in the provinces of Punjab, Khyber Pakhtunkhwa and Sindh.
The holding company of the Bank is FINCA Microfinance Cooperatief U.A.,(a cooperative with exclusion of liability incorporated in the Netherlands) The ultimate holding company of the Bank is FINCA International, Inc, a not-for-profit corporation incorporated in the Washington DC, USA.
These financial statements have been presented in accordance with the requirements of SBP Banking Supervision Department (BSD) Circular number 11 dated December 30, 2003.
These financial statements have been prepared in accordance with the directives issued by State Bank of Pakistan, the requirements of the Microfinance Institution Ordinance, 2001, the Companies Ordinance, 1984, and the accounting standards issued by the International Accounting Standards Board (IASB) and interpretations issued by International Financial Reporting Interpretation Committee, of the IASB as adopted in Pakistan.
SBP has deferred the applicability of International Accounting Standard (IAS) 39, 'Financial Instruments: Recognition and Measurement' and International Accounting Standard (IAS) 40, 'Investment Property' for Banking Companies through BSD Circular No. 10 dated August 26, 2002. Further, SECP has deferred applicability of IFRS 7 "Financial Instruments: Disclosures" through its notification S.R.O 411(1) / 2008 dated April 28, 2008. Accordingly, the requirements of these standards have not been considered in the preparation of these financial statements. However, investments have been classified and valued in accordance with the requirements prescribed by SBP through various circulars / regulations.
The following standards, amendments and interpretations are effective for the year ended December 31, 2016. These standards, interpretations and the amendments are either not relevant to the Company's operations or are not expected to have significant impact on the Company's financial statements other than certain additional disclosures.
Amendments to IFRS 5 ‘Non-current Assets Held for Sale and Discontinued Operations’: Clarification regarding changes in the method of disposal of an asset.
Effective from accounting period beginning on or after January 01, 2016
Amendments to IFRS 7 ‘Financial Instruments – Disclosures’: Disclosure requirements for servicing arrangements on continuing involvement in transferred financial assets.
Effective from accounting period beginning on or after January 01, 2016
Amendments to IFRS 10 - Consolidated Financial Statements, IFRS 12 - Disclosure of Interests in Other Entities and IAS 28 (Revised 2011) - Investments in Associates and Joint Ventures: Application of consolidation exception.
Effective from accounting period beginning on or after January 01, 2016
Amendments to IFRS 11 - Joint Arrangements: Accounting for acquisitions of an interest in a joint operation.
Effective from accounting period beginning on or after January 01, 2016
Amendments to IAS 1 - Presentation of Financial Statements: Amendments resulting from the disclosure initiative.
Effective from accounting period beginning on or after January 01, 2016

###
3.3 New accounting standards / amendments and IFRS interpretations that are not yet effective
Certain annual improvements have also been made to a number of IFRSs.
- IFRS 1 – First Time Adoption of International Financial Reporting Standards
- IFRS 14 – Regulatory Deferral Accounts
- IFRS 15 – Revenue from Contracts with Customers
- IFRS 16 – Leases
4 BASIS OF MEASUREMENT
4.1 Accounting convention
Amendments to IAS 16 - Property, Plant and Equipment and IAS 38 - Intangible Assets: Clarification on acceptable methods of depreciation and amortisation.
Effective from accounting period beginning on or after January 01, 2016
Amendments to IAS 16 - Property, Plant and Equipment and IAS 41 - Agriculture: Bringing bearer plants in scope of IAS 16.
Effective from accounting period beginning on or after January 01, 2016
Amendments to IAS 19 ‘Employee Benefits’: Clarification that the same currency bonds be used to determine the discount rate in which benefits are to be paid.
Effective from accounting period beginning on or after January 01, 2016
Amendments to IAS 27 (Revised 2011) ‘Separate Financial Statements’: Use of equity method to account for investments in subsidiaries, joint ventures and associates in separate financial statements.
Effective from accounting period beginning on or after January 01, 2016
Amendments to IAS 34 ‘Interim Financial Reporting’: Clarification related to certain disclosures, i.e., if they are not included in the notes to interim financial statements and disclosed elsewhere should be cross referred.
Effective from accounting period beginning on or after January 01, 2016
The following standards, amendments and interpretations are only effective for accounting periods, beginning on or after the date mentioned against each of them. These standards, interpretations and the amendments are either not relevant to the Company's operations or are not expected to have significant impact on the Company's financial statements other than certain additional disclosures.
Amendments to IFRS 2 'Share-based Payment': Clarification of the classification and measurement of share-based payment transactions
Effective from accounting period beginning on or after January 01, 2018
Amendments to IAS 7 'Statement of Cash Flows': Amendments as result of the disclosure initiative
Effective from accounting period beginning on or after January 01, 2017
Amendments to IAS 12 'Income Taxes': Recognition of deferred tax assets for unrealised losses
Effective from accounting period beginning on or after January 01, 2017
Amendments resulting from Annual Improvements 2014–2016 Cycle (clarifying certain fair value measurements)
Effective from accounting period beginning on or after January 01, 2018
Amendments to IAS 40 'Investment Property': Clarification on transfers of property to or from investment property.
Effective from accounting period beginning on or after January 01, 2018
IFRIC 22 'Foreign Currency Transactions and Advance Consideration': Provides guidance on transactions where consideration against non-monetary prepaid asset / deferred income is denominated in foreign currency.
Effective from accounting period beginning on or after January 01, 2018
Other than the aforesaid standards, interpretations and amendments, the International Accounting Standards Board (IASB) has also issued the following standards which have not been adopted locally by the Securities and Exchange Commission of Pakistan:
- IFRS 9 – Financial Instruments
These financial statements have been prepared under the historical cost convention except for certain staff retirement benefits which are measured at present value and certain investments which are measured at fair value and amortised cost.

5 CRITICAL ACCOUNTING ESTIMATES AND JUDGEMENTS
a) Provision against doubtful advances (note 10.5) e) Deferred tax asset (note 13)
b) Gratuity payable (note 16.2) f) Accumulating compensated absences (note 16.3)
c) Residual values of operating fixed assets and intangibles (note 11.3 and note 11.2)
d) Provision for taxation (note 26)
6 SUMMARY OF SIGNIFICANT ACCOUNTING POLICIES
6.1 Cash and cash equivalents
6.2 Advances
a)
b) Substandard: These are advances in arrears (payments / installments overdue) for 60 days or more but less than 90 days.
c) Doubtful: These are advances in arrears (payments / installments overdue) for 90 days or more but less than 180 days.
d) Loss: These are advances in arrears (payments / installments overdue) for 180 days or more.
Specific and general provisions are charged to income for the year.
6.3 Investments
Investments are classified as follows:
Held for trading
Held-to-maturity
The preparation of financial statements in conformity with approved accounting standards requires the use of certain critical accounting estimates. It also requires the management to exercise its judgment in the process of applying the Bank's accounting policies. Estimates and judgments are continually evaluated expectations of future events that are believed to be reasonable under the circumstances. The areas where various assumptions and estimates are significant to the Bank's financial statements are as follows:
The principal accounting policies applied in the preparation of these financial statements are set out below. These policies have been consistently applied to all the years presented, unless otherwise stated.
Cash and cash equivalents for the purpose of cash flow statement represent cash in hand and balances held with treasury banks and balances held with other banks in current and deposit accounts with maturities of less than three months.
These are stated net of provision for non-performing advances, (if any). The outstanding portion of the advances, payments against which are overdue for 30 days or more, are classified as non-performing and divided into the following four categories as prescribed in Prudential Regulations for Microfinance Banks issued by SBP:
Other assets especially mentioned (OAEM): These are advances in arrears (payments / installments overdue) for 30 days or more but less than 60 days.
In addition, a general provision is maintained equivalent to 1% (2015:1%) of the net outstanding balance (advances net of specific provisions) for potential loan losses. General provision is not required in cases where loans have been secured against gold or other cash collaterals with appropriate margin.
Non-performing advances are written off one month after the loan is classified as 'Loss' in accordance with the requirements of the Prudential Regulations for Microfinance Banks issued by the State Bank of Pakistan. However, the Bank continues its efforts for recovery of the written off balances.
All purchases and sale of investments are recognised using settlement date accounting. Settlement date is the date on which investments are delivered to or by the Bank. All investments are derecognised when the right to receive the economic benefits from the investments has expired or has been transferred and the Bank has transferred substantially all the risks and rewards of ownership.
Securities acquired with the intention to dispose off within 90 days trade by taking advantage of short-term market / interest rate movement are classified as held for trading investments.
These are measured at mark-to-market and surplus / deficit arising on revaluation of held for trading investments is recognised in profit and loss account.
Investments with fixed maturity, where management has both the intent and the ability to hold till maturity, are classified as held-to-maturity and are initially measured at cost.
Subsequently these are measured at amortised cost using the effective yield method. Any premium paid or discount availed on acquisition of held-to-maturity investments is amortised and charged to profit and loss account over the remaining term of the investment using the effective interest rate method.

Available for sale
6.4 Operating fixed assets and depreciation
Capital work-in-progress
Capital work-in-progress is stated at cost less accumulated impairment losses, if any.
Tangible fixed assets - Owned
Operating fixed assets are stated at cost less accumulated depreciation and accumulated impairment losses, if any.
Tangible fixed assets - Leased
The outstanding obligations under the lease agreements are shown as a liability net of finance charges allocable to future periods.
Depreciation
Intangible assets
Full month's amortisation is charged in the month of addition while no amortisation is charged in the month of deletion.
6.5 Impairment
6.6 Grants
Investments that are intended to be held for an undefined period of time but may be sold in response to the need for liquidity or changes in interest rates are classified as available for sale.
Investments classified as available-for-sale are initially measured at cost, being the fair value of consideration paid. Subsequent to initial recognition at cost, these investments are measured at fair value (quoted market price), unless fair value cannot be reliably measured. The investments for which a quoted market price is not available, are measured at cost as it is not possible to apply any other valuation methodology.
The surplus / (deficit) arising on revaluation of available for sale investments is shown in the balance sheet below equity. The surplus / (deficit) arising on these investments is recognised in the profit and loss account, when actually realised on upon disposal.
Leases in terms of which the Bank assumes substantially all the risks and rewards of ownership are classified as assets subject to finance lease. These are stated at amounts equal to the lower of their fair value and the present value of minimum lease payments at inception of the lease, less accumulated depreciation and impairment losses (if any).
Financial charges are allocated over the period of the lease term so as to provide a constant periodic rate of financial charge on the outstanding liability.
Depreciation is calculated using the straight line method so as to write off the operating fixed assets, over their expected useful lives. Depreciation is calculated at the rates stated in note 11.3. The assets' residual values, useful lives and depreciation methods are reviewed and adjusted, if appropriate, at each balance sheet date. The effect of any revision are charged to profit and loss account for the year, when the changes arise.
Subsequent costs are included in the asset's carrying amount or recognised as a separate asset, as appropriate, only when it is probable that future benefits associated with the item will flow to the Bank and the cost of the item can be measured reliably. All other repair and maintenance are charged to profit and loss account as and when incurred.
An item of property and equipment is derecognised upon disposal or when no future economic benefits are expected from its use or disposal. Gains and losses on disposals are determined by comparing proceeds with the carrying amount. These are included in the income for the year.
Expenditure incurred to acquire computer software are capitalised as intangible assets and stated at cost less accumulated amortisation and any identified impairment loss. These are amortised using the straight line method over their estimated useful life.
The Bank assesses at each balance sheet date whether there is any indication that assets may be impaired. If such indication exists, the carrying amounts of such assets are reviewed to assess whether they are recorded in excess of their recoverable amount. Where carrying amounts exceed the respective recoverable amount, assets are written down to their recoverable amounts and the resulting impairment loss is recognised in profit and loss account. The recoverable amount is the higher of an asset’s fair value less cost to sell and value in use. Where an impairment loss is recognised, the amortisation charge is adjusted in the future periods to allocate the asset’s revised carrying amount over its estimated useful life.
Grants are initially recognised at fair value in the balance sheet when there is reasonable assurance that the grants will be received and the Bank will comply with all the attached conditions. Grants that compensate the Bank for expenses incurred are recognised as other income in the profit and loss account on a systematic basis in the same periods in which the expenses are incurred. Grants that compensate the Bank for the cost of an asset are recognised in the profit and loss account as other income on a systematic basis over the useful life of the asset.

6.7 Staff retirement benefits
6.7.1 Defined contribution plan
6.7.1.1 Provident Fund
6.7.2 Defined benefit plan
6.7.2.1 Gratuity scheme
6.7.3 Accumulated compensated absences
6.8 Taxation
6.8.1 Current tax
6.8.2 Deferred tax
6.9 Deposits
6.10 Borrowing
Finance costs are accounted for on an accrual basis and are included in other liabilities to the extent of the amount remaining unpaid.
6.11 Provisions
6.12 Statutory reserve
6.13 Depositors' Protection Fund
The Bank operates an approved defined contribution provident fund scheme for all permanent employees. Equal monthly contributions are made by the Bank and the employees to the fund at the rate of 10% of basic salary per month.
The Bank operates an unapproved non-contributory defined benefit gratuity scheme for all permanent employees with a qualifying period of five years. During the year, the Bank has reduced the qualifying period from five years to three years. Eligible employees are entitled to one month's basic salary for each completed year of service upon their departure from the Bank. The latest actuarial valuation was carried out as at December 31, 2016 using Projected Unit Credit Method. Actuarial gains and losses arising from the actuarial valuation are recognised immediately in other comprehensive income.
The Bank used to provide for its liabilities towards vested compensated absences accumulated by its employees. During the year bank changed its policy for encashment of compensated absences as accumulated compensated absences are not encashed. This change has resulted in reversal of provision aggregating Rs. 14,232,128.
Income tax on the profit or loss for the year comprises of current and deferred tax. Income tax is recognised in the profit and loss account, except to the extent that it relates to items recognised in other comprehensive income, in which case it is recognised in other comprehensive income.
Provision for current tax is based on the taxable income for the year determined in accordance with the prevailing laws for taxation of income. The charge for current tax is calculated using prevailing tax rates or tax rates expected to apply to the profit for the year, if enacted. The charge for current tax also includes adjustments, where considered necessary, to provision for taxation made in previous years arising from assessments framed during the year for such years.
Deferred tax is accounted for using the balance sheet liability method in respect of all temporary differences arising from differences between the carrying amount of assets and liabilities in the financial statements and the corresponding amounts used for taxation purposes. Deferred tax liabilities are generally recognised for all taxable temporary differences and deferred tax assets are recognised to the extent that it is probable that taxable profits will be available against which the deductible temporary differences, unused tax losses and tax credits can be utilised.
Deposits are recorded at the proceeds received. Markup accrued on these deposits, if any, is recognised separately as part of other liabilities, and is charged to profit and loss account over the period.
Loans and borrowings are initially recorded at proceeds received. In subsequent periods, borrowings are stated at amortised cost using the effective yield method.
Provisions are recognised when the Bank has a present legal or constructive obligation as a result of past events and it is probable that an outflow of resources embodying economic benefits will be required to settle the obligation and a reliable estimate of the amount of obligation can be made. Provisions are reviewed at each balance sheet date and adjusted to reflect the current best estimates.
The Bank is required under Microfinance Institutions Ordinance, 2001 to maintain a statutory reserve to which an appropriation equal to 20% of the annual after tax profit is made.
The Bank is required under the Microfinance Institutions Ordinance, 2001 to contribute 5% of its annual after tax profit and profit earned on the investments of the fund shall be credited to the Depositors' Protection Fund for the purpose of providing security or guarantee to persons depositing money in the Bank.

6.14 Revenue recognition
Return on bank deposits and investment is recognised on an accrual basis.
Fee and commission income is recognised as services are rendered.
Other income is recognised on an accrual basis.
6.15 Foreign currency transactions and translations
Exchange differences are charged to income in the period in which they arise.
6.16 Financial instruments
6.16.1 Financial assets and financial liabilities
6.16.2 Off setting
6.16.3 Share capital
6.17 Functional and presentation currency
6.18 Earnings per share
Mark-up / return on performing advances is recognised using effective interest rate method at the Bank's prevailing mark-up rates for the loan products. Mark-up / income on advances is collected with loan installments due but unpaid mark-up is accrued on overdue advances for a period up to 29 days. From the 30th day, overdue advances are classified as non-performing advances and further accrual of unpaid service charges / income ceases. Accrued mark-up on non-performing advances are reversed and credited to suspense account. Mark-up recoverable on non-performing advances and classified investments is recognised on a receipt basis.
All monetary assets and liabilities in foreign currencies are translated into rupees at exchange rates prevailing at the balance sheet date. Transactions in foreign currencies are translated into rupees at the spot rate. All non-monetary items are translated into rupees at exchange rates prevailing on the date of transaction or on the date when fair values are determined.
Financial assets and financial liabilities are recognised when the Bank becomes a party to the contractual provisions of the instrument and derecognized when the Bank looses control of the contractual contract that comprise the financial assets and in case of financial liabilities when the obligation specified in the contract is discharged, cancelled or expired.
All financial assets and liabilities are initially measured at cost, which is the fair value of the consideration given and received, respectively. These financial assets and liabilities are subsequently measured at fair value, amortised cost or cost, as the case may be.
Financial instruments carried on the balance sheet include cash and balances with treasury banks, balances with other banks, lending to financial institutions, investments, advances, other assets, bills payable, borrowings, deposits and other liabilities. The particular measurement methods adopted are disclosed in the individual policy statements associated with each item.
Financial assets and financial liabilities are set off and the net amount is reported in the financial statements when there is a legally enforceable right to set off and the Bank intends to either settle on a net basis, or to realise the assets and to settle the liabilities simultaneously.
Ordinary shares are classified as equity and recognized at their face value. Incremental costs directly attributable to the issue of new shares or options are shown in equity as deduction, net of tax, from the proceeds.
Items included in the financial statements are measured using the currency of the primary economic environment in which the Bank operates. The financial statements are presented in Pakistani Rupees, which is the Bank's functional and presentation currency.
The Bank presents earnings per share (EPS) for its ordinary shares which is calculated by dividing the profit or loss attributable to ordinary shareholders of the Bank by weighted average number of ordinary shares outstanding during the year. Diluted EPS is determined by adjusting the profit or loss attributable to ordinary shareholders and the weighted average number of ordinary shares outstanding for the effect of all dilutive potential ordinary shares (if any).

2016 20157 Cash and balances with SBP and NBP Note Rupees Rupees
Cash in hand 147,056,414 93,549,573 Balance with State Bank of Pakistan 7.1 551,278,135 245,236,566 Balance with National Bank of Pakistan in : Deposit accounts 7.1 24,014,414 17,601,439 Current accounts 7.1 87,325,680 250,900
809,674,643 356,638,478
7.1
2016 20158 Balances with other banks Note Rupees Rupees
In Pakistan:Saving accounts 8.1 1,002,522,213 238,715,690 Deposit accounts 8.2 155,000,000 125,000,000 Current accounts 90,962,717 46,275,006
1,248,484,930 409,990,696
8.1 These accounts carry mark-up ranging from 3.5% to 8.0% (2015: 4.5% to 9.3%) per annum.
8.2 These term deposits carry mark-up ranging from 6% to 11.25% (2015: 6.55% to 9.00%) per annum with maturity up to one month.
2016 20159 Investments-net of provisions Note Rupees Rupees
Federal Govt. Securities:Market Treasury Bills (Held to maturity) 9.1 1,885,328,850 1,039,196,250
9.1
2016 2015Note Number Rupees Number Rupees
10 Advances
Micro credit advances 10.1 132,880 10,135,920,390 90,804 5,438,119,109 Other advances 10.2 721 73,208,256 476 40,638,816
10,209,128,646 5,478,757,925 Less: Provisions held:Specific 10.5 1,710 29,949,986 2,154 14,415,116 General 10.4 96,914,686 45,667,075 Sub-Total 126,864,672 60,082,191 Advances (net of provision) 10,082,263,974 5,418,675,734
10.1
10.2
10.3 Particulars of non-performing advances
2016
Number %
Rupees Rupees
OAEM 534 36,990,697 0 - - Sub-standard 367 23,269,770 25 5,083,300 5,083,300 Doubtful 804 53,936,252 50 24,086,689 24,086,689 Loss 5 779,997 100 779,997 779,997 Total 1,710 114,976,716 29,949,986 29,949,986
This represents the balance maintained with SBP and NBP to meet the minimum balance requirement equivalent to 5% as cash reserve and 10% as liquidity reserve of the Bank's time and demand liabilities in accordance with the Prudential Regulations.
These carry yield rate ranging between 5.77% to 6.95% (2015: 6.41% to 6.95%) per annum and have maturity upto April 13, 2017.These securities have an aggregate face value of Rs. 1,900,000,000 (2015: Rs. 1,050,000,000)
This includes fully secured advances amounting to Rs.487,709,188 (2015: Rs. 899,903,430) whereas the remaining advances are secured by personal guarantees.
These advances are staff loans and carry markup rate of 5% per annum (2015: 5%). This amount includes a loan sanctioned to the Chief Executive Officer of Rs. 5,845,175 (2015: Rs. 4,260,830) at a markup rate of 5% (2015: 5%).
The total advances of Rs. 114,976,716 (2015: Rs. 126,350,998) placed under non-performing status includes Rs 16,278,010 (2015: Rs. 84,220,264) against secured gold loans:
Amount outstanding
Provision required
Provision held

2015
Number %Rupees Rupees
OAEM 471 26,748,246 0 - - Sub-standard 345 19,097,718 25 2,005,553 2,005,553 Doubtful 1,327 80,116,646 50 12,117,737 12,117,737 Loss 11 388,388 100 291,826 291,826 Total 2,154 126,350,998 14,415,116 14,415,116
10.4
10.5 Particulars of non-performing advances
Movement of provision against non-performing advances is as under:
2016 2015Specific General Total Specific General Total
Note …..…………...(Rupees)…...……... …..…………...(Rupees)…...……...
Balance as at January 1 14,415,116 45,667,075 60,082,191 8,274,452 25,472,839 33,747,291 Charge for the year 105,502,766 51,247,611 156,750,377 57,316,777 20,194,236 77,511,013 Reversal during the year - - - - - - Amounts written off 10.5.1 (89,967,896) - (89,967,896) (51,176,113) - (51,176,113)
15,534,870 51,247,611 66,782,481 6,140,664 20,194,236 26,334,900 Balance as at December 31 29,949,986 96,914,686 126,864,672 14,415,116 45,667,075 60,082,191
2016 201510.5.1 Particulars of write offs Note Rupees Rupees
Against provisions 89,967,896 51,176,113 Directly charged to profit and loss account 62,460,438 28,143,149
152,428,334 79,319,262
11 Operating fixed assets
Capital work-in-progress 11.1 65,980,795 29,523,350 Intangible assets 11.2 129,391,422 108,634,332 Property and equipment 11.3 725,475,033 638,494,507
920,847,250 776,652,189
11.1 Capital work-in-progress
Civil works 10,873,479 7,609,988 Equipment 26,123,143 9,781,274 Intangible assets 7,897,362 10,291,902 Advances to suppliers and contractors 21,086,811 1,840,186
65,980,795 29,523,350
11.2 Intangible assets
Computer software
CostBalance as at January 1 219,257,516 168,492,178 Additions during the year 66,125,768 50,765,338 Reversal during the year (11,153,797) - Balance as at December 31 274,229,487 219,257,516
AmortizationBalance as at January 1 110,623,184 86,281,177 Charge during the year 34,214,881 24,342,007 Balance as at December 31 144,838,065 110,623,184
Carrying amount 129,391,422 108,634,332
2016 2015
Amortization rate 10% - 20% 10% - 20%
Amount outstanding
Provision required Provision held
This represents general provision equivalent to 1% (2015: 1%) of the outstanding advances net of specific provisions and those against which gold collaterals are taken.
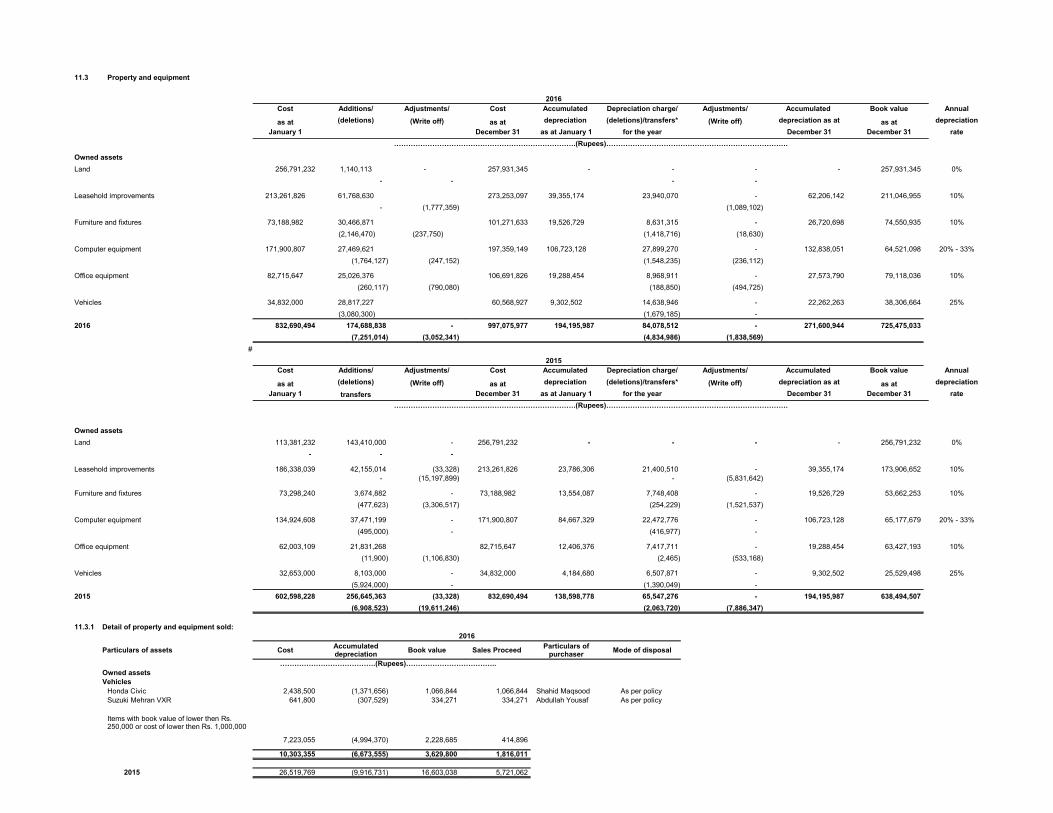
11.3 Property and equipment
2016Cost Additions/ Adjustments/ Cost Accumulated Depreciation charge/ Adjustments/ Accumulated Book value Annual
as at (deletions) (Write off) as at depreciation (deletions)/transfers* (Write off) depreciation as at as at depreciation
January 1 December 31 as at January 1 for the year December 31 December 31 rate
………………………………………………………………….(Rupees)………………………………………………………………….
Owned assets
Land 256,791,232 1,140,113 - 257,931,345 - - - - 257,931,345 0%
- - - -
Leasehold improvements 213,261,826 61,768,630 273,253,097 39,355,174 23,940,070 - 62,206,142 211,046,955 10%
- (1,777,359) (1,089,102)
Furniture and fixtures 73,188,982 30,466,871 101,271,633 19,526,729 8,631,315 - 26,720,698 74,550,935 10%
(2,146,470) (237,750) (1,418,716) (18,630)
Computer equipment 171,900,807 27,469,621 197,359,149 106,723,128 27,899,270 - 132,838,051 64,521,098 20% - 33%
(1,764,127) (247,152) (1,548,235) (236,112)
Office equipment 82,715,647 25,026,376 106,691,826 19,288,454 8,968,911 - 27,573,790 79,118,036 10%
(260,117) (790,080) (188,850) (494,725)
Vehicles 34,832,000 28,817,227 60,568,927 9,302,502 14,638,946 - 22,262,263 38,306,664 25%
(3,080,300) (1,679,185) -
2016 832,690,494 174,688,838 - 997,075,977 194,195,987 84,078,512 - 271,600,944 725,475,033
(7,251,014) (3,052,341) (4,834,986) (1,838,569)
###
2015Cost Additions/ Adjustments/ Cost Accumulated Depreciation charge/ Adjustments/ Accumulated Book value Annual
as at (deletions) (Write off) as at depreciation (deletions)/transfers* (Write off) depreciation as at as at depreciation
January 1 transfers December 31 as at January 1 for the year December 31 December 31 rate
………………………………………………………………….(Rupees)………………………………………………………………….
Owned assets
Land 113,381,232 143,410,000 - 256,791,232 - - - - 256,791,232 0%
- - - - - - -
Leasehold improvements 186,338,039 42,155,014 (33,328) 213,261,826 23,786,306 21,400,510 - 39,355,174 173,906,652 10% - (15,197,899) - (5,831,642)
Furniture and fixtures 73,298,240 3,674,882 - 73,188,982 13,554,087 7,748,408 - 19,526,729 53,662,253 10%
(477,623) (3,306,517) (254,229) (1,521,537)
Computer equipment 134,924,608 37,471,199 - 171,900,807 84,667,329 22,472,776 - 106,723,128 65,177,679 20% - 33%
(495,000) - (416,977) -
Office equipment 62,003,109 21,831,268 82,715,647 12,406,376 7,417,711 - 19,288,454 63,427,193 10%
(11,900) (1,106,830) (2,465) (533,168)
Vehicles 32,653,000 8,103,000 - 34,832,000 4,184,680 6,507,871 - 9,302,502 25,529,498 25%
(5,924,000) - (1,390,049) -
2015 602,598,228 256,645,363 (33,328) 832,690,494 138,598,778 65,547,276 - 194,195,987 638,494,507
(6,908,523) (19,611,246) (2,063,720) (7,886,347)
11.3.1 Detail of property and equipment sold:2016
Particulars of assets Cost Book value Sales Proceed Mode of disposal
………………………………….(Rupees)……………………………….. Owned assetsVehicles
Honda Civic 2,438,500 (1,371,656) 1,066,844 1,066,844 Shahid Maqsood As per policy Suzuki Mehran VXR 641,800 (307,529) 334,271 334,271 Abdullah Yousaf As per policy
7,223,055 (4,994,370) 2,228,685 414,896
10,303,355 (6,673,555) 3,629,800 1,816,011
2015 26,519,769 (9,916,731) 16,603,038 5,721,062
Accumulated depreciation
Particulars of purchaser
Items with book value of lower then Rs. 250,000 or cost of lower then Rs. 1,000,000

2016 201512 Other assets Rupees Rupees
Income / mark-up accrued on loans and advances 570,704,572 223,531,465 Income / mark-up accrued on balance with banks 7,793,310 104,270 Prepayments 40,651,478 17,940,558 Security deposits 2,183,644 2,194,844 Stationery and stamps on hand 9,175,660 5,982,242 Receivable from FINCA International, Inc. 18,317,306 18,488,325 Receivable from FINCA ( MESA Region ) 3,168,015 3,168,015 Others 12,963,584 12,438,667
664,957,569 283,848,386
13 Deferred tax asset
Deferred tax asset arising in respect of:Gratuity payable 32,203,210 21,819,465 Accumulating compensated absences - 4,981,280 Deferred tax asset on unused business losses - 100,373,846 Deferred tax asset on unabsorbed depreciation - 65,601,435
32,203,210 192,776,026 Deferred tax liability arising in respect of:
Property and equipment 25,795,518 25,858,832 6,407,692 166,917,194
13.1
14 Deposits
2016 2015Note Rupees Rupees
Fixed deposits 14.1 6,589 7,675,359,202 4,669 3,921,406,395 Saving deposits 14.1 106,120 2,041,534,933 100,308 1,295,568,840 Current deposits 350,769 1,352,761,717 277,054 840,388,868
463,478 11,069,655,852 382,031 6,057,364,103
14.1
2016 2015
Rupees Rupees
14.2 Particulars of deposits by ownership
1) Individual depositors 462,888 7,704,269,360 381,276 5,261,196,362 2) Institutional depositors:
a) Corporations, firms and other such entities 538 1,087,424,670 744 512,502,193 b) Banks and financial institutions 52 2,277,961,822 11 283,665,548
463,478 11,069,655,852 382,031 6,057,364,103
14.3 Deposits include deposits from related parties amounting to Rs. 71,561,229 (2015: Rs. 136,116,814).
2016 201515 Borrowings Note Rupees Rupees
Borrowings from banks/ financial institutions in Pakistan 15.1 1,350,001,756 115,000,880
15.1 Details of borrowings from financial institutionsSecured
- Running finance - JS Bank Limited 15.2 299,999,996 - - Running finance - NIB Bank Limited 15.3 150,001,760 115,000,660 - Running finance - UBL Bank Limited 15.4 400,000,000 220
- Term finance - Pak Oman Investment Company Limited 15.5 300,000,000 - - Term finance - UBL Bank Limited 15.6 200,000,000 -
1,350,001,756 115,000,880
The deferred tax asset recognized in the financial statements represents the management's best estimate of the potential benefit which is expected to be realized in future years in the form of reduced tax liability as the Bank would be able to set off the profits earned in those years against temporary differences.
Number of accounts
Number of accounts
These represent term deposits having tenure of 1 to 60 months carrying profit rates ranging from 7.95% to 14.20% (2015: 5.25% to 14.15%) per annum. The saving deposits represent accounts carrying interest rates ranging from 5% to 7.5% (2015: 6% to 10%) per annum.
Number of accounts
Number of accounts

15.2
15.3
15.4
15.5
15.6
2016 201516 Other liabilities Note Rupees Rupees
Markup / return / interest payable 16.1 159,935,612 94,128,504
Bills payable 14,624,542 5,840,158 Accrued expenses 120,786,729 96,490,899 Current taxation 137,144,960 19,819,806 Gratuity payable 16.2 92,009,170 62,341,329 Accumulating compensated absences 16.3 - 14,232,228 Payable to FINCA Afghanistan - 1,021,590 Withholding tax payable 7,733,612 6,681,973 Unutilized Grant payable to Stitching to Promote Women's World Banking 361,675 361,675 Unpaid dividend 99,944,340 - Sundry creditors 133,213,631 45,101,340
765,754,271 346,019,502
16.1 Markup payable on deposits from key management personnel amounts to Rs. 759,000 (2015: Rs. 460,000).
2016 ### 201516.2 Gratuity payable Rupees Rupees
Present value of defined benefit obligation 92,009,170 62,341,329
a) Changes in present value of defined benefit obligation
2016 ### 2015Rupees Rupees
Balance at 1 January 62,341,329 44,271,975
Included in profit and lossCurrent service cost 20,198,320 16,376,744
Past service cost 7,000,857 -
Interest cost 5,887,513 4,705,813
33,086,690 21,082,557 Included in other comprehensive incomeActuarial loss arising from experience adjustment 3,513,550 1,871,839 Payments made during the year (6,932,399) (4,885,042)Balance at 31 December 92,009,170 62,341,329
This is secured against first pari-passu charge on all present and future current assets of the Bank to the extent of financing amount with a 20% margin. Mark-up is payable quarterly at rate of 3 months KIBOR + 1.75bps (2015: 3 month KIBOR + 1.65bps) and commitment fee of 0.5% per annum payable quarterly. This facility is expiring by May 25, 2017. The total limit of the facility is Rs. 300 million.
This is secured against the unconditional and irrevocable MCGF of 40% by SBP and rest 60% will be secured through first pari-passu hypothecation charge on all assets including current and fixed assets located anywhere in Pakistan with 25% margin. Further any other security may be requested by bank from time to time plus the bank shall have a banker's lien on all the customer deposits, accounts and properties held with the Bank. Mark-up is payable quarterly at the rate of 3 months KIBOR + 1.60bps. (2015: 3 months KIBOR + 1.60bps.). The total limit of the facility is Rs. 200 million.
This is secured by first pari-passu charge on all present and future assets of the Bank to the extent of financing amount with a 25% margin. Mark-up is payable quarterly at the rate of 3 months KIBOR + 1.50bps. (2015: 3 months KIBOR + 1.00bps) with commitment fee of 0.25% per annum payable quarterly. This facility is expiring by August 10, 2017. The total limit of the facility is Rs. 400 million.
This is secured against first pari-passu charge on present and future current assets of the Bank to the extent of financing amount with a 25% margin. Mark-up is payable quarterly at the rate of 3 months KIBOR + 1.40bps.The principal will be paid in twelve equal quarterly installments, the first such installment falls due on September 23, 2017 and last installment on June 23, 2020. The total limit of the facility is Rs. 300 million.
This is secured against the unconditional and irrevocable MCGF of 40% by SBP and rest 60% will be secured through first pari-passu hypothecation charge on all assets including current and fixed assets located everywhere in Pakistan with a 25% margin. Mark-up is payable quarterly at the rate of 3 months KIBOR + 1.50bps. This facility is repayable on March 27, 2018. The total limit of the facility is Rs. 200 million.
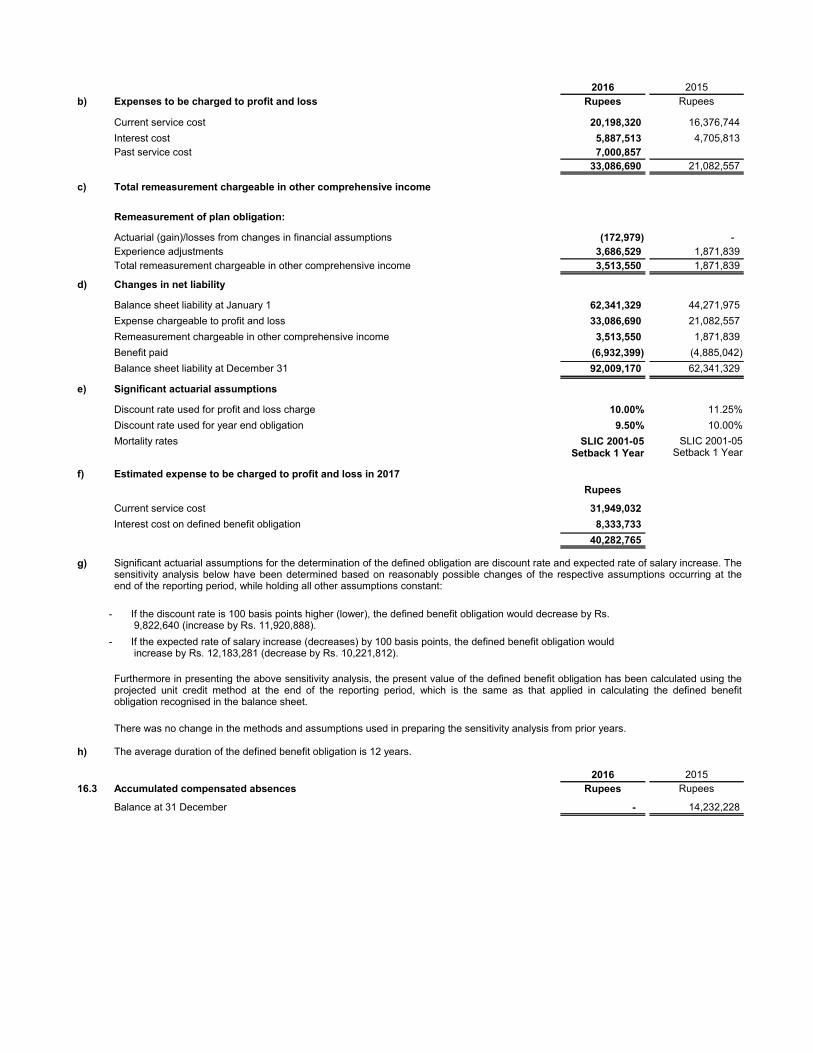
2016 2015b) Expenses to be charged to profit and loss Rupees Rupees
Current service cost 20,198,320 16,376,744
Interest cost 5,887,513 4,705,813 Past service cost 7,000,857
33,086,690 21,082,557
c) Total remeasurement chargeable in other comprehensive income
Remeasurement of plan obligation:
Actuarial (gain)/losses from changes in financial assumptions (172,979) - Experience adjustments 3,686,529 1,871,839 Total remeasurement chargeable in other comprehensive income 3,513,550 1,871,839
d) Changes in net liability
Balance sheet liability at January 1 62,341,329 44,271,975
Expense chargeable to profit and loss 33,086,690 21,082,557
Remeasurement chargeable in other comprehensive income 3,513,550 1,871,839
Benefit paid (6,932,399) (4,885,042)
Balance sheet liability at December 31 92,009,170 62,341,329
e) Significant actuarial assumptions
Discount rate used for profit and loss charge 10.00% 11.25%
Discount rate used for year end obligation 9.50% 10.00%
Mortality rates
f) Estimated expense to be charged to profit and loss in 2017
Rupees
Current service cost 31,949,032
Interest cost on defined benefit obligation 8,333,733
40,282,765
g)
-
-
There was no change in the methods and assumptions used in preparing the sensitivity analysis from prior years.
h) The average duration of the defined benefit obligation is 12 years.
2016 201516.3 Accumulated compensated absences Rupees Rupees
Balance at 31 December - 14,232,228
SLIC 2001-05Setback 1 Year
SLIC 2001-05Setback 1 Year
Significant actuarial assumptions for the determination of the defined obligation are discount rate and expected rate of salary increase. The sensitivity analysis below have been determined based on reasonably possible changes of the respective assumptions occurring at the end of the reporting period, while holding all other assumptions constant:
If the discount rate is 100 basis points higher (lower), the defined benefit obligation would decrease by Rs. 9,822,640 (increase by Rs. 11,920,888).
If the expected rate of salary increase (decreases) by 100 basis points, the defined benefit obligation would increase by Rs. 12,183,281 (decrease by Rs. 10,221,812).
Furthermore in presenting the above sensitivity analysis, the present value of the defined benefit obligation has been calculated using the projected unit credit method at the end of the reporting period, which is the same as that applied in calculating the defined benefit obligation recognised in the balance sheet.

a) Changes in present value of defined benefit obligation
2016 2015
Rupees Rupees
Balance at 1 January 14,232,128 11,543,054
Included in profit and lossCurrent service cost - 2,441,488
Interest cost - 1,298,494
- 3,739,982
Actuarial gain arising from experience adjustment - (1,050,908)Reversal during the year (14,232,128) -
Balance at 31 December - 14,232,128
b) Expenses to be charged to profit and loss
Current service cost - 2,441,488 Interest cost - 1,298,594 Actuarial gain arising of experience adjustment - (1,050,908)
- 2,689,174
c) Total remeasurement chargeable in profit and loss account.2016 2015
Remeasurement of plan obligation: Rupees Rupees
Total remeasurement chargeable in other comprehensive income - (1,050,908)
d) Changes in net liability
Balance sheet liability at January 1 14,232,128 11,543,054 Expense chargeable to profit and loss - 2,689,174 Reversal during the year (14,232,128) - Balance sheet liability at December 31 - 14,232,228
2016 2015
e) Significant actuarial assumptions
Discount rate used for profit and loss charge - 11.25%
Discount rate used for year end obligation - 10.00% Mortality rates -
17 Share capital2016 2015
17.1 Authorised capital Note Rupees Rupees
750,000,000 ordinary shares of Rs. 10 each 7,500,000,000 7,500,000,000
17.2 Issued, subscribed and paid-up share capital
634,888,711 Ordinary shares of Rs. 10 each fully paid in cash 17.3 6,348,887,110 6,348,887,110
17.3 Share capital has been subscribed by the following:
2016 2015 2016 2015(Number of shares) Rupees Rupees
FINCA Microfinance Cooperatief U.A 548,498,653 548,498,653 5,484,986,530 5,484,986,530 Kashf Holdings (Private) Limited 33,119,747 33,119,747 331,197,470 331,197,470 International Finance Corporation 30,771,739 30,771,739 307,717,390 307,717,390 Acumen Fund 5,130,253 5,130,253 51,302,530 51,302,530 Triodos Fair Share Fund 17,368,319 17,368,319 173,683,190 173,683,190
634,888,711 634,888,711 6,348,887,110 6,348,887,110
SLIC 2001-05Setback 1 Year

17.4 Percentage holding of shareholders is as follows:
2016 2015 2016 2015
Percentange of holding Rupees Rupees
FINCA Microfinance Cooperatief U.A 86.4% 86.4% 5,484,986,530 5,484,986,530
Kashf Holdings (Private) Limited 5.2% 5.2% 331,197,470 331,197,470
International Finance Corporation 4.8% 4.8% 307,717,390 307,717,390
Acumen Fund 0.8% 0.8% 51,302,530 51,302,530
Triodos Fair Share Fund 2.7% 2.7% 173,683,190 173,683,190 100% 100% 6,348,887,110 6,348,887,110
2016 201518 Deferred grants Note Rupees Rupees
Opening balance 18,296,924 18,211,626 Grants received from:
State Bank of Pakistan (value chain financing scheme) 18.1 - 4,075,000 Rumsfeld through FINCA International Inc. 18.2 - 6,199,374
- 10,274,374 Grants amortised (5,695,175) (9,167,155)Grants refunded - (1,021,921)
12,601,749 18,296,924
18.1
18.2
19 Memorandum / Off-balance sheet items
19.1 Contingencies
19.1.1
2016 201520 Mark-up / return / interest earned Note Rupees Rupees
Interest / mark-up on advances 2,883,194,576 1,788,636,094 Markup earned on investments in government securities 54,070,498 77,477,643 Interest / mark-up on bank accounts 48,784,961 33,640,140
2,986,050,035 1,899,753,877
21 Mark-up / return / interest expensed
Deposits 618,149,047 517,104,251 Borrowings 29,443,650 17,565,199
647,592,697 534,669,450
22 Fee, commission and brokerage income
Loan processing fee 331,184,390 115,256,068
Income on Cheque Book issuance 27,069,944 20,167,287
Others 83,141,449 147,972,972 441,395,783 283,396,327
23 Other income
Grant income 18 5,695,175 9,167,155
Recovery of debts previously written off 104,213,066 33,257,811
Others 285,422 350,779
110,193,663 42,775,745
This represents grant received from State Bank of Pakistan (SBP) under the Financial Innovation Challenge Fund (FICF) of Financial Inclusion Program (FIP) to promote Innovative Rural and Agricultural Finance in Pakistan. The term of the grant is from July 01, 2014 to December 31, 2014 and Rs. 10,745,000 amounts in aggregate.
This represents grant from Finca International Inc. to leverage technology through implementation of automated call center solution to enable the Bank to have direct communication channel with women clients to facilitate them and gauge service levels and promote marketing while fulfilling regulatory prerequisite for consumer protection.
Assistant Commissioner of Sindh Revenue Board issued an order regarding scrutiny of input tax claimed and raised a demand of Rs. 889,993. Appeal has been filed to Commissioner Appeals, Sindh Revenue Board against said order, which is pending for decision.

2016 201524 Administrative expenses Note Rupees Rupees
Staff salaries and other benefits 24.1 848,182,082 ### 683,576,661
Non-executive directors' fees, allowances and other expenses 675,000 -
Contribution to employee provident fund 36,660,241 33,128,895
Printing, stationery and periodicals 33,432,199 ### 23,892,271
Advertisement 70,301,523 ### 36,189,519
Rent 102,983,454 ### 75,293,960
Office running expenses 28,726,173 ### 22,485,982
Vehicle running expenses 13,868,905 ### 12,920,030
Insurance 11,959,673 ### 13,304,026
Office security / personnel services 61,729,621 ### 49,324,273
Repairs and maintenance 52,895,452 ### 42,450,443
Communication 59,824,686 ### 57,384,771
Travel and transportation 101,771,197 ### 78,449,718
Utilities 40,331,839 ### 36,729,241
Legal and professional 45,601,320 ### 40,460,685
Auditors' remuneration 24.2 3,305,000 ### 2,870,000
Training and research 25,755,582 ### 20,401,473
Depreciation 11.3 84,078,512 ### 65,547,276
Amortization 11.2 34,214,881 24,342,007
Others 13,463,168 ### 3,261,171
1,669,760,508 ### 1,322,012,402
2016 2015Rupees Rupees
24.2 Audit fee 2,775,000 2,520,000 Fee for certifications 200,000 50,000 Out of pocket expenses 330,000 ### 300,000
3,305,000 2,870,000
25 Other charges
Penalties imposed by SBP 1,043,000 740,750 Bank charges 9,336,276 6,497,061 Net loss on disposal / deletion of fixed assets 1,813,789 10,881,968 Others 1,287,079 250,000
13,480,144 18,369,779
26 Taxation
CurrentFor the year 184,377,277 21,831,502 For the prior year 10,583,237 -
194,960,514 21,831,502
Deferred
For the year 161,646,128 78,147,708 For the prior year 93,117 (21,453,574)
161,739,245 56,694,134 356,699,759 78,525,636
26.1 Relationship between tax expense and accounitng profit
Accounting profit before taxation 987,595,317 245,220,156 Tax rate % 35% 35%Tax on accounting rate 345,658,361 85,827,055 Tax effect of income chargeable to tax at lower rate - 21,831,502 Prior year tax adjustment 10,676,354 (21,453,574)
Tax effect of inadmissible expenses 365,044 259,263 Effect on deferred tax balance due to unabsorbed depreciation - (7,938,610)Tax provision 356,699,759 78,525,636
24.1
This includes Rs. 33,086,689 (2015: Rs. 21,082,557) in respect of staff gratuity expense and Rs. 1,413,207 (2015: Rs. 1,363,674) in respect of gratuity expense of Chief Executive Officer.

27 Number of employees
2016 2015
Permanent 874 687 1,561 575 613 1,188
Contractual 1 144 145 1 135 136
Total 875 831 1,706 576 748 1,324
28 Number of branches and permanent booths
2016 2015
Branches Branches Permanent Booths
At the beginning of the year 79 21 42 58
Opened during the year 5 - - - Upgraded from permanent booths 21 (21) 37 (37)
At the end of the year 105 - 79 21
No branch was closed during the year.
29 Remuneration of directors and executives
Chief Executive Directors Executives2016 2015 2016 2015 2016 2015
…………………………………………..(Rupees)…………………………………………...
Managerial remuneration 15,119,796 12,928,896 675,000 - 102,205,438 78,514,575
House rent allowance - - - - 43,385,309 31,405,888
Provident fund 1,511,978 1,292,892 - - 9,928,400 10,193,145
Utilities allowance - - - - 6,986,380 4,868,119
Medical allowance 1,511,316 1,292,400 - - 3,234,157 2,983,342
Conveyance / car allowance 840,000 576,000 - - 15,275,627 13,331,750
Others 1,035,876 - - - 4,238,640 6,122,720 20,018,966 16,090,188 ### 675,000 ### - ### 185,253,951 ### 147,419,539
1 1 3 - 98 76
29.3
2016 201530 Basic and diluted earnings per share Rupees Rupees
30.1 Profit for the year 630,895,558 166,694,520
Weighted average number of ordinary shares - number 634,888,711 540,569,155
Basic and diluted earnings per share 0.99 0.31 1
30.2 There is no dilutive effect on the basic earnings per share of the Bank.
31 Related party transactions
Credit / Salesstaff
Banking / Support
staffTotal staff
Credit / Salesstaff
Banking / Supportstaff
Total staff
Permanent Booths
The aggregate amounts charged in the financial statements for the year in respect of remuneration, including benefits to the Chief Executive, Directors and Executives of the Bank are as follows:
Number of persons at year end
29.1
Executive means employees, other than the chief executive and directors, whose basic salary exceed five hundred thousand rupees in a financial year.
29.2
Aggregate amount charged to profit and loss account for the year in respect of travelling and hotel expenses of directors is Rs. 151,890 (2015: Rs 376,879) and Rs. 434,525 (2015: Rs. 351,325) respectively.
The Bank provides car allowance of Rs. 840,000 (2015: Rs. 576,000) per annum to the Chief Executive Officer as part of the remuneration.
The Bank's related parties comprise of directors, key management personnel, shareholders and entities over which the directors are able to exercise significant influence and employee gratuity fund. The detail of Bank's shareholders is given in note 17.3 while remuneration of key management personnel is disclosed in note 29 to the financial statements. Transactions with related parties during the year, other than those which have been disclosed elsewhere in these financial statements, are as follows:

2016 2015
…………………………………………..(Rupees)…………………………………………...DepositsOpening balance 50,579,689 600 85,536,525 61,622,976 600 84,479,808
Received during the year 312,698,362 - 91,349,000 209,676,332 - 15,271,226
Withdrawn during the year (302,863,852) (600) (165,738,494) (220,719,619) - (14,214,509)
Closing balance 60,414,199 - 11,147,031 50,579,689 600 85,536,525
Staff loansOpening balance 8,561,118 - - 11,681,932 - -
Disbursements during the year 42,523,593 - - 13,993,400 - -
Repayments during the year (34,969,906) - - (17,114,214) - -
Closing balance 16,114,805 - - 8,561,118 - -
Transactions during the year
Mark-up/return/interest earned 688,141 - - 897,822 - -
Mark-up/return/interest expensed 3,244,602 - 7,709,647 5,652,337 301,928
Contribution to provident fund 11,440,378 - - 10,147,194 - -
2016 201532 Cash and cash equivalents Note Rupees Rupees
Cash and balances with SBP and NBP 7 809,674,643 356,638,478
Balances with other banks 8 1,248,484,930 409,990,696
2,058,159,573 766,629,174
33 Capital risk management
Key management
personnel
Associated company /
parent
Other related parties
Key management personnel
Associated company / parent
Other related parties
33.1
The objective of managing capital is to safeguard the Bank's ability to continue as a going concern, so that it could continue to provide adequate returns and benefits to stakeholders by pricing products and services commensurately with the level of risk and comply with capital requirements set by SBP. It is the policy of the Bank to maintain a strong capital base at a reasonable cost so as to maintain investor, creditor and market confidence, sustain future development of the business and achieve low overall cost of capital with appropriate mix of cost of capital. The impact of the level of capital on shareholders' return is also recognised and the Bank recognises the need to maintain a balance between the higher returns that might be possible with higher gearing and the advantages and security afforded by a sound capital position.
As per amendments on Prudential Regulations (R-1) issued vide BPRD Circular No. 10 of 2015 dated June 03, 2015, the minimum paid up capital requirement (MCR), free of losses for Microfinance Banks operating at national level is Rs. 1,000 million as at December 31, 2016. As at December 31, 2016, the paid up share capital net of discount, of the Bank stood at Rs. 2,259.847 million (2015: Rs. 2,259.847 million).
The capital of the Bank is managed keeping in view the minimum CAR (15%) required by the Prudential Regulations for the Microfinance Banks / Institutions. The adequacy of the capital is tested with reference to the risk-weighted assets of the Bank. The calculation of capital adequacy enables the Bank to assess the long-term soundness. As the Bank conducts business on a wide area network basis, it is critical that it is able to continuously monitor the exposure accross the entire organization.
The Bank manages its capital structure and makes adjustments to it in light of changes in regulatory and economic conditions. In order to maintain or adjust the capital structure, the Bank may adjust the amount of dividend paid to shareholders, return capital to shareholders or issue new shares.
As at December 31, 2016, the Bank's Capital adequacy ratio (CAR) is approximately 20.59% (2015: 30.34%) of its weighted exposure, as against the minimum requirement of 15% prescribed by SBP.

34 Financial assets and liabilities
2016
Interest bearing / exposed to yield / interest risk Non-Interest bearing / not exposed to yield / interest risk
Upto one month Over one year Sub total Upto one month Over one year Sub total Total
% Rupees
Financial assets
On balance sheet
Cash and balances with SBP and NBP - 24,014,414 - - - 24,014,414 785,660,229 - - - 785,660,229 809,674,643
Balances with other banks/NBFIs/MFBs 3.5%-11.25% 1,057,522,213 100,000,000 - - 1,157,522,213 90,962,717 - - - 90,962,717 1,248,484,930
Investments - net of provisions 5.77%-6.95 748,737,472 1,136,591,378 - - 1,885,328,850 - - - - - 1,885,328,850
Advances - net of provisions 5% - 49.8% 650,156,308 ### 4,837,914,575 ### 3,955,442,189 ### 638,750,902 10,082,263,974 - - - - - 10,082,263,974
Other assets - - - - 590,441,525 22,506,911 - 2,183,644 615,132,080 615,132,080
2,480,430,407 6,074,505,953 3,955,442,189 638,750,902 13,149,129,451 1,467,064,471 22,506,911 - 2,183,644 1,491,755,026 14,640,884,477
Off balance sheet - - - - - - - - - - -
Total 2,480,430,407 6,074,505,953 3,955,442,189 638,750,902 13,149,129,451 1,467,064,471 22,506,911 - 2,183,644 1,491,755,026 14,640,884,477
Financial liabilities
On balance sheet
Deposit and other accounts 5%-14.15% 3,188,952,986 3,110,888,978 1,366,138,116 2,050,914,055 9,716,894,135 1,352,761,717 - - - 1,352,761,717 11,069,655,852
Borrowings 7.35%-8.09% - ### - ### 900,001,756 ### 450,000,000 ### 1,350,001,756 - - - - - 1,350,001,756
Other liabilities - - ### - ### - ### - ### - 396,022,871 ### 50,747,585 ### 48,965,584 ### 125,139,659 620,875,699 620,875,699
3,188,952,986 3,110,888,978 2,266,139,872 2,500,914,055 11,066,895,891 1,748,784,588 50,747,585 48,965,584 125,139,659 1,973,637,416 13,040,533,307
Off balance sheet - - - - - - - - - - -
Total 3,188,952,986 3,110,888,978 2,266,139,872 2,500,914,055 11,066,895,891 1,748,784,588 50,747,585 48,965,584 125,139,659 1,973,637,416 13,040,533,307
On balance sheet gap (708,522,579) 2,963,616,975 1,689,302,317 (1,862,163,153) 2,082,233,560 (281,720,117) (28,240,674) (48,965,584) (122,956,015) (481,882,390) 1,600,351,170
Off balance sheet gap - - - - - - - - - - -
Effective yield /
interest rate
Over one month upto six months
Over six months upto one year
Over one month upto six months
Over six months upto one year

34 Financial assets and liabilities (cont'd)
2015
Interest bearing / exposed to yield / interest risk Non-Interest bearing / not exposed to yield / interest risk
Upto one month Over one year Sub total Upto one month Over one year Sub total Total
% Rupees
Financial assets
On balance sheet
Cash and balances with SBP and NBP - 17,601,439 - - - 17,601,439 339,037,039 - - - 339,037,039 356,638,478
Balances with other banks/NBFIs/MFBs 4.5%-9.3% 363,715,690 - - - 363,715,690 46,275,006 - - - 46,275,006 409,990,696
Investments - net of provisions 6.41%-6.95 199,226,923 839,969,327 - - 1,039,196,250 - - - - - 1,039,196,250
Advances - net of provisions 5% - 51.44% 793,757,045 2,419,635,399 1,784,872,761 420,410,529 5,418,675,734 - - - - - 5,418,675,734
Other assets - - - - - - 257,730,742 - - 2,194,844 259,925,586 259,925,586
1,374,301,097 3,259,604,726 1,784,872,761 420,410,529 6,839,189,113 643,042,787 - - 2,194,844 645,237,631 7,484,426,744
Off balance sheet - - - - - - - - - - -
Total 1,374,301,097 3,259,604,726 1,784,872,761 420,410,529 6,839,189,113 643,042,787 - - 2,194,844 645,237,631 7,484,426,744
Financial liabilities
On balance sheet
Deposit and other accounts 5%-15.63% 1,909,110,938 1,015,368,612 779,535,109 1,512,960,575 5,216,975,234 840,388,869 - - - 840,388,869 6,057,364,103
Borrowings 7.60%-11.23% - - 115,000,880 - 115,000,880 - - - - - 115,000,880 .
Other liabilities - - - - - - 163,685,715 27,172,168 28,117,347 86,310,265 305,285,495 305,285,495
1,909,110,938 1,015,368,612 894,535,989 1,512,960,575 5,331,976,114 1,004,074,584 27,172,168 28,117,347 86,310,265 1,145,674,364 6,477,650,478
Off balance sheet - - - - - - - - - - -
Total 1,909,110,938 1,015,368,612 894,535,989 1,512,960,575 5,331,976,114 1,004,074,584 27,172,168 28,117,347 86,310,265 1,145,674,364 6,477,650,478
On balance sheet gap - - - - - - - - - - -
Off balance sheet gap - - - - - - - - - - -
34.1 Credit risk management
34.2 Liquidity risk management
34.3 Interest rate risk management
'Interest rate risk is the risk that the value of a financial instrument will fluctuate as result of changes in market interest rate. This risk is managed by regular review of market rates.
34.4 Fair value of financial instruments
The carrying values of all financial assets and financial liabilities reflected in the financial statements approximate their fair values except held to maturity assets which are carried at amortized cost.
Effective yield /
interest rateOver one month upto six months
Over six months upto one year
Over one month upto six months
Over six months upto one year
Credit risk is the risk that one party to a financial instrument will fail to discharge an obligation and cause the other party to incur a financial loss. The Bank's credit risk is primarily attributable to its advances. However, the Bank believes that it is not exposed to major concentration of credit risk. The Bank has an effective loan disbursement and recovery monitoring system which allows it to evaluate borrowers credit worthiness and identify potential problem loans. A provision for potential loan losses is maintained.
'Liquidity risk is the risk of being unable to raise funds at a reasonable price to meet commitments when they fall due, or take the advantage of investment opportunities when they rise. The management ensures that funds are available at all times to meet the funding requirements of the Bank. The Bank manages risk by maintaining sufficient liquidity at Head Office and the branches.

35 Maturities of assets and liabilities
2016
Total Upto one month Over one year
Rupees
Market rate assets
Advances 10,082,263,974 650,156,308 4,837,914,575 3,955,442,189 638,750,902
Investments 1,885,328,850 748,737,472 1,136,591,378 - -
Other earning assets 1,181,536,627 1,081,536,627 100,000,000 - -
Total market rate assets 13,149,129,451 2,480,430,407 6,074,505,953 3,955,442,189 638,750,902
Other non-earning assets 2,468,835,457 1,503,530,492 ### 157,489,218 79,955,906 727,859,841
Total assets 15,617,964,908 3,983,960,899 6,231,995,171 4,035,398,095 1,366,610,743
Market rate liabilities
Time deposits of Rs. 100,000 and above 7,632,763,487 1,136,397,071 3,102,280,750 1,360,023,011 2,034,062,655
Time deposits below Rs. 100,000 42,595,714 11,020,982 8,608,227 6,115,105 16,851,400
Other cost bearing liabilities 3,391,536,690 2,041,534,934 - 900,001,756 450,000,000
Total market rate liabilities 11,066,895,891 3,188,952,987 3,110,888,977 2,266,139,872 2,500,914,055
Other non-cost bearing liabilities 2,118,515,988 1,786,921,242 50,747,585 155,707,502 125,139,659
Total liabilities 13,185,411,879 4,975,874,229 3,161,636,562 2,421,847,374 2,626,053,714
2015
Total Upto one month Over one year
Rupees
Market rate assets
Advances 5,418,675,734 793,757,045 2,419,635,399 1,784,872,761 420,410,529
Investments 1,039,196,250 199,226,923 839,969,327 - -
Other earning assets 381,317,129 381,317,129 - - -
Total market rate assets 6,839,189,113 1,374,301,097 3,259,604,726 1,784,872,761 420,410,529
Other non-earning assets 1,612,729,814 659,434,084 59,581,014 53,958,384 839,756,332
Total assets 8,451,918,927 2,033,735,181 3,319,185,740 1,838,831,145 1,260,166,861
Market rate liabilities
Time deposits of Rs. 100,000 and above 3,887,889,957 604,627,206 1,004,787,675 776,132,901 1,502,342,175
Time deposits below Rs. 100,000 33,516,438 8,914,892 10,580,938 3,402,208 10,618,400
Other cost bearing liabilities 1,410,569,720 1,295,568,840 - 115,000,880 -
Total market rate liabilities 5,331,976,115 1,909,110,938 1,015,368,613 894,535,989 1,512,960,575
Other non-cost bearing liabilities 1,186,408,370 1,010,756,555 27,172,168 28,117,347 120,362,300
Total liabilities 6,518,384,485 2,919,867,493 1,042,540,781 922,653,336 1,633,322,875
Over one month upto six months
Over six months upto one year
Over one month upto six months
Over six months upto one year

36 Provident Fund
The following information is based on latest un-audited financial statements of the Fund:
2016 2015Note Rupees Rupees
Size of the fund ### 214,400,822 168,330,406Total investments ### 36.1 202,640,837 154,590,291%age of investments made ### 95% 92%
36.1 Breakup of investments
Mutual funds 26,120,595 - Term deposit receipts (TDRs) 176,520,242 154,590,291
202,640,837 154,590,291
37 Non adjusting event after the balance sheet date
38 Date of authorisation
39 General
- Figures have been rounded off to the nearest Rupee unless otherwise specified.-
-
Chief Executive Officer Chairman Director Director
The investments are kept in mutual funds and TDRs in the name of Trust, in accordance with requirements of section 227 of the Companies Ordinance, 1984.
The Board of Directors of the Bank in their meeting held on 27 MAR 2017, have passed on the dividend for the year ended December 31, 2016 @ 0% (Rs. 0 per share).
These financial statement were authorised for issue by the Board of Directors of the Bank on 27 MAR 2017
Corresponding figures have been re-arranged, wherever necessary, for the purpose of comparison. However, no significant re-arrangements have been made.
Where there are no amounts to be disclosed in the account captions as prescribed by BSD Circular No.11 dated December 30, 2003 issued by SBP in respect of forms of financial statements for Microfinance banks, these captions have not been reproduced in these financial statements, except for caption of balance sheet, profit and loss account and cash flow statement.