financial statements 2017 - heijmans · financial statements 2017 . 2 financial ... 6.24 financial...
TRANSCRIPT

This financial statement is part of Heijmans’ annual report 2017. The complete English version of the annual report will be published a number of weeks after the publication of the Dutch annual report.
In case of differences between the Dutch and the English annual report (financial statements), the first shall prevail.
Please note that in the tables the European currency notation has been used.
Publication date: 23 February 2018
Financial Statements 2017

2 Financial statements 2017 - Heijmans

3Financial statements 2017 - Heijmans
FINANCIAL STATEMENTS
Financial statements 2017
CONTENTS
1. Consolidated statement of profit or loss 4
2a. Consolidated statement of comprehensive income 5
2b. Consolidated statement of changes in equity 6
3. Consolidated statement of financial position 8
4. Consolidated statement of cash flows - indirect method 10
5. Accounting principles 11
6. Segment reporting 236.1 Segment reporting 236.2 Discontinued operations 276.3 Other operating income 286.4 Staff costs, depreciation, and research
and development expenses 286.5 Other operating expenses 296.6 Finance income and expense 306.7 Income tax 316.8 Income tax assets and liabilities 33
6.9 Property, plant and equipment 346.10 Intangible assets 366.11 Joint ventures and associates 386.12 Other investments 416.13 Deferred tax assets and liabilities 416.14 Inventories 446.15 Work in progress 466.16 Trade and other receivables 476.17 Cash and cash equivalents 486.18 Equity 486.19 Earnings per share 496.20 Interest-bearing loans and other
financing liabilities 506.21 Employee benefits 556.22 Provisions 606.23 Trade and other payables 616.24 Financial risks and risk management 626.25 Rental and operating lease contracts 696.26 Investment commitments 706.27 Contingent liabilities 706.28 Related parties 726.29 Management estimates and judgements 77
7. Subsidiaries and joint operations 79
8. Company financial statements 80

4 Financial statements 2017 - Heijmans
FINANCIAL STATEMENTS
Consolidated statement of profit or loss
x € 1.000
2017 2016
Continued operations
Discontinued operations
TotalContinued operations
Discontinued operations
Total
6.1 Revenue 1.402.215 85.059 1.487.274 1.369.680 514.111 1.883.791
Cost of sales -1.265.336 -78.200 -1.343.536 -1.334.976 -466.578 -1.801.554
Gross profit 136.879 6.859 143.738 34.704 47.533 82.237
6.3 Other operating income 2.506 31.035 33.541 721 1.132 1.853
Selling expenses -30.575 -1.517 -32.092 -32.163 -6.730 -38.893
6.4 Administrative expenses -92.568 -5.375 -97.943 -106.129 -25.339 -131.468
6.5 Other operating expenses -1.912 -8 -1.920 -1.590 -6.126 -7.716
Operating result 14.330 30.994 45.324 -104.457 10.470 -93.987
6.6 Finance income 1.702 534 2.236 2.482 2.340 4.822
6.6 Finance expense -10.803 -165 -10.968 -11.277 -1.320 -12.597
6.11 Share in results of joint ventures and associates -14.669 -1 -14.670 -4.662 2.622 -2.040
Result before tax -9.440 31.362 21.922 -117.914 14.112 -103.802
6.7 Income tax 0 -2.380 -2.380 -349 -6.343 -6.692
Result after tax -9.440 28.982 19.542 -118.263 7.769 -110.494
The entire result after tax is attributable to the shareholders.
Earnings per share (in €)
6.19 Earnings per ordinary share after tax -0,44 1,35 0,91 -5,52 0,36 -5,16
6.19 Earnings per ordinary share after tax and dilution effects -0,44 1,35 0,91 -5,52 0,36 -5,16
Dividend distributed per ordinary share in the financial year 0,00 0,00 0,00 0,00 0,00 0,00
1. Consolidated statement of profit or loss

5Financial statements 2017 - Heijmans
FINANCIAL STATEMENTS
Consolidated statement of comprehensive income
x € 1.000
2a. Consolidated statement of comprehensive income
2017 2016
1. Result after tax 19.542 -110.494
Other comprehensive income that after initial recognition is possibly reclassified to profit or loss:
Effective portion of changes in the fair value of cash flow hedges for joint ventures and associates 353 -568
Other comprehensive income that is never reclassified to the statement of profit or loss:
Changes in actuarial results on defined benefit plans 508 -17.418
Tax effect on changes in actuarial results on defined benefit plans -127 4.371
Other comprehensive income (after tax) 734 -13.615
Comprehensive income 20.276 -124.109
The entire comprehensive income is fully attributable to the shareholders.

6 Financial statements 2017 - Heijmans
FINANCIAL STATEMENTS
Consolidated statement of changes in equity
x € 1.000
2b. Consolidated statement of changes in equity
2017
Paid-up and
called-up share
capital
Share premium
reserve
Reserve for
actuarial results
Hedging reserve
Reserve for Bonus
Investment Share
Matching PlanRetained earnings
Result for the year after tax
Total Equity
Balance at 1 January 2017 6.423 242.680 -27.965 -193 239 31.208 -110.494 141.898
Result after tax - - - - - - 19.542 19.542
Other comprehensive income - - 381 353 - - - 734
Total realised and unrealised results for the reporting period:
- - 381 353 - - 19.542 20.276
Transactions with owners of the group:
Bonus Investment Share Matching Plan - - - - 3 - - 3
Appropriation of result for 2016
Transferred to retained earnings - - - - - -110.494 110.494 0
Total transactions with owners - - - - 3 -110.494 110.494 3
Balance at 31 December 2017 6.423 242.680 -27.584 160 242 -79.286 19.542 162.177

7Financial statements 2017 - Heijmans
FINANCIAL STATEMENTS
Consolidated statement of changes in equity
x € 1.000
2016
Paid-up and
called-up share
capital
Share premium
reserve
Reserve for
actuarial results
Hedging reserve
Reserve for Bonus
Investment Share
Matching PlanRetained earnings
Result for the year after tax
Total Equity
Balance at 01 January 2016 6.423 242.680 -14.918 375 229 58.466 -27.258 265.997
Result after tax - - - - - - -110.494 -110.494
Other comprehensive income - - -13.047 -568 - - - -13.615
Total realised and unrealised results for the reporting period:
- - -13.047 -568 - - -110.494 -124.109
Transactions with owners of the group:
Bonus Investment Share Matching Plan - - - - 10 - - 10
Appropriation of result for 2015
Transferred to retained earnings - - - - - -27.258 27.258 0
Total transactions with owners 0 0 - - 10 -27.258 27.258 10
Balance at 31 December 2016 6.423 242.680 -27.965 -193 239 31.208 -110.494 141.898

8 Financial statements 2017 - Heijmans
FINANCIAL STATEMENTS
Consolidated statement of financial position
x € 1.000
3. Consolidated statement of financial position
Assets 31 december 2017 31 december 2016
Non-current assets
6.9 Property, plant and equipment 46.575 54.507
6.10 Intangible assets 79.707 81.619
6.11 Joint ventures and associates 66.357 65.796
6.12 Other investments 29.631 33.615
6.21 Employee-related receivable 30.122 25.111
6.13 Deferred tax assets 29.817 29.946
282.209 290.594
Current assets
6.14 Strategic land holdings 150.043 146.974
6.14 Residential property in preparation or under construction 27.040 58.156
6.14 Other inventories 10.110 11.304
6.15 Work in progress 61.264 60.196
6.8 Income tax assets 38 38
6.16 Trade and other receivables 165.662 176.071
6.17 Cash and cash equivalents 74.437 30.249
488.594 482.988
6.2 Assets held for sale 0 282.586
Total assets 770.803 1.056.168

9Financial statements 2017 - Heijmans
FINANCIAL STATEMENTS
Consolidated statement of financial position
x € 1.000
Equity and liabilities 31 december 2017 31 december 2016
Equity
2b Issued capital 6.423 6.423
2b Share premium reserve 242.680 242.680
2b Reserves -27.182 -27.919
2b Retained earnings from prior financial years -79.286 31.208
1 Result for the year after tax 19.542 -110.494
162.177 141.898
Non-current liabilities
6.20 Interest-bearing loans and other non-current financing liabilities1 54.537 58.405
6.21 Employee benefits 15.298 12.333
6.22 Provisions 1.949 2.364
6.13 Deferred tax liabilities 607 609
72.391 73.711
Current liabilities
6.20 Interest-bearing loans and other current financing liabilities 6.229 118.630
6.23 Trade and other payables 377.400 371.066
6.15 Work in progress 128.965 118.081
6.8 Income tax liabilities 109 65
6.21 Employee benefits 1.995 2.703
6.22 Provisions 21.537 15.366
536.235 625.911
6.2 Liabilities held for sale 0 214.648
Total equity and liabilities 770.803 1.056.168
1 The interest-bearing loans include cumulative preference shares amounting to €45.1 million (2016: €45.1 million).

10 Financial statements 2017 - Heijmans
FINANCIAL STATEMENTS
Consolidated statement of cash flows - indirect method
x € 1.000
4. Consolidated statement of cash flows - indirect method
2017 2016
Operating result - including discontinued operations 45.324 -93.988
Adjustments for:
6.2 Impairment of assets held for sale (a loss on the sale of the subsidiary Franki) - 6.094
6.2 Gain on sale of entities disposed of -31.035 -6.3 Gain on sale of non-current assets -725 -4096.9 Depreciation of property, plant and equipment 11.759 16.9306.10 Amortisation of intangible assets 1.920 1.622
6.14 Adjustment of valuation of property investments and land portfolios, excluding joint ventures 5.200 17.554
Net change in work in progress 1.367 28.855Change in other working capital and long-term provisions -1.525 -31.854Operating result after adjustments 32.285 -55.196
Interest paid -10.527 -13.380Interest received 1.894 4.561Income tax paid -2.439 -4.100
Cash flow from operating activities 21.213 -68.115
6.9 Investments in property, plant, and equipment -4.203 -14.986
Sale of property, plant and equipment 1.766 6.846
6.2 Proceeds from sale of entities disposed of 96.893 -
Capital contributions to joint ventures and associates -5.406 -19.774
Dividends received from joint ventures and associates 4.410 9.969
Loans granted to joint ventures and associates, less loans repaid by them -2.226 -4.302
Cash flow from investing activities 91.234 -22.247
6.20 Interest-bearing loans drawn down 0 68.818
6.20 Interest-bearing loans repaid -116.269 -25.589
Cash flow from financing activities -116.269 43.229
Net cash flow in the period -3.822 -47.133
6.17 Cash and cash equivalents at 1 January 30.249 125.392
Adjustment of cash and cash equivalents relating to assets held for sale 48.010 -48.010
6.17 Cash and cash equivalents at 31 December 74.437 30.249

11Financial statements 2017 - Heijmans
FINANCIAL STATEMENTS
Accounting principles
Heijmans N.V. (referred to as the “Company”) has its registered office in the Netherlands. The Company’s consolidated financial statements for the 2017 financial year include the Company and its subsidiaries (collective-ly referred to as the ‘Group’) and the Group’s investments in associates and interests in jointly controlled entities. The Executive Board prepared the financial statements on 23 February 2018. These will be submitted for approval to the General Meeting of Shareholders on 11 April 2018.
(1) Statement of Compliance
The consolidated financial statements for 2017 were prepared in accordance with the International Financial Reporting Standards as adopted by the European Union (EU-IFRS) and with Part 9 of Book 2 of the Dutch Civil Code.
(2) Basis of preparation
The financial statements are presented in thousands of euros. The financial statements are based on historical costs, unless otherwise stated.
The preparation of the annual financial statements in accordance with EU-IFRS requires management to make judgements, estimates and assumptions that affect the reported amounts of assets and liabilities and of revenue and expenses. The estimates and their underlying assumptions are based on experience and other factors that are considered reasonable. The estimates form the basis for calculating the carrying amounts of assets and liabilities that cannot easily be derived from other sources. Actual results could differ from these estimates. See also note 6.29, Management estimates and judgements.
The estimates and underlying assumptions are continu-ally reassessed. Revised estimates are recognised in the period in which the estimate was revised, provided that the revision only affects that period. Revisions are recognised in the reporting period and future periods if
the revision also affects future periods. The accounting policies described below have been consistently applied to all periods presented in these consolidated financial statements and to all entities in the Group, apart from the changes explained in (3).
(3) Implications of new standards
The IAS 7 amendment to IFRS 10 and 12 and to IAS 28 adopted by the EU and the annual improvements 2014-2016 cycle that apply to reporting periods com-mencing on or after 1 January 2017 have no material effect on the consolidated financial statements.
For new standards that have not yet come into force, Heijmans is looking into what impact they will have. This mainly concerns IFRS 9 Financial Instruments, IFRS 15 Revenue from Contracts with Customers and IFRS 16 Leases.
(3a) IFRS 9 Financial Instruments
IFRS 9 Financial Instruments was issued on 24 July 2014 and was adopted by the EU on 22 November 2016. The standard is effective for reporting periods commencing on or after 1 January 2018. IFRS 9 generally requires that the amount of the credit loss provision established on initial recognition of financial instruments is measured on the basis of the expected credit losses over the coming 12 months. Subsequently, as long as there is no significant deterioration in the credit risk, the credit loss provision continues to be measured at the amount of the 12-month expected credit losses. If, however, a significant increase in the credit risk occurs, on either an individual or a collective basis, the amount of the expected credit loss provision is measured as the expected credit losses over the entire term to maturity of the instrument. In the case of trade receivables, it is permissible to adopt a simplified approach involving recognition of a loss allowance at an amount equal to lifetime expected credit losses every time. This new standard is not expected to have any material impact on the Group’s financial results.
5. Accounting principles

12 Financial statements 2017 - Heijmans
FINANCIAL STATEMENTS
Accounting principles
(3b) IFRS 15 Revenue from Contracts with Customers
IFRS 15 Revenue from Contracts with Customers was issued on 28 May 2014, amended on 11 September 2015 and was adopted by the EU on 22 September 2016.
The standard is effective for reporting periods commenc-ing on or after 1 January 2018. On initial application, this new standard is to be applied either fully retroactively (including restatement of comparative figures) or merely retrospectively with the cumulative effect recognised in the opening balance of equity in 2018. The Group has decided in favour of the latter option because we expect the impact which IFRS 15 has on the financial results to be limited, as explained below. Also, this method of initial application is considerably more efficient (less labour-in-tensive) than a fully retrospective application.
IFRS 15 introduces a 5-step model for revenue recognition. The steps are: 1. identifying customer contracts, 2. identifying the performance obligations in a contract, 3. determining the transaction price, 4. allocating the transaction price to performance obligations and 5. recognising revenue when performance obligations have been satisfied.
The Group has carried out a detailed analysis of the expected impact, based on the existing standards, the internal reporting guidelines and IFRS 15. A further assessment has been made of the effects on the major contracts that run over from 2017 to 2018. The revenue streams have also been analysed into categories with similar attributes and the effects on each category have been analysed, based on representative contracts. The main conclusions to come out of these analyses at this stage, which are mainly of a qualitative nature, are:
Identification of separate performance obligations: one of the steps in IFRS 15 involves identifying the performance obligations in a contract. Our analyses have shown that this is not expected to introduce any material changes compared with the existing reporting rules. For projects involving both a construction component and a long-term maintenance component, for instance, IFRS 15 means that there will be two separate performance obligations, partly because management of the contract will involve various project teams. Under the existing rules, construction and long-term maintenance are recognised as two separate projects, meaning that IFRS 15 is not expected to have any impact on contracts of this kind. In the case of housing projects, the adopted position is that transfer of ownership of the residential units is so intrinsically tied up with the
land beneath them that conveyance of the land and construction of the homes can be seen as a single performance obligation under IFRS 15. Under the existing rules, conveyance of the land and construction of the homes are accounted for as part of the same project so, again, IFRS 15 is not expected to have any effects.
Variable consideration: under IFRS 15, it is only permissi-ble to recognise as revenue that portion of the considera-tion for which it is highly unlikely that a significant revenue reversal will occur. Under the existing rules, revenue is broadly speaking only recognised when it is probable. Where additional work is involved and with respect to claims against clients, for example, IFRS 15 potentially means recognising more conservative amounts.
Financing components in contracts: under IFRS 15, the effects of the time value of money must be accounted for separately if the payment date means that the customer or the Group obtains a significant financing gain (unless that gain does not arise out of financing arrangements but has a different origin, for example because parties wish to protect themselves against default). A practical exception to this requirement is if there is less than one year between payment and delivery. Our analyses have shown that this will not lead to any material changes compared with the existing rules, partly because the Group will be availing itself of the practical exception.
Recognition of revenue at a point in time or over a period: under IFRS 15, revenue is recognised when the perfor-mance obligation has been satisfied, i.e. the date on which the customer takes control. This can be a particular point in time or spread over a period. Our analyses have shown that this is not expected to lead to material effects on the financial results compared with the existing rules. In the case of construction projects, for example, the Group carries out works on the land owned by the customer. The customer obtains control of the constructed works as and when ownership is transferred. Partly for this reason, therefore, the revenue from projects will be recognised over a period under IFRS 15. Under the existing rules, the revenue from projects is recognised in proportion to progress, meaning that IFRS 15 is expected not to have any effect.
Apart from the above aspects, there are numerous other aspects that play a mostly minor role. One such aspect is the way in which tendering fees and mobilisation costs are to be treated under IFRS 15. Again, our analyses have shown that this is expected not to have any material effects on the financial results. Moreover, in the case of

13Financial statements 2017 - Heijmans
FINANCIAL STATEMENTS
Accounting principles
Heijmans, there is a multitude of projects, so that differences in the timing of revenue recognition will more or less average things out (‘ideal complex’).
Analysis will not be completed until after publication of the financial statements. The outcome of the current discussions within IFRIC (International Financial Reporting Issues Committee) will form part of this analysis. Among other things, these discussions concern the treatment of loss-making contracts (use of incremen-tal costs or integrated costs) and the question of whether the delivery of land and buildings should be seen as two separate performance obligations. Depending on the outcome of these discussions, there could be an impact on the Group’s financial results. The extent of any such impact will be determined when the outcome of the discussions is known. The 2018 half-year report will be prepared on the basis of IFRS 15.
IFRS 15 has a number of requirements necessitating various supplementary disclosures with respect to such things as revenue categories, future performance obligations (order book), contract assets and movements in work in progress.
(3c) IFRS 16 Leases
IFRS 16 Leases, was issued on 13 January 2016 and was adopted by the EU on 31 October 2017. The standard is effective for reporting periods commencing on or after 01 January 2019. IFRS 16 will have material implications for the statement of financial position in particular. If IFRS 16 had been applied to the 2017 financial statements, an item representing right-of-use assets would have appeared on the balance sheet, giving rise to an item of a similar amount on the liabilities side in respect of finance lease liabilities. This would have had the effect of increasing the balance sheet total by approximately 10%. In the statement of profit or loss, there would have been changes in the items making up the operating result and in the interest figures (result after tax remaining unchanged), giving an increase in the operating result of several million euros, with a similar increase in the interest expense. Within the operating result, this gives rise to a movement from operating expenses to deprecia-tion, as a consequence of which EBITDA (earnings before interest, tax, depreciation and amortisation) will increase. This movement does not have any effect on the net result. The impact on equity is expected to be limited in amount on the date from which the change in accounting policies becomes effective. The impact on the financial results for 2018 and ensuing years is expected to be of a similar magnitude.
(4) Accounting policies used for consolidation
(4a) Subsidiaries (full consolidation)
A subsidiary is an entity over which the Group has direct or indirect control. Control exists if the Group:a) has power over the entity;b) is exposed or has rights to variable returns because of
its involvement with the entity; andc) can use its power over the entity to affect the size of
these returns.Each of these three criteria has to be satisfied to establish that the Group has control over a company in which it owns an interest. The financial statements of subsidiaries are included in the consolidated financial statements from the date that control commences to the date that control ceases.
Business combinations are recognised according to the acquisition method, as from the date on which control is transferred to the Group. The transaction cost of an acquisition is recognised at fair value, as are the net identifiable assets acquired. Any resulting goodwill is tested every year for impairment. Any gain from a favourable purchase is recognised directly in profit or loss. Transaction costs are recognised when these are incurred, unless they relate to the issue of debt or equity instru-ments. The transfer sum includes no amount for settling existing account balances. Such amounts are generally recognised in the statement of profit or loss. The fair value of a contingent payment is recognised on the date of acquisition. If this conditional payment is classified as equity, it is not subsequently remeasured. Instead, the settlement figure is recognised in equity. In other cases, adjustments after initial recognition are recognised in profit or loss.
(4b) Joint ventures and associates (equity method)
A joint venture is a joint arrangement in which the Group has joint control together with other parties, and has a right to the net assets of the joint venture. The parties involved have agreed contractually that control is shared and that decisions concerning relevant activities require unanimous approval from the parties having joint control over the joint venture. A joint venture is recognised from the date on which the Group shares control until the date on which this ceases.
An associate is an entity over which the Group has significant influence, but cannot exercise control.

14 Financial statements 2017 - Heijmans
FINANCIAL STATEMENTS
Accounting principles
Significant influence is presumed to exist when the Group holds 20% or more of the voting rights. An associate is recognised from the date on which the Group has significant influence until the date on which this ceases.Joint ventures and associates are recognised in accord-ance with the equity method and are initially recognised at acquisition cost. The investments of the Group include the goodwill determined during acquisition. The consoli-dated financial statements include the Group’s propor-tionate share of the comprehensive income determined in accordance with the Group’s accounting policies. If the Group’s share of the losses is greater than the value of the interest in a joint venture or associate, the value of the interest is written down to nil. No further losses are then recognised except insofar as the Group has made a commitment or intends to recognise the losses.
(4c) Joint operations (proportional consolidation)
Joint operations are arrangements over which the Group exercises control jointly with third parties. For its share in a joint operation, the Group recognises its assets (includ-ing its share of the assets held jointly), liabilities (includ-ing its share of the liabilities incurred jointly), revenue (including its share of the revenue from the output of the joint operation) and expenses (including its share of the expenses incurred jointly). In practice, the method for recognising joint operations is comparable to that used for proportional consolidation.
(4d) Elimination of transactions on consolidation
Intragroup balances and any unrealised income and expense arising from intragroup transactions are eliminated when preparing the consolidated financial statements.
Unrealised income from transactions with associates, joint ventures and joint operations are eliminated in proportion to the Group’s interests in the entities concerned. (5) Foreign currency
(5a) Transactions in foreign currency
Transactions in foreign currency are translated into euros at the exchange rate prevailing on the transaction date. Foreign currency balances, as well as assets acquired and liabilities paid in foreign currencies, are translated at the corresponding exchange rates prevailing on the closing
date. Foreign currency differences resulting from translation are recognised in the statement of profit or loss.
(5b) Financial statements of foreign operations denominated in foreign currency
The assets and liabilities of foreign operations are translated into euros at the exchange rate prevailing on the closing date. The revenues and expenses of foreign operations are translated into euros at average exchange rates.
Foreign currency exchange rate differences arising from the translation of a net investment in foreign operations and the associated hedging transactions are recognised as other comprehensive income that after initial recogni-tion is possibly reclassified to the statement of profit or loss. When an investment is disposed of, the amount transferred to equity is recognised in the statement of profit or loss.
All foreign currency differences arising from foreign operations are presented as separate equity components.
(6) Financial instruments
(6a) Derivative financial instruments
The Group may use interest rate swaps, cross-currency swaps and inflation hedges to hedge its interest rate, currency and inflation risk exposures arising from corporate and project financing activities. Commodity hedges may also be used in specific cases. In accordance with its treasury policy, the Group does not hold deriva-tives for trading purposes. Interest-rate swaps, cross-cur-rency swaps and inflation hedges are measured at fair value.
The fair value of interest rate and inflation swaps is calculated as the present value of the estimated future cash flows. The fair value of forward currency contracts is determined using the forward foreign exchange rates as at the closing date.
(6b) Non-derivative financial instruments
Non-derivative financial instruments consist of invest-ments in shares and bonds, trade and other receivables, cash and cash equivalents, loans and other financing liabilities, trade payables and other payable items. These instruments are recognised initially at fair value, plus - for instruments that are not recognised at fair value when

15Financial statements 2017 - Heijmans
FINANCIAL STATEMENTS
Accounting principles
their gains or losses are recognised in the statement of profit or loss - all directly attributable transaction costs. Thereafter, the current non-derivative financial instru-ments are measured at amortised cost, using the effective interest method, less impairment losses.
A financial instrument is recognised if the Group becomes a party to the contractual provisions of the instrument. Financial assets are derecognised if the contractual rights to the cash flows arising from those financial assets expire, or if the Group transfers the financial asset to another party without retaining control or without substantially retaining all the risks and rewards of the asset. The normal purchase and sale of financial assets are accounted for on the trading date, i.e. the date that the Group commits itself to purchase or sell the asset. Financial liabilities are derecognised if the Group’s commitments specified in the contract expire or are discharged or cancelled.
(7) Hedges
In principle, hedge accounting is applied to derivative financial instruments, subject to the cash flow hedging guidelines.
The Group may use derivatives to hedge its interest-rate, currency and inflation risks. Changes in the fair value of the derivatives that are classified as cash flow hedges are recognised directly as other comprehensive income that after initial recognition may be reclassified to the statement of profit or loss, to the extent that the hedge can be shown to be effective. To the extent that the effectiveness of the hedge cannot be demonstrated, changes in fair value are recognised under the item Finance income and expense in the statement of profit or loss.
When the hedging instrument is sold or expires, or when the transaction no longer meets the effectiveness criterion, the cumulative gains or losses previously recognised in equity remain there. This amount is amortised over the original term, unless there is no longer an expectation that the hedged future interest and currency payments will occur. In that case, the above-mentioned cumulative gains and losses will be immediately recognised in the statement of profit or loss as a component of finance income and expense.
(8) Revenue
(8a) Sales of goods - mainly residential property and land
Revenues from the sales of goods - mainly residential property and land - are carried at the fair value of the payment received or due to be received. Revenues from the sales of goods are recognised in the statement of profit or loss if the significant risks and rewards of ownership have been transferred to the buyer, it is probable that the amount receivable will be collected, the associated costs can be reliably estimated, there is no continued management involvement with the goods and the amount of the revenues can be reliably determined.
The transfer of risks and rewards varies depending on the conditions in the associated sales contract. The sale of residential construction projects generally involves the transfer of risks and rewards when the purchase or contracting agreement is signed, and subsequently in proportion to progress with the construction work. Revenues from these residential construction projects are recognised in the statement of profit or loss in proportion to the extent of project completion (see accounting policy 15b). Expected losses are recognised immediately in the statement of profit or loss.
(8b) Work in progress - projects
The revenue and costs agreed in relation to work in progress are recognised in the statement of profit or loss in proportion to the stage of completion of the project. The stage of completion is assessed by reference to the proportion of costs recorded in relation to the total expected costs. If the results from a contract cannot be determined reliably, contract revenue is only recognised insofar as it is probable that the costs incurred can be covered by revenue. Expected project losses are recog-nised immediately in the statement of profit or loss.
Revenue from additional work is included in the overall contract revenue if the client has accepted the sum involved in any way. Claims and incentives are recog-nised in the amount for work in progress where it is probable that they will lead to revenue and can be reliably measured.
(8c) Rental income
Rental income from an investment property is recognised in the statement of profit or loss in proportion to the term of the lease.

16 Financial statements 2017 - Heijmans
FINANCIAL STATEMENTS
Accounting principles
(8d) PPP contracts
Revenues from Public-Private Partnership (PPP) contracts concern revenues from construction and operation. Revenues from construction are recognised in the same way as revenues from work in progress (see accounting policy 8b). Revenues from operations are recognised when the related services are delivered.
(8e) Services
Revenues from services are recognised in the statement of profit or loss in proportion to the stage of completion of the transaction on the reporting date. The stage of completion is determined from assessments of the work already carried out.
(9) Other operating income
Grants Grants that compensate the Group for expenses incurred are always recognised as revenue in the statement of profit or loss in the same period in which the correspond-ing expenses are recognised.
(10) Expenses
(10a) Selling expenses
Costs of sales are the costs of sales that are not charged to projects.
(10b) Administrative expenses
The administrative expenses represent general expenses that are not costs of sales and are not charged to projects.
(10c) Lease payments under operating leases
Lease payments made under operating leases are recognised in the statement of profit or loss, evenly spread over the term of the lease.
(10d) Lease payments under finance leases
Lease payments made under finance leases are appor-tioned between the finance expense and the reduction of the outstanding liability. The finance expense is allocated to each period during the total lease term so as to produce a constant periodic rate of interest over the remaining term of the liability.
(10e) Finance income and expense
Net financing costs comprise interest payable on borrowings and finance lease commitments, dividends on cumulative preference shares, interest receivable on funds invested, dividend income, and foreign currency exchange gains and losses, as well as gains and losses on hedging instruments that are recognised in the statement of profit or loss (see accounting policy 7).
Financing expenses that can be directly allocated to the acquisition, construction or production of an asset are capitalised as part of the costs of that asset during the period that the asset is under development.
The interest component of a finance lease payment is recognised in the statement of profit or loss and is calculated using the effective interest method.
(11) Income tax
Deferred tax assets and liabilities are recognised for temporary differences between the carrying amounts of assets and liabilities for financial reporting purposes, and the values used for taxation purposes. A deferred tax asset or liability is not recognised for non-deductible goodwill, assets and liabilities whose initial recognition does not affect accounting or taxable profit, or differences relating to investments in subsidiaries to the extent that these will probably not reverse in the foreseeable future. The amount of the deferred tax assets and liabilities is based on the manner in which the expected asset and liability carrying amounts will be realised or settled, based on the income tax rates that have been enacted or substantively enacted on the closing date.
Deferred tax assets and liabilities are set off against each other if there is a right enforceable by law to set them off, and if these tax assets and liabilities are associated with income tax levied by the same tax authority on the same taxable entity, or on different taxable entities that intend to set them off or that will be realising the tax assets at the same time as the tax liabilities.
Income tax recognised in the statement of profit or loss during the financial year comprises the income tax owed or refundable over the reporting period and the deferred income tax. The income tax is recognised in the statement of profit or loss, except to the extent that it relates to items recognised in other comprehensive income. In that case, the relevant portion of the income tax is recognised in other comprehensive income.The income tax owed or refundable over the financial year

17Financial statements 2017 - Heijmans
FINANCIAL STATEMENTS
Accounting principles
is the expected tax payable on the taxable income for the financial year, using tax rates enacted or substantively enacted on the closing date, as well adjustments to tax payable in respect of previous years.
A deferred tax asset (net of any deferred tax liability) is recognised only to the extent that it is probable that future taxable profits will be available that can be utilised towards realising the deferred asset. The amount of the deferred tax asset is reduced to the extent that it is no longer probable that the related tax benefit will be realised.
Additional income tax that arises from the distribution of dividends is recognised at the same time as the liability to pay the related dividend is recognised.
(12) Property, plant and equipment
(12a) Assets in ownership
Items of property, plant and equipment are measured at cost or estimated cost less accumulated depreciation (see below) and impairments (see accounting policy 20). Cost includes costs that can be directly allocated to the acquisition of the asset. The cost of self-constructed assets includes the cost of materials, direct labour costs, financing costs and any other costs that can be directly allocated to making the asset ready for use, as well as any costs of dismantling and removing the asset and restoring the site where the asset is located. The costs of self-constructed assets and acquired assets include (i) the initial estimate at the time of installation of the costs of dismantling and removing the assets and restoring the site on which the assets are located and (ii) changes in the measurement of existing liabilities recognised in relation to the costs identified in (i) above.
If elements of an item of property, plant or equipment have different useful lives, the component method is applied.
(12b) Leased assets
Leases for which the Group takes on nearly all the risks and rewards of ownership are classified as finance leases. The leased asset is stated at an amount equal to the lower of its fair value and the present value of the minimum lease payments at the inception of the lease, less accumulated depreciation (see below) and impairments (see accounting policy 20).
(12c) Expenses after initial recognition
The Group includes the cost of replacing part of an asset in the carrying amount of items of property, plant and equipment when the cost is incurred. This occurs if it is likely that the future economic benefits of the asset will accrue to the Group and the cost price of the asset can be reliably determined. All other expenses are taken to the statement of profit or loss when these are incurred.
(12d) Depreciation of property, plant and equipment
Depreciation is recognised in the statement of profit or loss using the straight-line method over the estimated useful life of each part of an item of property, plant or equipment. The residual values are reassessed on an annual basis. Depreciation is not applied to land. The estimated useful lives are as follows:• Buildings: main building structures and roofs:
30 years• Buildings: technical equipment: 15 years• Buildings: interior walls: 10 years• Office equipment: 3 - 10 years• Machines: 5 - 10 years• Installations: 5 - 10 years• Large-scale equipment and other capital assets: 3 - 10
years
(12e) Investment property
Given its marginal importance, investment property (property held for its rental income and/or increase in value) is recognised under property, plant and equipment. Investment property is measured at cost, less accumulat-ed depreciation and impairment losses. Cost includes costs that can be directly allocated to the acquisition of the asset. The cost of self-constructed assets includes the cost of materials, direct labour costs, financing costs and any other costs that can be directly allocated to making the asset ready for use, as well as any costs of disman-tling and removing the asset and restoring the site where the asset is located. Rental income from investment property is accounted for as described in principle 8.
(13) Intangible assets
(13a) Goodwill
All business combinations are recognised using the acquisition method. Goodwill is the amount that arises from the acquisition of subsidiaries. Goodwill represents the excess of the cost of the acquisition over the net fair

18 Financial statements 2017 - Heijmans
FINANCIAL STATEMENTS
Accounting principles
value of the identifiable assets and liabilities at the time of acquisition. An impairment test is carried out every year (see accounting policy 20).
Negative goodwill arising from an acquisition is recog-nised directly in the statement of profit or loss.
(13b) Other intangible assets
The intangible assets acquired by the Group that have finite useful lives are measured at cost less accumulated depreciation and accumulated impairments.
(13c) Amortisation
Regarding goodwill, an impairment test is systematically performed every year at the closing date to determine whether there are any impairments. The other intangible assets are amortised through the statement of profit or loss on a straight-line basis over the expected useful lives of the intangible assets, and undergo periodic impairment testing (see accounting policy 20). The estimated useful lives of the intangible asset categories are as follows:• Customer base: 5 - 20 years• Order book: 4 years• Sand quarry concession: 5 - 15 years• Brand: 5 - 10 years
(13d) Expenses after initial recognition
Expenditure on intangible assets, other than goodwill, is only capitalised after initial recognition if it is expected to increase the future economic benefits that are inherent in the specific asset to which the expenditure relates. All other items of expenditure are recognised as costs in the statement of profit or loss when these are incurred.
(14) Other investments
Other investments are measured at amortised cost using the effective interest method, less impairments.
(15) Inventories
(15a) Strategic land portfolio
The strategic land portfolio represents the reported land holdings that are managed centrally in the Company’s strategic land portfolio. These holdings are acquired and held for future property development. The interest and development costs for land portfolios that are under development are capitalised. Land and holdings are measured at cost or net realisable value if lower.
(15b) Residential property in preparation or under construction
SoldResidential construction projects where the buyer only has limited influence on the main elements in the design of the assets are recognised under inventory. Contracts with buyers concern purchase/contracting agreements that have been formulated in a way that the land is initially bought after which the building is constructed. By accession, everything that is built on the land is the property of the purchaser. Moreover, the purchase price is fixed in advance, so that the economic risk of an increase or decrease in value is borne by the buyer. The transfer of risks and benefits therefore occurs continually during the progress of the project. Revenue and results are thus accounted for in proportion to project progress - in accordance with IFRIC 15 - and measured in the same way as for construction work in progress (see accounting policy 16). Progress is measured according to billing progress, as this is linked to previously established phases.
UnsoldUnsold residential properties in preparation and under construction are measured at cost, or at net recoverable value if lower. The net realisable value is the estimated selling price in the ordinary course of business less the estimated costs of completion and the estimated costs necessary to make the sale. Development and construc-tion rights are also recognised under residential property in preparation or under construction.
(15c) Other inventories
Other inventories includes land and premises for sale, raw materials and consumables, inventories in production and finished products.
Inventories is measured at cost, or at net realisable value if lower. The net realisable value is the estimated selling price in the ordinary course of business less the estimated costs of completion and the estimated costs necessary to make the sale. The cost of inventories is based on the first-in, first-out (FIFO) principle, and includes expenditure incurred in acquiring the inventories, the production or conversion costs, and the other costs incurred in bringing the inventories to its current location and current condition. The cost of inventories includes an appropriate share of production overheads based on normal operating capacity, as well as the attributable financing expenses.Land and property held for sale are also recognised under inventories. This concerns land and premises that have

19Financial statements 2017 - Heijmans
FINANCIAL STATEMENTS
Accounting principles
been technically delivered as developed but which on the closing date were not sold to third parties. The inventories of land and premises for sale is valued at cost (including interest and allocated overhead costs), less any write-downs relating to a lower net realisable value as a consequence of the risk of inability to sell or rent.
(16) Work in progress
Construction work in progress concerns projects commis-sioned by third parties. These are measured at cost plus profit recognised to date (see also accounting policy 8), in proportion to the progress of the project, less expected losses and invoiced instalments. Total expected project losses, if any, are directly recognised as expenses in the relevant period. Cost includes all costs that relate directly to the projects.
Revenue from additional work is included in the overall contract revenue if the client has accepted the sum involved in any way. Claims and incentives are recog-nised in the amount for work in progress where it is probable that they will lead to revenue and can be reliably measured.
Interest and development costs for construction work in progress are only capitalised if the asset is under construction. If no construction activities are carried out over an extended period, the interest and development costs are no longer capitalised.
The preparation costs and the design and development costs of major projects are capitalised as work in progress if the following conditions are met: • the costs can be separately identified;• the costs can be reliably determined;• it is probable that the project will be awarded; and• there is no longer any competition as regards the
awarding of the project.
If any of these requirements is not fulfilled, the costs are charged to the result for the period in which they are incurred. Costs, once expensed in the statement of profit or loss in the period in which they are incurred, are not subsequently capitalised if the project is awarded.
The profit capitalised on work in progress is based on the estimated final result, taking into account the percentage of progress on this specific work. The progress percentage is calculated as the ratio between the costs incurred to date and the total expected costs, on a project-by-project basis.
(17) Trade and other receivables
Trade and other receivables are estimated at amortised cost less impairment losses due to the risk of non-collection.
(18) Cash and cash equivalents
Cash and cash equivalents comprise cash and bank balances and other call deposits with an original term of a maximum of three months. Current account overdrafts that are repayable on demand and form an integral part of the Group’s cash management are included as a component of cash and cash equivalents in the statement of cash flows.
(19) Assets held for sale and discontinued operations
Non-current assets (or groups of assets and liabilities that are to be disposed of), for which it is expected that the carrying amount will probably be realised within one year mainly by means of a sale transaction and not through continued use, are classified as held for sale (or held for distribution), after it is established that the relevant conditions have been met. Immediately preceding this classification, the assets (or the compo-nents of a group of assets to be disposed of) are measured again in accordance with the Group’s accounting policies. The assets or group of assets to be disposed of are generally measured at the carrying amount or the fair value less sale costs, if lower. Any impairment loss on a group of assets held for sale is first allocated to goodwill and then pro rata to the remaining assets and liabilities, subject to the restriction that impairment losses are not allocated to inventories, financial assets, deferred tax assets or employee benefits, all of which are measured in accordance with the Group’s accounting policies. Impairment losses arising from the initial classification as held for sale or distribution and gains or losses on revaluation arising after initial recognition are recognised in the statement of profit or loss. If the gain concerned exceeds the accumulated impairment loss, the difference is not recognised.
A discontinued operation is an element of the Group’s operations that represents a separate significant business activity or separate significant geographical business area that has been disposed of or is held for sale or distribu-tion, or a subsidiary that has been acquired solely for the purpose of resale. Classification as a discontinued operation occurs upon disposal, or when the operation meets the criteria for classification as held for sale, if

20 Financial statements 2017 - Heijmans
FINANCIAL STATEMENTS
Accounting principles
earlier. If an operation is designated as a discontinued operation, the comparative figures in the statement of profit or loss have been restated as if the operation had been discontinued from the beginning of the comparative period.
(20) Impairments
The carrying amounts of the Group’s assets, excluding work in progress (see accounting policy 16), inventories (see accounting policy 15) and deferred tax assets (see accounting policy 11), are reviewed each closing date to determine whether there is any indication of impairment. If there are such indications, an estimate is made of the recoverable amount of the asset concerned.
For goodwill, intangible assets with an unlimited useful life, and intangible assets that are not yet ready for use, the recoverable amount is estimated at the closing date.
An impairment loss is recognised whenever the carrying amount of an asset or its cash-generating unit exceeds its recoverable amount. Impairment losses are recognised in the statement of profit or loss.
Impairment losses recognised in respect of cash-generat-ing units are allocated first to reduce the carrying amount of any goodwill allocated to the units, and then to reduce the carrying amount of the other assets in the unit (or group of units) on a pro rata basis.
(20a) Determination of recoverable amount
The recoverable amount of an asset is equal to the higher of its net selling price and its value in use. To determine the value in use, the discounted value of the estimated future cash flows is calculated using a discount rate that reflects current market rates as well as the specific risks associated with the asset. For any asset that does not generate cash inflows and is largely independent of other assets, the recoverable amount is determined on the basis of its cash-generating unit.
(20b) Reversal of impairments
An impairment loss relating to securities held to maturity or assets measured at amortised cost is reversed if the increase in fair value subsequent to recognition of the loss can be objectively linked to an event that occurred after the impairment loss was recognised.
Impairment losses in respect of goodwill are never reversed.
In respect of other assets, impairments recognised in other periods are reversed if there is an indication that the impairment no longer exists or has decreased and if there has been a change in the estimates used to determine the recoverable amount.
An impairment is reversed only to the extent that the asset’s carrying amount does not exceed the carrying amount that would have been determined, net of depreciation or amortisation, if no impairment had been recognised.
(21) Share capital
(21a) Costs of issuing ordinary shares
Costs directly attributable to the issuing of ordinary shares are charged to equity, after deduction of any tax effects.
(21b) Repurchase of own shares
If shares representing capital that is recognised as equity in the balance are repurchased, the amount of the consideration paid, including directly attributable costs, is recognised as a deduction from equity. Repurchased shares are classified as treasury shares and are presented as a deduction from total equity.
(21c) Dividends
Dividends are recognised as a liability in the period in which these are declared.
(22) Interest-bearing loans
(22a) Financing of preference share capital
Preference share capital is classified as a liability because the dividend payments are not discretionary. Dividends on preference share capital are recognised as interest expense in the statement of profit or loss.
(22b) Loans
Interest-bearing loans are initially recognised at fair value less attributable transaction costs. Any difference between the amortised cost and the redemption amount calculat-ed by the effective interest method is recognised in the statement of profit or loss over the term of each such loan.

21Financial statements 2017 - Heijmans
FINANCIAL STATEMENTS
Accounting principles
(23) Employee benefits
(23a) Defined contribution plans
Commitments for contributions to defined-contribution pension plans are recognised as an expense in the statement of profit or loss when they are due.
(23b) Defined benefit plans
The Group’s net obligation in respect of defined benefit pension plans is calculated separately for each plan by estimating the amount of future pension benefit that employees have earned in return for their service in the reporting period and in previous periods. The discounted present value of these pension benefits is determined, and is reduced by the fair value of the plan assets. The discount rate is the yield at the closing date on high-qual-ity corporate bonds that have terms to maturity approxi-mately the same as the terms of the Group’s liabilities. The calculation is performed by a qualified actuary using the projected unit credit method. This method takes into account future salary increases resulting from employee career opportunities and general salary increases, including adjustments for inflation.
If the entitlements under a plan are changed, or a plan is curtailed, the resulting change in entitlements relating to past service, or the gain or loss on the closure, as the case may be, is recognised directly in the statement of profit or loss.
Actuarial gains and losses are recognised directly as other comprehensive income that will never be reclassified to the statement of profit or loss.
If the result of the calculation is a potential asset for the Group, recognition of the asset is limited to the present value of the economic benefits available as possible future refunds from the plan or lower future contribu-tions. When calculating the present value of the economic benefits, possible minimum financing obligations that apply are taken into account.
(23c) Long-term employee benefits
The Group’s net liability in respect of long-term employee benefits, other than pension plans, is the amount of future benefits that employees have accrued in return for their service in the reporting period and in previous periods, such as long-service payments, bonuses and incentives. The liability is calculated using the projected unit credit method and is discounted to determine its
present value. The discount rate is the yield at the closing date on high-quality corporate bonds that have terms to maturity approximately the same as the terms of the Group’s liabilities. Actuarial gains and losses on these benefits are recognised in the statement of profit or loss.
(23d) Severance payments
Severance payments are recognised as an expense if the Group has shown that it is committed to terminating the employment contract of an employee or group of employees before the normal retirement date, by producing a detailed, formal plan, without there being a realistic option of the plan being withdrawn.
(24) Provisions
A provision is recognised in the statement of financial position if the Group has a present legal or actual liability that is the result of a past event and it is probable that its settlement will require an outflow of funds. Provisions are determined by discounting the expected future cash flows at a pre-tax discount rate that reflects current market assessments of the time value of money and, where necessary, the risks specific to the liability. The accrued interest on provisions is treated as a financing charge.
(24a) Warranties
A provision for warranties is recognised after the underly-ing products or services have been sold and delivered. The provision is made for costs that must be incurred to correct deficiencies that appear after delivery but during the warranty period.
(24b) Restructuring
A restructuring provision is recognised (i) when the Group has approved a detailed and formal restructuring plan and (ii) the restructuring has either commenced or been publicly announced.
(24c) Environment
A provision for restoration of contaminated land is formed in accordance with the Group’s environmental policy and applicable legal requirements.
(24d) Onerous contracts
A provision for onerous contracts is recognised if the benefits that the Group expects to receive from a contract are lower than the unavoidable costs of meeting the
22 Financial statements 2017 - Heijmans
FINANCIAL STATEMENTS
Accounting principles
contractual obligations. Provisions are valued at the lower of the present value of the expected costs of terminating the contract and the present value of the expected net costs of continuing the contract. Where appropriate, the Group recognises impairment losses on any assets associated with the contract prior to forming the provision.
(25) Trade and other payables
Trade and other payables are recognised at amortised cost.
(26) Statement of cash flows
The statement of cash flows is prepared using the indirect method. The liquidity item in the statement of cash flows comprises cash and cash equivalents after deduction of current-account overdrafts that are repayable on demand.
(27) Segment reporting
A segment is a clearly distinguishable operation of the Group. The segments are identified in accordance with the classification used by the Executive Board when taking operational decisions. The Group distinguishes the following segments: Property Development, Residential Building, Non-Residential, and Infrastructure. Residential and Non-Residential Building will be brought under unified control and integrated in the course of 2018 into a new segment of Building&Technology (Dutch name: Bouw&Techniek).

23Financial statements 2017 - Heijmans
FINANCIAL STATEMENTS
Segment reporting
x € 1.000
6.1 Segment reporting
The Group distinguishes the following segments: Property Development, Residential Building, Non-Residential, and Infra, in line with the management conducted by the Executive Board. Residential and Non-Residential Building will be integrated and brought under unified control in the course of 2018 into a new segment of Building&Technology (Dutch name: Bouw&Techniek). The operations in Germany and Belgium, which as at year-end 2016 were recognised in the statement of financial position as assets and liabilities held for sale, were sold in 2017 and have been included in the statement of profit or loss as discontinued operations. The condensed statements of profit or loss for these operations are presented as separate segment information. The segments are managed primarily on the basis of operating results. In accordance with IFRS 8, the segment figures represent data that can be allocated to a segment either directly or on reasonable grounds.
Condensed statement of profit or loss by business segment
2017Business segments
Property Develop-
mentResidential
BuildingNon-
Residential EliminationsBuilding &
TechnologyInfra-
structure OtherDiscontinued
operations Eliminations Total
RevenueThird parties 391.004 102.735 235.625 338.360 669.366 3.484 85.060 1.487.274Intercompany - 194.488 4.780 -416 198.852 10.405 750 0 -210.007 0Total revenue 391.004 297.223 240.405 -416 537.212 679.771 4.234 85.060 -210.007 1.487.274
Operating result 10.542 5.022 -9.151 -4.129 25.238 -17.321 30.994 - 45.324
Finance income 2.236Finance expense -10.968Share in results of joint ventures and associates
1.848 0 -1.515 -1.515 -15.745 742 0 - -14.670
Result before tax 21.922
Income tax -2.380
Result after tax 19.542
2016Business segments
Property Develop-
mentResidential
BuildingNon-
Residential EliminationsBuilding &
TechnologyInfra-
structure OtherDiscontinued
operations Eliminations Total
RevenueThird parties 331.951 132.215 293.105 425.320 608.725 3.684 514.111 1.883.791Intercompany - 164.112 21.941 -1.085 184.968 11.885 0 -196.853 0Total revenue 331.951 296.327 315.046 -1.085 610.288 620.610 3.684 514.111 -196.853 1.883.791
Operating result -7.574 4.001 -6.894 - -2.893 -81.897 -12.093 10.470 - -93.987
Finance income 4.822Finance expense -12.597Share in results of joint ventures and associates
1.671 0 -9.266 - -9.266 2.854 79 2.622 - -2.040
Result before tax -103.802
Income tax -6.692
Result after tax -110.494
6. Segment reporting

24 Financial statements 2017 - Heijmans
FINANCIAL STATEMENTS
Segment reporting
x € 1.000
Condensed statement of financial position and analysis by business segment
2017Business segments
Property Development
Residential Building
Non-Residential
Building & Technology
Infra- structure Other
Discontinued operations Eliminations Total
Assets 304.141 103.851 136.624 240.475 291.496 311.091 - -409.341 737.862
Not allocated 32.941
Total assets 304.141 103.851 136.624 240.475 291.496 311.091 - -409.341 770.803
Liabilities 267.299 98.704 133.919 232.623 258.965 161.449 - -409.341 510.995
Not allocated 97.631
Total liabilities 267.299 98.704 133.919 232.623 258.965 161.449 - -409.341 608.626
Equity 162.177
Total equity and liabilities 770.803
Property, plant and equipment
Depreciation 38 46 - 46 3.747 7.005 923 - 11.759
Investments 241 - - - 1.635 2.069 - - 3.945
Intangible assets
Amortisation - - 1.021 1.021 891 - 8 - 1.920
Joint ventures and associates
Carrying amount 57.662 - 2.720 2.720 4.207 1.768 - 66.357

25Financial statements 2017 - Heijmans
FINANCIAL STATEMENTS
Segment reporting
x € 1.000
2016Business segments
Property Development
Residential Building
Non-Residential
Building & Technology
Infra- structure Other
Discontinued operations Eliminations Total
Assets 327.952 94.747 153.322 248.069 211.557 403.884 282.586 -448.320 1.025.728
Not allocated 30.440
Total assets 327.952 94.747 153.322 248.069 211.557 403.884 282.586 -448.320 1.056.168
Liabilities 303.950 93.955 149.626 243.581 250.838 206.690 214.648 -519.154 700.553
Not allocated 213.717
Total liabilities 303.950 93.955 149.626 243.581 250.838 206.690 214.648 -519.154 914.270
Equity 141.898
Total equity and liabilities 1.056.168
Property, plant and equipment
Depreciation 38 134 - 134 4.467 6.703 5.588 - 16.930
Investments - 60 - 60 1.751 5.735 7.380 - 14.986
Intangible assets
Amortisation - - 1.021 1.021 569 - - 32 1.622
Joint ventures and associates
Carrying amount 57.150 - 734 734 5.714 2.198 - - 65.796
Transactions between business segments are conducted on arm’s length terms that are comparable to those for transacti-ons with third parties. Assets not allocated mainly concern deferred tax assets. Unallocated liabilities mainly concern interest- bearing loans and other financing commitments.
By the nature of its operations, the Infrastructure segment is highly dependent on public sector contracts.
External revenues breakdown by country as follows:2017 2016
Netherlands 1.402.214 1.369.680
Belgium 50.008 230.467
Germany 35.052 283.644
Total 1.487.274 1.883.791
Non-current assets (including those held for sale) breakdown by country as follows:2017 2016
Netherlands 281.815 290.464
Belgium 123 18.191
Germany 271 59.337
Total 282.209 367.992

26 Financial statements 2017 - Heijmans
FINANCIAL STATEMENTS
Segment reporting
x € 1.000
Underlying EBITDA by business segment2017In € millions
Property Development
Residential Building
Non-Residential
Building & Technology
Infra- structure Other
Discontinued operations Total
Underlying EBITDA 19,9 5,3 -6,0 -0,7 15,9 -5,2 0,9 30,8
EBITDA of joint ventures -3,1 0,9 0,9 16,4 -0,2 14,0
Property write-downs -6,2 -6,2
Reorganisation costs -0,2 -3,0 -3,2 -2,8 -2,0 -8,0
Soil remediation -3,0 -3,0
Gains on sale of investees 0,4 31,0 31,4
Total exceptional items -9,3 -0,2 -2,1 -2,3 14,0 -5,2 31,0 28,2
EBITDA 10,6 5,1 -8,1 -3,0 29,9 -10,4 31,9 59,0
Depreciation and amortisation -0,1 -0,1 -1,0 -1,1 -4,7 -6,9 -0,9 -13,7
Operating result 10,5 5,0 -9,1 -4,1 25,2 -17,3 31,0 45,3
2016In € millions
Property Development
Residential Building
Non-Residential
Building & Technology
Infra- structure Other
Discontinued operations Total
Underlying EBITDA 14,7 4,1 -14,1 -10,0 -72,8 -5,2 26,4 -46,9
EBITDA of joint ventures -3,4 9,0 9,0 -1,7 0,2 -3,8 0,3
Property write-downs -18,8 0,0 -18,8
Reorganisation costs -0,8 -0,8 -2,3 -0,4 -0,4 -3,9
Gains on sale of investees 0,0 -6,1 -6,1
Total exceptional items -22,2 0,0 8,2 8,2 -4,0 -0,2 -10,3 -28,5
EBITDA -7,5 4,1 -5,9 -1,8 -76,8 -5,4 16,1 -75,4
Depreciation and amortisation -0,1 -0,1 -1,0 -1,1 -5,1 -6,7 -5,6 -18,6
Operating result -7,6 4,0 -6,9 -2,9 -81,9 -12,1 10,5 -94,0
With underlying EBITDA, the Group is referring to earnings before interest, tax, depreciation and amortisation (equal to the operating result before depreciation/amortisation) adjusted for the EBITDA from joint ventures, property write-downs, reorganisation costs, gains and losses on the sale of entities, impairment losses on goodwill and other non-operating results considered exceptional by the Group that are relevant in the above statement. The soil remediation costs in 2017 relate to industrial sites sold off as part of the restructuring. The underlying EBITDA is also used as the basis for calculation for covenant reporting to the bank consortium.

27Financial statements 2017 - Heijmans
FINANCIAL STATEMENTS
Segment reporting
x € 1.000
6.2 Discontinued operations On 17 January 2017, Heijmans sold its subsidiary Franki to PORR Deutschland GmbH. The purchase price of €14 million was paid in cash on 16 January 2017. In 2016, Franki generated a result after tax of approximately €0.4 million (before write-downs of goodwill and property, plant and equipment). The book loss of €6.1 million connected with this disposal was recognised in 2016. €2.0 million of the loss was treated as an impairment of intangible assets and €4.1 million as an impairment of property, plant and equipment, before being reclassified under assets held for sale. The amount of cash included in the sale was nil.
On 25 April 2017, Heijmans sold all the shares of its Belgian companies Heijmans Bouw, Heijmans Infra, Van den Berg and Heijmans (B) NV to BESIX. The net cash proceeds for Heijmans (selling price of €95 million less cash of €55 million included in the sale) amounted to €40 million. The book profit on the disposal was €14 million. In the period prior to the date of disposal, these Belgian entities generated a combined result after tax of €0.5 million.
On 21 April 2017, Heijmans sold all the shares of Heijmans Oevermann GmbH to PORR Deutschland GmbH. The net cash proceeds for Heijmans (selling price of €58 million less cash of €15 million included in the sale) amounted to approxima-tely €43 million. The book profit on the disposal was €17 million. In the period prior to the date of disposal, Oevermann reported a loss after tax in 2017 of approximately €2.5 million.
In the statement of profit or loss, the above results on disposal have been accounted for in discontinued operations.
As at year-end 2016, the entities were recognised in the statement of financial position as assets and liabilities held for sale.
The cash flows from discontinued operations (in 2017 up to the date of disposal) amounted to:
In € millionsCash flows from discontinued operations
2017 2016
Cash flow from operating activities -44 -1
Cash flow from investing activities 11 -7
Cash flow from financing activities -24 -1
-57 -9
Prior to the disposal of the Belgian entities, there were a number of intercompany payments that have been included in the cash flow from investing activities and the cash flow from financing activities.

28 Financial statements 2017 - Heijmans
FINANCIAL STATEMENTS
Segment reporting
6.3 Other operating income
Other operating income from continuing operations 2017 2016
Gain on sale of non-current assets 572 138
Miscellaneous 1.934 583
2.506 721
The gain on the sale of non-current assets relates to the sale of machinery and equipment.
6.4 Staff costs, depreciation, and research and development expenses
Staff costs included under continuing operations in the statement of profit or loss are broken down as follows:
Staff costs 2017 2016
Wages and salaries -266.773 -272.204
Compulsory social insurance contributions -41.110 -42.046
Defined contribution plans -29.313 -29.840
Defined benefit plans and long-service payments -568 -554
-337.764 -344.644
The income statement includes an amount of approximately €8 million (2016 €4 million), of which €7 million (2016: €4 million) relates to reorganisation provisions and €1 million (2016: €0 million) to wholly or partly vacant property and other expenses deemed directly involved in the reorganisation.
The number of employees at year-end 2017 was 4,554 in the Netherlands (2016: 4,716).
x € 1.000

29Financial statements 2017 - Heijmans
FINANCIAL STATEMENTS
Segment reporting
Depreciation and amortisation relating to continuing operations recognised in the statement of profit or loss is broken down as follows:
Depreciation 2017 2016
Depreciation of property, plant and equipment -10.836 -11.342
Amortisation of intangible assets -1.912 -1.590
-12.748 -12.932
Depreciation of property, plant and equipment is included in the cost of sales and administrative expenses. Amortisation of intangible assets is recognised under other operating expenses.
The costs for research and development relating to continuing operations recognised in the statement of profit or loss are:
Costs for research and development 2017 2016
-2.841 -2.675
Project work also involves research and development activities, which are reflected in the cost of sales. The costs relating to these activities are not included in the figures stated above.
6.5 Other operating expenses
Other operating expenses for continuing operations are broken down as follows:
Other operating expenses for continuing operations 2017 2016
Amortisation of intangible assets -1.912 -1.590
-1.912 -1.590
The amortisation of intangible assets includes the customer base and concessions for sand quarries.
x € 1.000

30 Financial statements 2017 - Heijmans
FINANCIAL STATEMENTS
Segment reporting
x € 1.000
6.6 Finance income and expense
The net financing expense for continuing operations is broken down as follows:
Finance income and expense 2017 2016
Interest income 1.702 2.482
Finance income 1.702 2.482
Interest expense -13.399 -13.097
Loan impairment reversal 1.100 0
Capitalised financing costs 1.496 1.820
Finance expense -10.803 -11.277
-9.101 -8.795
The cumulative finance expense for 2017 amounts to €9.1 million, which is €0.3 million higher than the €8.8 million for 2016.
The interest and development costs for land portfolios that are under development are capitalised. The interest rate used for determining the financing costs to be capitalised is 4.20% for 2017 (2016: 4.20%).
The finance expense in 2017 includes the reversal of an impairment loss previously recognised on an outstanding loan to a previously sold associate.
The average interest rate in 2017 was higher than in 2016, primarily as a consequence of the increased interest margin on the syndicate loan contracted as part of the refinancing operation at the start of 2017. The effect was mitigated by a reduction in the average level of debt, chiefly as a consequence of the disposal of entities outside the Netherlands. For a summary of the interest rates, see note 6.20.

31Financial statements 2017 - Heijmans
FINANCIAL STATEMENTS
Segment reporting
x € 1.000
6.7 Income tax
Recognised in the statement of profit or loss 2017 2016
Current tax charges or credits
Current financial year -225 -4.640
Prior financial years -2.155 250
Amount of the positive effect of losses not previously recognised, receivables or temporary differences used to reduce the current tax charges - -261
-2.380 -4.651
Deferred tax charges or credits
Relating to temporary differences and losses recognised in the current financial year -1.590 24.294
Relating to the write-off of a deferred tax asset (charge) or to the reversal of a write-off (credit) 1.590 -26.755
Relating to adjustments for prior years 0 420
0 -2.041
Total tax charge/credit in the statement of profit or loss -2.380 -6.692
For 2017, the tax charge relating to continuing operations is €0 million (2016: charge of €0.3 million).

32 Financial statements 2017 - Heijmans
FINANCIAL STATEMENTS
Segment reporting
x € 1.000
Analysis of the effective tax rate2017 2016
% € % €
Result before tax 21.922 -103.802
Based on local tax rate 25,0% -5.481 25,0% 25.950
Effect of foreign tax rates 0,5% -113 -1,3% -1.320
Non-deductible expenses 9,0% -1.970 -1,6% -1.629
Non-taxable revenue in results of investees 14,5% -3.185 -2,6% -2.746
Non-taxable proceeds from sale of investees -39,8% 8.727 0,0% 0
Losses not recognised in current financial year and other deferred tax assets and the reversals thereof 0,0% 0 -25,8% -26.755
Effect of utilising losses available for set-off -7,2% 1.590 0,2% 250
Effect of adjustments to estimates for prior years 8,9% -1.948 -0,4% -442
Overall tax burden 10,9% -2.380 -6,4% -6.692
The effective tax rate for 2017 is 10.9% (2016: -6.4%).
The main differences between the profit calculated for reporting purposes and that for tax purposes concern the non-deductible interest expenses relating to the cumulative preference financing shares, general limits on expense deductions in the various jurisdictions, the exempt results under the substantial-holding privilege, the exempt results on disposal and the non-deductible selling costs connected with the disposal of the international operations and non-recognition or reversal of losses in the Netherlands.

33Financial statements 2017 - Heijmans
FINANCIAL STATEMENTS
Segment reporting
x € 1.000
6.8 Income tax assets and liabilities
31 december 2017 31 december 2016
Geographical segment Receivables Liabilities Receivables Liabilities
Netherlands 38 109 38 65
Belgium - - - -
Germany - - - -
38 109 38 65
Income tax assets relate to outstanding income tax claims for financial years that have not yet been settled and for which excessive provisional assessments were paid. Income tax liabilities relate to outstanding income tax payments for financial years that have not yet been settled, supplemental to income tax assessments already paid, and taking account of prospec-tive and retrospective loss relief rules.

34 Financial statements 2017 - Heijmans
FINANCIAL STATEMENTS
Segment reporting
x € 1.000
6.9 Property, plant and equipment
CostLand and buildings
Machinery, installations
and large-scale equipment
Other capital assets
Operating assets under construction Total
Balance at 01 January 2016 84.969 148.335 67.695 4.898 305.897
Investments 654 4.851 5.111 4.370 14.986
Disposals -10.723 -14.723 -12.956 0 -38.402
To assets held for sale -19.145 -64.430 -10.558 -3.396 -97.529
Reclassifications 0 2.051 2.142 -4.193 0
Balance at 31 December 2016 55.755 76.084 51.434 1.679 184.952
Balance at 1 January 2017 55.755 76.084 51.434 1.679 184.952
Investments 373 1.434 1.219 919 3.945
Disposals -441 -4.724 -11.361 0 -16.526
Reclassifications 135 994 631 -1.760 0
Balance at 31 December 2017 55.822 73.788 41.923 838 172.371

35Financial statements 2017 - Heijmans
FINANCIAL STATEMENTS
Segment reporting
x € 1.000
Depreciation and impairment losses
CostLand and buildings
Machinery, installations
and large-scale equipment
Other capital assets
Operating assets under construction Total
Balance at 01 January 2016 53.004 112.117 50.848 - 215.969
Depreciation 2.930 8.588 5.412 - 16.930
Disposals -9.388 -9.988 -12.475 - -31.851
Impairments of assets held for sale - 4.065 - - 4.065
To assets held for sale -10.586 -55.154 -8.928 - -74.668
Balance at 31 December 2016 35.960 59.628 34.857 0 130.445
Balance at 1 January 2017 35.960 59.628 34.857 - 130.445
Depreciation 2.231 3.438 5.167 - 10.836
Disposals -296 -4.208 -10.981 - -15.485
Balance at 31 December 2017 37.895 58.858 29.043 0 125.796
Carrying amount
At 1 January 2016 31.965 36.218 16.847 4.898 89.928
At 31 December 2016 19.795 16.456 16.577 1.679 54.507
At 01 January 2017 19.795 16.456 16.577 1.679 54.507
At 31 December 2017 17.927 14.930 12.880 838 46.575
As at year-end, the contractual obligations relating to the acquisition of property, plant and equipment amounted to €0.5 million.
Since the beginning of 2015, given the limited importance, investment property (property held for its rental income and/or increase in value) has been recognised as other capital assets, rather than as a separate item in the statement of financial position. The carrying amount of investment property was €2.0 million at year-end 2017 (2016: €1.9 million).

36 Financial statements 2017 - Heijmans
FINANCIAL STATEMENTS
Segment reporting
x € 1.000
6.10 Intangible assets
Intangible assets consist of goodwill and other identifiable intangible assets.
Cost GoodwillIdentifiable
intangible assets Total
Balance at 01 January 2016 183.576 48.359 231.935
To assets held for sale -26.970 -500 -27.470
Balance at 31 December 2016 156.606 47.859 204.465
Balance at 1 January 2017 156.606 47.859 204.465
Balance at 31 December 2017 156.606 47.859 204.465
Impairment losses and amortisation GoodwillIdentifiable
intangible assets Total
Balance at 01 January 2016 86.552 32.970 119.522
Amortisation - 1.622 1.622
Impairments of assets held for sale 2.029 0 2.029
To assets held for sale - -327 -327
Balance at 31 December 2016 88.581 34.265 122.846
Balance at 1 January 2017 88.581 34.265 122.846
Amortisation - 1.912 1.912
Balance at 31 December 2017 88.581 36.177 124.758
Carrying amountGoodwill
Identifiable intangible assets Total
At 1 January 2016 97.024 15.389 112.413
At 31 December 2016 68.025 13.594 81.619
At 01 January 2017 68.025 13.594 81.619
At 31 December 2017 68.025 11.682 79.707

37Financial statements 2017 - Heijmans
FINANCIAL STATEMENTS
Segment reporting
x € 1.000
The composition of the carrying amount for goodwill and other intangible assets at year-end 2017 is as follows:
Acquisition
2017 2016
GoodwillIdentifiable intangible
assets GoodwillIdentifiable
intangible assets
IBC (NL-2001) 21.207 - 21.207 -
Burgers Ergon (Nl-2007) 31.107 9.234 31.107 10.255
Other 15.711 2.448 15.711 3.339
Carrying amount at 31 December 2017 68.025 11.682 68.025 13.594
Other mainly refers to the cash-generating unit Infrastructure (€15 million).
For further details on the impairment of assets held for sale in 2016, refer to note 6.2.The remaining amortisation term for the intangible asset that was part of the Burgers Ergon acquisition is 9 years.
The remaining intangible assets of the other acquisitions relate mainly to concessions for sand quarries. The amortisation of the other intangible assets is recognised in the statement of profit or loss under other operating expenses. Goodwill is tested annually for impairment, based on the relevant cash-generating unit. For an explanation of the calculation of the recoverable amount, reference is made to the accounting policies.
The impairment tests are based on the value in use calculated by means of the discounted cash flow method. The pre-tax WACC (weighted average cost of capital) used for this calculation was around 12% as in the preceding year, corresponding to a discount rate after tax of 9.5% (2016: 9.7%).
The value in use of the cash-flow generating business units is based on their expected future cash flows. The period adopted to determine the present value of cash flows is indefinite. In the determination of future cash flows, the medium to long-term planning for the relevant cash-flow generating unit is used. The assumptions underlying the medium to long-term planning are partly based on historical experience and external information sources. The medium to long-term planning generally covers a period of 5 years. Cash flows after 5 years are extrapolated using a growth rate of 1.5% (2016: 1.5%).
The recoverable amount calculated for the impairment test depends on the growth rate used and the period over which the cash flows are realised. Other important variables are the expected of revenue growth, probable margins and working capital requirements.
The expected cash flows are discounted using a pre-tax WACC of around 12%. If the pre-tax WACC were 1 percentage point higher, this would not result in an impairment. Cash flows after five years are extrapolated using growth rates not exceeding 1.5%. If this maximum were 1 percentage point lower, this would not result in an impairment.

38 Financial statements 2017 - Heijmans
FINANCIAL STATEMENTS
Segment reporting
x € 1.000
The cash-flow generating unit Non-Residential - to which the goodwill and other intangible assets of Burgers Ergon and the majority of the goodwill for IBC is allocated, totalling €60 million (2016: €61 million) - is sensitive to changes in the assumptions, with the possibility that the recoverable amount could become lower than the carrying amount of €58 million (2016: €45 million). According to the impairment test, the recoverable amount of the cash-flow generating unit Non-Residential is currently some €20 million (2016: €50 million) higher than the carrying amount. One significant factor in this context is the change in the EBIT (earnings before interest and tax) margin. For the purposes of the test, revenue has been assumed to rise to a level of around €430 million in 2020 (2017: €241 million actual revenue), partly on the back of developments providing mass-produced affordable housing. A key assumption is that the EBIT margin grows to 1.9% (2016: 4.0%) of revenue. If the EBIT margin is only 1.2% (2016: 2.0% , the recoverable amount is equal to the carrying amount.
6.11 Joint ventures and associates
The interests in joint ventures and investments in associates included in the statement of financial position breaks down as follows:
2017 2016
Joint ventures 62.048 61.595
Associates 4.309 4.201
66.357 65.796
Joint venturesTogether with 3i Investments plc. (formerly Barclays Infrastructure Funds Management), Heijmans has been participating since June 2013 in the joint venture Heijmans Capital B.V. for the financing of DBFMO (design, build, finance, maintain, operate) projects. The focus of the collaboration is on sharing the risk-bearing capital and knowledge required for such projects, from the tendering phase onwards. The project for the National Military Museum was transferred to the joint venture at the time of establishment. In 2014, Heijmans took on part of the funding for the projects A9-Gaasperdammerweg, RIVM-Utrecht Science Park/De Uithof and A12-Veenendaal-Ede-Grijsoord. Then in 2017, Heijmans also took on part of the funding of the A27/ A1 Hart van Zuid projects. The share of 3i Investments plc. in Heijmans Capital B.V is 80% and Heijmans’ share in the company is 20% (2016: 20%).
The figures presented below were extracted from the financial statements of Heijmans Capital, prepared in accordance with the Group’s accounting policies. Also shown below is the reconciliation of the Group’s interest with equity.

39Financial statements 2017 - Heijmans
FINANCIAL STATEMENTS
Segment reporting
x € 1.000
2017 2016
Revenue 6.946 27.030
Operating result -474 -1.799
Finance income 6.806 6.832
Finance expense -5.104 -5.054
Share in results of joint ventures 2.389 842
Result before tax 3.617 821
Income tax -356 51
Result after tax 3.261 872
Unrealised changes in the fair value of cash flow hedges 1.763 -2.841
Comprehensive income 5.024 -1.969
20% share of result after tax 652 174
20% share of other comprehensive income 353 -568
Non-current assets 107.912 110.664
Cash and cash equivalents 11.600 6.815
Other current assets 27.537 32.036
Total current assets 39.137 38.851
Non-current financial liabilities 124.816 128.162
Other non-current liabilities 1.400 105
Total non-current liabilities 126.216 128.267
Current financial liabilities 4.232 4.885
Other current liabilities 8.890 12.639
Total current liabilities 13.122 17.524
Net amount 7.711 3.724
20% share of equity 1.542 745
In 2017 Heijmans Capital distributed €198,000 to the Group in dividend (2016: nil). The amount of this dividend distribution received in 2017 was €28,000, the remainder of €170,000 becoming payable in 2018.
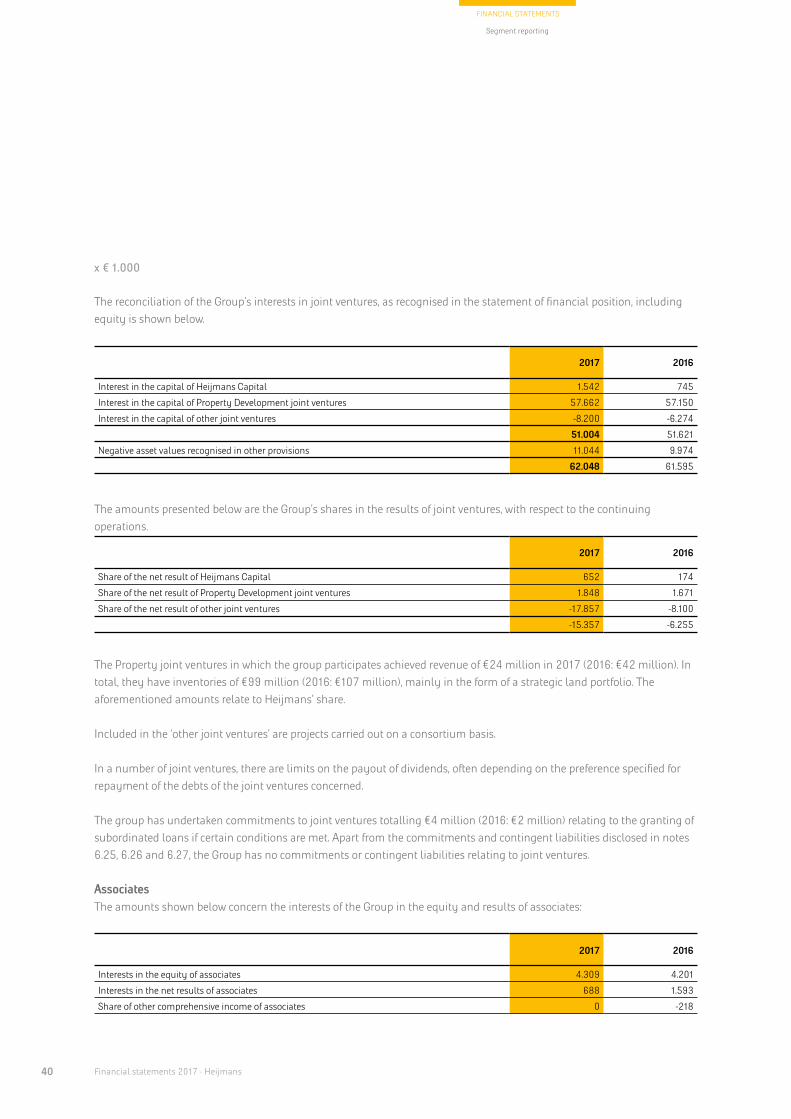
40 Financial statements 2017 - Heijmans
FINANCIAL STATEMENTS
Segment reporting
x € 1.000
The reconciliation of the Group’s interests in joint ventures, as recognised in the statement of financial position, including equity is shown below.
2017 2016
Interest in the capital of Heijmans Capital 1.542 745
Interest in the capital of Property Development joint ventures 57.662 57.150
Interest in the capital of other joint ventures -8.200 -6.274
51.004 51.621
Negative asset values recognised in other provisions 11.044 9.974
62.048 61.595
The amounts presented below are the Group’s shares in the results of joint ventures, with respect to the continuing operations.
2017 2016
Share of the net result of Heijmans Capital 652 174
Share of the net result of Property Development joint ventures 1.848 1.671
Share of the net result of other joint ventures -17.857 -8.100
-15.357 -6.255
The Property joint ventures in which the group participates achieved revenue of €24 million in 2017 (2016: €42 million). In total, they have inventories of €99 million (2016: €107 million), mainly in the form of a strategic land portfolio. The aforementioned amounts relate to Heijmans’ share.
Included in the ‘other joint ventures’ are projects carried out on a consortium basis.
In a number of joint ventures, there are limits on the payout of dividends, often depending on the preference specified for repayment of the debts of the joint ventures concerned.
The group has undertaken commitments to joint ventures totalling €4 million (2016: €2 million) relating to the granting of subordinated loans if certain conditions are met. Apart from the commitments and contingent liabilities disclosed in notes 6.25, 6.26 and 6.27, the Group has no commitments or contingent liabilities relating to joint ventures.
AssociatesThe amounts shown below concern the interests of the Group in the equity and results of associates:
2017 2016
Interests in the equity of associates 4.309 4.201
Interests in the net results of associates 688 1.593
Share of other comprehensive income of associates 0 -218

41Financial statements 2017 - Heijmans
FINANCIAL STATEMENTS
Segment reporting
x € 1.000
6.13 Deferred tax assets and liabilities
The net amount of the deferred tax assets and liabilities relating to temporary differences between the carrying amounts for tax purposes and for reporting purposes of items on the statement of financial position, together with recognised tax-loss carryforwards, can be broken down as follows:
Receivables31 december
Liabilities31 december
Net amount31 december
2017 2016 2017 2016 2017 2016
Property, plant and equipment - - 259 510 -259 -510
Intangible assets - - 2.987 3.291 -2.987 -3.291
Employee benefits - - 3.206 2.473 -3.206 -2.473
Provisions 33 90 - - 33 90
Recognised tax-loss carryforwards 35.629 35.521 - - 35.629 35.521
Deferred tax assets and liabilities 35.662 35.611 6.452 6.274 29.210 29.337
Set-off of deferred tax assets and liabilities -5.845 -5.665 -5.845 -5.665 - -
Net deferred tax assets and liabilities 29.817 29.946 607 609 29.210 29.337
6.12 Other investments
2017 2016
Long-term loans 29.507 33.361
Other long-term lending and investments 124 254
Balance at 31 December 29.631 33.615
The long-term loans mainly concern loans granted to property development joint ventures. An amount of €16 million of this item falls due within one year, with €14 million maturing after more than 5 years. The weighted average interest rate is approximately 3.5%. The loans are repayable and are secured by pledged assets and in other ways and by cash flows from projects being carried on by the joint ventures concerned.

42 Financial statements 2017 - Heijmans
FINANCIAL STATEMENTS
Segment reporting
x € 1.000
The movement in the statement of financial position of the deferred tax assets and liabilities in 2017 breaks down as follows:
Net amount at 1 January 2017
Recognised in income tax
Recognised in other comprehen-
sive income Net amount at 31
December 2017
Property, plant and equipment -510 251 -259
Intangible assets -3.291 304 - -2.987
Employee benefits -2.473 -606 -127 -3.206
Provisions 90 -57 - 33
Recognised tax-loss carryforwards 35.521 108 - 35.629
Total 29.337 0 -127 29.210
The movement in the statement of financial position of the deferred tax assets and liabilities in 2016 breaks down as follows:
Net amount at 01 January
2016 Recognised in
income tax
Recognised in other
comprehensive income
To assets/liabilities held
for sale
Net amount at 31 December
2016
Property, plant and equipment -1.071 105 - 456 -510
Intangible assets -7.968 -479 - 5.156 -3.291
Work in progress -888 1.019 - -131 0
Employee benefits -6.479 15 4.316 -325 -2.473
Provisions -817 323 - 584 90
Other items 904 0 - -904 0
Recognised tax-loss carryforwards 40.756 -3.024 - -2.211 35.521
Total 24.437 -2.041 4.316 2.625 29.337

43Financial statements 2017 - Heijmans
FINANCIAL STATEMENTS
Segment reporting
x € 1.000
Measurement of deferred tax assetsAt year-end 2017, the recognised loss carry forward was €35.6 million, which relates to the loss carryforward of the Dutch tax group. This loss carryforward has been set off against the tax group’s deferred tax liabilities.
The losses of the Dutch tax group are subject to a loss carryforward period of 9 years. A deferred tax asset is recognised to the extent that it is probable, based on forecasts, that sufficient future taxable profits will be available that can be utilised towards realising the deferred asset. A relatively small number of large problem projects produces the losses, Measures have been taken to prevent such losses. Most of the activities perform according to plan. The forecasts are based on the order book, the 2018 business plan, and the long-term forecast. These also underlie the measurement of the recoverable amount of goodwill (for impairment tests). For the long-term forecast, the average EBIT margin of the Dutch tax group is assumed to grow to approximately 3% of revenue. The remaining settlement term of 9 years is longer than the period currently used until 2022. A factor inherent in the measurement of the deferred tax assets is that the utilisation of losses depends on the realisation of the 2018 business plan and the long-term forecasts, which are the Group’s best estimates. Based on the projected results for the years 2018–2022 and the current tax rate of 25%, there will be sufficient taxable profits over the next few years to enable the tax asset recognised as at 31 December 2017 to be realised.
Measurement of deferred tax liabilitiesFor determining the amount of the deferred tax liabilities, the value for tax purposes of the construction work in progress in the Netherlands (including residential building projects) is largely treated as being equal to the value under IFRS.
Deferred tax assets or liabilities are recognised for any temporary differences originating at subsidiaries, joint operations or joint ventures. No deferred tax assets or liabilities have been recognised for temporary differences arising from investments in associates in view of their relative insignificance.
The majority of the deferred tax liabilities have a term of more than one year.
Tax losses not recognised in the statement of financial positionAt year-end 2017, the tax-deductible losses of the Heijmans NV tax group amounted to €261.3 million (2016: €266.3 million). An analysis of this figure shows that €44.9 million relates to 2012, €69.6 million to 2014, €43.0 million to 2015, and €103.8 million to 2016. Out of the total, €119 million has not been recognised. At year-end 2017, the other tax losses not recognised in the statement of financial position amounted to €40.9 million (2016: €41.3 million). This relates to one German and two Belgian subsidiaries that conduct no operations.

44 Financial statements 2017 - Heijmans
FINANCIAL STATEMENTS
Segment reporting
x € 1.000
6.14 Inventories
31 december 2017 31 december 2016
Strategic land holdings 150.043 146.974
Residential property in preparation or under construction 27.040 58.156
Raw materials and consumables 8.769 9.216
Finished products 1.341 2.088
Total 187.193 216.434
Carrying amount of inventories pledged as security 75.588 3.082
Inventories amount recognised as a charge in the period 384.521 352.533
Finished products measured at net realisable value 1.313 3.066
Strategic land portfolioThe strategic land portfolio comprises land holdings that are measured at cost or net realisable value if lower. The net realisable value of these holdings may be either the direct realisable value or the indirect realisable value. The recognised net realisable value depends on the expected manner and time horizon of realisation and in most cases, therefore, is measured using an indirect realisable value method. The indirect realisable value is the estimated selling price in the ordinary course of business less the estimated costs of completion and the estimated costs necessary to make the sale, the expected cash flows usually being discounted to net present value using a discount rate of 6% unless a different rate has been agreed, for example on the basis of favourable financing arrangements available within a joint undertaking. In fixing the discount rate, account is taken of the expected capital structure, operational risks and specific circumstances affecting Heijmans or the project concerned. Determining the indirect realisable value involves the use of judgements and estimates. The strategic land portfolio is affected by several elements of uncertainty, such as demographic changes, location, and details and implementation of development plans and administrative decisions, with as local a focus as possible. For each site, this results in projections for land and house prices and for other variables that ultimately have a bearing on the indirect realisable value. The Group makes a comprehensive internal assessment of the value of its land holdings twice a year.

45Financial statements 2017 - Heijmans
FINANCIAL STATEMENTS
Segment reporting
x € 1.000
In general, the risk of deviations from the judgements and estimates is greater for strategic land holdings without planning permission than for those with. Moreover, this risk keeps increasing the longer the expected delay is before the start of development. The net realisable value of the strategic land portfolio was calculated in 2017 and compared with the carrying amount. This led to a write-down of €5.2 million and a write-down of €1.0 million concerning a joint venture (2016: write-downs totalling €17.6 million and a reversal of an earlier write-down of €1.2 million concerning a joint venture). The decreases in value are partly due to specific local conditions that have adversely affected the success of projects, time to completion, expected margins and the number of homes completed.
In principle, the term of the strategic land portfolio is more than 12 months after the closing date (mostly 5 to 10 years). Residential property in preparation or under construction usually has a term of 3 to 5 years as from the closing date. The other items in principle have a term of less than 12 months.
For more information on the pledging of land portfolios in connection with the new financing agreements, refer to note 6.20.
Residential property in preparation or under construction Residential property in preparation or under construction can be analysed as follows:
2017 2016
Unsold residential properties:
Costs less provisions for losses and risks 36.307 57.147
Sold:
Costs less provisions for losses and risks, plus profits based on percentage of completion 305.995 312.784
less: less: Invoiced instalments -315.262 -311.775
Total residential property in preparation or under construction 27.040 58.156
Revenue from sales of residential property in preparation and or under construction recognised in the reporting period amounted to €0.4 billion (2016: €0.3 billion). The amounts in question relate to continuing operations.

46 Financial statements 2017 - Heijmans
FINANCIAL STATEMENTS
Segment reporting
x € 1.000
6.15 Work in progress
31 december 2017 31 december 2016
Costs less provisions for losses and risks, plus profits based on percentage of completion 1.789.727 1.683.259
less: less: Invoiced instalments -1.857.428 -1.741.144
Balance of work in progress -67.701 -57.885
Positive balance of work in progress (recognised under current assets) 61.264 60.196
Negative balance of work in progress (recognised under current liabilities) -128.965 -118.081
Balance of work in progress -67.701 -57.885
A periodical assessment of the carrying amount of work in progress is made for each project by the project owner and the management of the unit concerned. This assessment is essentially performed on the basis of the figures in the project files, the project accounts and the knowledge and experience of those involved. Inherent in this process and the project-related activities is that estimates have to be made and that the Group is involved in negotiations and discussions concerning the financial progress of projects, such as contract savings or extras, claims, incentives and penalties, completion dates and the quality standard of the work. It may turn out at a later stage that actual results differ from the estimates. This will be so particularly for long-term projects that include considerable customisation. It can also occur if there are unsettled claims or discussions with clients about additional work that are still continuing on the closing date. For further details on a number of specific projects, refer to note 6.29.
The degree of uncertainty surrounding these estimates becomes greater the more, for example:• types of contract and associated specific agreements involve increased risks for the Group. In a DC contract, for example,
the Group assumes the design risk (as well as construction). DBMO contracts also include responsibility for maintenance and operation;
• projects are still at the design stage. It is possible for substantial changes to occur in the process of turning a provisional design into the final design, leading to adjustments both up and down compared with the initial projection.
For example there may be extra work, claims or unforeseen circumstances with a potential cost to the Group. For example there may be extra work, claims or unforeseen circumstances with a potential cost to the Group.
Revenue from additional work is included in the overall contract revenue if the client has accepted the sum involved in any way. Claims and incentives are recognised in the amount for work in progress where it is probable that they will lead to revenue and can be reliably measured. In determining the amount to be recognised, account is taken of specific contractual agreements and the legal framework in the country where the project is being carried out.

47Financial statements 2017 - Heijmans
FINANCIAL STATEMENTS
Segment reporting
x € 1.000
For claims and penalties imposed by contractors against Heijmans, because of construction overruns for example, are recognised if it is likely that they will have an adverse effect.
Bonuses are recognised as revenue from work in progress if the project is far enough advanced and it is probable that the performance indicators specified will be met, and the bonus amount can be reliably determined. If the bonus can only be received after expiry of a predetermined period following completion of the project, then that bonus is only recognised when it is sufficiently probable that the bonus will be received.
The positive balance of work in progress represents all the projects in progress for third parties where the incurred costs plus the capitalised profit, less the recognised losses, are greater than the invoiced instalments. The negative balance of work in progress represents all the projects in progress for third parties where the incurred costs plus the capitalised profit, less the recognised losses, are less than the invoiced instalments. Revenue from work in progress carried out for third parties and from service activities recognised in the reporting period amounted to €1.0 billion (2016: €1.0 billion). The amounts in question relate to continuing operations. Work in progress generally has a term of less than 12 months.
6.16 Trade and other receivables
31 december 2017 31 december 2016
Trade receivables 120.304 115.963
Amounts still to be invoiced 15.146 23.604
Receivables from joint operations 5.016 7.065
Prepayments 10.642 12.848
Other receivables 14.554 16.591
Total trade and other receivables 165.662 176.071
Trade receivables are presented after deduction of impairment losses. The write-down for expected bad debts is recognised in the statement of profit or loss under administrative expenses. At year-end 2017, a provision of €4.1 million was formed for impairment of trade receivables (2016: €4.8 million).
Trade and other receivables are mainly short-term.

48 Financial statements 2017 - Heijmans
FINANCIAL STATEMENTS
Segment reporting
x € 1.000
6.17 Cash and cash equivalents
31 december 2017 31 december 2016
Bank balances 69.172 28.414
Cash in hand 0 1
Funds in blocked accounts 5.265 1.834
Total cash and cash equivalents 74.437 30.249
Of the total cash and cash equivalents, €48 million (2016: €24 million) is held by joint ventures. This increase is an effect of the strategic decision to undertake large-scale integrated projects to an increasing extent on a partnership basis. These cash and cash equivalents are exclusively available in consultation with the joint venture partners concerned.
The funds in blocked accounts mainly relate to the obligatory G accounts (guarantee accounts) under the Dutch Wages and Salaries Tax and Social Security Contributions (liability of Subcontractors) Act.
Cash is utilised to reduce the Group’s financing to the extent contractually and practically permitted, for example, by making the balances concerned part of notional cash pool arrangements.
6.18 Equity
Paid-up and called-up share capitalIn thousands of ordinary shares 2017 2016
Outstanding at 1 January 21.407 21.407
Share Matching Plan 2 -
Outstanding at 31 December 21.409 21.407
Refer to statement 2b for disclosures on the changes in equity, and to the Company financial statements for disclosures on the authorised share capital, the statutory reserve for investees, the hedging reserve, the appropriation of results and other figures.
In April 2017, the Group issued 2,289 shares in connection with the vesting of deferred bonus shares awarded to members of the Executive Board in April 2014 under the Share Matching Plan (see note 6.28).

49Financial statements 2017 - Heijmans
FINANCIAL STATEMENTS
Segment reporting
x € 1.000
6.19 Earnings per share
Basic earnings per ordinary share The basic earnings per share in 2017 on the combined operations amounted to €0.91 (2016: loss of €5.16) and, on conti-nuing operations, to a loss of €0.44 (2016: €5.52 loss). The calculation is based on the result after tax attributable to the holders of ordinary shares or depositary receipts for ordinary shares and the weighted average number of ordinary shares that were outstanding during 2017.
Result attributable to holders of ordinary shares (all operations) 2017 2016
Result attributable to holders of ordinary shares after tax 19.542 -110.494
Weighted average number of ordinary sharesIn thousands of shares 2017 2016
Ordinary shares outstanding on 1 January 21.407 21.407
Effect of shares issued under the Share Matching Plan on 28 April 2017 1 -
Weighted average number of ordinary shares at 31 December 21.408 21.407
Diluted earnings per ordinary share The calculation of the diluted earnings per share in 2017 is based on the weighted average number of ordinary shares during the year, which was 21,408,000. The calculation of the 2016 figures included the dilution effect related to the award of deferred bonus shares under the Bonus Investment Share Matching Plan (see note 6.28).

50 Financial statements 2017 - Heijmans
FINANCIAL STATEMENTS
Segment reporting
x € 1.000
6.20 Interest-bearing loans and other financing liabilities
The breakdown of interest-bearing loans and other financing liabilities is shown below.
31 December 2017 Non-current portion Current portion Total
Cumulative financing preference shares 45.100 - 45.100
Syndicated bank financing - - -
Project financing 67 267 334
Other non-current liabilities 9.370 4.834 14.204
Current account overdrafts with credit institutions - 1.128 1.128
Total liabilities 54.537 6.229 60.766
31 December 2016 Non-current portion Current portion Total
Cumulative financing preference shares 45.100 - 45.100
Syndicated bank financing - 105.000 105.000
Project financing 521 517 1.038
Other non-current liabilities 12.784 9.222 22.006
Current account overdrafts with credit institutions - 3.891 3.891
Total liabilities 58.405 118.630 177.035

51Financial statements 2017 - Heijmans
FINANCIAL STATEMENTS
Segment reporting
x € 1.000
Cumulative financing preference sharesAt year-end 2017, 4,510,000 cumulative financing preference shares B were outstanding at €10 a share. The annual amount of the interest payable on these shares, with effect from 1 January 2014, is 7.9% and is payable annually, 14 days after the General Meeting of Shareholders. The dividend will be reviewed on 1 January 2019 and every 5 years thereafter. The Group has the right to repurchase or cancel these preference shares before their maturity date in case of an interest rate change or at any other time subject to payment of compensation. There is no repayment obligation.
Syndicated bank financingThe total committed amount of the syndicated bank facility as at year-end 2017 was €155.9 million. This facility was refinanced at the start of 2017 with a maturity date of 30 June 2019. Efforts made to achieve more robust balance sheet ratios, resulting in a gradual reduction in the facility from €256 million to €122 million by mid-2019 (year-end 2018: €145 million). With the disposal of the operations outside the Netherlands and the improvement in the cash flow from operating activities, the Group was able to bring about a reduction in the facility to the current figure of €155.9 million by the end of October 2017, which was eight months ahead of the agreed schedule. On 31 March 2017, Deutsche Bank left the syndicate as planned, and it has since been made up of Rabobank, ING Bank, ABN AMRO Bank and KBC. The further reduction in the facility to €122 million anticipates the agreed exit of KBC from the banking syndicate as from mid-2019.
The interest rate payable to the banking syndicate is 4%. A cut in the interest rate to 3% comes into effect as soon as the amount of the facility has been reduced to €125 million. Collateral security has been provided for the facility. This is predominantly in the form of pledging of trade receivables and bank balances as well as a first mortgage on land holdings recognised at a combined carrying amount of approximately €75 million.
As a consequence of the substantial project losses incurred in Q4 2016, a different regime was applicable in 2017 for testing compliance with the financial covenants. As regards the tests as at 30 June 2017, 30 September 2017 and 31 December 2017, minimum levels for EBITDA and solvency were agreed. The applicable minimum EBITDA (cumulative as from 1 January 2017) was €0 million for the first half of 2017, €5 million for the first three quarters of 2017 and €20 million for the whole of 2017. The solvency ratio minimums were 16% on 30 June 2017, 18% on 30 September 2017 and 20% on 31 December 2017. The solvency ratio calculation involves dividing the capital base by total assets, the capital base being made up of equity plus the cumulative financing preference shares. Heijmans operated within the agreed covenants throughout the year. With the disposal of the non-Dutch businesses, which produced a book profit and a reduction in the size of the balance sheet, there was a structural improvement in the solvency ratio of approximately 10 percentage points, meaning that the agreed levels were comfortably achieved.
From 2018 onwards, the financial covenants from prior to 2017 become effective again and, if they are not satisfied, the facility can in principle be called in immediately. This concerns an interest cover ratio of a minimum of level 4, to be complied with at the end of each quarter, a senior debt cover ratio of a maximum of 3 on a six monthly basis and an average leverage ratio of a maximum of 2.5, to be complied with quarterly as from 30 June 2018. Satisfying the covenants is actively monitored within Heijmans. Based on the 2018 business plan, together with the already achieved quarterly figures during 2017, the Group expects to be able to continue operating within the covenants in the year ahead, the relevant parameters here being the development in EBITDA and net debt. Changes in the net debt position are a function of fluctuations in working capital, behind which lie seasonal effects and fluctuations due to specific projects in particular. During the course of the year, the working capital requirement is traditionally higher than at year-end, leading to an increase in net debt by as

52 Financial statements 2017 - Heijmans
FINANCIAL STATEMENTS
Segment reporting
x € 1.000
much as €50-100 million. The syndicated loan, which was not drawn on at all as at year-end 2017, is available to fund fluctuations in working capital.
The leverage ratio is obtained by dividing net debt by EBITDA (earnings before interest, tax, depreciation and amortisation). The interest cover ratio is calculated as EBITDA divided by net interest expense. The definitions of these items include several adjustments to the reported figures, as agreed with the bank consortium in the credit agreement. The main adjustments compared with the net debt for accounting purposes are an increase in respect of the net debt from joint ventures and a decrease in respect of the amount of the cumulative financing preference shares B in issue and certain specific project financing arrangements where there is no right of recourse against Heijmans. The main adjustments compared with the accounting EBITDA concern the capitalised interest, results relating to business units that have been sold off, fair value adjustments, reorganisation costs and EBITDA results from joint ventures. The main adjustments to the reported net interest expense concern the exclusion of interest expense on non-recourse project financing and cumulative financing B preference shares. Reconciliation between the underlying results, EBITDA, net debt and net interest expense as reported and in accordance with the definitions agreed with the bank consortium, and the calculation of the 2018 ratios, is presented below. As can be seen, Heijmans would already have satisfied the financial covenants applicable with effect from 31 March 2018 at year-end 2017.
The reconciliation between the underlying result, EBITDA, net debt and net interest expense as reported and in accordance with the definitions agreed with the bank consortium, and calculation of the ratios is shown below,

53Financial statements 2017 - Heijmans
FINANCIAL STATEMENTS
Segment reporting
x € 1.000
Amounts x €1 million note 2017 2016
Interest-bearing debt 6.20 60,8 177,0
Interest-bearing debt held for sale 0,0 1,3
Interest-bearing debt 6.20 60,8 178,3
Cash and cash equivalents 6.17 74,4 30,2
Cash and cash equivalents held for sale 0,0 48,0
less: Cash and cash equivalents 6.17 74,4 78,2
Net debt 6.20 -13,6 100,1
Adjustments for:
Net debt of Joint Ventures 6.11 89,2 84,7
Non-recourse net debt for project financing -95,0 -92,6
Cumulative financing preference shares B 6.20 -45,1 -45,1
Other 5,3 2,0
Covenant net debt (A) -59,2 49,1
Reported EBITDA 6.1 59,0 -75,4
EBITDA of joint ventures 6.1 -14,0 -0,2
Exceptional expenses 6.1 -14,2 28,7
Underlying EBITDA 30,8 -46,9
Adjustments for:
Capitalised interest 6.6 1,5 1,8
EBITDA for projects with non-recourse financing -5,2 -3,6
Other -1,3 -0,6
Covenant EBITDA (B) - Interest Cover 25,8 -49,3
EBITDA attributable to disposals 0,9 0,0
Covenant EBITDA (C) - Leverage Ratio 24,9 -49,3
Net interest expense 11,3 9,6
Adjustments for:
Joint venture net interest expense 1,1 2,1
Non-recourse project financing interest expense -2,8 -3,0
Interest on cumulative financing preference shares B 6.20 -3,6 -3,6
Other -2,7 -0,8
Net covenant interest expense (C) 3,3 4,3
Leverage ratio (A/C) <3 -2,4 -1,0
Interest cover ratio (B/D) >4 7,7 -11,5
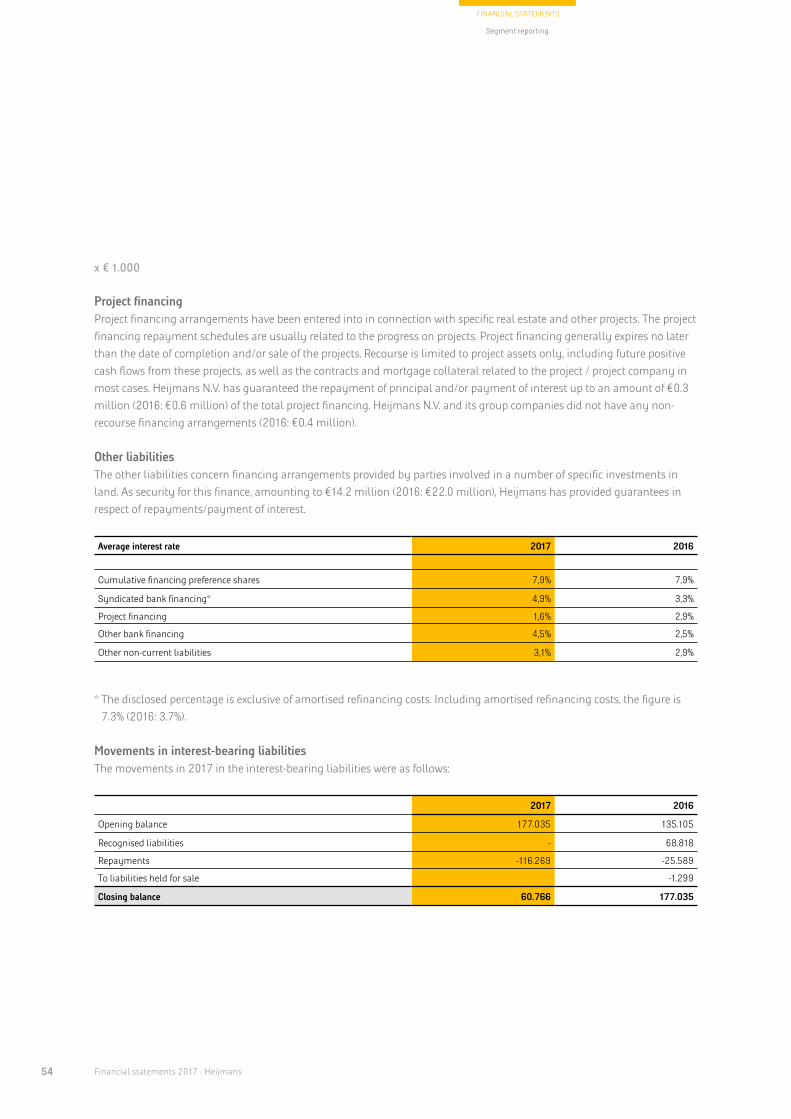
54 Financial statements 2017 - Heijmans
FINANCIAL STATEMENTS
Segment reporting
x € 1.000
Project financingProject financing arrangements have been entered into in connection with specific real estate and other projects. The project financing repayment schedules are usually related to the progress on projects. Project financing generally expires no later than the date of completion and/or sale of the projects. Recourse is limited to project assets only, including future positive cash flows from these projects, as well as the contracts and mortgage collateral related to the project / project company in most cases. Heijmans N.V. has guaranteed the repayment of principal and/or payment of interest up to an amount of €0.3 million (2016: €0.6 million) of the total project financing. Heijmans N.V. and its group companies did not have any non-recourse financing arrangements (2016: €0.4 million).
Other liabilitiesThe other liabilities concern financing arrangements provided by parties involved in a number of specific investments in land. As security for this finance, amounting to €14.2 million (2016: €22.0 million), Heijmans has provided guarantees in respect of repayments/payment of interest.
Average interest rate 2017 2016
Cumulative financing preference shares 7,9% 7,9%
Syndicated bank financing* 4,9% 3,3%
Project financing 1,6% 2,9%
Other bank financing 4,5% 2,5%
Other non-current liabilities 3,1% 2,9%
* The disclosed percentage is exclusive of amortised refinancing costs. Including amortised refinancing costs, the figure is 7.3% (2016: 3.7%).
Movements in interest-bearing liabilitiesThe movements in 2017 in the interest-bearing liabilities were as follows:
2017 2016
Opening balance 177.035 135.105
Recognised liabilities - 68.818
Repayments -116.269 -25.589
To liabilities held for sale -1.299
Closing balance 60.766 177.035

55Financial statements 2017 - Heijmans
FINANCIAL STATEMENTS
Segment reporting
x € 1.000
6.21 Employee benefits
Movement in the liability for defined benefit plans and long-service payments
Liability Fair value of assets
Net asset relating to vested pension rights and jubilee payments
2017 2016 2017 2016 2017 2016
Balance at 1 January 427.891 394.715 437.966 407.190 -10.075 -12.475
Recognised in profit or loss
Service cost 282 487 - - 282 487
Interest expense/income 7.455 9.698 7.575 10.048 -120 -350
Settlements and curtailments -87 501 - - -87 501
Administrative and other expenses - - -580 -489 580 489
Recognised in other comprehensive income
Actuarial result, experience -729 6.968 - - -729 6.968
Actuarial result, indexing 3.398 - - - 3.398 -
Actuarial result, discount rate -6.769 50.072 - - -6.769 50.072
Actuarial result, return on investments - - -3.505 39.840 3.505 -39.840
Contributions and benefits
Employer contributions - - 2.814 2.912 -2.814 -2.912
Pension and long-service payments -14.271 -14.197 -14.271 -14.197 - -
To assets/liabilities held for sale - -20.353 - -7.338 - -13.015
Total at 31 December 417.170 427.891 429.999 437.966 -12.829 -10.075
The pension and long-service payments in 2018 will amount to approximately €15 million. Over the next few years, this amount should not change significantly.

56 Financial statements 2017 - Heijmans
FINANCIAL STATEMENTS
Segment reporting
x € 1.000
The total liability arising from defined benefit pension plans and long-service payments is recognised in the statement of financial position as follows:
31 december 2017 31 december 2016
Non-current employee benefits 15.298 12.333
Current employee benefits 1.995 2.703
Employee-related receivable -30.122 -25.111
-12.829 -10.075
The employee-related receivable concerns a plan that, in accordance with the Pensions Act funding rules as specified in the Financial Assessment Framework, has a policy funding ratio of 102.6% (2016: 99.4%). (See Stichting Pensioenfonds Heijmans N.V. below.) The receivable is based on the assumption that this plan, which is now closed, will gradually wind down, and on the conclusion that the Group, as the employer, will eventually be the sole remaining stakeholder and therefore logically entitled to the final balance. However, it is expected that new IFRS rules (a proposed amendment to IFRIC 14 not yet issued, curtailing refunds from a defined benefit plan) could lead to this asset ceasing to be recognised. The pension fund trustees and the Group are currently engaged in discussions regarding reinsurance of either part or all of the plan. If it is decided to go ahead with either partial or complete reinsurance, this could mean the amount of the receivable from the pension plan becomes smaller. In either situation this would, for example, have a negative impact on the Group’s solvency ratio amounting to several percentage points. Liability for defined benefit plans in the Netherlands The liability for defined benefit plans concerns the liabilities recognised for one company pension fund and approximately 15 plans placed with insurance companies. Stichting Pensioenfonds Heijmans N.V. No new members will be admitted to the Pensioenfonds Heijmans plan. Pension rights are currently being accrued at an insurer on the portion of salary that exceeds the maximum salary threshold of the industry-wide pension fund. This plan came into effect on 1 January 2012 for new employees. As of 1 January 2013, existing employees have also been accruing pension rights under this plan. (This concerns employees who have been with the Company since before 1 January 2012 and were accruing supplementary pension rights with Pensioenfonds Heijmans.) The plan is an average pay scheme with conditional indexation and qualifies as a defined contribution plan. The pension accrual of employees who became members of the supplementary plan before the end of 2012 remains guaranteed by Stichting Pensioenfonds Heijmans N.V.. While employees stay with Heijmans, the pensions they accrued up to the end of 2012 are subject to conditional annual increase. Heijmans pays a contribution each year to cover the costs of this. Approximately 23% of the members in the new plan were members of the former plan who are still employed by Heijmans, and accordingly have a conditional right to indexation, depending on the salary increase in accordance with the collective employment agreement for the Construction Industry for a maximum of 4% a year. For the rest, 52% are former employees and 25% are pensioners. The average term of the pension liabilities is approximately 16 years. Because of the funding deficit in the former plan, Heijmans made an additional contribution of €5 million in 2012 and a further €3 million in 2013. Heijmans is under no obligation to make

57Financial statements 2017 - Heijmans
FINANCIAL STATEMENTS
Segment reporting
x € 1.000
any further contributions. The pension contributions and required buffers are calculated in accordance with the rules stated in the Pensions Act. In accordance with these rules, the contributions are cost effective, and the funding ratio set by the pension fund policy needs to be 108.5% at year-end 2017 (2016: 109%). The actual policy funding ratio as at 31 December 2017 was 102.6%. The pension fund capital is expected to reach the required level by the set date and no further measures should be necessary. The pensions regulator is De Nederlandsche Bank (DNB), the Dutch central bank. The Board of Trustees of the fund comprises representatives of the employer, employees and pensioners.
Insured plans Heijmans has some 15 insured pension plans in the form of guarantee contracts. Other than the costs of indexation, Heijmans is not liable for payments due to aggravated mortality assumptions. The risks inherent in the plan of these being necessary are largely borne by the insurers. It is a responsibility of the insurers to hold sufficient funds to pay out all benefits. Again, regulatory responsibility lies with DNB. The amount of the additional contribution required to meet annual increases is calculated on the basis of the assumptions contained in the insurance contract. The average term of the pension liabilities is approximately 15 years. Industry-wide pension fundsThe majority of the pensions have been placed with industry-wide pension funds, the main ones being the Pension Fund for the Construction Industry (Bouwnijverheid) and the Pension Fund for the Engineering, Mechanical and Electrical Contracting Sector (Metaal en Techniek). Both these funds operate average pay plans with annual increases. The funding ratio set by the policy of the Collective Pension Fund for the Construction Industry was 115.2% at year-end 2017 (year-end 2016: 105.4%). The policy funding ratio for the Engineering, Mechanical and Electrical Contracting Sector stood at 100.6% at year-end 2017 (year-end 2016: 92.8%). These funding ratios have been calculated on the basis of the actuarial assumptions used by the various industry-wide pension funds, in accordance with the Pensions Act and the Financial Assessment Framework.
Since their funding ratios have only a marginal effect on the contribution adjustments, these plans qualify as defined benefit pension plans. Despite this, they are treated as defined contribution plans because the administration of the industry pension funds is not designed to supply the required information.
With regard to these plans, Heijmans is only required to pay the predetermined contributions. The Group has no obligation to make up any deficit, other than through future contribution adjustments. Heijmans has no claim to any surplus in the funds.
Long-service payments The long-service payments are a month’s salary, or a portion thereof, for employment periods of 25 and 40 years.

58 Financial statements 2017 - Heijmans
FINANCIAL STATEMENTS
Segment reporting
x € 1.000
Income and expense items recognised in connection with defined benefit plans and long-service payments for continuing operations
2017 2016
Service cost -282 -261
Interest expense -7.368 -9.395
Expected return on assets 7.575 10.029
-75 373
Administrative and other expenses -580 -489
Settlements and curtailments 87 -438
Total expense for defined benefit plans and long-service payments -568 -554
The principal actuarial assumptions as at year-end are:
31 december 2017 31 december 2016
Discount rate 1,85% 1,75%
Expected return on plan assets 1,85% 1,75%
Future wage inflation 2,25% 2,25%
Future pay increases 0-1,5% 0-1,5%
Future annual increase 0-1,00% 0-0,75%
Staff turnover 7,0-16,0% 7,0-16,0%
Life expectancy AA Forecast Table 2016 0/0 AA Forecast Table 2016 0/0
The discount rate is based on high-quality corporate bonds adjusted for the term of the payment obligation. This also applies to the expected yield.
The annual increase for the supplementary plan that is administered by Stichting Pensioenfonds Heijmans N.V. tracks wage inflation.

59Financial statements 2017 - Heijmans
FINANCIAL STATEMENTS
Segment reporting
x € 1.000
Financing liability for defined benefit plans and long-service payments 31 december 2017 31 december 2016
Defined benefit plans:
- Funded plans 412.287 422.736
- Unfunded plans - -
Long-service payments (unfunded) 4.883 5.155
Liability for defined benefit plans and long-service payments at 31 December 417.170 427.891
Breakdown of plan assets as a percentage of the total 31 december 2017 31 december 2016
Equities 10% 8%
Fixed-income securities 40% 41%
Liquid assets 0% 0%
Other/insured plans 50% 51%
Stichting Pensioenfonds Heijmans N.V. assetsAt Stichting Pensioenfonds Heijmans N.V, approximately 85% of the interest-rate risk associated with the liabilities is hedged using a liability-matching portfolio. Of the total plan assets, valued at €215 million, €172 million is in fixed-income securities, €43 million in equities and €0 million in liquid assets and current receivables. The fixed-income securities as well as the equities are listed and these assets are measured at quoted price. No investments are made in Heijmans shares.
Reasonably possible changes in one of the relevant actuarial assumptions on the reporting date, with the other assumpti-ons remaining unchanged, could potentially affect the liabilities associated with the vested pension rights to the extent shown below.
x €1 million 2017 2016
Increase Decrease Increase Decrease
Change of 0.50 %-points in discount rate -32,3 36,6 -34,5 39,1
Change of 0.25 %-points in wage and price inflation and rate of annual increase 10,7 -4,2 11,6 -4,7
Change of 1 year in life expectancy 16,2 -16,4 16,9 -17,1
The above effects were determined by the actuary who performed the calculations. The combined effect of changes to more than one of the assumptions can be different from the sum of the corresponding individual effects owing to interactions.

60 Financial statements 2017 - Heijmans
FINANCIAL STATEMENTS
Segment reporting
The effects presented apply only to the liabilities and not to the fair value of the investments. For a plan in the form of an insurance contract, the effect of a change in the discount rate is largely mitigated by an equal but opposite effect on the plan investments. This is because of the guarantee provided by the insurer.
Heijmans expects to contribute approximately €2 million in 2018 to its defined pension plans and approximately €30 million to defined contribution plans. The expected contributions in subsequent years are likely to be in line with those expected for 2017, depending on changes in the above-mentioned actuarial assumptions.
6.22 Provisions
GeneralProvisions for warranty obligations, restructuring costs and environmental risks are recognised if Heijmans has an existing obligation and it is probable that an outflow of economic benefits will occur. The amount of each provision can be reliably estimated. The provisions are stated at face value, unless the time value of money is material.
01 January
2017Reversal of unused
amountsAdditions to
provisions Provisions used 31 December 2017
Warranty obligations 1.299 0 237 0 1.536
Restructuring costs 3.451 -519 6.172 -6.189 2.915
Environmental risks 579 0 3.000 -9 3.570
Provision for loss-making interests 10.000 0 12.009 -10.939 11.070
Other provisions 2.401 0 2.435 -441 4.395
Total provisions 17.730 -519 23.853 -17.578 23.486
Ageing of provisions 31 december 2017 31 december 2016
Non-current portion 1.949 2.364
Current portion 21.537 15.366
Total 23.486 17.730
Provision for warranty obligationsThe provisions relate to complaints and deficiencies that become apparent after the delivery of projects and that fall within the warranty period. The magnitude of the costs provided for is dependent partly on the estimated allocation of the claim to the related construction partners. It is expected that most of the obligations will materialise in the next two years.

61Financial statements 2017 - Heijmans
FINANCIAL STATEMENTS
Segment reporting
x € 1.000
Provision for restructuring costsThe provision for restructuring costs relates to the expected severance costs related to organisational changes. Most of the provision will be used in 2018 and the remainder in the years 2019 and 2020.
Provision for environmental risksThis item represents possible site reinstatement costs. The costs have been estimated by site, based on government regulations concerning the clean-up method and soil investigation. The periods within which restoration needs to take place vary by site. In the event that the restoration does not have to take place for another few years, there is an obligation to monitor the pollution. The expected monitoring costs have also been included in the provision.
Provision for loss-making interestsAs at year-end 2017, the provision for loss-making interests amounted to €11 million (2016: €10 million). The provision relates to joint ventures in which the Group’s share is negative.
Other provisionsThe other provisions include lawsuits, amounting to €2.2 million (2016: €0.3 million), quarry site reinstatement obligations of €1.3 million (2016: €1.2 million) and property vacancy amounting to €0.1 million (2016: €0.3 million). Among the remainder is a provision for potential expenses in connection with occupational disability.
6.23 Trade and other payables
Trade and other payables 31 december 2017 31 december 2016
Suppliers and subcontractors 220.160 228.331
Invoices due for work in progress 23.892 18.418
Invoices due for work completed 28.822 31.398
Pension obligations 3.400 2.400
Staff costs payable 14.795 13.413
VAT payable 36.149 36.005
Wage tax and social security contributions payable 13.763 13.429
Administrative expenses and costs of sales payable 2.520 3.194
Interest payable 5.252 4.826
Other liabilities 28.647 19.652
Total trade and other payables 377.400 371.066
The trade and other payables are predominantly of a short-term nature.

62 Financial statements 2017 - Heijmans
FINANCIAL STATEMENTS
Segment reporting
x € 1.000
6.24 Financial risks and risk management
GeneralIIn the normal course of business, Heijmans is exposed to various financial risks, including credit, liquidity, market, price and interest-rate risks.
This section describes the degree to which these risks manifest themselves, the objectives set regarding the risks and the policy and procedures for measuring and managing them, as well as the management of capital.
The risk policy is focused on the identification and analysis of the risks to which the Group is exposed and the setting of acceptable limits.
The risk policy and systems are assessed on a regular basis and then modified if necessary for changes in market conditi-ons and the operations of the Group. The objective is to create a disciplined and constructive approach to risk management, with the aid of training, standards and procedures whereby all employees are aware of their roles and responsibilities.
The Audit Committee periodically reviews the risk management policy and procedures. In addition, the Committee reviews the risk policy used in the light of the risks to which the Group is exposed.
Credit riskCredit risk is the risk that the Group will be exposed to financial loss if a party against which Heijmans has a claim fails to meet its contractual obligations. Credit risks arise primarily from receivables due from customers and consortium partners.
The credit risk associated with residential property development is limited, as future residents can only take possession of the new home once they have met all their obligations and there is pre-financing during the construction stage. The creditworthiness is assessed in transactions involving the development of commercial property, construction contracts and infrastructure projects, with additional collateral possibly being requested. Additional forms of security are particularly important in the case of turnkey projects (paid for on completion), although normally there is pre-financing of transactions of this kind as well. Where Infrastructure and Non-Residential Building are concerned in particular, Heijmans carries out many assignments for public authorities, for which the credit risk is considered extremely limited. In these areas of the business, Heijmans will be part of consortiums working on various large-scale, integrated projects. The more specific the expertise of a consortium partner, the greater the importance that is attached to the creditworthiness of that partner. In such cases, a poor credit rating is grounds for not going into partnership, since financial guarantees are not worth anything if essential know-how is lost.
The assessment of creditworthiness is part of the standard procedure. Credit risk is mitigated by pre-financing arrange-ments and payments in instalments. Risks are insured with a credit insurer if considered necessary.
The large number of clients, a substantial proportion of which are private individuals and public authorities, means there is no concentration of credit risk.

63Financial statements 2017 - Heijmans
FINANCIAL STATEMENTS
Segment reporting
x € 1.000
The cash and cash equivalents are held at different banks that are assessed as regards creditworthiness. The credit risk is further mitigated by concentrating the cash as far as possible in cash pools, the cumulative balance of which is predomi-nantly negative over the year.
A provision for doubtful receivables is recognised following an assessment of the potential risks for each individual receivable. Doubtful receivables are subjected to an impairment test and written down as necessary to the present value of the future cash flows if lower.
The carrying amount of the financial assets exposed to credit risk can be analysed as follows:
31 december 2017 31 december 2016
Other investments 29.631 33.615
Cash and cash equivalents 74.437 30.249
Trade and other receivables 165.662 176.071
Total 269.730 239.935
Other investments are mainly loans granted by the Group to joint arrangements in which it participates.
Age analysis of outstanding trade receivables without impairment, from due date:
31 december 2017 31 december 2016
< 30 days 12.760 16.993
30-60 days 1.314 4.238
60-90 days 1.094 555
> 90 days - 1 year 1.202 9.245
> 1 years 6.097 5.878
Total 22.467 36.909
Including accounts not yet due and accounts for which an impairment has been recognised, the balance of trade receivables at year-end 2017 was €120 million (2016: €116 million).
The due dates of the other financial assets have not been exceeded.
Trade receivables are reported after deduction of impairment losses relating to doubtful receivables. The movement in the provision was as follows:

64 Financial statements 2017 - Heijmans
FINANCIAL STATEMENTS
Segment reporting
x € 1.000
2017 2016
Balance at 1 January 4.759 9.227
Additions 0 118
Withdrawals -525 -2.862
Release -101 -152
To assets held for sale - -1.572
Balance at 31 December 4.133 4.759
Liquidity riskLiquidity risk is the risk that the Group cannot meet its financial obligations at the time it is required to do so. See also note 6.20, Interest-bearing loans. The liquidity-risk management assumption is that sufficient liquidity levels will be maintained to meet current and future financial obligations, in both normal and exceptional circumstances, without incurring unac-ceptable risks and without endangering the reputation of the Group. Weekly 3-month rolling and monthly 12-month rolling liquidity forecasts are among the tools used to determine whether the Group has sufficient liquidity available. In addition, the availability of credit, including in the form of contingency funding available from credit insurers or providers of guarantees, is continuously monitored by regularly making projecti-ons of the score in relation to financial covenants and engaging in an active dialogue with all financial stakeholders. Based on this forecast, the Group considers that sufficient liquidity is available to conduct operations. To secure the availability of financial resources for both the long term and the short term, Heijmans has access to the following facilities:• €45 million in cumulative financing preference shares without a repayment obligation;• (year-end 2017) €156 million committed syndicated bank financing, €25 million of which is in the form of a committed
overdraft facility linked to a cash pool. This is being reduced in stages to €122 million by 30 June 2019 (see note 6.20). The remaining reduction should essentially be achieved by using the spare cash provided by current cash flow trends;• project financing for which committed financing is available for most of the anticipated principal sum and duration of
the project in question; and• various operating leases.
In order to satisfy clients’ requirements for bank guarantees, Heijmans has access to guarantee facilities with various institutions. These facilities are uncommitted. Every two weeks, a projection is made of the use of the available bank guarantee facilities, based on current tenders and expectations regarding the discharge of existing bank guarantees. Based on these projections, Heijmans believes that the present extent of the facilities is adequate. At year-end 2017, the bank guarantee facilities totalled € 286 million (2016: € 505 million) provided by a total of 10 parties. The lower figure was in line with expectations, as a large part of the bank guarantee facilities was held in Belgium and especially in Germany. As at year-end 2017, there remained €1 million in guarantees relating to the international activities, with the rest exclusively concerning guarantees for projects associated with operations in the Netherlands.

65Financial statements 2017 - Heijmans
FINANCIAL STATEMENTS
Segment reporting
x € 1.000
The contractual maturity dates of the financial obligations, including interest payments for continuing operations, are as follows:
31 december 2017Carrying amount
Contractual cash flow < 6 months 6-12 months 1-2 years 2-5 years > 5 years
Cumulative financing preference shares -45.100 -62.915 -3.563 - -3.563 -10.689 -45.100
Syndicated bank financing - - - - - - -
Project financing -334 -334 -138 -133 -63 - -
Other non-current liabilities -14.204 -15.784 -229 -42 -9.690 -2.315 -3.508
Current account overdrafts with credit institutions -1.128 -1.128 -1.128 - - - -
Trade and other payables -377.400 -377.400 -377.400 - - - -
Total -438.166 -457.561 -382.458 -175 -13.316 -13.004 -48.608
31 december 2016Carrying amount
Contractual cash flow < 6 months 6-12 months 1-2 years 2-5 years > 5 years
Cumulative financing preference shares -45.100 -62.915 -3.563 - -3.563 -10.689 -45.100
Syndicated bank financing -105.000 -105.071 -105.071 - - - -
Project financing -1.038 -1.071 -147 -143 -718 -63 -
Other non-current liabilities -22.006 -24.672 -691 -4.894 -444 -14.978 -3.665
Current account overdrafts with credit institutions -3.891 -3.891 -3.891 - - - -
Trade and other payables -371.066 -371.066 -371.066 - - - -
Total -548.101 -568.686 -484.429 -5.037 -4.725 -25.730 -48.765
For the cumulative financing preference shares B, the nominal value has been taken into account on the maturity date and on the interest rate repricing date. The cumulative financing preference shares do not have a repayment obligation. In the liquidity analysis, the nominal value of the loan has been included in the period > 5 years.
Market riskMarket risk is the risk that the income of the Group or the value of financial instruments is adversely affected by changes in market prices, for example, due to movements in exchange rates, interest rates and share prices. The objective of managing market risk is to keep the market risk position within acceptable limits while achieving optimum returns.To manage market risk, derivatives may be bought and sold, and financial commitments may be undertaken. Transactions of this nature are carried out within established guidelines. .

66 Financial statements 2017 - Heijmans
FINANCIAL STATEMENTS
Segment reporting
x € 1.000
Price riskPrice risk associated with the purchase of raw materials and consumables as well as with outsourced work, is mitigated by making price indexation agreements with clients, or where possible by making price agreements with suppliers at an early stage. If necessary, derivatives may be used occasionally to hedge the price risk of procuring raw materials.
Interest-rate riskThe interest rate policy at Heijmans is directed towards limiting the impact of changes in interest rates on the Group’s results. For the majority of the project financing arrangements, fixed interest rates are preferred, giving greater certainty with respect to results on the various projects. Where the syndicated loan is used, financing is at a variable rate. Since this involves financing of working capital, which is generally not required at the end of the year, there is currently nothing to be gained from having interest rates fixed for an extended period. The present negative Euribor rate is another factor here. This policy is subject to constant evaluation.
If the interest rate for 2017 had been 2 percentage points higher on average, the result before tax based on the average level of debt would have been approximately €1.1 million lower (2016: €2.9 million lower). The effect of a 2 percentage point difference in interest rates on the Group’s equity (assuming all other variables remained constant) would have been a decrease of €0.9 million (2016: decrease of €2.2 million).
The table below shows the periods in which interest rates for interest-bearing financial assets and financial liabilities are reviewed:
31 december 2017
Note Total0–6
months6–12
months1–2 year 2–5 year > 5 year
Other investments 6.12 29.631 3.664 60 14.233 10.430 1.244
Cash and cash equivalents 6.17 74.437 74.437 - - - -
Cumulative financing preference shares 6.20 -45.100 0 - -45.100 - -
Syndicated bank financing 6.20 - - - - - -
Project financing 6.20 -334 -334 - - - -
Other non-current liabilities 6.20 -14.204 -30 -9.450 - -1.844 -2.880
Current account overdrafts with credit institutions 6.20 -1.128 -1.128 - - - -
Total 43.302 76.609 -9.390 -30.867 8.586 -1.636

67Financial statements 2017 - Heijmans
FINANCIAL STATEMENTS
Segment reporting
x € 1.000
31 december 2016
Note Total0–6
months6–12
months1–2 year 2–5 year > 5 year
Other investments 6.12 33.615 19.025 - 12.486 860 1.244
Cash and cash equivalents 6.17 30.249 30.249 - - - -
Cumulative financing preference shares 6.20 -45.100 0 - - -45.100 -
Syndicated bank financing 6.20 -105.000 -105.000 - - - -
Project financing 6.20 -1.038 -1.038 - - - -
Other non-current liabilities 6.20 -22.006 -437 -18.689 - - -2.880
Current account overdrafts with credit institutions 6.20 -3.891 -3.891 - - - -
Total -113.171 -61.092 -18.689 12.486 -44.240 -1.636
As at the closing date, 82% (2016: 30%) of the interest-bearing debt had been negotiated at a fixed rate of interest, and 18% (2016: 70%) at a floating rate. Due to seasonal effects, the average debt during the year is higher than the debt at the closing date. The portion of the gross debt subject to a floating interest rate is also higher during the year. The gross floating rate interest debt is offset by items such as cash and cash equivalents, which are also subject to floating rate interest.
The average weighted term to maturity of the project financing is 0.2 years (2016: 0.2 years). The interest-bearing loans are measured at amortised cost rather than at fair value. The carrying amount of the loans is therefore not affected by changes in interest rates.
Currency risk The currency risk on sales, purchases and loans is extremely limited for Heijmans, since by far the greater part of the cash flows within the Group are in euros.
Fair values The table below shows the fair values and the carrying amounts of the financial instruments. The fair values are allocated to different levels of the fair-value hierarchy, depending on the inputs used to determine the measurement methods. The levels are defined as follows:level 1: quoted (unadjusted) market prices available to the Group on the measurement date, in active markets for identical
assets or liabilities.level 2: input that is not a quoted market price at level 1 but is obtainable for the asset or liability concerned, either directly
(as a price) or indirectly (derived from a price). level 3: input for the asset or liability not based on data available in a market (unobservable input).
Heijmans has no financial assets or liabilities measured at fair value.

68 Financial statements 2017 - Heijmans
FINANCIAL STATEMENTS
Segment reporting
x € 1.000
31 december 2017 31 december 2016
Carryingvalue
Fairvalue
Carryingvalue
Fairvalue
Note Level Loans and receivables
6.12 2 Other investments 29.631 29.593 33.615 34.154
6.16 * Trade and other receivables 165.662 165.662 176.071 176.071
6.17 * Cash and cash equivalents 74.437 74.437 30.249 30.249
6.20 * Current account overdrafts with credit institutions -1.128 -1.128 -3.891 -3.891
6.20 2 Cumulative financing preference shares -45.100 -49.987 -45.100 -51.169
6.20 2 Syndicated bank financing - - -105.000 -105.000
6.20 2 Project financing -334 -334 -1.038 -1.038
6.20 2 Other non-current liabilities -14.204 -14.520 -22.006 -22.515
6.23 * Trade and other payables -377.400 -377.400 -371.066 -371.066
-168.436 -173.677 -308.166 -314.205
* The carrying amount is a reasonable approximation of the fair value.
The above values are based on the present value of future cash flows. The loans with a fixed interest rate are discounted using the yield curve for 31 December 2017, plus the relevant risk mark-up.
All loans with a variable interest rate are assumed to have a fair value equal to their carrying amount.
Capital managementThe policy has been designed to achieve a sound capital position with sufficient availability of credit to be able to ensure continuity for stakeholders. A sound long-term capital structure is based on operating with sufficient headroom within the limits of the covenants, in particular the leverage ratio. This means net interest-bearing debt after deduction of cumulative preference finance shares plus non-recourse finance divided by EBITDA not exceeding 3.0 and an interest cover ratio of at least 4.0 (see also note 6.20 for a description of the financial ratios in the conditions agreed with the banks).
To improve the capital structure in the short term, a debt-reduction plan based on the disposal of foreign companies is being carried out. The sale of Franki (completed in January 2017) and the sale of Heijmans Belgium (sales contract signed in February 2017) are steps already taken in relation to this plan. A variation of on the financial covenants was applicable in 2017 (see note 6.20 for more information).

69Financial statements 2017 - Heijmans
FINANCIAL STATEMENTS
Segment reporting
x € 1.000
6.25 Rental and operating lease contracts
31 december 2017 31 december 2016
Rental contracts
Instalments due within 1 year 10.096 11.774
Instalments due between 1 and 5 years 26.286 26.254
Instalments due after 5 years 24.958 6.148
Total 61.340 44.176
Lease contracts
Instalments due within 1 year 19.980 20.392
Instalments due between 1 and 5 years 33.382 32.353
Instalments due after 5 years 790 1.015
Total 54.152 53.760
A charge of €22 million for operating leases was recognised in the statement of profit or loss for 2017 (2016: €24 million). A charge of €12 million for rental costs was recognised in the statement of profit or loss for 2017 (2016: €14 million).
The lease commitments primarily relate to future instalments on leases for vehicles and equipment. The rental commitments are for the lease of company buildings. The joint ventures in which Heijmans participates have undertaken neither rental commitments nor lease commitments.
Approximately 3,300 assets (2,340 cars, 840 vans, and 80 trucks) are leased in the Netherlands on operating lease terms. In 2017, an umbrella agreement covering the cars and vans was signed with the main leasing company for a term of 4.5 years. The individual contracts covered by the agreement have periods varying from 12 months to 72 months. These contracts can only be cancelled on payment of the difference between the market value and the carrying amount (if the market value is lower) and for that portion of the lease payments representing the management fee or administrative expenses and interest. For trucks, the maximum lease period is usually 120 months.
The above amounts relate to continuing operations.
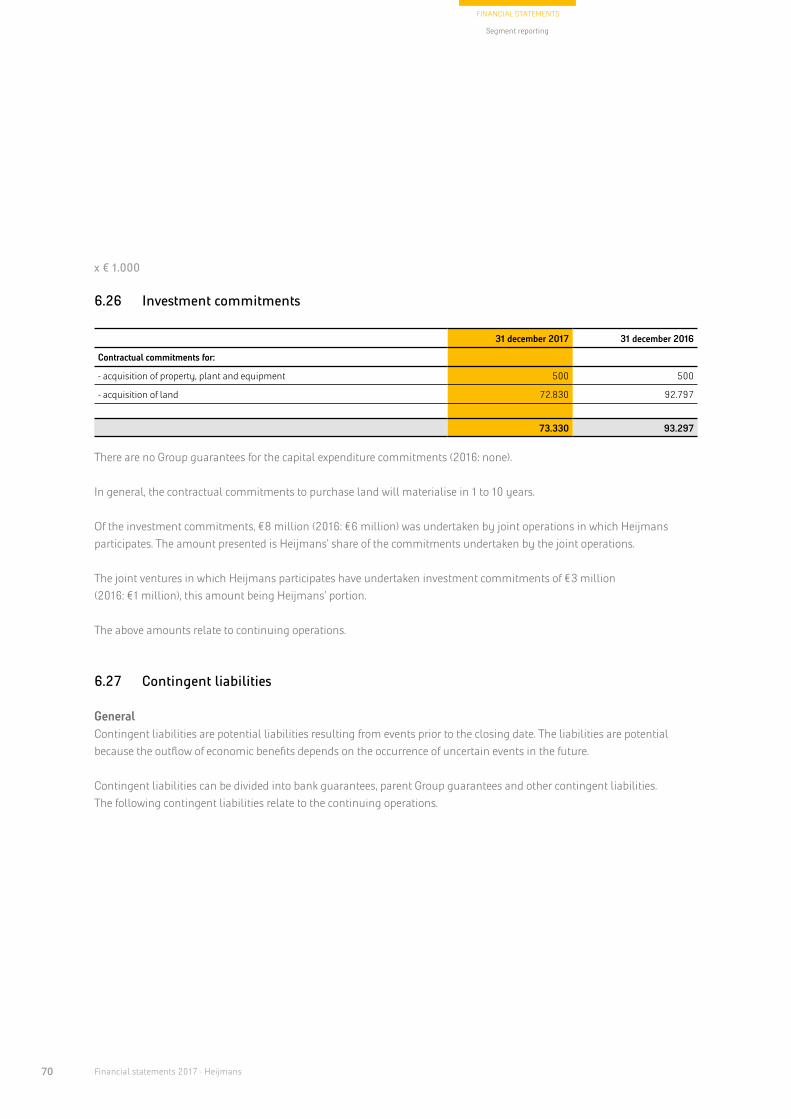
70 Financial statements 2017 - Heijmans
FINANCIAL STATEMENTS
Segment reporting
x € 1.000
6.26 Investment commitments
31 december 2017 31 december 2016
Contractual commitments for:
- acquisition of property, plant and equipment 500 500
- acquisition of land 72.830 92.797
73.330 93.297
There are no Group guarantees for the capital expenditure commitments (2016: none).
In general, the contractual commitments to purchase land will materialise in 1 to 10 years.
Of the investment commitments, €8 million (2016: €6 million) was undertaken by joint operations in which Heijmans participates. The amount presented is Heijmans’ share of the commitments undertaken by the joint operations.
The joint ventures in which Heijmans participates have undertaken investment commitments of €3 million (2016: €1 million), this amount being Heijmans’ portion.
The above amounts relate to continuing operations.
6.27 Contingent liabilities
GeneralContingent liabilities are potential liabilities resulting from events prior to the closing date. The liabilities are potential because the outflow of economic benefits depends on the occurrence of uncertain events in the future.
Contingent liabilities can be divided into bank guarantees, parent Group guarantees and other contingent liabilities. The following contingent liabilities relate to the continuing operations.

71Financial statements 2017 - Heijmans
FINANCIAL STATEMENTS
Segment reporting
x € 1.000
Bank and Group guarantees 31 december 2017 31 december 2016
Bank guarantees relating to:
Execution of projects 179.632 185.803
Tenders 5.250 2.174
Other 13.179 23.366
198.061 211.343
Group guarantees relating to:
Execution of projects 378.331 298.478
Contingent liabilities 0 427
Credit and bank guarantee facilities 29.287 27.788
407.618 326.693
Total 605.679 538.036
The Group guarantees associated with financing facilities have been provided in connection with project financing, bank guarantees and credit facilities applying to foreign subsidiaries, joint operations and joint ventures. Heijmans has guaran-teed its share of the debt of various joint operations and property joint ventures, which amounts to €29 million (2016: €28 million).
The Group guarantees issued for divested operations (Leadbitter) are not included in the above table. They amount to €68 million (2016: €78 million). With regard to work completed and work in progress, the guarantees will be taken over by the buyer if possible. Where this is not possible, the buyer has provided a bank or corporate guarantee.
Other contingent liabilitiesThe other contingent liabilities of continuing operations with a significant cash impact as at year-end 2017 amount to €17 million (2016: €26 million) and those with a limited cash impact €97 million (2016: €120 million), making a total of €114 million (2016: €146 million). Of the total amount, €18 million 2016: €19 million) is recognised under joint operations. This relates mainly to commitments to acquire land when the building permit is obtained and/ or a certain sales percentage is achieved. No Group guarantees were issued in respect of this in 2017 (2016: none). At year-end 2017, the joint ventures in which Heijmans participates had contingent liabilities with significant cash impact amounting to €3 million (2016: €3 million), and with a limited cash impact amounting to €4 million (2016: €4 million), making a total of €7 million (2016: €7 million). This relates mainly to commitments to acquire land when the building permit is obtained and/ or a certain sales percentage is achieved. The aforementioned amounts relate to Heijmans’ share in the joint ventures.

72 Financial statements 2017 - Heijmans
FINANCIAL STATEMENTS
Segment reporting
6.28 Related parties
Related parties for Heijmans can be divided into subsidiaries, associates, joint arrangements (joint ventures and joint operations), a company pension fund, the members of the Supervisory Board and the members of the Executive Board. Transactions with related parties are conducted at arm’s length, on terms comparable to those for transactions with third parties.
Transactions with subsidiaries, associates, joint ventures and joint operationsHeijmans undertakes a number of operating activities together with related parties, including in the form of joint ventures. Significant transactions in this context are the contribution of land holdings to joint arrangements and/or their financing. In addition, large and complex projects are carried out in partnership with other companies.
There are no transactions with the organisation’s management, with the exception of the remuneration discussed below. For information on the relationships with joint ventures and associates, see note 6.11.
The Group’s share in the revenue and total assets of joint operations relating to continuing operations is analysed by segment below:
2017Business segments in € millions
Property Development
Residential Building
Non-Residential
Building & Technology
Infra-structure Eliminations Total
Revenue 32,2 16,0 28,2 44,2 118,8 -8,4 186,8
Costs -26,0 -14,0 -26,7 -40,7 -110,0 8,4 -168,3
Non-current assets 4,0 0,0 0,0 0,0 0,7 0,0 4,7
Current assets 55,8 7,0 8,7 15,7 55,6 0,0 127,1
Total assets 59,8 7,0 8,7 15,7 56,3 0,0 131,8
Non-current liabilities 0,0 0,0 0,0 0,0 0,0 0,0 0,0
Current liabilities 9,8 5,3 11,7 17,0 48,9 0,0 75,7
Total liabilities 9,8 5,3 11,7 17,0 48,9 0,0 75,7
Equity 50,0 1,7 -3,0 -1,3 7,4 0,0 56,1

73Financial statements 2017 - Heijmans
FINANCIAL STATEMENTS
Segment reporting
2016Business segments in € millions
Property Development
Residential Building
Non-Residential
Building & Technology
Infra-structure Eliminations Total
Revenue 28,0 15,6 19,3 34,9 33,5 -17,4 79,0
Costs -27,2 -13,7 -18,4 -32,1 -32,0 17,4 -73,9
Non-current assets 4,0 0,2 0,0 0,2 0,8 0,0 5,0
Current assets 55,6 4,0 4,2 8,2 22,2 0,0 86,0
Total assets 59,6 4,2 4,2 8,4 23,0 0,0 91,0
Non-current liabilities 0,2 0,1 0,0 0,1 0,0 0,0 0,3
Current liabilities 11,1 3,1 5,2 8,3 21,8 0,0 41,2
Total liabilities 11,3 3,2 5,2 8,4 21,8 0,0 41,5
Equity 48,3 1,0 -1,0 0,0 1,2 0,0 49,5
Company pension fund Heijmans is affiliated with Stichting Pensioenfonds Heijmans N.V.. The principal function of this company pension fund is to operate pension plans for Heijmans’ current and former employees and retired staff.
In 2017, some €2.1 million (2016: €1.5 million) in pension contributions was paid by Heijmans to the above-mentioned company pension fund. Heijmans also made additional contributions of €5 million in 2012 and €3 million in 2013 because of a prior funding deficit. No additional contributions were made after these. Heijmans is under no obligation to make any further contributions.
Remuneration of Supervisory DirectorsNone of the Supervisory Directors hold depositary receipts for shares in Heijmans N.V, nor have they been allocated any options or depositary receipts for shares. All Supervisory Directors receive a fixed annual fee that is not dependent on the results in any single year. They also receive a fixed or variable expense allowance. None of the Supervisory Directors has any other business links to Heijmans from which they could derive personal gain.
The total payments granted to Supervisory Directors in 2017 and 2016 were as follows:
in € 2017 2016
Sj.S. Vollebregt – voorzitter* 47.723 43.973
A.A. Olijslager** - 13.390
Drs. P.G. Boumeester*** 37.723 37.723
Ing. R. van Gelder BA**** 42.723 42.723
Drs. S. van Keulen***** 42.723 42.723
R. Icke RA****** 37.723 37.723
Totaal 208.615 218.255
*Supervisory Director since 15 April 2015 and Chairman since 13 April 2016**Supervisory Director from 18 April 2007 to 13 April 2016*** Supervisory Director since 28 April 2010
**** Supervisory Director since 1 July 2010***** Supervisory Director since 18 April 2007****** Supervisory Director since 9 April 2008

74 Financial statements 2017 - Heijmans
FINANCIAL STATEMENTS
Segment reporting
Remuneration of members of the Executive Board The composition of the remuneration paid to each member of the Executive Board is as follows:
in €
Gross fixed remunera-
tion
Short-term variable
remunera-tion
Long-term variable
remunera-tion
Severance payment
Pension contributions
Expense allowances including reimbursement
of car expenses, long-service bonus and
costs of the Share Matching Plan
Total
A.G.J. Hillen *2017 500.000 345.868 -102.050 - 200.273 43.463 987.554
2016 414.470 - -95.780 - 116.917 45.048 480.655
J.G. Janssen**2017 74.053 - - - 14.667 9.059 97.779
2016 - - - - - - -
R.F. Majenburg ***2017 331.409 248.557 -64.484 404.563 72.822 34.304 1.027.171
2016 386.903 - 64.484 - 85.135 40.445 576.967
L.J.T. van der Els ****2017 115.954 - - - 28.671 14.892 159.517
2016 496.906 -98.753 -246.882 - 102.160 47.123 300.554
M.C. van den Biggelaar *****2017 68.209 - - - 11.870 9.372 89.451
2016 406.907 -79.132 -197.831 - 73.059 53.512 256.515
Total 2017 1.089.625 594.425 -166.534 404.563 328.303 111.090 2.361.472
2016 1.705.186 -177.885 -476.009 0 377.271 186.128 1.614.691
* Chairman of the Executive Board since 1 December 2016 and member of the Executive Board since 18 April 2012 ** Member of the Executive Board since 30 October 2017*** Member of the Executive Board from 13 April 2016 to 26 October 2017**** Member of the Executive Board from 28 April 2010 to 13 April 2017 and Chairperson of the Executive Board from 18 April 2012 to 1 December 2016 ***** Member of the Executive Board from 1 September 2009 to 1 March 2017
The members of the Executive Board have been awarded short-term variable remuneration for 2017 equal to 85% of Mr Hillen’s basic salary and 75% of Mr Majenburg’s basic salary in view of the achievement of targets set for 2017. For more information, refer to the section on remuneration in the directors’ report.
The members of the Executive Board have been awarded conditional short-term variable remuneration for 2015 equal to 20% of their respective basic salaries. A reserve of €79,132 has been formed for Mr Hillen, charged to the result for 2015. This award has not yet become vested and therefore not released to income in 2017.
A reserve of €0 million has been formed for the variable remuneration to the current members of the Executive Board for the periods 2016-2018 and 2017-2019 (2016: €0.2 million for the periods 2015-2017 and 2016-2018). Specifically, €0 has been reserved for Mr A.G.J. Hillen (2016: €102,050) and nil for Mr Janssen (2016: nil).

75Financial statements 2017 - Heijmans
FINANCIAL STATEMENTS
Segment reporting
In order to bind directors to the Company for the long term and to encourage a focus on long-term value creation, with effect from 2010 a Bonus Investment Share Matching Plan has been applicable under which directors can opt to use part of their variable short-term remuneration to purchase Heijmans shares.
In April 2014, Mr van der Els used 50% of the net short-term bonus awarded to him for 2013 to purchase shares in Heijmans. Similarly, Mr van den Biggelaar and Mr Hillen each used 20% of their net short-term bonuses for the same purpose. For each share purchased - in total 2,289 shares - one share is conditionally allocated under the Share Matching Plan. The allocation becomes vested after three years, following which a mandatory lock-up period of two years comes into effect. The total expense relating to the allocation of shares is determined at the time of allocation and is recognised on a time-proportionate basis in the statement of profit or loss over the period until the allocated shares become vested. The 2017 statement of profit or loss includes an amount of €3,210 (2016: €9,629) as a charge relating to the shares awarded in April 2011. In April 2017, 2,289 shares became vested. The Group issued 2,289 shares in April 2017, granting them to the existing and former members of the Executive Board concerned. These shares must be held for a minimum of two years.
The pension plan for Mr Hillen is arranged through the industry-wide pension fund and the directly insured average pay plan. He also receives compensation in respect of termination of the early retirement plan. This compensation is currently €34,021 (2016: €33,600) and is increased in line with pay increases under the collective labour agreement. In addition, Mr Hillen received compensation of €97,188 in 2017 (2016: €65,638) for the loss of pension accrual on his salary above €100,000 and compensation of €50,232 (2016: nil) for the loss of annual increases on the Delta Lloyd average-pay plan. Mr Majenburg receives a fixed amount in the form of pension contributions. In 2017, this was €72,822 (2016: €85,135) for his tenure as member of the Executive Board. Mr Janssen receives a fixed amount in the form of pension contributions. In 2017, this was € 14,667.
The pension charge is calculated in accordance with accounting policy 23.
As at year-end 2017, the members of the Executive Board owned a total of 11,971 depositary receipts for Heijmans shares. The ownership of these shares is partly a consequence of the Share Matching Plan as described above and partly the result of the purchase of shares by members of the Executive Board. The ownership of depositary receipts for Heijmans shares by the individual members of the Executive Board at year-end 2017 is as shown below:
Shares owned on 31 December 2017
A.G.J. Hillen - Chairman 11.971
J.G. Janssen 0
Total 11.971

76 Financial statements 2017 - Heijmans
FINANCIAL STATEMENTS
Segment reporting
Remuneration of former members of the Executive BoardAn amount of €180,000 has been recognised in the statement of profit or loss for 2017 (2016: €180.000) in respect of the fees that Mr Witzel, a former member of the Executive Board, receives under his management agreement that came into effect on 1 November 2014. Mr Witzel’s activities comprise consulting and managing large projects. In the statement of profit or loss for 2017, an amount of €177,785 has been recognised in respect of the remuneration received by Mr Van den Biggelaar, who was a member of the Executive Board until 28 February 2017. At the request of the Executive Board, Mr Van den Biggelaar performed consultancy activities until 1 July 2017. Also recognised in the statement of profit or loss for 2017 is an amount of €151,320 in respect of the remuneration received by Mr Majenburg, who was a member of the Executive Board until 26 October 2017. Mr Majenburg is performing consultancy activities at the request of the Executive Board.

77Financial statements 2017 - Heijmans
FINANCIAL STATEMENTS
Segment reporting
6.29 Management estimates and judgements
The accounting information in the financial statements is partly based on estimates and assumptions. The Group makes these estimates and makes assumptions about future developments, based on factors such as experience and expectations about future events that may reasonably be expected to occur given the current state of affairs. These estimates and assumptions are continually reassessed.
Revisions of estimates and assumptions, or differences between estimates and assumptions and actual outcomes, may lead to material adjustments to the carrying amounts of assets and liabilities.
Supplementary to the estimates already described in the accounting policies (section 5) and the explanatory notes (6.1 to 6.28), the key elements of estimation uncertainty are explained below.
Measurement of projects For more information on the key assumptions used in the measurement of projects, refer to note 6.15, Work in progress. A higher estimation uncertainty applies for the Wilhelminasluis Zaandam project. With this project, there is a difference of opinion with the principal mainly concerning the design of the lock chamber. The Construction Industry Arbitration Board gave its interim decision on this matter in October 2017. The interim decision provides a sufficient basis for completing the project together. Talks are ongoing with the principal concerning the amount of compensation payable in the light of the interim decision, a final settlement being the subject of arbitration, and it is expected that this will be decided in 2018. Given the fact that the compensation has not yet been legally finalised, any estimate of the amount concerned is still subject to uncertainty. The Group therefore continues to work on the basis of a bandwidth of approximately €10 million up or down, as disclosed in the previous year’s report.
Financing Note 6.20 discloses the conditions attached to the financing in greater detail. An important condition is the reduction of the facility (in stages) to €122 million in 2019. Of major importance to the reduction in debt is the effective management of project risks. This applies equally to the fulfilment of the 2018 business plan and the long-term forecast, especially as regards achieving the EBITDA and cash flows and satisfying the covenants.
Pensions The key actuarial assumptions for the calculation of the pension obligations are outlined in note 6.21. Deferred tax assets For more information on the key assumptions used in the measurement of deferred tax assets, refer to note 6.13 Deferred tax assets and liabilities.

78 Financial statements 2017 - Heijmans
FINANCIAL STATEMENTS
Segment reporting
Strategic land holdingsFor more information on the key assumptions used in the measurement of the strategic land portfolio, refer to note 6.14 Inventories.
Intangible assetsFor the main principles used in the annual determination of the recoverable amount of intangible assets, refer to note 6.10 Intangible assets.

79Financial statements 2017 - Heijmans
FINANCIAL STATEMENTS
Subsidiaries and joint operations
The following entities were included in the consolidation in 2017. Wholly owned entities are subsidiaries. The remaining entities are joint operations. For practical reasons, entities of only minor significance are not included in this list. A complete list of the subsidiaries included in the consolidation is deposited with the Trade Register at the Chamber of Commerce in Eindhoven. For significant joint ventures and associates in which the Group participates, see note 6.11. For the discontinued operations, see note 6.2.
31 december 2017 31 december 2016
Heijmans Nederland B.V., Rosmalen 100% 100%
Heijmans Vastqoed B.V., Rosmalen 100% 100%Heijmans Vastgoed Deelnemingen B.V., Rosmalen 100% 100%
V.O.F. Gasthuiskwartier, Rosmalen 50% 50%V.O.F. Mondriaanlaan, Utrecht 35% 35%
Heijmans Woningbouw B.V., Rosmalen 100% 100%
Heijmans Huizen B.V, Huizen 100% 100%Bouwcombinatie Westergouwe V.O.F., Rosmalen 50% -
Heijmans Utiliteit B.V., Rosmalen 100% 100%Heijmans Utiliteit Metaal B.V., Rosmalen 100% 100%Hart van Zuid V.O.F., Nieuwegein 50% 50%
Heijmans Infrastructuur B.V., Rosmalen 100% 100%
Heijmans Infra B.V., Rosmalen 100% 100%Heijmans Wegen B.V., Rosmalen 100% 100%Heijmans Civiel B.V., Rosmalen 100% 100%Sanders & Geraedts B.V., Koningsbosch 100% 100%Brinck Amersfoort B.V., Zeewolde 100% 100%Brinck Meter Control Services B.V., Zeewolde 100% 100%Brinck Technology B.V., Zeewolde 100% 100%A4All V.O.F, Rotterdam 45% 45%Waterdunen V.O.F., Amsterdam 40% 40%3Angle EPCM V.O.F., Hoofddorp 50% 50%Sas van Vreeswijk V.O.F., Barendrecht 33% 33%ZuidPlus V.O.F., Amstelveen 15% -De Stichtse Kraan V.O.F., Rosmalen 67% 67%
Heijmans Facilitair Bedrijf B.V., Rosmalen 100% 100%
Heijmans Materieel Beheer B.V., Rosmalen 100% 100%
Heijmans International B.V., Rosmalen 100% 100%
7. Subsidiaries and joint operations

80 Financial statements 2017 - Heijmans
FINANCIAL STATEMENTS
8.1 General
The company financial statements are part of the 2017 financial statements of Heijmans N.V.
Please refer to the notes to the consolidated statement of profit or loss and statement of financial position for items in the company statement of profit or loss and statement of financial position for which no additional explanations are provided.
8.2 Accounting policies for measuring assets and liabilities and the determination of results
For determining the accounting policies to use for measuring the assets and liabilities and the determination of results of its separate financial statements, Heijmans N.V. makes use of the option provided in Section 362, subsection 8 of Book 2 of the Dutch Civil Code. This means that the basis for measuring assets and liabilities and the determination of results (accounting policies) applied in the separate financial statements of Heijmans N.V. are the same as those applied in the consolidated EU-IFRS financial statements. Investees over which significant control is exercised are recognised using the equity method.Heijmans N.V. is registered with the Chamber of Commerce under number 16004309.
The share in the result of participating interests consists of the share of Heijmans N.V in the result of these participating interests. Results from transactions where there is a transfer of assets and liabilities between Heijmans N.V. and its investees or between investees themselves are not recognised insofar as they can be deemed to be unrealised.
For details of the remuneration of the members of the Supervisory Board and the Executive Board, see note 6.28 to the consolidated financial statements.
8. Company financial statements
x € 1.000

81Financial statements 2017 - Heijmans
FINANCIAL STATEMENTS
Vennootschappelijke jaarrekening
x € 1.000
8.3 Company statement of profit or loss for 2017
2017 2016
Administrative expenses -1.898 -2.534
Operating result -1.898 -2.534
Finance income 24.771 29.885
Finance expense -15.070 -14.221
Result before tax 7.803 13.130
Income tax -1.241 -31.103
Share in profit or loss of investees 12.980 -92.521
Result after tax 19.542 -110.494
The employee benefits for the members of the Supervisory Board, the Executive Board and the Board’s Secretariat are recognised in the company financial statements (see note 6.28 to the consolidated financial statements).

82 Financial statements 2017 - Heijmans
FINANCIAL STATEMENTS
Vennootschappelijke jaarrekening
x € 1.000
8.4 Company statement of financial position at 31 December 2017 (before appropriation of result)
Assets 31 december 2017 31 december 2016
Non-current assets
Intangible assets 21.207 21.207
Financial assets 40.351 11.732
Deferred tax asset 34.605 8.154
96.163 41.093
Current assets
Receivables 404.293 451.871
Cash and cash equivalents 0 0
404.293 451.871
500.456 492.964
Equity and liabilities 31 december 2017 31 december 2016
Equity
Issued capital 6.423 6.423
Share premium reserve 242.680 242.680
Hedging reserve 160 -193
Reserve for actuarial results -27.584 -27.965
Reserve for Bonus Investment Share Matching Plan 242 239
Statutory reserve for investees 64.559 58.959
Retained earnings -143.845 -27.751
Result after tax for the current financial year 19.542 -110.494
162.177 141.898
Non-current liabilities 45.100 45.100
Current liabilities 293.179 305.966
500.456 492.964

83Financial statements 2017 - Heijmans
FINANCIAL STATEMENTS
Vennootschappelijke jaarrekening
x € 1.000
8.5 Notes to the company statement of financial position
Intangible assets (goodwill) 2017 2016
Carrying amount
Balance at 1 January 21.207 21.207
Balance at 31 December 21.207 21.207
Financial assets 2017 2016
Investments in Group companies
Balance at 1 January -146.713 -67.042
Share in results of investees after tax 12.980 -92.521
Dividends received from investees -3.154 -4.101
Capital contributions 86.178 30.566
Changes in cash flow hedges 356 -568
Changes in actuarial results relating to employee-benefits 381 -13.047
Balance at 31 December -49.972 -146.713
Set off against receivables from Group companies -90.323 -158.445
Recognised under financial assets 40.351 11.732
The share in results of investees after tax includes the gains on the sale of investees. The investments in Group companies are direct or indirect interests in them. The principal Group companies are listed in Chapter 7.

84 Financial statements 2017 - Heijmans
FINANCIAL STATEMENTS
Vennootschappelijke jaarrekening
x € 1.000
Receivables 31 december 2017 31 december 2016
Group companies 403.623 451.462
Other receivables 670 409
404.293 451.871
The receivables fall due within one year.The comparative figures for classification purposes have been restated.
Cash and cash equivalents Cash balances are at the free disposal of the Company.
Equity
2017 Issued capital
Share premium
reserve
Reserve for actuarial
resultsHedging reserve
Reserve for Bonus
Investment Share
Matching Plan
Statutory reserve for
investees Retained earnings
Result for the year after tax
Total Equity
Balance at 1 January 6.423 242.680 -27.965 -193 239 58.959 -27.751 -110.494 141.898
Share issue 0 0 0 0 0 0 0 0 0
Reclassification 0 0 0 0 0 5.600 -5.600 0 0
Bonus Investment Share Matching Plan 0 0 0 0 3 0 0 0 3
Appropriation of result for 2016 0 0 0 0 0 0 -110.494 110.494 0
Comprehensive income 0 0 381 353 0 0 0 19.542 20.276
Balance at 31 December 6.423 242.680 -27.584 160 242 64.559 -143.845 19.542 162.177
2016 Issued capital
Share premium
reserve
Reserve for actuarial
resultsHedging reserve
Reserve for Bonus
Investment Share
Matching Plan
Statutory reserve for
investees Retained earnings
Result for the year after tax
Total Equity
Balance at 1 January 6.423 242.680 -14.918 375 229 42.059 16.407 -27.258 265.997
Share issue 0 0 0 0 0 0 0 0 0
Reclassification 0 0 0 0 0 16.900 -16.900 0 0
Bonus Investment Share Matching Plan 0 0 0 0 10 0 0 0 10
Appropriation of result for 2016 0 0 0 0 0 0 -27.258 27.258 0
Comprehensive income 0 0 -13.047 -568 0 0 0 -110.494 -124.109
Balance at 31 December 6.423 242.680 -27.965 -193 239 58.959 -27.751 -110.494 141.898

85Financial statements 2017 - Heijmans
FINANCIAL STATEMENTS
Vennootschappelijke jaarrekening
Authorised share capitalComposition of the authorised share capital is as follows:
Authorised share capital in € 31 december 2017
35,100,000 ordinary shares, each with a nominal value of €0.30 10.530.000
7,000,000 cumulative financing preference shares B, each with a nominal value of €0.21 1.470.000
8,000,000 protective preference shares, each with a nominal value of €1.50 12.000.000
24.000.000
As at 31 December 2017, the number of ordinary shares issued was 21,406,880. All the outstanding shares are paid up, which represents a value of €6,422,064 (at €0.30 per share). Depositary receipts are issued for ordinary shares. Holders of depositary receipts have the option to convert these into shares under certain conditions. This option has been exercised for 7 depositary receipts. The holders of ordinary shares or their depositary receipts are entitled to dividend and have the right to exercise 30 votes per share at meetings of the Company’s shareholders.
Refer to section 6.20 of the consolidated financial statements for the notes on the rights and obligations relating to the cumulative financing preference shares.
Share premium reserveThe share premium reserve consists of the capital paid up in excess of the nominal value.
Reserve for actuarial resultsThe reserve for actuarial results represents the actuarial results on employee-benefits (see note 6.21 to the consolidated financial statements).
Hedging reserveThe hedging reserve represents the effective portion of the cumulative net change in the fair value of the cash flow hedging instruments relating to hedged transactions that have not yet occurred. This reserve is not freely distributable.
Reserve for Bonus Investment Share Matching PlanFor information on the reserve for the Bonus Investment Share Matching Plan, see note 6.28 to the consolidated financial statements.
Reserve for investeesThe statutory reserve for investees represents the difference between the retained earnings and the direct changes in equity as calculated using the parent company’s accounting policies on the one hand and that portion for which the parent company can determine distribution on the other hand. The statutory reserve is determined for each investee individually. This reserve is not freely distributable.

86 Financial statements 2017 - Heijmans
FINANCIAL STATEMENTS
Vennootschappelijke jaarrekening
x € 1.000
Result appropriation It is proposed to add the result after tax of approximately €20 to the reserves.
Liabilities 31 december 2017 31 december 2016
Non-current liabilities
Financing preference shares 45.100 45.100
Syndicated bank financing 0 0
45.100 45.100
Current liabilities
Group companies 283.332 162.554
Dividend payable on financing preference shares 3.522 3.522
Banks 3.672 29.789
Syndicated bank financing 0 105.000
Tax and social security contributions 0 4.166
Other liabilities 2.653 935
293.179 305.966

87Financial statements 2017 - Heijmans
FINANCIAL STATEMENTS
Vennootschappelijke jaarrekening
x € 1.000
8.6 Liabilities not disclosed in the statement of financial position
Contingent liabilities 31 december 2017 31 december 2016
Bank guarantees 198.061 211.343
Group guarantees to clients 378.331 298.905
Group guarantees to credit institutions 29.287 27.788
605.679 538.036
For information on the guarantees, see note 6.27 to the consolidated financial statements.
Joint and several liability, and guarantees With the exception of Heijmans Deutschland B.V. and Heijmans Technology B.V, statements of joint and several liability as referred to under Section 403(1)(f) of Book 2 of the Dutch Civil Code have been filed with the Trade Register of the respective Chambers of Commerce for all the Dutch wholly owned subsidiaries included in the consolidated figures.
Tax group Together with its Dutch subsidiaries, Heijmans N.V. forms a tax group for the purposes of corporate income tax and value added tax. In accordance with the standard applicable conditions, each company is jointly and severally liable for the tax liabilities of every company that forms part of the tax group.
Share in results of investeesThis is the company’s share in the results of its investees, all of which are Group companies.

88 Financial statements 2017 - Heijmans
FINANCIAL STATEMENTS
Vennootschappelijke jaarrekening
x € 1.000
Auditors’ feesThe following fees for Ernst & Young Accountants llP have been charged to the Company, its subsidiaries and other companies included in the consolidated figures. These are disclosed in accordance with the provisions in Section 382a Book 2 of the Dutch Civil Code.
x € 1.000 2017
Ernst & YoungAccountants LLP
Other EY network firms Total EY
Examination of the financial statements 1.630 - 1.630
Other audit engagements 77 9 86
Tax consultancy services - - 0
Other non-audit services - - 0
1.707 9 1.716
In addition to performing the audit of the financial statements required by law, Ernst & Young Accountants LLP provided the following permitted services: assurance report relating to the sustainability information contained in the directors’ report, in particular agreed activities with respect to the ‘Compliance Certificate’ for the banking group and various specific declarati-ons concerning revenue, key figures and projects.The costs relating to the examination of the financial statements for the foreign subsidiaries are billed directly by Ernst & Young Accountants LLP.
x € 1.000 2016
Ernst & YoungAccountants LLP
Other EY network firms Total EY
Examination of the financial statements 1.613 - 1.613
Other audit engagements 104 - 104
Tax consultancy services - - 0
Other non-audit services - - 0
1.717 0 1.717
Events after balance dateIn the period prior to signing, no significant events occurred that would have an effect on these financial statements other than those explained in the consolidated financial statements.
Rosmalen, 23 February 2018
De leden van de raad van bestuur A.G.J. HillenJ.G. Janssen
De leden van de raad van commissarissenSj. S. VollebregtP.G. BoumeesterR. van GelderR. IckeS. van Keulen