financial results q2 2015
TRANSCRIPT
Financial Results for Q2 2015
CEO Karl-Henrik Sundström and CFO Seppo Parvi 21 July 2015
It should be noted that certain statements herein which are not historical facts, including, without
limitation those regarding expectations for market growth and developments; expectations for growth
and profitability; and statements preceded by “believes”, “expects”, “anticipates”, “foresees”, or similar
expressions, are forward-looking statements within the meaning of the United States Private Securities
Litigation Reform Act of 1995. Since these statements are based on current plans. estimates and
projections, they involve risks and uncertainties which may cause actual results to materially differ from
those expressed in such forward-looking statements. Such factors include, but are not limited to: (1)
operating factors such as continued success of manufacturing activities and the achievement of
efficiencies therein, continued success of product development, acceptance of new products or services
by the Group’s targeted customers, success of the existing and future collaboration arrangements,
changes in business strategy or development plans or targets, changes in the degree of protection
created by the Group’s patents and other intellectual property rights, the availability of capital on
acceptable terms; (2) industry conditions, such as strength of product demand, intensity of competition,
prevailing and future global market prices for the Group’s products and the pricing pressures thereto.
price fluctuations in raw materials, financial condition of the customers and the competitors of the
Group, the potential introduction of competing products and technologies by competitors; and (3)
general economic conditions, such as rates of economic growth in the Group’s principal geographic
markets or fluctuations in exchange and interest rates.
Stora Enso Q2 2015 Results 2 21 July 2015
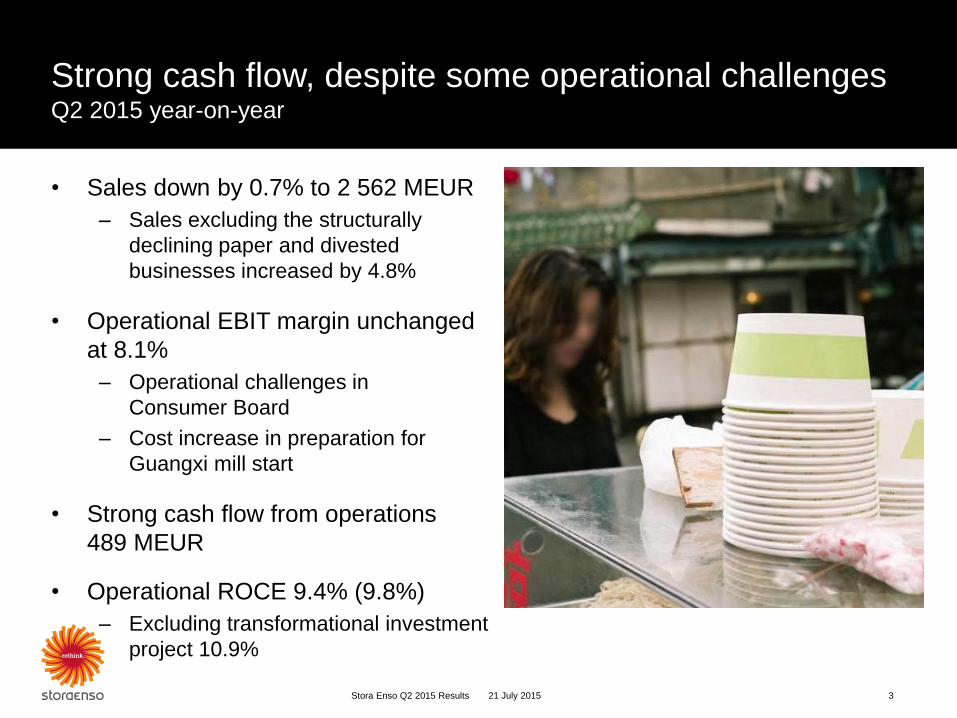
Strong cash flow, despite some operational challenges Q2 2015 year-on-year
• Sales down by 0.7% to 2 562 MEUR
– Sales excluding the structurally
declining paper and divested
businesses increased by 4.8%
• Operational EBIT margin unchanged
at 8.1%
– Operational challenges in
Consumer Board
– Cost increase in preparation for
Guangxi mill start
• Strong cash flow from operations
489 MEUR
• Operational ROCE 9.4% (9.8%)
– Excluding transformational investment
project 10.9%
21 July 2015 Stora Enso Q2 2015 Results 3
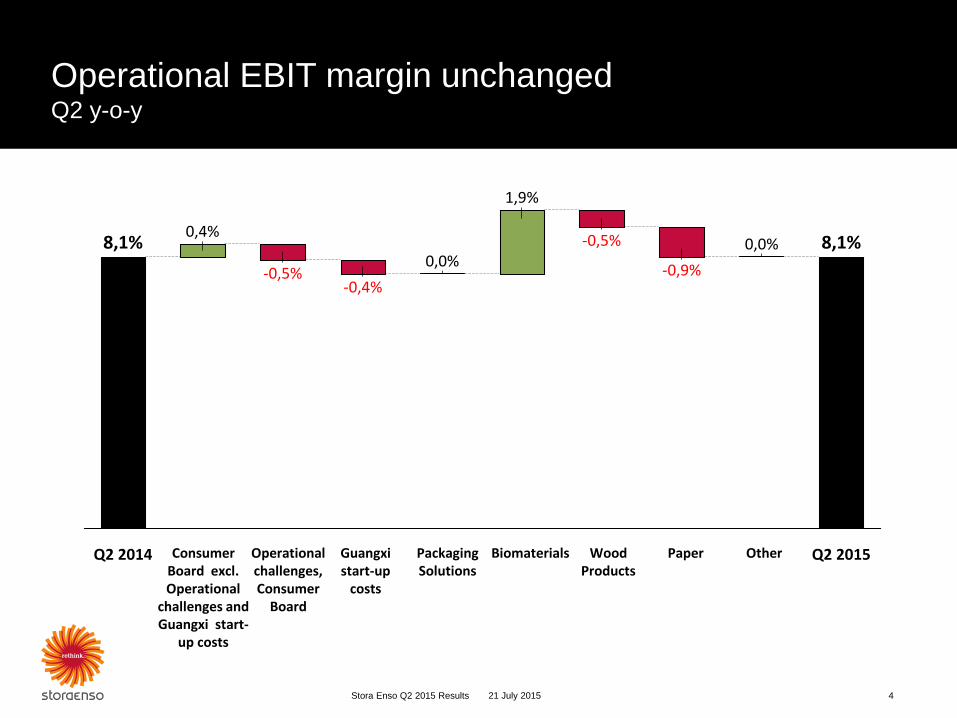
Operational EBIT margin unchanged Q2 y-o-y
21 July 2015 Stora Enso Q2 2015 Results 4
-0,9%
Packaging Solutions
Q2 2015Wood Products
Paper OtherConsumer Board excl. Operational
challenges and Guangxi start-
up costs
-0,4%-0,5%
Operational challenges,Consumer
Board
Q2 2014
1,9%
-0,5%0,4%
0,0%0,0%
Biomaterials
8,1%
Guangxi start-up
costs
8,1%
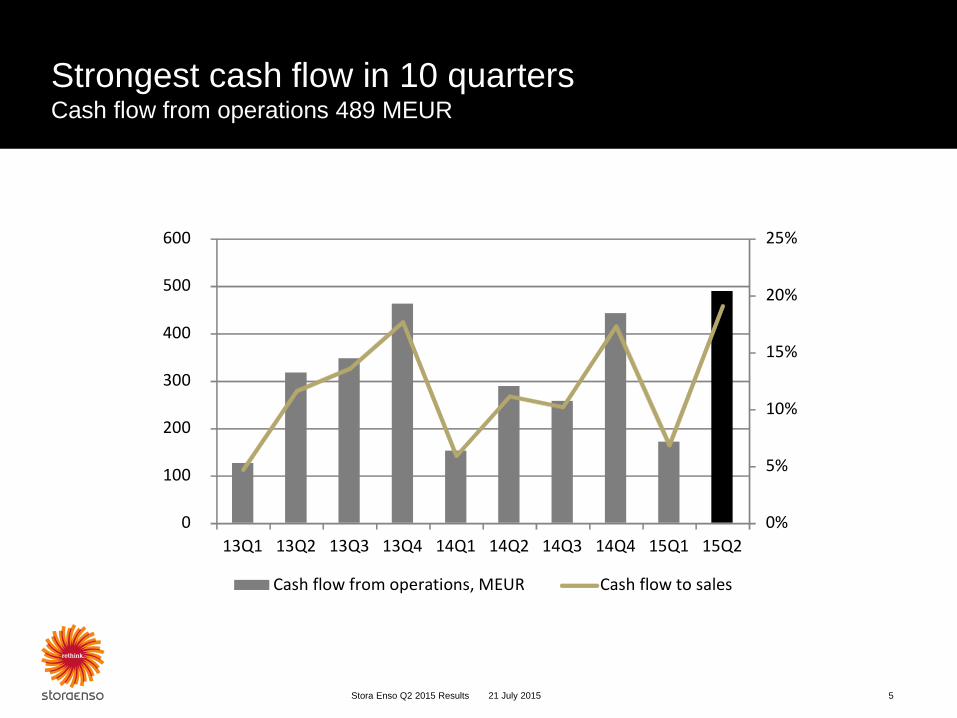
Strongest cash flow in 10 quarters Cash flow from operations 489 MEUR
Stora Enso Q2 2015 Results 5 21 July 2015
0%
5%
10%
15%
20%
25%
0
100
200
300
400
500
600
13Q1 13Q2 13Q3 13Q4 14Q1 14Q2 14Q3 14Q4 15Q1 15Q2
Cash flow from operations, MEUR Cash flow to sales
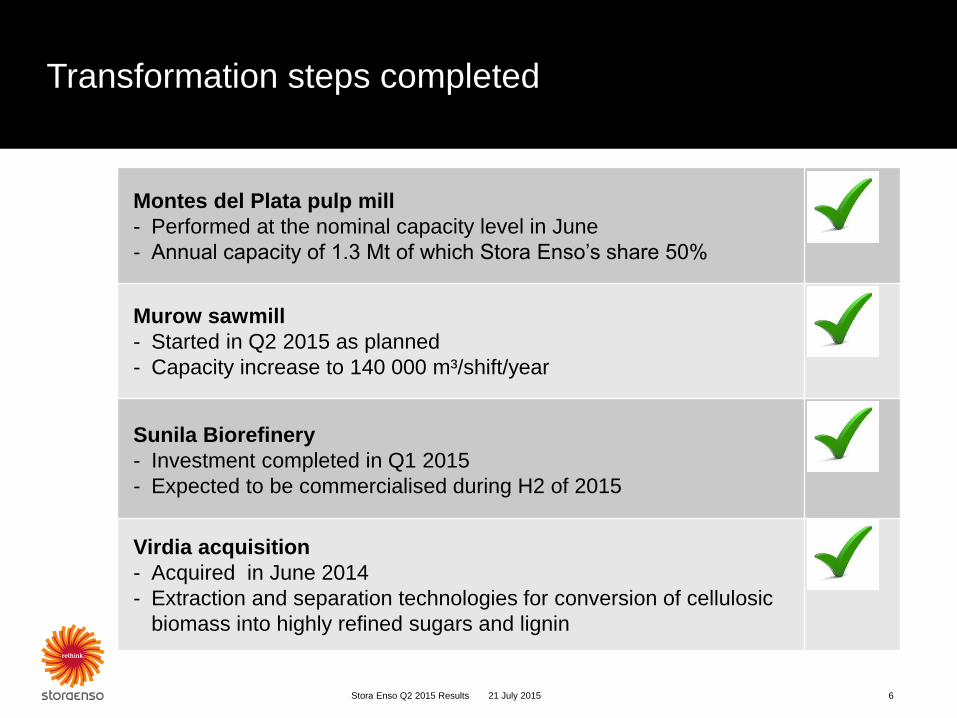
Montes del Plata pulp mill
- Performed at the nominal capacity level in June
- Annual capacity of 1.3 Mt of which Stora Enso’s share 50%
Murow sawmill
- Started in Q2 2015 as planned
- Capacity increase to 140 000 m³/shift/year
Sunila Biorefinery
- Investment completed in Q1 2015
- Expected to be commercialised during H2 of 2015
Virdia acquisition
- Acquired in June 2014
- Extraction and separation technologies for conversion of cellulosic
biomass into highly refined sugars and lignin
Transformation steps completed
21 July 2015 Stora Enso Q2 2015 Results 6
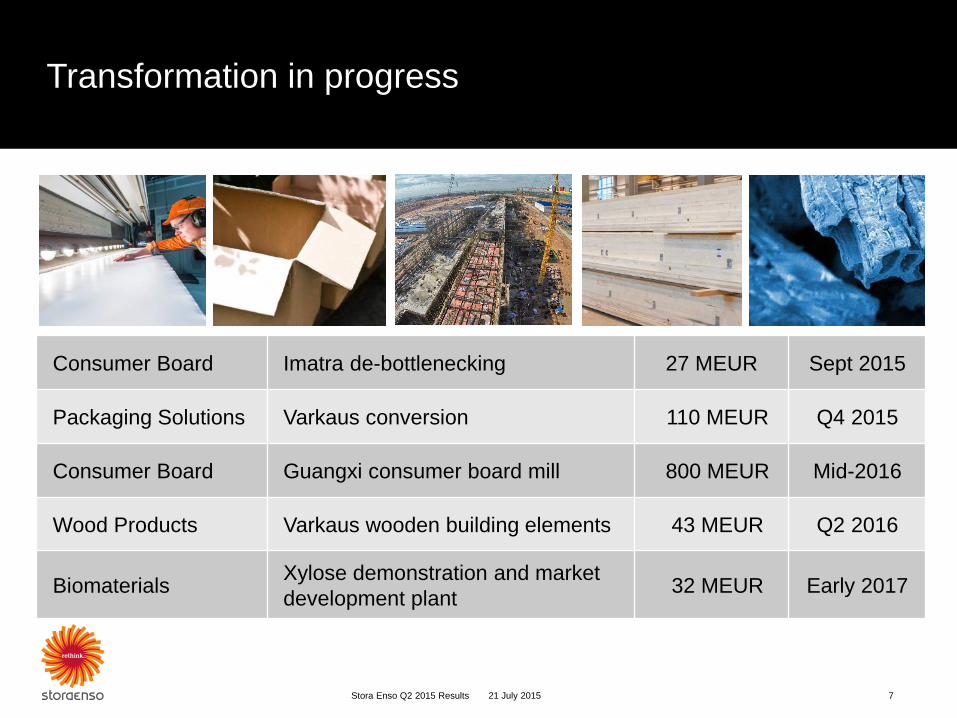
Consumer Board Imatra de-bottlenecking 27 MEUR Sept 2015
Packaging Solutions Varkaus conversion 110 MEUR Q4 2015
Consumer Board Guangxi consumer board mill 800 MEUR Mid-2016
Wood Products Varkaus wooden building elements 43 MEUR Q2 2016
Biomaterials Xylose demonstration and market
development plant 32 MEUR Early 2017
Transformation in progress
21 July 2015 Stora Enso Q2 2015 Results 7
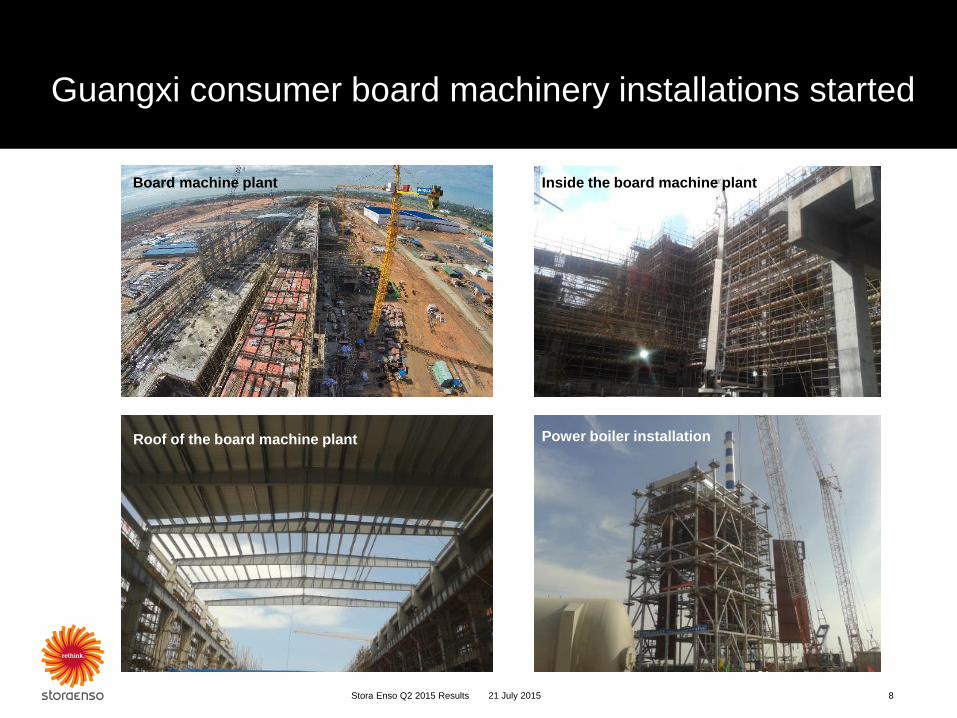
Guangxi consumer board machinery installations started
21 July 2015 Stora Enso Q2 2015 Results 8
Board machine plant Inside the board machine plant
Power boiler installation Roof of the board machine plant
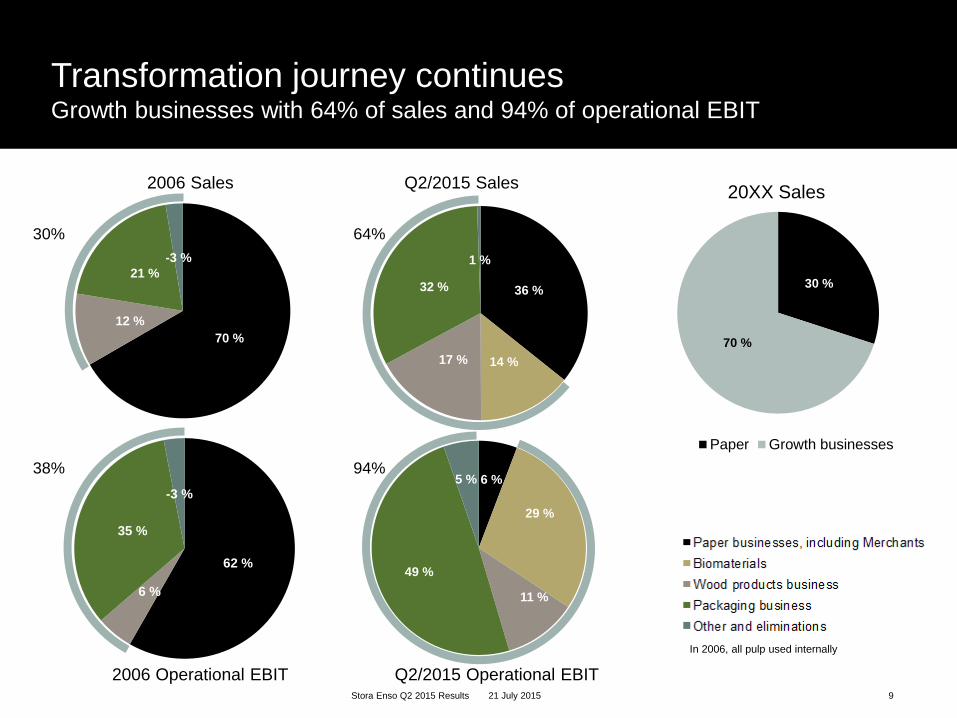
6 %
29 %
11 %
49 %
5 %
36 %
14 %17 %
32 %
1 %
62 %
6 %
35 %
-3 %
70 %
12 %
21 %
-3 %
Transformation journey continues Growth businesses with 64% of sales and 94% of operational EBIT
2006 Sales
Stora Enso Q2 2015 Results 9 21 July 2015
Q2/2015 Sales
30 %
70 %
Paper Growth businesses
64%
94%
30%
38%
In 2006, all pulp used internally
Q2/2015 Operational EBIT 2006 Operational EBIT
20XX Sales
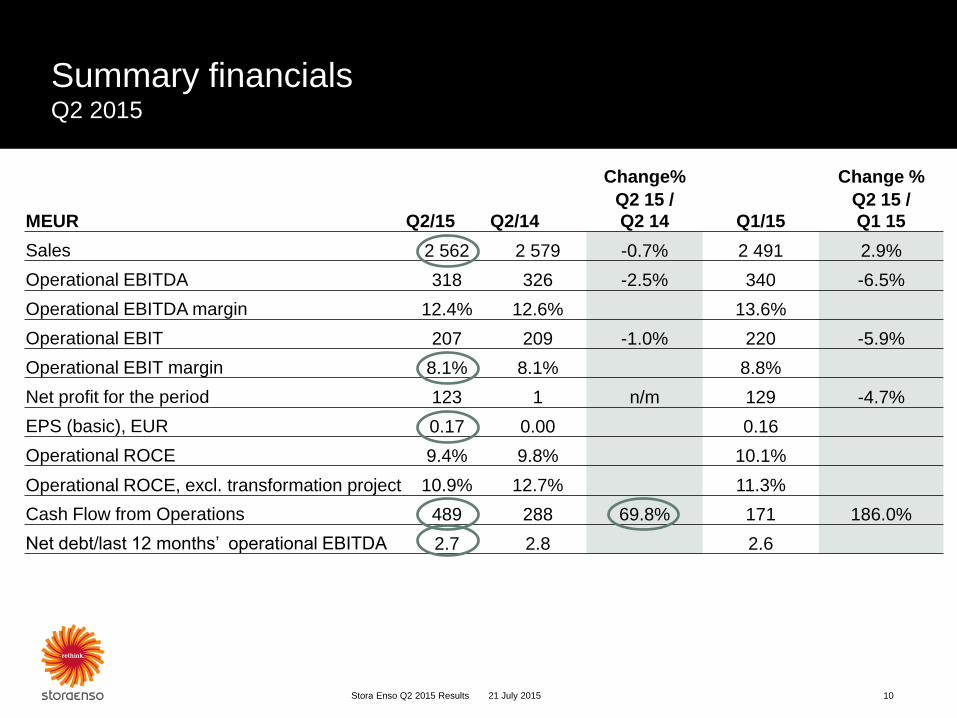
Summary financials Q2 2015
MEUR
Q2/15
Q2/14
Change% Change %
Q2 15 /
Q2 14 Q1/15
Q2 15 /
Q1 15
Sales 2 562 2 579 -0.7% 2 491 2.9%
Operational EBITDA 318 326 -2.5% 340 -6.5%
Operational EBITDA margin 12.4% 12.6% 13.6%
Operational EBIT 207 209 -1.0% 220 -5.9%
Operational EBIT margin 8.1% 8.1% 8.8%
Net profit for the period 123 1 n/m 129 -4.7%
EPS (basic), EUR 0.17 0.00 0.16
Operational ROCE 9.4% 9.8% 10.1%
Operational ROCE, excl. transformation project 10.9% 12.7% 11.3%
Cash Flow from Operations 489 288 69.8% 171 186.0%
Net debt/last 12 months’ operational EBITDA 2.7 2.8 2.6
10 Stora Enso Q2 2015 Results 21 July 2015
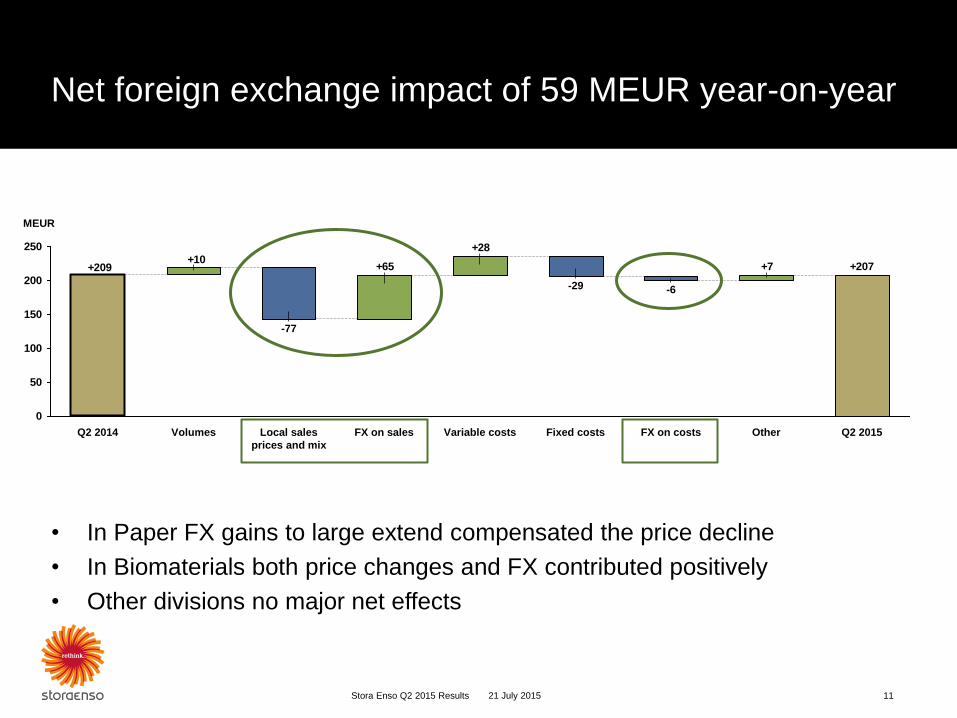
+207+7+65+209
+28+10
0
50
100
150
200
250
Other Volumes Q2 2014
Q2 2015 FX on costs
-6
Fixed costs
-29
Variable costs FX on sales Local sales
prices and mix
-77
MEUR
Net foreign exchange impact of 59 MEUR year-on-year
• In Paper FX gains to large extend compensated the price decline
• In Biomaterials both price changes and FX contributed positively
• Other divisions no major net effects
11 21 July 2015 Stora Enso Q2 2015 Results
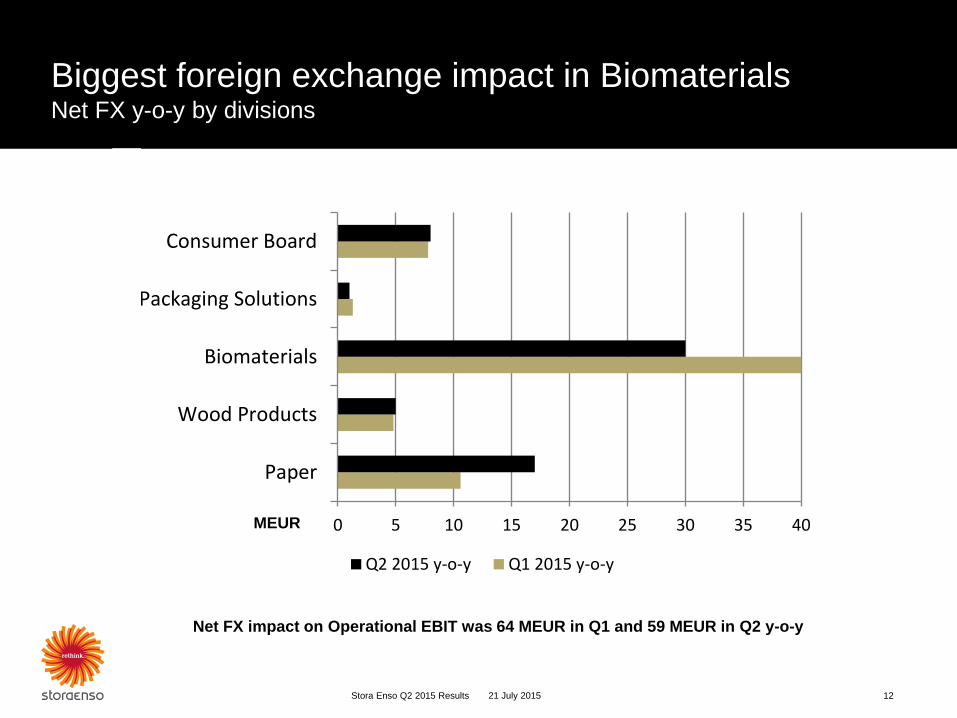
0 5 10 15 20 25 30 35 40
Paper
Wood Products
Biomaterials
Packaging Solutions
Consumer Board
Q2 2015 y-o-y Q1 2015 y-o-y
Biggest foreign exchange impact in Biomaterials Net FX y-o-y by divisions
21 July 2015 Stora Enso Q2 2015 Results 12
Net FX impact on Operational EBIT was 64 MEUR in Q1 and 59 MEUR in Q2 y-o-y
MEUR
0
100
200
300
400
500
600
700
14Q2 15Q2
Sales, MEUR
0
10
20
30
40
50
60
70
80
90
100
14Q2 15Q2
Operational EBIT, MEUR
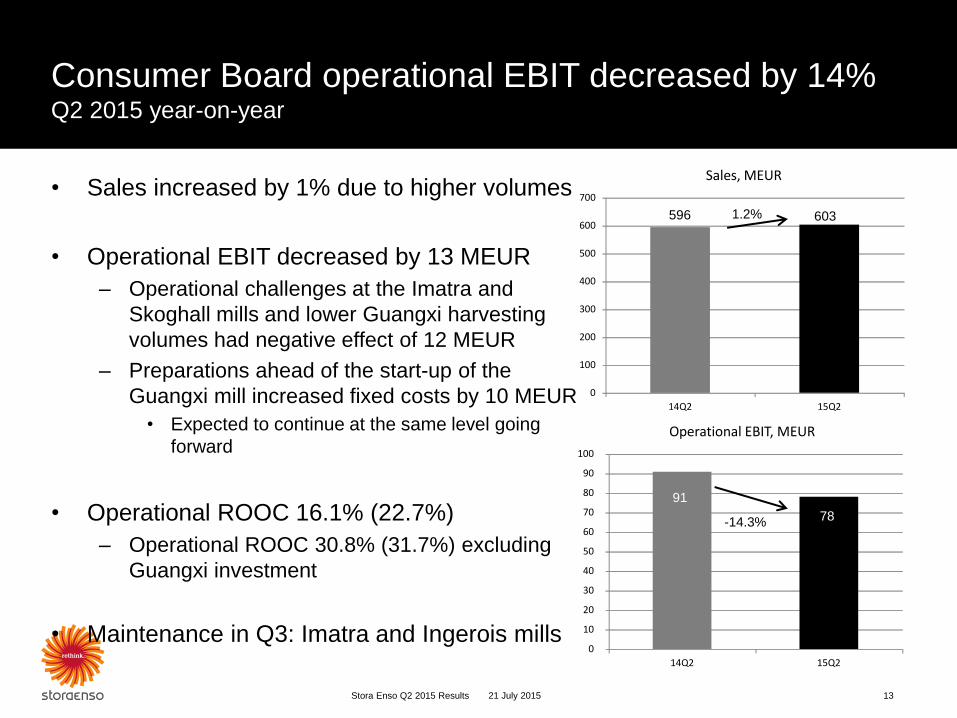
Consumer Board operational EBIT decreased by 14% Q2 2015 year-on-year
13 Stora Enso Q2 2015 Results
• Sales increased by 1% due to higher volumes
• Operational EBIT decreased by 13 MEUR
– Operational challenges at the Imatra and
Skoghall mills and lower Guangxi harvesting
volumes had negative effect of 12 MEUR
– Preparations ahead of the start-up of the
Guangxi mill increased fixed costs by 10 MEUR
• Expected to continue at the same level going
forward
• Operational ROOC 16.1% (22.7%)
– Operational ROOC 30.8% (31.7%) excluding
Guangxi investment
• Maintenance in Q3: Imatra and Ingerois mills
– operational EBIT increased by
21 July 2015
1.2%
-14.3%
596 603
78
91
0
5
10
15
20
25
30
14Q2 15Q2
Operational EBIT excl. Corenso, MEUR
0
50
100
150
200
250
14Q2 15Q2
Sales excl. Corenso, MEUR
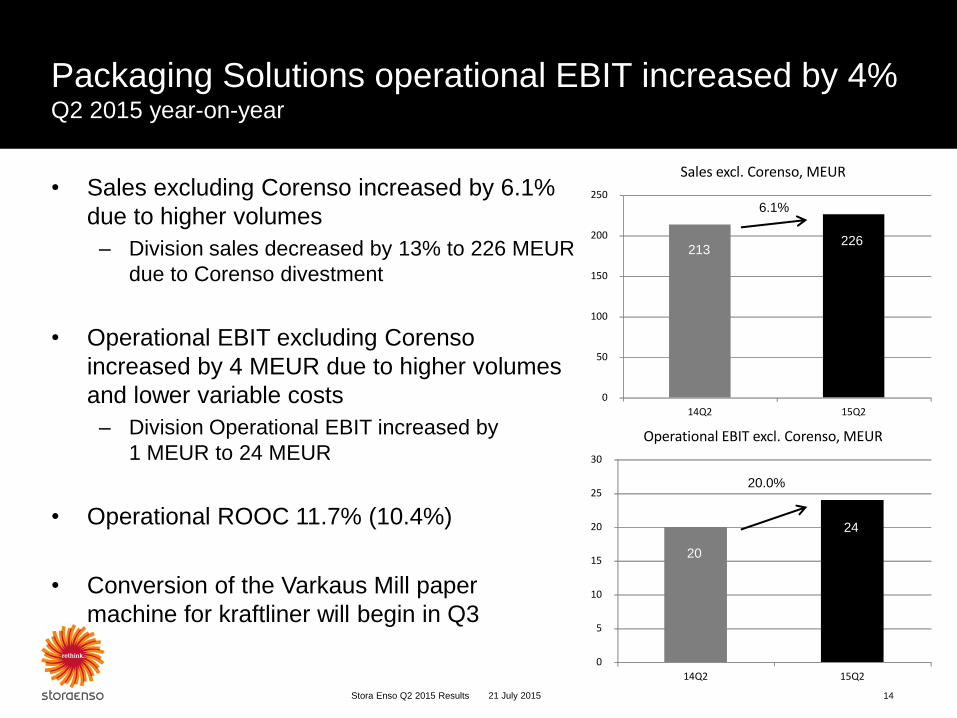
Packaging Solutions operational EBIT increased by 4% Q2 2015 year-on-year
14 Stora Enso Q2 2015 Results
• Sales excluding Corenso increased by 6.1%
due to higher volumes
– Division sales decreased by 13% to 226 MEUR
due to Corenso divestment
• Operational EBIT excluding Corenso
increased by 4 MEUR due to higher volumes
and lower variable costs
– Division Operational EBIT increased by
1 MEUR to 24 MEUR
• Operational ROOC 11.7% (10.4%)
• Conversion of the Varkaus Mill paper
machine for kraftliner will begin in Q3
21 July 2015
6.1%
20.0%
213 226
24
20
0
10
20
30
40
50
60
70
14Q2 15Q2
Operational EBIT, MEUR
0
50
100
150
200
250
300
350
400
14Q2 15Q2
Sales, MEUR
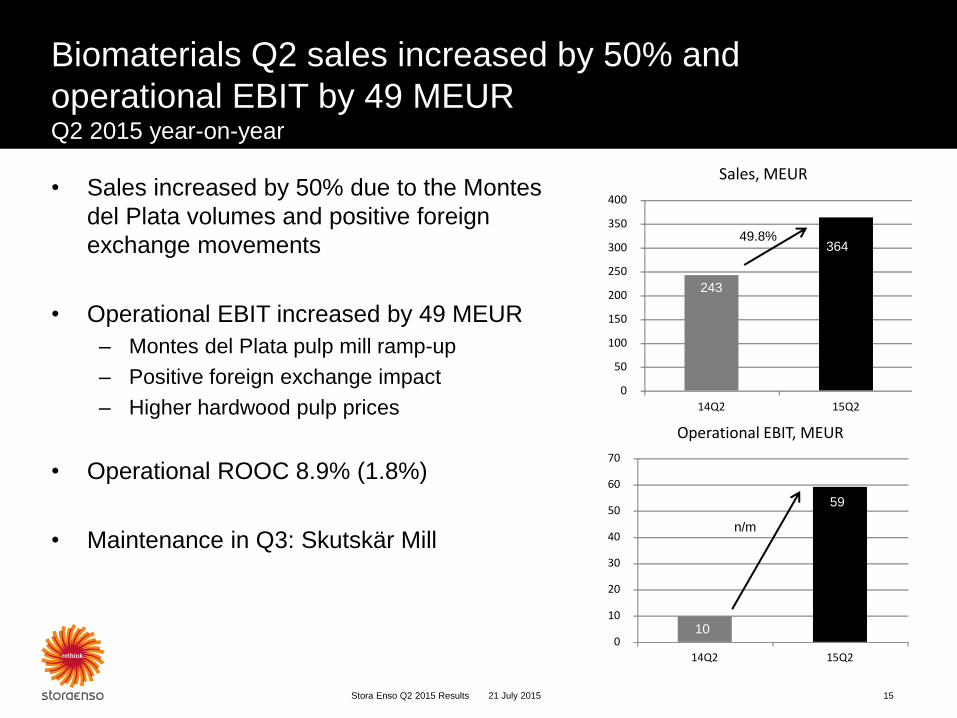
Biomaterials Q2 sales increased by 50% and
operational EBIT by 49 MEUR Q2 2015 year-on-year
• Sales increased by 50% due to the Montes
del Plata volumes and positive foreign
exchange movements
• Operational EBIT increased by 49 MEUR
– Montes del Plata pulp mill ramp-up
– Positive foreign exchange impact
– Higher hardwood pulp prices
• Operational ROOC 8.9% (1.8%)
• Maintenance in Q3: Skutskär Mill
21 July 2015 Stora Enso Q2 2015 Results 15
49.8%
n/m
243
364
59
10
0
5
10
15
20
25
30
35
40
14Q2 15Q2
Operational EBIT, MEUR
0
100
200
300
400
500
600
14Q2 15Q2
Sales, MEUR
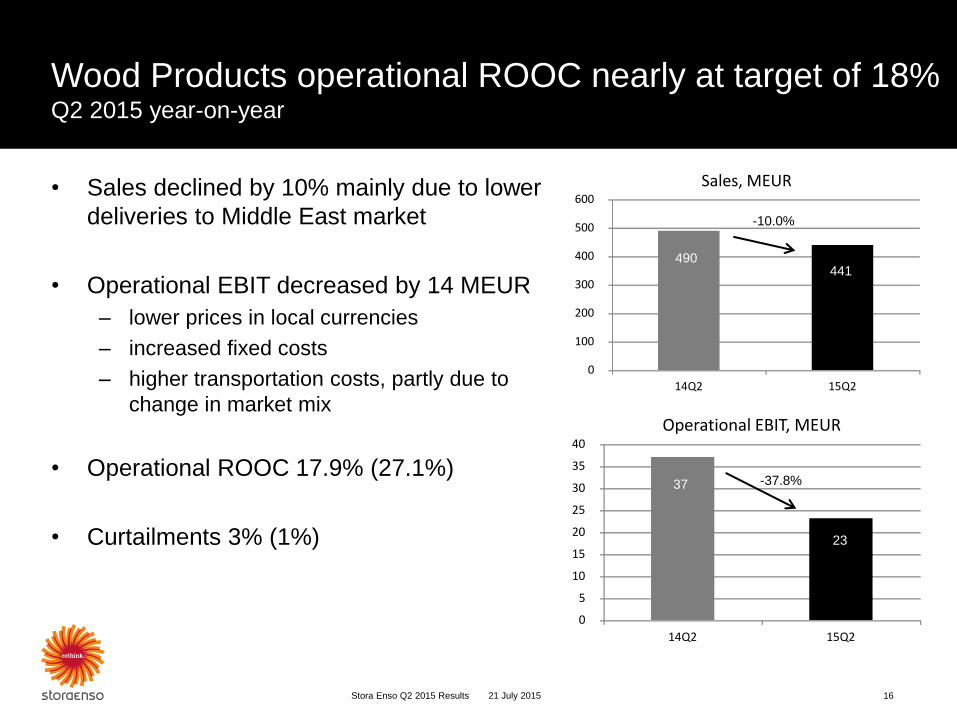
Wood Products operational ROOC nearly at target of 18% Q2 2015 year-on-year
• Sales declined by 10% mainly due to lower
deliveries to Middle East market
• Operational EBIT decreased by 14 MEUR
– lower prices in local currencies
– increased fixed costs
– higher transportation costs, partly due to
change in market mix
• Operational ROOC 17.9% (27.1%)
• Curtailments 3% (1%)
21 July 2015 Stora Enso Q2 2015 Results 16
-10.0%
-37.8%
490
37
23
441
0
200
400
600
800
1 000
1 200
14Q2 15Q2
Sales, MEUR
0
10
20
30
40
50
60
70
80
90
14Q2 15Q2
Operational EBITDA, MEUR
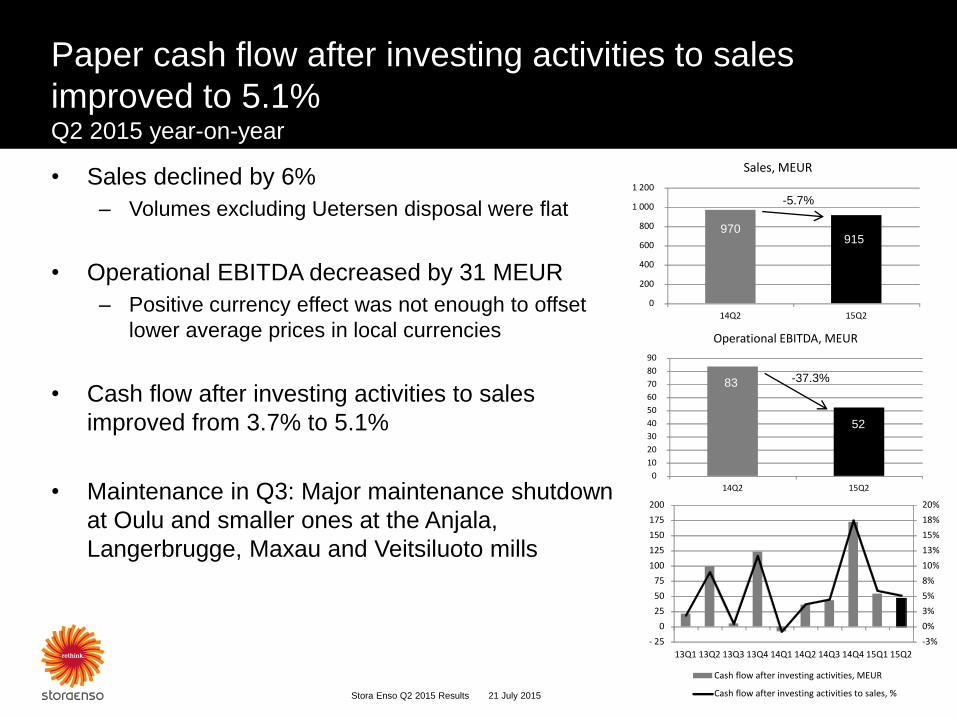
Paper cash flow after investing activities to sales
improved to 5.1% Q2 2015 year-on-year
• Sales declined by 6%
– Volumes excluding Uetersen disposal were flat
• Operational EBITDA decreased by 31 MEUR
– Positive currency effect was not enough to offset
lower average prices in local currencies
• Cash flow after investing activities to sales
improved from 3.7% to 5.1%
• Maintenance in Q3: Major maintenance shutdown
at Oulu and smaller ones at the Anjala,
Langerbrugge, Maxau and Veitsiluoto mills
Stora Enso Q2 2015 Results 17 21 July 2015
-5.7%
-37.3%
915 970
83
52
-3%
0%
3%
5%
8%
10%
13%
15%
18%
20%
- 25
0
25
50
75
100
125
150
175
200
13Q1 13Q2 13Q3 13Q4 14Q1 14Q2 14Q3 14Q4 15Q1 15Q2
Cash flow after investing activities, MEUR
Cash flow after investing activities to sales, %
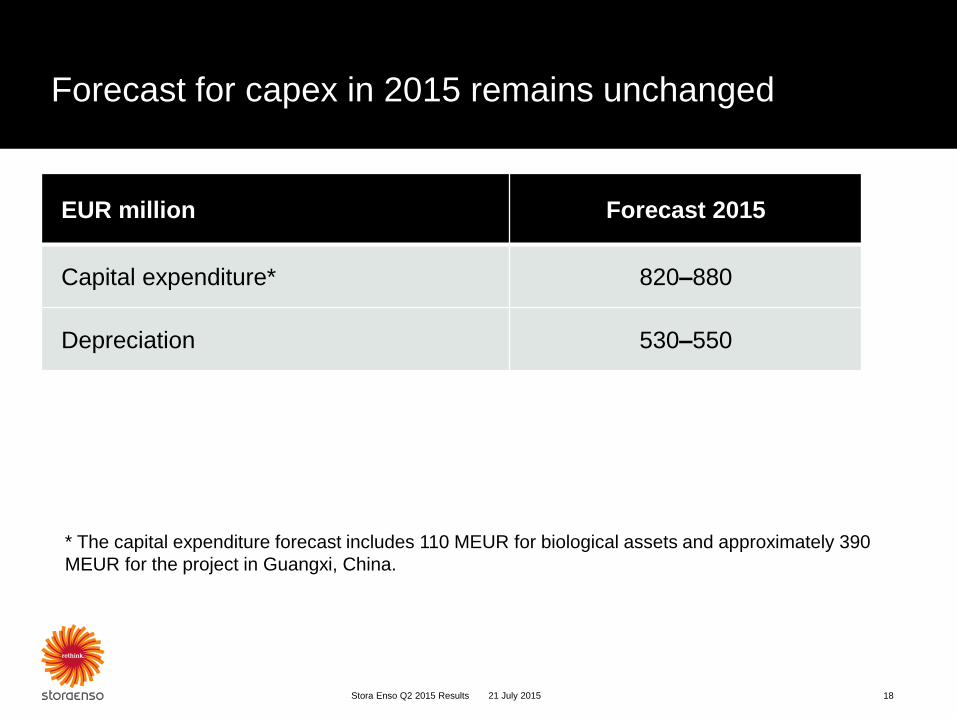
Forecast for capex in 2015 remains unchanged
EUR million Forecast 2015
Capital expenditure* 820–880
Depreciation 530–550
* The capital expenditure forecast includes 110 MEUR for biological assets and approximately 390
MEUR for the project in Guangxi, China.
18 Stora Enso Q2 2015 Results 21 July 2015
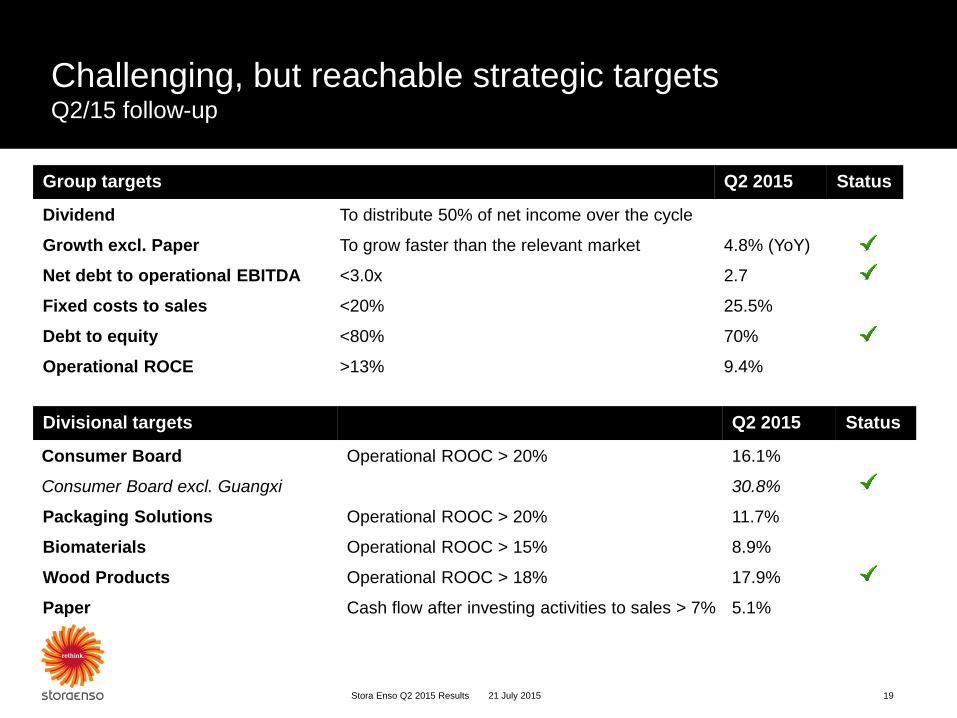
Challenging, but reachable strategic targets Q2/15 follow-up
Group targets Q2 2015 Status
Dividend To distribute 50% of net income over the cycle
Growth excl. Paper To grow faster than the relevant market 4.8% (YoY)
Net debt to operational EBITDA <3.0x 2.7
Fixed costs to sales <20% 25.5%
Debt to equity <80% 70%
Operational ROCE >13% 9.4%
Divisional targets Q2 2015 Status
Consumer Board Operational ROOC > 20% 16.1%
Consumer Board excl. Guangxi 30.8%
Packaging Solutions Operational ROOC > 20% 11.7%
Biomaterials Operational ROOC > 15% 8.9%
Wood Products Operational ROOC > 18% 17.9%
Paper Cash flow after investing activities to sales > 7% 5.1%
21 July 2015 Stora Enso Q2 2015 Results 19
Guidance for Q3 2015 Compared to Q2 2015
• Q3/2015 sales are estimated to be
similar to the amount of the 2 562
MEUR in Q2/2015
• Operational EBIT is expected to
be in line with the 207 MEUR
recorded in Q2/2015
• The negative maintenance impact
is expected to be 15 MEUR higher
in Q3 than in Q2/2015
21 July 2015 Stora Enso Q2 2015 Results 20
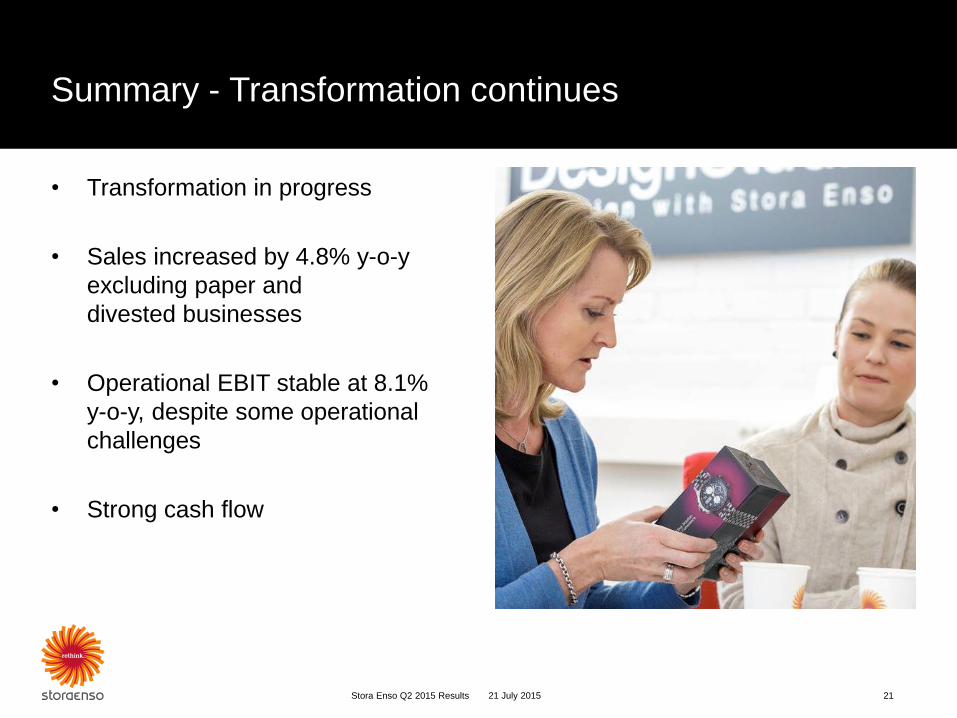
Summary - Transformation continues
• Transformation in progress
• Sales increased by 4.8% y-o-y
excluding paper and
divested businesses
• Operational EBIT stable at 8.1%
y-o-y, despite some operational
challenges
• Strong cash flow
21 July 2015 Stora Enso Q2 2015 Results 21
21 July 2015 Stora Enso Q2 2015 Results 22
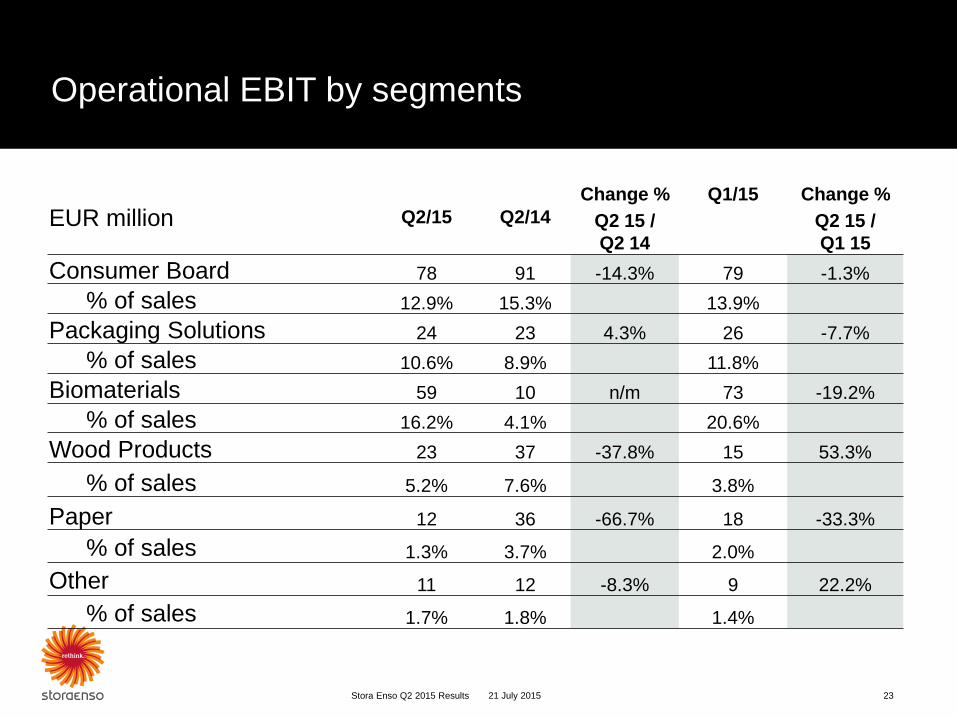
Operational EBIT by segments
EUR million Q2/15 Q2/14
Change % Q1/15 Change %
Q2 15 /
Q2 14
Q2 15 /
Q1 15
Consumer Board 78 91 -14.3% 79 -1.3%
% of sales 12.9% 15.3% 13.9%
Packaging Solutions 24 23 4.3% 26 -7.7%
% of sales 10.6% 8.9% 11.8%
Biomaterials 59 10 n/m 73 -19.2%
% of sales 16.2% 4.1% 20.6%
Wood Products 23 37 -37.8% 15 53.3%
% of sales 5.2% 7.6% 3.8%
Paper 12 36 -66.7% 18 -33.3%
% of sales 1.3% 3.7% 2.0%
Other 11 12 -8.3% 9 22.2%
% of sales 1.7% 1.8% 1.4%
23 Stora Enso Q2 2015 Results 21 July 2015
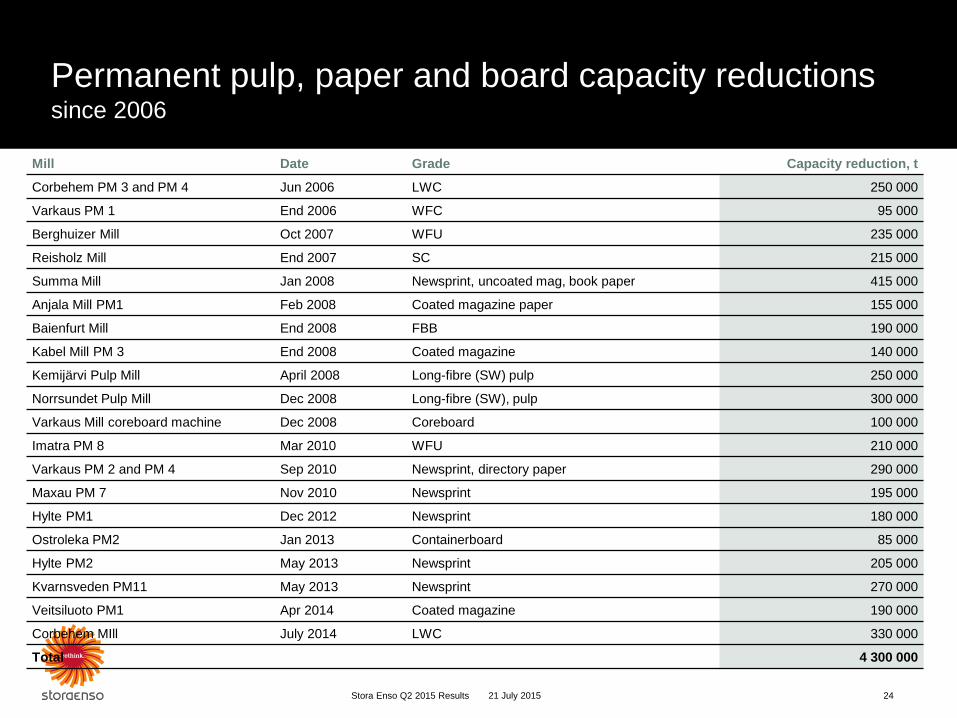
Permanent pulp, paper and board capacity reductions since 2006
Stora Enso Q2 2015 Results 24
Mill Date Grade Capacity reduction, t
Corbehem PM 3 and PM 4 Jun 2006 LWC 250 000
Varkaus PM 1 End 2006 WFC 95 000
Berghuizer Mill Oct 2007 WFU 235 000
Reisholz Mill End 2007 SC 215 000
Summa Mill Jan 2008 Newsprint, uncoated mag, book paper 415 000
Anjala Mill PM1 Feb 2008 Coated magazine paper 155 000
Baienfurt Mill End 2008 FBB 190 000
Kabel Mill PM 3 End 2008 Coated magazine 140 000
Kemijärvi Pulp Mill April 2008 Long-fibre (SW) pulp 250 000
Norrsundet Pulp Mill Dec 2008 Long-fibre (SW), pulp 300 000
Varkaus Mill coreboard machine Dec 2008 Coreboard 100 000
Imatra PM 8 Mar 2010 WFU 210 000
Varkaus PM 2 and PM 4 Sep 2010 Newsprint, directory paper 290 000
Maxau PM 7 Nov 2010 Newsprint 195 000
Hylte PM1 Dec 2012 Newsprint 180 000
Ostroleka PM2 Jan 2013 Containerboard 85 000
Hylte PM2 May 2013 Newsprint 205 000
Kvarnsveden PM11 May 2013 Newsprint 270 000
Veitsiluoto PM1 Apr 2014 Coated magazine 190 000
Corbehem MIll July 2014 LWC 330 000
Total 4 300 000
21 July 2015
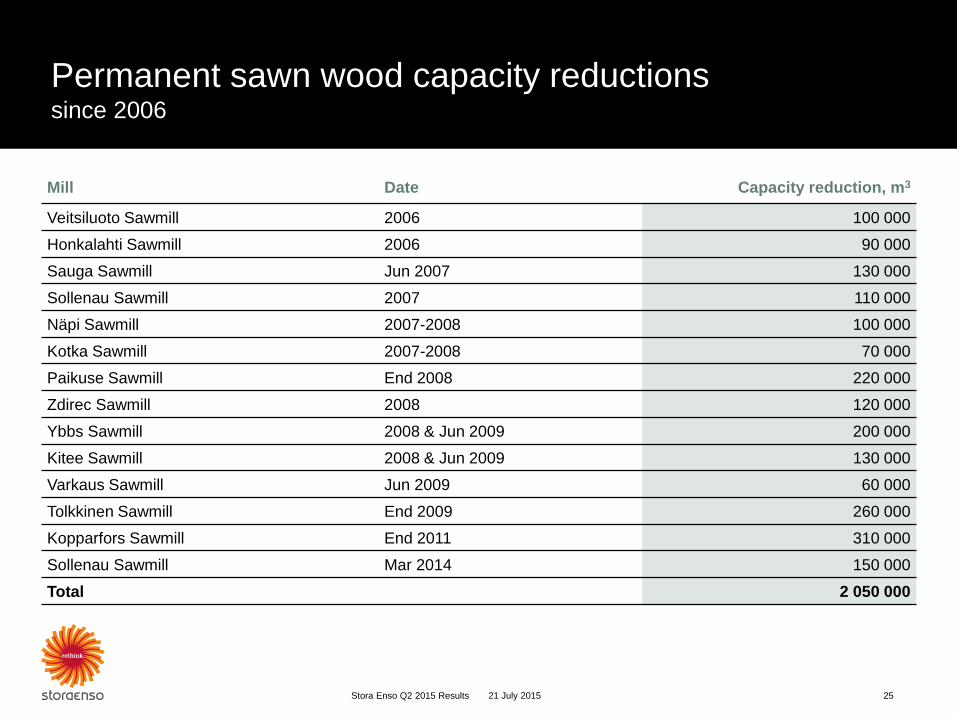
Permanent sawn wood capacity reductions since 2006
Stora Enso Q2 2015 Results 25
Mill Date Capacity reduction, m3
Veitsiluoto Sawmill 2006 100 000
Honkalahti Sawmill 2006 90 000
Sauga Sawmill Jun 2007 130 000
Sollenau Sawmill 2007 110 000
Näpi Sawmill 2007-2008 100 000
Kotka Sawmill 2007-2008 70 000
Paikuse Sawmill End 2008 220 000
Zdirec Sawmill 2008 120 000
Ybbs Sawmill 2008 & Jun 2009 200 000
Kitee Sawmill 2008 & Jun 2009 130 000
Varkaus Sawmill Jun 2009 60 000
Tolkkinen Sawmill End 2009 260 000
Kopparfors Sawmill End 2011 310 000
Sollenau Sawmill Mar 2014 150 000
Total 2 050 000
21 July 2015
Net Financial Items
21 July 2015 Stora Enso Q2 2015 Results 26
EUR million Q2/
2015
Q2/
2014
Change %
Q215/
Q214
Q1/
2015
Change %
Q215/
Q115
Net interest expense -47 -45 -4 -48 2
Foreign exchange gains and losses - 15 -100% 6 -100%
Other financial items. of which -19 -16 -19 -11 -73
Fair valuation of interest rate derivatives* 4 -9 -2
Fair valuation of long-term debt 1 - -1
Pension costs (IAS 19R) -2 -3 -2
Other items -22 -4 -6
Total net financial items -66 -46 -43 -53 -25
*Not hedge accounted interest rate derivatives.
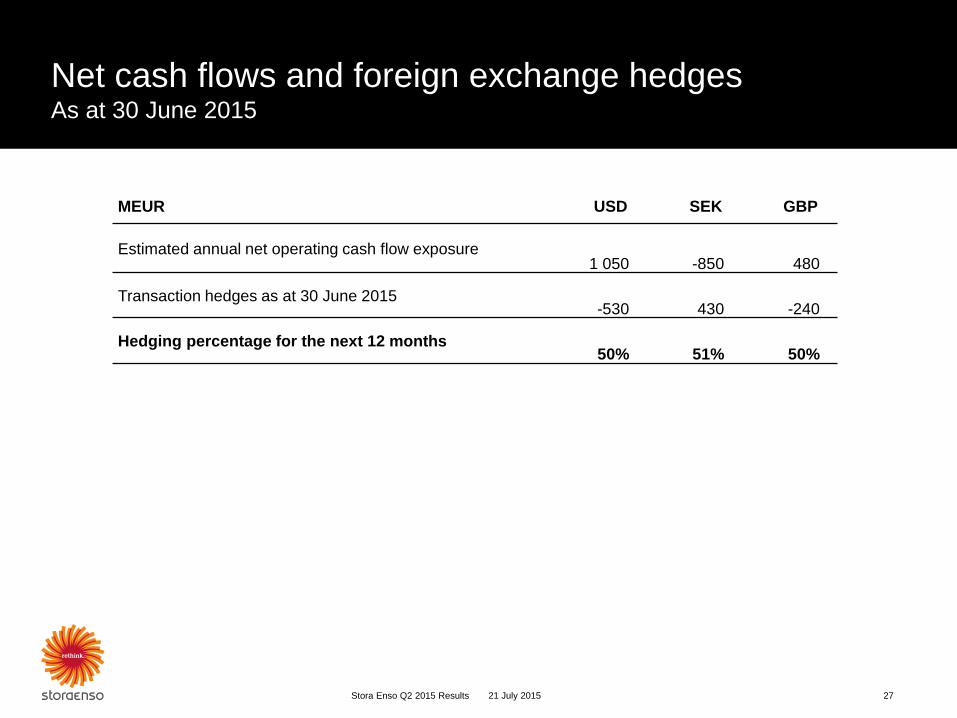
Net cash flows and foreign exchange hedges As at 30 June 2015
Stora Enso Q2 2015 Results 27 21 July 2015
MEUR USD SEK GBP
Estimated annual net operating cash flow exposure 1 050 -850 480
Transaction hedges as at 30 June 2015 -530 430 -240
Hedging percentage for the next 12 months 50% 51% 50%
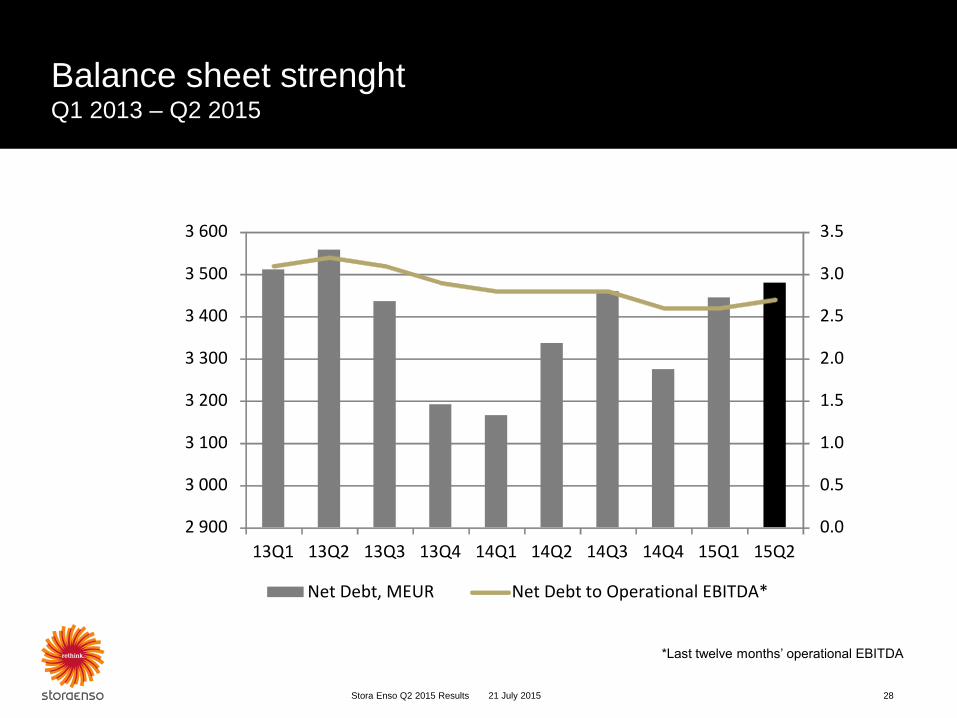
Balance sheet strenght Q1 2013 – Q2 2015
21 July 2015 Stora Enso Q2 2015 Results 28
0.0
0.5
1.0
1.5
2.0
2.5
3.0
3.5
2 900
3 000
3 100
3 200
3 300
3 400
3 500
3 600
13Q1 13Q2 13Q3 13Q4 14Q1 14Q2 14Q3 14Q4 15Q1 15Q2
Net Debt, MEUR Net Debt to Operational EBITDA*
*Last twelve months’ operational EBITDA
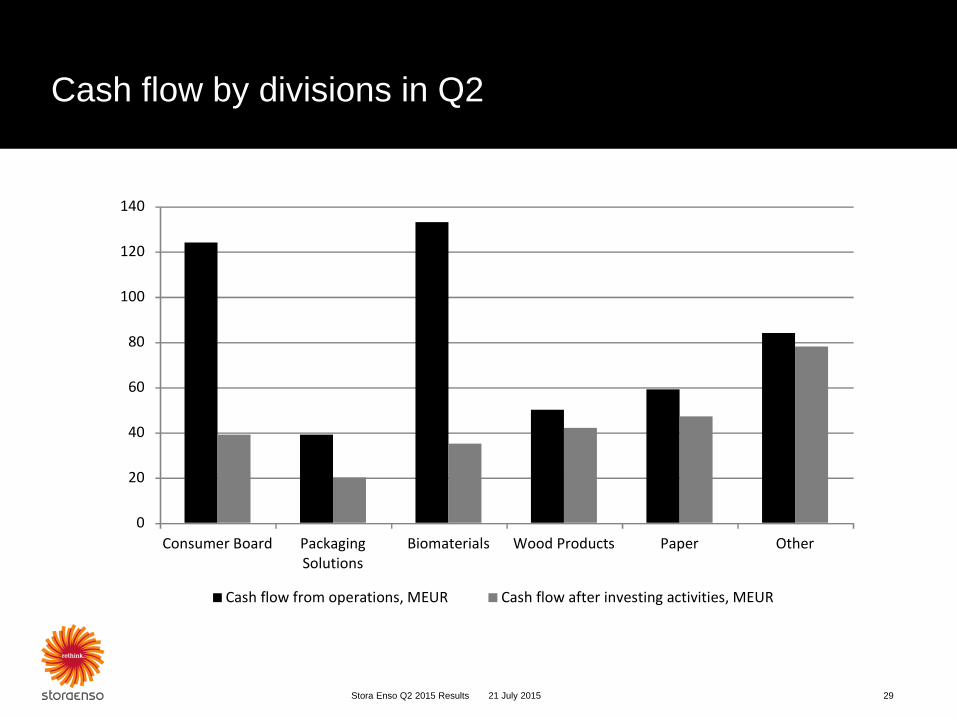
Cash flow by divisions in Q2
21 July 2015 Stora Enso Q2 2015 Results 29
0
20
40
60
80
100
120
140
Consumer Board PackagingSolutions
Biomaterials Wood Products Paper Other
Cash flow from operations, MEUR Cash flow after investing activities, MEUR
0
2
4
6
8
10
12
14
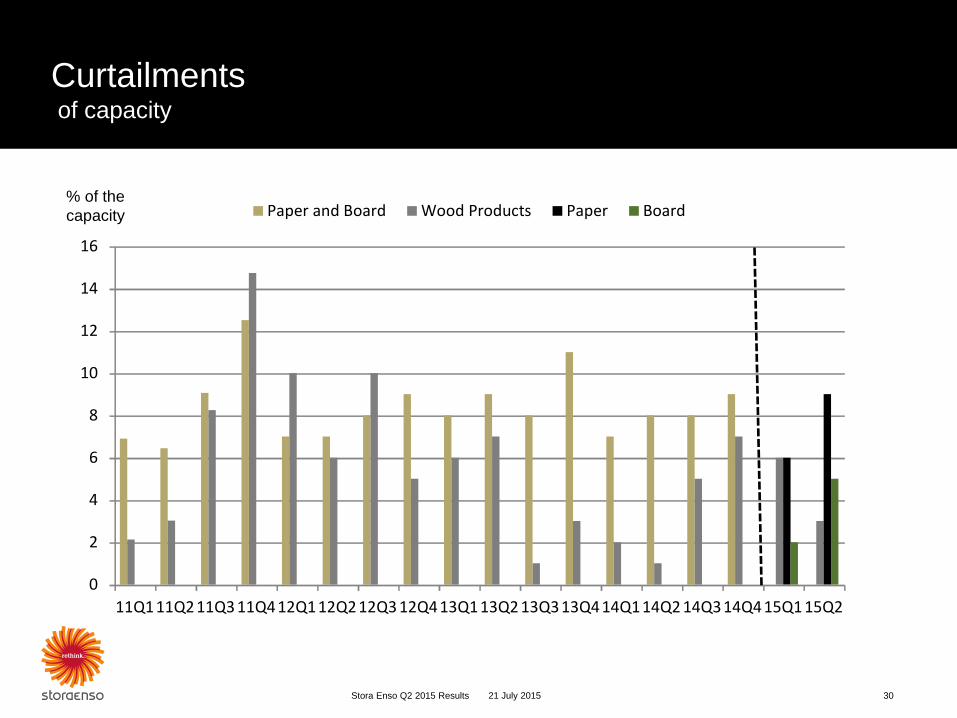
16
11Q111Q211Q3 11Q412Q112Q212Q3 12Q413Q113Q2 13Q313Q414Q114Q2 14Q314Q415Q1 15Q2
Paper and Board Wood Products Paper Board
Curtailments of capacity
30 Stora Enso Q2 2015 Results
% of the
capacity
21 July 2015
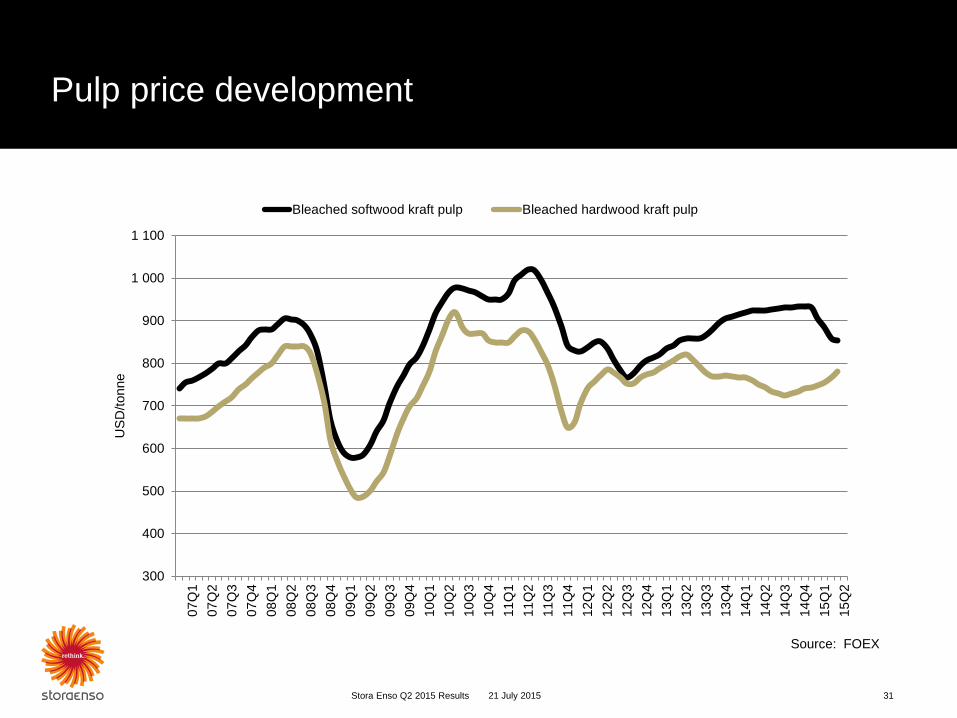
Pulp price development
Stora Enso Q2 2015 Results 31
Source: FOEX
21 July 2015
300
400
500
600
700
800
900
1 000
1 100
07
Q1
07
Q2
07
Q3
07
Q4
08
Q1
08
Q2
08
Q3
08
Q4
09
Q1
09
Q2
09
Q3
09
Q4
10
Q1
10
Q2
10
Q3
10
Q4
11
Q1
11
Q2
11
Q3
11
Q4
12
Q1
12
Q2
12
Q3
12
Q4
13
Q1
13
Q2
13
Q3
13
Q4
14
Q1
14
Q2
14
Q3
14
Q4
15
Q1
15
Q2
US
D/tonne
Bleached softwood kraft pulp Bleached hardwood kraft pulp
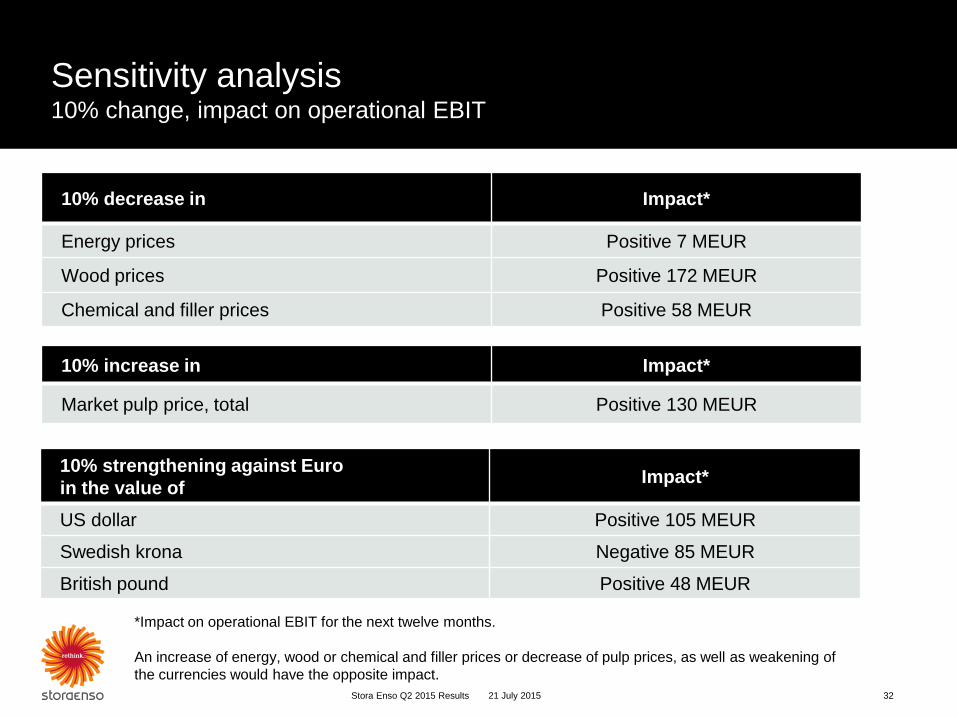
Sensitivity analysis 10% change, impact on operational EBIT
21 July 2015 Stora Enso Q2 2015 Results 32
10% increase in Impact*
Market pulp price, total Positive 130 MEUR
*Impact on operational EBIT for the next twelve months.
An increase of energy, wood or chemical and filler prices or decrease of pulp prices, as well as weakening of
the currencies would have the opposite impact.
10% decrease in Impact*
Energy prices Positive 7 MEUR
Wood prices Positive 172 MEUR
Chemical and filler prices Positive 58 MEUR
10% strengthening against Euro
in the value of Impact*
US dollar Positive 105 MEUR
Swedish krona Negative 85 MEUR
British pound Positive 48 MEUR
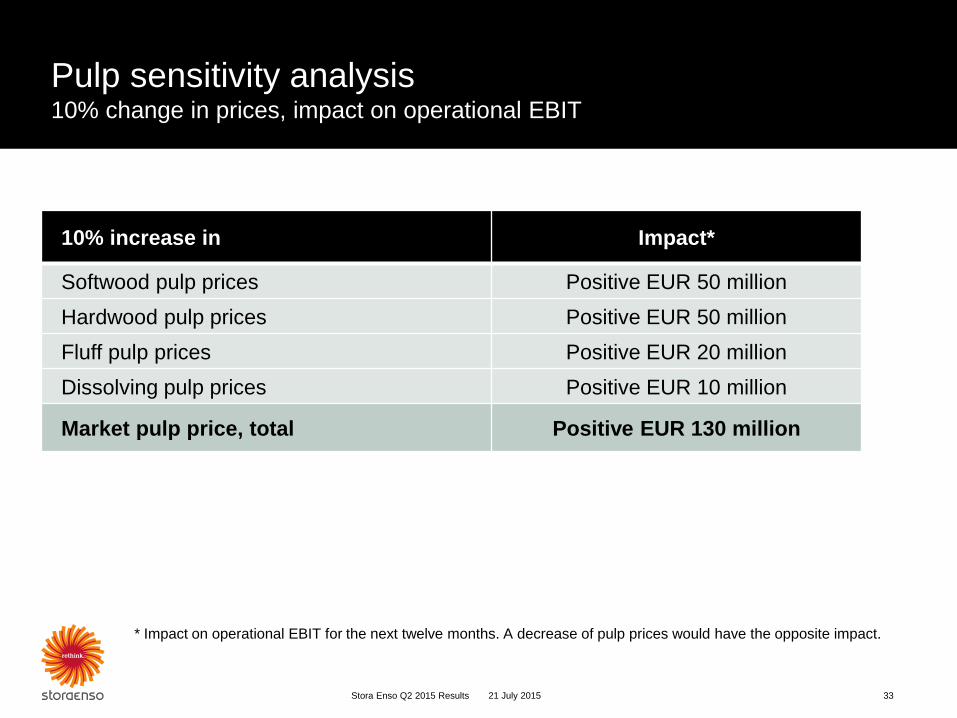
Pulp sensitivity analysis 10% change in prices, impact on operational EBIT
21 July 2015 Stora Enso Q2 2015 Results 33
10% increase in Impact*
Softwood pulp prices Positive EUR 50 million
Hardwood pulp prices Positive EUR 50 million
Fluff pulp prices Positive EUR 20 million
Dissolving pulp prices Positive EUR 10 million
Market pulp price, total Positive EUR 130 million
* Impact on operational EBIT for the next twelve months. A decrease of pulp prices would have the opposite impact.
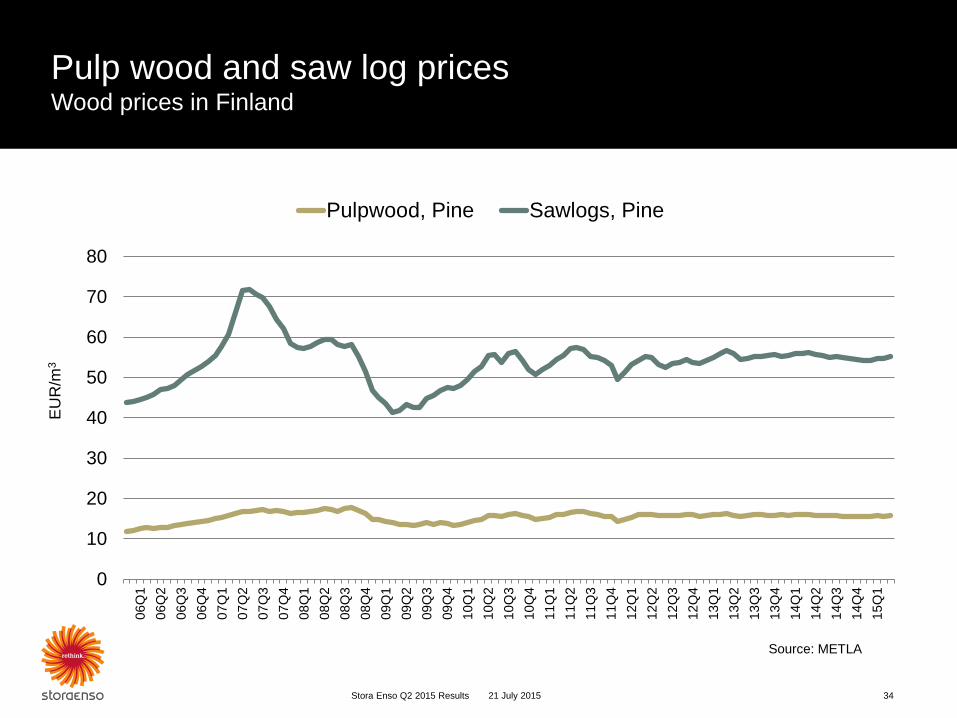
Pulp wood and saw log prices Wood prices in Finland
Source: METLA
34 Stora Enso Q2 2015 Results 21 July 2015
0
10
20
30
40
50
60
70
80
06
Q1
06
Q2
06
Q3
06
Q4
07
Q1
07
Q2
07
Q3
07
Q4
08
Q1
08
Q2
08
Q3
08
Q4
09
Q1
09
Q2
09
Q3
09
Q4
10
Q1
10
Q2
10
Q3
10
Q4
11
Q1
11
Q2
11
Q3
11
Q4
12
Q1
12
Q2
12
Q3
12
Q4
13
Q1
13
Q2
13
Q3
13
Q4
14
Q1
14
Q2
14
Q3
14
Q4
15
Q1
EU
R/m
3
Pulpwood, Pine Sawlogs, Pine
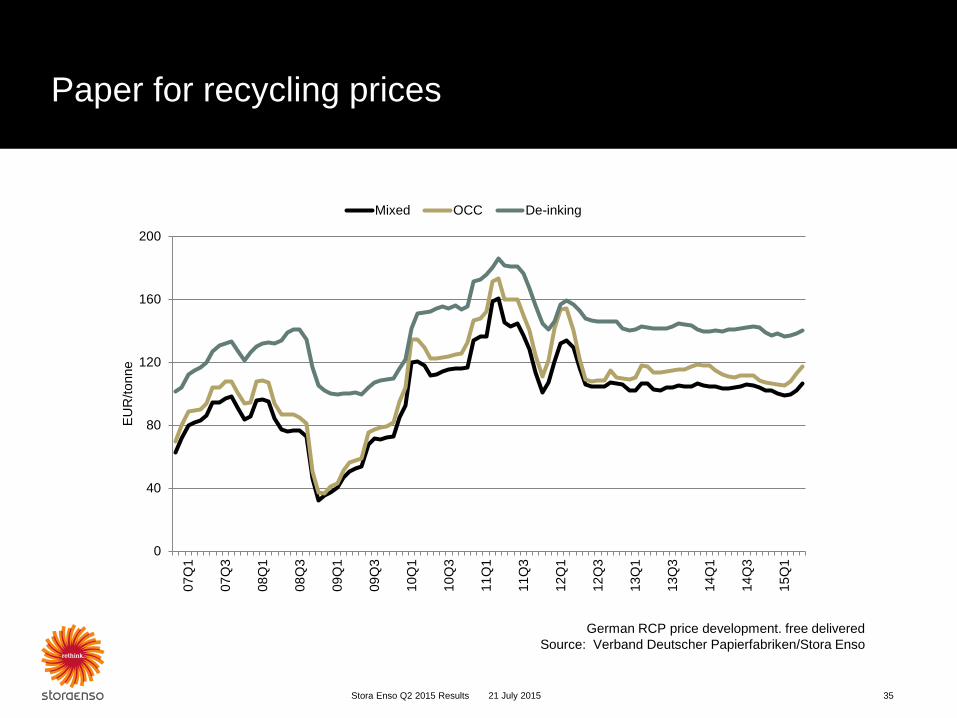
Paper for recycling prices
Stora Enso Q2 2015 Results 35
German RCP price development. free delivered
Source: Verband Deutscher Papierfabriken/Stora Enso
21 July 2015
0
40
80
120
160
200
07
Q1
07
Q3
08
Q1
08
Q3
09
Q1
09
Q3
10
Q1
10
Q3
11
Q1
11
Q3
12
Q1
12
Q3
13
Q1
13
Q3
14
Q1
14
Q3
15
Q1
EU
R/tonne
Mixed OCC De-inking
MEUR
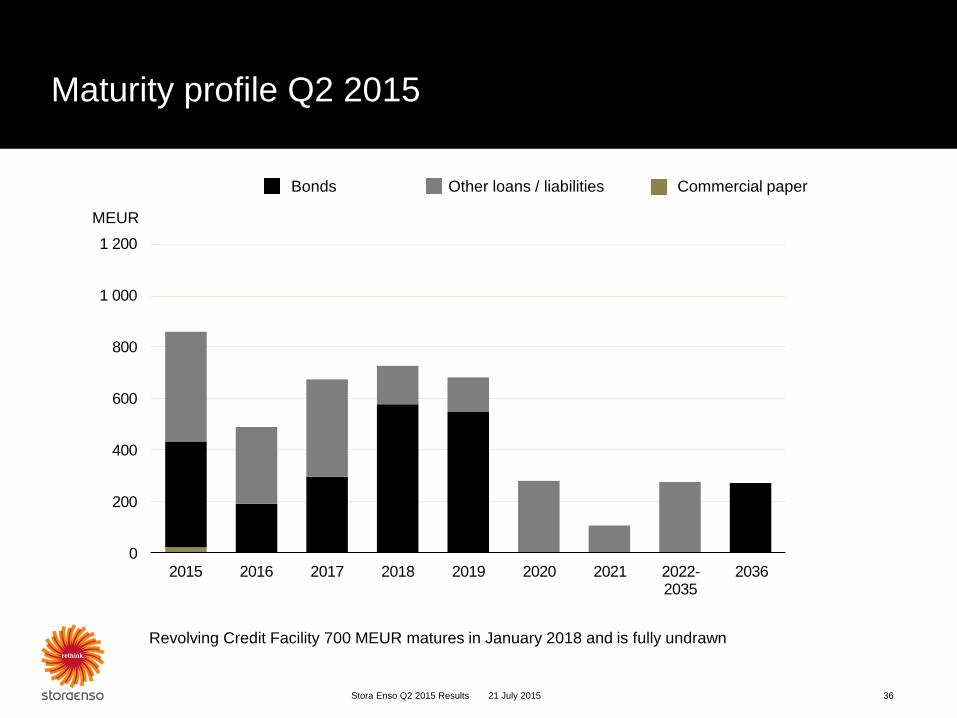
Other loans / liabilities Bonds Commercial paper
Revolving Credit Facility 700 MEUR matures in January 2018 and is fully undrawn
Maturity profile Q2 2015
21 July 2015 Stora Enso Q2 2015 Results 36
0
200
400
600
800
1 000
1 200
2015 2016 2017 2018 2019 2020 2021 2022-2035
2036
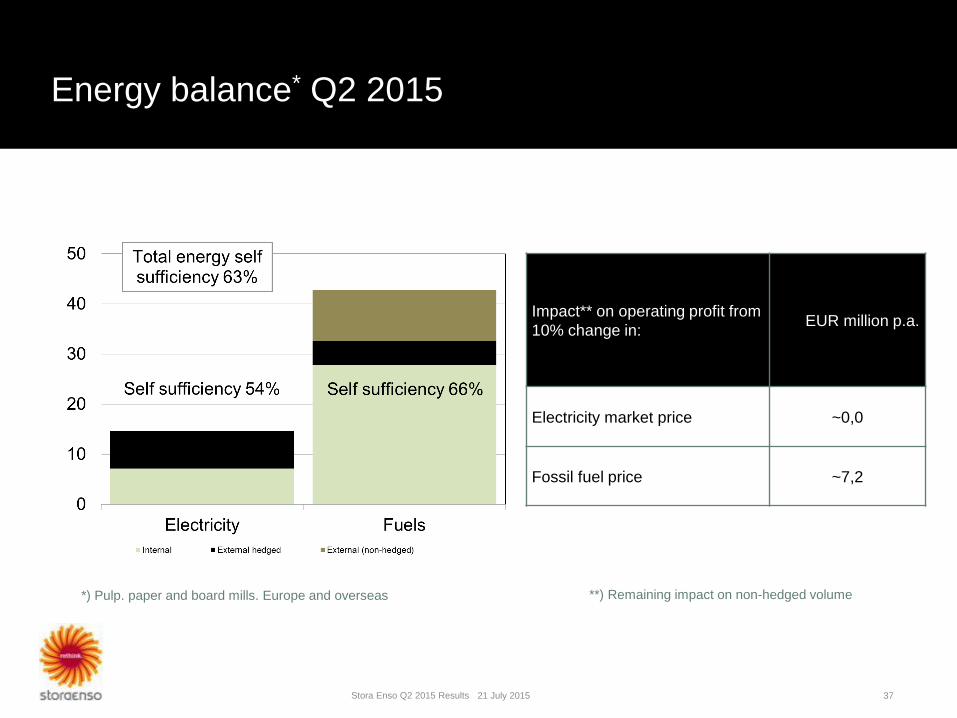
Energy balance* Q2 2015
**) Remaining impact on non-hedged volume
21 July 2015 Stora Enso Q2 2015 Results
*) Pulp. paper and board mills. Europe and overseas
Impact** on operating profit from
10% change in: EUR million p.a.
Electricity market price ~0,0
Fossil fuel price ~7,2
37
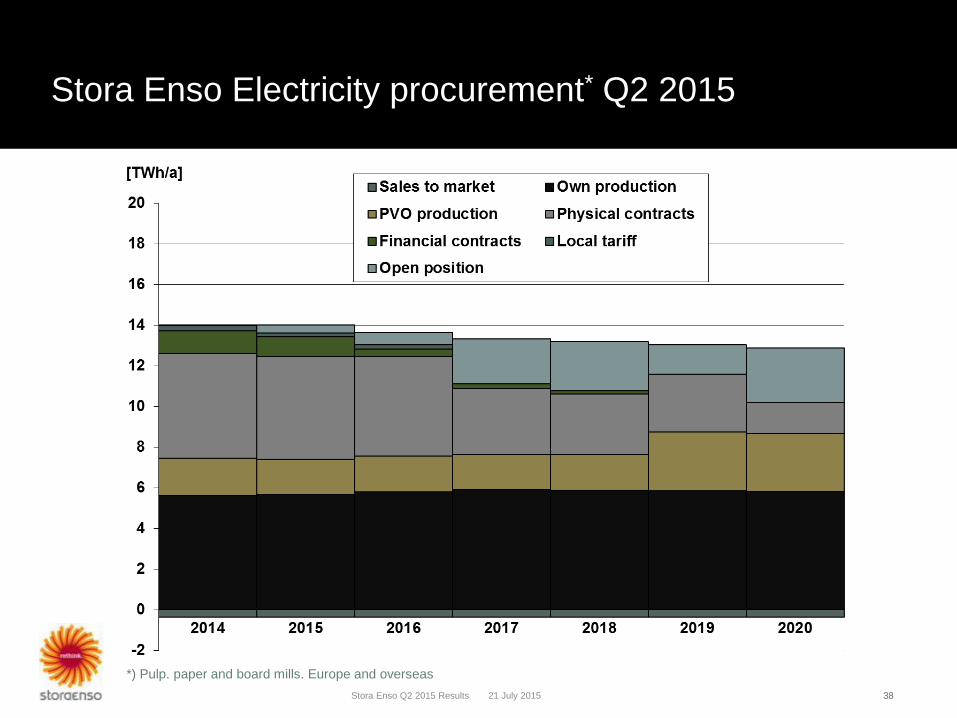
Stora Enso Electricity procurement* Q2 2015
21 July 2015 Stora Enso Q2 2015 Results
*) Pulp. paper and board mills. Europe and overseas
38 38
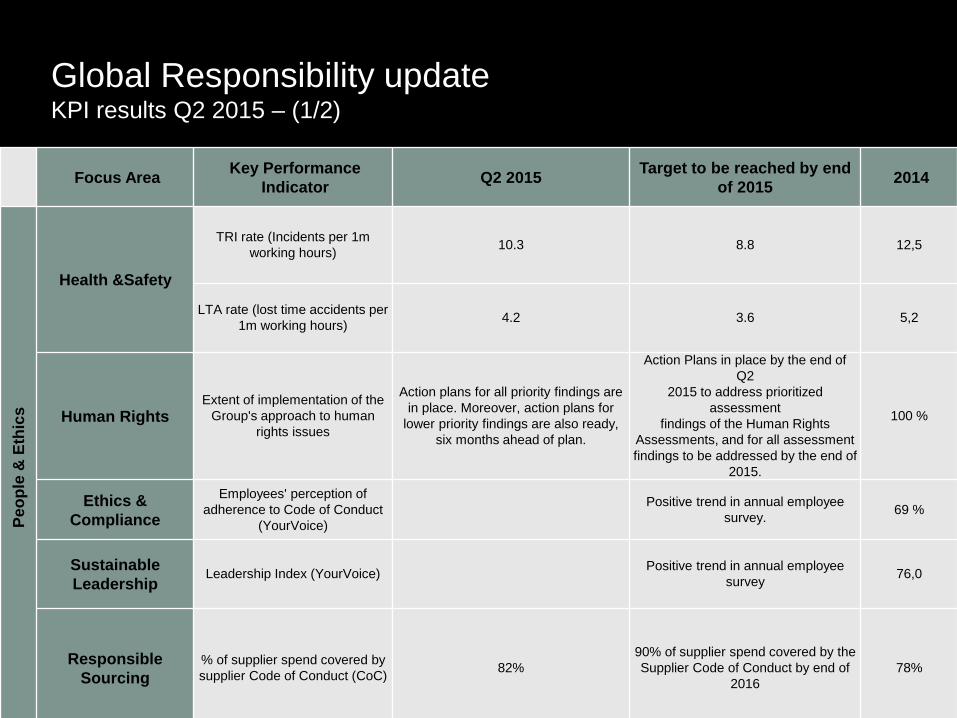
Global Responsibility update KPI results Q2 2015 – (1/2)
21 July 2015 Stora Enso Q2 2015 Results 39
Focus Area Key Performance
Indicator Q2 2015
Target to be reached by end
of 2015 2014
Pe
op
le &
Eth
ics
Health &Safety
TRI rate (Incidents per 1m
working hours) 10.3 8.8 12,5
LTA rate (lost time accidents per
1m working hours) 4.2 3.6 5,2
Human Rights Extent of implementation of the
Group's approach to human
rights issues
Action plans for all priority findings are
in place. Moreover, action plans for
lower priority findings are also ready,
six months ahead of plan.
Action Plans in place by the end of
Q2
2015 to address prioritized
assessment
findings of the Human Rights
Assessments, and for all assessment
findings to be addressed by the end of
2015.
100 %
Ethics &
Compliance
Employees' perception of
adherence to Code of Conduct
(YourVoice)
Positive trend in annual employee
survey. 69 %
Sustainable
Leadership Leadership Index (YourVoice)
Positive trend in annual employee
survey 76,0
Responsible
Sourcing
% of supplier spend covered by
supplier Code of Conduct (CoC) 82%
90% of supplier spend covered by the
Supplier Code of Conduct by end of
2016
78%
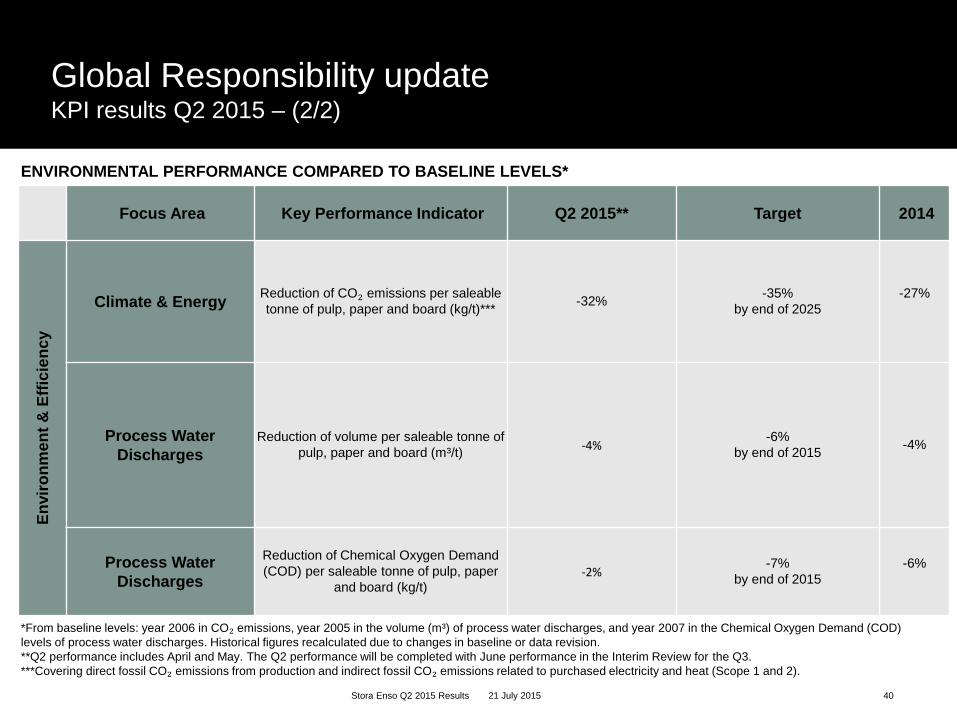
Global Responsibility update KPI results Q2 2015 – (2/2)
Focus Area Key Performance Indicator Q2 2015** Target 2014
En
vir
on
me
nt
& E
ffic
ien
cy
Climate & Energy Reduction of CO₂ emissions per saleable
tonne of pulp, paper and board (kg/t)*** -32%
-35%
by end of 2025
-27%
Process Water
Discharges Reduction of volume per saleable tonne of
pulp, paper and board (m³/t) -4%
-6%
by end of 2015 -4%
Process Water
Discharges
Reduction of Chemical Oxygen Demand
(COD) per saleable tonne of pulp, paper
and board (kg/t) -2%
-7%
by end of 2015
-6%
40
*From baseline levels: year 2006 in CO₂ emissions, year 2005 in the volume (m³) of process water discharges, and year 2007 in the Chemical Oxygen Demand (COD)
levels of process water discharges. Historical figures recalculated due to changes in baseline or data revision.
**Q2 performance includes April and May. The Q2 performance will be completed with June performance in the Interim Review for the Q3.
***Covering direct fossil CO₂ emissions from production and indirect fossil CO₂ emissions related to purchased electricity and heat (Scope 1 and 2).
ENVIRONMENTAL PERFORMANCE COMPARED TO BASELINE LEVELS*
21 July 2015 Stora Enso Q2 2015 Results