financial integration within eu countries: the role of ... · financial integration within eu...
TRANSCRIPT

Financial Integration within EU Countries:The Role of Institutions, Confidence, and Trust
Mehmet Fatih Ekinci1 Sebnem Kalemli-Ozcan2
Bent Sorensen3
ECB-CFS Symposium February 2008
1University of Rochester2University of Houston and NBER3University of Houston and CEPR

Introduction Model Data Methodology and Results Conclusion Appendices
Motivation
In an integrated capital market physical investmentshould flow to relatively productive places
Recent debate in the literature (based on country data)suggests limited financial integration:
ï Capital flows to lower productivity countriesï Capital flows to “uphill” from poor to rich countries

Introduction Model Data Methodology and Results Conclusion Appendices
Motivation
In an integrated capital market physical investmentshould flow to relatively productive placesRecent debate in the literature (based on country data)suggests limited financial integration:
ï Capital flows to lower productivity countriesï Capital flows to “uphill” from poor to rich countries

Introduction Model Data Methodology and Results Conclusion Appendices
Motivation
In an integrated capital market physical investmentshould flow to relatively productive placesRecent debate in the literature (based on country data)suggests limited financial integration:ï Capital flows to lower productivity countriesï Capital flows to “uphill” from poor to rich countries
Introduction Model Data Methodology and Results Conclusion Appendices
Therefore...
It is important to ask:
How much de-facto financial integration is there amongEU countries and EU regions—a de-jure integratedmarket
Introduction Model Data Methodology and Results Conclusion Appendices
What do we do?
Infer regional capital flows from the cross border incomeflows they generateï Approximate capital income by the difference between
OUTPUT (GDP) and INCOME (Personal Income) in a region
Construct an index of de-facto financial integrationbased on the relation between capital income flows andgrowth
ï A measure of diversification finance
Also ask: Does capital flow to rich or poor regions?
ï Is there any development finance?
Introduction Model Data Methodology and Results Conclusion Appendices
What do we do?
Infer regional capital flows from the cross border incomeflows they generateï Approximate capital income by the difference between
OUTPUT (GDP) and INCOME (Personal Income) in a region
Construct an index of de-facto financial integrationbased on the relation between capital income flows andgrowthï A measure of diversification finance
Also ask: Does capital flow to rich or poor regions?ï Is there any development finance?
Introduction Model Data Methodology and Results Conclusion Appendices
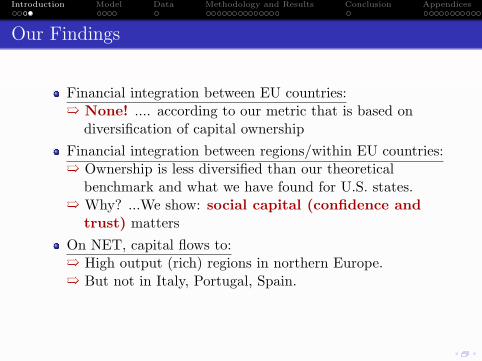
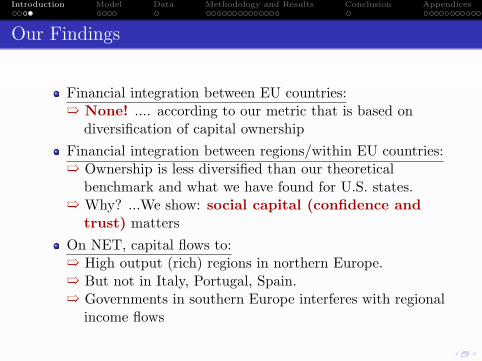
Our Findings
Financial integration between EU countries:
ï None! .... according to our metric that is based ondiversification of capital ownership
Financial integration between regions/within EU countries:
ï Ownership is less diversified than our theoreticalbenchmark and what we have found for U.S. states.
ï Why? ...We show: social capital (confidence andtrust) matters
On NET, capital flows to:
ï High output (rich) regions in northern Europe.ï But not in Italy, Portugal, Spain.ï Governments in southern Europe interferes with regional
income flows
Introduction Model Data Methodology and Results Conclusion Appendices
Our Findings
Financial integration between EU countries:ï None! .... according to our metric that is based on
diversification of capital ownership
Financial integration between regions/within EU countries:
ï Ownership is less diversified than our theoreticalbenchmark and what we have found for U.S. states.
ï Why? ...We show: social capital (confidence andtrust) matters
On NET, capital flows to:
ï High output (rich) regions in northern Europe.ï But not in Italy, Portugal, Spain.ï Governments in southern Europe interferes with regional
income flows
Introduction Model Data Methodology and Results Conclusion Appendices
Our Findings
Financial integration between EU countries:ï None! .... according to our metric that is based on
diversification of capital ownershipFinancial integration between regions/within EU countries:
ï Ownership is less diversified than our theoreticalbenchmark and what we have found for U.S. states.
ï Why? ...We show: social capital (confidence andtrust) matters
On NET, capital flows to:
ï High output (rich) regions in northern Europe.ï But not in Italy, Portugal, Spain.ï Governments in southern Europe interferes with regional
income flows
Introduction Model Data Methodology and Results Conclusion Appendices
Our Findings
Financial integration between EU countries:ï None! .... according to our metric that is based on
diversification of capital ownershipFinancial integration between regions/within EU countries:ï Ownership is less diversified than our theoretical
benchmark and what we have found for U.S. states.
ï Why? ...We show: social capital (confidence andtrust) matters
On NET, capital flows to:
ï High output (rich) regions in northern Europe.ï But not in Italy, Portugal, Spain.ï Governments in southern Europe interferes with regional
income flows

Introduction Model Data Methodology and Results Conclusion Appendices
Our Findings
Financial integration between EU countries:ï None! .... according to our metric that is based on
diversification of capital ownershipFinancial integration between regions/within EU countries:ï Ownership is less diversified than our theoretical
benchmark and what we have found for U.S. states.ï Why? ...We show: social capital (confidence and
trust) matters
On NET, capital flows to:
ï High output (rich) regions in northern Europe.ï But not in Italy, Portugal, Spain.ï Governments in southern Europe interferes with regional
income flows
Introduction Model Data Methodology and Results Conclusion Appendices
Our Findings
Financial integration between EU countries:ï None! .... according to our metric that is based on
diversification of capital ownershipFinancial integration between regions/within EU countries:ï Ownership is less diversified than our theoretical
benchmark and what we have found for U.S. states.ï Why? ...We show: social capital (confidence and
trust) mattersOn NET, capital flows to:
ï High output (rich) regions in northern Europe.ï But not in Italy, Portugal, Spain.ï Governments in southern Europe interferes with regional
income flows
Introduction Model Data Methodology and Results Conclusion Appendices
Our Findings
Financial integration between EU countries:ï None! .... according to our metric that is based on
diversification of capital ownershipFinancial integration between regions/within EU countries:ï Ownership is less diversified than our theoretical
benchmark and what we have found for U.S. states.ï Why? ...We show: social capital (confidence and
trust) mattersOn NET, capital flows to:ï High output (rich) regions in northern Europe.
ï But not in Italy, Portugal, Spain.ï Governments in southern Europe interferes with regional
income flows
Introduction Model Data Methodology and Results Conclusion Appendices
Our Findings
Financial integration between EU countries:ï None! .... according to our metric that is based on
diversification of capital ownershipFinancial integration between regions/within EU countries:ï Ownership is less diversified than our theoretical
benchmark and what we have found for U.S. states.ï Why? ...We show: social capital (confidence and
trust) mattersOn NET, capital flows to:ï High output (rich) regions in northern Europe.ï But not in Italy, Portugal, Spain.
ï Governments in southern Europe interferes with regionalincome flows
Introduction Model Data Methodology and Results Conclusion Appendices
Our Findings
Financial integration between EU countries:ï None! .... according to our metric that is based on
diversification of capital ownershipFinancial integration between regions/within EU countries:ï Ownership is less diversified than our theoretical
benchmark and what we have found for U.S. states.ï Why? ...We show: social capital (confidence and
trust) mattersOn NET, capital flows to:ï High output (rich) regions in northern Europe.ï But not in Italy, Portugal, Spain.ï Governments in southern Europe interferes with regional
income flows

Introduction Model Data Methodology and Results Conclusion Appendices
A Stylized Framework: Assumptions
Standard production technology, constant savings rate
Total Factor Productivity (TFP) different in eachregion—varies over timeï Not too fast (persistent TFP shocks)ï Broad interpretation of TFP (taxes, endowments,
agglomeration benefits, ...)
Physical capital moves “instantly” (empirically 5-10 yearaverages; to avoid issues of adjustment of capital, businesscycles, etc..)Labor moves “slowly” (random movements of people notimportant)Capital ownership: fully diversifiedLabor income: not diversified

Introduction Model Data Methodology and Results Conclusion Appendices
A Stylized Framework: Assumptions
Standard production technology, constant savings rateTotal Factor Productivity (TFP) different in eachregion—varies over timeï Not too fast (persistent TFP shocks)ï Broad interpretation of TFP (taxes, endowments,
agglomeration benefits, ...)
Physical capital moves “instantly” (empirically 5-10 yearaverages; to avoid issues of adjustment of capital, businesscycles, etc..)Labor moves “slowly” (random movements of people notimportant)
Capital ownership: fully diversifiedLabor income: not diversified

Introduction Model Data Methodology and Results Conclusion Appendices
A Stylized Framework: Assumptions
Standard production technology, constant savings rateTotal Factor Productivity (TFP) different in eachregion—varies over timeï Not too fast (persistent TFP shocks)ï Broad interpretation of TFP (taxes, endowments,
agglomeration benefits, ...)
Physical capital moves “instantly” (empirically 5-10 yearaverages; to avoid issues of adjustment of capital, businesscycles, etc..)Labor moves “slowly” (random movements of people notimportant)Capital ownership: fully diversifiedLabor income: not diversified
Introduction Model Data Methodology and Results Conclusion Appendices
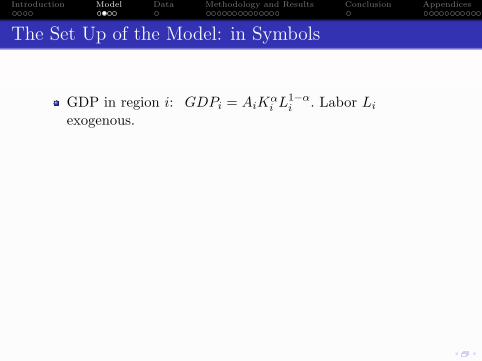
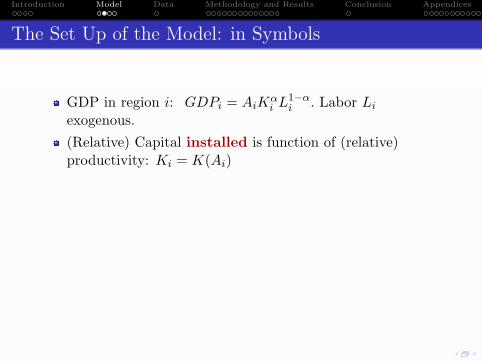
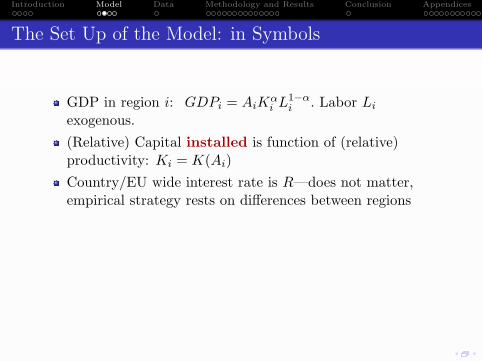
The Set Up of the Model: in Symbols
GDP in region i: GDPi = AiKαi L
1−αi . Labor Li
exogenous.
(Relative) Capital installed is function of (relative)productivity: Ki = K(Ai)Country/EU wide interest rate is R—does not matter,empirical strategy rests on differences between regionsFor given R, Ai, and Li, capital installed in region i isdetermined by the equilibrium,MPK = R = αAiK
α−1i L1−α
i , ∀i,Capital owned by region i is φiK where K is aggregatecapital, K = ΣiKi
Introduction Model Data Methodology and Results Conclusion Appendices
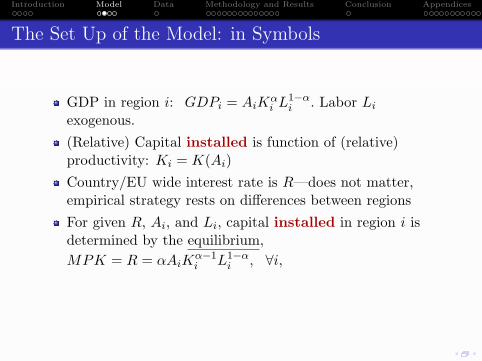
The Set Up of the Model: in Symbols
GDP in region i: GDPi = AiKαi L
1−αi . Labor Li
exogenous.(Relative) Capital installed is function of (relative)productivity: Ki = K(Ai)
Country/EU wide interest rate is R—does not matter,empirical strategy rests on differences between regionsFor given R, Ai, and Li, capital installed in region i isdetermined by the equilibrium,MPK = R = αAiK
α−1i L1−α
i , ∀i,Capital owned by region i is φiK where K is aggregatecapital, K = ΣiKi
Introduction Model Data Methodology and Results Conclusion Appendices
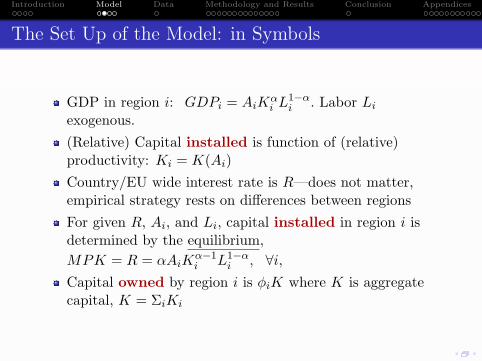
The Set Up of the Model: in Symbols
GDP in region i: GDPi = AiKαi L
1−αi . Labor Li
exogenous.(Relative) Capital installed is function of (relative)productivity: Ki = K(Ai)Country/EU wide interest rate is R—does not matter,empirical strategy rests on differences between regions
For given R, Ai, and Li, capital installed in region i isdetermined by the equilibrium,MPK = R = αAiK
α−1i L1−α
i , ∀i,Capital owned by region i is φiK where K is aggregatecapital, K = ΣiKi
Introduction Model Data Methodology and Results Conclusion Appendices
The Set Up of the Model: in Symbols
GDP in region i: GDPi = AiKαi L
1−αi . Labor Li
exogenous.(Relative) Capital installed is function of (relative)productivity: Ki = K(Ai)Country/EU wide interest rate is R—does not matter,empirical strategy rests on differences between regionsFor given R, Ai, and Li, capital installed in region i isdetermined by the equilibrium,MPK = R = αAiK
α−1i L1−α
i , ∀i,
Capital owned by region i is φiK where K is aggregatecapital, K = ΣiKi
Introduction Model Data Methodology and Results Conclusion Appendices
The Set Up of the Model: in Symbols
GDP in region i: GDPi = AiKαi L
1−αi . Labor Li
exogenous.(Relative) Capital installed is function of (relative)productivity: Ki = K(Ai)Country/EU wide interest rate is R—does not matter,empirical strategy rests on differences between regionsFor given R, Ai, and Li, capital installed in region i isdetermined by the equilibrium,MPK = R = αAiK
α−1i L1−α
i , ∀i,Capital owned by region i is φiK where K is aggregatecapital, K = ΣiKi
Introduction Model Data Methodology and Results Conclusion Appendices
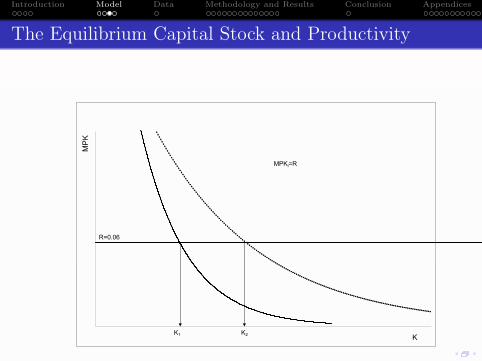
The Equilibrium Capital Stock and Productivity
K
MP
K
MPKi=R
K1 K2
R=0.06

Introduction Model Data Methodology and Results Conclusion Appendices
The Rest of the Model: in Words
If capital ownership is geographically diversifiedregional jumps in output and in capital income: separated
For small regions: all capital income should come fromother regions and all capital income generated should go toother regionsSince 30% of output goes to capital, a (small) region thatsees an output growth of 100 million euros should send 30million euros to other regionsif its capital ownership is perfectly diversified.
ï Thus, the change in income following growth (keepingoutput of other regions constant) should be 0.7 timesthe output shock
ï A test of this prediction gives us an index of “ deep”financial integration
Introduction Model Data Methodology and Results Conclusion Appendices
The Rest of the Model: in Words
If capital ownership is geographically diversifiedregional jumps in output and in capital income: separatedFor small regions: all capital income should come fromother regions and all capital income generated should go toother regions
Since 30% of output goes to capital, a (small) region thatsees an output growth of 100 million euros should send 30million euros to other regionsif its capital ownership is perfectly diversified.
ï Thus, the change in income following growth (keepingoutput of other regions constant) should be 0.7 timesthe output shock
ï A test of this prediction gives us an index of “ deep”financial integration
Introduction Model Data Methodology and Results Conclusion Appendices
The Rest of the Model: in Words
If capital ownership is geographically diversifiedregional jumps in output and in capital income: separatedFor small regions: all capital income should come fromother regions and all capital income generated should go toother regionsSince 30% of output goes to capital, a (small) region thatsees an output growth of 100 million euros should send 30million euros to other regionsif its capital ownership is perfectly diversified.
ï Thus, the change in income following growth (keepingoutput of other regions constant) should be 0.7 timesthe output shock
ï A test of this prediction gives us an index of “ deep”financial integration
Introduction Model Data Methodology and Results Conclusion Appendices
The Rest of the Model: in Words
If capital ownership is geographically diversifiedregional jumps in output and in capital income: separatedFor small regions: all capital income should come fromother regions and all capital income generated should go toother regionsSince 30% of output goes to capital, a (small) region thatsees an output growth of 100 million euros should send 30million euros to other regionsif its capital ownership is perfectly diversified.ï Thus, the change in income following growth (keeping
output of other regions constant) should be 0.7 timesthe output shock
ï A test of this prediction gives us an index of “ deep”financial integration
Introduction Model Data Methodology and Results Conclusion Appendices
Regional Accounts Data from EuroStat
Output—regional GDP
Income—primary income
ï Also use primary income plus transfers and minus taxes
We normalize the ratio to have average 1 across our sampleWe use NUTS2 regions of:Belgium, Germany, Spain, France, Italy, the Netherlands,Austria, Portugal, Sweden, the UK
ï Greece is an outlierï Other countries do not have more than one NUTS2 region (or
no data at all)
Introduction Model Data Methodology and Results Conclusion Appendices
Regional Accounts Data from EuroStat
Output—regional GDPIncome—primary income
ï Also use primary income plus transfers and minus taxes
We normalize the ratio to have average 1 across our sampleWe use NUTS2 regions of:Belgium, Germany, Spain, France, Italy, the Netherlands,Austria, Portugal, Sweden, the UK
ï Greece is an outlierï Other countries do not have more than one NUTS2 region (or
no data at all)
Introduction Model Data Methodology and Results Conclusion Appendices
Regional Accounts Data from EuroStat
Output—regional GDPIncome—primary incomeï Also use primary income plus transfers and minus taxes
We normalize the ratio to have average 1 across our sample
We use NUTS2 regions of:Belgium, Germany, Spain, France, Italy, the Netherlands,Austria, Portugal, Sweden, the UK
ï Greece is an outlierï Other countries do not have more than one NUTS2 region (or
no data at all)
Introduction Model Data Methodology and Results Conclusion Appendices
Regional Accounts Data from EuroStat
Output—regional GDPIncome—primary incomeï Also use primary income plus transfers and minus taxes
We normalize the ratio to have average 1 across our sampleWe use NUTS2 regions of:
Belgium, Germany, Spain, France, Italy, the Netherlands,Austria, Portugal, Sweden, the UK
ï Greece is an outlierï Other countries do not have more than one NUTS2 region (or
no data at all)
Introduction Model Data Methodology and Results Conclusion Appendices
Regional Accounts Data from EuroStat
Output—regional GDPIncome—primary incomeï Also use primary income plus transfers and minus taxes
We normalize the ratio to have average 1 across our sampleWe use NUTS2 regions of:Belgium, Germany, Spain, France, Italy, the Netherlands,Austria, Portugal, Sweden, the UK
ï Greece is an outlierï Other countries do not have more than one NUTS2 region (or
no data at all)
Introduction Model Data Methodology and Results Conclusion Appendices
Regional Accounts Data from EuroStat
Output—regional GDPIncome—primary incomeï Also use primary income plus transfers and minus taxes
We normalize the ratio to have average 1 across our sampleWe use NUTS2 regions of:Belgium, Germany, Spain, France, Italy, the Netherlands,Austria, Portugal, Sweden, the UKï Greece is an outlierï Other countries do not have more than one NUTS2 region (or
no data at all)
Introduction Model Data Methodology and Results Conclusion Appendices
Are Countries and Regions within EU fully integrated?
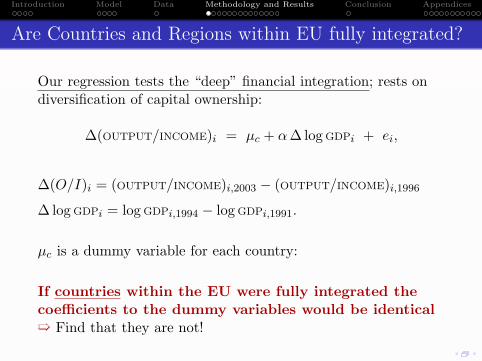
Our regression tests the “deep” financial integration; rests ondiversification of capital ownership:
∆(OUTPUT/INCOME)i = µc + α∆ log GDPi + ei,
∆(O/I)i = (OUTPUT/INCOME)i,2003 − (OUTPUT/INCOME)i,1996
∆ log GDPi = log GDPi,1994 − log GDPi,1991.
µc is a dummy variable for each country:
If countries within the EU were fully integrated thecoefficients to the dummy variables would be identicalï Find that they are not!
Introduction Model Data Methodology and Results Conclusion Appendices
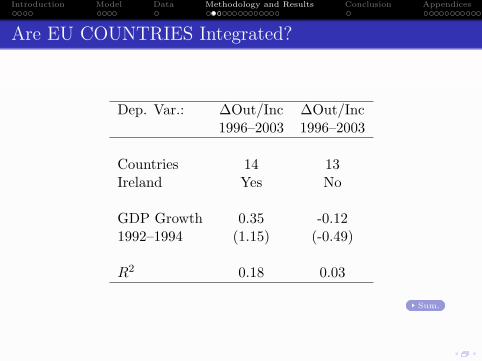
Are EU COUNTRIES Integrated?
Dep. Var.: ∆Out/Inc ∆Out/Inc1996–2003 1996–2003
Countries 14 13Ireland Yes No
GDP Growth 0.35 -0.121992–1994 (1.15) (-0.49)
R2 0.18 0.03
Sum.

Introduction Model Data Methodology and Results Conclusion Appendices
Countries
FindingEU Countries are not integrated in the sense that ownership ofphysical capital is not diversified—with the exception of Ireland.
Introduction Model Data Methodology and Results Conclusion Appendices
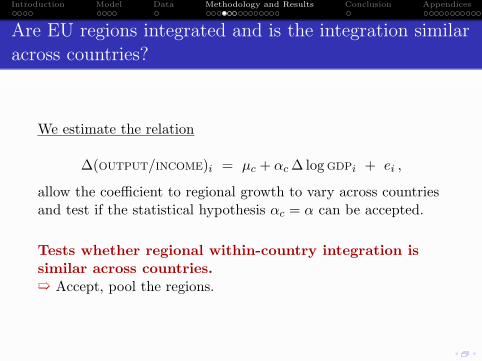
Are EU regions integrated and is the integration similaracross countries?
We estimate the relation
∆(OUTPUT/INCOME)i = µc + αc ∆ log GDPi + ei ,
allow the coefficient to regional growth to vary across countriesand test if the statistical hypothesis αc = α can be accepted.
Tests whether regional within-country integration issimilar across countries.ï Accept, pool the regions.
Introduction Model Data Methodology and Results Conclusion Appendices
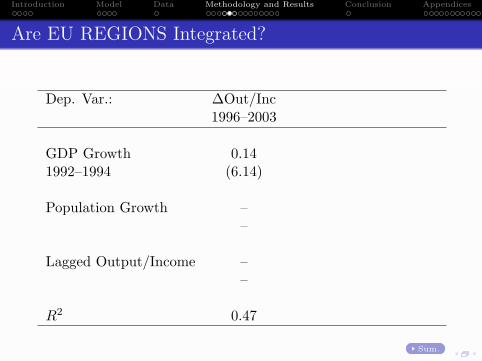
Are EU REGIONS Integrated?
Dep. Var.: ∆Out/Inc
∆Out/Inc ∆Out/Inc
1996–2003
1996–2003 1996–2003
GDP Growth 0.14
0.11 0.07
1992–1994 (6.14)
(2.66) (1.57)
Population Growth –
-0.33 -0.49
–
(-1.32) (-1.73)
Lagged Output/Income –
– -0.07
–
– (-1.43)
R2 0.47
0.47 0.49
Sum.

Introduction Model Data Methodology and Results Conclusion Appendices
Are EU REGIONS Integrated?
Dep. Var.: ∆Out/Inc ∆Out/Inc
∆Out/Inc
1996–2003 1996–2003
1996–2003
GDP Growth 0.14 0.11
0.07
1992–1994 (6.14) (2.66)
(1.57)
Population Growth – -0.33
-0.49
– (-1.32)
(-1.73)
Lagged Output/Income – –
-0.07
– –
(-1.43)
R2 0.47 0.47
0.49
Sum.
Introduction Model Data Methodology and Results Conclusion Appendices
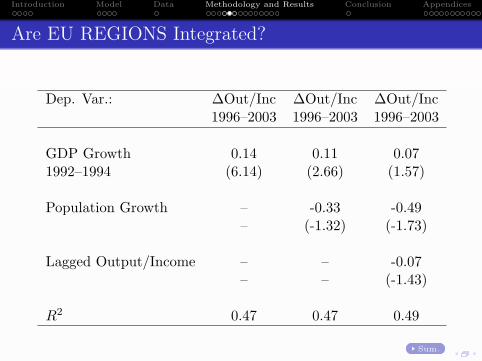
Are EU REGIONS Integrated?
Dep. Var.: ∆Out/Inc ∆Out/Inc ∆Out/Inc1996–2003 1996–2003 1996–2003
GDP Growth 0.14 0.11 0.071992–1994 (6.14) (2.66) (1.57)
Population Growth – -0.33 -0.49– (-1.32) (-1.73)
Lagged Output/Income – – -0.07– – (-1.43)
R2 0.47 0.47 0.49
Sum.
Introduction Model Data Methodology and Results Conclusion Appendices
Regions
Finding
Regions within EU Countries are somewhat integrated (the sizeof the coefficient is half of what it should be; For U.S states theestimated coefficient has the right size).
Introduction Model Data Methodology and Results Conclusion Appendices
Why?
Usual suspect country-wide financial institutions: rejectedby the data
We can compare regions—isolating country-wide legal andfinancial systems—to find outTake our cue from the recent literature (Guiso, Sapiensa,Zingales): social capital has a large effect of peopleswillingness to use financial assets.
ï Our data allows us to examine if financial integrationdepends on indicators of social capital.
Introduction Model Data Methodology and Results Conclusion Appendices
Why?
Usual suspect country-wide financial institutions: rejectedby the dataWe can compare regions—isolating country-wide legal andfinancial systems—to find out
Take our cue from the recent literature (Guiso, Sapiensa,Zingales): social capital has a large effect of peopleswillingness to use financial assets.
ï Our data allows us to examine if financial integrationdepends on indicators of social capital.
Introduction Model Data Methodology and Results Conclusion Appendices
Why?
Usual suspect country-wide financial institutions: rejectedby the dataWe can compare regions—isolating country-wide legal andfinancial systems—to find outTake our cue from the recent literature (Guiso, Sapiensa,Zingales): social capital has a large effect of peopleswillingness to use financial assets.
ï Our data allows us to examine if financial integrationdepends on indicators of social capital.
Introduction Model Data Methodology and Results Conclusion Appendices
Why?
Usual suspect country-wide financial institutions: rejectedby the dataWe can compare regions—isolating country-wide legal andfinancial systems—to find outTake our cue from the recent literature (Guiso, Sapiensa,Zingales): social capital has a large effect of peopleswillingness to use financial assets.ï Our data allows us to examine if financial integration
depends on indicators of social capital.

Introduction Model Data Methodology and Results Conclusion Appendices
Individual Level Data
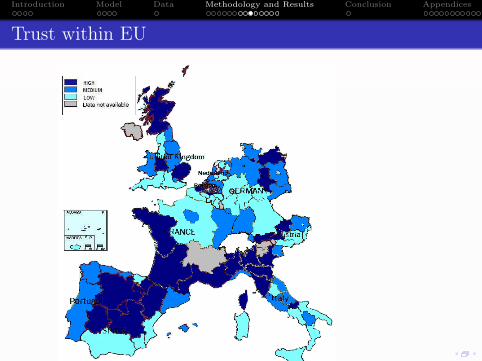
Survey questions from World Value Survey:Trust: 2 questions:ï “Most people can be trusted,” “Trust other people in
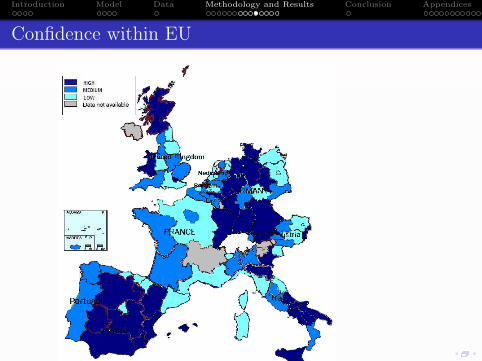
the country?”Confidence: 13 questions:ï in armed forces; education system; press; labor unions;
police; parliament; civil service; social security system;major companies; justice system; EU; NATO
Introduction Model Data Methodology and Results Conclusion Appendices
Trust within EU
Introduction Model Data Methodology and Results Conclusion Appendices
Confidence within EU
Introduction Model Data Methodology and Results Conclusion Appendices
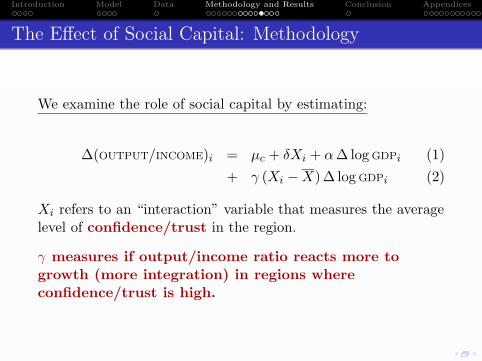
The Effect of Social Capital: Methodology
We examine the role of social capital by estimating:
∆(OUTPUT/INCOME)i = µc + δXi + α∆ log GDPi (1)+ γ (Xi −X) ∆ log GDPi (2)
Xi refers to an “interaction” variable that measures the averagelevel of confidence/trust in the region.
γ measures if output/income ratio reacts more togrowth (more integration) in regions whereconfidence/trust is high.
Introduction Model Data Methodology and Results Conclusion Appendices
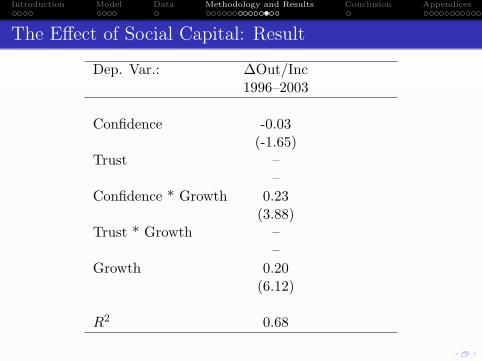
The Effect of Social Capital: Result
Dep. Var.: ∆Out/Inc
∆Out/Inc
1996–2003
1996–2003
Confidence -0.03
–
(-1.65)
–
Trust –
0.00
–
(0.66)
Confidence * Growth 0.23
–
(3.88)
–
Trust * Growth –
0.18
–
(1.88)
Growth 0.20
0.12
(6.12)
(5.21)
R2 0.68
0.64
Introduction Model Data Methodology and Results Conclusion Appendices
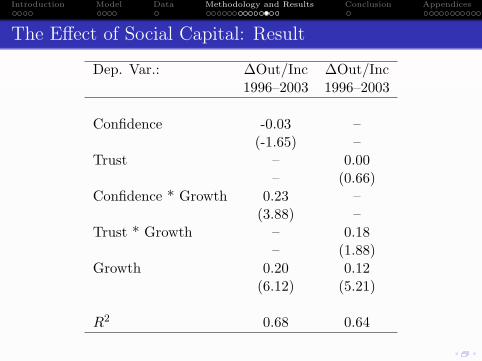
The Effect of Social Capital: Result
Dep. Var.: ∆Out/Inc ∆Out/Inc1996–2003 1996–2003
Confidence -0.03 –(-1.65) –
Trust – 0.00– (0.66)
Confidence * Growth 0.23 –(3.88) –
Trust * Growth – 0.18– (1.88)
Growth 0.20 0.12(6.12) (5.21)
R2 0.68 0.64
Introduction Model Data Methodology and Results Conclusion Appendices
The Effect of Social Capital
FindingRegions within EU Countries where agents have confidence ininstitutions and trust each other are financially more integrated.
Introduction Model Data Methodology and Results Conclusion Appendices
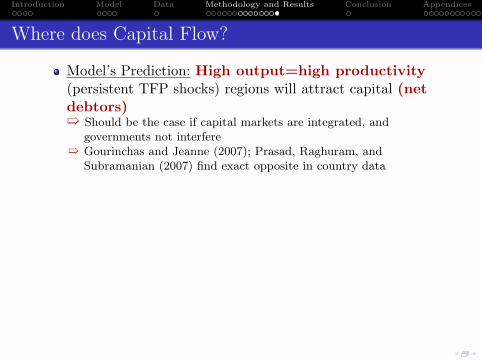
Where does Capital Flow?
Model’s Prediction: High output=high productivity(persistent TFP shocks) regions will attract capital (netdebtors)ï Should be the case if capital markets are integrated, and
governments not interfereï Gourinchas and Jeanne (2007); Prasad, Raghuram, and
Subramanian (2007) find exact opposite in country data
Alternative Story: Catch-up growth: high output regionshad positive productivity shocks and converged; low outputregions attract capital due to productivity catch-up
ï Blanchard and Givazzi (2005); Abiad, Leigh, and Mody (2007)
finds in favor of this for EU countries
We find:
ï Capital flows to rich regions in Northern Europe: integratedmarkets
ï No relation between output and flows in Southern Europe: notintegrated markets or government direct income flows
ï Strong redistribution to mining/agricultural regions in Italy/Spain
Introduction Model Data Methodology and Results Conclusion Appendices
Where does Capital Flow?
Model’s Prediction: High output=high productivity(persistent TFP shocks) regions will attract capital (netdebtors)ï Should be the case if capital markets are integrated, and
governments not interfereï Gourinchas and Jeanne (2007); Prasad, Raghuram, and
Subramanian (2007) find exact opposite in country data
Alternative Story: Catch-up growth: high output regionshad positive productivity shocks and converged; low outputregions attract capital due to productivity catch-upï Blanchard and Givazzi (2005); Abiad, Leigh, and Mody (2007)
finds in favor of this for EU countries
We find:ï Capital flows to rich regions in Northern Europe: integrated
markets
ï No relation between output and flows in Southern Europe: notintegrated markets or government direct income flows
ï Strong redistribution to mining/agricultural regions in Italy/Spain
Introduction Model Data Methodology and Results Conclusion Appendices
Where does Capital Flow?
Model’s Prediction: High output=high productivity(persistent TFP shocks) regions will attract capital (netdebtors)ï Should be the case if capital markets are integrated, and
governments not interfereï Gourinchas and Jeanne (2007); Prasad, Raghuram, and
Subramanian (2007) find exact opposite in country data
Alternative Story: Catch-up growth: high output regionshad positive productivity shocks and converged; low outputregions attract capital due to productivity catch-upï Blanchard and Givazzi (2005); Abiad, Leigh, and Mody (2007)
finds in favor of this for EU countries
We find:ï Capital flows to rich regions in Northern Europe: integrated
marketsï No relation between output and flows in Southern Europe: not
integrated markets or government direct income flows
ï Strong redistribution to mining/agricultural regions in Italy/Spain
Introduction Model Data Methodology and Results Conclusion Appendices
Summary of Findings and Policy Implications
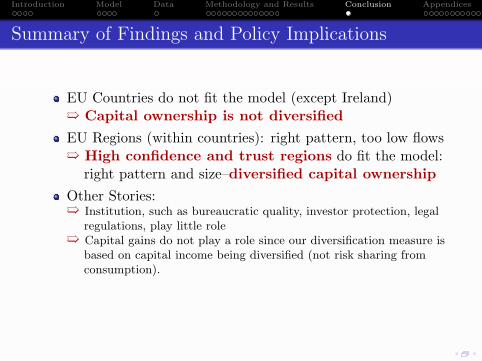
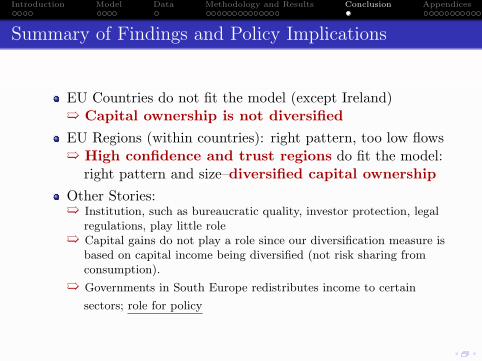
EU Countries do not fit the model (except Ireland)
ï Capital ownership is not diversified
EU Regions (within countries): right pattern, too low flows
ï High confidence and trust regions do fit the model:right pattern and size–diversified capital ownership
Other Stories:
ï Institution, such as bureaucratic quality, investor protection, legalregulations, play little role
ï Capital gains do not play a role since our diversification measure isbased on capital income being diversified (not risk sharing fromconsumption).
ï Governments in South Europe redistributes income to certain
sectors; role for policy
Introduction Model Data Methodology and Results Conclusion Appendices
Summary of Findings and Policy Implications
EU Countries do not fit the model (except Ireland)ï Capital ownership is not diversified
EU Regions (within countries): right pattern, too low flowsï High confidence and trust regions do fit the model:
right pattern and size–diversified capital ownership
Other Stories:ï Institution, such as bureaucratic quality, investor protection, legal
regulations, play little role
ï Capital gains do not play a role since our diversification measure isbased on capital income being diversified (not risk sharing fromconsumption).
ï Governments in South Europe redistributes income to certain
sectors; role for policy
Introduction Model Data Methodology and Results Conclusion Appendices
Summary of Findings and Policy Implications
EU Countries do not fit the model (except Ireland)ï Capital ownership is not diversified
EU Regions (within countries): right pattern, too low flowsï High confidence and trust regions do fit the model:
right pattern and size–diversified capital ownership
Other Stories:ï Institution, such as bureaucratic quality, investor protection, legal
regulations, play little roleï Capital gains do not play a role since our diversification measure is
based on capital income being diversified (not risk sharing fromconsumption).
ï Governments in South Europe redistributes income to certain
sectors; role for policy
Introduction Model Data Methodology and Results Conclusion Appendices
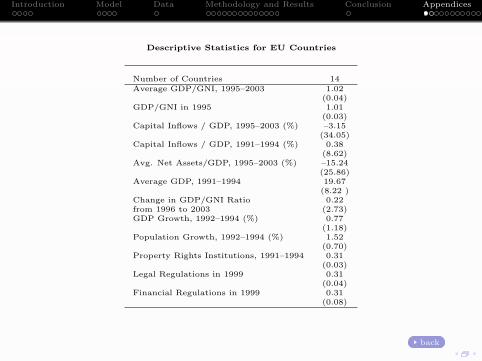
Descriptive Statistics for EU Countries
Number of Countries 14Average GDP/GNI, 1995–2003 1.02
(0.04)GDP/GNI in 1995 1.01
(0.03)Capital Inflows / GDP, 1995–2003 (%) –3.15
(34.05)Capital Inflows / GDP, 1991–1994 (%) 0.38
(8.62)Avg. Net Assets/GDP, 1995–2003 (%) –15.24
(25.86)Average GDP, 1991–1994 19.67
(8.22 )Change in GDP/GNI Ratio 0.22from 1996 to 2003 (2.73)GDP Growth, 1992–1994 (%) 0.77
(1.18)Population Growth, 1992–1994 (%) 1.52
(0.70)Property Rights Institutions, 1991–1994 0.31
(0.03)Legal Regulations in 1999 0.31
(0.04)Financial Regulations in 1999 0.31
(0.08)
back
Introduction Model Data Methodology and Results Conclusion Appendices
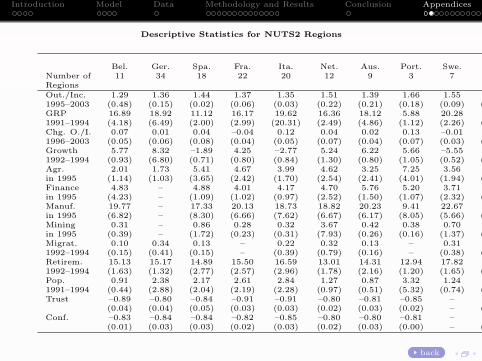
Descriptive Statistics for NUTS2 Regions
Bel. Ger. Spa. Fra. Ita. Net. Aus. Port. Swe. UKNumber of 11 34 18 22 20 12 9 3 7 32RegionsOut./Inc. 1.29 1.36 1.44 1.37 1.35 1.51 1.39 1.66 1.55 1.361995–2003 (0.48) (0.15) (0.02) (0.06) (0.03) (0.22) (0.21) (0.18) (0.09) (0.14)GRP 16.89 18.92 11.12 16.17 19.62 16.36 18.12 5.88 20.28 13.371991–1994 (4.18) (6.49) (2.00) (2.99) (20.31) (2.49) (4.86) (1.12) (2.26) (1.99)Chg. O./I. 0.07 0.01 0.04 –0.04 0.12 0.04 0.02 0.13 –0.01 –0.011996–2003 (0.05) (0.06) (0.08) (0.04) (0.05) (0.07) (0.04) (0.07) (0.03) (0.07)Growth 5.77 8.32 –1.89 4.25 –2.77 5.24 6.22 5.66 –5.55 1.491992–1994 (0.93) (6.80) (0.71) (0.80) (0.84) (1.30) (0.80) (1.05) (0.52) (0.88)Agr. 2.01 1.73 5.41 4.67 3.99 4.62 3.25 7.25 3.56 2.81in 1995 (1.14) (1.03) (3.65) (2.42) (1.70) (2.54) (2.41) (4.01) (1.94) (2.51)Finance 4.83 – 4.88 4.01 4.17 4.70 5.76 5.20 3.71 4.52in 1995 (4.23) – (1.09) (1.02) (0.97) (2.52) (1.50) (1.07) (2.32) (2.01)Manuf. 19.77 – 17.33 20.13 18.73 18.82 20.23 9.41 22.67 23.98in 1995 (6.82) – (8.30) (6.66) (7.62) (6.67) (6.17) (8.05) (5.66) (6.39)Mining 0.31 – 0.86 0.28 0.32 3.67 0.42 0.38 0.70 0.73in 1995 (0.39) – (1.72) (0.23) (0.31) (7.93) (0.26) (0.16) (1.37) (0.74)Migrat. 0.10 0.34 0.13 – 0.22 0.32 0.13 – 0.31 0.271992–1994 (0.15) (0.41) (0.15) – (0.39) (0.79) (0.16) – (0.38) (0.34)Retirem. 15.13 15.17 14.89 15.50 16.59 13.01 14.31 12.94 17.82 15.951992–1994 (1.63) (1.32) (2.77) (2.57) (2.96) (1.78) (2.16) (1.20) (1.65) (1.76)Pop. 0.91 2.38 2.17 2.61 2.84 1.27 0.87 3.32 1.24 1.821991–1994 (0.44) (2.88) (2.04) (2.19) (2.28) (0.97) (0.51) (5.32) (0.74) (1.28)Trust –0.89 –0.80 –0.84 –0.91 –0.91 –0.80 –0.81 –0.85 – –0.82
(0.04) (0.04) (0.05) (0.03) (0.03) (0.02) (0.03) (0.02) – (0.02)Conf. –0.83 –0.84 –0.84 –0.82 –0.85 –0.80 –0.80 –0.81 – –0.83
(0.01) (0.03) (0.03) (0.02) (0.03) (0.02) (0.03) (0.00) – (0.02)
back
Introduction Model Data Methodology and Results Conclusion Appendices
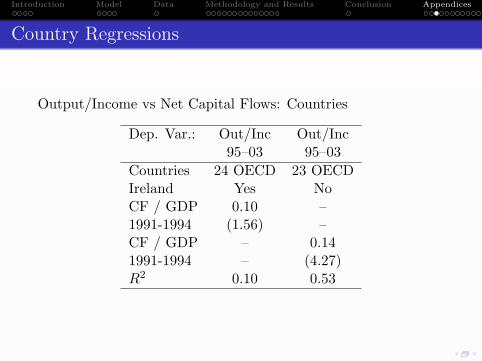
Country Regressions
Output/Income vs Net Capital Flows: Countries
Dep. Var.: Out/Inc Out/Inc95–03 95–03
Countries 24 OECD 23 OECDIreland Yes NoCF / GDP 0.10 –1991-1994 (1.56) –CF / GDP – 0.141991-1994 – (4.27)R2 0.10 0.53
Introduction Model Data Methodology and Results Conclusion Appendices
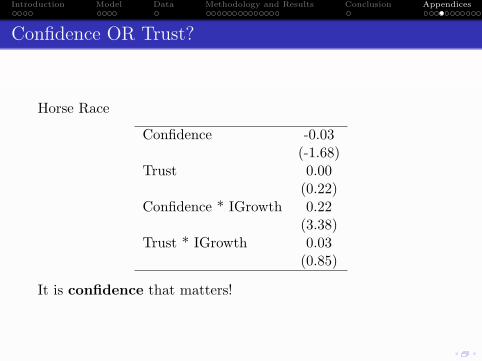
Confidence OR Trust?
Horse Race
Confidence -0.03(-1.68)
Trust 0.00(0.22)
Confidence * IGrowth 0.22(3.38)
Trust * IGrowth 0.03(0.85)
It is confidence that matters!
Introduction Model Data Methodology and Results Conclusion Appendices
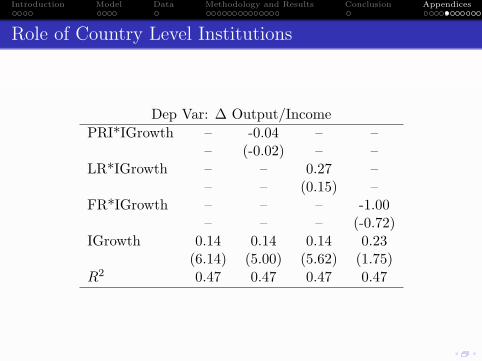
Role of Country Level Institutions
Dep Var: ∆ Output/IncomePRI*IGrowth – -0.04 – –
– (-0.02) – –LR*IGrowth – – 0.27 –
– – (0.15) –FR*IGrowth – – – -1.00
– – – (-0.72)IGrowth 0.14 0.14 0.14 0.23
(6.14) (5.00) (5.62) (1.75)R2 0.47 0.47 0.47 0.47
Introduction Model Data Methodology and Results Conclusion Appendices
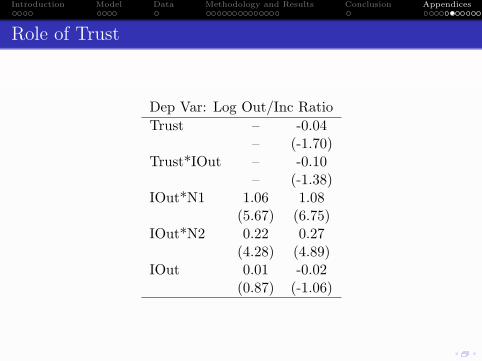
Role of Trust
Dep Var: Log Out/Inc RatioTrust – -0.04
– (-1.70)Trust*IOut – -0.10
– (-1.38)IOut*N1 1.06 1.08
(5.67) (6.75)IOut*N2 0.22 0.27
(4.28) (4.89)IOut 0.01 -0.02
(0.87) (-1.06)
Introduction Model Data Methodology and Results Conclusion Appendices
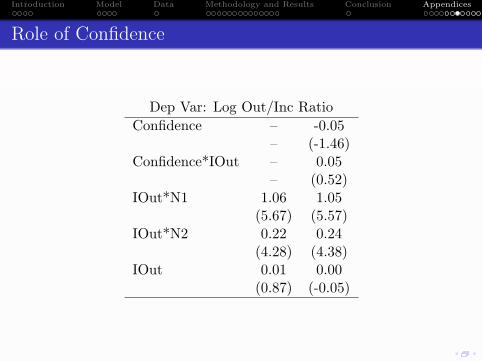
Role of Confidence
Dep Var: Log Out/Inc RatioConfidence – -0.05
– (-1.46)Confidence*IOut – 0.05
– (0.52)IOut*N1 1.06 1.05
(5.67) (5.57)IOut*N2 0.22 0.24
(4.28) (4.38)IOut 0.01 0.00
(0.87) (-0.05)
Introduction Model Data Methodology and Results Conclusion Appendices
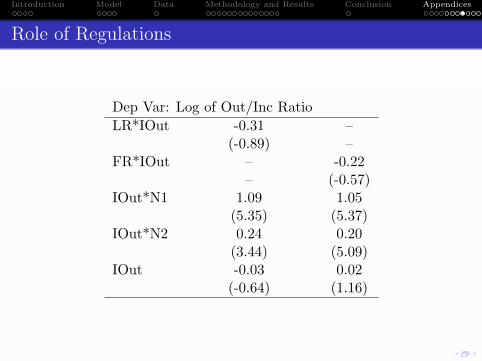
Role of Regulations
Dep Var: Log of Out/Inc RatioLR*IOut -0.31 –
(-0.89) –FR*IOut – -0.22
– (-0.57)IOut*N1 1.09 1.05
(5.35) (5.37)IOut*N2 0.24 0.20
(3.44) (5.09)IOut -0.03 0.02
(-0.64) (1.16)
Introduction Model Data Methodology and Results Conclusion Appendices
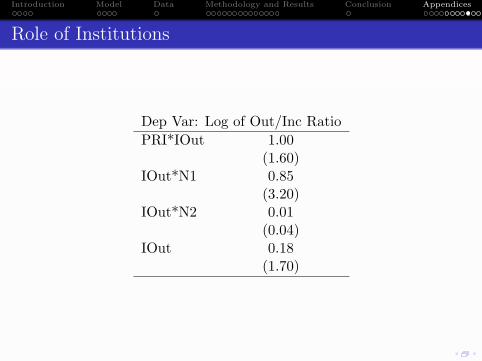
Role of Institutions
Dep Var: Log of Out/Inc RatioPRI*IOut 1.00
(1.60)IOut*N1 0.85
(3.20)IOut*N2 0.01
(0.04)IOut 0.18
(1.70)
Introduction Model Data Methodology and Results Conclusion Appendices
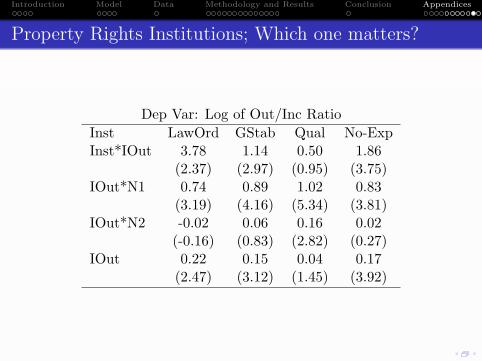
Property Rights Institutions; Which one matters?
Dep Var: Log of Out/Inc RatioInst LawOrd GStab Qual No-ExpInst*IOut 3.78 1.14 0.50 1.86
(2.37) (2.97) (0.95) (3.75)IOut*N1 0.74 0.89 1.02 0.83
(3.19) (4.16) (5.34) (3.81)IOut*N2 -0.02 0.06 0.16 0.02
(-0.16) (0.83) (2.82) (0.27)IOut 0.22 0.15 0.04 0.17
(2.47) (3.12) (1.45) (3.92)
Introduction Model Data Methodology and Results Conclusion Appendices
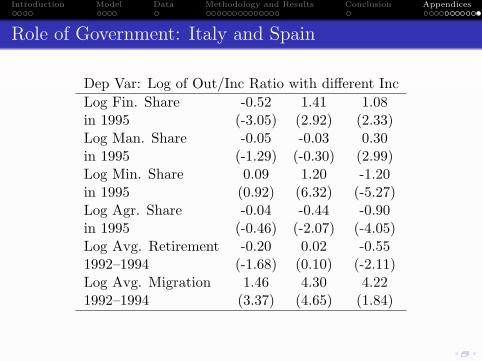
Role of Government: Italy and Spain
Dep Var: Log of Out/Inc Ratio with different IncLog Fin. Share -0.52 1.41 1.08in 1995 (-3.05) (2.92) (2.33)Log Man. Share -0.05 -0.03 0.30in 1995 (-1.29) (-0.30) (2.99)Log Min. Share 0.09 1.20 -1.20in 1995 (0.92) (6.32) (-5.27)Log Agr. Share -0.04 -0.44 -0.90in 1995 (-0.46) (-2.07) (-4.05)Log Avg. Retirement -0.20 0.02 -0.551992–1994 (-1.68) (0.10) (-2.11)Log Avg. Migration 1.46 4.30 4.221992–1994 (3.37) (4.65) (1.84)