financial impact of ecc changes · the ecc powers are currently applied on land but not on...
TRANSCRIPT
Report for DCMS
Financial impact of ECC
changes
May 2016
Charles Murray and Matt Yardley
Ref: 2005861-196
Error! U nknown document propert y name.
Financial impact of ECC changes | i
Ref: 2005861-196 Error! U nknown document propert y name.
Contents
1 Executive summary 1
2 Introduction 2
3 Proposed Code changes 3
4 Methodology 5
5 Industry structure and spend 6
5.1 Number of sites 6
5.2 Events which drive changes in an operator’s cost base 6
5.3 Estimated industry cash flows 8
5.4 Site costs 10
5.5 Projected rent in 2020 12
5.6 Historical revenue and cost trends 16
5.7 Other costs which could be impacted by changes to the ECC 19
6 Impact of potential Code changes 21
6.1 Proposed change 1: widen the scope of the Code to include infrastructure as well as land 21
6.2 Proposed changes 2, 3 and 4: provide the MNO with additional rights 23
6.3 Proposed change 5: use a new valuation method to calculate rents 24
7 Timing considerations 27
Annexes
Annex A Project Beacon
ii | Financial impact of ECC changes
Error! U nknown document propert y name. Ref: 2005861-196
Copyright © 2016. The information contained herein is the property of Analysys Mason Limited
and is provided on condition that it will not be reproduced, copied, lent or disclosed, directly or
indirectly, nor used for any purpose other than that for which it was specifically furnished.
Analysys Mason Limited
Bush House, North West Wing
Aldwych
London WC2B 4PJ
UK
Tel: +44 (0)20 7395 9000
www.analysysmason.com
Registered in England No. 5177472
Financial impact of ECC changes | iii
Ref: 2005861-196 Error! U nknown document propert y name.
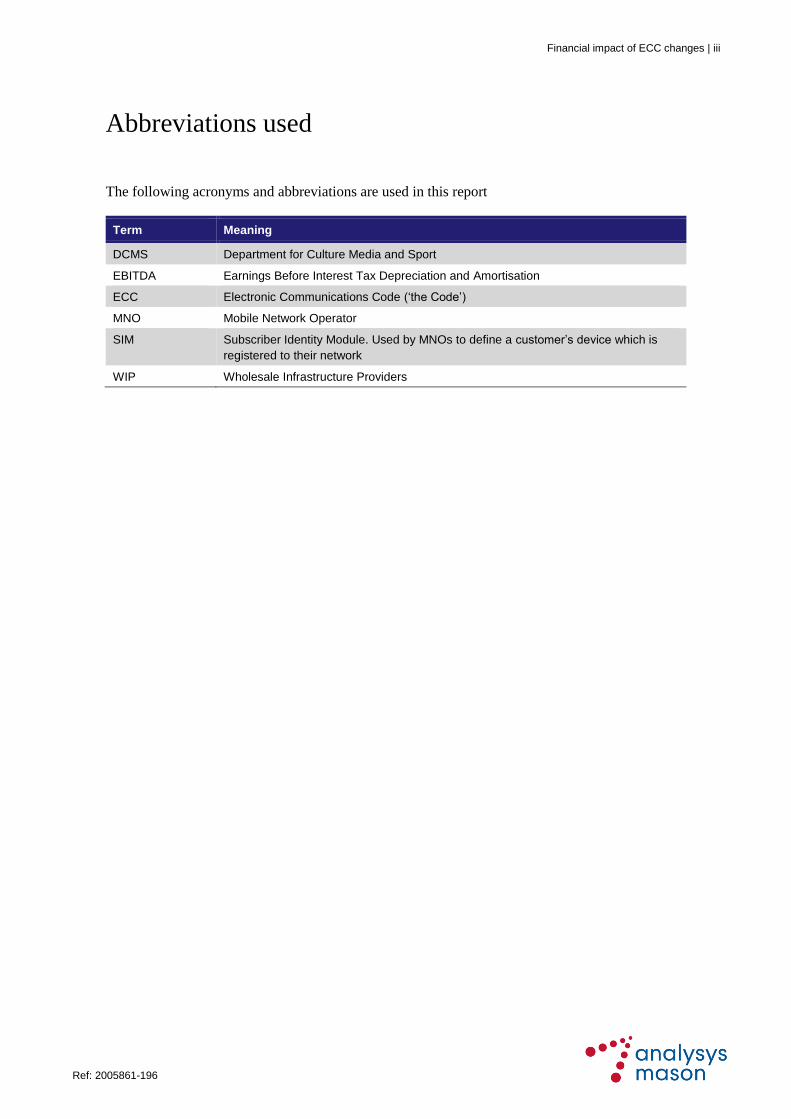
Abbreviations used
The following acronyms and abbreviations are used in this report
Term Meaning
DCMS Department for Culture Media and Sport
EBITDA Earnings Before Interest Tax Depreciation and Amortisation
ECC Electronic Communications Code (‘the Code’)
MNO Mobile Network Operator
SIM Subscriber Identity Module. Used by MNOs to define a customer’s device which is
registered to their network
WIP Wholesale Infrastructure Providers
Financial impact of ECC changes | 1
Ref: 2005861-196 Error! U nknown document propert y name.
1 Executive summary
This document is the final report of a project carried out by Analysys Mason on behalf of the
Department for Culture Media and Sport, to examine the financial impact of proposed changes to
the Electronics Communications Code (‘the Code’).
The DCMS is considering a set of five key changes, which can be grouped under the following
three categories:
increasing the scope of the Code
providing MNOs with additional rights
changing the rental valuation regime.
To conduct the impact analysis we engaged with key stakeholders through phone interviews,
submitted information requests and reviewed all the submissions from the consultation of
Q1 2015. Our initial findings were further refined through further engagement with the key
stakeholders. Our findings suggest the following potential impacts of changing the Code in the
three categories:
Increasing the scope of the Code could impact the GBP145 million of MNO spend on WIP
licence fees, with GBP 91 million being directly impacted. GBP54 million of the WIP licence
fees are spent on land rents which will not be directly impacted by the scope change, though
they could be impacted by changing the valuation regime (see below).
Providing the MNOs with additional rights would ease roll-out challenges but might increase
costs in the short term as the market finds a new rate incorporating all the new rights; longer
term cost should then stabilise.
Changing the valuation regime could produce significant yearly savings, up to GBP 53 million
by 2020 for the utility regime. This figure is the maximum savings assuming the MNOs move
to the new utility rates on lease renewal, however the actual savings are likely to be much less
as the MNOs are unlikely to impose the rates on landowners.
Changing the Code could help MNOs to roll out new equipment and coverage although it is not
the only barrier. Planning consent, availability of backhaul and wayleaves for fibre backhaul are
all other areas which cause challenges for MNOs deploying network.
We also note the importance of timing considerations: in order to start 5G services using 700MHz
spectrum by 2020, negotiations with the WIPs and independent landowners will commence during
2018.
2 | Financial impact of ECC changes
Error! U nknown document propert y name. Ref: 2005861-196
2 Introduction
In December 2015 the Department for Culture Media and Sport (DCMS) engaged Analysys
Mason to conduct a financial impact analysis of its proposed changes to the Electronic
Communications Code (ECC or ‘the Code’). The Code enables electronic communications
network providers to construct their networks, through the provision of certain rights to build
infrastructure on public and private land.
An explanatory note to the Code states: ‘The Code is designed to facilitate the installation and
maintenance of electronic communications networks. It confers rights on providers of such
networks… to install and maintain apparatus in, over and under land, and results in considerably
simplified planning procedures.’
The Code has its origins in the 1980s1, before the boom in commercial mobile services, and was
therefore designed to provide fixed communications operators with rights to build fixed
infrastructure.
The DCMS is considering changing the ECC to make it more suited to mobile communications,
and Analysys Mason were engaged to analyse the financial impact of the proposed changes. In this
report, we present the findings of our financial impact analysis of the proposed ECC changes on
mobile network operators (MNOs), wholesale infrastructure providers (WIPs) and independent
landowners.
The remainder of this document is laid out as follows:
Section 3 describes the DCMS’s proposed changes to the ECC
Section 4 explains the methodology we have used in our analysis
Section 5 outlines the current financial status of the mobile infrastructure market
Section 6 presents our findings of the impact of potential Code changes
Section 7 explains the timeframe within which changes to the ECC must be implemented.
The report includes supplementary material in Annex A, which provides information on Project
Beacon (Vodafone and O2’s network share).
1 The Electronic Communications Code is set out in Schedule 2 to the Telecommunications Act 1984 as amended by
Schedule 3 to the Communications Act 2003 (“the Act”).
Financial impact of ECC changes | 3
Ref: 2005861-196 Error! U nknown document propert y name.
3 Proposed changes to the Code
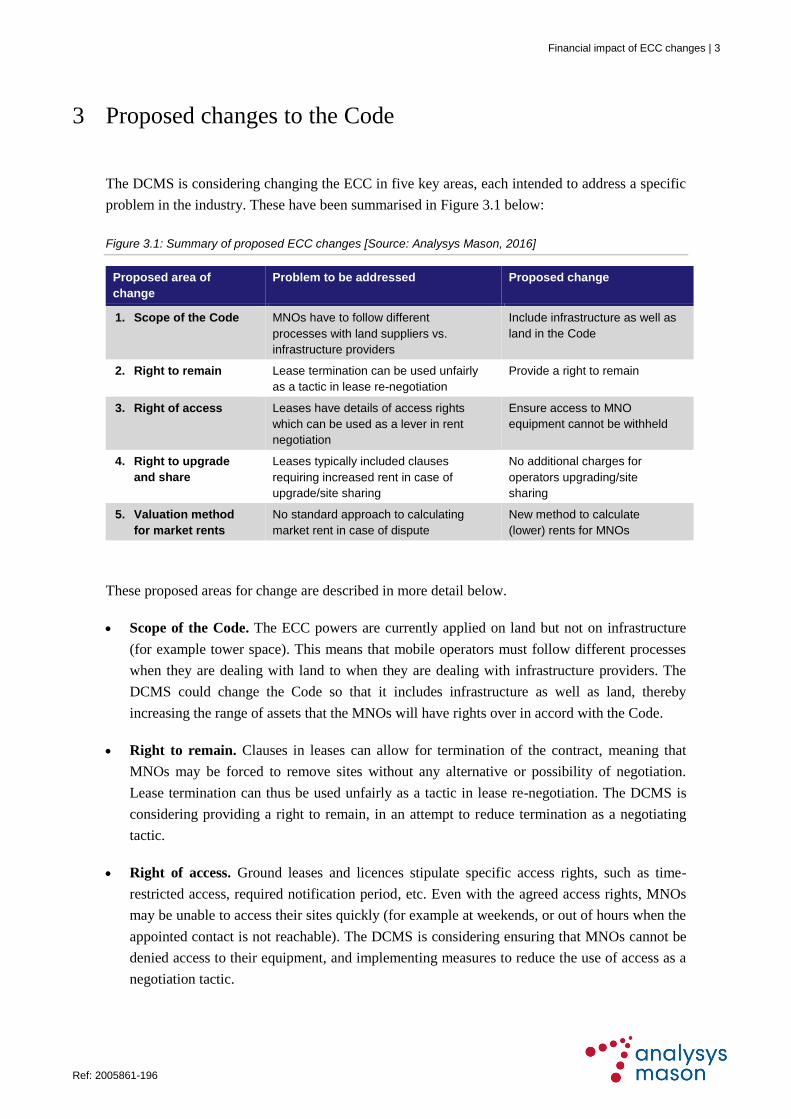
The DCMS is considering changing the ECC in five key areas, each intended to address a specific
problem in the industry. These have been summarised in Figure 3.1 below:
Figure 3.1: Summary of proposed ECC changes [Source: Analysys Mason, 2016]
Proposed area of
change
Problem to be addressed Proposed change
1. Scope of the Code MNOs have to follow different
processes with land suppliers vs.
infrastructure providers
Include infrastructure as well as
land in the Code
2. Right to remain Lease termination can be used unfairly
as a tactic in lease re-negotiation
Provide a right to remain
3. Right of access Leases have details of access rights
which can be used as a lever in rent
negotiation
Ensure access to MNO
equipment cannot be withheld
4. Right to upgrade
and share
Leases typically included clauses
requiring increased rent in case of
upgrade/site sharing
No additional charges for
operators upgrading/site
sharing
5. Valuation method
for market rents
No standard approach to calculating
market rent in case of dispute
New method to calculate
(lower) rents for MNOs
These proposed areas for change are described in more detail below.
Scope of the Code. The ECC powers are currently applied on land but not on infrastructure
(for example tower space). This means that mobile operators must follow different processes
when they are dealing with land to when they are dealing with infrastructure providers. The
DCMS could change the Code so that it includes infrastructure as well as land, thereby
increasing the range of assets that the MNOs will have rights over in accord with the Code.
Right to remain. Clauses in leases can allow for termination of the contract, meaning that
MNOs may be forced to remove sites without any alternative or possibility of negotiation.
Lease termination can thus be used unfairly as a tactic in lease re-negotiation. The DCMS is
considering providing a right to remain, in an attempt to reduce termination as a negotiating
tactic.
Right of access. Ground leases and licences stipulate specific access rights, such as time-
restricted access, required notification period, etc. Even with the agreed access rights, MNOs
may be unable to access their sites quickly (for example at weekends, or out of hours when the
appointed contact is not reachable). The DCMS is considering ensuring that MNOs cannot be
denied access to their equipment, and implementing measures to reduce the use of access as a
negotiation tactic.

4 | Financial impact of ECC changes
Error! U nknown document propert y name. Ref: 2005861-196
Right to upgrade and share. Ground leases typically include clauses which increase rents in
the case that a site should be upgraded or shared with another MNO. These clauses drive cost
during the MNOs’ roll-outs, and can lead to disputes. The DCMS is proposing to allow
operators to upgrade and share their sites without and additional charges.
Valuation method for market rents. The process for resolving disputes is not consistent with
other property processes (the Landlord and Tenant Act) and there is not a standard approach
for calculating market rents in the case of a dispute. The DCMS is considering standardising
this process using a ‘red book’ method or utility calculation, which will ultimately result in
lower rents for MNOs.
Financial impact of ECC changes | 5
Ref: 2005861-196 Error! U nknown document propert y name.
4 Methodology
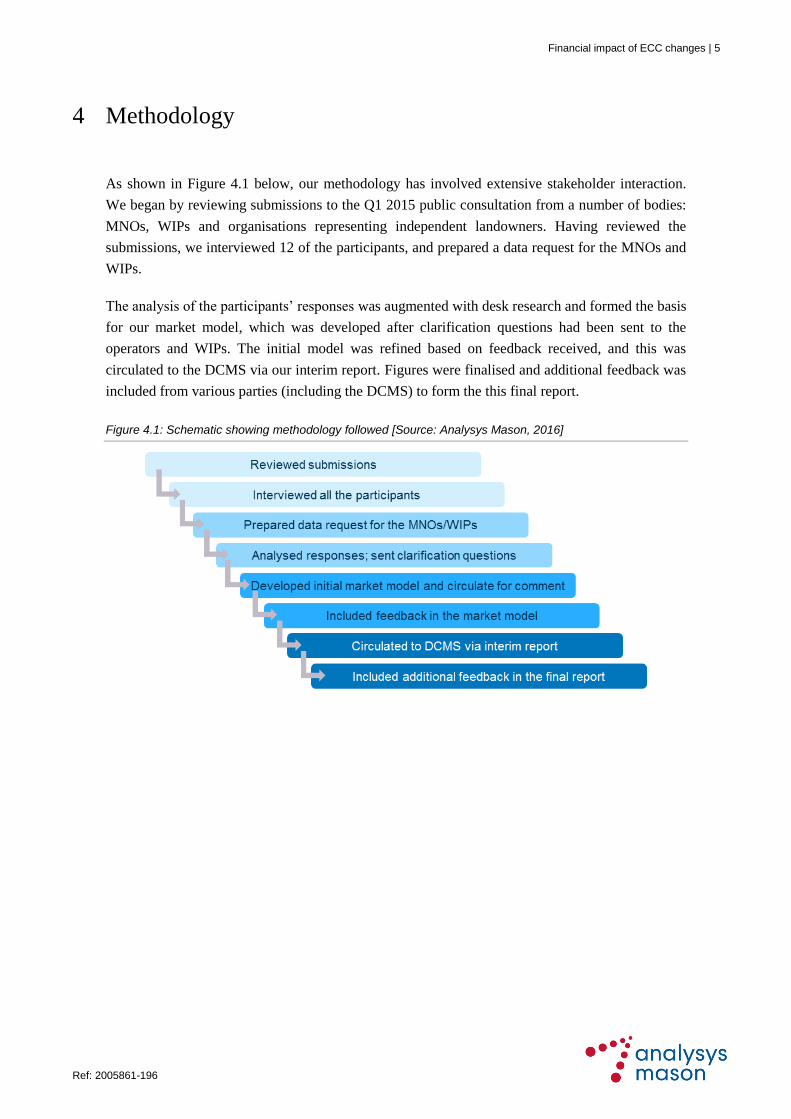
As shown in Figure 4.1 below, our methodology has involved extensive stakeholder interaction.
We began by reviewing submissions to the Q1 2015 public consultation from a number of bodies:
MNOs, WIPs and organisations representing independent landowners. Having reviewed the
submissions, we interviewed 12 of the participants, and prepared a data request for the MNOs and
WIPs.
The analysis of the participants’ responses was augmented with desk research and formed the basis
for our market model, which was developed after clarification questions had been sent to the
operators and WIPs. The initial model was refined based on feedback received, and this was
circulated to the DCMS via our interim report. Figures were finalised and additional feedback was
included from various parties (including the DCMS) to form the this final report.
Figure 4.1: Schematic showing methodology followed [Source: Analysys Mason, 2016]
6 | Financial impact of ECC changes
Error! U nknown document propert y name. Ref: 2005861-196
5 Industry structure and spend
5.1 Number of sites
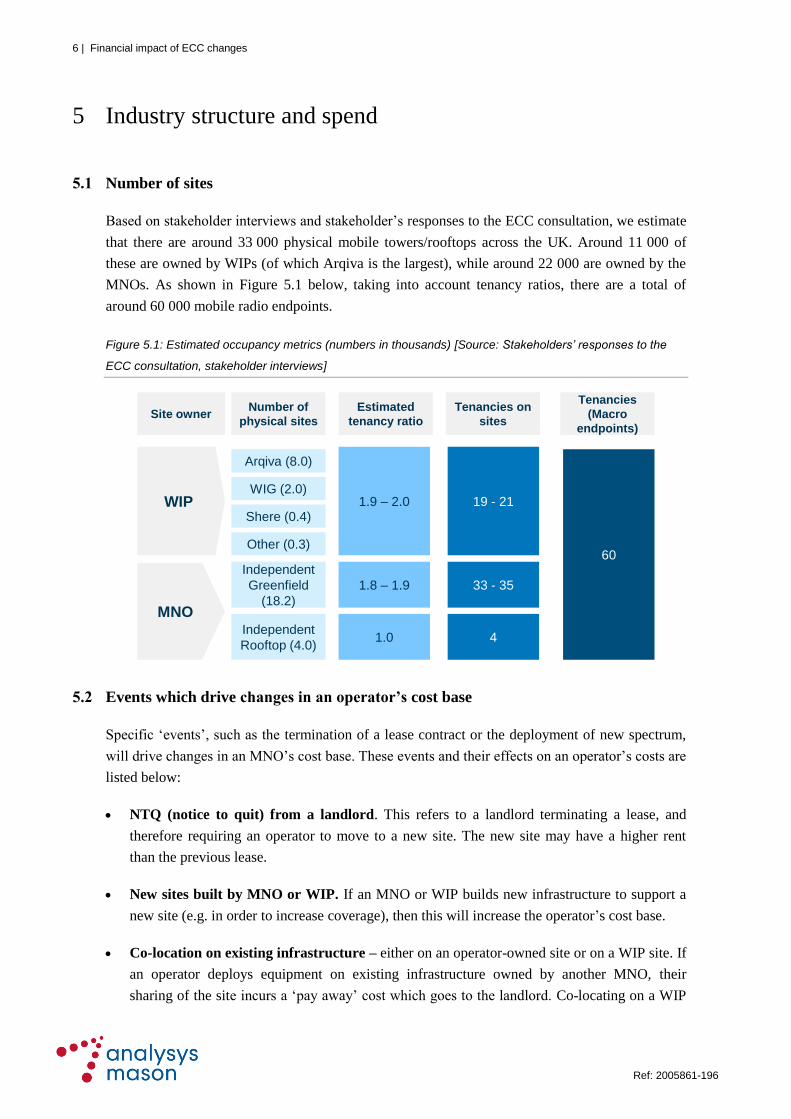
Based on stakeholder interviews and stakeholder’s responses to the ECC consultation, we estimate
that there are around 33 000 physical mobile towers/rooftops across the UK. Around 11 000 of
these are owned by WIPs (of which Arqiva is the largest), while around 22 000 are owned by the
MNOs. As shown in Figure 5.1 below, taking into account tenancy ratios, there are a total of
around 60 000 mobile radio endpoints.
Figure 5.1: Estimated occupancy metrics (numbers in thousands) [Source: Stakeholders’ responses to the
ECC consultation, stakeholder interviews]
5.2 Events which drive changes in an operator’s cost base
Specific ‘events’, such as the termination of a lease contract or the deployment of new spectrum,
will drive changes in an MNO’s cost base. These events and their effects on an operator’s costs are
listed below:
NTQ (notice to quit) from a landlord. This refers to a landlord terminating a lease, and
therefore requiring an operator to move to a new site. The new site may have a higher rent
than the previous lease.
New sites built by MNO or WIP. If an MNO or WIP builds new infrastructure to support a
new site (e.g. in order to increase coverage), then this will increase the operator’s cost base.
Co-location on existing infrastructure – either on an operator-owned site or on a WIP site. If
an operator deploys equipment on existing infrastructure owned by another MNO, their
sharing of the site incurs a ‘pay away’ cost which goes to the landlord. Co-locating on a WIP
WIP
MNO
Arqiva (8.0)
WIG (2.0)
Shere (0.4)
Other (0.3)
Independent
Greenfield
(18.2)
Independent
Rooftop (4.0)
1.9 – 2.0
1.8 – 1.9
1.0
19 - 21
33 - 35
4
60
Site ownerNumber of
physical sites
Estimated
tenancy ratio
Tenancies on
sites
Tenancies
(Macro
endpoints)
Financial impact of ECC changes | 7
Ref: 2005861-196 Error! U nknown document propert y name.
tower provides the WIP with additional income from the licence fees of the new operator (the
basic premise of the WIPs’ business model).
Decommissioning of a site. If an operator comes off a site, then the cost base is reduced. This
is occurring in large numbers at the moment due to Project Beacon (a network-sharing
arrangement between Vodafone and O2 – see Section 6). Project Beacon has caused tension in
the supply chain due to the reduction in sites (and thus income) for independent landlords and
WIPs.
Renewals of lease contracts. When a lease contract between a landlord and an operator
expires (or when a licence agreement between a WIP and an operator expires), this may be
renewed through a renegotiation process. The uncertainty over the dispute process, and the
high costs of moving site, have the potential to give rise to additional cost and tension.
4G coverage upgrades. An operator’s base 4G coverage roll-out (using a mixture of 800MHz
and 1800MHz), in order to reach its coverage target, gives rise to costs due to the additional
equipment needed on each site.
4G capacity upgrades. Operators deploy additional spectrum (1.4GHz, 2.3GHz and 2.6GHz)
in order to increase capacity. Generally the additional equipment required for a capacity
upgrade is covered by the costs of a coverage upgrade, although this can vary considerably
depending on the particular site and the MNO.
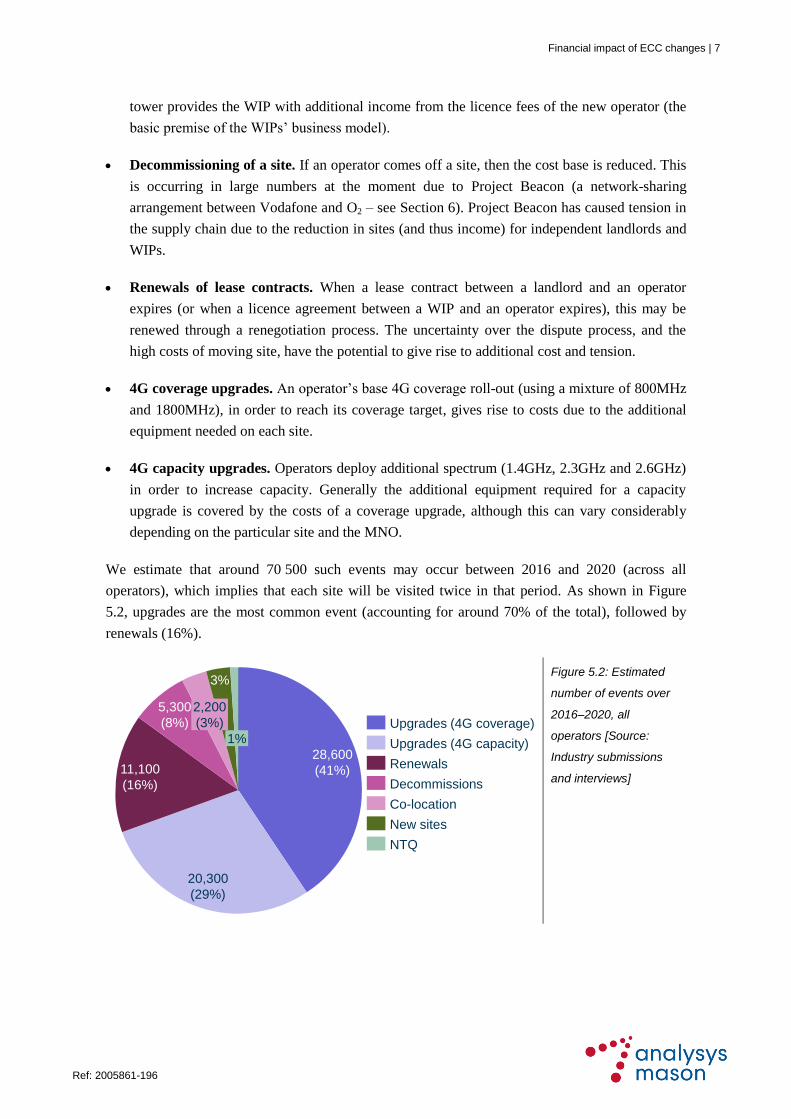
We estimate that around 70 500 such events may occur between 2016 and 2020 (across all
operators), which implies that each site will be visited twice in that period. As shown in Figure
5.2, upgrades are the most common event (accounting for around 70% of the total), followed by
renewals (16%).
Figure 5.2: Estimated
number of events over
2016–2020, all
operators [Source:
Industry submissions
and interviews]
1%
3%
2,200
(3%)
5,300
(8%)
11,100
(16%)
20,300
(29%)
28,600
(41%)
NTQ
New sites
Co-location
Decommissions
Renewals
Upgrades (4G capacity)
Upgrades (4G coverage)
8 | Financial impact of ECC changes
Error! U nknown document propert y name. Ref: 2005861-196
5.3 Estimated industry cash flows
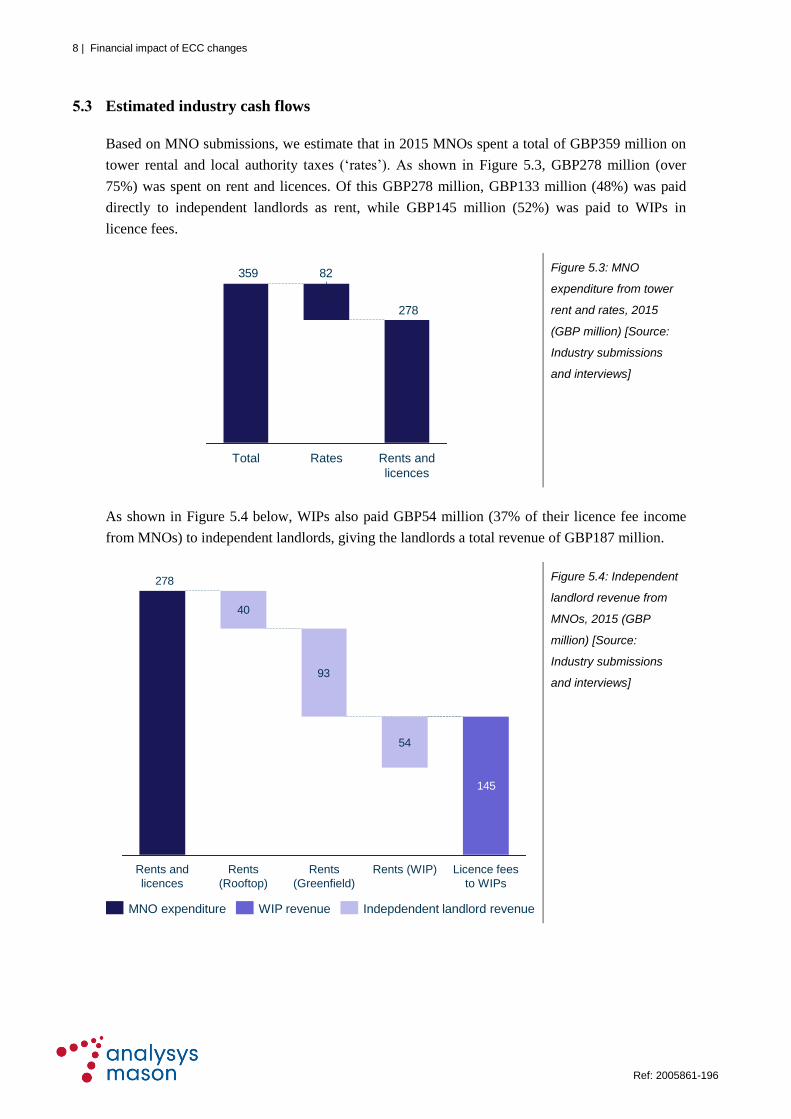
Based on MNO submissions, we estimate that in 2015 MNOs spent a total of GBP359 million on
tower rental and local authority taxes (‘rates’). As shown in Figure 5.3, GBP278 million (over
75%) was spent on rent and licences. Of this GBP278 million, GBP133 million (48%) was paid
directly to independent landlords as rent, while GBP145 million (52%) was paid to WIPs in
licence fees.
Figure 5.3: MNO
expenditure from tower
rent and rates, 2015
(GBP million) [Source:
Industry submissions
and interviews]
As shown in Figure 5.4 below, WIPs also paid GBP54 million (37% of their licence fee income
from MNOs) to independent landlords, giving the landlords a total revenue of GBP187 million.
Figure 5.4: Independent
landlord revenue from
MNOs, 2015 (GBP
million) [Source:
Industry submissions
and interviews]
278
82359
Rents and
licences
Total Rates
40
93
54
278
145
Rents (WIP)Rents and
licences
Rents
(Greenfield)
Rents
(Rooftop)
Licence fees
to WIPs
WIP revenueMNO expenditure Indepdendent landlord revenue
Financial impact of ECC changes | 9
Ref: 2005861-196 Error! U nknown document propert y name.
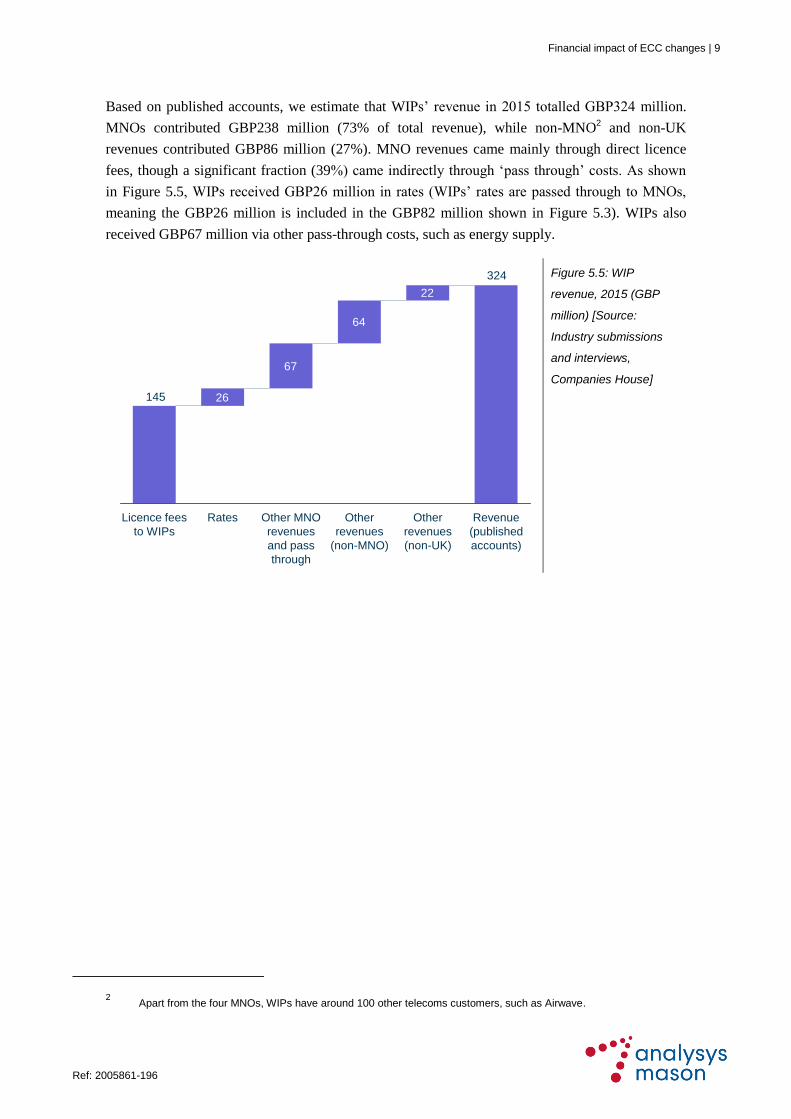
Based on published accounts, we estimate that WIPs’ revenue in 2015 totalled GBP324 million.
MNOs contributed GBP238 million (73% of total revenue), while non-MNO2 and non-UK
revenues contributed GBP86 million (27%). MNO revenues came mainly through direct licence
fees, though a significant fraction (39%) came indirectly through ‘pass through’ costs. As shown
in Figure 5.5, WIPs received GBP26 million in rates (WIPs’ rates are passed through to MNOs,
meaning the GBP26 million is included in the GBP82 million shown in Figure 5.3). WIPs also
received GBP67 million via other pass-through costs, such as energy supply.
Figure 5.5: WIP
revenue, 2015 (GBP
million) [Source:
Industry submissions
and interviews,
Companies House]
2 Apart from the four MNOs, WIPs have around 100 other telecoms customers, such as Airwave.
26
67
64
22
324
145
RatesLicence fees
to WIPs
Other MNO
revenues
and pass
through
Other
revenues
(non-UK)
Other
revenues
(non-MNO)
Revenue
(published
accounts)
10 | Financial impact of ECC changes
Error! U nknown document propert y name. Ref: 2005861-196
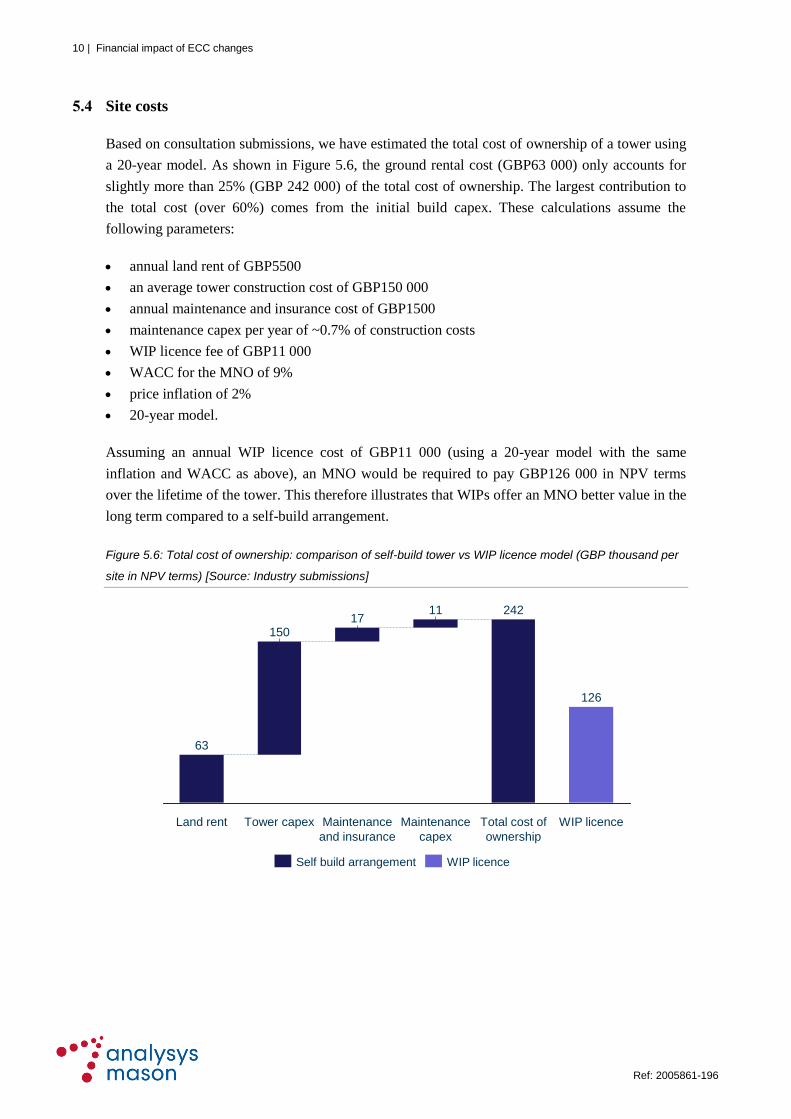
5.4 Site costs
Based on consultation submissions, we have estimated the total cost of ownership of a tower using
a 20-year model. As shown in Figure 5.6, the ground rental cost (GBP63 000) only accounts for
slightly more than 25% (GBP 242 000) of the total cost of ownership. The largest contribution to
the total cost (over 60%) comes from the initial build capex. These calculations assume the
following parameters:
annual land rent of GBP5500
an average tower construction cost of GBP150 000
annual maintenance and insurance cost of GBP1500
maintenance capex per year of ~0.7% of construction costs
WIP licence fee of GBP11 000
WACC for the MNO of 9%
price inflation of 2%
20-year model.
Assuming an annual WIP licence cost of GBP11 000 (using a 20-year model with the same
inflation and WACC as above), an MNO would be required to pay GBP126 000 in NPV terms
over the lifetime of the tower. This therefore illustrates that WIPs offer an MNO better value in the
long term compared to a self-build arrangement.
Figure 5.6: Total cost of ownership: comparison of self-build tower vs WIP licence model (GBP thousand per
site in NPV terms) [Source: Industry submissions]
126
150
WIP licenceTower capex
63
242
Total cost of
ownership
Land rent Maintenance
capex
11
Maintenance
and insurance
17
Self build arrangement WIP licence
Financial impact of ECC changes | 11
Ref: 2005861-196 Error! U nknown document propert y name.
It should be noted that the economic pricing of a WIP tower is significantly more complex than
Figure 5.6 above depicts, due to the characteristics of the WIP business model and tower portfolio,
including factors such as additional tenants for limited costs, the difference between depreciated
lifespan and economic lifespan, and different tower heights and costs.
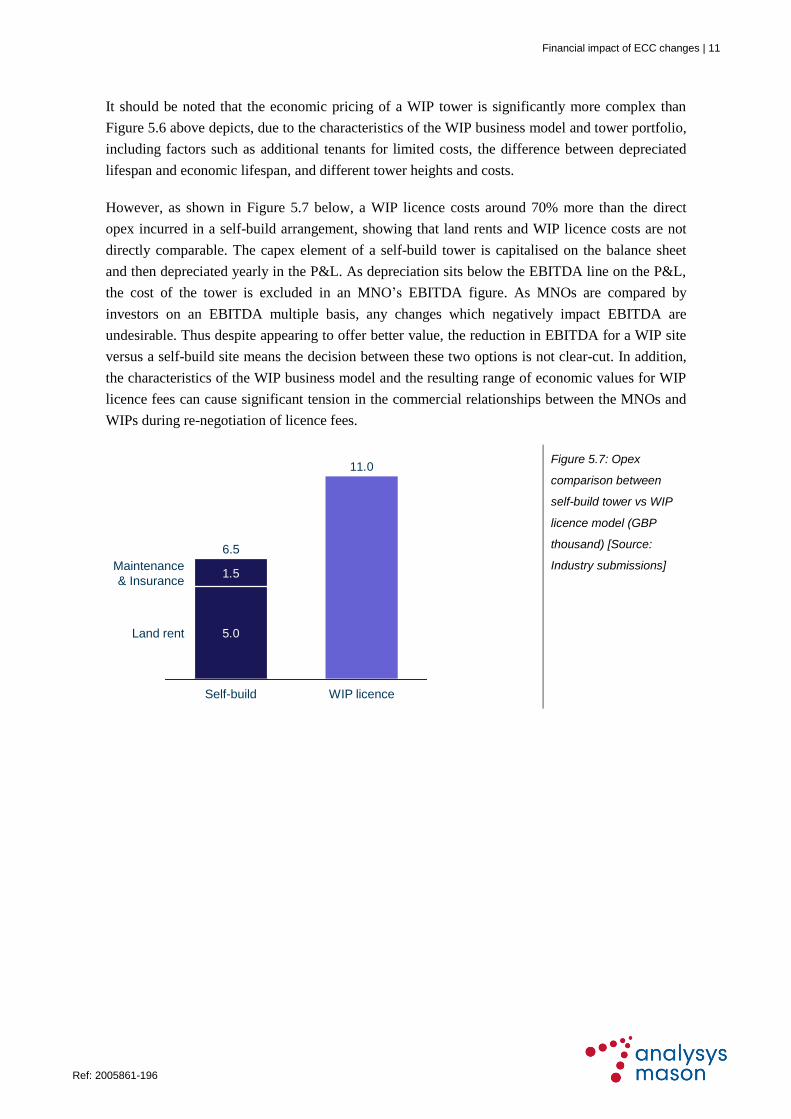
However, as shown in Figure 5.7 below, a WIP licence costs around 70% more than the direct
opex incurred in a self-build arrangement, showing that land rents and WIP licence costs are not
directly comparable. The capex element of a self-build tower is capitalised on the balance sheet
and then depreciated yearly in the P&L. As depreciation sits below the EBITDA line on the P&L,
the cost of the tower is excluded in an MNO’s EBITDA figure. As MNOs are compared by
investors on an EBITDA multiple basis, any changes which negatively impact EBITDA are
undesirable. Thus despite appearing to offer better value, the reduction in EBITDA for a WIP site
versus a self-build site means the decision between these two options is not clear-cut. In addition,
the characteristics of the WIP business model and the resulting range of economic values for WIP
licence fees can cause significant tension in the commercial relationships between the MNOs and
WIPs during re-negotiation of licence fees.
Figure 5.7: Opex
comparison between
self-build tower vs WIP
licence model (GBP
thousand) [Source:
Industry submissions]
11.0
5.0
1.5Maintenance
& Insurance
Land rent
WIP licenceSelf-build
6.5
12 | Financial impact of ECC changes
Error! U nknown document propert y name. Ref: 2005861-196
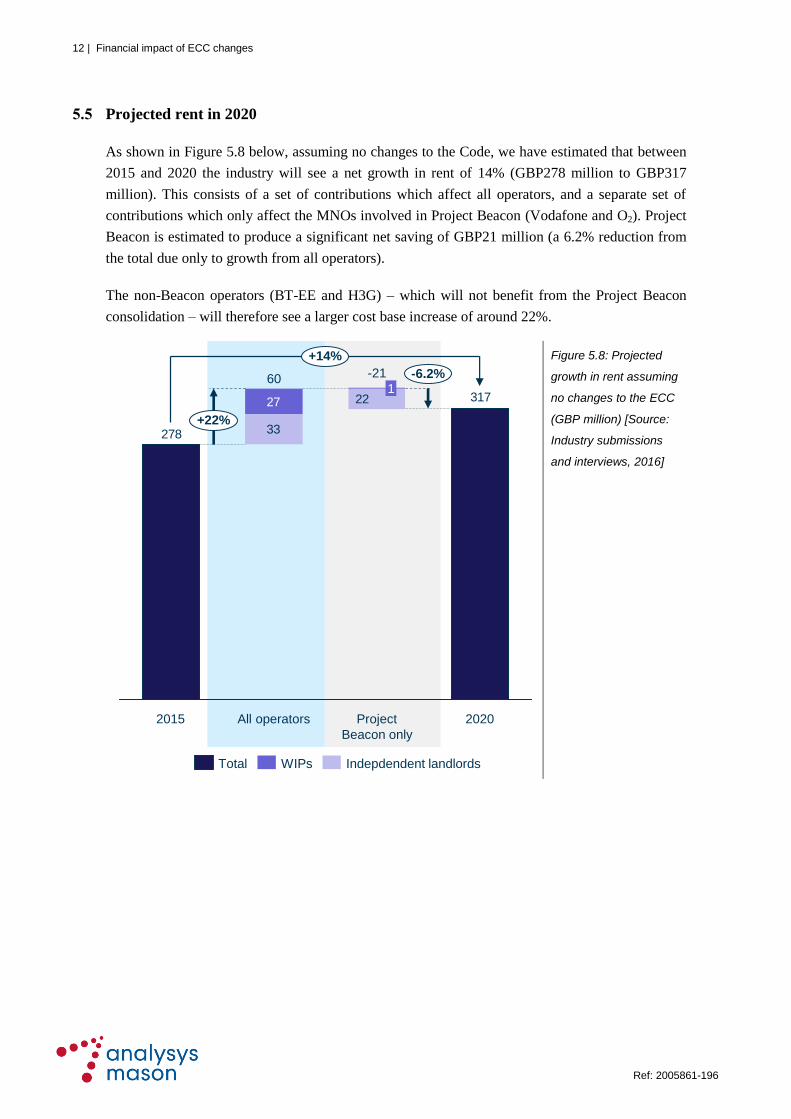
5.5 Projected rent in 2020
As shown in Figure 5.8 below, assuming no changes to the Code, we have estimated that between
2015 and 2020 the industry will see a net growth in rent of 14% (GBP278 million to GBP317
million). This consists of a set of contributions which affect all operators, and a separate set of
contributions which only affect the MNOs involved in Project Beacon (Vodafone and O2). Project
Beacon is estimated to produce a significant net saving of GBP21 million (a 6.2% reduction from
the total due only to growth from all operators).
The non-Beacon operators (BT-EE and H3G) – which will not benefit from the Project Beacon
consolidation – will therefore see a larger cost base increase of around 22%.
Figure 5.8: Projected
growth in rent assuming
no changes to the ECC
(GBP million) [Source:
Industry submissions
and interviews, 2016]
33
31722
278
27
60
+22%
-6.2%
2020Project
Beacon only
-21
1
All operators2015
+14%
Indepdendent landlordsWIPsTotal
Financial impact of ECC changes | 13
Ref: 2005861-196 Error! U nknown document propert y name.
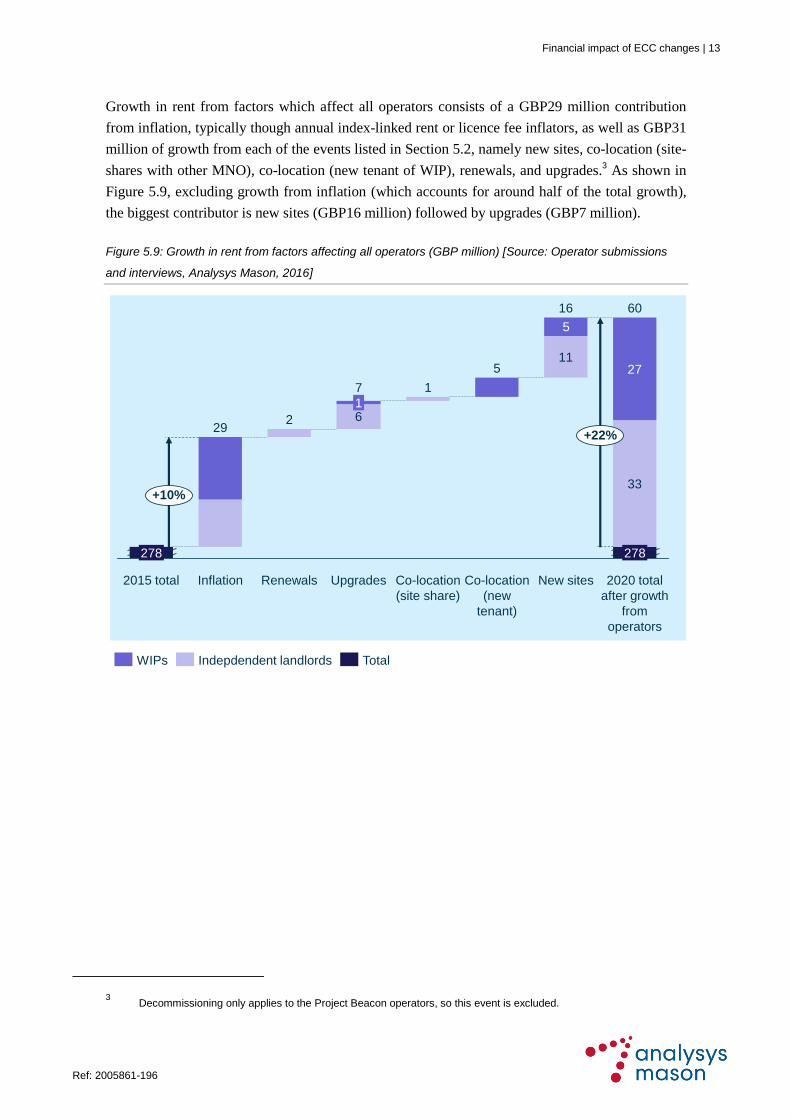
Growth in rent from factors which affect all operators consists of a GBP29 million contribution
from inflation, typically though annual index-linked rent or licence fee inflators, as well as GBP31
million of growth from each of the events listed in Section 5.2, namely new sites, co-location (site-
shares with other MNO), co-location (new tenant of WIP), renewals, and upgrades.3 As shown in
Figure 5.9, excluding growth from inflation (which accounts for around half of the total growth),
the biggest contributor is new sites (GBP16 million) followed by upgrades (GBP7 million).
Figure 5.9: Growth in rent from factors affecting all operators (GBP million) [Source: Operator submissions
and interviews, Analysys Mason, 2016]
3 Decommissioning only applies to the Project Beacon operators, so this event is excluded.
33
11
6
27
5
+22%
New sites 2020 total
after growth
from
operators
60
+10%
29
278
16
Co-location
(new
tenant)
5
Co-location
(site share)
1
Upgrades
7
1
Renewals
2
Inflation2015 total
278
Indepdendent landlords TotalWIPs
14 | Financial impact of ECC changes
Error! U nknown document propert y name. Ref: 2005861-196
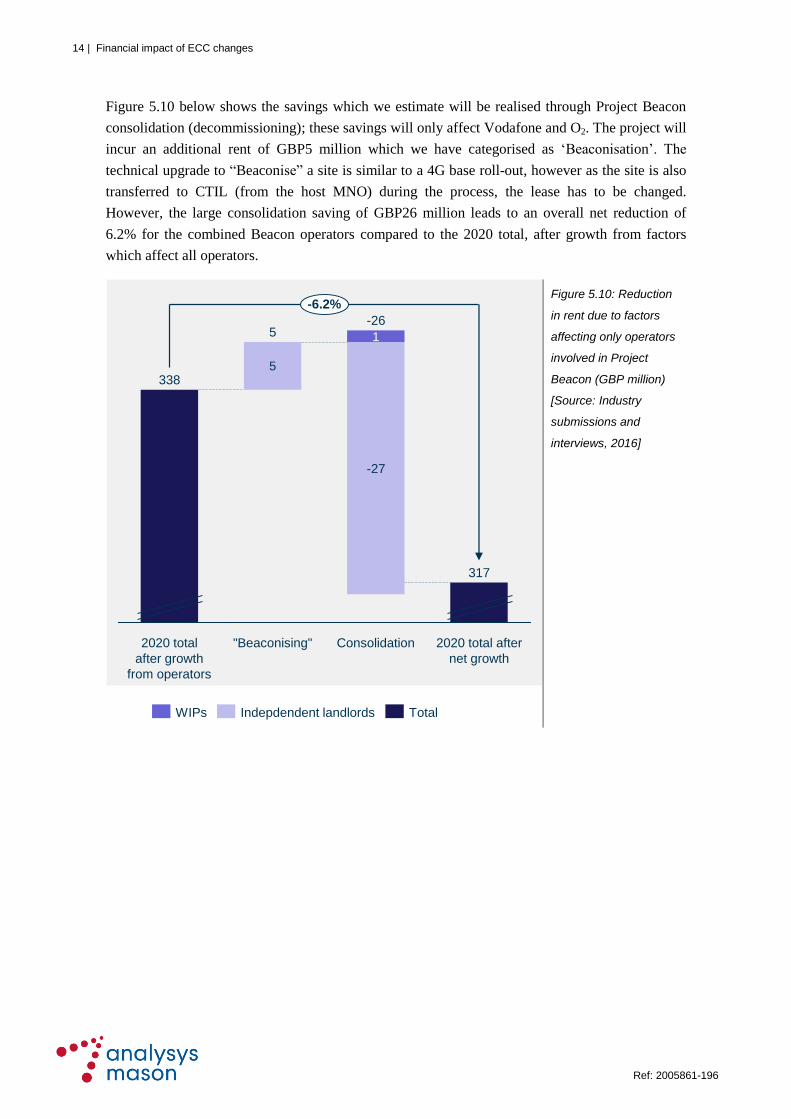
Figure 5.10 below shows the savings which we estimate will be realised through Project Beacon
consolidation (decommissioning); these savings will only affect Vodafone and O2. The project will
incur an additional rent of GBP5 million which we have categorised as ‘Beaconisation’. The
technical upgrade to “Beaconise” a site is similar to a 4G base roll-out, however as the site is also
transferred to CTIL (from the host MNO) during the process, the lease has to be changed.
However, the large consolidation saving of GBP26 million leads to an overall net reduction of
6.2% for the combined Beacon operators compared to the 2020 total, after growth from factors
which affect all operators.
Figure 5.10: Reduction
in rent due to factors
affecting only operators
involved in Project
Beacon (GBP million)
[Source: Industry
submissions and
interviews, 2016]
5
1
-26
-27
317
"Beaconising"
5
2020 total
after growth
from operators
338
2020 total after
net growth
-6.2%
Consolidation
TotalIndepdendent landlordsWIPs
Financial impact of ECC changes | 15
Ref: 2005861-196 Error! U nknown document propert y name.
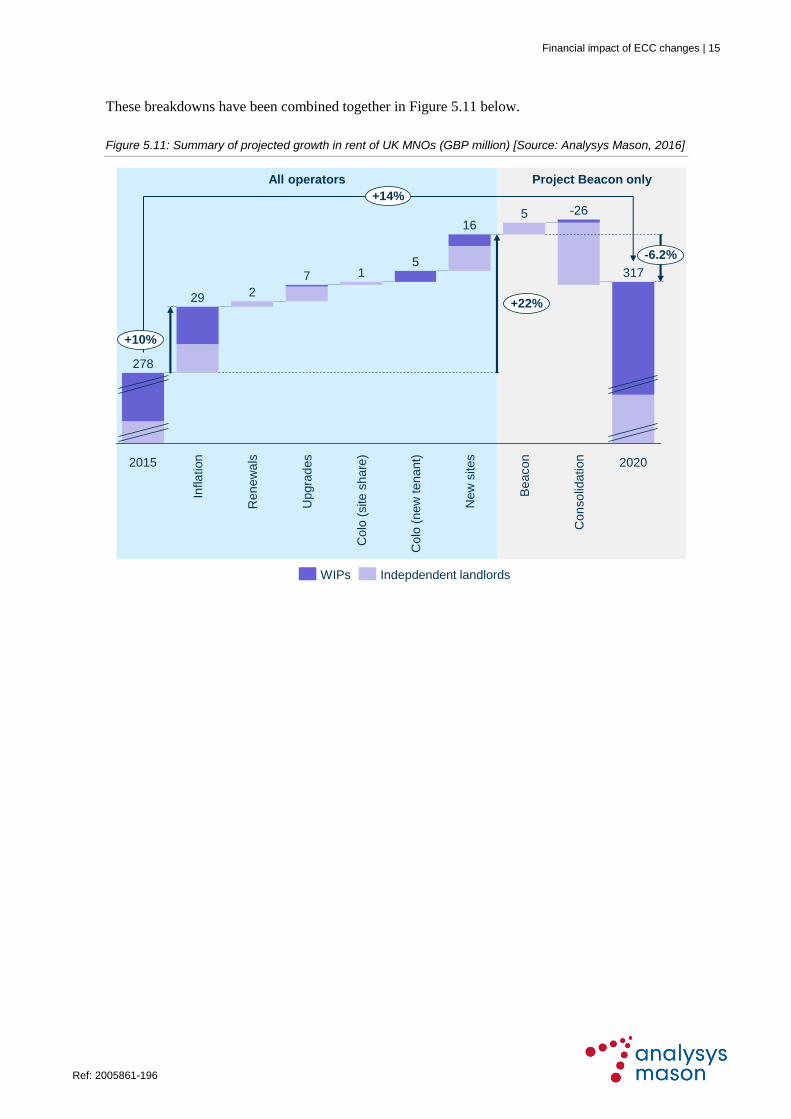
These breakdowns have been combined together in Figure 5.11 below.
Figure 5.11: Summary of projected growth in rent of UK MNOs (GBP million) [Source: Analysys Mason, 2016]
All operators Project Beacon only
+22%
+14%
317
-6.2%
2020
Co
nso
lida
tion
-26
Be
aco
n
Ne
w s
ite
s
29
Co
lo (
ne
w t
en
an
t)
5
Co
lo (
site
sh
are
)
1
Up
gra
de
s
7
16
2
Infla
tio
n2015
278
+10%
5
Re
ne
wa
ls
Indepdendent landlordsWIPs
16 | Financial impact of ECC changes
Error! U nknown document propert y name. Ref: 2005861-196
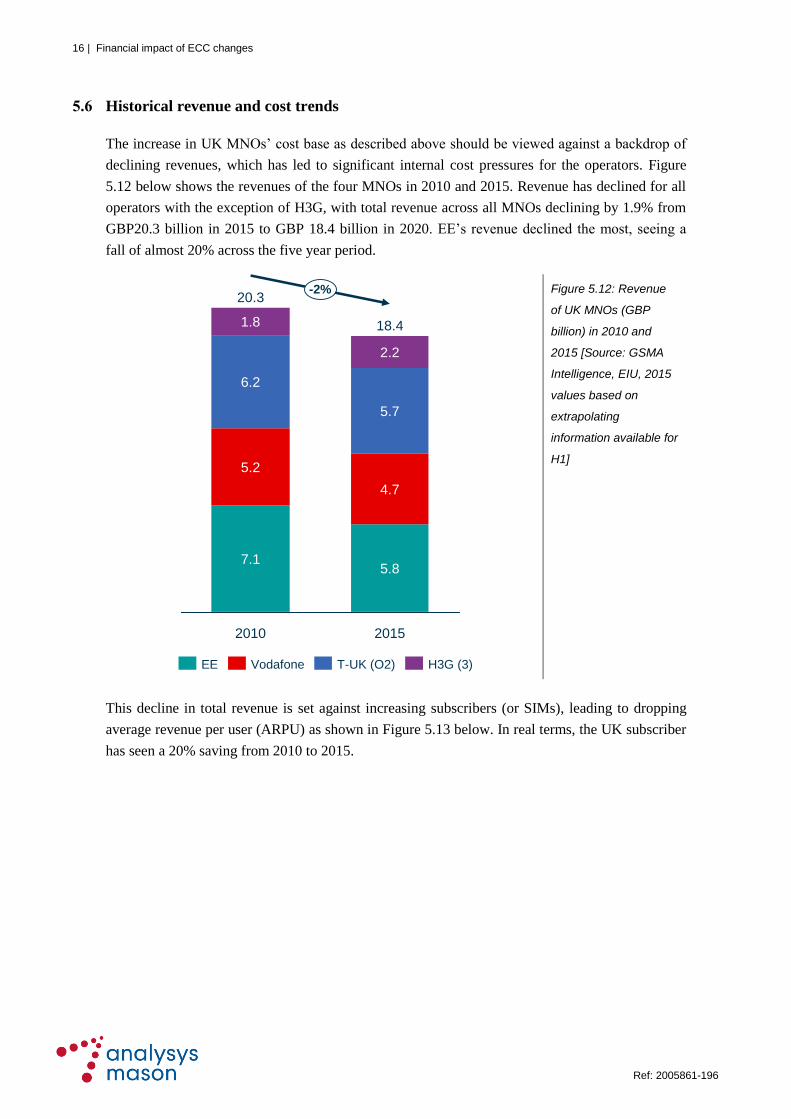
5.6 Historical revenue and cost trends
The increase in UK MNOs’ cost base as described above should be viewed against a backdrop of
declining revenues, which has led to significant internal cost pressures for the operators. Figure
5.12 below shows the revenues of the four MNOs in 2010 and 2015. Revenue has declined for all
operators with the exception of H3G, with total revenue across all MNOs declining by 1.9% from
GBP20.3 billion in 2015 to GBP 18.4 billion in 2020. EE’s revenue declined the most, seeing a
fall of almost 20% across the five year period.
Figure 5.12: Revenue
of UK MNOs (GBP
billion) in 2010 and
2015 [Source: GSMA
Intelligence, EIU, 2015
values based on
extrapolating
information available for
H1]
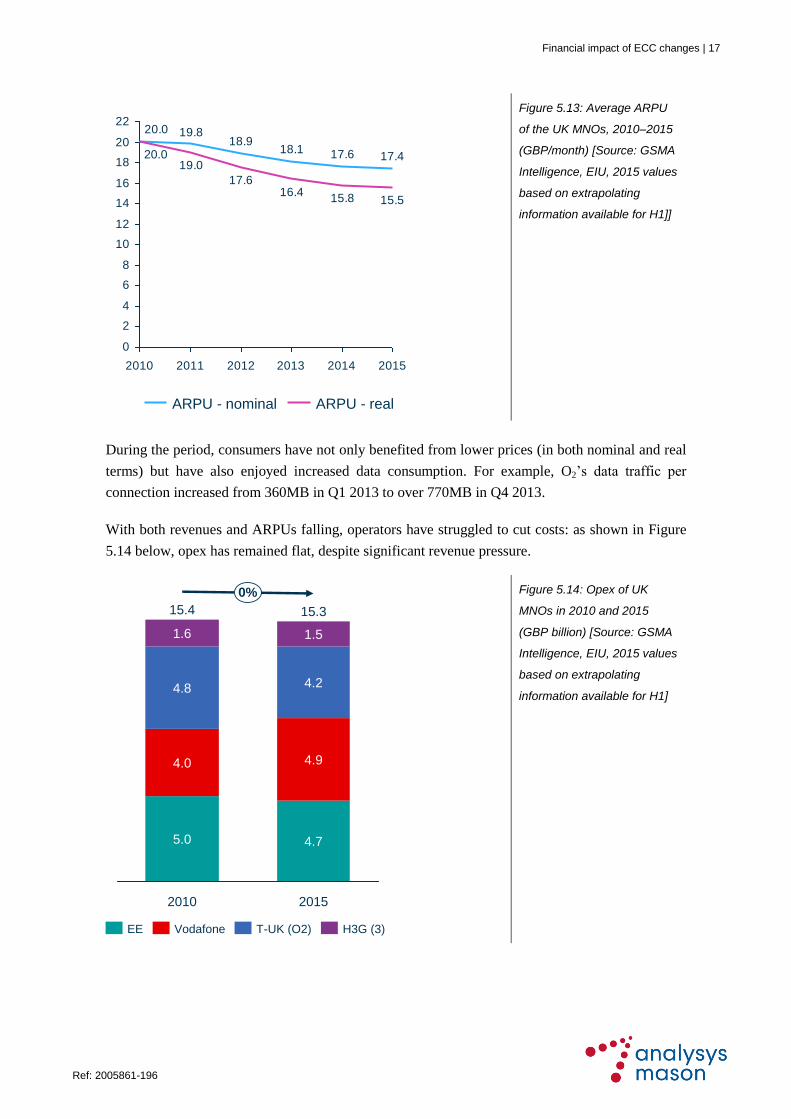
This decline in total revenue is set against increasing subscribers (or SIMs), leading to dropping
average revenue per user (ARPU) as shown in Figure 5.13 below. In real terms, the UK subscriber
has seen a 20% saving from 2010 to 2015.
-2%
2015
18.4
2.2
5.7
4.7
5.8
2010
20.3
1.8
6.2
5.2
7.1
H3G (3)T-UK (O2)VodafoneEE
Financial impact of ECC changes | 17
Ref: 2005861-196 Error! U nknown document propert y name.
Figure 5.13: Average ARPU
of the UK MNOs, 2010–2015
(GBP/month) [Source: GSMA
Intelligence, EIU, 2015 values
based on extrapolating
information available for H1]]
During the period, consumers have not only benefited from lower prices (in both nominal and real
terms) but have also enjoyed increased data consumption. For example, O2’s data traffic per
connection increased from 360MB in Q1 2013 to over 770MB in Q4 2013.
With both revenues and ARPUs falling, operators have struggled to cut costs: as shown in Figure
5.14 below, opex has remained flat, despite significant revenue pressure.
Figure 5.14: Opex of UK
MNOs in 2010 and 2015
(GBP billion) [Source: GSMA
Intelligence, EIU, 2015 values
based on extrapolating
information available for H1]
17.417.618.118.9
19.820.0
15.515.816.4
17.6
19.0
0
2
4
6
8
10
12
14
16
18
20
22
2010 2011 2012 2013 2014 2015
20.0
ARPU - realARPU - nominal
1.6
4.8
4.0
5.0
15.4
0%
2015
15.3
1.5
4.2
4.9
4.7
2010
Vodafone H3G (3)T-UK (O2)EE
18 | Financial impact of ECC changes
Error! U nknown document propert y name. Ref: 2005861-196
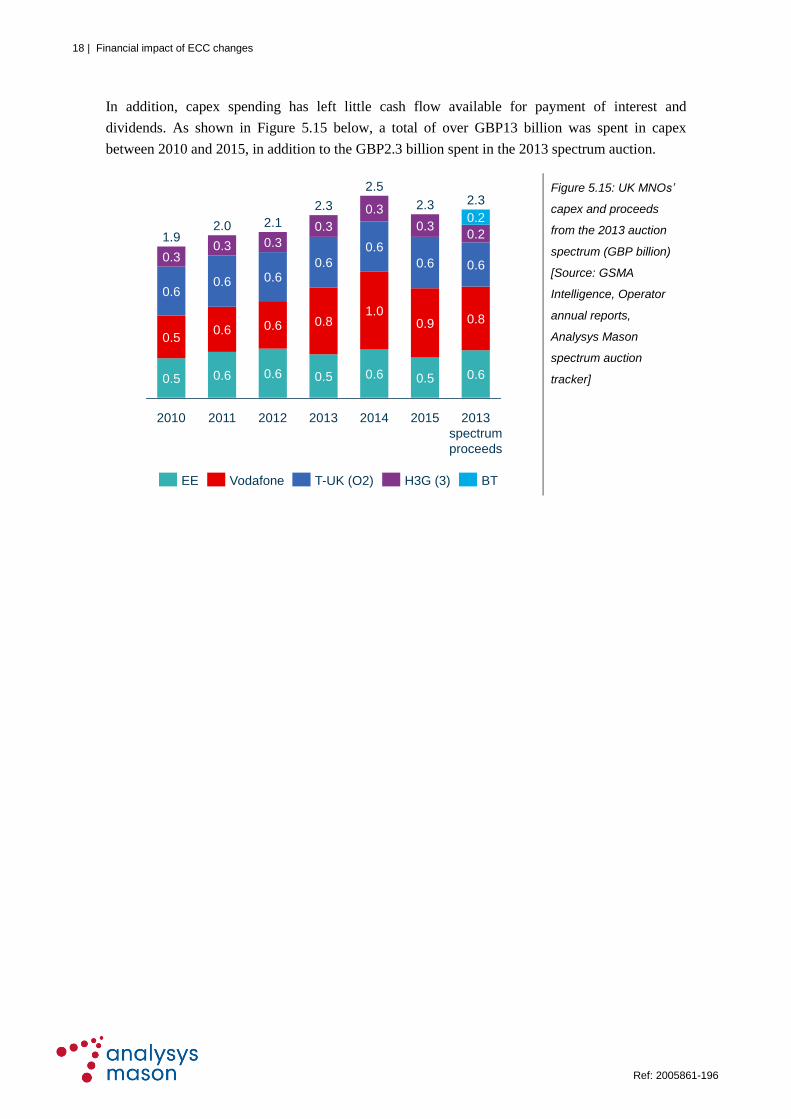
In addition, capex spending has left little cash flow available for payment of interest and
dividends. As shown in Figure 5.15 below, a total of over GBP13 billion was spent in capex
between 2010 and 2015, in addition to the GBP2.3 billion spent in the 2013 spectrum auction.
Figure 5.15: UK MNOs’
capex and proceeds
from the 2013 auction
spectrum (GBP billion)
[Source: GSMA
Intelligence, Operator
annual reports,
Analysys Mason
spectrum auction
tracker]
2.30.3
2015
2.5
2014
0.5
0.6
0.9
0.6
0.3
1.0
0.6
0.6
0.3
0.8
2013
2.30.2
0.5
2012
2.1
0.3
0.6
0.6
0.6
2011
2.0
0.3
0.6
0.6
0.6
2010
1.9
0.3
0.6
0.5
0.5 0.6
0.8
2.3
2013
spectrum
proceeds
0.6
0.2
Vodafone T-UK (O2) H3G (3)EE BT
Financial impact of ECC changes | 19
Ref: 2005861-196 Error! U nknown document propert y name.
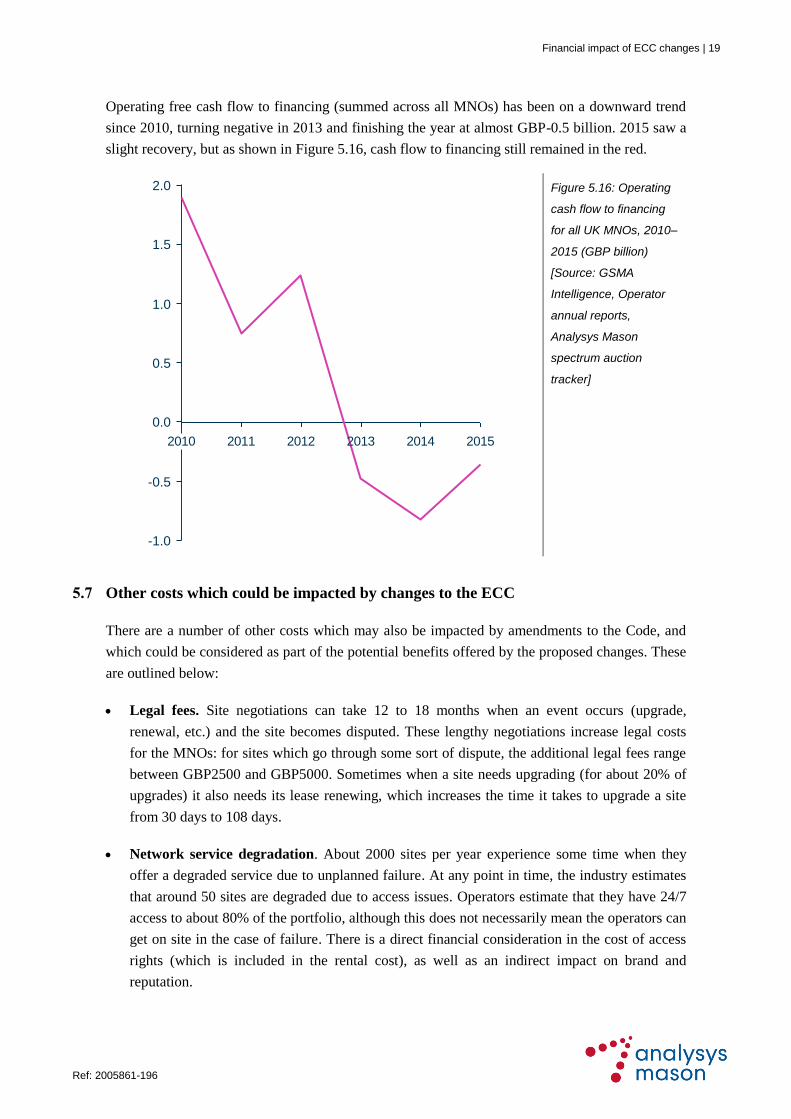
Operating free cash flow to financing (summed across all MNOs) has been on a downward trend
since 2010, turning negative in 2013 and finishing the year at almost GBP-0.5 billion. 2015 saw a
slight recovery, but as shown in Figure 5.16, cash flow to financing still remained in the red.
Figure 5.16: Operating
cash flow to financing
for all UK MNOs, 2010–
2015 (GBP billion)
[Source: GSMA
Intelligence, Operator
annual reports,
Analysys Mason
spectrum auction
tracker]
5.7 Other costs which could be impacted by changes to the ECC
There are a number of other costs which may also be impacted by amendments to the Code, and
which could be considered as part of the potential benefits offered by the proposed changes. These
are outlined below:
Legal fees. Site negotiations can take 12 to 18 months when an event occurs (upgrade,
renewal, etc.) and the site becomes disputed. These lengthy negotiations increase legal costs
for the MNOs: for sites which go through some sort of dispute, the additional legal fees range
between GBP2500 and GBP5000. Sometimes when a site needs upgrading (for about 20% of
upgrades) it also needs its lease renewing, which increases the time it takes to upgrade a site
from 30 days to 108 days.
Network service degradation. About 2000 sites per year experience some time when they
offer a degraded service due to unplanned failure. At any point in time, the industry estimates
that around 50 sites are degraded due to access issues. Operators estimate that they have 24/7
access to about 80% of the portfolio, although this does not necessarily mean the operators can
get on site in the case of failure. There is a direct financial consideration in the cost of access
rights (which is included in the rental cost), as well as an indirect impact on brand and
reputation.
2010 2011 2012 2013 2014 2015
2.0
1.5
1.0
0.5
0.0
-0.5
-1.0
20 | Financial impact of ECC changes
Error! U nknown document propert y name. Ref: 2005861-196
Roll-out costs. Most suppliers of MNO roll-out services are paid on completion, so some
direct roll-out costs are not impacted by delays. However, re-booking and other administrative
costs are incurred on upgrades which fail due to access issues, which occurs on around 10% of
site upgrades The direct cost of an aborted site is around GBP600; there will also be an
indirect impact on brand and reputation for a degraded network service.
Site relocation. NTQs are issued on around 3% of the portfolio per annum, and the MNOs
estimate that approximately 20% of these NTQs are designed to force a variation in the
contract. The cost of relocating to a new site is typically GBP80 000 to GBP100 000.
Financial impact of ECC changes | 21
Ref: 2005861-196 Error! U nknown document propert y name.
6 Impact of potential Code changes
This section summarises our findings of the potential implications and financial impact of the
DCMS’s five proposed changes to the ECC.
6.1 Proposed change 1: widen the scope of the Code to include infrastructure as well as
land
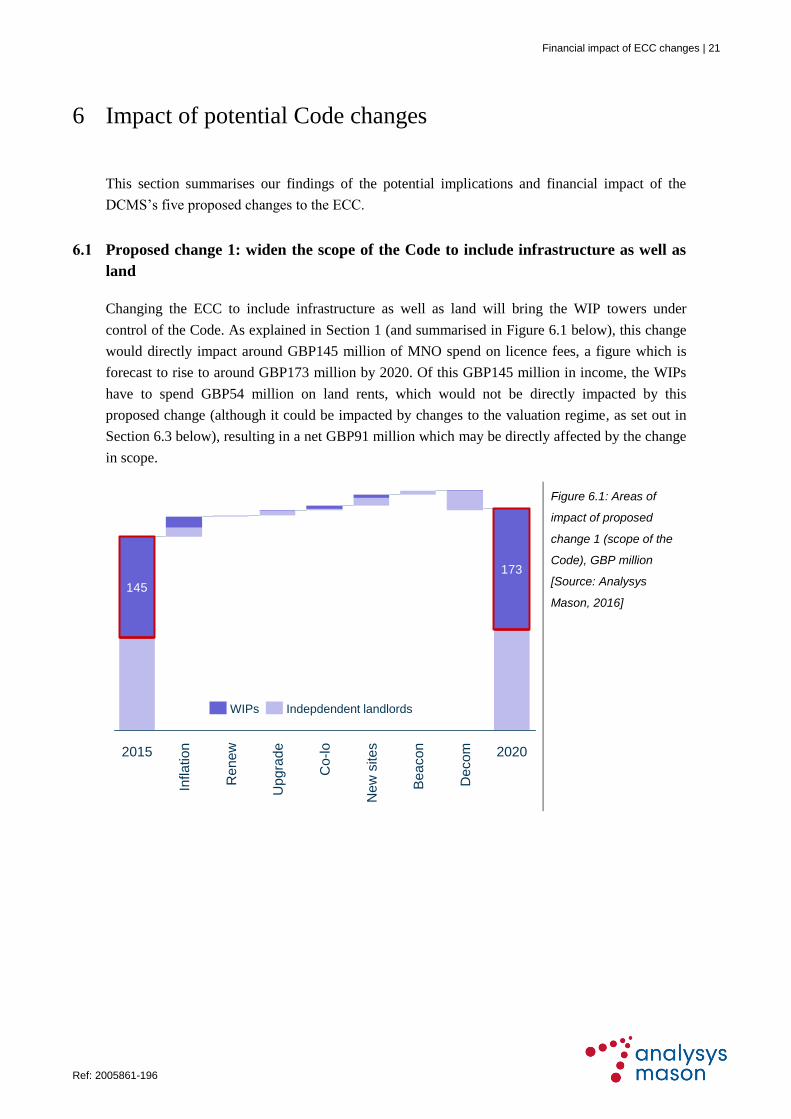
Changing the ECC to include infrastructure as well as land will bring the WIP towers under
control of the Code. As explained in Section 1 (and summarised in Figure 6.1 below), this change
would directly impact around GBP145 million of MNO spend on licence fees, a figure which is
forecast to rise to around GBP173 million by 2020. Of this GBP145 million in income, the WIPs
have to spend GBP54 million on land rents, which would not be directly impacted by this
proposed change (although it could be impacted by changes to the valuation regime, as set out in
Section 6.3 below), resulting in a net GBP91 million which may be directly affected by the change
in scope.
Figure 6.1: Areas of
impact of proposed
change 1 (scope of the
Code), GBP million
[Source: Analysys
Mason, 2016]
173
145
2020
Decom
Beacon
Ne
w s
ite
s
Co
-lo
Upgra
de
Re
ne
w
Inflation2015
WIPs Indepdendent landlords
22 | Financial impact of ECC changes
Error! U nknown document propert y name. Ref: 2005861-196
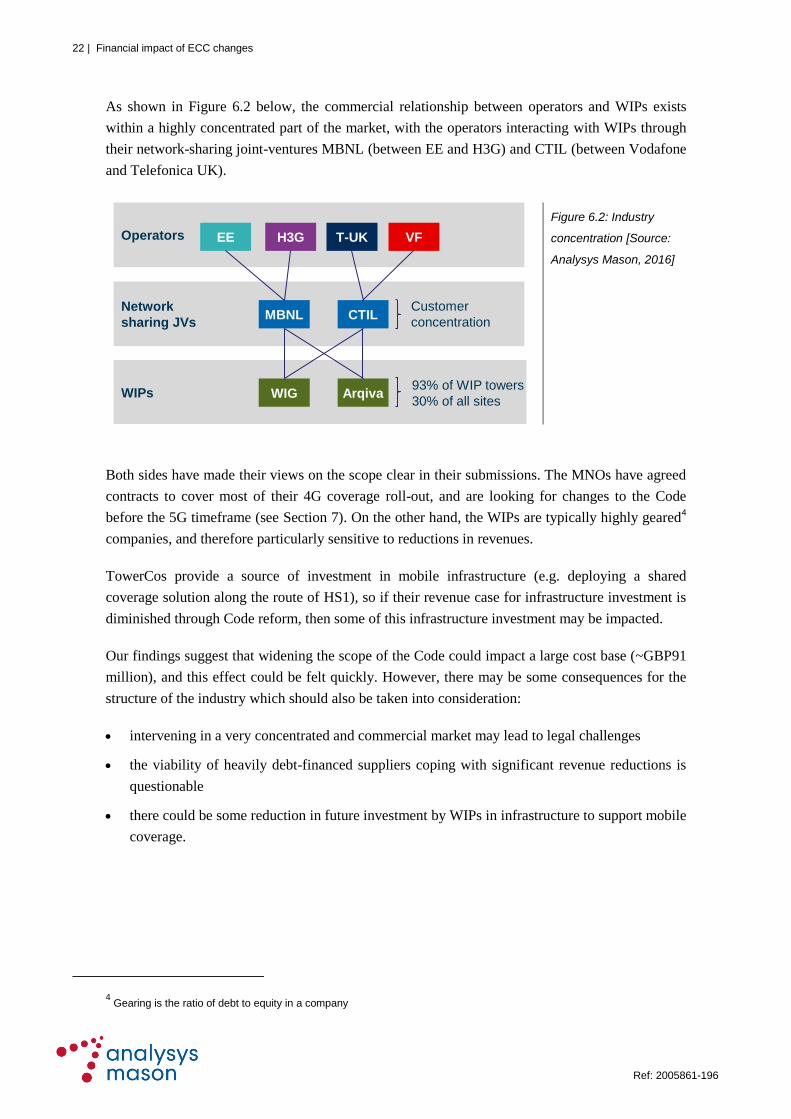
As shown in Figure 6.2 below, the commercial relationship between operators and WIPs exists
within a highly concentrated part of the market, with the operators interacting with WIPs through
their network-sharing joint-ventures MBNL (between EE and H3G) and CTIL (between Vodafone
and Telefonica UK).
Figure 6.2: Industry
concentration [Source:
Analysys Mason, 2016]
Both sides have made their views on the scope clear in their submissions. The MNOs have agreed
contracts to cover most of their 4G coverage roll-out, and are looking for changes to the Code
before the 5G timeframe (see Section 7). On the other hand, the WIPs are typically highly geared4
companies, and therefore particularly sensitive to reductions in revenues.
TowerCos provide a source of investment in mobile infrastructure (e.g. deploying a shared
coverage solution along the route of HS1), so if their revenue case for infrastructure investment is
diminished through Code reform, then some of this infrastructure investment may be impacted.
Our findings suggest that widening the scope of the Code could impact a large cost base (~GBP91
million), and this effect could be felt quickly. However, there may be some consequences for the
structure of the industry which should also be taken into consideration:
intervening in a very concentrated and commercial market may lead to legal challenges
the viability of heavily debt-financed suppliers coping with significant revenue reductions is
questionable
there could be some reduction in future investment by WIPs in infrastructure to support mobile
coverage.
4 Gearing is the ratio of debt to equity in a company
WIPs
Network
sharing JVs
Operators EE H3G T-UK VF
MBNL CTIL
WIG Arqiva93% of WIP towers
30% of all sites
Customer
concentration
Financial impact of ECC changes | 23
Ref: 2005861-196 Error! U nknown document propert y name.
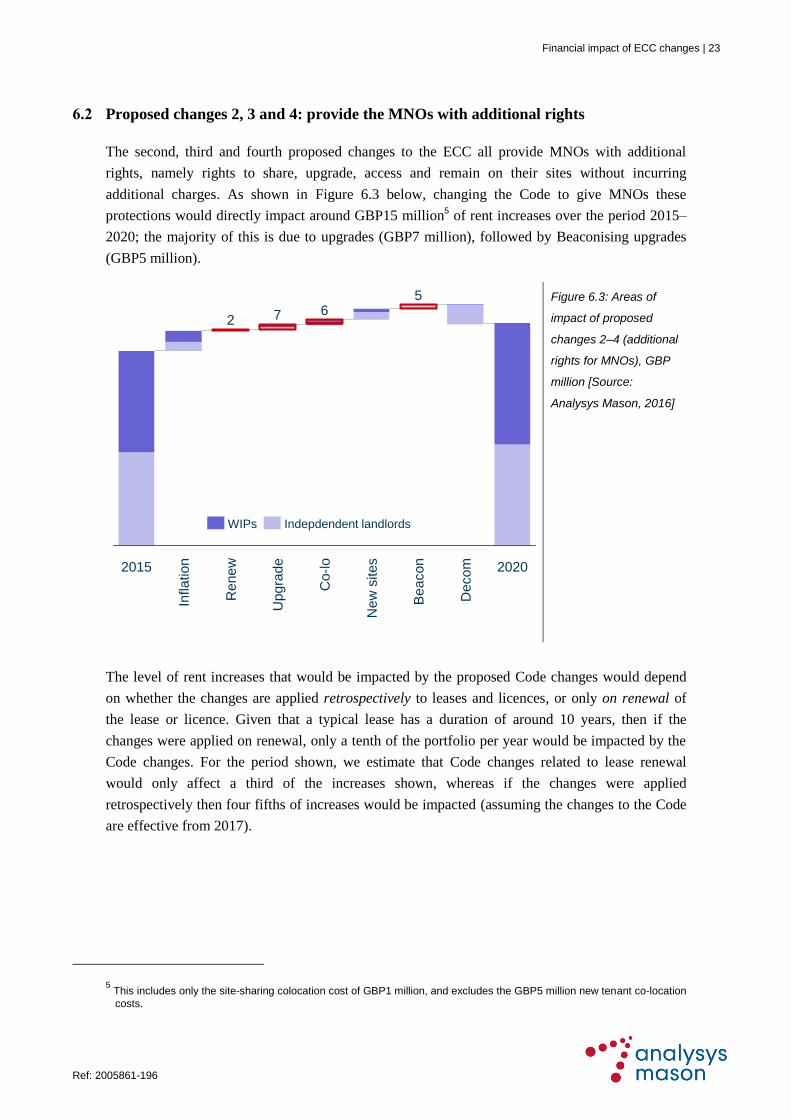
6.2 Proposed changes 2, 3 and 4: provide the MNOs with additional rights
The second, third and fourth proposed changes to the ECC all provide MNOs with additional
rights, namely rights to share, upgrade, access and remain on their sites without incurring
additional charges. As shown in Figure 6.3 below, changing the Code to give MNOs these
protections would directly impact around GBP15 million5 of rent increases over the period 2015–
2020; the majority of this is due to upgrades (GBP7 million), followed by Beaconising upgrades
(GBP5 million).
Figure 6.3: Areas of
impact of proposed
changes 2–4 (additional
rights for MNOs), GBP
million [Source:
Analysys Mason, 2016]
The level of rent increases that would be impacted by the proposed Code changes would depend
on whether the changes are applied retrospectively to leases and licences, or only on renewal of
the lease or licence. Given that a typical lease has a duration of around 10 years, then if the
changes were applied on renewal, only a tenth of the portfolio per year would be impacted by the
Code changes. For the period shown, we estimate that Code changes related to lease renewal
would only affect a third of the increases shown, whereas if the changes were applied
retrospectively then four fifths of increases would be impacted (assuming the changes to the Code
are effective from 2017).
5 This includes only the site-sharing colocation cost of GBP1 million, and excludes the GBP5 million new tenant co-location
costs.
2020
Be
aco
n
Co
-lo
Renew
Up
gra
de
Ne
w s
ite
s
De
co
m
Infla
tio
n
7 65
2015
2
Indepdendent landlordsWIPs
24 | Financial impact of ECC changes
Error! U nknown document propert y name. Ref: 2005861-196
Some landlords take advantage of the high cost to an operator of moving a site by increasing the
rent (a ‘ransom rent’). Changing the Code to strengthen MNOs’ rights in one area but not another
may not have the desired effect, due to ransom rents still prevailing. For example, mobile networks
are constantly evolving, with new technology and additional frequencies coming into use, so sites
constantly need upgrades and alterations. However, we understand that about 30% of sites require
consent to upgrade. If the Code were changed to provide upgrading as a right, this might not be
effective if the landowner was able to raise rent by threatening to remove another right, such as
timely access or sharing.
Our findings suggest that providing MNOs with additional rights could deal with a number of their
tower-base problems, ultimately resulting in a faster network roll-out on existing sites.
Additionally, MNO opex increases driven by this roll-out should be more predictable, removing a
barrier to infrastructure investment. However, while additional rights would ease roll-out
challenges, these changes also come with the following risks:
Increasing operators’ rights may actually increase rents rather than reduce them, as the pricing
of rights is commercially well understood, and the market could simply price in the additional
rights during the next lease renegotiation.
Introducing changes which impact all landlords in order to address only the few which employ
ransom rents may cause resentment within the industry.
6.3 Proposed change 5: use a new valuation method to calculate rents
The DCMS has proposed changing the mechanism and process used to calculate market rents, by
adopting either a red book or utility method. Under the current Code, the industry has specific
dispute processes which are not aligned with standard property processes (namely those consistent
with the Landlord and Tenant Act). This creates uncertainty regarding the definition and level of a
‘market rent’. We have found that all parties agree on the need for the current process to be
reformed.
Leases with independent landlords typically have a duration of 10 years, and are expiring at a rate
of around 2200 per annum. Retrospectively applying changes in the Code to existing leases would
therefore require around 22 000 leases to be renegotiated, a scale of task which the industry is not
geared for. Additionally, a ‘bow-wave’ of around 4000 expired leases exists, which increases the
number of leases which could be renegotiated in the short term, however this bow wave has been
present in the industry for a number of years and there appears little incentive to reduce it.
Financial impact of ECC changes | 25
Ref: 2005861-196 Error! U nknown document propert y name.
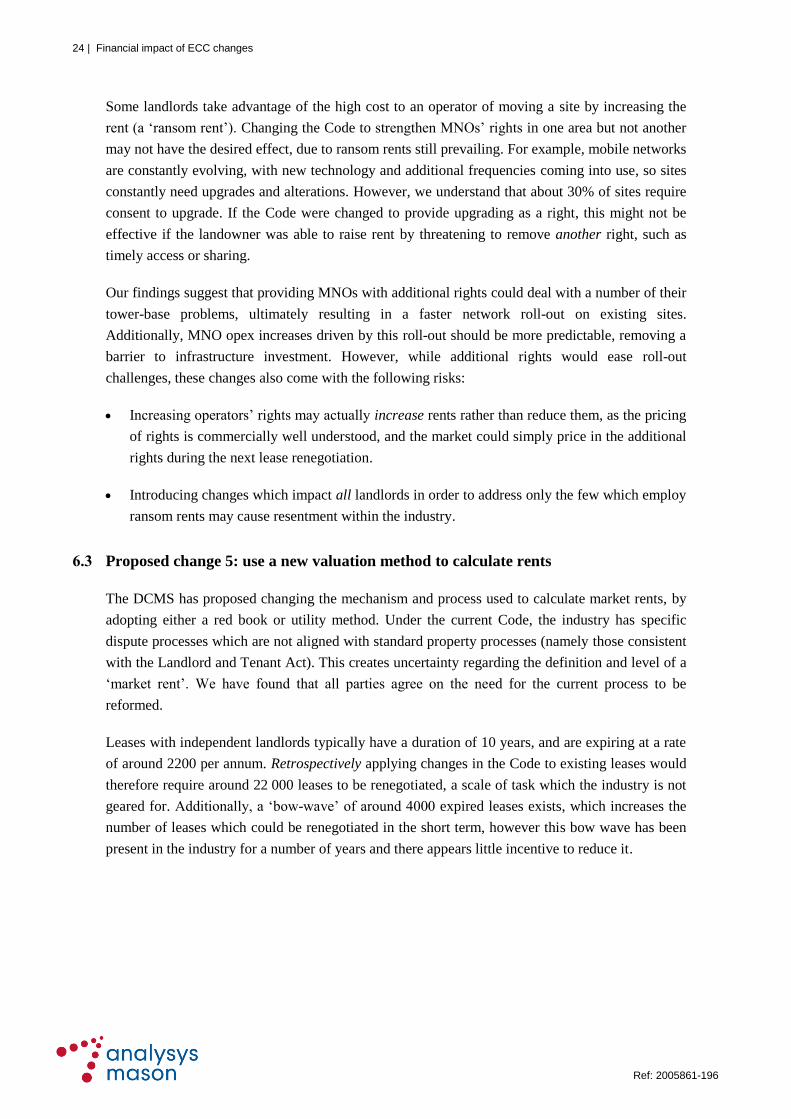
As shown in Figure 6.4, the value of rents (as of 2015) which could be impacted if this change in
the Code was applied retrospectively to existing leases is around GBP133 million.6 The value of
rents impacted between 2016 and 2020, based on lease renewals during the period, is around
GBP85 million.
Figure 6.4: Areas of
impact of proposed
change 5 (new rent
valuation method), GBP
million [Source:
Analysys Mason, 2016]
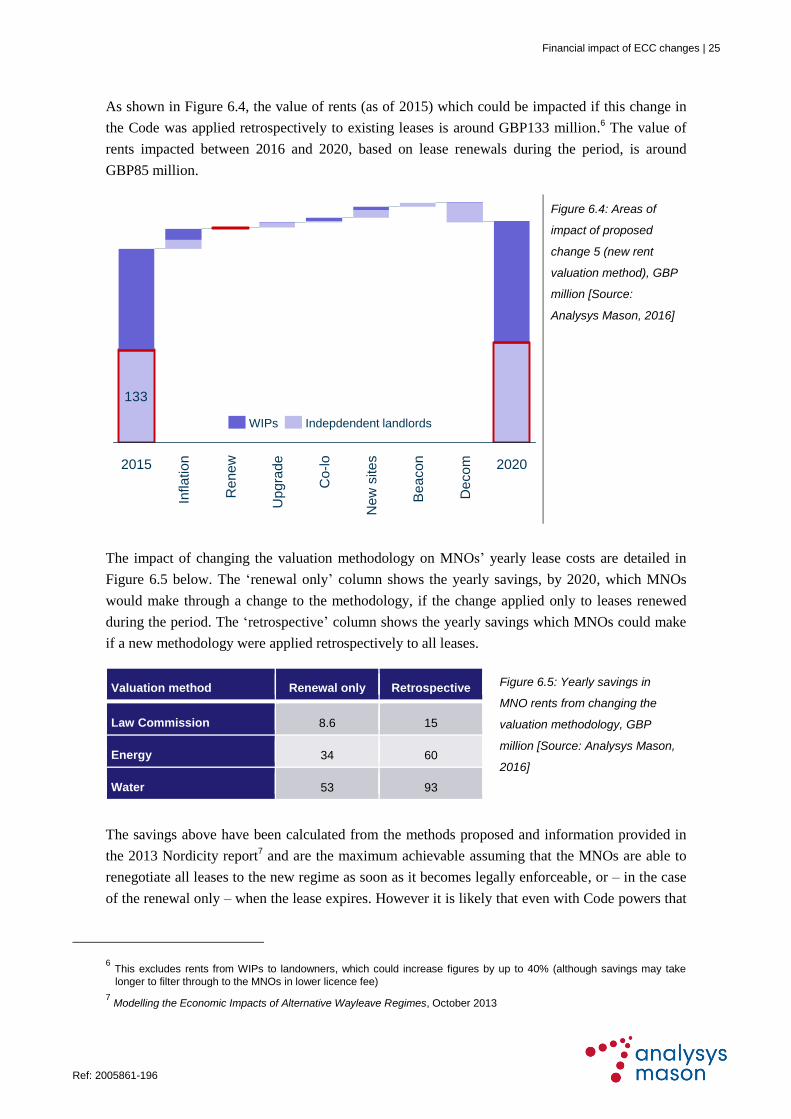
The impact of changing the valuation methodology on MNOs’ yearly lease costs are detailed in
Figure 6.5 below. The ‘renewal only’ column shows the yearly savings, by 2020, which MNOs
would make through a change to the methodology, if the change applied only to leases renewed
during the period. The ‘retrospective’ column shows the yearly savings which MNOs could make
if a new methodology were applied retrospectively to all leases.
Valuation method Renewal only Retrospective
Law Commission 8.6 15
Energy 34 60
Water 53 93
Figure 6.5: Yearly savings in
MNO rents from changing the
valuation methodology, GBP
million [Source: Analysys Mason,
2016]
The savings above have been calculated from the methods proposed and information provided in
the 2013 Nordicity report7 and are the maximum achievable assuming that the MNOs are able to
renegotiate all leases to the new regime as soon as it becomes legally enforceable, or – in the case
of the renewal only – when the lease expires. However it is likely that even with Code powers that
6 This excludes rents from WIPs to landowners, which could increase figures by up to 40% (although savings may take
longer to filter through to the MNOs in lower licence fee)
7 Modelling the Economic Impacts of Alternative Wayleave Regimes, October 2013
133
Upgra
de
Be
aco
n
Decom
Co
-lo
New
sites
Renew 2020
Inflation2015
WIPs Indepdendent landlords
26 | Financial impact of ECC changes
Error! U nknown document propert y name. Ref: 2005861-196
provide for utility land rents the MNOs would not enforce this low level of rent on renewal, so the
actual savings could be significantly less.
Providing the MNOs with an enforceable and low level of rent may cause friction at the interface
between MNOs, agents and landowners as the market resets expectations regarding the rents
achievable from MNOs. Depending on the level of changes and the parties involved, that friction
may become a public issue which could involve other Government departments.
The figures above do not include the impact that changing the valuation regime would have on
WIPs’ costs. WIPs are generally Code operators themselves and as they host Code operators, they
can enforce the Code on their land owners. Thus the WIPs could also benefit from reduced land
rents should the valuation regime change: we estimate that they could see savings of up to 40% of
the above figures. The same comment about the application of the Code applies to the WIPs as it
does to the MNOs, so it is unlikely that the WIPs would benefit from negotiating rents down to the
level provided by the Code. It is possible that WIPs could eventually pass on these savings to the
MNOs through lower licence fees, although this may take time and would be based on the
commercial pressure the MNOs could apply should WIPs’ infrastructure not be included in the Code.
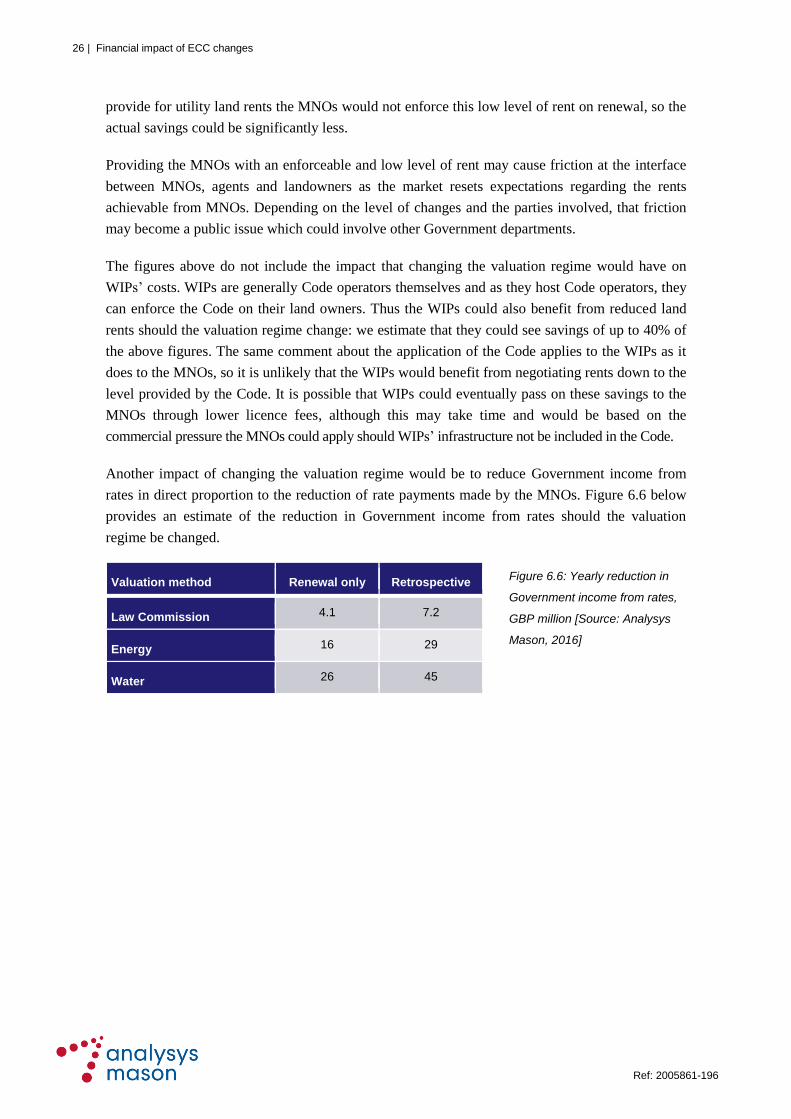
Another impact of changing the valuation regime would be to reduce Government income from
rates in direct proportion to the reduction of rate payments made by the MNOs. Figure 6.6 below
provides an estimate of the reduction in Government income from rates should the valuation
regime be changed.
Valuation method Renewal only Retrospective
Law Commission 4.1 7.2
Energy 16 29
Water 26 45
Figure 6.6: Yearly reduction in
Government income from rates,
GBP million [Source: Analysys
Mason, 2016]
Financial impact of ECC changes | 27
Ref: 2005861-196 Error! U nknown document propert y name.
7 Timing considerations
Given the long lead times required to auction spectrum and deploy networks, the timings of any
changes to the ECC must be considered alongside the 5G coverage roll-out timeframe.
It has been suggested by the industry that the main 5G coverage band will be the 700MHz band,
which Ofcom will auction. The 700MHz band has to be cleared from the existing use (digital
terrestrial television) before the MNOs can deploy 5G services in it. No clearance target date has
been announced by Government, but the end of 2021 is considered a backstop ‘no later than’ date
for clearance. An auction date will be announced to reflect the clearance timetable in due course.
Depending on the final dates for clearance and the auction, it is likely that there will need to be
negotiations between MNOs, WIPs and independent landowners during the period 2017–2020 to
enable 5G roll-out to take place.
28 | Financial impact of ECC changes
Error! U nknown document propert y name. Ref: 2005861-196
Annex A Project Beacon
Project Beacon is a RAN-sharing arrangement between Vodafone and O2 in which active
equipment is owned by each MNO separately, but ground lease, tower and passive equipment are
shared through the medium of the joint venture CTIL (Cornerstone Telecoms Infrastructure
Limited).
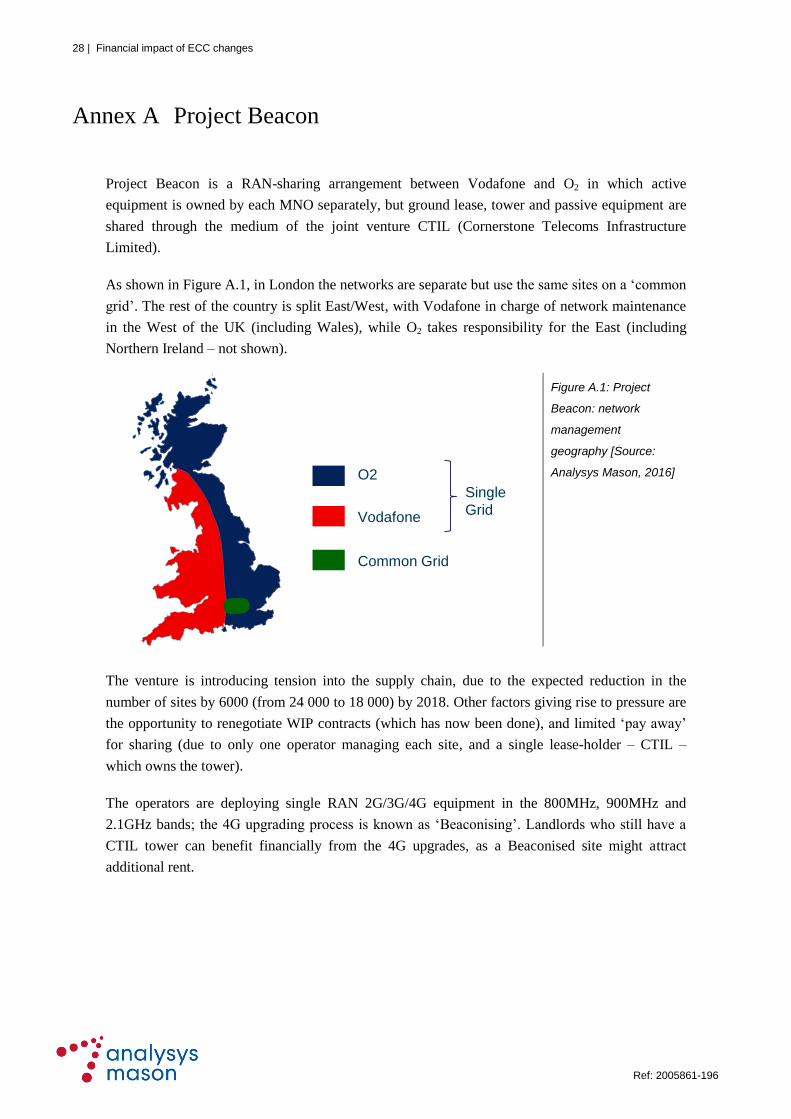
As shown in Figure A.1, in London the networks are separate but use the same sites on a ‘common
grid’. The rest of the country is split East/West, with Vodafone in charge of network maintenance
in the West of the UK (including Wales), while O2 takes responsibility for the East (including
Northern Ireland – not shown).
Figure A.1: Project
Beacon: network
management
geography [Source:
Analysys Mason, 2016]
The venture is introducing tension into the supply chain, due to the expected reduction in the
number of sites by 6000 (from 24 000 to 18 000) by 2018. Other factors giving rise to pressure are
the opportunity to renegotiate WIP contracts (which has now been done), and limited ‘pay away’
for sharing (due to only one operator managing each site, and a single lease-holder – CTIL –
which owns the tower).
The operators are deploying single RAN 2G/3G/4G equipment in the 800MHz, 900MHz and
2.1GHz bands; the 4G upgrading process is known as ‘Beaconising’. Landlords who still have a
CTIL tower can benefit financially from the 4G upgrades, as a Beaconised site might attract
additional rent.
O2
Vodafone
Common Grid
Single
Grid