financial disintermediation in international markets and ... · pdf filefinancial...
TRANSCRIPT
(*) José María Serena Garralda, of the Associate Directorate General of International Affairs, Banco de España. The
author thanks comments of Ricardo Correa, Emilio Muñoz de la Peña, Daniel Nolle, Adrian van Rixtel, Eric Wong,
and an anonymous referee.
This article is the exclusive responsibility of the author and does not necessarily reflect the opinion of the Banco de
España or the Eurosystem.
José María Serena Garralda (*)
FINANCIAL DISINTERMEDIATION IN INTERNATIONAL MARKETS AND GLOBAL BANKS
FUNDING MODELS


BANCO DE ESPAÑA 111 ESTABILIDAD FINANCIERA, NÚM. 26
FINANCIAL DISINTERMEDIATION IN INTERNATIONAL MARKETS AND GLOBAL
BANKS FUNDING MODELS
This paper investigates the process of financial disintermediation in international markets
after the global financial crisis. Since the outbreak of the crisis, global banks are reducing their
cross-border positions, this way reversing their large expansion in the period 2000-2008.
Global banks funding structures are shifting in parallel, with a sharp and protracted reduction
in wholesale funding. We test whether this trend towards more stable funding patterns
explains the contraction in cross-border bank financing, using a panel of 56 countries, for the
period 1991-2013. We find that net redemptions of banks’ international debt or the declining
activity of global banks’ branches in the US important drivers of the process. We highlight
next how, in some regions, financial disintermediation is a defining feature of the post-crisis
international markets. International capital markets have gained importance as source of
external financing for private borrowers headquartered in emerging economies, supported by
easy monetary conditions in advanced economies. The potential implications of such process
for financial stability have raised concerns. Assessing them requires further information on
bond holders’ investment profiles, and borrowers’ financial soundness.
The process of financial integration experienced a turning point after the global financial crisis.
Global banking is today described by cross-border fragmentation. Cross-border bank claims
are experiencing a sustained and deep contraction which lasts since the outbreak of the global
financial crisis. The contraction of cross-border interbank claims is sharper, but cross-border
claims vis-à-vis non banks have also remained subdued – Chart 1 –. It is also apparent in this
chart how non-financial corporations’ debt issuances at international markets have increased
protractedly, in the same period. Issuances are nearly three times higher than in 2008, and
have reached an all-time high after the global financial crisis.1 Financial disintermediation
seems therefore a defining feature of the post-crisis international markets.
The process of cross-border bank deleveraging is a reversal of the rapid expansion of banks’
cross-border activity in the period 2000-2008, which was fostered by the development of
1 Introduction
SOURCE: BIS.
a
BANKING FRAGMENTATION AND NON-FINANCIAL COMPANIES ACCESS TO CAPITAL MARKETS (a) CHART 1
-15
-10
-5
0
5
10
15
20
25
-50
0
50
100
150
200
250
300
350
1992 1994 1996 1998 2000 2002 2004 2006 2008 2010 2012
NON-FINANCIAL CORPORATIONS ISSUANCES (4Q)
CROSS-BORDER BANK FLOWS, ON NON-BANKS (right-hand scale)
CROSS-BORDER INTERBANK FLOWS (right-hand scale)
US n % of
1 Cross-border bank deleveraging also contrasts with the resilience of other models of internationally expansion. For
instance, banking subsidiaries’ local claims have grown, a development attributed to the stability of their funding
models, based on local liabilities and capital [CIEPR (2012)].

BANCO DE ESPAÑA 112 ESTABILIDAD FINANCIERA, NÚM. 26
centralized funding structures. Banking groups headquartered in a number of advanced
economies, in particular euro area countries, obtained wholesale funding in international
markets, and invested them worldwide [CGFS (2010c), McCauley, McGuire and Von Peter
(2010), Shin (2012)]. Today, these global banks funding structures are shifting in parallel to
cross-border bank deleveraging.2 Wholesale funding is contracting, as part of broader shifts
towards more stable funding sources.
These shifts in banks’ funding patterns are particularly relevant in financial centres [Serena
and Valdeolivas (2014)]. Global banks’ branches in the US, which were used as funding
vehicles during the period 2000-2008, are no longer a source of financial resources for
their banking groups [Goulding and Nolle (2012)]. EU and US banks branches in offshore
centres such as Hong-Kong are experiencing similar changes (HKMA (2013). The changes
in international funding patters are broad, and are not limited to these few, although
relevant, financial centres [Caruana and Van Rixtel (2012)]. Banks international net
issuances are contracting sharply on an aggregate basis. Cross-border interbank liabilities
are also contracting, in particular by banks headquartered in advanced economies
[García-Luna and Van Rixtel (2014)]. Global banks activity from financial hubs remains
subdued. Regulatory reforms, either at the global level, or in home and host countries, are
among the main underlying factors [Tarullo (2012, 2014), CGFS (2010c), Gambacorta and
Van Rixtel (2013)]. Therefore, this trend towards more stable funding models is probably
of permanent nature. Global banks which expanded overseas by establishing locally
funded and capitalized subsidiaries have been more resilient.
In stark contrast with global banks’ cross-border deleveraging, international capital markets
show a strong dynamism. International issuances – bonds issued by non-residents, in all
markets –, have increased, particularly in emerging economies [Goodhart (2014), Turner
(2014)]. It has been suggested that banks could be “losing ground” in favour of international
capital markets [BIS (2013), Deutsche Bank (2014)].
These developments pose a number of interesting, unexplored, and pressing questions. Are
cross-border bank disinvestments driven by the contraction in global banks international
wholesale funding? Are capital markets counterbalancing global banks cross-border
deleveraging? And, which are the implications for the transmission of global liquidly across
borders?
The objective of this paper is to shed light on these issues. We will argue that banking
fragmentation reflects, to some extent, a post-crisis reassessment of global banks
business models. Banks are obtaining less funding from international wholesale markets.
These changes have global reach implications, frequently overlooked. International
wholesale funding was instrumental to finance cross-border activity. Accordingly, its
shrinking importance could be a driver of cross-border bank deleveraging.
We investigate econometrically this hypothesis, building on a database comprising
quarterly data for 56 countries, emerging and advanced, for the period 1991-3Q2013. Our
results suggest that new funding patterns are among the key factors behind the sharp
contraction in cross-border bank flows, and therefore impacting on financial integration.
2 Global bank are those which have any activity of international reach -outside the country where the parent bank is
headquartered. They are also known as internationally active banks. Global banks can expand abroad using different
models [McCauley et al. (2010)]. We are implicitly focusing on the so-called international banks, which expand
through cross-border investments, and centralized funding. Multinational banks are another typology of global
banks, not analyzed in this article. They expand overseas by establishing subsidiaries, with a decentralized funding
structure. Foreign subsidiaries are locally funded and capitalized, so multinational banks gain international.

BANCO DE ESPAÑA 113 ESTABILIDAD FINANCIERA, NÚM. 26
We show next how heightened activity in capital markets, coupled with the steady
shrinkage of cross-border banking activity, has implied, from the perspective of recipient
countries, a shift in the composition of their external financing. There is an ongoing trend
towards financial disintermediation: countries obtain less international financing from
banks, and more from capital markets. Geographical breakdowns show that, in areas such
as Emerging Asia or Latin America, capital markets have gain relative importance relative
to banks’ cross-border credit. In these countries, non-financial corporations’ issuances
have reached all-time high volumes. It remains open whether this substitution is short-
lived, since other factors, such as the accommodative monetary policy in advanced
economies, have been supportive [Lo Luca et al. (2014)]. Moreover, for some borrowers, such
as SMEs, capital markets could be an imperfect substitute of cross-border bank financing
[Larosière (2013)]. The increasing access to capital markets by banks headquartered in
emerging economies is also remarkable.
The rest of the article is structured as follows. In Section 2, we describe in detail how
global banks funding in international markets is decreasing after the global financial crisis.
In Section 3, we investigate econometrically the impact of these shifts on cross-border
bank investments. In Section 4, we depict the main changes in financial integration after
the global financial crisis. Finally, in Section 5, we discuss the main implications of these
trends, and the questions they open. Large international debt issuances pose risks, either
overborrowing or currency mismatches. Bond markets could be new carriers of global
liquidity. The impact of tightening of global liquidity conditions on bond holders investment
decisions would depend on the investors risk profile, investment horizon, or leverage.
In this section we discuss how global banks have reduced their reliance on international
wholesale financing. Wholesale international financing was instrumental to finance global
banks cross-border expansion. Therefore the current decline in international financing is a
reversal of the previous process, and has far-reaching implications for financial integration.
Whole sale funding refers to all financing from non-retail sources. Retail funding are mostly
small, insured deposits, and similar instruments, such as promissory notes. Wholesale funding
includes a wide range of financial instruments: debt instruments, interbank loans, and any
other liabilities versus institutional investors.3
The trend towards more stable funding patterns is being analyzed at length, using
consolidated balance sheets – see for instance, IMF (2013), for a global analysis, or ECB
(2012), for an analysis of euro area developments –.
We focus instead on the international dimension. Global banks usually tap wholesale funding
in international markets, either by issuing debt in international markets, through cross-border
interbank loans, or by using branches in key financial centres as funding vehicles.
International funding patters are not easy to analyze systematically, so we use two different
approaches. We show first descriptive evidence on global banks branches activity in key
financial centres, such as US and Hong-Kong. As a second step, we show evidence on
aggregate funding patterns of global banks in international markets, either through debt
issuance, or through cross-border interbank financing. Both approaches suggests global
banks have decreased their wholesale funding in international markets.
2 Global banks funding
patterns after the
global financial crisis
3 Wholesale funding can have different maturities, or degree of stability, which are not discussed in this section
[see Chen et al. (2012)].

BANCO DE ESPAÑA 114 ESTABILIDAD FINANCIERA, NÚM. 26
The US financial market has been for years a key funding location for non-US international
banks. The depth of its financial markets and the prominence of the US dollar as currency
of invoice make it an attractive financial centre. Global banks’ branches in the US have
therefore an important role as funding vehicles of their banking groups.4
Their activity has experienced two dramatic shifts despite the apparent stability of
branches’ activities - their balance sheets have increased in size since the onset of the
global financial crisis. These shifts have to do with the balance sheets composition, as
shown in Chart 2 [see Goulding and Nolle (2012) for a detailed analysis].
2.1 BRANCHES OF FOREIGN
BANKS IN KEY FINANCIAL
CENTRES
4 Foreign banking offices in the US are either branches (and agencies) or subsidiaries. Foreign-owned subsidiaries
are US commercial banks, of which a foreign banking organization owns at least 25 percent. US branches and
agencies of foreign banks are incorporated in their foreign banking organizations. Foreign-owned subsidiaries
and US branches of foreign banks have very different activities, analyzed in detail in Goulding and Nolle (2012).
SOURCE: US Financial Accounts; 4.30 Assets and Liabilities of U.S. Branches and Agencies of Foreign Banks.
a
Bank credit Deposits
Securities Large ti e deposits
Loans and leases Other deposits
nterbank loans
Cash assets Borrowings
Trading assets Trading liabilities
Other assets Other liabilities
Net due to Due to / F related
foreign of ces
Assets Liabilities
BRANCHES OF GLOBAL BANKS IN THE US, SELECTED BALANCE SHEET ITEMS (a) CHART 2
0
500
1,000
1,500
2,000
2,500
2000 2002 2004 2006 2008 2010 2012
SECURITIES TRADING ASSETS LOANS
CASH OTHER ASSETS NET DUE TO
INTERBANK LOANS
2.1 ASSETS
USD bln
0
500
1,000
1,500
2,000
2,500
2000 2002 2004 2006 2008 2010 2012
LONG TIME DEPOSITS TRADING LIABILITIES
BORROWINGS OTHER DEPOSITS
OTHER LIABILITIES NET DUE TO
2.2 LIABILITIES
USD bln
-600
-400
-200
0
200
400
600
800
1,000
1,200
1,400
1,600
2000 2002 2004 2006 2008 2010 2012
NET DUE TO
DUE FROM RELATED FOREIGN OFFICES (INTEROFFICE ASSET)
DUE TO RELATED FOREIGN OFFICES (INTEROFFICE LIABILITY)
USD bln
2.3 NET DUE TO 2.4 US BRANCHES, BALANCE SHEET
BANCO DE ESPAÑA 115 ESTABILIDAD FINANCIERA, NÚM. 26
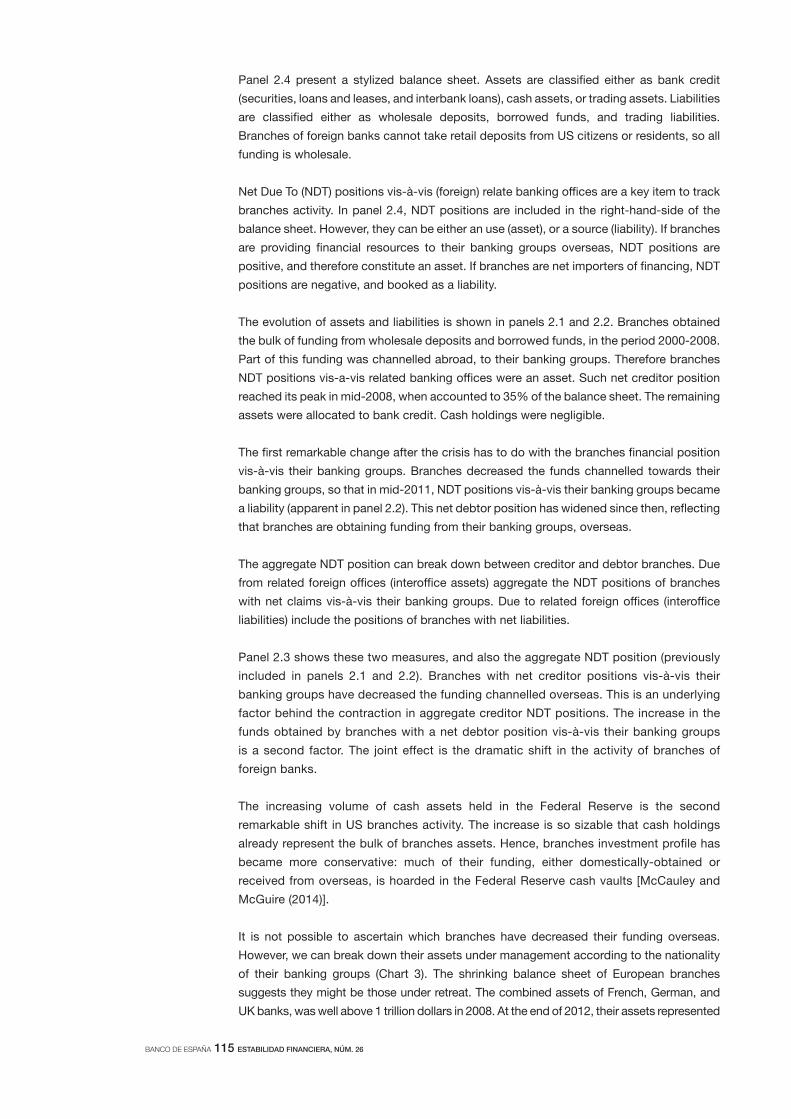
Panel 2.4 present a stylized balance sheet. Assets are classified either as bank credit
(securities, loans and leases, and interbank loans), cash assets, or trading assets. Liabilities
are classified either as wholesale deposits, borrowed funds, and trading liabilities.
Branches of foreign banks cannot take retail deposits from US citizens or residents, so all
funding is wholesale.
Net Due To (NDT) positions vis-à-vis (foreign) relate banking offices are a key item to track
branches activity. In panel 2.4, NDT positions are included in the right-hand-side of the
balance sheet. However, they can be either an use (asset), or a source (liability). If branches
are providing financial resources to their banking groups overseas, NDT positions are
positive, and therefore constitute an asset. If branches are net importers of financing, NDT
positions are negative, and booked as a liability.
The evolution of assets and liabilities is shown in panels 2.1 and 2.2. Branches obtained
the bulk of funding from wholesale deposits and borrowed funds, in the period 2000-2008.
Part of this funding was channelled abroad, to their banking groups. Therefore branches
NDT positions vis-a-vis related banking offices were an asset. Such net creditor position
reached its peak in mid-2008, when accounted to 35% of the balance sheet. The remaining
assets were allocated to bank credit. Cash holdings were negligible.
The first remarkable change after the crisis has to do with the branches financial position
vis-à-vis their banking groups. Branches decreased the funds channelled towards their
banking groups, so that in mid-2011, NDT positions vis-à-vis their banking groups became
a liability (apparent in panel 2.2). This net debtor position has widened since then, reflecting
that branches are obtaining funding from their banking groups, overseas.
The aggregate NDT position can break down between creditor and debtor branches. Due
from related foreign offices (interoffice assets) aggregate the NDT positions of branches
with net claims vis-à-vis their banking groups. Due to related foreign offices (interoffice
liabilities) include the positions of branches with net liabilities.
Panel 2.3 shows these two measures, and also the aggregate NDT position (previously
included in panels 2.1 and 2.2). Branches with net creditor positions vis-à-vis their
banking groups have decreased the funding channelled overseas. This is an underlying
factor behind the contraction in aggregate creditor NDT positions. The increase in the
funds obtained by branches with a net debtor position vis-à-vis their banking groups
is a second factor. The joint effect is the dramatic shift in the activity of branches of
foreign banks.
The increasing volume of cash assets held in the Federal Reserve is the second
remarkable shift in US branches activity. The increase is so sizable that cash holdings
already represent the bulk of branches assets. Hence, branches investment profile has
became more conservative: much of their funding, either domestically-obtained or
received from overseas, is hoarded in the Federal Reserve cash vaults [McCauley and
McGuire (2014)].
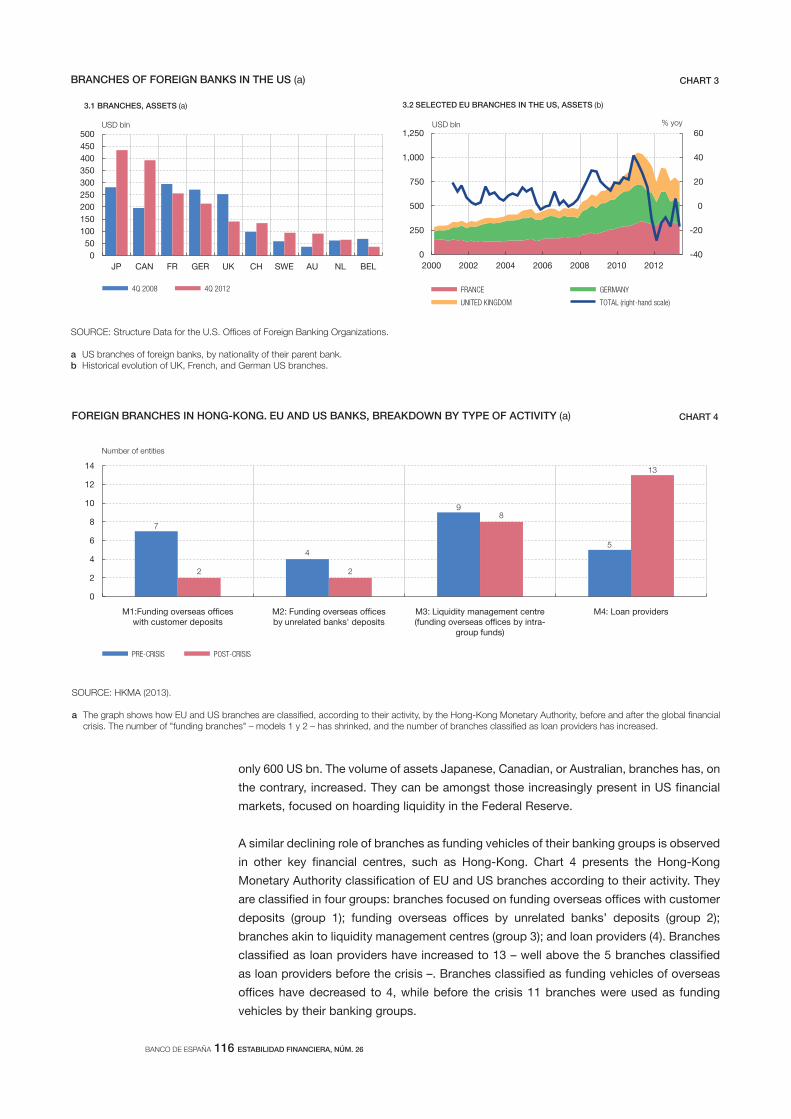
It is not possible to ascertain which branches have decreased their funding overseas.
However, we can break down their assets under management according to the nationality
of their banking groups (Chart 3). The shrinking balance sheet of European branches
suggests they might be those under retreat. The combined assets of French, German, and
UK banks, was well above 1 trillion dollars in 2008. At the end of 2012, their assets represented
BANCO DE ESPAÑA 116 ESTABILIDAD FINANCIERA, NÚM. 26
only 600 US bn. The volume of assets Japanese, Canadian, or Australian, branches has, on
the contrary, increased. They can be amongst those increasingly present in US financial
markets, focused on hoarding liquidity in the Federal Reserve.
A similar declining role of branches as funding vehicles of their banking groups is observed
in other key financial centres, such as Hong-Kong. Chart 4 presents the Hong-Kong
Monetary Authority classification of EU and US branches according to their activity. They
are classified in four groups: branches focused on funding overseas offices with customer
deposits (group 1); funding overseas offices by unrelated banks’ deposits (group 2);
branches akin to liquidity management centres (group 3); and loan providers (4). Branches
classified as loan providers have increased to 13 – well above the 5 branches classified
as loan providers before the crisis –. Branches classified as funding vehicles of overseas
offices have decreased to 4, while before the crisis 11 branches were used as funding
vehicles by their banking groups.
ab
BRANCHES OF FOREIGN BANKS IN THE US (a) CHART 3
0
50
100
150
200
250
300
350
400
450
500
JP CAN FR GER UK CH SWE AU NL BEL
4Q 2008 4Q 2012
USD b
3.1 BRANCHES, ASSETS (a)
-40
-20
0
20
40
60
0
250
500
750
1,000
1,250
2000 2002 2004 2006 2008 2010 2012
FRANCE GERMANY
UNITED KINGDOM TOTAL (right-hand scale)
USD b
% o
3.2 SELECTED EU BRANCHES IN THE US, ASSETS (b)
SOURCE: HKMA (2013).
a
FOREIGN BRANCHES IN HONG-KONG. EU AND US BANKS, BREAKDOWN BY TYPE OF ACTIVITY (a) CHART 4
7
4
9
5
2 2
8
13
M1:Funding overseas with deposits
M2: Funding overseas by unrelated banks' deposits
M3: Liquidity anage ent (fu by intra-
group funds)
M4: Loan providers
0
2
4
6
8
10
12
14
PRE-CRISIS POST-CRISIS
N er o n i ies

BANCO DE ESPAÑA 117 ESTABILIDAD FINANCIERA, NÚM. 26
We turn now to the analysis of global banks aggregate funding patterns in international
markets: international bond issuances, cross-border interbank liabilities, and global banks
activity in financial hubs.
BIS securities data track net international issuances, classifying banks according to the
nationality of their banking groups. The information is compiled on a national basis, so that
issuances by foreign subsidiaries, branches, or vehicles are classified according to the
nationality of the ultimate owner of the entity. Therefore, international bond issuances are
those in which the ultimate issuer is not headquartered in the market of issuance.
Chart 5 shows the protracted contraction of net aggregate international issuances –represented
by the black line, included in both panels. This trend is driven by the deleveraging of banks
headquartered in UK, US, Switzerland and most euro area banking systems, which are
redeeming international debt, on net basis. Other banks, headquartered in emerging (Brazil or
China) and some advanced economies (Canada, Norway, or Sweden) have increasingly
tapped international markets after the global financial crisis. However, their increase is not
large enough to compensate the large and protracted redemption of debt by the aforementioned
banking systems
The net redemptions of global banks’ international debt might reflect different factors,
ranging from temporary closures of financial markets in some banking systems, to higher
funding costs, or, structural policy-driven changes in funding models. Whichever is the
reason, they imply less towards less wholesale funding in international financial markets.
There are broader changes in banks’ debt issuances after the global financial crisis, not
easily grasped in aggregate data. Bank-level data suggests that debt issuances have
experienced significant composition effects [see Van Rixtel and Gasparini (2013), for an
analysis on euro area patterns]. Debt issuances have shifted towards secured funding. In
some banking systems, government sponsored issuances increased, and a higher fraction
of bond issuance was retained, to be used as collateral. As collateralized debt issuances
2.2 INTERNATIONAL
WHOLESALE FINANCING
SOURCE: BIS.
a The graph shows the recent evolution of banks net international bond issuances. International bond issuances are those issued outside the market where the
to the nationality of their banking group. Panel A shows net international issuances of banking systems which are deleveraging. These include mostly european banks, and the US. Euro area includes France, Germany, Italy, and Spain .Panel B shows net international issuances of banks tapping international markets, such as emerging market banking systems, and also a number of developed countries which includ Canada, Norway, or Sweden. The blue line represents global banks total issuances.
b Germany, France, Italy and Spain.
BANK ISSUANCES IN INTERNATIONAL MARKETS. BREAKDOWN BY NATIONALITY OF PARENT BANK (a) CHART 5
-200
-100
0
100
200
300
400
500
600
-600
-400
-200
0
200
400
600
800
1,000
2001 2002 2003 2004 2005 2006 2007 2008 2009 2010 2011 2012 2013
SWITZERLAND UNITED STATES
UNITED KINGDOM EURO AREA (b)
TOTAL (right-hand scale)
USD bln
USD bln
-150
0
150
300
450
600
-40
0
40
80
120
160
2001 2002 2003 2004 2005 2006 2007 2008 2009 2010 2011 2012 2013
CANADA NORWAY
CHINA SWEDEN
BRAZIL TOTAL (right-hand scale)
USD bln USD bln

BANCO DE ESPAÑA 118 ESTABILIDAD FINANCIERA, NÚM. 26
increased substantially after the global financial crisis, asset encumbrance became a risk,
amidst heightened counterpart credit risk, and ongoing regulatory reforms. The process had
probably implications for banks cross-border activity, since reflected scarcer unsecured
funding and, altogether, an increase in funding costs [CGFS (2013)]. Such analysis is, however,
beyond the scope of this paper.
Cross-border interbank liabilities have also contracted sharply, in particular between advanced
economies banks. Panel 6.1 shows the evolution of cross-border interbank loans. Interbank
liabilities, measured in GDP terms, reached to 90% of GDP in advanced economies at the
end of 2008, and 60% excluding financial centres. Interbank liabilities also increased in
emerging economies, although to lower levels – an average of 30% of GDP –.
The outbreak of the global financial crisis was a turning point in cross-border interbank
financing. Cross-border interbank liabilities have contracted protractedly, in every quarter
since 2009. The stock of cross-border interbank liabilities in advanced economies has
halved, while that of emerging economies is 35% lower than its peak. The reduction in
cross-border interbank liabilities reflects, in some banking systems, less financing
obtained from overseas. It can reflect as well lesser degree of liquidity management from
financial hubs.
The subdued activity of global banks from their banking offices operating in financial hubs is
apparent in panel 6.2. Cross-border assets and liabilities booked by banking offices in
financial centers increased sharply, and with great synchronization, in the period 2000-2008.
They suffered a sharp reversal and, after a short-lived recovery, cross-border banking activity
is contracting again. This is consistent with evidence of lower activity by global banks from
financial centers. Banks headquartered in the euro area or Switzerland are amongst those
reducing their cross-border interbank activity from United Kingdom [García-Luna and Van
Rixtel (2014)].
SOURCE: BIS Locational Banking Statistics, national accounts.
a
b
INTERBANK LIABILITIES AND FINANCIAL HUBS CHART 6
0
10
20
30
40
50
60
70
80
90
100
-25
-20
-15
-10
-5
0
5
10
15
20
25
1981 1985 1989 1993 1997 2001 2005 2009 2013
ADVANCED, STOCK (right-hand scale) ADVANCED, FLOWS ALL COUNTRIES, STOCK (right-hand scale) EXCLUDING FINANCIAL CENTRES, STOCK (right-hand scale)
% of GDP % of GDP
6.1 INTERBANK LIABILITIES. CROSS-BORDER (a)
1993 1995 1997 1999 2001 2003 2005 2007 2009 2011 2013
-2,000
-1,000
0
1,000
2,000
3,000
INTERNATIONAL ISUANCES CROSS-BORDER BANK ASSETS, FLOWS CROSS-BORDER BANK LIABILITIES, FLOWS
USD bln
6.2 FINANCIAL HUBS AND GLOBAL BANKING ACTIVITY (b)

BANCO DE ESPAÑA 119 ESTABILIDAD FINANCIERA, NÚM. 26
In this section we investigate econometrically the drivers of cross-border banking activity
building on the previous work of Bruno and Shin (2013). Our focus lies on the statistical
and economic significance of different measures of global banks reliance on international
wholesale funding. The results confirm that cross-border bank investments depend
positively on global banks international wholesale funding. As for the economic significance,
the sharp contraction in banks’ international wholesale funding explains 1/3 of the cross-
border bank flows reduction after the global financial crisis.
International banks are shedding cross-border bank assets, in parallel to their contraction
in wholesale international funding. The process is impacting on countries’ international
financing, as shown in Chart 7.
In this chart, dots represent countries’ reliance on different sources of funding, measured in
GDP terms, before and after the crisis (horizontal and vertical axis). Dots above the bisecting
line reflect a country is relying more on a given source of financing after the crisis. We break
down international financing between cross-border claims on non-banks (panel 7.1),
cross-border interbank claims (panel 7.2), financial corporations’ international issuances
(panel 7.3), and non-financial corporations’ international issuances (panel 7.4). This
highlights how countries financing patterns are changing.
3 Drivers of cross-border
bank flows.
Econometric analysis
3.1 PRELIMINARY EVIDENCE
SOURCES: BIS, International Banking Statistics; BIS Securities Statistics; national accounts, owns elaboration.
aCross-border claims on non-banks and Cross-border claims on banks. Pre-crisis average is the average of 2005, 2006, and 2007; Post-crisis average is the average of 2010, 2011, 2012, and 2013. Each dot represents a country: advanced countries are represented in blue, Emerging Europe countries in green, and the rest of emerging economies (Asian, Latin American, and a number of countries of Africa & Middle East) in red. If points are above the bisecting line, countries
FINANCIAL INTEGRATION AFTER THE CRISIS. CROSS-COUNTRY ANALYSIS (a) CHART 7
-1.0
-0.5
0.0
0.5
1.0
1.5
2.0
2.5
-1.0 -0.5 0.0 0.5 1.0 1.5 2.0
Post-crisis, average
7.4 NON-FINANCIAL CORPORATIONS BONDS, CHANGE IN PP GDP
Pre-crisis, average
-6
-4
-2
0
2
4
6
8
10
12
-5 0 5 10 15 20
ADVANCED EMERGING EMERGING EUROPE
Post-crisis, average
7.3 FINANCIAL CORPORATIONS BONDS, CHANGE IN PP GDP
Pre-crisis, average
-10
-8
-6
-4
-2
0
2
4
-2 0 2 4 6 8 10
ADVANCED EMERGING EMERGING EUROPE
Post-crisis, average
7.1 CROSS-BORDER CLAIMS ON NON-BANKS, CHANGE IN PP GDP
Pre-crisis, average
-15
-10
-5
0
5
10
15
-5 0 5 10 15 20
Post-crisis, average
7.2 CROSS-BORDER CLAIMS ON BANKS, CHANGE IN PP GDP
Pre-crisis, average

BANCO DE ESPAÑA 120 ESTABILIDAD FINANCIERA, NÚM. 26
Cross-border bank flows on non-banks headquartered in advanced economies and emerging
Europe are contracting – panel 7.1 –, where most dots are below the bisecting line. The
impact on other emerging economies, represented as red dots, is less clear-cut. Cross-border
interbank flows have contracted even more sharply, in particular vis-a-vis advanced
economies – panel 7.2 –. As for financial corporations debt issuances in international markets,
there are net redemptions in most advanced economies – panel 7.3 –, although with some
relevant outliers. This contrasts with the large international issuances by financial corporations’
headquartered in number of emerging economies. These stylized facts are consistent with the
more aggregate pattern show in Chart 2. Finally, panel 7.4 shows how non-financial
corporations’ international debt issuances have increased. The increase is common to non-
financial companies headquartered in emerging and advanced economies alike, although
their size is still low, measured in GDP terms. We delve into this trend in Section 4.
We turn now to the econometric analysis on the drivers of cross-border bank flows. Our
panel data includes 56 countries – advanced, emerging, and financial hubs – which are
listed in Appendix 1. We use quarterly data for the period 1991-2013. We construct
measures of quarterly cross-border bank investments building on the BIS International
Banking Statistics: cross-border investments in all sectors (Table 6A); and on banks (cross-
border interbank claims, constructed as the difference between Tables 6A and 6B). We
define the dependent variable in Section 3.3.
To investigate the relevance of global banks funding patterns as drivers of cross-border
bank flows, we construct a number of proxies, detailed in Table 1.
Changes in outstanding volumes of global banks international bonds are deemed a
measure of banks’ international funding patterns. Global banks international bonds
increased before the global financial crisis, and are experiencing a protracted contraction
afterwards. We construct this variable using BIS Securities data to test if this is driving
global banks cross-border deleveraging.
Branches in the US were also a source of funding for global banks using centralized funding
models. We construct a measure of the Net Due To positions share in branches total assets,
using the Assets and Liabilities of U.S. Branches and Agencies of Foreign Banks (4.30). The
evolving relevance of centralized funding models are reflected in the sharp changes in NDT
positions. Branches Net Due To positions vis-à-vis their banking groups were large and
positive during the period 2000-2008. The declining importance of branches as funding
vehicles is reflected in the protracted reduction in creditor NDT positions. We expect
decreases in net creditor NDT positions to impact negatively on cross-border bank flows.
3.2 DATA ISSUES
SOURCE: Author's elaboration.
Description Source
Banks international
issuances (+)
Quarterly change in the outstanding total stock of banks
international debt securities
BIS, Table 12
US branches
funding (+)
Quarterly change in the net due to position of branches
of foreign banks, vis-a-vis their banking groups (positive if creditor)
Reserva Federal, Assets and Liabilities of
U.S. Branches and Agencies of Foreign
Banks (4.30)
Broker Dealer
Leverage (+)
Quarterly change in the, leverage of the broker-dealer sector US,
measured as the ratio (liabilities plus equity)/equity
Flow of Funds, L. 128
MEASURING GLOBAL BANKS INTERNATIONAL FUNDING. MAIN VARIABLES TABLE 1

BANCO DE ESPAÑA 121 ESTABILIDAD FINANCIERA, NÚM. 26
Branches have not separate capital, so it is not possible to compute their leverage.
However, there are shifts in branches risk-appetite. Their current liquidity hoarding,
described in Section 2.1, is an extreme example. US broker-dealer leverage is considered
a proxy of branches activity, since both institutional sectors are influenced by similar
factors [Bruno and Shin (2013)]. Therefore we compute the leverage of the US Broker-
Dealer sector, using the Flow of Funds, and introduce it as proxy of global banks activity
in wholesale funding markets. Higher leverage is expected to affect positively cross-
border bank flows.
Cross-border bank flows are expected to depend on other global factors, not directly
related to global banks funding patterns. These variables include world GDP growth, or
global risk aversion (measured by the VIX). The VIX can be interpreted a measure of global
banks risk-aversion. Alternatively the VIX can be considered a proxy of banks’ funding
costs in wholesale markets.
We include also a number of country-specific variables which are also expected to influence
cross-border bank flows. The selection is guided by previous work on determinants on
capital flows – pull factors –. The variables included as control variables are domestic GDP
growth, the current account balance, the sovereign rating, and measures of fiscal soundness
(fiscal balance and public debt). Countries with sounder economic fundamentals are
expected to receive more cross-border bank flows.
We estimate the following equation:
xb it = xb t-1 + ´f (local it ) + g (global t ) + i + y t + ϵ it [1]
where cross-border bank flows xb t-1 on country i, at quarter t, depend on a vector of
country-specific variables f(local it ) and a vector of global variables g(globalt). The latter
includes the measures of global banks funding patterns, and the remaining global factors
(VIX, and world GDP growth). The right-hand side variables include a lag of the dependent
variable, xbit-1, country-fixed effects, and time effects.
Cross-border bank flows xbit are quarterly flows, measured in GDP terms, and standardized
at the country-level. To standardize them we divide cross-border bank flows by their historical
(country-specific) standard deviation, following Broner et al. (2013).
xb it = ( XB it ⁄ PIB it ) / sd xb it [2]
This standardization is important. Cross-border bank flows received by countries, even
scaled by their GDP, have remarkable differences in size and volatility. This is apparent in
Chart 8 which plots the historical country-specific volatility of bank flows: volatility of
cross-border bank flows on non-banks is plotted in the horizontal axis, against the
interbank flows volatility, in the vertical axis. Each dot represents a country.
Panel 8.1 shows volatility of advanced and emerging economies, which are represented with
blue and red dots, respectively. It is apparent how volatility is much higher in advanced
economies. The chart also shows that cross-border interbank claims are more volatile than
claims on non-banks, since most of the dots are above the bisecting line. Panel 8.2 shows the
volatility of cross-border bank flows to financial hub. It is much higher than that of advanced
and emerging economies – to ease the comparison the average volatility of cross – border
bank flows to these countries is included.
3.3 ECONOMETRIC
FRAMEWORK

BANCO DE ESPAÑA 122 ESTABILIDAD FINANCIERA, NÚM. 26
Cross-border bank flows, once standardized, can be interpreted as deviations from each
country-specific dynamics. In Section 3.5, we rescale the results to gauge their economic
size in percentage points of GDP.
We estimate equation [1] with system-GMM. We instrument the three variables deemed
endogenous, which are the lag of the dependent variable, domestic GDP growth, and the
current account balance.5 In columns 1 to 3 our dependent variable are cross-border bank
flows on all counterparts.
Column 1 estimates the model for all countries. The results confirm that cross-border bank
flows depend on global banks reliance on international, wholesale, funding. Cross-border
bank flows depend positively on global banks issuances in international markets. Therefore,
net redemptions of banks international debt – Chart 2 – have as a by-product cross-border
asset shedding.
Cross-border bank flows depend positively on increases in the NDT position of branches
of foreign banks in the US vis-à-vis their banking groups. It implies that global banks have
more lending resources. Accordingly the sharp reversal in the funds channelled from US
markets to non-US global banks implies less cross-border banking activity. Finally, the
leverage of the US broker-dealer sector, a proxy of activity of wholesale, international
banks, also has the expected positive impact on cross-border bank flows.
As for the rest of global variables, cross-border bank flows depend positively on world global
growth. VIX increases impact negatively on cross-border bank investments. Cross-border
investments can be impaired by global banks heightened risk-aversion, proxied by the VIX.
Country-specific variables also are important determinants of cross-border bank flows.
Countries with higher GDP growth rates attract more bank flows, as do countries with
3.4 MAIN RESULTS
SOURCE: BIS (Locational Banking Statistics).
abc
CROSS-BORDER BANK FLOWS. HISTORICAL COUNTRY-SPECIFIC VOLATILITY (a) CHART 8
0
5
10
15
20
25
0 1 2 3 4 5 6 7 8
ADVANCED (b) EMERGING (b)
Standard deviation interbank cross-border invest ents % of
8.1 EMERGING AND ADVANCED COUNTRIES
Standard deviation cross-border invest ents on non-banks % of
0
10
20
30
40
50
60
70
80
90
-10 0 10 20 30 40 50 60 70 80 90
ADVANCED (AVERAGE) (c) EMERGING (AVERAGE) (c) FINANCIAL HUB (b)
Standard deviation interbank cross-border invest ents % of
8.2 EMERGING AND ADVANCED COUNTRIES AND FINANCIAL HUB
Standard deviation cross-border invest ents on non-banks % of
5 We use system-GMM to estimate all specifications. We introduce time dummies to control for cross-country
correlation. As for the number of lags used as instruments, we choose it so as to avoid having too many
instruments (as detailed in the tables). Following standard rules-of-thumb, we target a number of instrument
similar to N [Roodman (2006)]. Arellano-Bond autocorrelation tests are reported, while Hansen tests (not shown)
do not reject the null hypothesis that overidentifying restrictions are valid.

BANCO DE ESPAÑA 123 ESTABILIDAD FINANCIERA, NÚM. 26
better sovereign rating. Public debt to GDP ratios are negatively associated with cross-
border bank investments received. Other variables deemed as potentially relevant, such as
current account balance or the fiscal balance, are not statistically significant.
We conduct a number of robustness checks. First, we investigate if the results hold in different
country samples. In column 2 we exclude financial centres. These countries are not strictly
capital flows recipient countries, and share features with hubs which banks use to manage
liquidity routinely. Therefore their correlation with funding matters could be endogenous, and
not a connection between funding and asset shedding. We find very similar results.
In column 3, we estimate the model excluding also euro area countries. Financial integration in
Europe was boosted by the introduction of the euro. It was mostly bank-based, and had very
SOURCE: Author's elaboration.
a Robust standard errors in brackets; *** p<0.01, ** p<0.05, * p<0.1. Equations estimated using system GMM. Variables treated as endogenous are the lag of the dependent variable, domestic GDP growth, and the current account. We choose the number of lags used as instruments in order to avoid instrument proliferation, and taking into account residual autocorrelation paterns. In columns 1 and 3 the minimum lag is 1 and 2 for the levels and transformed equation; and the maximum
and euro area countries.
Dependent variable is cross border bank ows
tal
1
Excluding nancial centres
2
& Excluding euro area
3
Country speci c variables
0.399*** 0.236 0.417**
[0.121] [0.151] [0.162]
0.01 * 0.033*** 0.021
[0.010] [0.010] [0.037]
0.053** 0.042* 0.050
[0.024] [0.024] [0.036]
0.067*** 0.061*** 0.059***
[0.010] [0.012] [0.013]
0.003** 0.003 0.004
[0.002] [0.002] [0.003]
0.004 0.006 0.000
[0.013] [0.012] [0.026]
Global variables
0.177*** 0. 5*** 0.161***
[0.030] [0.034] [0.03 ]
0.247*** 0.19 * 0.121
[0. ] [0.107] [0.109]
0.109*** 0.104*** 0.106***
[0.021] [0.021] [0.026]
1.927*** 1.706*** 2.200***
[0.400] [0.461] [0.444]
1.356*** 1.225** 1.51 ***
[0.431] [0.499] [0.544]
Observations 3,977 3,413 2,542
Number of id 54 46 36
Instruments 56 53 44
est Arellano Bond AR 1 0. 36 0.0325 0.25
est Arellano Bond AR 2 0.352 0.739 0.311
Fiscal balance to GDP
Lag Bank ows GDP terms, standarized
Current account GDP terms
Domestic GDP growth
Standard & Poors Rating
Public debt to GDP
World GDP
VIX
BrokerDealer Leverage
US branches funding
Banks international issuances
CROSS-BORDER BANK FLOWS (a) TABLE 2

BANCO DE ESPAÑA 124 ESTABILIDAD FINANCIERA, NÚM. 26
specific features. Retail banking remained mostly national and interbank lending, or direct
cross-border investments boomed [Sapir and Wolff (2013)]. Since the outbreak of the crisis
cross-border interbank flows are experiencing a particularly protracted contraction. Financial
fragmentation can be attributed to an important extent to idiosyncratic developments
[Millaruelo and del Río (2013)]. Therefore it is sensible to test whether the results are robust
to the exclusion of euro area countries. Most of them hold in this alternative data sampling,
although cross-border bank flows do not depend on the VIX.
In Table 3 we present additional robustness checks. First, we analyze alternative time
spans. We expect cross-border bank flows to be more dependent on global financial
conditions in periods in which centralized funding models were more prominent. Therefore,
3.5 ADDITIONAL ROBUSTNESS
CHECKS. TIME SPANS, AND
SECTOR OF COUNTERPART
SOURCE: Author's elaboration.
a Robust standard errors in brackets; *** p<0.01, ** p<0.05, * p<0.1.Equations estimated using system GMM. Variables treated as endogenous are the lag of the dependent variable, domestic GDP growth, and the current account. We choose the number of lags used as instruments in order to avoid instrument proliferation, and taking into account residual autocorrelation paterns. In columns 1 and the minimum lag is 1 and 2 for the levels and transformed equation; and the maximum lag is 8 and 10. In columns 3 and 4 the minimum lag is 2 and 3 for levels and transfromed equation, and the maximum lag is 8 and 10, respectively). Hansen-Tests
Dependent variable is:
Until 1Q2010
(1)
1999-2010
(2)
All sample
(3)
1999-2010
(4)
Country-speci c variables
-0.423*** -0.565*** -0.478* -0.587***
[0.145] [0.186] [0.246] [0.190]
0.011 0.007 -0.113*** -0.105***
[0.038] [0.042] [0.038] [0.033]
0.025 0.011 0.033 -0.000
[0.032] [0.062] [0.048] [0.090]
0.067*** 0.092*** 0.045** 0.058**
[0.015] [0.017] [0.021] [0.027]
-0.008** -0.010* 0.002 0.000
[0.004] [0.005] [0.003] [0.004]
-0.015 -0.029 0.050 0.044
[0.027] [0.035] [0.033] [0.040]
Global variables
0.367*** 0.425*** 0.133*** 0.356***
[0.066] [0.085] [0.047] [0.112]
-0.347*** -0.437*** -0.266** -0.558***
[0.133] [0.159] [0.113] [0.193]
0.120*** 0.128*** 0.098*** 0.105***
[0.028] [0.028] [0.032] [0.035]
-2.666*** -2.920*** -1.801*** -2.270***
[0.422] [0.511] [0.450] [0.464]
1.515** 1.874* 1.142 1.648
[0.707] [1.068] [0.943] [1.189]
Observations 2,049 1,352 2,526 1,352
Number of id 34 34 36 34
Instruments 36 40 41 33
Test Arellano-Bond AR(1) 0.262 0.693 0.367 0.464
Test Arellano-Bond AR(2) 0.325 0.221 0.360 0.0721
World GDP
VIX
BrokerDealer Leverage
US branches funding
Banks international issuances
Current account - GDP terms
Domestic GDP growth
Standard & Poors Rating
Public debt to GDP
Fiscal balance to GDP
Cross-border bank claims Interbank claims
Lag Bank ows - GDP terms, standarized
ROBUSTNESS CHECKS (a) TABLE 3

BANCO DE ESPAÑA 125 ESTABILIDAD FINANCIERA, NÚM. 26
we estimate the model for different sub-periods: column 1 presents results of sub-period
1991-2010; while column 2 uses period 1999-2010. This is the period when centralized
funding models were more prevalent.
The results hold, qualitatively, in both sub-periods. Interestingly, a number of global variables
have higher economic size. The coefficient of the VIX – the measure of funding costs in
wholesale markets or global risk aversion – is highest in the period 1999-2010. We find a
similar increase in the economic size our three measures of global banks funding patterns.
World GDP growth has also a stronger economic impact on cross-border bank flows.
Finally, in columns 3 and 4 we use as dependent variable cross-border interbank claims
(claims on banks). They are the most volatile source of cross-border bank financing. The
results for the whole time span are qualitatively very similar to our benchmark results.
The results obtained in the sub-period 1999-2010 are also stronger.6 The main difference
is the non-significance coefficient of banks international issuances. Cross-border
interbank claims have probably shorter maturities, and they might be associated with
shorter-term liabilities.
We investigate next the economic size of our main results (Table 2, first column, obtained
excluding financial centres). In order to measure the quantitative importance of the shifting
funding patterns of global banks, we classify drivers in four groups: global banks funding
patterns, other global factors, country-specific factors, time effects. Non-significant
variables are included in the unexplained variation. We compute the average impact of
each group of variables at a country-level. Then we average this impact for advanced and
emerging economies, and compute their contribution to cross-border bank flows before
and after the crisis (pre: 1Q2000-3Q2008, post: 1Q2010-3Q2013). Since cross-border
bank flows, and its drivers, are measured in terms of (country-specific) standard deviations,
we need to rescale them. Therefore we multiply them by the average standard deviation of
cross-border bank flows in emerging and advanced economies. Chart 9 shows the
decomposition, for advanced and emerging economies (panel 9.1 and 9.2, respectively).
We present the information annualized.
Cross-border bank flows have experienced a sizable contraction, which is stronger in
advanced economies. In these countries, cross-border bank flows are, on average, 20 pp
of GDP lower than before the global financial crisis.
The contraction of international wholesale funding represents the key driver. Indeed, global
banks new funding patterns predict a contraction in flows twice as important as the observed.
Other global factors (including world GDP growth and risk aversion) explain 15% of that
reduction. As for country-specific variables, they have less impact: they explain 20% of
banking fragmentation, reflecting lower economic growth and worsening in sovereign rating.
Time dummies have a large, positive, impact, this way partially counterbalancing the negative
impact of global variables on cross-border bank flows after the crisis.
This sizable impact of time-effects on cross-border bank flows suggests that an unobserved,
global factor, has partially smoothed the retrenchment of wholesale-oriented global banks
headquartered in advanced economies.7 This could reflect that, short after the crisis, a
3.6 ECONOMIC SIZE
6 Coefficients measure the impact of variables on standardized cross-border bank flows. Since interbank flows are
more volatile, all variables have stronger impact on them, measured in pp of GDP (see Chart 8).
7 If the model is estimated removing the time dummies, the coefficients of global variables become much smaller
– for instance, the coefficient of the broker-dealer leverage (the most important single variable) halves –.

BANCO DE ESPAÑA 126 ESTABILIDAD FINANCIERA, NÚM. 26
number of banking systems engaged in a cross-border expansion, less dependent on
wholesale international funding. Emerging markets banking systems have expanded
overseas, to an important extent relying on their domestic retail funding (CGFS (2014).
In areas such as Asia-Pacific, their cross-border activity has picked strongly, so that
intrarregional banks represent the bulk of cross-border credit. Japanese banks overseas
expansion has also increased, financed either with corporate deposits, or currency swaps
of their domestic currency retail funding [Lam (2013)]. Global banking after the crisis is
defined, therefore, by a sharp contraction of wholesale-funding cross-border activity, and a
modest decoupling of cross-border bank flows from these factors.
The retrenchment of international banks through cross-border asset-shedding is impacting
strongly on financial integration. Banks are losing importance as providers of cross-border
credit. International capital markets are gaining relative importance. In some geographical
areas, international capital markets have also increased in absolute terms. This trend
towards financial disintermediation in international markets is depicted in Chart 10.
International financing is break down between funding obtained from banks, and from
capital markets. Cross-border bank claims are investments by banks operating overseas,
on residents in the recipient economy. These investments can be either on banks, or on
non-banks (all other sectors). International issuances are those by residents in the country,
in all markets, excepting the domestic. Therefore, they are not necessarily associated with
balance of payment flows. We present separately issuances by sovereigns and by other
institutional sectors (including banks, non-financial corporations, and other financial
institutions (bonds). Capital flows are measured relative to GDP, as a sum of the last four
quarters. In other to account different geographical patterns, we show evolutions in the
euro area, emerging economies, and emerging Europe.
Panel 10.1 shows that cross-border bank flows are experiencing a protracted contraction,
particularly severe in interbank financing. International issuances have hold better,
although remain small in absolute terms. Financial fragmentation is sharper in the euro
4 Financial
disintermediation in
international markets
after the crisis
SOURCE: Author's estimations.
a
CROSS-BORDER BANK FLOWS AFTER THE GLOBAL FINANCIAL CRISIS. AVERAGE ECONOMIC IMPACT (a) CHART 9
-10.2
-1.8
-21.6
-1.6
11.8
2.
-30 -20 -10 0 10 20
Observed
Country-
Funding Models
Global, other
Time effects
Lag dep. variable
9.1 EMERGING (EXCLUDING EMERGING EUROPE)
-20.7
-3.6
- 3.8
-3.3
2 .0
5.8
-60 -40 -20 0 20 40
Observed
Country-
Funding Models
Global, other
Time effects
Lag dep. variable
9.2 ADVANCED

BANCO DE ESPAÑA 127 ESTABILIDAD FINANCIERA, NÚM. 26
area – panel 10.2 –, where cross-border bank flows are contracting, and international
issuances remain low. There are also sizable cross-border bank disinvestments vis-a-vis
emerging Europe. Cross-border bank flows vis-à-vis the rest of emerging economies
have hold better – panel 10.3 –, but have not recovered the pre-crisis levels.
We investigate next additional features of international issuances in Emerging Asia and
Latin America. In both areas, large private international debt issuances have counterbalanced
the lesser importance of cross-border bank financing. This trend is driven by private
issuances, as shown in panel 11.1, which breaks down international issuances by type of
issuer: non-financial corporations, banks, other financial institutions, and sovereigns. Non-
financial corporations’ international issuances are three times larger than before the global
financial crisis, while banks and other financial institutions international issuances have
had a slightly increase.
SOURCE: BIS Securities Statistics, Table 12.
a
FINANCIAL INTEGRATION AFTER THE GLOBAL FINANCIAL CRISIS. RECENT EVOLUTION (a) CHART 10
-10
-5
0
5
10
15
2000 2002 2004 2006 2008 2010 2012
CROSS-BORDER CLAIMS ON NON-BANKS CROSS-BORDER CLAIMS ON BANKS SOVEREIGN, INTERNATIONAL BONDS BONDS TOTAL INTERNATIONAL FINANCING
% o
10.1 TOTAL
-20
-10
0
10
20
30
40
2000 2002 2004 2006 2008 2010 2012
CROSS-BORDER CLAIMS ON NON-BANKS CROSS-BORDER CLAIMS ON BANKS SOVEREIGN, INTERNATIONAL BONDS BONDS TOTAL INTERNATIONAL FINANCING
% o
10.2 EURO AREA
-3
-2
-1
0
1
2
3
4
5
2000 2002 2004 2006 2008 2010 2012
CROSS-BORDER CLAIMS ON NON-BANKS CROSS-BORDER CLAIMS ON BANKS SOVEREIGN, INTERNATIONAL BONDS BONDS TOTAL INTERNATIONAL FINANCING
% o
10.3 EMERGING ECONOMIES, EXCLUDING EMERGING EUROPE
-10
-5
0
5
10
15
2000 2002 2004 2006 2008 2010 2012
CROSS-BORDER CLAIMS ON NON-BANKS CROSS-BORDER CLAIMS ON BANKS SOVEREIGN, INTERNATIONAL BONDS BONDS TOTAL INTERNATIONAL FINANCING
% o
10.4 EMERGING EUROPE

BANCO DE ESPAÑA 128 ESTABILIDAD FINANCIERA, NÚM. 26
Thus, international capital markets are gaining importance relative to cross-border banking
in Latin America and Emerging Asia.8 The volumes of cross-border bank claims and
outstanding international bonds are compared in panel 11.2. International bonds issued by
non-sovereigns were half-the volume of cross-border bank claims until 2010. Bonds
started to gain importance in 2010. Bonds issued in international markets already represent
85% of cross-border bank claims in Emerging Asia and Latin America.
This process of international financial disintermediation might pose risks. Capital markets can
be a poor substitute of cross-border bank financing for some borrowers, for instance, SMEs.
Firm-level data suggests that bond issuances are positively related to asset size. Panel 11.3
shows international issuances by SMEs headquartered in emerging economies. It suggests
they remain relatively low, despite a pick-up in 2011 and 2012. The sharp reduction in SMEs
issuances in 2013 might reflect a shutdown of capital markets, which contrasts with the still
resilient access of the whole population of firms. A proper assessment requires delving in
recent trends in SMEs access to domestic bank credit, or domestic bond markets.
SOURCES: BIS (Securities and International Banking Statistics) and Bloomberg.
acorporations; and sovereigns.
FINANCIAL DESINTERMEDIATION IN EMERGING ECONOMIES (a) CHART 11
0
10
20
30
40
50
60
70
80
90
100
0
200
400
600
800
1,000
1,200
1,400
1,600
1,800
2,000
2000 2002 2004 2006 2008 2010 2012
CROSS-BORDER CLAIMS ON NON-BANKS
INTERNATIONAL BONDS (PRIVATE SECTOR)
RATIO BONDS TO BANKS (right-hand scale)
USD bln
%
11.2 RELATIVE VOLUME OF BONDS AND CROSS-BORDER BANK FLOWS
-50
0
50
100
150
200
250
300
2000 2002 2004 2006 2008 2010 2012
BANKS OFIs
NONFIN SOVEREIGN
USD bln
11.1 EMERGING ECONOMIES, EXCLUDING EMERGING EUROPE (a)
0
100
200
300
400
500
600
0
500
1,000
1,500
2,000
2,500
3,000
2004 2005 2006 2007 2008 2009 2010 2011 2012 2013
QUARTERLY (right-hand-scale)
CUMULATIVE
USD bln
11.3 SMEs ISSUANCES IN EMERGING ECONOMIES
USD bln
0
15
30
45
60
75
0
200
400
600
800
1,000
2000 2002 2004 2006 2008 2010 2012
RESIDENCE
FOREIGN SUBSIDIARIES
FOREIGN SUBSIDIARIES, AS % OF TOTAL (right-hand scale)
USD bln
%
11.4 ISSUANCES BY FOREIGN SUBSIDIARIES
8 In the following analysis, Emerging Asia includes India, Indonesia, Malaysia, Philippines, and Thailand. Latin
America includes Argentina, Brazil, Chile, Colombia, Mexico, Peru. Korea and China are not included, and have
different patterns.

BANCO DE ESPAÑA 129 ESTABILIDAD FINANCIERA, NÚM. 26
On the other hand, large issuances can lead to build-up of potential risks and vulnerabilities
in firms’ balance sheets. Aggregate evidence suggests that international issuances have
been denominates mostly in dollars, although issuances in emerging market currencies
have increased [Gruic and Wooldrdige (2013); see also IADB (2014) for an analysis of Latin
America]. Large issuances by emerging-markets multinationals foreign-subsidiaries have
also attracted attention, as a potencial source of hidden vulnerabilities. The historical
record suggests, however, that this practice has not changed recently. Panel 11.4 shows
issuances by domestically-based companies and their foreign subsidiaries in international
markets. Their relative importance has remained constant, as depicted their ratio, which
has remained stable all over the period.
Financial integration goes ahead after the global financial crisis, although has experienced
remarkable changes. Financial disintermediation has increased in international markets.
This is particularly important in some emerging economies, where bonds’ weight in
international financing has increased despite the relative resilience of cross-border banking.
These countries obtain more funding from international capital markets, and less from
cross-border banking
The lesser relative importance of global banks in international finance reflects their new
business models, with decreasing importance of wholesale international financing.
Regulation intended to achieve more stable funding patterns is among the prime drivers of
a process which, therefore, has probably a permanent nature. Global banks which
expanded overseas by establishing foreign subsidiaries, with local funding, have been
more resilient [CIEPR (2012)].
A few banking systems depart from this general trend. For instance, emerging banking systems
are expanding their cross-border activity, at a modest scale, and with less reliance on market-
based financing [CGFS (2014)]. Recently, issuances by banks headquartered in some emerging
economies have picked up. This could eventually become a source of vulnerabilities, since
represent wholesale financing which banks could use to finance domestic credit.
Financial disintermediation poses risks and uncertainties for financial stability. Cross-border
bank flows have been historically a very volatile source of external financing, highly connected
with global financial conditions. The impact of tightening of global financial conditions on
bond holders and borrowers is more uncertain. Large issuances have been supported by
factors which could be temporary, as easy monetary policy in advanced economies. The
sharp sell-off in emerging economies bond markets after tapering talks in May 2013 suggests
new channels of transmission of global financial conditions [Turner (2014)]. The financial
stability implications of an eventual process of international financial disintermediation would
depend on issues such as the investors risk profile, investment horizon, or leverage.
As for borrowers, non-financial corporations’ large debt issuances have caused concern,
since, based on historical records, are considered telltale signs of overborrowing or
currency mismatches. However, understanding these risks requires a firm-level analysis
on balance-sheet soundness. Issues such as companies leverage, rating, or an eventual
substitution of banks financing by bond issuances are of interest.
Finally, it is worth noting that, for some nonfinancial corporations, capital markets can be
an imperfect substitute of cross-border bank financing. Access to capital markets is often
more restrictive for SMEs. There is little evidence of an increasing access of SMEs to
international financial, their ability to tap markets at large-scale is yet to be tested.
5 Conclusions

BANCO DE ESPAÑA 130 ESTABILIDAD FINANCIERA, NÚM. 26
BIS (2013). BIS Quarterly Review, December.
BRONER, F., T. DIDIER, A. ERCE and S. L. SCHMUKLER (2013). “Gross capital flows: Dynamics and crisis”, Journal
of Monetary Economics 60, pp. 113-133.
BRUNO, V., and H. SHIN (2013). Capital Flows and the Risk-Taking Channel of Monetary Policy, NBER Working
Paper No. 18942.
CARUANA, J., and A. van RIXTEL (2012). International financial markets and bank funding in the euro area: dynamics
and participants, BIS.
CEPR (2011). Cross-border Banking in Europe: Implications for Financial Stability and Macroeconomic Policies.
CGFS (2010a). The functioning and resilience of cross-border funding markets, CGFS Report No. 37, March.
— (2010b). Long-term issues in international banking, CGFS Report No. 41, July.
— (2010c). Funding patterns and liquidity management of internationally active banks, CGFS Report No. 39, May.
— (2013). Asset encumbrance, financial reform, and the demand for collateral assets, CGFS Paper No. 49.
— (2014). EME banking systems and regional financial integration, CGFS Paper No. 51.
CHAN, N. (2011). “Universal banking-Hong Kong’s perspective”, Keynote address at the Asian Banker Summit.
CHEN, S., A. HAECHLER, C. MARSH, S. SAKSONOVS and H. SHIN (2012). Exploring the dynamics of global
liquidity, IMF Working Paper No. 12/246.
CIEPR (2012). Banks and Cross-Border Capital Flows: Policy Challenges and Regulatory Responses, September.
CORREA, R., H. SAPRIZA and A. ZLATE (2012). Liquidity shocks, dollar funding costs, and the bank lending channel
during the European sovereign crisis, Board of Governors of the Federal Reserve System International Finance
Discussion Papers No. 1059, November.
DEUTSCHE BANK (2014). “Tight bank lending, lush bond market. New trends in European corporate debt issuance”,
Current Issues. Global financial markets, Deutsche Bank Research.
DUDLEY, W. (2013). Fixing wholesale funding to build a more stable financial system, New York Bankers Association
2013 Annual Meeting.
ECB (2012). Changes in bank financing patterns.
FENDER, I., and P. MCGUIRE (2010). “Bank structure, funding risk, and the transmission of shocks across countries:
concepts and measurements”, BIS Quarterly Review, September.
GAMBACORTA, L., and A. VAN RIXTEL (2013). Structural bank regulation initiatives: approaches and implications,
BIS Working Papers No. 412.
GARCÍA-LUNA, P., and A. VAN RIXTEL (2014). “International interbank activity in retreat”, Box 1, BIS Quarterly
Review, March.
GOODHART, C. (2014). “Pattern of policy tightening is different this time”, Financial Times, 3rd April.
GOULDING, W., and D. NOLLE (2012). Foreign banks in the US: A primer, International Finance Discussion Papers
No. 1064.
GRUIC, B., and P. WOOLDRDIGE (2013). “Who is issuing international bonds denominated in emerging market
currencies?”, Box 2, BIS Quarterly Review, December.
HAHM, J.-H., H. SHIN, and K. SHIN (2012). Non-core liabilities and financial vulnerabilities, NBER Working Paper No. 1848.
HONG-KONG MONETARY AUTHORITY (2013). Half-Yearly Monetary and Financial Stability Report, Box 6, “Changing
business models of Hong Kong branches of US and European banks”.
IADB (2014). “Global recovery and monetary policy normalization. Escaping a chronicle foretold?”, 2014 Latin
America and Caribbean Macroeconomic Report.
IMF (2013). Global Financial Stability Report, October.
LAM, W. R. (2013). Cross-border Activity of Japanese Banks, IMF Working Paper n.º 13/235.
LAROSIÈRE, J. (2013). “A world of warning: banking regulation is about to create pro-cyclical damage”, European
Savings Banks Conference.
LO LUCA, M., G. NICOLETTI, and A. VIDAL MARTÍNEZ (2014). Global bond corporate issuance: What role for US
quantitative easing?, ECB Working Paper N1 1649, March.
MARTÍN-OLIVER, A. (2013). “Financial integration and structural changes in Spanish banks during the pre-crisis
period”, Estabilidad Financiera, No. 24.
MCCAULEY, R., and P. MCGUIRE (2014). “Non-US banks’ claims on the Federal Reserve”, BIS Quarterly
Review, March.
MCCAULEY, R., P. MCGUIRE, and G. VON PETER (2010). “The architecture of global banking: from international to
multinational?”, BIS Quarterly Review, March.
MCCAULEY, R., C. UPPER, and A.VILLAR (2013). “Emerging market debt securities issuance in offshore centres”,
Box 2, BIS Quarterly Review, September.
MCGUIRE, P., and G. VON PETER (2009). The US dollar shortage in global banking and the international policy
response, BIS Working Paper No. 201.
MILLARUELO, A., and A. DEL RÍO (2013). “La fragmentación financiera en la zona del euro durante la crisis”, Boletín
Económico, December, Banco de España.
ROODMAN, D. (2006). How to Do xtabond2: An Introduction to “Difference” and “System” GMM in Stata, Center for
Global Development Working Paper No. 103.
SAPIR, A., and G. B. WOLFF (2013). “The neglected side of banking union: reshaping Europe’s financial system”,
Bruegel Policy Note.
SERENA, J. M., and E. VALDEOLIVAS (2014). Integración financiera y modelos de negocio de los bancos globales,
Documentos Ocasionales, No. 1401, Banco de España.
SHIN, H. (2012). “Global banking glut and loan risk premium”, 2011 Mundell-Fleming Lecture, IMF Economic Revue
60, pp. 155-192, July.
— (2013). “The Second Phase of Global Liquidity and its Impact on Emerging Economies”, Keynote address at the
Federal Reserve Bank of San Francisco Asia Economic Policy Conference.
TARULLO, D. (2012). “Regulation of Foreign Banking Organizations”, Board of Governors of the Federal Reserve
System, Speech at the Yale School of Management Leaders Forum.
REFERENCES

BANCO DE ESPAÑA 131 ESTABILIDAD FINANCIERA, NÚM. 26
TARULLO, D. (2014). Opening Statement by Gov. Daniel K. Tarullo, “Enhanced Prudential Standards for Bank Holding
Companies and Foreign Banking Organization”.
TURNER, P. (2014). The global long-term interest rate, financial risks and policy choices in EMEs, BIS Working Paper,
No. 441.
VAN RIXTEL, A., and G. GASPARINI (2013). Financial crisis and bank funding: recent experience in the euro area, BIS
Working Paper, No. 406.
Our panel data includes 54 countries, which can be classified as advanced, emerging, or
financial hubs. Advanced economies: Australia, Austria, Belgium, Canada, Denmark, Finland,
France, Germany, Greece, Ireland, Israel, Italy, Japan, Netherlands, New Zealand, Norway,
Portugal, Spain, Sweden, Switzerland, United Kingdom, United States. Emerging economies:
Latin America; Argentina, Brazil, Chile, Colombia, Mexico, Peru, Uruguay, Venezuela; Emerging
Asia: China, India, Indonesia, Korea, Malaysia, Philippines, Thailand; Emerging Europe:
Bulgaria, Czech Republic, Estonia, Hungary, Latvia, Lithuania, Poland, Romania, Russia,
Slovakia, Slovenia, Turkey; other emerging; Qatar, Egypt, South Africa. Financial hubs: Hong-
Kong, Luxembourg, Singapore (Iceland, Switzerland, United Kingdom, United States are also
considered financial hubs).
Euro area countries include Austria, Belgium, Finland, France, Greece, Ireland, Italy, Netherlands,
Portugal, Spain. We do not include in our sample Malta and Cyprus, which share features with
financial hubs, during a short-period of time.
We use quarterly data, for the period 1Q1991-3Q2013. Table A.1 shows descriptive statistics.
Table A.2 shows the correlation matrix between the variables.
APPENDIX. DATA
DESCRIPTION
Mean Median Std. Dev. Min Max Source
Country-speci c
Current account to GDP -0.491 -1.013 6.166 -50.507 38.450 IMF, national accounts
GDP growth 3.307 3.393 4.841 -54.819 119.429 National accounts
Sovereign rating 15.992 16.000 4.571 0.000 21.000 S&P
Public Debt to GDP 57.645 49.470 52.479 1.060 1,266.220 IMF, national accounts
Primary balance to GDP -1.974 -1.898 4.784 -140.620 20.183 IMF, national accounts
Global variables
World GDP growth 2.644 2.823 1.379 -2.832 4.758 IMF, WEO
VIX, qoq change -0.005 -0.019 0.195 -0.489 0.847 CBOE
Broker Dealer Leverage 15.050 13.612 5.903 5.596 30.680 Flow of Funds, L.128
NDT position, qoq change 0.001 -0.002 0.048 -0.153 0.387 Structure and Share Data, 4.30
Banks international issuances 0.035 0.041 0.039 -0.068 0.123 BIS Securities data
Cross-border bank ows measures
All countries
On all counterparts 4.013 1.074 33.923 -848.896 867.958 BIS IBS, national accounts
On banks 2.626 0.537 29.497 -789.600 836.573 BIS IBS, national accounts
On non-banks 1.387 0.440 13.307 -289.685 287.322 BIS IBS, national accounts
Excluding Financial centres
On all counterparts 1.374 0.836 7.993 -99.395 78.888 BIS IBS, national accounts
On banks 0.782 0.408 6.978 -129.646 74.818 BIS IBS, national accounts
On non-banks 0.592 0.350 3.322 -38.703 53.224 BIS IBS, national accounts
DESCRIPTIVE STATISTICS TABLE A.1
SOURCE: Author's elaboration.

BANCO DE ESPAÑA 132 ESTABILIDAD FINANCIERA, NÚM. 26
Current
Account
(GDP
terms)
Domestic
GDP
growth
Standard
& Poors
rating
Public
Debt to
GDP
Fiscal
Balance to
GDP
World
GDP
growth
VIX
Broker
Dealer
Leverage
US
branches
funding
Banks
international
issuances
Current Account
(GDP terms)1
Domestic GDP
growth-0.2343 1
Standard & Poors
rating-0.8244 0.2967 1
Public Debt to
GDP0.8202 -0.2735 -0.8339 1
Fiscal Balance to
GDP0.0094 0.5242 -0.024 0.0152 1
World GDP growth -0.1228 0.4279 0.0307 0.0126 0.3977 1
VIX 0.0018 0.0496 0.0146 -0.0483 0.0822 0.0975 1
Broker Dealer
Leverage0.072 0.1296 -0.0436 0.127 0.6341 0.4043 0.1453 1
US branches
funding0.0263 0.106 0.0343 -0.0714 -0.0823 -0.0124 0.5145 -0.2286 1
Banks international
issuances0.0048 0.1204 -0.0566 0.1591 0.4096 0.2837 -0.2392 0.5175 -0.21 1
CORRELATION MATRIX TABLE A.2
SOURCE: Author's elaboration.