financial crises
DESCRIPTION
free to useTRANSCRIPT
ACCOUNTING & TAXATION ♦ Volume 6♦ Number 1 ♦ 2014
THE ROLE OF DERIVATIVES IN THE FINANCIAL CRISIS AND THEIR IMPACT ON SECURITY PRICES
Ronald A. Stunda, Valdosta State University
ABSTRACT
This study takes on two divergent notions concerning derivatives; that they are dangerous instruments (Warren Buffet) versus the concept that they help to reduce risk (Allen Greenspan). These notions are assessed from the perspective of the recent Financial Crisis in which derivatives were assigned a good deal of the blame for the meltdown. This study analyzes three different study periods; Pre-Crisis (2003, 2004, 2005), Crisis (2008, 2009, 2010), and Post-Crisis (2011, 2012, 2013-1st quarter). In addition, the study also analyzes three different groups of firms containing 100 firms each; firms engaging in the use of derivatives and accepting TARP funds, firms engaging in derivatives and not accepting TARP funds, and firms not engaging in derivatives and not accepting TARP funds. Results indicate that for Crisis and Post-Crisis periods, investors tend to discount accounting earnings releases in making investment decisions. For the firms using derivative and not accepting TARP funds and firms not using derivatives and not accepting TARP funds, the results across all three study periods are almost identical, accounting earnings reflect positive information-enhancing signals on security prices. This does not mean that security prices continued a steady upward trek, but only that investors placed a greater positive reliance on earnings in making investment decisions, in other words, they tended to not discount earnings releases. JEL: G3, M41, N2 KEYWORDS: Derivatives, Security Prices, TARP
INTRODUCTION
n the fall of 2008, the U.S. Congress implemented the Emergency Economic Stabilization Act as a result of the financial crisis which began that same year. The Act created the Troubled Asset Relief Program (TARP). It was the largest component of the government’s measures to address the sub-
prime mortgage crisis and resulted in expenditures of close to $1 trillion taxpayer dollars. These “troubled assets” were defined as residential or commercial mortgages, securities, obligations, or other instruments which in many cases were utilized for speculative purposes under the banner of “derivatives.” Derivatives, also referred to as “futures contracts,” have functioned for more than 100 years to act as a hedge against fluctuations in prices of items such as commodities, metals, energy products and financial instruments. Control of derivatives was insured under the Commodity Exchange Act (CEA) of 1936, which called for regulation and oversight of derivatives. Significant growth in the use of derivatives occurred at about the same time the Federal government decided to deregulate them in 2000 through passage of the Commodity Futures Modernization Act (CFMA). As a result, derivative growth along with the simultaneous removal of all controls associated with them, help lead to the worse financial meltdown in the U.S. economy in more than 75 years. Derivatives are viewed by many as complex and murky in nature, however, they are not new to the financial scene. The early derivatives market began in the 1860s and consisted of farmers and grain merchants coming together in Chicago to hedge price risks in such commodities as corn, wheat, soy and other grain products. This began what came to be known as “futures” contracts. The traditional futures contract is an agreement between a seller and a buyer that the seller will deliver a product to the buyer at a
I
39
R. A. Stunda | AT ♦ Vol. 6 ♦ No. 1 ♦ 2014
price agreed to when a contract is first entered and the buyer will accept and pay for the product at some agreed upon future date. In addition, the buyer has the opportunity to liquidate some or all of the product prior to delivery. Although developed initially in the agricultural sector, derivatives quickly spread into the metals, energy and financial sectors. Because of the debilitating effect of agricultural prices during the Depression, President Roosevelt recommended to Congress the first market reform that impacted derivatives. The Commodity Exchange Act (CEA) of 1936 restricted, as far as possible, the use of futures purely for speculative purposes, thus relieving commodity producers of injury and thus producing some amount of control over the use of derivatives. In addition, the CEA called for a formal and regulated exchange through which transactions may occur. Futures contracts were required to be traded on a publicly transparent market, fully regulated, and ensuring that commitments would be backed by adequate capital. By the 1980s, a variant of futures contracts was developed, commonly referred to as “swaps.” They are defined as an agreement between two parties to exchange a series of cash flows measured by different interest rates, exchange rates, or prices with payment calculated by reference to a base amount. An example of an interest rate swap would be where one party exchanges a variable rate obligation on an existing loan for a fixed rate obligation. The expectation is that the fixed rate will be lower than the variable rate. Thus, instead of buying or selling a single future rate (as would be true under a traditional futures contract) there now exists the potential for the “swapping” of commitments. As these complex derivative types took hold during the 1980s and 1990s the Commodity Futures Trading Commission (CFTC) granted them exemption from the CEA of 1936. This caused the number of interest rate swaps, currency swaps, and other swaps to increase at a significant rate. This culminated in the Commodity Futures Modernization Act (CFMA) of 2000. Signed into law by President Clinton, the CFMA removed derivative transactions, from all the regulatory requirements established in 1936 by the CEA. Those parties engaging in derivatives were now exempt from capital adequacy requirements, reporting and disclosure, regulation of intermediaries, self-regulation, and bars on fraud or manipulation and excessive speculation. The Securities and Exchange Commission (SEC) was also barred from derivatives oversight. Through the passage of this Act lay the seeds for the destruction that would come in less than a decade. By October, 2008, the value of the unregulated derivatives market was estimated to be in excess of $60 trillion. Included in that amount was somewhere close to $30 trillion in credit swaps. At the same time, a perfect storm was developing. The Federal government was pursuing a course of easy money for home loans through maintaining low interest rates and providing Federally-backed less-than-secure home loans. Many of these “sub-prime” loans became embedded in the $30 trillion of credit swaps. As a result, when defaults began to occur, they first created a mortgage crisis, which developed into a credit crisis, which then turned into a “once in a century” systematic financial crisis that, but for a huge U.S. taxpayer intervention, may have led in the fall of 2008 to a worldwide devastating Depression. Although the use of derivatives has become widespread throughout the U.S. economy over the past 25 years, not all public companies have engaged in their use. In fact, of the public companies listed in Fortune 500 as of June 1, 2013, only 108 have recorded in their financial notes the use of such instruments. As a note, of all the companies accepting TARP bailout monies, 93% were engaged in the use of some form of derivatives prior to the inception of TARP. Derivatives were not the only cause of the financial meltdown, neither were all public companies that engaged in their use crippled from a financial standpoint. It should be clear that futures contracts in the form of derivatives must possess some benefit by shifting risk, otherwise they would not be used at all. Given that derivatives have been, and will continue to be used as instruments that permit the potential minimization of future financial risks, the question must be asked, “to what extent do they affect the security price of the firms that utilize them?” Clearly, if the objective of management is to maximize the return to the stockholders, some firms may be inhibited from using derivatives if they are viewed to minimize stock prices. On the other hand, if derivative use ultimately increases the stock price, more firms would elect their use.
40
ACCOUNTING & TAXATION ♦ Volume 6♦ Number 1 ♦ 2014
The purpose of this study is to assess the role that derivatives play on the security prices of firms. In particular, do firms that engage in derivative use find that their change in stock price is significantly different from firms that do not utilize derivatives? Specifically, three study periods are assessed; 1) a Pre-Crisis period of 2003-2005, 2) Crisis Period of 2008-2010, and 3) a Post-Crisis period of 2011- 2013. A sample of 100 publicly traded firms which accepted TARP funds and engaged in derivative use is analyzed in all three periods in order to ascertain any significant differences in stock prices for these firms across the time periods. In addition, a sample of 100 publicly traded firms which did not accept TARP funds and does not engage in derivative use is analyzed in the three study periods for the purpose of determining any differences in stock prices. A third sample of 100 firms is also analyzed during the three sample periods. These are publicly traded firms which did engage in derivative usage but were not in peril to the point of accepting TARP funds. The three samples are then analyzed to assess any differences among them. Findings from such a comparison might have significant impact to current and potential investors of firms which engage in derivative instruments. The article will first provide a summary of past and current relevant literature, followed by the hypotheses of the study. The data and methodology will then be elaborated, followed by results by hypothesis and concluding remarks. LITERATURE REVIEW
The use of derivatives is a contentious issue. Nevertheless, whether on subscribes to Warren Buffet’s warning about the danger of derivatives or Allen Greenspan’s assertion that derivatives reduce risk (Berry 2003), the fact is that derivatives are popular and growing in use (Bodner et al 1995, Wolfson and Crawford 2010). Therefore, given the place of derivatives in the financial market place, it seem reasonable to ask what, if any, information content they provide in relation to security prices. Many studies have examined the risk associated with derivative usage (Cornfield 1996, Guay 1999, Kuprianov 1995, Newman 1994, Hentschel and Kothari 2001). In general, these studies note that firms use derivatives as a hedge against exposure, but find that compared to firms which do not use derivatives, there does not appear to be any measurable difference in risk. This would lead one to suspect that no market impact from the use of derivative instruments would be found. In addition to risk, other researchers have examined the role of derivatives in an earnings management context. Jan Barton (2001) examined this issue and presented evidence “consistent with managers using derivatives and discretionary accruals as partial substitutes for smoothing earnings.” An implication of this finding is that derivatives may indeed have a market impact through their effect on corporate earnings. The main contentions of the financial school of thought that link derivatives to the financial crisis lie in the artificial credit boom. The credit expansion created systematic risk, which led to the use of derivatives as an attempt to reduce the risk. The derivatives were traded in a market that lacked transparency, and proper regulation, i.e., the Over the Counter Market (OTC), (Stulz 2009). In addition, there is a popular belief that derivatives do not contribute any financial or economic substance to the general economy but are mere financial gambling devices (Gilani 2008). As a result, many arrive at the conclusion that derivatives do indeed lay at the root of the financial crisis. But how exactly can things go wrong for buyers and sellers of derivative instruments and how can this in turn lead to adverse earnings results which may in turn affect stock prices? Skeel and Partnoy 2007, describe the scenario in which this can occur. The ease of credit, in conjunction with loose U.S. monetary policy led to the mispricing of credit. This means that loans which eventually turned out to be sub-prime in nature were bundled together with loans with lesser risk, the risk on the bundle was underestimated. As a result, mispricing on the bundled rate led to highly leveraged bets for the holders of such bundles. The subsequent defaults led to a massive attempt to unwind these bundles but it was too late from a liquidity
41
R. A. Stunda | AT ♦ Vol. 6 ♦ No. 1 ♦ 2014
standpoint, the effects then steamrolled and permeated national and international financial markets. All of this unraveled in a few weeks. Holders of undervalued derivatives were forced to record current period losses as the swaps took place, placing downward pressure on earnings and forcing greater securitization (Pertrova 2009). Given the use, nature, and circumstances that have swirled around derivative financial instruments, and based on the research undertaken to date, it becomes even more important to determine the link that derivatives have to stock prices. As the Financial Accounting Standards Board (FASB) continues to struggle to identify what exactly their role should be in the derivatives debate, it is important to understand the relationship that derivatives have to stockholder wealth, and stockholder wealth is ultimately dictated by the price of the stock.
HYPOYHESIS DEVELOPMENT
As previously noted, recent studies of derivatives do not directly link derivative usage to information content of earnings and security returns. However, if a correlation is established, evidence may suggest that firms could directly or indirectly affect the price of their stock in the capital markets through use (or non-use) of derivatives. As one test, earnings are analyzed for incremental information content relative to security prices for public companies utilizing derivatives, and accepting TARP funds. Three study periods are assessed: 1) Pre-Crisis Period (2003, 2004, 2005). These years are perceived to be years in which the economy was going through expansion and institutional profitability was growing. 2) Crisis-Period (2008, 2009, 2010). These years are the years in which public companies began to have financial difficulties leading to troubled assets and they also began to accept TARP funds. 3) Post-Crisis Period (2011, 2012, 2013). During 2011, 93% of all TARP funds were paid back to the U.S. Treasury. In addition, many public companies were started back on what they termed the “road to recovery.” Absent extraneous factors (i.e., change in corporate form, change in management, change in ownership, etc.) there should not be significant difference in information content of earnings across study periods. Thus, the first hypothesis tests for the existence of market reaction for firms using derivatives that accepted TARP funding across the above three study periods. Stated in the null form, the hypothesis tested is:
H1: Earnings information content of security prices for public companies utilizing derivatives and
accepting TARP funding is not significantly different across study periods. The next test is similar to the first but now assesses public companies utilizing derivatives and not accepting TARP funds. Since more than 1,000 public companies accepted TARP funds, it may be inferred that if any public firm met the guidelines for distribution of TARP monies, namely the presence of troubled assets, then they would qualify for receipt of funds. Firms not receiving TARP funding are presumed to not have been in need of the Federal resources. Thus, the second hypothesis tests for the existence of market reaction for firms using derivatives that did not accept TARP funding across the above three study periods. Stated in the null form, the hypothesis tested is:
H2: Earnings information content of security prices for public companies utilizing derivatives and not
accepting TARP funding is not significantly different across study periods.
The last test assesses public companies that have not used derivatives and have not accepted TARP funding. If derivatives as a whole contain no incremental earnings information, we should see consistency in results when comparing firms that do use derivatives with firms that do not use them. If,
42
ACCOUNTING & TAXATION ♦ Volume 6♦ Number 1 ♦ 2014
however, a difference exists, it should be pronounced when comparing the groups. This test allows for such a comparison. Stated in the null form:
H3: Earnings information content of security prices for public companies not utilizing derivatives,
and not accepting TARP funding is not significantly different across study periods. DATA AND METHODOLOGY
The sample consists of analysis of quarterly security returns during each of the following test periods: 1. Pre-Crisis period (2003, 2004, 2005) 2. Crisis period (2008, 2009, 2010) 3. Post-Crisis period (2011, 2012, 2013-1st quarter) The sample of firms consisted of three groups:
1. 100 public companies engaging in derivatives usage as identified in the financial notes for each of the above three periods, and having accepted TARP funds.
2. 100 public companies engaging in derivatives usage as identified in the financial notes for each of the above three periods, and having not accepted TARP funds.
3. 100 public companies not engaging in derivative usage for each of the above three periods, and having not accepted TARP funds.
Because the majority of firms accepting TARP monies consisted of those engaged in financial services, the sample pool is limited to those firms contained in SIC code 738909 (Financial Services). In addition, security price data must be available from the Center for Research on Security Prices (CRSP), earnings data is available on Compustat, and financial notes information is accessible through the Electronic Data Gathering and Retrieval System (EDGAR). Capitalization of firms contained in the study range from $10 million to $45 billion. Each of the three sample groups contains a similar array of firms within this capitalization range. The range was broad enough to be as inclusive as possible and also to meet the requirement for the same number of firms in each sample. Test of Hypotheses The purpose of these tests is to assess the relative information content of the security prices to the earnings for the firms using derivatives, and receiving TARP funds, for each of the three time periods detailed in the study. Quarterly financial data is typically released by each publicly held firm within two weeks following the close of the quarter. Based on this information, stock traders respond along with the stock price itself. The premise set forth by Ball and Brown (1968) and others, was that earnings, more specifically, “unexpected earnings” was causing the stock price to move. Ball and Brown (1968) assumed that investors used prior year reported earnings as a benchmark for the level of earnings they expected the firm to report in the current year. They then selected a sample of 261 NYSE-listed firms with earnings across the period 1957-1965. They classified a firm based upon whether current year earnings were up or down relative to the prior year earnings. Then, they tracked the stock price performance across an 18-month period starting 12 months before the current year earnings were announced. To facilitate comparison across firms, they examined stock returns (change in stock price during a period scaled by beginning of period stock prices) rather than stock prices. Also, to control for market-wide movements in stock prices they examined abnormal returns rather than raw returns (roughly speaking, abnormal returns are the difference between the raw stock return and the average market return). Much to the surprise of many doubters, they discovered that stock returns of good news firms
43
R. A. Stunda | AT ♦ Vol. 6 ♦ No. 1 ♦ 2014
increased over the period, and the stock returns of bad news firms declined. In particular, if an investor had bought good news (sold bad news) firms at the start of the accounting period, the investor would have outperformed the overall market by 6 (9) percent. Thus, they showed that unexpected earnings have information content in the sense that they “reflect” the economic events that drive investor decisions during the accounting period. The logical extension of Ball and Brown’s study was to see whether the magnitude of unexpected earnings (as opposed to merely the sign of unexpected earnings) was related to the magnitude of the stock price response. Beaver, Clarke and Wright (1979) addressed the issue and discovered, in fact, that the magnitude of unexpected earnings was related to the magnitude of the stock price response. Again, they focused on market-adjusted stock returns to facilitate across-firm comparisons and to control for market-wide movements in stock prices. Ball and Brown (1968) and Beaver, Clarke and Wright (1979) show that despite the deficiencies of historical cost accounting, accounting earnings are potentially useful to investors. They also ushered in the so-called information perspective on the decision usefulness of accounting. The information perspective implies that investors’ response to accounting information can provide a guide as to what type of information is or is not valued by investors. The next logical question to ask was whether the market responded more strongly to unexpected earnings in some firms, and less strongly in other firms. This question is quite pertinent to accountants because we potentially would be better able to design financial statements if we knew the factors that predict when and why investors respond more strongly (less strongly) to financial statement information. Consistent with the literature, the term “Earnings Response Coefficient,” or “ERC” is used to describe the strength of the market response to unexpected earnings. To understand this line of research, one needs to have an intuitive understanding of how investors might respond to accounting information in light of single person decision theory, portfolio theory, and efficient market theory. Here is the basic idea: Let’s say that last period’s earnings were $1 and, accordingly, that is the level of earnings an investor expects this year. When this year earnings are announced, the level of earnings are, say, $1.25, implying a $0.25 earnings surprise. If the investor believes this $0.25 level of unexpected earnings is a one-time shot that will not recur into the future, the investor will increase his assessment of stock value by $0.25. However, if the investor believes this $0.25 unexpected increase in earnings is a permanent boost to earnings that will recur in future years, then the investor’s increase in stock price is $0.25 + the present value of receiving $0.25 into perpetuity. Given this framework for thinking about how investors should respond to unexpected earnings, it can be predicted that investors will respond more strongly to unexpected earnings when those earnings are expected to persist into the future. It can also be predicted that investors’ response to unexpected earnings will be smaller the higher the discount rate they use in discounting those unexpected earnings that are expected to be received into perpetuity. Subsequent numerous studies have tested these predictions, and here is what they found: (1) ERC are increasing in the persistence of earnings. This has implications for accountants because it suggests the importance of clearly identifying on the income statement those transactions that are nonrecurring transactions (Baginski and Hassell, 1990). 2) ERC are decreasing in the riskiness of the firm and the leverage of the firm because both imply that investors demand higher expected returns and thus will use a higher discount rate in discounting the unexpected earnings expected to persist into the future. Thus, accountants should minimize the opportunities for off-balance sheet financing (or make sure the off-balance sheet financing is transparent) (Ajinkya, Atiase, and Gift, 1991). (3) ERC are increasing in the growth opportunities of the firm because unexpected earnings reported by growth firms are expected to persist into the future. Thus, the forward-looking MD&A disclosures are
44
ACCOUNTING & TAXATION ♦ Volume 6♦ Number 1 ♦ 2014
particularly important because they provide information about growth opportunities (Collins, Kothari, and Sloan, 1994). (4) ERC are increasing in the quality of accounting accruals. Thus, detailed information about the components of accounting accruals might be useful to investors (Lev, 1989). Therefore, the above extant theory and rationale was used to replicate the model first used by Ball and Brown in 1968 in order to establish that there is a correlation between earnings and security prices, that model is shown below. The Dow Jones News Retrieval Service (DJNRS) was used to identify the date that each firm released quarterly financial data for the study periods. This date of data release is known as the event date. The following model is established for determining information content: 𝐶𝐶𝐶𝐶𝐶𝐶𝐶𝐶𝐶𝐶 = 𝑎𝑎 + 𝑏𝑏1𝑇𝑇1𝑈𝑈𝑈𝑈𝐶𝐶𝐶𝐶 + 𝑏𝑏2𝑇𝑇2𝑈𝑈𝑈𝑈𝐶𝐶𝐶𝐶 + 𝑏𝑏3𝑇𝑇3𝑈𝑈𝑈𝑈𝐶𝐶𝐶𝐶 + 𝑏𝑏4𝑀𝑀𝑀𝑀𝐶𝐶𝐶𝐶 + 𝑏𝑏5𝑀𝑀𝐶𝐶𝐶𝐶 + 𝑏𝑏6𝑀𝑀𝑀𝑀𝐶𝐶𝐶𝐶 + 𝑒𝑒𝐶𝐶𝐶𝐶 (1) Where:
CARit = Cumulative abnormal return firm i, time t a = Intercept term T1 UEit = Unexpected earnings for Pre-Crisis firm i, time t T2UEit = Unexpected earnings for Crisis firm i, time t T3UEit = Unexpected earnings for Post-Crisis firm i, time t Mbit = Market to book value of equity as proxy for growth and persistence Bit = Market model slope coefficient as proxy for systematic risk MVit = Market value of equity as proxy for firm size eit = error term for firm i, time t
The coefficient “a” measures the intercept. The coefficients b1, b2, and b3 are the traditional earnings response coefficient (ERC), found to have correlation with security prices in traditional market based studies, for the three separate study periods. Unexpected earnings (UEi) is measured as the difference between the management earnings forecast (MFi) and security market participants’ expectations for earnings proxied by consensus analyst following as per Investment Brokers Estimate Service (IBES) (EXi). The unexpected earnings are scaled by the firm’s stock price (Pi) 180 days prior to the forecast: 𝑈𝑈𝑈𝑈𝐶𝐶 = [(𝑀𝑀𝑀𝑀𝐶𝐶) − (𝑈𝑈𝑋𝑋𝐶𝐶)]/𝑃𝑃𝐶𝐶 (2) Unexpected earnings are measured for each of the 100 firms during each study period; Pre-Crisis (b1 variable), Crisis (b2 variable), and Post-Crisis (b3 variable). This is done in order to assess any differences in information content of security prices to earnings releases in each of the study periods. The coefficients b4, b5, and b6, are contributions to the ERC for all firms in the sample. To investigate the effects of the information content of earnings on security returns, there must be some control for variables shown by prior studies to be determinants of ERC. For this reason, the variables represented by coefficients b4 through b6 are included in the study. For each firm sample, an abnormal return (ARit) is generated around the event dates of -1, 0, +1 (day 0 representing the day that the firm’s financials were available per DJNRS). The market model is utilized along with the CRSP equally-weighted market index and regression parameters are established between -290 and -91. Abnormal returns are then summed to calculate a cross-sectional cumulative abnormal return (CARit).
45
R. A. Stunda | AT ♦ Vol. 6 ♦ No. 1 ♦ 2014
RESULTS Hypothesis 1 Results As indicated in Table 1, for firms utilizing derivatives and accepting TARP funds, the coefficient representing the Pre-Crisis ERC, b1, is positive .12 (.01 significance level) indicating a positive security price effect for the 100 firms in the study prior to receiving TARP funds. However, the coefficient representing the Crisis ERC, b2, is negative -.10 (.01 significance level) indicating a negative security price effect for the 100 firms in the study during this study period in which TARP funds were received. The coefficient representing the Post-Crisis ERC, b3, is also negative at -.03 (.01 significance level) indicating a negative security price effect for the 100 firms in the study in a post-TARP environment. Although the b3 ERC is negative, it seems to have a more muted negative effect than the Crisis study period ERC (b2). Study results therefore, indicate that investors view earnings for firms containing derivatives to contain information content in the Pre-Crisis study period, this information content provides information enhancing signals, while the Crisis period information content is interpreted to be much more noisy and less informative, and the Post-Crisis period information content is still perceived to be less informative than the Pre-Crisis period, but more informative than the Crisis period. All other control variables are not significant at conventional levels. As a result of these findings, Hypothesis 1, which states that, for firms utilizing derivatives, there exists no information content difference on security prices in Pre-Crisis, Crisis, and Post-Crisis periods for the sample of 100 financial institutional TARP-recipients, must be rejected. In addition, whenever regression variables are employed, there is a probability of the presence of multicollinearity within the set of independent variables which may be problematic from an interpretive perspective. To assess the presence of multicollinearity, the Variance Inflation Factor (VIP) was utilized. Values of VIP exceeding 10 are often regarded as indicating multicollinearity. In the test of hypothesis 1, a VIP of 2.0 was observed, thus indicating a non-presence of significant multicollinearity. Table 1: Test of Hypothesis 1
Model: CARit = a + b1T1UEit + b2T2UEit + b3T3UEit + b4MBit + b5Bit + b6MVit + eit Sample: 100 firms utilizing derivatives and accepting TARP funds a b1 b2 b3 b4 b5 b6 Adj. R2
0.2 0 .12 -0.1 -0.03 0.14 0.06 0.02
-0.88 (1.67)*** (1.75)*** (1.68)*** -0.11 -0.28 -0.31 0.191
CARit = Cumulative abnormal return firm i, time a = Intercept term T1UEit = Unexpected earnings for Pre-Crisis firm i, time t T2UEit = Unexpected earnings for Crisis firm i, time t T3UEit = Unexpected earnings for Post-Crisis firm i, time t MBit = Market to book value of equity as proxy for growth and persistence Bit = Market model slope coefficient as proxy for systematic risk MVit = market value of equity as proxy for firm size eit = error term for firm i, time t
Table 1 assesses information content of the security prices for 100 firms. These are firms that utilized derivatives and accepted TARP funding. Analysis represents Pre-Crisis periods (b1), Crisis periods (b2), and Post-Crisis periods (b3). The first line values indicate coefficient value, while the second line values indicate significance of the coefficients. *** Significant at the 0.01 level Hypothesis 2 Results The purpose of this test is to assess the relative information content of the security prices to the earnings for the sample of firms using derivatives, and not accepting TARP funds, for each of the three time periods detailed in the study. Similar parameters and regressions are utilized. As indicated in Table 2, the coefficient representing the Pre-Crisis ERC, b1, is positive .14 (.01 significance level) indicating a
46
ACCOUNTING & TAXATION ♦ Volume 6♦ Number 1 ♦ 2014
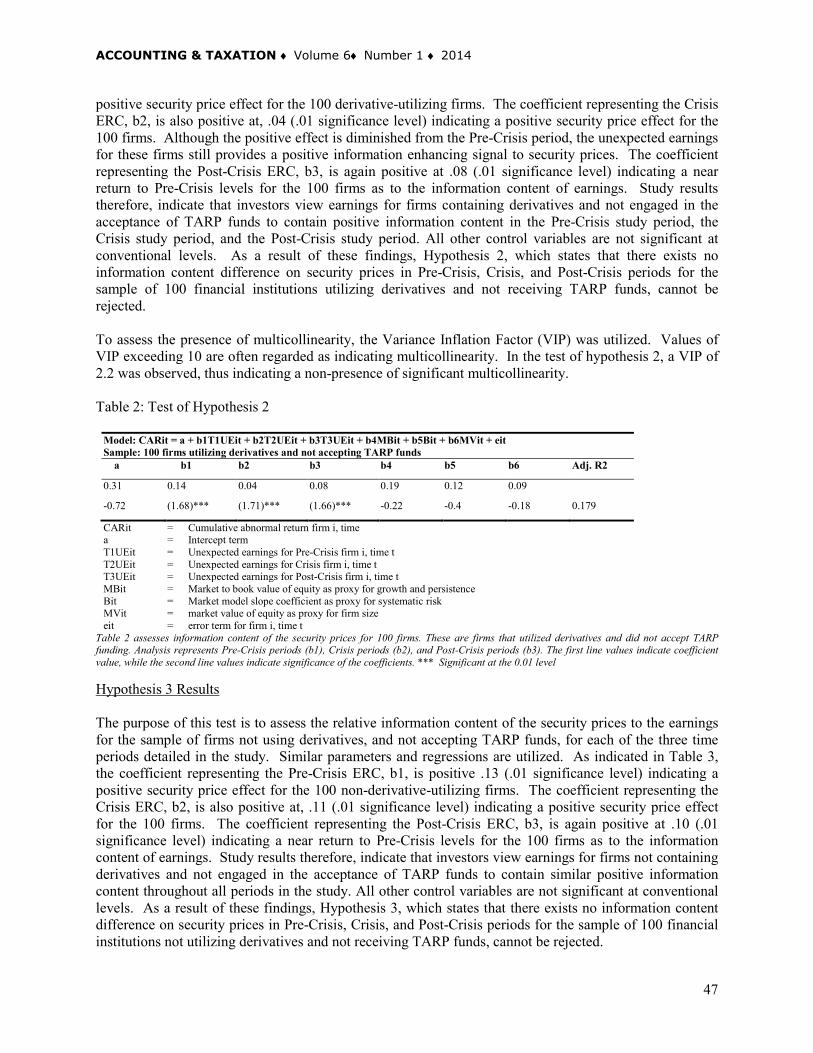
positive security price effect for the 100 derivative-utilizing firms. The coefficient representing the Crisis ERC, b2, is also positive at, .04 (.01 significance level) indicating a positive security price effect for the 100 firms. Although the positive effect is diminished from the Pre-Crisis period, the unexpected earnings for these firms still provides a positive information enhancing signal to security prices. The coefficient representing the Post-Crisis ERC, b3, is again positive at .08 (.01 significance level) indicating a near return to Pre-Crisis levels for the 100 firms as to the information content of earnings. Study results therefore, indicate that investors view earnings for firms containing derivatives and not engaged in the acceptance of TARP funds to contain positive information content in the Pre-Crisis study period, the Crisis study period, and the Post-Crisis study period. All other control variables are not significant at conventional levels. As a result of these findings, Hypothesis 2, which states that there exists no information content difference on security prices in Pre-Crisis, Crisis, and Post-Crisis periods for the sample of 100 financial institutions utilizing derivatives and not receiving TARP funds, cannot be rejected. To assess the presence of multicollinearity, the Variance Inflation Factor (VIP) was utilized. Values of VIP exceeding 10 are often regarded as indicating multicollinearity. In the test of hypothesis 2, a VIP of 2.2 was observed, thus indicating a non-presence of significant multicollinearity. Table 2: Test of Hypothesis 2
Model: CARit = a + b1T1UEit + b2T2UEit + b3T3UEit + b4MBit + b5Bit + b6MVit + eit Sample: 100 firms utilizing derivatives and not accepting TARP funds a b1 b2 b3 b4 b5 b6 Adj. R2
0.31 0.14 0.04 0.08 0.19 0.12 0.09
-0.72 (1.68)*** (1.71)*** (1.66)*** -0.22 -0.4 -0.18 0.179
CARit = Cumulative abnormal return firm i, time a = Intercept term T1UEit = Unexpected earnings for Pre-Crisis firm i, time t T2UEit = Unexpected earnings for Crisis firm i, time t T3UEit = Unexpected earnings for Post-Crisis firm i, time t MBit = Market to book value of equity as proxy for growth and persistence Bit = Market model slope coefficient as proxy for systematic risk MVit = market value of equity as proxy for firm size eit = error term for firm i, time t
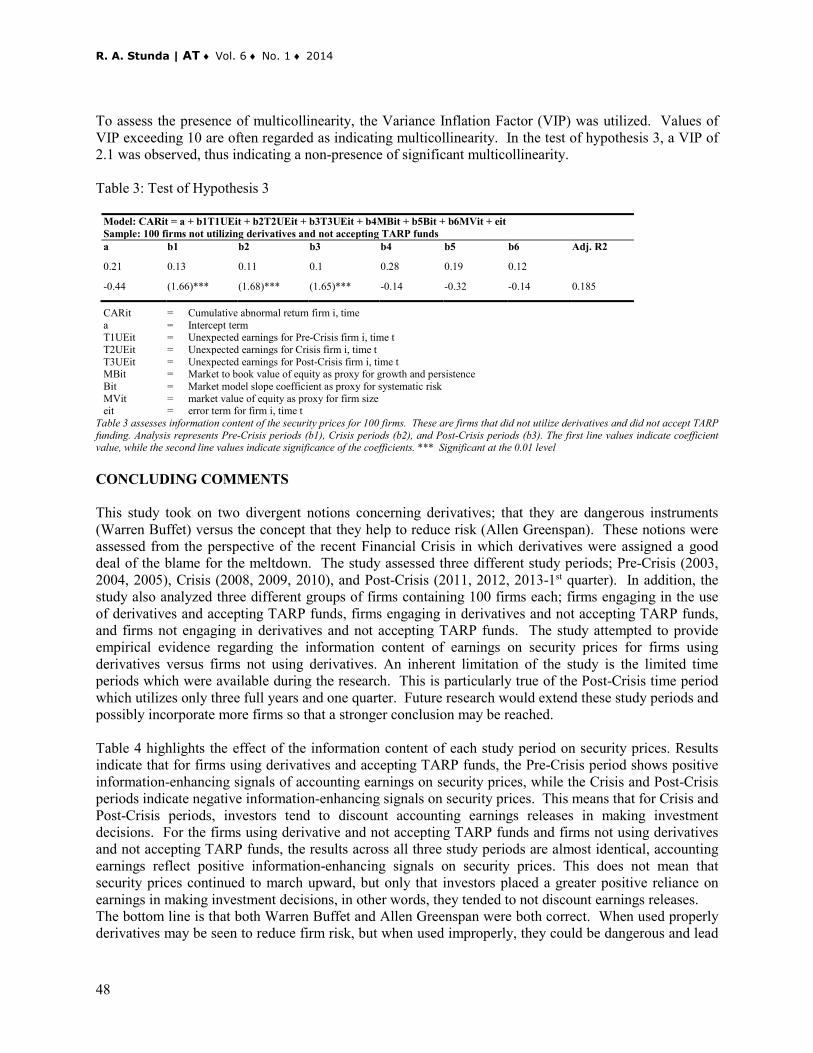
Table 2 assesses information content of the security prices for 100 firms. These are firms that utilized derivatives and did not accept TARP funding. Analysis represents Pre-Crisis periods (b1), Crisis periods (b2), and Post-Crisis periods (b3). The first line values indicate coefficient value, while the second line values indicate significance of the coefficients. *** Significant at the 0.01 level Hypothesis 3 Results The purpose of this test is to assess the relative information content of the security prices to the earnings for the sample of firms not using derivatives, and not accepting TARP funds, for each of the three time periods detailed in the study. Similar parameters and regressions are utilized. As indicated in Table 3, the coefficient representing the Pre-Crisis ERC, b1, is positive .13 (.01 significance level) indicating a positive security price effect for the 100 non-derivative-utilizing firms. The coefficient representing the Crisis ERC, b2, is also positive at, .11 (.01 significance level) indicating a positive security price effect for the 100 firms. The coefficient representing the Post-Crisis ERC, b3, is again positive at .10 (.01 significance level) indicating a near return to Pre-Crisis levels for the 100 firms as to the information content of earnings. Study results therefore, indicate that investors view earnings for firms not containing derivatives and not engaged in the acceptance of TARP funds to contain similar positive information content throughout all periods in the study. All other control variables are not significant at conventional levels. As a result of these findings, Hypothesis 3, which states that there exists no information content difference on security prices in Pre-Crisis, Crisis, and Post-Crisis periods for the sample of 100 financial institutions not utilizing derivatives and not receiving TARP funds, cannot be rejected.
47
R. A. Stunda | AT ♦ Vol. 6 ♦ No. 1 ♦ 2014
To assess the presence of multicollinearity, the Variance Inflation Factor (VIP) was utilized. Values of VIP exceeding 10 are often regarded as indicating multicollinearity. In the test of hypothesis 3, a VIP of 2.1 was observed, thus indicating a non-presence of significant multicollinearity. Table 3: Test of Hypothesis 3
Model: CARit = a + b1T1UEit + b2T2UEit + b3T3UEit + b4MBit + b5Bit + b6MVit + eit Sample: 100 firms not utilizing derivatives and not accepting TARP funds a b1 b2 b3 b4 b5 b6 Adj. R2
0.21 0.13 0.11 0.1 0.28 0.19 0.12
-0.44 (1.66)*** (1.68)*** (1.65)*** -0.14 -0.32 -0.14 0.185
CARit = Cumulative abnormal return firm i, time a = Intercept term T1UEit = Unexpected earnings for Pre-Crisis firm i, time t T2UEit = Unexpected earnings for Crisis firm i, time t T3UEit = Unexpected earnings for Post-Crisis firm i, time t MBit = Market to book value of equity as proxy for growth and persistence Bit = Market model slope coefficient as proxy for systematic risk MVit = market value of equity as proxy for firm size eit = error term for firm i, time t
Table 3 assesses information content of the security prices for 100 firms. These are firms that did not utilize derivatives and did not accept TARP funding. Analysis represents Pre-Crisis periods (b1), Crisis periods (b2), and Post-Crisis periods (b3). The first line values indicate coefficient value, while the second line values indicate significance of the coefficients. *** Significant at the 0.01 level CONCLUDING COMMENTS
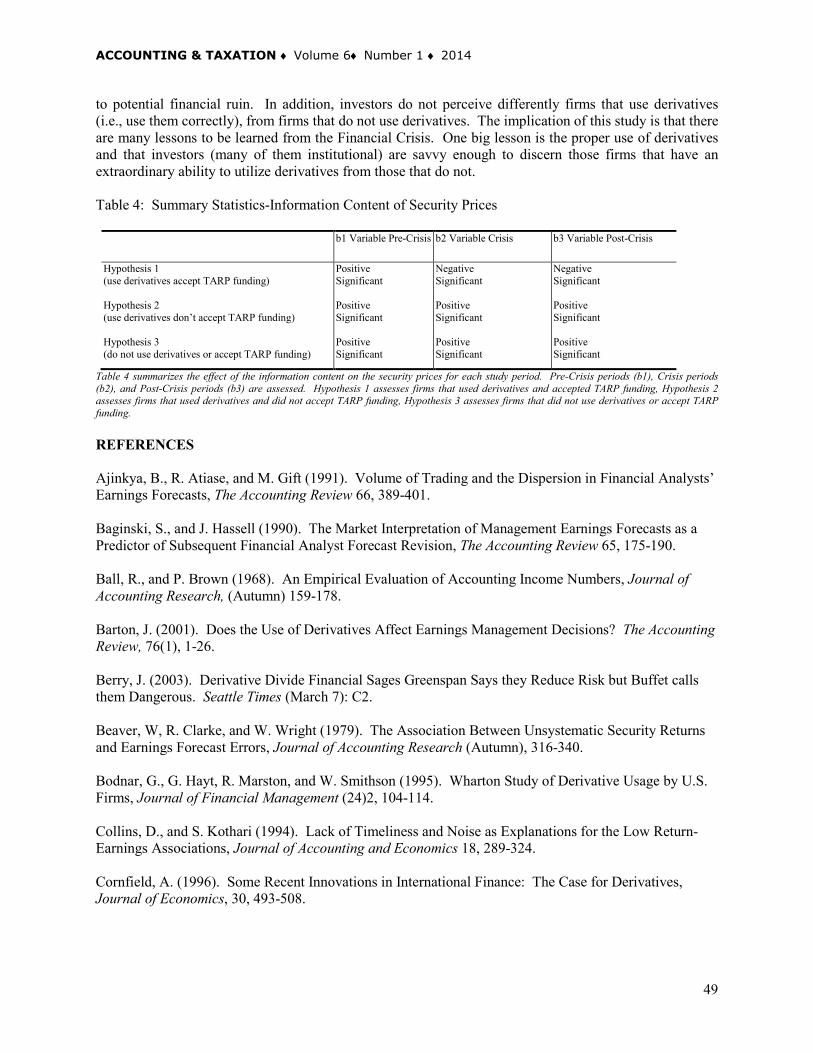
This study took on two divergent notions concerning derivatives; that they are dangerous instruments (Warren Buffet) versus the concept that they help to reduce risk (Allen Greenspan). These notions were assessed from the perspective of the recent Financial Crisis in which derivatives were assigned a good deal of the blame for the meltdown. The study assessed three different study periods; Pre-Crisis (2003, 2004, 2005), Crisis (2008, 2009, 2010), and Post-Crisis (2011, 2012, 2013-1st quarter). In addition, the study also analyzed three different groups of firms containing 100 firms each; firms engaging in the use of derivatives and accepting TARP funds, firms engaging in derivatives and not accepting TARP funds, and firms not engaging in derivatives and not accepting TARP funds. The study attempted to provide empirical evidence regarding the information content of earnings on security prices for firms using derivatives versus firms not using derivatives. An inherent limitation of the study is the limited time periods which were available during the research. This is particularly true of the Post-Crisis time period which utilizes only three full years and one quarter. Future research would extend these study periods and possibly incorporate more firms so that a stronger conclusion may be reached. Table 4 highlights the effect of the information content of each study period on security prices. Results indicate that for firms using derivatives and accepting TARP funds, the Pre-Crisis period shows positive information-enhancing signals of accounting earnings on security prices, while the Crisis and Post-Crisis periods indicate negative information-enhancing signals on security prices. This means that for Crisis and Post-Crisis periods, investors tend to discount accounting earnings releases in making investment decisions. For the firms using derivative and not accepting TARP funds and firms not using derivatives and not accepting TARP funds, the results across all three study periods are almost identical, accounting earnings reflect positive information-enhancing signals on security prices. This does not mean that security prices continued to march upward, but only that investors placed a greater positive reliance on earnings in making investment decisions, in other words, they tended to not discount earnings releases. The bottom line is that both Warren Buffet and Allen Greenspan were both correct. When used properly derivatives may be seen to reduce firm risk, but when used improperly, they could be dangerous and lead
48
ACCOUNTING & TAXATION ♦ Volume 6♦ Number 1 ♦ 2014
to potential financial ruin. In addition, investors do not perceive differently firms that use derivatives (i.e., use them correctly), from firms that do not use derivatives. The implication of this study is that there are many lessons to be learned from the Financial Crisis. One big lesson is the proper use of derivatives and that investors (many of them institutional) are savvy enough to discern those firms that have an extraordinary ability to utilize derivatives from those that do not. Table 4: Summary Statistics-Information Content of Security Prices
b1 Variable Pre-Crisis b2 Variable Crisis b3 Variable Post-Crisis
Hypothesis 1 (use derivatives accept TARP funding) Hypothesis 2 (use derivatives don’t accept TARP funding) Hypothesis 3 (do not use derivatives or accept TARP funding)
Positive Significant Positive Significant Positive Significant
Negative Significant Positive Significant Positive Significant
Negative Significant Positive Significant Positive Significant
Table 4 summarizes the effect of the information content on the security prices for each study period. Pre-Crisis periods (b1), Crisis periods (b2), and Post-Crisis periods (b3) are assessed. Hypothesis 1 assesses firms that used derivatives and accepted TARP funding, Hypothesis 2 assesses firms that used derivatives and did not accept TARP funding, Hypothesis 3 assesses firms that did not use derivatives or accept TARP funding.
REFERENCES Ajinkya, B., R. Atiase, and M. Gift (1991). Volume of Trading and the Dispersion in Financial Analysts’ Earnings Forecasts, The Accounting Review 66, 389-401. Baginski, S., and J. Hassell (1990). The Market Interpretation of Management Earnings Forecasts as a Predictor of Subsequent Financial Analyst Forecast Revision, The Accounting Review 65, 175-190. Ball, R., and P. Brown (1968). An Empirical Evaluation of Accounting Income Numbers, Journal of Accounting Research, (Autumn) 159-178. Barton, J. (2001). Does the Use of Derivatives Affect Earnings Management Decisions? The Accounting Review, 76(1), 1-26. Berry, J. (2003). Derivative Divide Financial Sages Greenspan Says they Reduce Risk but Buffet calls them Dangerous. Seattle Times (March 7): C2. Beaver, W, R. Clarke, and W. Wright (1979). The Association Between Unsystematic Security Returns and Earnings Forecast Errors, Journal of Accounting Research (Autumn), 316-340. Bodnar, G., G. Hayt, R. Marston, and W. Smithson (1995). Wharton Study of Derivative Usage by U.S. Firms, Journal of Financial Management (24)2, 104-114. Collins, D., and S. Kothari (1994). Lack of Timeliness and Noise as Explanations for the Low Return-Earnings Associations, Journal of Accounting and Economics 18, 289-324. Cornfield, A. (1996). Some Recent Innovations in International Finance: The Case for Derivatives, Journal of Economics, 30, 493-508.
49
R. A. Stunda | AT ♦ Vol. 6 ♦ No. 1 ♦ 2014
Gilani, S. (2008). The Real Reason for the Global Financial Crisis, http://mondaymorning.com, September 18, 2008. Guay, W. (1999). The Impact of Derivatives on Firm Risk, Journal of Accounting and Economics, 26, 319-351. Hentschel, L., and P. Kothari (2001). Are Corporations Reducing or Taking Risks with Derivatives? Journal of Financial and Quantitative Analysis, Vol 7, 146-158. Kuprianov, A. (1995). Case Studies of Large Losses in the Derivatives Market, Federal Reserve Bank of Richmond, Economic Quarterly (18), 1-39. Lev, B. (1989). On the Usefulness of Earnings and Earnings Research, Journal of Accounting Research 27, 153-192. Newman, P. (1994). The Real Story of an Insurance Giant’s Fall. Maclean’s 107, 1-24. Petrova, I. (2009). Derivatives as the World Financial Crisis Factor, Journal of Business Management, March, 75-84. Skeel, D., and F. Partnoy (2007). The Promise and Perils of Credit Derivatives, University of Cincinnati Law Review, Vol 75, 1019-1027. Stulz, R. (2009). Credit Default Swaps and the Credit Crisis. Poznan University Economics Review, 11, 64-72. Wolfson, J., and C. Crawford (2010). Lessons from the Current Financial Crisis, Journal of Business and Economic Research, July, Vol 8, 85-91. BIOGRAPHY Ronald Stunda is Professor of Accounting at Valdosta State University. He also serves as reviewer for several journals. His research deals mainly with market-based applied accounting research and has appeared in such journals as Academy of Business Journal, Journal of Business and Behavioral Sciences, Advances in Business Research, and the Journal of Accounting and Financial Studies. He can be reached at Valdosta State University, 1500 North Patterson Street, Valdosta, GA, 31698, [email protected].
50