financial advisors: ycharts confronting behavioral financial biases
TRANSCRIPT
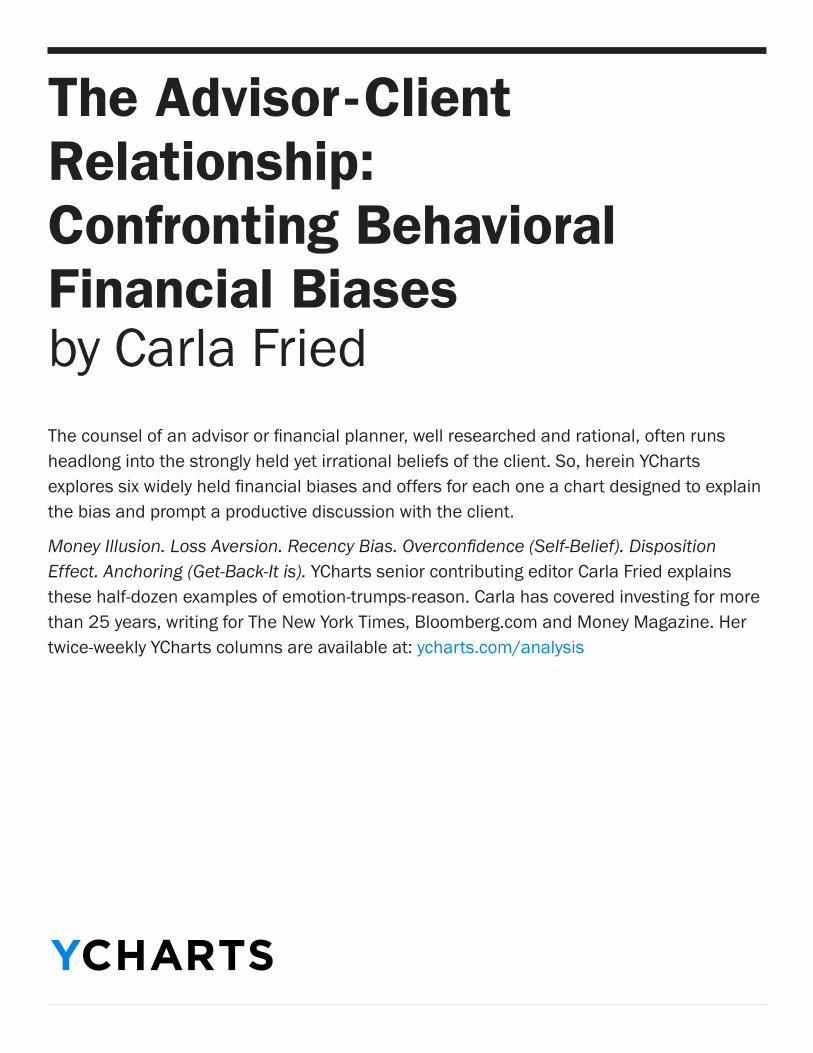
The Advisor -Client Relationship: Confronting Behavioral Financial Biasesby Carla FriedThe counsel of an advisor or financial planner, well researched and rational, often runs headlong into the strongly held yet irrational beliefs of the client. So, herein YCharts explores six widely held financial biases and offers for each one a chart designed to explain the bias and prompt a productive discussion with the client.
Money Illusion. Loss Aversion. Recency Bias. Overconfidence (Self-Belief). Disposition Effect. Anchoring (Get-Back-It is). YCharts senior contributing editor Carla Fried explains these half-dozen examples of emotion-trumps-reason. Carla has covered investing for more than 25 years, writing for The New York Times, Bloomberg.com and Money Magazine. Her twice-weekly YCharts columns are available at: ycharts.com/analysis
YCHARTS
Product Inquiries (866) 965 7552 [email protected]
-56.3% -60
-50
-40
-30
-20
-10
0
7/1/84 7/1/89 7/1/94 7/1/99 7/1/04 7/1/09 7/1/14
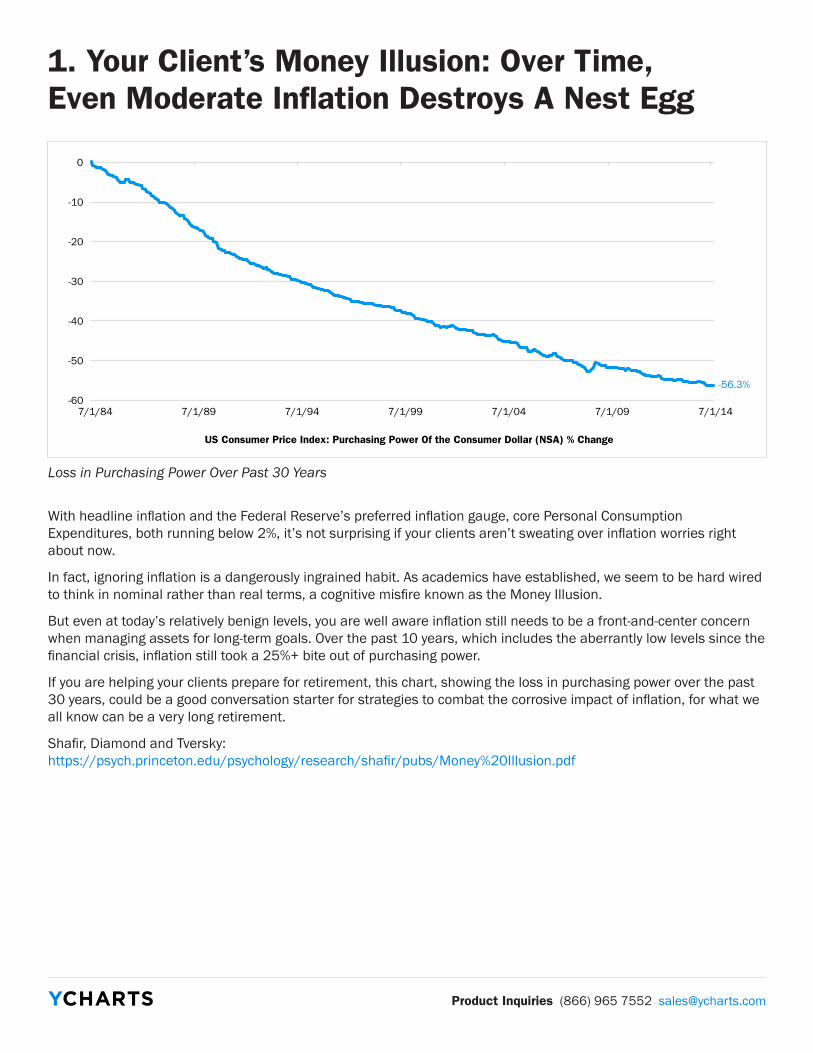
US Consumer Price Index: Purchasing Power Of the Consumer Dollar (NSA) % Change
1. Your Client’s Money Illusion: Over Time,Even Moderate Inflation Destroys A Nest Egg
With headline inflation and the Federal Reserve’s preferred inflation gauge, core Personal Consumption Expenditures, both running below 2%, it’s not surprising if your clients aren’t sweating over inflation worries right about now.
In fact, ignoring inflation is a dangerously ingrained habit. As academics have established, we seem to be hard wired to think in nominal rather than real terms, a cognitive misfire known as the Money Illusion.
But even at today’s relatively benign levels, you are well aware inflation still needs to be a front-and-center concern when managing assets for long-term goals. Over the past 10 years, which includes the aberrantly low levels since the financial crisis, inflation still took a 25%+ bite out of purchasing power.
If you are helping your clients prepare for retirement, this chart, showing the loss in purchasing power over the past 30 years, could be a good conversation starter for strategies to combat the corrosive impact of inflation, for what we all know can be a very long retirement.
Shafir, Diamond and Tversky: https://psych.princeton.edu/psychology/research/shafir/pubs/Money%20Illusion.pdf
Loss in Purchasing Power Over Past 30 Years
Product Inquiries (866) 965 7552 [email protected]
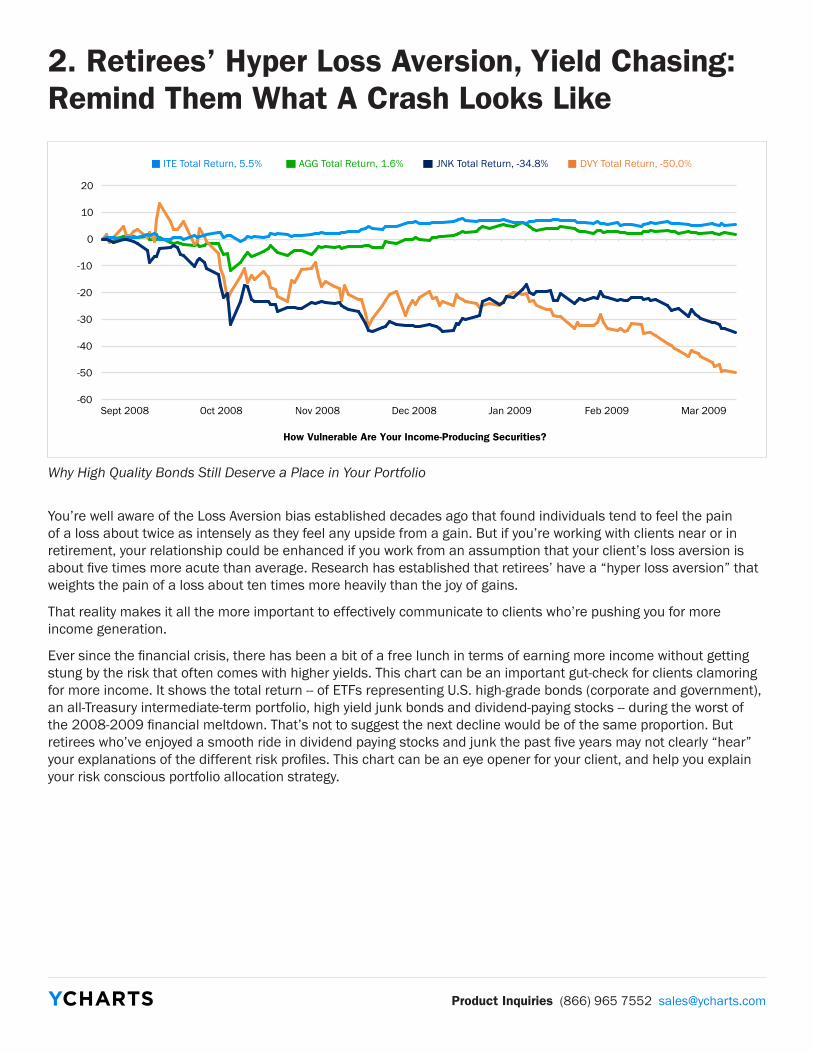
AGG Total Return, 1.6% DVY Total Return, -50.0% ITE Total Return, 5.5% JNK Total Return, -34.8%
-60
-50
-40
-30
-20
-10
0
10
20
How Vulnerable Are Your Income-Producing Securities?
Sept 2008 Oct 2008 Nov 2008 Dec 2008 Jan 2009 Feb 2009 Mar 2009
2. Retirees’ Hyper Loss Aversion, Yield Chasing: Remind Them What A Crash Looks Like
You’re well aware of the Loss Aversion bias established decades ago that found individuals tend to feel the pain of a loss about twice as intensely as they feel any upside from a gain. But if you’re working with clients near or in retirement, your relationship could be enhanced if you work from an assumption that your client’s loss aversion is about five times more acute than average. Research has established that retirees’ have a “hyper loss aversion” that weights the pain of a loss about ten times more heavily than the joy of gains.
That reality makes it all the more important to effectively communicate to clients who’re pushing you for more income generation.
Ever since the financial crisis, there has been a bit of a free lunch in terms of earning more income without getting stung by the risk that often comes with higher yields. This chart can be an important gut-check for clients clamoring for more income. It shows the total return -- of ETFs representing U.S. high-grade bonds (corporate and government), an all-Treasury intermediate-term portfolio, high yield junk bonds and dividend-paying stocks -- during the worst of the 2008-2009 financial meltdown. That’s not to suggest the next decline would be of the same proportion. But retirees who’ve enjoyed a smooth ride in dividend paying stocks and junk the past five years may not clearly “hear” your explanations of the different risk profiles. This chart can be an eye opener for your client, and help you explain your risk conscious portfolio allocation strategy.
Why High Quality Bonds Still Deserve a Place in Your Portfolio
Product Inquiries (866) 965 7552 [email protected]
0
10
20
30
40
50
60
70
80
-
500
1,000
1,500
2,000
2,500
3,000
3,500
4,000
1/1/09 7/1/09 1/1/10 7/1/10 1/1/11 7/1/11 1/1/12 7/1/12 1/1/13 7/1/13 1/1/14 7/1/14
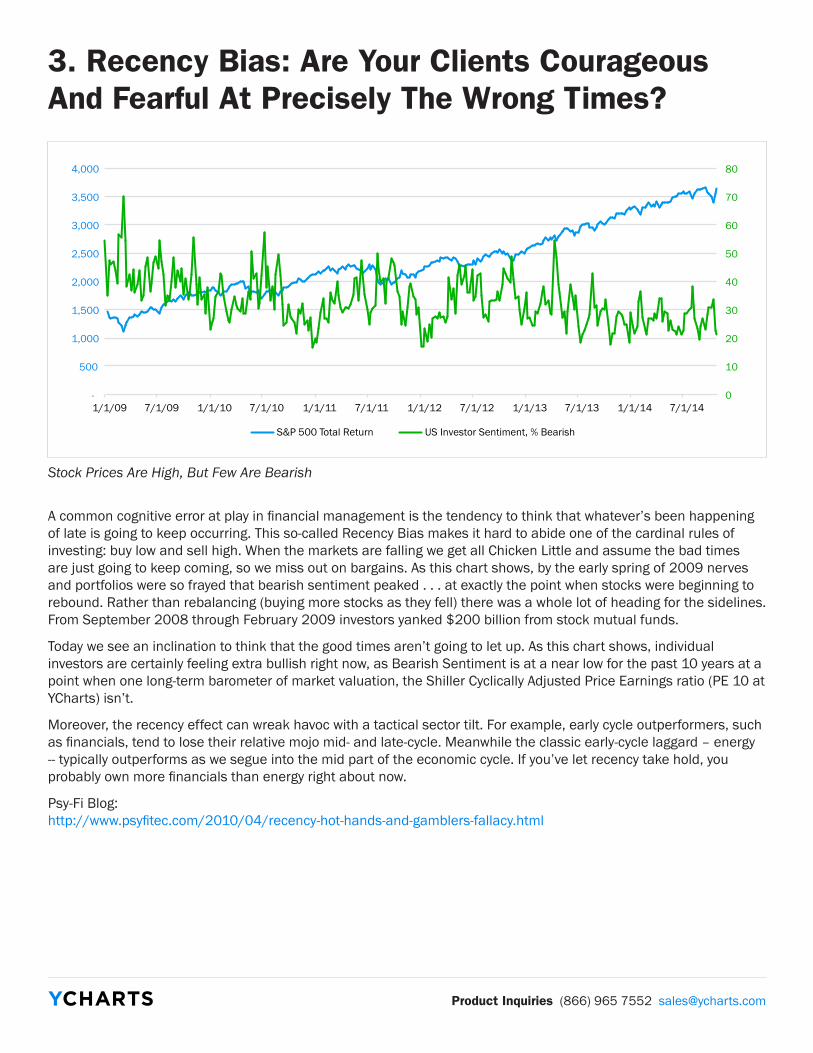
S&P 500 Total Return US Investor Sentiment, % Bearish
3. Recency Bias: Are Your Clients Courageous And Fearful At Precisely The Wrong Times?
A common cognitive error at play in financial management is the tendency to think that whatever’s been happening of late is going to keep occurring. This so-called Recency Bias makes it hard to abide one of the cardinal rules of investing: buy low and sell high. When the markets are falling we get all Chicken Little and assume the bad times are just going to keep coming, so we miss out on bargains. As this chart shows, by the early spring of 2009 nerves and portfolios were so frayed that bearish sentiment peaked . . . at exactly the point when stocks were beginning to rebound. Rather than rebalancing (buying more stocks as they fell) there was a whole lot of heading for the sidelines. From September 2008 through February 2009 investors yanked $200 billion from stock mutual funds.
Today we see an inclination to think that the good times aren’t going to let up. As this chart shows, individual investors are certainly feeling extra bullish right now, as Bearish Sentiment is at a near low for the past 10 years at a point when one long-term barometer of market valuation, the Shiller Cyclically Adjusted Price Earnings ratio (PE 10 at YCharts) isn’t.
Moreover, the recency effect can wreak havoc with a tactical sector tilt. For example, early cycle outperformers, such as financials, tend to lose their relative mojo mid- and late-cycle. Meanwhile the classic early-cycle laggard – energy -- typically outperforms as we segue into the mid part of the economic cycle. If you’ve let recency take hold, you probably own more financials than energy right about now.
Psy-Fi Blog: http://www.psyfitec.com/2010/04/recency-hot-hands-and-gamblers-fallacy.html
Stock Prices Are High, But Few Are Bearish
Product Inquiries (866) 965 7552 [email protected]
0
20
40
60
80
100
120
10/1/09 4/1/10 10/1/10 4/1/11 10/1/11 4/1/12 10/1/12 4/1/13 10/1/13 4/1/14 10/1/14
4. Overconfidence: Tools To Temper Clients’ Self-Congratulations With Thoughtful Self-Awareness
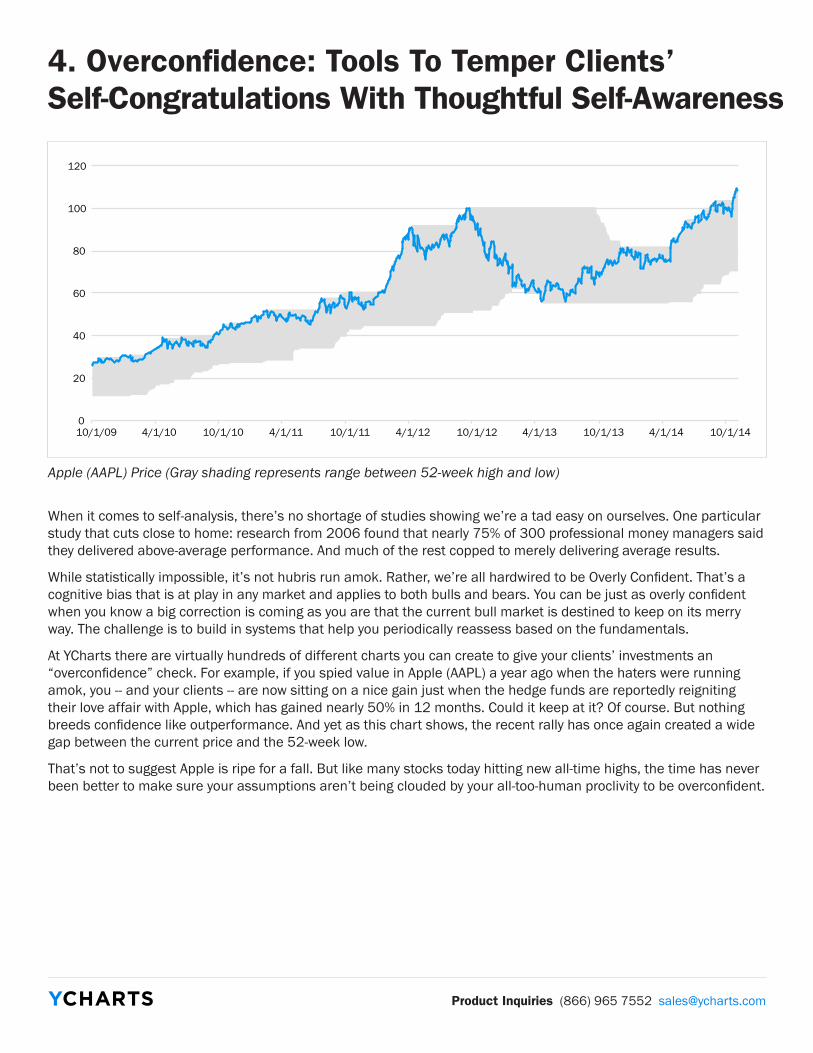
When it comes to self-analysis, there’s no shortage of studies showing we’re a tad easy on ourselves. One particular study that cuts close to home: research from 2006 found that nearly 75% of 300 professional money managers said they delivered above-average performance. And much of the rest copped to merely delivering average results.
While statistically impossible, it’s not hubris run amok. Rather, we’re all hardwired to be Overly Confident. That’s a cognitive bias that is at play in any market and applies to both bulls and bears. You can be just as overly confident when you know a big correction is coming as you are that the current bull market is destined to keep on its merry way. The challenge is to build in systems that help you periodically reassess based on the fundamentals.
At YCharts there are virtually hundreds of different charts you can create to give your clients’ investments an “overconfidence” check. For example, if you spied value in Apple (AAPL) a year ago when the haters were running amok, you -- and your clients -- are now sitting on a nice gain just when the hedge funds are reportedly reigniting their love affair with Apple, which has gained nearly 50% in 12 months. Could it keep at it? Of course. But nothing breeds confidence like outperformance. And yet as this chart shows, the recent rally has once again created a wide gap between the current price and the 52-week low.
That’s not to suggest Apple is ripe for a fall. But like many stocks today hitting new all-time highs, the time has never been better to make sure your assumptions aren’t being clouded by your all-too-human proclivity to be overconfident.
Apple (AAPL) Price (Gray shading represents range between 52-week high and low)
Product Inquiries (866) 965 7552 [email protected]
29.1
15.5
3.8
0
5
10
15
20
25
30
35
40
45
3/9/09 9/9/09 3/9/10 9/9/10 3/9/11 9/9/11 3/9/12 9/9/12 3/9/13 9/9/13 3/9/14 9/9/14
Google (GOOGL) Valuation Metrics
GOOGL PE Ratio (TTM) GOOGL EV to EBITDA (TTM) GOOGL Price to Book Value
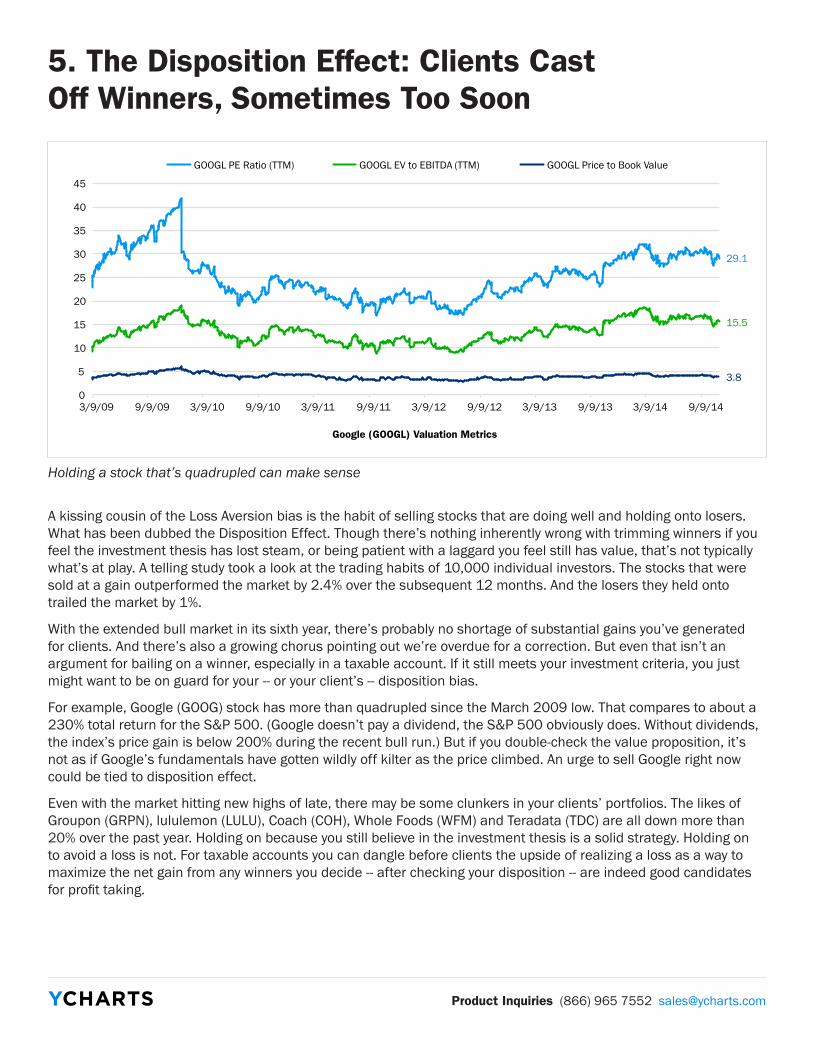
5. The Disposition Effect: Clients Cast Off Winners, Sometimes Too Soon
A kissing cousin of the Loss Aversion bias is the habit of selling stocks that are doing well and holding onto losers. What has been dubbed the Disposition Effect. Though there’s nothing inherently wrong with trimming winners if you feel the investment thesis has lost steam, or being patient with a laggard you feel still has value, that’s not typically what’s at play. A telling study took a look at the trading habits of 10,000 individual investors. The stocks that were sold at a gain outperformed the market by 2.4% over the subsequent 12 months. And the losers they held onto trailed the market by 1%.
With the extended bull market in its sixth year, there’s probably no shortage of substantial gains you’ve generated for clients. And there’s also a growing chorus pointing out we’re overdue for a correction. But even that isn’t an argument for bailing on a winner, especially in a taxable account. If it still meets your investment criteria, you just might want to be on guard for your -- or your client’s -- disposition bias.
For example, Google (GOOG) stock has more than quadrupled since the March 2009 low. That compares to about a 230% total return for the S&P 500. (Google doesn’t pay a dividend, the S&P 500 obviously does. Without dividends, the index’s price gain is below 200% during the recent bull run.) But if you double-check the value proposition, it’s not as if Google’s fundamentals have gotten wildly off kilter as the price climbed. An urge to sell Google right now could be tied to disposition effect.
Even with the market hitting new highs of late, there may be some clunkers in your clients’ portfolios. The likes of Groupon (GRPN), lululemon (LULU), Coach (COH), Whole Foods (WFM) and Teradata (TDC) are all down more than 20% over the past year. Holding on because you still believe in the investment thesis is a solid strategy. Holding on to avoid a loss is not. For taxable accounts you can dangle before clients the upside of realizing a loss as a way to maximize the net gain from any winners you decide -- after checking your disposition -- are indeed good candidates for profit taking.
Holding a stock that’s quadrupled can make sense
Product Inquiries (866) 965 7552 [email protected]
77.0 89.4
0.8
-58.9
-100
-80
-60
-40
-20
0
20
40
60
80
100
8/23/00 8/23/02 8/23/04 8/23/06 8/23/08 8/23/10 8/23/12 8/23/14
S&P 500 MSFT ORCL CSCO
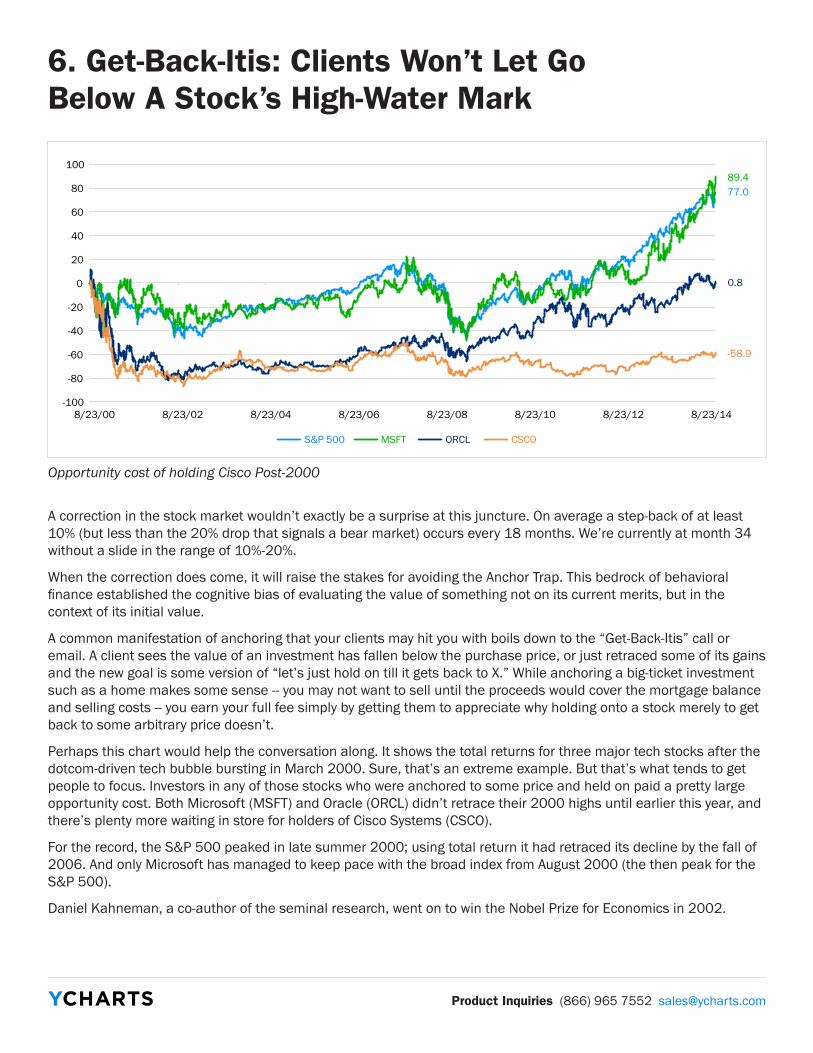
6. Get-Back-Itis: Clients Won’t Let GoBelow A Stock’s High-Water Mark
A correction in the stock market wouldn’t exactly be a surprise at this juncture. On average a step-back of at least 10% (but less than the 20% drop that signals a bear market) occurs every 18 months. We’re currently at month 34 without a slide in the range of 10%-20%.
When the correction does come, it will raise the stakes for avoiding the Anchor Trap. This bedrock of behavioral finance established the cognitive bias of evaluating the value of something not on its current merits, but in the context of its initial value.
A common manifestation of anchoring that your clients may hit you with boils down to the “Get-Back-Itis” call or email. A client sees the value of an investment has fallen below the purchase price, or just retraced some of its gains and the new goal is some version of “let’s just hold on till it gets back to X.” While anchoring a big-ticket investment such as a home makes some sense -- you may not want to sell until the proceeds would cover the mortgage balance and selling costs -- you earn your full fee simply by getting them to appreciate why holding onto a stock merely to get back to some arbitrary price doesn’t.
Perhaps this chart would help the conversation along. It shows the total returns for three major tech stocks after the dotcom-driven tech bubble bursting in March 2000. Sure, that’s an extreme example. But that’s what tends to get people to focus. Investors in any of those stocks who were anchored to some price and held on paid a pretty large opportunity cost. Both Microsoft (MSFT) and Oracle (ORCL) didn’t retrace their 2000 highs until earlier this year, and there’s plenty more waiting in store for holders of Cisco Systems (CSCO).
For the record, the S&P 500 peaked in late summer 2000; using total return it had retraced its decline by the fall of 2006. And only Microsoft has managed to keep pace with the broad index from August 2000 (the then peak for the S&P 500).
Daniel Kahneman, a co-author of the seminal research, went on to win the Nobel Prize for Economics in 2002.
Opportunity cost of holding Cisco Post-2000