financial accounting methods and - ea · pdf filefinancial accounting methods and executive...
TRANSCRIPT

International Journal of Business and Management Review
Vol.3, No.7, pp.16-37, August 2015
Published by European Centre for Research Training and Development UK (www.eajournals.org)
16 ISSN: 2052-6393(Print), ISSN: 2052-6393(Print)
FINANCIAL ACCOUNTING METHODS AND EXECUTIVE COMPENSATION: A
COMPARATIVE STUDY OF PRE AND POST IFRS ADOPTION BY
MANUFACTURING FIRMS
Asian A Umobong, FCA
Department of Accounting, Faculty of Management Science
University of Port Harcourt,
Port Harcourt, Nigeria
ABSTRACT: This paper examines the relationship between financial accounting methods and
executive compensation in pre and post IFRS era of manufacturing firms in Nigeria for a 7 year
period .Financial accounting variables considered in the study are discretional receivable
accruals, discretional inventory accruals and discretional depreciation accruals Tests were
conducted to determine whether financial accounting methods variables have any statistically
significant relationship with executive compensation variable using simple regression Analysis
Executive compensation variable was regressed on financial accounting methods variable on
both eras independently. The results from the analysis showed that discretionary accounts
receivable accruals and discretionary inventory accrual have no statistically significant
relationship with executive compensation of firms in the manufacturing sector of Nigeria in both
pre and post IFRS periods. In Contrast to the other two variables of financial accounting
methods, discretionary depreciation has significant relationship with remuneration of executive
directors implying earnings manipulation and in sync with agency theory.
KEYWORDS: Financial Accounting method, Executive Compensation, Pre and Post IFRS
Adoption, Discretional Accruals, Account Receivable Accruals, Depreciation
INTRODUCTION
The last two decades has witnessed a phenomenal rise in executive compensation largely due to
inflationary pressure and the divorce of management and ownership authority of firms. This
separation of ownership and running of the firm and placement of the responsibility on top
management as the main makers of control system in modern firms, gave rise to conflict of
interest between managers and shareholders. This is the agency theory that implies that managers
have the intent to maximise their personal wealth at the expense of shareholders. Therefore, to
align the interest of managers with that of shareholders, firm designs executive remuneration
contracts to constrain management to act in the best interest of shareholders Jensen and Meckling
(1976). A well designed executive remuneration package maximizes firm’s benefit and reduces
the costs related to executives, hence minimizing costs and risk for the shareholders. Bührer
(2010). The crux of the issue is whether compensation driven contracts utterly addresses the
agency problem or constitute part of the agency problem. This problem has witnessed increased
attention by researchers over the years. The reason for this renewed interest is not far-fetched as
International Journal of Business and Management Review
Vol.3, No.7, pp.16-37, August 2015
Published by European Centre for Research Training and Development UK (www.eajournals.org)
17 ISSN: 2052-6393(Print), ISSN: 2052-6393(Print)
the phenomenal increase in wages of executive impacts on the return to equity due to
shareholders.
One prominent means by which management exercise their control in firms is in financial
accounting and reporting process, precisely in accounting choice policy. Watts and Zimmerman
(1978) extended the agency theory and developed positive accounting theory, a proposition that
managers by exercising judgements in financial reporting attempt to maximise their benefit
through increases in reported earnings that are used as a base measure in executive incentive
bonus plans. Several studies on financial statements-disclosed earnings which serve as the
bottom-line upon which firms’ performance is assesed indicate that earnings contain more
information than rather primitive constructs like operating cash flow. Gomez, Okumura, and
Kunuimura (2000). In other words, the correlation between earnings and future stock returns and
the correlation between earnings and future performance are higher than the correlation between
cash flows from operations and these variables. Such improvement in information content is
obtained by the use of accruals. This is so because accruals mitigate the problems of timing in
measuring cash flows over short interval (Dechow 1994). In this sense, accruals contain the
accounting adjustments necessary to cancel variations related to the operating cash cycle. She
posits further that since timing and matching issues makes cash flow inefficient in measuring
firm performance, and accruals are designed to mitigate these problems, it means, then that
accruals will improve earnings ability to reflect firm’s performance. DKW (1998) also asserts
that earnings predict future cash flow better than current cash flow. This phenomenon can be
attributed to the forecasting power of accruals.
However, GAAP and IFRS allows certain discretions (managers deliberate choices on alternative
accounting methods, often labeled in the literature as “professional judgment”), in reporting
accounting numbers, especially discretionary accruals items which possibly contain
management’s expectations about future cash flows and/or management’s intention to
manipulate information. Subramayam (1996) assert that managerial discretion is the source of
earnings smoothing. Moreover, that executive remuneration is either tied to accounting earnings
(for example, bonus) or stock prices (for example, stock options) makes the executive
compensation contract to create strong incentives and may induce earnings management by firm
agents (executive directors). Lan Sun (2012) Some scholars even argue that large executive pay
packages are the result of powerful managers setting their own pay and extracting rents from
firms. (Carola and Dirk) Managers accomplish this income smoothing using discretionary
accruals. Amr Hassan (2012).The users of financial statements rely and are unsuspecting about
the audited financial information they receive. Likewise firm owners will presume executive
remuneration contract mitigates the principal-agent problem but, in reality, where management
(preparers of financial statements) has everything at their disposal to misrepresent those
statements within the provisions of . Fields et al. (2001) believe the demand for accounting and
accounting regulation implies that accounting disclosures and accounting-based contracts are
efficient ways of addressing market imperfections. The question then arises, is there truly a
correlation between the choice of accounting method and executive remuneration; does
management apply their discretion in choice of accounting method in the interest of the
shareholders and users of financial statements and/ or if managers use their accounting choice
discretion on accruals to maximize their remuneration benefits. There is however scant empirical
International Journal of Business and Management Review
Vol.3, No.7, pp.16-37, August 2015
Published by European Centre for Research Training and Development UK (www.eajournals.org)
18 ISSN: 2052-6393(Print), ISSN: 2052-6393(Print)
literature in third world countries especially in Nigeria that investigates and attempts to proffer
solutions to this questions.. This study therefore aims to fill this gap and ascertain the impact of
accounting methods and its correlation with executive’s compensation in Nigeria’s
pharmaceutical companies.
The main purpose of this study is to ascertain the relationship between Financial Accounting
Methods and Executives Remuneration of quoted manufacturing firms in Nigeria. The objective
of the study therefore is to investigate the relationship between Discretionary Accounts
Receivable Accrual and remuneration of executive directors. It aims also to ascertain the
association between Discretionary Inventories Accrual and remuneration of executive directors.
To examine the correlation between Discretionary Depreciation Accrual and remuneration of
executive directors.
LITERATURE /THEORETICAL UNDERPINNINGS
Conceptual Framework
Discretionary Account Receivables Accrual
Since almost all manufacturing firms in Nigeria have credit sales, accounts receivable accruals
are almost a necessary accrual component of revenue. Accounts receivables are debts owed to
the firm by their customers. Sometimes some of these customers never pay part or all of their
debt, which makes their debt bad, hence bad debt. In compliance with the matching concept, a
proportion of bad debt to be charged to the accounting period is to be estimated by management
known as provisions for bad and doubtful debt which is usually a percentage of the Account
Receivables. Managers also make the call on decisions as to write-off of bad debts and
provisions for bad and doubtful debt. Decisions of increases and reductions in provisions are all
judgements of management, as well as recognition of ‘bad debt written-off and later recovered’.
Hence, potential for manipulation in receivables and receivables-related accounts is well
established. For example, Beasley et al. (2000) find that receivables and inventory are the most
misstated asset accounts on the balance sheet. Accounts receivable accruals are almost a
necessary accrual component of revenue. Accounts receivable is commonly used through
techniques such as trade-loading and premature revenue recognition to manipulate earnings
(Dechow et al. 1996). Stubben (2006) in his study shows that firms manage accounts receivable
accruals to meet not only earnings forecasts, but also sales forecasts. He further shows that such
revenue manipulation behavior is more significant for growth firms whose valuation is
hypothesized to depend more on revenues than on earnings. Based on similar reasons, Marquardt
and Weidman (2004) predict and find that firms issuing equity, who are often growth firms, are
more likely to manage earnings using accounts receivables as companies may manipulate
receivables to increase sales or earnings (Caylor, 2010). A case in point is American Italian
Pasta, which inflated its receivables to support overstated sales (U. S. SEC, 2008). Other
companies, like Gateway for instance, have understated the allowance for doubtful accounts to
decrease expenses and increase earnings (U.S. SEC, 2003).
Discretionary Depreciation Accruals Depreciation is the systematic procedure for allocating the cost of fixed assets over their useful
lives (IAS 4). In determining depreciation, the following four critical decisions have to be made:
International Journal of Business and Management Review
Vol.3, No.7, pp.16-37, August 2015
Published by European Centre for Research Training and Development UK (www.eajournals.org)
19 ISSN: 2052-6393(Print), ISSN: 2052-6393(Print)
Ascertainment of the cost of the asset, estimating the useful life of the asset, determining the
residual or scrap value of the asset and the selection of the depreciation method. All of these
decisions are made by managers, and have impact on financial reporting. Amongst the methods
for example are the straight-line method (spreading the depreciation charge equally over the
assets useful life) - which reports higher earnings and the Reducing balance method (charges
higher depreciation at the beginning of asset life and reduces with subsequent years). Other areas
of judgements many of which offer an opportunity to manage earnings is in Writing off long-
term assets:
Selecting the write-off method - Management has to decide what method to use to write-off
newly acquired long-term operating asset. Some methods result in greater expense in the current
period than others.
Selecting the write-off period - Management must often estimate the “useful” life of a long-term
asset, which can be substantially shorter than its actual physical life. Estimating salvage value -
Some long-term assets retain substantial value at the end of their estimated useful lives. This
value must be estimated in order to record the correct annual expense amount. The value may be
realized 10, 15, or even 30 years in the future, so there can be a range of reasonable estimates.
Change to non-operating use - If a long-term asset is changed from operating to non-operating
use, it will no longer be necessary to record depreciation or amortization expense. This is
permissible when a company ceases to use an asset for operating purposes. Researchers have
either explicitly or implicitly considered a company's depreciation policies in their analyses of
the quality of the firm's earnings. The overriding consensus is that straight-line depreciation is an
income-increasing method and all accelerated methods are income decreasing. For example,
Comiskey (1971) examined the market reaction to a switch from straight-line to accelerated
depreciation. He studied 11 steel companies in 1968 that had changed methods in that year and
reported that four of the 11 firms were able to prevent a decline in EPS from 1967 to 1968
simply by changing to a different depreciation method. Dhalimal, Salamon, and Smith (1982)
reported that management-controlled firms are more likely than the owner controlled firms to use
straight-line depreciation. Aside the choice of accounting methods, managers make the call on
the rate of depreciation, estimated life and salvage value. The longer the useful life of an asset
and the greater the scrap value, the less its depreciation will be over its life. And a lower
depreciation raises reported earnings and boosts book value.
Discretionary Inventory and Accruals
Firms are going concerns and therefore it is expected that at any year end, a firm may have
quantities of stock on hand to meet the day to day demand. Thus inventory constitutes goods
manufactured. The gross profit arises when sales revenue exceeds cost of sales (total opening
stock + cost of manufactured goods less closing stock). There is therefore a relationship between
the value of closing stock, cost of sales and size of gross profit, valuation of inventory becomes
invaluable (Ebirim 1999). However, GAAP provides management choices of different valuation
methods which basically include First-in-First-Out (FIFO), Last in Last Out (LIFO) and the
Weighted Average Method. All of these methods have different significant impact on reported
earnings; FIFO reports higher earnings, followed by the Weighted Average and then the LIFO.
Currently, every manufacturing company uses the FIFO which portrays the prevalent desire to
report higher profits especially in an inflationary economic environment as Nigeria. The GAAP
International Journal of Business and Management Review
Vol.3, No.7, pp.16-37, August 2015
Published by European Centre for Research Training and Development UK (www.eajournals.org)
20 ISSN: 2052-6393(Print), ISSN: 2052-6393(Print)
requires method of valuation to be specified in Financial reports, and the Principle of
consistency, however makes it difficult for firms to switch between methods; however, in stock
valuation, determining the quantity of stock held, deciding the price of the quantity held, the
replacement value of the stock at the accounting date etc are areas of management discretions
which the books is not required to compulsorily state and have proven to be areas usually
exploited in earnings management. Hamilton, C. (n.d)
According to Hamilton, C. (n.d) the overstatement of inventory is one of the most common
manipulations in financial statements. This type of manipulation, he argues is carried out by top
management and is usually motivated by the desire to attain some financial goals or benchmark
and subsequently their compensation. He further asserted that management may be motivated to
report high earnings to satisfy shareholders, achieve compensation targets or maintain bank
lending covenants. This is usually carried out through timing schemes, expenses record as
inventory and valuation schemes. In addition, the FIFO/LIFO question is one of the most
obvious areas of discussion when considering the effects of an accounting method choice on a
firm's quality of earnings. Because inventory make up a large percentage of the assets on the
typical balance sheet of a manufacturing or merchandising company, and because the cost of the
inventory sold is one of the largest single expense items on the typical income statement of
manufacturing and merchandising companies, researchers and analysts have had a heightened
interest in how inventory method decisions affect a company's earnings quality. However, since
such changes must be reflected on the income statements, managers would rather use areas of
discretion to carry out their accrued inventory manipulations. Other operational areas that are
potential targets of accounting manipulation are stated below:
Income overstatement is the most common area of potential manipulation which may involve
artificially inflating sales, or improper accounting entries that cause earnings to be overstated
(Vesta Insurance Group Inc., for example), or overstating inventory (Gibson Greetings Inc.), or
overstating assets and retained earnings (Seaboard Corp.).
Understatement of expenses or payables is a method employed to inflate earnings. Accounting
irregularity examples in this category include artificially-reduced expenses (Rent Way Inc.),
inappropriate recording of expenses (Chicago & North Western Holdings), understating accounts
payable (Guilford Mills Inc.), and undervaluing contract costs (Gunther International Ltd).
Improper Revenue Recognition is one of several ways used to manipulate revenue. Among the
examples in this research are: premature recognition of sales (Systems Network Corp. recognised
revenue in 1996, which should have properly been reported in 1997), shipment manipulations
(Structural Dynamics Research Corp. found that certain shipments intended for sale to, or
through, third party distribution channels, apparently did not represent valid sales), inappropriate
recognition of gains on derivatives transactions (Safety Kleen Corp.), improper recording of
receivables and recording previously unrecognised expenses (Park Electrochemical Corp.), and
inappropriately recorded revenues (Allscripts Inc.), sales (McKesson HBOC Inc.), and
transactions (JDN Realty Corp.).Time Differentiation is another form of manipulation. There are
eight companies in the sample that overstated their earnings using this method. For example,
Exide Corp. improperly deferred a pre- fiscal 1998 charge until fiscal 1998 and 1999.
Transactions were booked in the wrong periods by Informix Corporation. Legato Systems Inc.
International Journal of Business and Management Review
Vol.3, No.7, pp.16-37, August 2015
Published by European Centre for Research Training and Development UK (www.eajournals.org)
21 ISSN: 2052-6393(Print), ISSN: 2052-6393(Print)
recorded contracts as revenue in the third quarter that should have been recorded as revenue in
the first and second quarters of 2000.
Executive Compensation
Executive compensation is defined as executive directors’ remuneration which includes salaries,
wages, and expenses. Despite substantial heterogeneity in pay practices across firms, most CEO
compensation packages contain five basic components: salary, annual bonus, payouts from
long‐term incentive plans, restricted option grants, and restricted stock grants. In addition, CEOs
often receive contributions to defined‐benefit pension plans, various perquisites, and, in case of
their departure, severance payments. (Frydman and Jenter) (n.d). The relative importance of
these compensation elements has changed considerably over time.
Management compensation agreements Management compensation contract is aimed at alleviating the conflict of interest between
corporate managers and stockholders; these plans are designed to motivate managers to
maximize firm value (Smith and Watts, 1982). However, the structure of management
compensation agreements varies across firms because the costs and benefits of monitoring and
motivating managers is a function of the firm’s nature of investment opportunities. Smith and
Watts (1991) argue that the actions of managers are less costly to monitor when the firms have
relatively more assets-in-place than when the firm’s value is comprised largely of growth
opportunities. In addition, managers of firms with relatively more growth opportunities are likely
to enjoy more decision-making discretion because of the notion that these managers have better
information about the firm’s investment opportunities than the firm’s stockholders; In other
words, managers of firms with relatively more assets-in-place are not likely to have as much
specific relevant knowledge as managers of growth firms would have. Consequently, Smith and
Watts predict that the latter are more likely to use incentive compensation schemes that tie
executive remuneration to measures of firm performance (such as accounting earnings or stock
price). In addition, Smith and Watts (1991) argue that accounting numbers are inefficient
performance measures for firms with relatively more growth opportunities due to conservatism
in accounting; the need for objective and verifiable numbers limits the willingness of accountants
to recognize income that depends on future events which are uncertain (Consistent with this,
Collins et al).
Earnings Based Compensation Executive compensation typically consists of four components: base salary – the fixed
component of compensation, stock options, long-term incentive plans and annual bonus plans
(Murphy, 1999). Larker et al. (2007) show a positive association between abnormal accruals and
the weight of accounting-based pay in the compensation package, suggesting that accounting
based pay provides stronger incentives for earnings manipulation than equity-based
compensation. Regarding bonus plans specifically, Murphy (1999) points out that these plans
consist of three basic components: performance measures, performance standards, and the
structure of the pay-performance relation. Prior research largely focuses on how the structure of
pay-performance relation provides incentives for earnings management (Healy, 1985;
Holthausen et al. 1995; Gaver et al. 1995). While these studies assume that earnings are the
performance measure used in bonus plans, Murphy (1999) indicates that cash flow may also be

International Journal of Business and Management Review
Vol.3, No.7, pp.16-37, August 2015
Published by European Centre for Research Training and Development UK (www.eajournals.org)
22 ISSN: 2052-6393(Print), ISSN: 2052-6393(Print)
used as a performance measure. Perry and Zenner (2001) report that in 1995 around 15 percent
of firms employed cash-flow based performance measures. Recent anecdotal evidence suggests
that cash-flow-based performance measures are increasing in popularity, allegedly due to
concerns over management manipulation of earnings (Leone, 2004). In a sample of 165 firms in
year 2005 Huang, Marquardt, and Zhang (2010) report that around 20% percent of the firms use
cash flow based performance measure in their bonus plans.
Conceptualized fig
EXECUTIVE COMPENSATION
(Dependent variable)
Executive directors’
salaries, allowances and
expenses
FIRM
SIZE
CONCEPTUAL
FACTOR
FINANCIAL ACCOUNTING METHODS (Independent variable)
Discretionary Accounts Receivable Accrual
Discretionary
Inventories Accrual
Discretionary
Depreciation
Accrual

International Journal of Business and Management Review
Vol.3, No.7, pp.16-37, August 2015
Published by European Centre for Research Training and Development UK (www.eajournals.org)
23 ISSN: 2052-6393(Print), ISSN: 2052-6393(Print)
EMPIRICAL REVIEW
Empirical Review
The earnings management literature describes the incentives among managers to exploit the
flexibility in GAAP to manage accounting reports in ways that affect earnings quality.
Researchers have examined the effect of bonus plans on those choices with mixed results. For
example, while Healy (1985) examines accrual choices around the lower and upper bounds of
bonus plans showing that managers make accounting/accrual choices as if they affect
compensation, later research, i.e., Gaver et al. (1995), and Holthausen et al. (1995), is unable to
confirm his results along the lower bound. While Gaver et al. (1995) suggest their results are
“more consistent with the income smoothing hypothesis than with Healy's bonus hypothesis,”
Holthausen et al. (1995) argue that “Healy's results at the lower bound are likely to be induced
by his methodology.” Another alternative explanation for the mixed results is that incentives and
behaviour have changed over time. For example, Holthausen et al. (1995) discuss the evolution
of bonus plans from pools plans to budget-based incentive arrangements. It makes sense that
managers would respond to incentives and make accounting choices to manage earnings.
Murphy (1999) documents the use of accounting performance measures in annual incentive plans
of large corporations. Other studies document a significant statistical association between
variants of accounting earnings and incentive pay (e.g., Antle and Smith 1985; Lambert and
Larcker 1987; Jensen and Murphy 1990; Sloan 1993). Perhaps most directly, another line of
research examines accounting method choices (Abdel-Khalik et al. 1987, Healy et al. 1987),
discretionary accruals (Balsam 1998), and nonrecurring transactions (Gaver and Gaver 1998),
showing that compensation appears to be affected by these choices, providing indirect evidence
that managers manipulate reported income to maximize their bonuses.
Given that managers can take actions to manage reported earnings, earnings-related disclosures,
and even the perception of earnings (Schrand and Walther 2000), it is not surprising that Clinch
and Magliolo (1993) report that management discretion could limit the effectiveness of earnings
as a performance measure in compensation contracts. Thus cash flows from operations are often
used by researchers to approximate performance because cash flows are less subject to
accounting accruals and deferrals, and consequently mitigate sources of potential manipulation
(Cheng et al. 1997). Prior researchers, i.e., Kumar et al. (1993) and Natarajan (1996), do not find
a significant association between cash flows from operations and CEO compensation after
controlling for net income. However, Nwaeze et al. (2006) find that cash flows from operations
are compensation contract-relevant, especially when the quality of earnings relative to the quality
of cash flows from operations as a measure of performance is low. While there are no studies
directly linking the level and structure of management compensation to accounting irregularities,
a large number of studies provide evidence about the linkage between management
compensation and earnings management or manipulation. Dye (1988) states that as long as
accounting data are used in compensation contracts, incentives will arise to manage these data.
Elitzur and Yaari (1995) examine how insider trading and executive incentive compensation
affect earnings management. Their results indicate that there is a systematic relationship between
executive incentive compensation and earnings manipulation. This implies that executive
incentive compensation can motivate management to increase the degree of earnings
manipulation. Elitzur and Yaari also indicate that the design of compensation schemes can affect
International Journal of Business and Management Review
Vol.3, No.7, pp.16-37, August 2015
Published by European Centre for Research Training and Development UK (www.eajournals.org)
24 ISSN: 2052-6393(Print), ISSN: 2052-6393(Print)
management’s earnings manipulation practices. Healy (1985) examines the effect of executive
earning-based bonus plans on accrual policies and accounting procedure choice decisions. He
indicates the bonus schemes and performance plans are explicitly dependent on accounting
earnings. His results suggest that bonus plans motivate management to select accrual and
accounting procedures that maximise the present value of their own bonus. Further, the adoption
or modification of a bonus plan has a high probability of causing changes in accounting
procedures. Holthausen, Larcker, and Sloan (1995) extend the work of Healy (1985) and
examine the degree to which earnings manipulation is driven by maximisation of short-term
bonus value. Their results support Healy’s bonus maximization hypothesis. Guidry et al. (1999)
find that business unit managers from multinational conglomerates manipulate earnings to
maximise their short-term bonus plans. Duru and Iyengar (2001) explore the relationship
between compensation variables and accounting- and market-based performance measures. Their
evidence shows that CEOs’ bonuses are more closely tied to accounting performance measures
like earnings before interest and taxes (EBIT) and earnings per share. However, CEO incentive
compensation is associated with the firms’ market-based returns, which explicitly or implicitly
incorporate accounting data.
METHODOLOGY
Data
The accessible population of the study constitutes all listed breweries, cement, food, health &
care product and consumer staple manufacturing companies in Nigeria. The research was based
on firms with complete data for the periods under investigation (2007 – 2011 pre IFRS) and
(2012 – 2013 post IFR. The data covered a total period of seven years (5 years pre IFRS and 2
years post IFRS) from 2007 to 2013. The research uses secondary data obtained from financial
statements of the studied firms and the Nigeria Stock Exchange fact book.
Variables
All the variables of the study were measured with the use of interval scale. The scale is
considered appropriate to measure the numerical extent to which the object on which the scale is
applied to possesses the variable being measured.
The main variables of the study are:
Independent variable: Financial Accounting Methods.
Financial accounting methods are defined as managers’ accounting method choices including
adjustments known as accruals which are the difference between reporting earnings and
operating cash flows (which is equal to Accrual components of earnings). Accounting accruals
(estimates)—adjustments to operating cash flows in calculating net income—are the means for
achieving a desired earnings figure. By their nature, accruals involve estimation, require
subjective judgments, and are difficult for auditors to objectively verify before their realization
(Jackson and Pitman, 2009).
Dependent variable: Executive Compensation.
International Journal of Business and Management Review
Vol.3, No.7, pp.16-37, August 2015
Published by European Centre for Research Training and Development UK (www.eajournals.org)
25 ISSN: 2052-6393(Print), ISSN: 2052-6393(Print)
Executive compensation is defined as executive directors’ remuneration which includes salaries,
wages, and expenses.
Model Specification
Managers use accrual-based earnings management techniques to provide flexibility within
accounting rules to manage firm earnings perhaps to increase their benefits.
Our primary regression follows from model (2) in Balsam (1998) as cited in Balsam (2010).
Balsam hypothesizes and finds that the use of income-increasing discretionary accruals increases
compensation; and that of Shalve, Zhang and Zhang (2010) who used the following model to
examine the relation between depreciation and amortization expenses and CEO bonuses:
CHANGE_BONUSt = α0 + α1 RETt + α2 ΔROAt + α3ΔDEP/AMORTt + e
where; RET is Stock returns and ΔROAt is changes in return on assets. Industry and year fixed
effects are also included in the regression. Change in the accounting-based performance measure
is decomposed into two parts: one for change in depreciation and amortization expenses
(ΔDEP/AMORTt, change in depreciation and amortization scaled by beginning total assets) and
one for change in ROA before depreciation and amortization (ΔROAt, net income before
extraordinary items and depreciation and amortization scaled by beginning total assets).
Following Shalve, et al. (2010), regression Analysis was used in this study. A cross-sectional
regression analysis was used to estimate the effect of these variables on the compensation
packages.
The functional relationships between the variables are thus:
∆EXR = f(∆AR)………………………………………….……………1
∆EXR = f(∆INV)…………………………………………………………2
∆EXR = f(∆DDEP)………………………………………………………..3
From the above functional relationship, the econometric models are specified thus:
y = α1 + β1x1 + ε1t
y = α2 + β2x2 + ε2t
y = α3 + β3x3 + ε3t
Where:
y is the executive directors’ remuneration (∆EXR) in year t less executive directors’
remuneration in year t-1 for firm I scaled by lagged total assets.
x1 is accounts receivables (AR) in year t less account receivables in year t-1scaled by lagged total
assets;
x2 is inventory accruals (IA) in year t less inventory accruals in year t-1scaled by lagged total
assets.
x3 is depreciation in year t less depreciation in year t-1 scaled by lagged total assets;
α = intercept term
β = estimation coefficients
ε = estimation error term
International Journal of Business and Management Review
Vol.3, No.7, pp.16-37, August 2015
Published by European Centre for Research Training and Development UK (www.eajournals.org)
26 ISSN: 2052-6393(Print), ISSN: 2052-6393(Print)
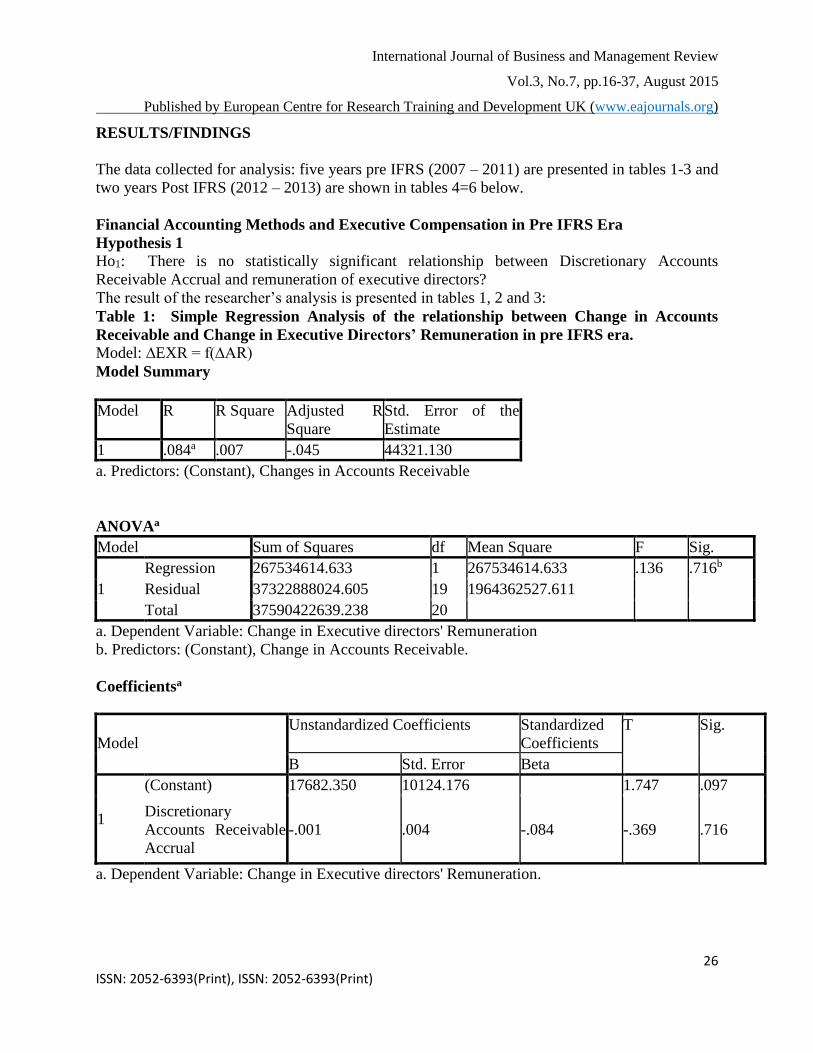
RESULTS/FINDINGS
The data collected for analysis: five years pre IFRS (2007 – 2011) are presented in tables 1-3 and
two years Post IFRS (2012 – 2013) are shown in tables 4=6 below.
Financial Accounting Methods and Executive Compensation in Pre IFRS Era
Hypothesis 1
Ho1: There is no statistically significant relationship between Discretionary Accounts
Receivable Accrual and remuneration of executive directors?
The result of the researcher’s analysis is presented in tables 1, 2 and 3:
Table 1: Simple Regression Analysis of the relationship between Change in Accounts
Receivable and Change in Executive Directors’ Remuneration in pre IFRS era.
Model: ∆EXR = f(∆AR)
Model Summary
Model R R Square Adjusted R
Square
Std. Error of the
Estimate
1 .084a .007 -.045 44321.130
a. Predictors: (Constant), Changes in Accounts Receivable
ANOVAa
Model Sum of Squares df Mean Square F Sig.
1
Regression 267534614.633 1 267534614.633 .136 .716b
Residual 37322888024.605 19 1964362527.611
Total 37590422639.238 20
a. Dependent Variable: Change in Executive directors' Remuneration
b. Predictors: (Constant), Change in Accounts Receivable.
Coefficientsa
Model
Unstandardized Coefficients Standardized
Coefficients
T Sig.
B Std. Error Beta
1
(Constant) 17682.350 10124.176 1.747 .097
Discretionary
Accounts Receivable
Accrual
-.001 .004 -.084 -.369 .716
a. Dependent Variable: Change in Executive directors' Remuneration.
International Journal of Business and Management Review
Vol.3, No.7, pp.16-37, August 2015
Published by European Centre for Research Training and Development UK (www.eajournals.org)
27 ISSN: 2052-6393(Print), ISSN: 2052-6393(Print)
The computed results show an R square value of 0.007, which indicates that 0.70 percent of the
variation in Change in Executive Directors’ Remuneration, can be explained by variability in
Change in Accounts Receivable. This suggests that change in accounts receivable has a very
weak relationship with Change in Executive Directors’ Remuneration. However, the intercept of
the regression is positive, meaning that change in accounts receivable has a positive relationship
with change in executive directors’ remuneration. The coefficient is -0.001, ceteris paribus (all
things being equal), this means that an increase in change in accounts receivable will lead to a
decrease in change in executive directors’ remuneration
.
The ANOVA F-value is 0.136 which is statistically insignificant at a level of 0.05 this suggests
that there is no linear relationship between the variables. The analysis shows a p-value of 0.716
which is far above the conventional level of 0.01 and 0.05 levels of significance. We therefore
accept the null hypothesis and conclude that change in accounts receivable does not have
significant relationship with change in executive directors’ remuneration.
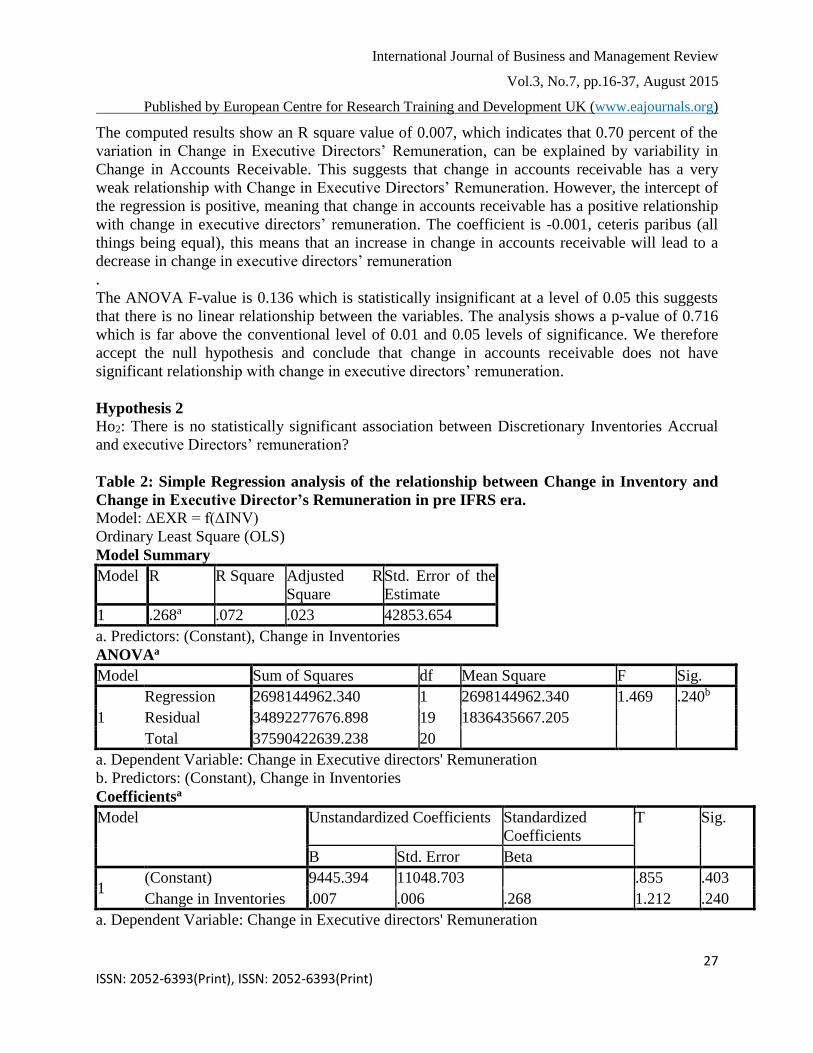
Hypothesis 2
Ho2: There is no statistically significant association between Discretionary Inventories Accrual
and executive Directors’ remuneration?
Table 2: Simple Regression analysis of the relationship between Change in Inventory and
Change in Executive Director’s Remuneration in pre IFRS era.
Model: ∆EXR = f(∆INV)
Ordinary Least Square (OLS)
Model Summary
Model R R Square Adjusted R
Square
Std. Error of the
Estimate
1 .268a .072 .023 42853.654
a. Predictors: (Constant), Change in Inventories
ANOVAa
Model Sum of Squares df Mean Square F Sig.
1
Regression 2698144962.340 1 2698144962.340 1.469 .240b
Residual 34892277676.898 19 1836435667.205
Total 37590422639.238 20
a. Dependent Variable: Change in Executive directors' Remuneration
b. Predictors: (Constant), Change in Inventories
Coefficientsa
Model Unstandardized Coefficients Standardized
Coefficients
T Sig.
B Std. Error Beta
1 (Constant) 9445.394 11048.703 .855 .403
Change in Inventories .007 .006 .268 1.212 .240
a. Dependent Variable: Change in Executive directors' Remuneration
International Journal of Business and Management Review
Vol.3, No.7, pp.16-37, August 2015
Published by European Centre for Research Training and Development UK (www.eajournals.org)
28 ISSN: 2052-6393(Print), ISSN: 2052-6393(Print)
The computed results show an R square value of 0.072, which indicates that 7.2 percent of the
variation in Change in Executive Directors’ Remuneration can be explained by variability in
Change in Inventory. This suggests that change in inventory has a very weak relationship with
Change in Executive Directors’ Remuneration. However, the intercept of the regression is
positive, meaning that change in inventory has a positive relationship with change in executive
directors’ remuneration.The ANOVA F-value is 1.469 which is statistically insignificant at a
level of 0.05 this suggests that there is no linear relationship among the variables. The analysis
shows a p-value of 0.240 which is far above the conventional level of 0.01 and 0.05 levels of
significance. We therefore accept the null hypothesis and conclude that change in inventory does
not have a significant relationship with change in executive directors’ remuneration.
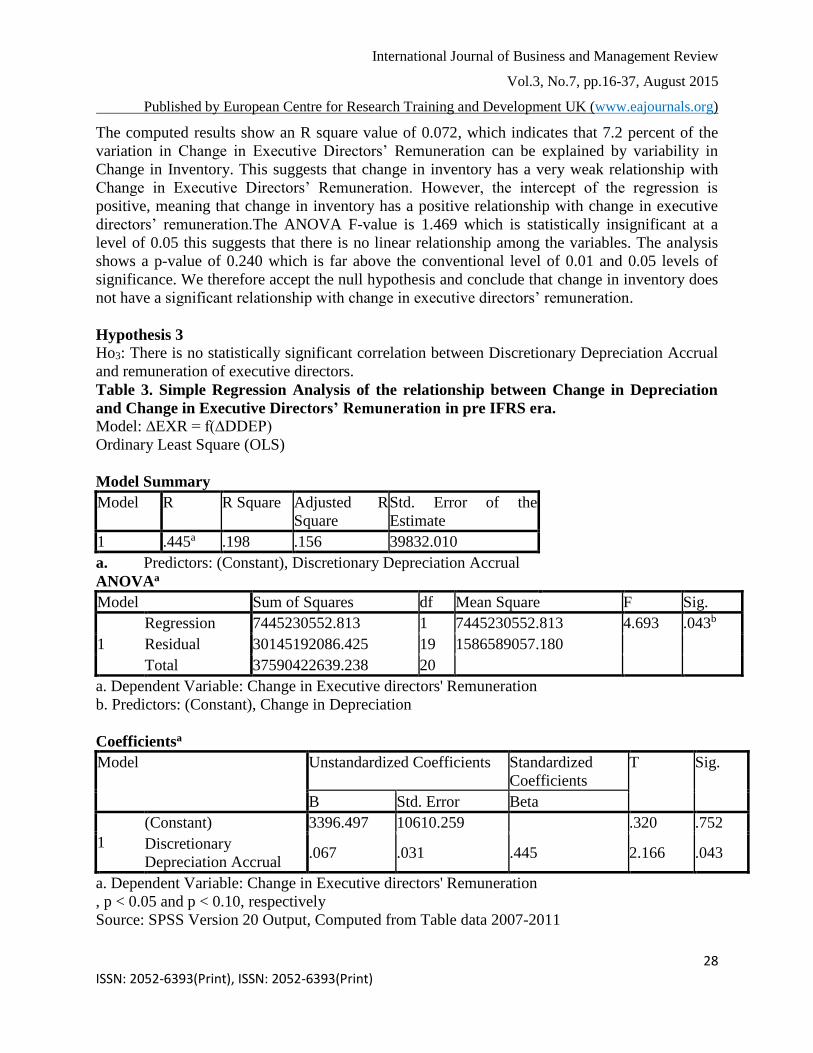
Hypothesis 3
Ho3: There is no statistically significant correlation between Discretionary Depreciation Accrual
and remuneration of executive directors.
Table 3. Simple Regression Analysis of the relationship between Change in Depreciation
and Change in Executive Directors’ Remuneration in pre IFRS era.
Model: ∆EXR = f(∆DDEP)
Ordinary Least Square (OLS)
Model Summary
Model R R Square Adjusted R
Square
Std. Error of the
Estimate
1 .445a .198 .156 39832.010
a. Predictors: (Constant), Discretionary Depreciation Accrual
ANOVAa
Model Sum of Squares df Mean Square F Sig.
1
Regression 7445230552.813 1 7445230552.813 4.693 .043b
Residual 30145192086.425 19 1586589057.180
Total 37590422639.238 20
a. Dependent Variable: Change in Executive directors' Remuneration
b. Predictors: (Constant), Change in Depreciation
Coefficientsa
Model Unstandardized Coefficients Standardized
Coefficients
T Sig.
B Std. Error Beta
1
(Constant) 3396.497 10610.259 .320 .752
Discretionary
Depreciation Accrual .067 .031 .445 2.166 .043
a. Dependent Variable: Change in Executive directors' Remuneration
, p < 0.05 and p < 0.10, respectively
Source: SPSS Version 20 Output, Computed from Table data 2007-2011
International Journal of Business and Management Review
Vol.3, No.7, pp.16-37, August 2015
Published by European Centre for Research Training and Development UK (www.eajournals.org)
29 ISSN: 2052-6393(Print), ISSN: 2052-6393(Print)
The computed results show a correlation coefficient of 0.445 which indicates a fair relationship
between change in depreciation and change in executive directors’ remuneration. However, the
intercept of the regression is positive, meaning that change in depreciation has a positive
relationship with change in executive directors’ remuneration.
The ANOVA F-value is 4.693 which is statistically significant at a level of 0.05 t66his suggests
that there is a strong linear relationship between the variables. The analysis shows a p-value of
0.043 which is less than the conventional level of 0.05 and 0.1 levels of significance. We
therefore reject the null hypothesis and conclude that change in depreciation has significant
relationship with change in executive directors’ remuneration.
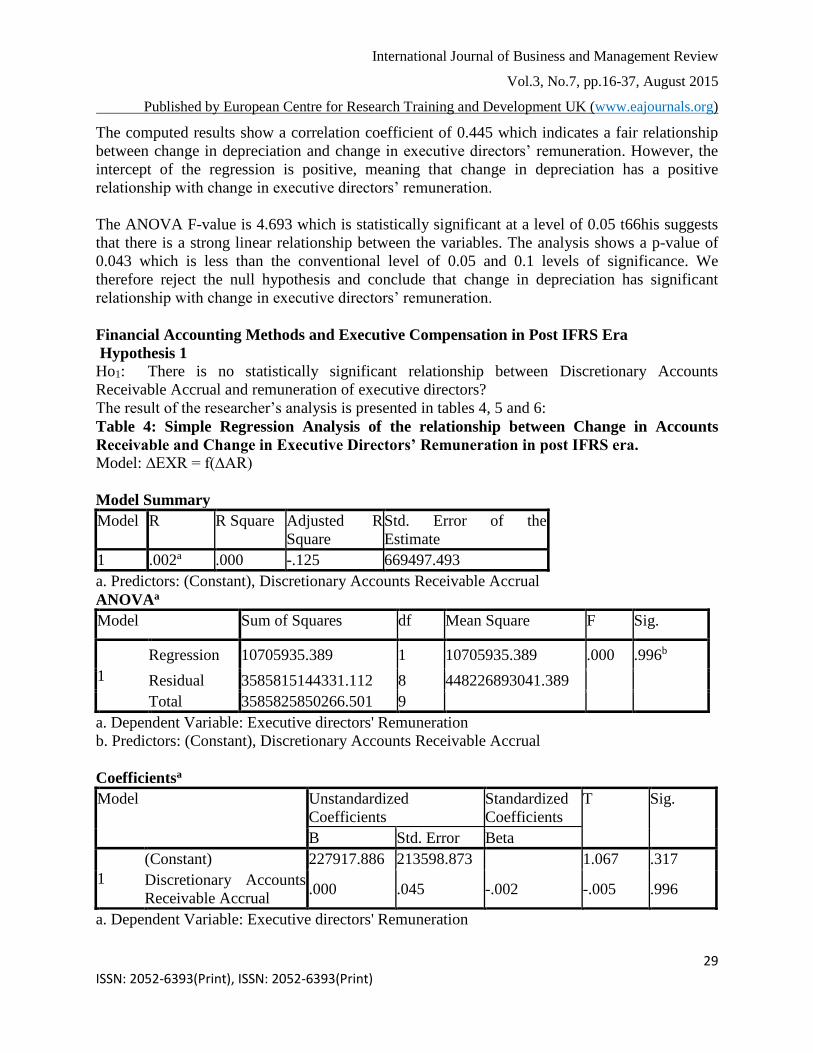
Financial Accounting Methods and Executive Compensation in Post IFRS Era
Hypothesis 1
Ho1: There is no statistically significant relationship between Discretionary Accounts
Receivable Accrual and remuneration of executive directors?
The result of the researcher’s analysis is presented in tables 4, 5 and 6:
Table 4: Simple Regression Analysis of the relationship between Change in Accounts
Receivable and Change in Executive Directors’ Remuneration in post IFRS era.
Model: ∆EXR = f(∆AR)
Model Summary
Model R R Square Adjusted R
Square
Std. Error of the
Estimate
1 .002a .000 -.125 669497.493
a. Predictors: (Constant), Discretionary Accounts Receivable Accrual
ANOVAa
Model Sum of Squares df Mean Square F Sig.
1
Regression 10705935.389 1 10705935.389 .000 .996b
Residual 3585815144331.112 8 448226893041.389
Total 3585825850266.501 9
a. Dependent Variable: Executive directors' Remuneration
b. Predictors: (Constant), Discretionary Accounts Receivable Accrual
Coefficientsa
Model Unstandardized
Coefficients
Standardized
Coefficients
T Sig.
B Std. Error Beta
1
(Constant) 227917.886 213598.873 1.067 .317
Discretionary Accounts
Receivable Accrual .000 .045 -.002 -.005 .996
a. Dependent Variable: Executive directors' Remuneration
International Journal of Business and Management Review
Vol.3, No.7, pp.16-37, August 2015
Published by European Centre for Research Training and Development UK (www.eajournals.org)
30 ISSN: 2052-6393(Print), ISSN: 2052-6393(Print)
The computed results show an R square value of 0.000, which indicates that 0.00 percent of the
variation in Change in Executive Directors’ Remuneration, can be explained by variability in
Change in Accounts Receivable. This suggests that change in accounts receivable has no
relationship with Change in Executive Directors’ Remuneration. However, the intercept of the
regression is negative, meaning that change in accounts receivable has a negative relationship
with change in executive directors’ remuneration. The coefficient is 0.000, ceteris paribus (all
things being equal), this means that an increase in change in accounts receivable will have no
effect in change in executive directors’ remuneration.
The ANOVA F-value is 0.000 which is statistically insignificant at a level of 0.05 this suggests
that there is no linear relationship between the variables. The analysis shows a p-value of 0.996
which is far above the conventional level of 0.01 and 0.05 levels of significance. We therefore
accept the null hypothesis and conclude that change in accounts receivable does not have
significant relationship with change in executive directors’ remuneration.
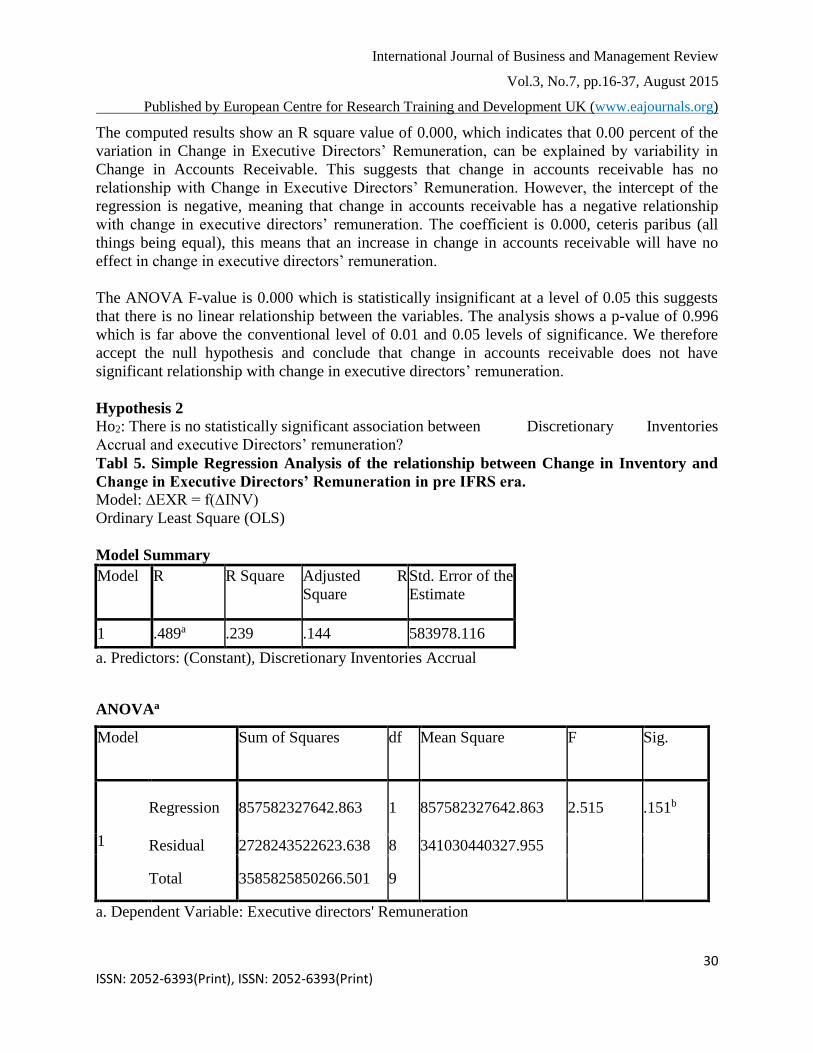
Hypothesis 2
Ho2: There is no statistically significant association between Discretionary Inventories
Accrual and executive Directors’ remuneration?
Tabl 5. Simple Regression Analysis of the relationship between Change in Inventory and
Change in Executive Directors’ Remuneration in pre IFRS era.
Model: ∆EXR = f(∆INV)
Ordinary Least Square (OLS)
Model Summary
Model R R Square Adjusted R
Square
Std. Error of the
Estimate
1 .489a .239 .144 583978.116
a. Predictors: (Constant), Discretionary Inventories Accrual
ANOVAa
Model Sum of Squares df Mean Square F Sig.
1
Regression 857582327642.863 1 857582327642.863 2.515 .151b
Residual 2728243522623.638 8 341030440327.955
Total 3585825850266.501 9
a. Dependent Variable: Executive directors' Remuneration
International Journal of Business and Management Review
Vol.3, No.7, pp.16-37, August 2015
Published by European Centre for Research Training and Development UK (www.eajournals.org)
31 ISSN: 2052-6393(Print), ISSN: 2052-6393(Print)
b. Predictors: (Constant), Discretionary Inventories Accrual
Coefficientsa
Model Unstandardized
Coefficients
Standardized
Coefficients
T Sig.
B Std. Error Beta
1
(Constant) 343208.226 198497.982 1.729 .122
Discretionary
Inventories Accrual .143 .090 .489 1.586 .151
a. Dependent Variable: Executive directors' Remuneration
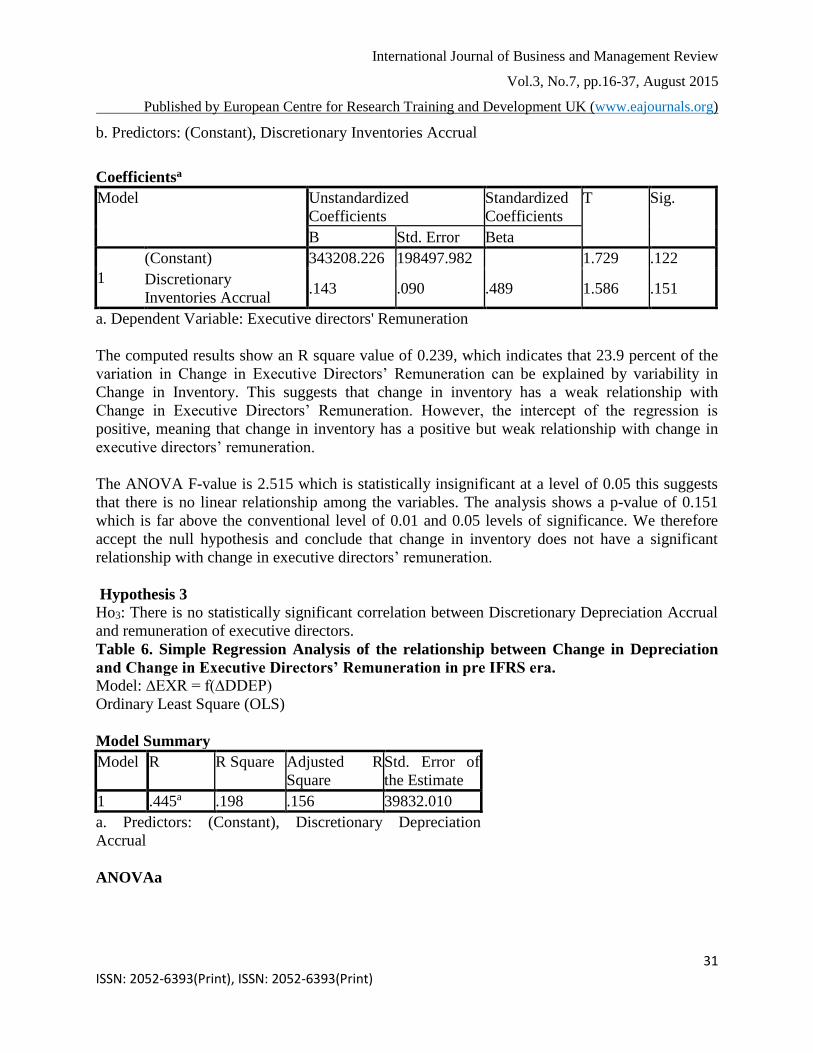
The computed results show an R square value of 0.239, which indicates that 23.9 percent of the
variation in Change in Executive Directors’ Remuneration can be explained by variability in
Change in Inventory. This suggests that change in inventory has a weak relationship with
Change in Executive Directors’ Remuneration. However, the intercept of the regression is
positive, meaning that change in inventory has a positive but weak relationship with change in
executive directors’ remuneration.
The ANOVA F-value is 2.515 which is statistically insignificant at a level of 0.05 this suggests
that there is no linear relationship among the variables. The analysis shows a p-value of 0.151
which is far above the conventional level of 0.01 and 0.05 levels of significance. We therefore
accept the null hypothesis and conclude that change in inventory does not have a significant
relationship with change in executive directors’ remuneration.
Hypothesis 3
Ho3: There is no statistically significant correlation between Discretionary Depreciation Accrual
and remuneration of executive directors.
Table 6. Simple Regression Analysis of the relationship between Change in Depreciation
and Change in Executive Directors’ Remuneration in pre IFRS era.
Model: ∆EXR = f(∆DDEP)
Ordinary Least Square (OLS)
Model Summary
Model R R Square Adjusted R
Square
Std. Error of
the Estimate
1 .445a .198 .156 39832.010
a. Predictors: (Constant), Discretionary Depreciation
Accrual
ANOVAa
International Journal of Business and Management Review
Vol.3, No.7, pp.16-37, August 2015
Published by European Centre for Research Training and Development UK (www.eajournals.org)
32 ISSN: 2052-6393(Print), ISSN: 2052-6393(Print)
Model Sum of Squares df Mean Square F Sig.
1
Regression 7445230552.813 1 7445230552.813 4.693 .043b
Residual 30145192086.425 19 1586589057.180
Total 37590422639.238 20
a. Dependent Variable: Executive directors' Remuneration
b. Predictors: (Constant), Discretionary Depreciation Accrual
Coefficientsa
Model Unstandardized
Coefficients
Standardized
Coefficients
T Sig.
B Std. Error Beta
1
(Constant) 3396.497 10610.259 .320 .752
Discretionary
Depreciation Accrual .067 .031 .445 2.166 .043
a. Dependent Variable: Executive directors' Remuneration
Source: SPSS Version 20 Output, Computed from Table data 2012-2013
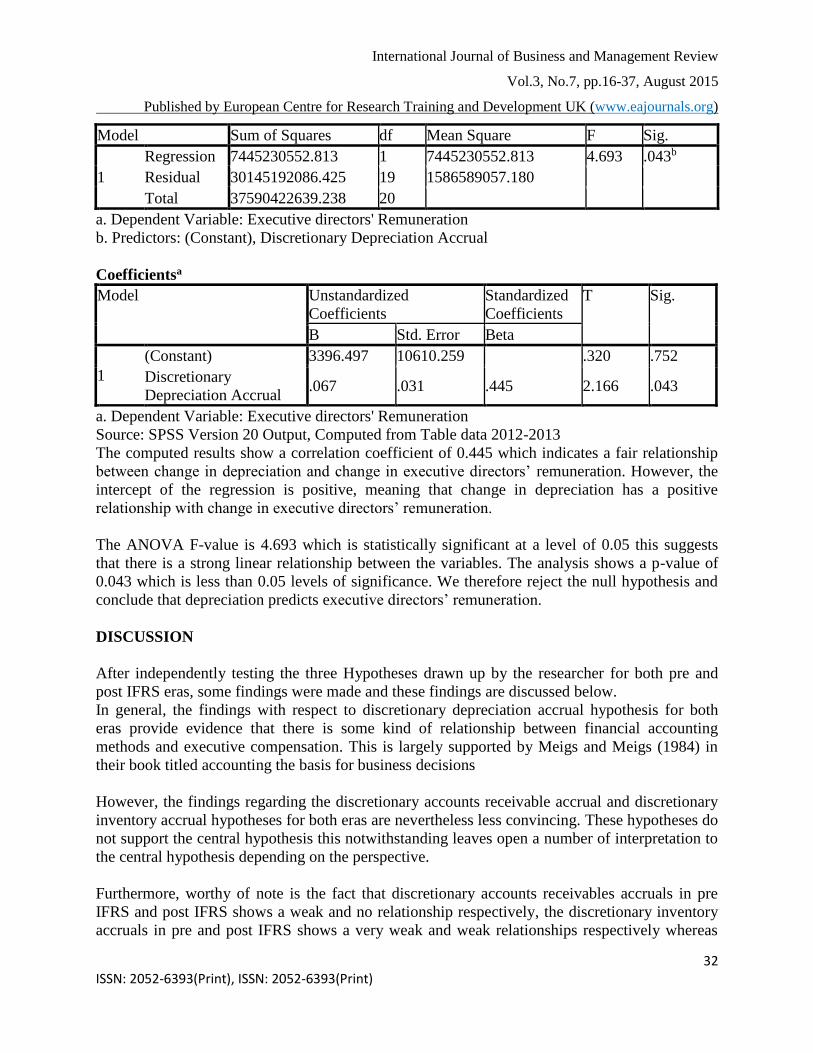
The computed results show a correlation coefficient of 0.445 which indicates a fair relationship
between change in depreciation and change in executive directors’ remuneration. However, the
intercept of the regression is positive, meaning that change in depreciation has a positive
relationship with change in executive directors’ remuneration.
The ANOVA F-value is 4.693 which is statistically significant at a level of 0.05 this suggests
that there is a strong linear relationship between the variables. The analysis shows a p-value of
0.043 which is less than 0.05 levels of significance. We therefore reject the null hypothesis and
conclude that depreciation predicts executive directors’ remuneration.
DISCUSSION
After independently testing the three Hypotheses drawn up by the researcher for both pre and
post IFRS eras, some findings were made and these findings are discussed below.
In general, the findings with respect to discretionary depreciation accrual hypothesis for both
eras provide evidence that there is some kind of relationship between financial accounting
methods and executive compensation. This is largely supported by Meigs and Meigs (1984) in
their book titled accounting the basis for business decisions
However, the findings regarding the discretionary accounts receivable accrual and discretionary
inventory accrual hypotheses for both eras are nevertheless less convincing. These hypotheses do
not support the central hypothesis this notwithstanding leaves open a number of interpretation to
the central hypothesis depending on the perspective.
Furthermore, worthy of note is the fact that discretionary accounts receivables accruals in pre
IFRS and post IFRS shows a weak and no relationship respectively, the discretionary inventory
accruals in pre and post IFRS shows a very weak and weak relationships respectively whereas
International Journal of Business and Management Review
Vol.3, No.7, pp.16-37, August 2015
Published by European Centre for Research Training and Development UK (www.eajournals.org)
33 ISSN: 2052-6393(Print), ISSN: 2052-6393(Print)
the fair significance in discretionary depreciation accruals remained same irrespective of the
difference in data quantum for both eras could be a pointer to a non significant improvement as
regards subjectivity in financial reporting with the translation from Nigerian GAAP to
International Financial Reporting Standards (IFRS). In other words, IFRS accounting standards
is still subjective hence the necessary use of management discretion for quality reporting.
IMPLICATION TO RESEARCH AND PRACTICE
This study provides a basis for policy makers to look at how they can make corporate
governance policy that will protect the interest of existing and potential investors. For industry
practitioners seeking ways to improve their financial accounting methods this study provides a
platform for better understanding of which areas to improve. shareholders should set up a
committee to realign the interest of the executive directors with that of the principal by
introducing stock option compensation and they should not tie this to company’s bottom-line
(i.e., company’s performance). The decision about the company’s accounting policy should not
be left in the hands of executive directors rather it should be done jointly with non-executive
directors. Also the accounting procedures as well as accounting policy be reviewed from time to
time by an accounting policy committee set up by shareholders. The findings of depreciation
having a significant relationship with executive compensation collaborates agency theory where
managers act in self interest and calls for further research on potential ways of mitigating agency
risks.
CONCLUSION
The research goal was to determine whether there is any significant relationship between
financial accounting methods and executive compensation from 2007 to 2011 pre IFRS era and
2012 to 2013 post IFRS era in the manufacturing sector of Nigeria. The research result suggest
that there is no statistically significant relationship between discretionary accounts receivable
accrual and executive directors’ remuneration and that there is also no significant relationship
between discretionary inventory accrual and executive directors’ remuneration, however, it
showed that there is a significant relationship between discretionary depreciation accrual and
executive directors’ remuneration in both eras. Note that variation in executive directions’
remuneration could also be as a result of change in the number of executive directors in the
employment of a given company in any particular year. This study examined the correlation of
change in accounts receivable, inventory and depreciation.
The research result showed that there is no significant relationship between discretionary
accounts receivable accrual, inventory accrual and executive directors’ remuneration. In contrast
discretionary depreciation accrual has a significant relationship with executive directors’
remuneration. The findings on discretionary depreciation accrual corroborate largely the agency
theory that managers adopt accounting choices that serve their interest by creating the impression
that the firm is doing very well while in actual sense the company may be down in terms of real
performance. The researcher’s results indicate that there is some relationship between financial
accounting methods and executive compensation.

International Journal of Business and Management Review
Vol.3, No.7, pp.16-37, August 2015
Published by European Centre for Research Training and Development UK (www.eajournals.org)
34 ISSN: 2052-6393(Print), ISSN: 2052-6393(Print)
FUTURE RESEARCH
The findings from our analysis have provided invaluable insights that should be of interest to
practitioners, scholars, investors and policy makers. Certain issues arising from the firms provide
avenues for further research as outlined below:
The study considered the relationship between financial accounting methods and executive
compensation of quoted manufacturing companies in pre and post IFRS periods. Future research
might carry out same study but with consideration to other factors like government policies,
stock performance, legal and political system etc that might be responsible for changes in
Executive compensation. A comparative analysis of the various financial accounting methods
can also be carried out in further research. as this study merely focused on comparison between
pre and post IFRS periods. Further research can extend this study by replicating the methodology
to investigate data of companies in the insurance sector. Moreover, the data sample can be
separated and analyzed by industry. In this way a contribution could be made to developing a
more industry specific theories. Future research has an opportunity to test longer time periods.
REFERENCES
Aboody, D. And Kaznik, R. (2010) Executive Compensation And Financial Accounting
Foundation And Trends In Accounting Vol 4, No 2, Pp 113-198, 2009
Abdel-Khalik, A. R., Chi, C. and Ghicas, D. (1987), Rationality Of Executive Compensation
Schemes And Real Accounting Changes Contemporary Accounting Research, 4: 32–60.
Doi: 10.1111/J.1911-3846.1987.Tb00654.X
Aksu, M. (2006) Improvement in Transparency & Disclosure in the ISE: Did IFRS Adoption and
Corporate Governance Principles Make a Difference? Faculty of Management, Sabanci
University, Istanbul, Turkey JEL Codes:G14, G32, G34, G38, O52
Antle, R. and A. Smith. (1985) Measuring Executive Compensation: Methods and Application
Journal of Accounting Research (Spring): 296-325. (Jstor Link).
Balsam, S. (1998), Discretionary Accounting Choices and CEO Compensation Contemporary
Accounting Research, 15: 229–252. Doi: 10.1111/J.1911-3846.1998.Tb00558.X
Balsam, S., Yang, S., And Yin, J. (2011) A Reexamination Of The Association Between CEO
Compensation and TheComponents of Accounting Earnings, University OfTexas, San
Antonio, College Of Business, Wp #0029acc-428-2010
Bebchuk, L. A. and Fried, J. M. (2003) Executive Compensation as an Agency Problem Journal
of Economic Perspectives, Vol.17, Pp. 71-92, Harvard Law and Economics Discussion
Paper No. 421.
Bebchuk, L. A. and Fried, J. M. (2005) Pay Without Performance: Overview Of The Issues
Journal Of Corporation Law, Vol. 30, No. 4, Pp. 647-673, Journal Of Applied Corporate .
Bird, A. And Ruchti, G. T. (2014) Managerial Discretion and Earnings Informativeness: A
Structural Approach
Bührer, M. S. (2010) CEO and Chairperson Compensation: The Impact of the Financial Crisis
University of St. Gallen, Graduate School of Business Administration, Economics, Law
and Social Sciences (HSG) Adag Copy AG, Zürich
International Journal of Business and Management Review
Vol.3, No.7, pp.16-37, August 2015
Published by European Centre for Research Training and Development UK (www.eajournals.org)
35 ISSN: 2052-6393(Print), ISSN: 2052-6393(Print)
Carola Frydman & Dirk Jenter, (2010) CEO Compensation Annual Review of Financial
Economics, Vol. 2(1), Pp 75-102
Chen, C., Liang, J. And Lin, S. (2006) Unexpected Earnings, Abnormal Accruals and Changes
in CEO Bonuses The International Journal Of Accounting Studies Pp 25-50
Cohen, A. D (2010) Discussion of CEO Compensation and Fair Value Accounting: Evidence
from Purchase Price Allocation Capana Conference Chengdu, July 2 2010.
Danoshana, S. And Ravivathani, T. (2013) The Impact of the Corporate Governance On Firm
Performance: A Study On Financial Institutions in Sri Lanka Merit Research Journal of
Accounting, Auditing, Economics And Finance Vol. 1(6) Pp.118-121, December, 2013
David I. Walker (2007) Financial Accounting and Corporate Behavior 64 Wash. & Lee L.
Rev 927
Davies, J. H., Schoorman, F. D. and Donaldson, L. (1997) Toward a Stewardship Theory of
Management Academy Of Management Review, 1997 Vol. 22,No1, Pp 20-47
Dkw (1998) Earnings Quality and Earnings Management: The Role of Accounting Accrual
Duncan, K. (1992) Income Strategies of Listed and Unlisted Companies: An Empirical Study of
Accounting Method Choices School of Business Discussion Papers. Paper 33
Dye, R. A. (1988) Earnings Management in an Overlapping Generations Model Journal of
Accounting Research Vol 26, No. 2
Ebirim, C. O (1999) Higher Business Accounting Fair and Square Publishers University of Port
Harcourt, Port Harcourt
Eierle, B. and Schultze, W. (2013) The Role of Management as a User of Accounting
Information: Implications for Standard Setting Accounting and Management Information
Systems Vol. 12, No.2, Pp.155 –189
Fekete, S., Damagum, Y. M., Mustaţă, R., Matiş, D., and Popa, I., (2010) Explaining
Accounting Policy Choices of Sme’s: An Empirical Research on The Evaluation
Methods European Research Studies, Volume Xiii, Issue (1)
Fields, T. D., Lys, T. Z. And Vincent, L. (2001) Empirical Research on Accounting Choice
Journal of Accounting and Economics 31 (2001) 255–307
Frydman, C. And Jenter, D. (n.d) CEO Compensation Gomez, X. G, Okumura, M. and
Kunuimura, M. (2000) Discretionary Accrual Models and the Accounting Process kobe
Economic and Business Review, Nagoya, Japan
Greg Clinch, Joseph Magliolo (1993) CEO Compensation and Components of Earnings in Bank
Holding Companies North-Holland Journal Of Accounting And Economics Vol 16 No 1
Pp 241-272
Hahn, D. P. and Lasfer, M. (2010) The Compensation of Non- Executive Directors:
Rationale, Form, and Findings Journal of Management Government Doi10.1007/S10997-
010-9134-5
Hassan, A. (2012) Accounting Choices Determinants Underlying the Positive Accounting
Theory Ark:/13960/T5v70gg5t
Healy, P. (1985) The Effect of Bonus Schemes on Accounting Decisions Journal of Accounting
and Economics 7 (1985) 85-107. North-Holland
Healy, P. M. and Wahlen J. M. (1999) A Review of the Earnings Management Literature and its
Implications for Standard Setting Kelley School of Business, Indiana University.
International Journal of Business and Management Review
Vol.3, No.7, pp.16-37, August 2015
Published by European Centre for Research Training and Development UK (www.eajournals.org)
36 ISSN: 2052-6393(Print), ISSN: 2052-6393(Print)
Hol Thausen, R. W., Larcker, D. F. And Sloan, R. G (1995) Annual Bonus Schemes and
the Manipulation of Earnings Journal Of Accounting And Economics 19 (1995) 29
Wharton School, University Of Pennsylvania, Philadelphia, Pa 19104-6365
Ibrahim, S. S. (2005) An Alternative Measure to Detect Intentional Earnings Management
through Discretionary Accruals
Jeanjean, T. and Stolowy, H. (2008) “Do Accounting Standards Matter? An Exploratory
Analysis of Earnings Management Before and After IFRS Adoption” issue of the Journal of
Accounting and Public Policy November/December 2008.
Jensen, M. C And Meckling, W. H. (1976) Theory of the Firm: Managerial Behavior,
Agency Costs and Ownership Structure Journal of Financial Economics, October,
1976, V. 3, No. 4, Pp. 305-360
Knivsfla, K. H. And Saettem, F. (N.D) Are Firms Using Depreciation to Manage Earnings Prior
to the Acquisition of Long-Term Capital?
Meigs, R. F. and Meigs, W. B. (1984) Accounting: The Basis for Business Decision McGraw
Hill Book Company, New York City, ISBN 0-07-041587-0
Murphy, Kevin J., (1998) Executive Compensation Available At Ssrn:
Http://Ssrn.Com/Abstract=163914 or Http://Dx.Doi.Org/10.2139/Ssrn.163914
Peasnell, K. V., Pope, P. F. and Young, S. (1999) Detecting Earnings Management Using Cross-
Sectional Abnormal Accruals Models Lancaster University
Ricci, W. C. (2011) Manipulating Receivables: A Comparison Using the Sec’s Accounting
and Auditing Enforcement Releases Journal of Applied Business and Economics
Vol.12(5).
Shalev, R., Zhang, I. and Zhang, Y. (2010) CEO Compensation And Fair Value Accounting:
Evidence From Purchase Price Allocation
Skinner, J. D (1993) The Investment Opportunity Set and Accounting Procedure Choice:
Preliminary Evidence Journal Of Accounting and Economics 16 (1993) 407-445. North-
Holland.
Sloan, R. G. (1993) Accounting earnings and Top Executive Compensation Journal of
accounting and Economics Vol16 (1) Pp 55-100 North-Holland
Sun, L. (2012) Executive Compensation and Contract-Driven Earnings Management Asian
Academy of Management Journal Of Accounting and Finance University of New England,
Australia Aamjaf, Vol. 8, No. 2, 111–127
Van Praag, B. J. (2001) Earnings Management: Empirical Evidence on value relevance
and Income smoothing Amsterdam Business School Research Institute (ABS-RI)
http://hdl.handle.net/11245/1.197039
Wattana, P. K (2008) The Effect of Accounting-Based Earnings Attributes on CEO
Compensation Oklahoma State University.
Watts, R. L. And Zimmerman, J. L (1978) Towards a Positive Theory of the Determination of
Accounting Standards Accounting Review American Accounting Association 112-134
Watts, R. L. And Zimmerman, J. L (1979) The Demand for and supply of Accounting
Theories: The Market for Excuses Accounting Review American Accounting Association
273-305
Watts, R. L. And Zimmerman, J. L (1986) Positive Accounting Theory Prentice-Hall Inc
International Journal of Business and Management Review
Vol.3, No.7, pp.16-37, August 2015
Published by European Centre for Research Training and Development UK (www.eajournals.org)
37 ISSN: 2052-6393(Print), ISSN: 2052-6393(Print)
Xing, W., Fengping, W. and Quen, W. (2013) The Structure of Executive Compensation, The
Choice of Accounting Policies and The Value of Corporation 2nd International Conference
on Science and Social Research (Icssr 2013)
Yuan, Z. (2006) An Empirical Analysis of Revenue Manipulation Columbia Business School
New York, Ny
Zmijewski, M. E. And Hagerman, R. L.(1981) An Income Strategy Approach to the Positive
Theory of Accounting Standard Setting/Choice Journal of Accounting and Economics, Vol
3(2), Pp. 129-49.
Zmijewski, M. E. And Hagerman, R. L.(1979) Some Economic Determinants of Accounting
Policy Choice Journal Of Accounting And Economics, 1(2), Pp. 141-61.