final thesis - m.sc sustainable energy science - vignir bjarnason
TRANSCRIPT
7/27/2019 Final Thesis - M.sc Sustainable Energy Science - Vignir Bjarnason
http://slidepdf.com/reader/full/final-thesis-msc-sustainable-energy-science-vignir-bjarnason 1/76
Feasibility study of utilizing surplus energy from Landsvirkjun for
the production of Substitute Natural Gas
by
Vignir Bjarnason
ThesisMaster of Science in Sustainable Energy
January 2013
7/27/2019 Final Thesis - M.sc Sustainable Energy Science - Vignir Bjarnason
http://slidepdf.com/reader/full/final-thesis-msc-sustainable-energy-science-vignir-bjarnason 2/76
ii
Feasibility study of utilizing surplus energy from Landsvirkjun for
the production of Substitute Natural gas
by
Vignir Bjarnason
Thesis submitted to the School of Science and Engineeringat Reykjavík University in partial fulfillment
of the requirements for the degree of Master of Science in Sustainable Energy
January 2013
Supervisor:
Páll Jensson – PhD Industrial Engineering, Reykjavík University
Examiner:
Teitur Gunnarson – M.Sc Chemical Engineering, Mannvit
7/27/2019 Final Thesis - M.sc Sustainable Energy Science - Vignir Bjarnason
http://slidepdf.com/reader/full/final-thesis-msc-sustainable-energy-science-vignir-bjarnason 3/76
iii
Feasibility study of utilizing surplus energy from Landsvirkjun for theproduction of Substitute Natural gas
Abstract Over 80% of the energy used in Iceland today comes from domestic renewable energy sources.
Around 70% of the energy produced from domestic renewable energy comes from hydro
power. The largest producer of renewable hydro power in Iceland is Landsvirkjun. At present
there is a substantial part of that hydro power energy which goes to waste during parts of the
years when water flows over the spillways of full reservoirs. This research thesis proposes a
solution to utilizing this energy. The main idea is to utilize the surplus or unsecured energy
generated by Landsvirkjun to produce a renewable synthetic fuel or Substitute Natural Gas. This
is to be done using the Sabatier reaction process. The equipment that is referred to in this
research is being developed by SolarFuel GmbH in Germany. The research focuses mainly on
what is needed to make the production described work and whether it can be considered
feasible, both technically and financially. In order to get a sense of any economies of scale three
scenarios are set up of different sizes for the SNG plant. The conclusion to the research is that
the project is technically possible but at best marginally financially feasible. Future
development of the technology could change the outcome of the project as well as possibly
higher fossil fuel prices.
Key words:
Substitute Natural Gas, Surplus Energy, Feasibility, CO2 Capture
7/27/2019 Final Thesis - M.sc Sustainable Energy Science - Vignir Bjarnason
http://slidepdf.com/reader/full/final-thesis-msc-sustainable-energy-science-vignir-bjarnason 4/76
iv
Möguleg nýting umframorku Landsvirkjunar til framleiðslu Metangass - Arðsemismat
ÚtdrátturYfir 80% af þeirri orku sem nýtt er á Íslandi í dag er framleidd með innlendum og
endurnýjanlegum auðlindum. Yfir 70% af orkunni sem framleidd er á Íslandi er frá vatnsafli og
er framleitt af stærstum hluta af Landsvirkjun. Sem stendur fer töluverður hluti af vatnsaflinu til
spillis á þeim tíma árs þegar öll lón eru full og vatn rennur yfir yfirföll stíflna. Í þessari
rannsóknarritgerð er lögð fram tillaga að lausn á þessu. Meginhugmyndin er að nýta þessa orku
sem er umframorka og ótryggð orka til þess að framleiða metan gas. Til þess að framleiða
metan gasið er notaður svokallaður „Sabatier Reaction Process“. Sá búnaður sem miðað er við í
þessari rannsókn er frá SolarFuel GmbH í Þýskalandi. Rannsóknin snýr að mestu að því hvaða
þættir þurfa að vera til staðar og hvort að hægt sé að framkvæma þetta á bæði tæknilega og
fjárhagslega hagkvæmann hátt. Til þess að fá hugmynd um hvort það sé einhver stærðar
hagræðing til staðar þá eru sett upp þrjú tilvik sem eru mismunandi að stærð. Niðurstaða
rannsóknarinnar er að þessi framleiðsla er tæknilega framkvæmanleg en í besta falli tæplega
fjárhagslega hagkvæm. Hugsanlegar tækniframfarir sem og hugsanlegar hækkanir á olíuverði í
framtíðinni geta haft mikil áhrif á framtíðarmöguleika þessa verkefnis.
Lykilorð:
Substitute Natural Gas, Surplus Energy, Feasibility, CO2 Capture
7/27/2019 Final Thesis - M.sc Sustainable Energy Science - Vignir Bjarnason
http://slidepdf.com/reader/full/final-thesis-msc-sustainable-energy-science-vignir-bjarnason 5/76
v
Feasibility study of utilizing surplus energy from Landsvirkjun for
the production of Substitute Natural Gas
by
Vignir Bjarnason
Thesis submitted to the School of Science and Engineeringat Reykjavík University in partial fulfillment
of the requirements for the degree of Master of Science in Sustainable Energy
January 2013
Student:
___________________________________________
Vignir Bjarnason
Supervisor:
___________________________________________
Páll Jensson
Examiner:
___________________________________________
Teitur Gunnarsson
7/27/2019 Final Thesis - M.sc Sustainable Energy Science - Vignir Bjarnason
http://slidepdf.com/reader/full/final-thesis-msc-sustainable-energy-science-vignir-bjarnason 6/76
vi
AcknowledgementsThe success of any project depends largely on the encouragement and guidelines of others. I
take this opportunity to express my gratitude to the people who have been instrumental in the
successful completion of this project. I would like to express my greatest appreciation to Prof.
Páll Jensson, without his encouragement and guidance this project would not have
materialized.
The opportunity to work with Landsvirkjun on this project is greatly appreciated and I owe that
to Árni Benediktsson, Head Engineer at Landsvirkjun. Without his help this project would not
have been reality.
The guidance and support received from all the professionals and companies which contributed
information and help to me during writing, was vital for the success of the project. I am grateful
for their constant support and help.
I would like to express my greatest appreciation to family and friends who have helped and
supported me throughout this project.
7/27/2019 Final Thesis - M.sc Sustainable Energy Science - Vignir Bjarnason
http://slidepdf.com/reader/full/final-thesis-msc-sustainable-energy-science-vignir-bjarnason 7/76
vii
Table of ContentsAbstract.......................................................................................................................................iii
Útdráttur.....................................................................................................................................iv
Acknowledgements.....................................................................................................................vi
List of Figures ..............................................................................................................................ix
List of Graphs ...............................................................................................................................x
List of Tables ...............................................................................................................................xi
List of Abbreviations ..................................................................................................................xii
1. Introduction............................................................................................................................. 1
1.1. Main research motives..................................................................................................... 1
1.2. Energy storage.................................................................................................................. 5
1.3. Main research questions.................................................................................................. 8
1.4. Thesis structure and approach......................................................................................... 9
2. Literature Review .................................................................................................................. 10
3. Technological Aspects ........................................................................................................... 12
3.1. Possible locations........................................................................................................... 12
3.2. Energy............................................................................................................................. 14
3.3. CO2 capture technology ................................................................................................. 16
3.3.1. CO2 Capture using Econamine FG plus...............................................................................16
3.3.2. CO2 Source Characteristics..................................................................................................18
3.4. Synthesis technology...................................................................................................... 19
3.4.1. Electrolysis ..........................................................................................................................20
3.4.2. Methanation .......................................................................................................................20
3.4.3. Basic Concept of SNG Production .......................................................................................21
3.4.4. Efficiency .............................................................................................................................23
3.4.5. Gas Conversion ...................................................................................................................24
3.5. Transportation and storage methods ............................................................................ 25
4. Proposed Plant/s ................................................................................................................... 26
4.1. Annual Running Time..................................................................................................... 27
4.1.1. Category 2 Available Running Time ....................................................................................27
7/27/2019 Final Thesis - M.sc Sustainable Energy Science - Vignir Bjarnason
http://slidepdf.com/reader/full/final-thesis-msc-sustainable-energy-science-vignir-bjarnason 8/76
viii
4.1.2. Category 3 Available Running Time ....................................................................................27
4.2. Production Information for Each Scenario..................................................................... 28
5. Financial Aspects ................................................................................................................... 30
5.1. Costs............................................................................................................................... 30
5.1.1. Building ...............................................................................................................................30
5.1.2. Power Lines and Flue Gas Piping.........................................................................................31
5.1.3. CO2 Capture Equipment......................................................................................................32
5.1.4. SolarFuel Methanation Equipment.....................................................................................34
5.1.5. Price of Energy ....................................................................................................................35
5.2. Revenue.......................................................................................................................... 36
5.2.1. SNG......................................................................................................................................36
5.2.2. O2.........................................................................................................................................37
5.2.3. CO2 ......................................................................................................................................38
5.2.4. Waste Heat..........................................................................................................................38
6. Profitability Model................................................................................................................. 39
6.1. Assumptions ................................................................................................................... 39
6.1.1. Cost Calculations – Three Point Method ............................................................................40
6.2. Scenario 1: 5 MW SNG plant – Cat 2 Energy.................................................................. 40
6.2.1. Results – Scenario 1 ............................................................................................................41
6.3. Scenario 2: 20 MW SNG Plant – Cat 2 Energy................................................................ 42
6.3.1. Results – Scenario 2 ............................................................................................................44
6.4. Scenario 3: 40 MW SNG Plant – Cat 2 Energy................................................................ 45
6.4.1. Results – Scenario 3 ............................................................................................................48
6.5. Scenario 4, 5 And 6 – Using Cat 3 Energy....................................................................... 49
7. Sensitivity Analysis................................................................................................................. 50
8. Discussion .............................................................................................................................. 519. Conclusion ............................................................................................................................. 53
Bibliography .................................................................................................................................. 55
Appendix ....................................................................................................................................... 57
7/27/2019 Final Thesis - M.sc Sustainable Energy Science - Vignir Bjarnason
http://slidepdf.com/reader/full/final-thesis-msc-sustainable-energy-science-vignir-bjarnason 9/76
ix
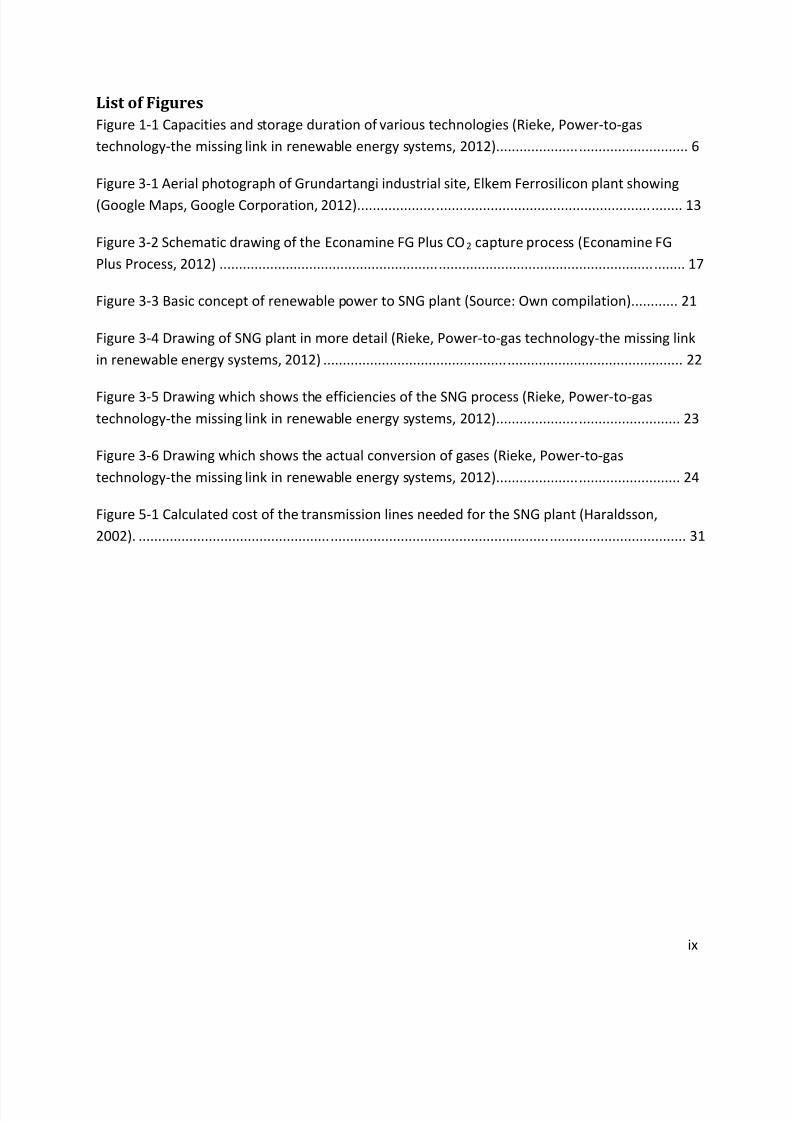
List of FiguresFigure 1-1 Capacities and storage duration of various technologies (Rieke, Power-to-gas
technology-the missing link in renewable energy systems, 2012)................................................. 6
Figure 3-1 Aerial photograph of Grundartangi industrial site, Elkem Ferrosilicon plant showing
(Google Maps, Google Corporation, 2012)................................................................................... 13
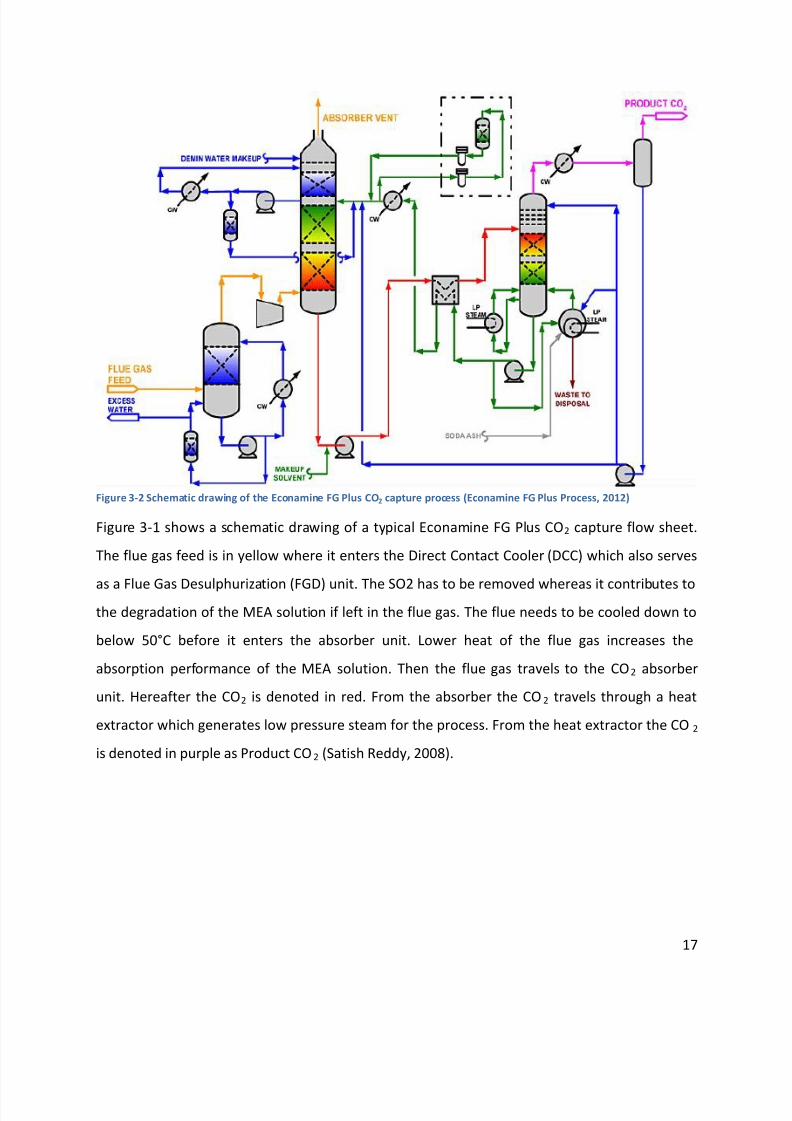
Figure 3-2 Schematic drawing of the Econamine FG Plus CO2 capture process (Econamine FG
Plus Process, 2012) ....................................................................................................................... 17
Figure 3-3 Basic concept of renewable power to SNG plant (Source: Own compilation)............ 21
Figure 3-4 Drawing of SNG plant in more detail (Rieke, Power-to-gas technology-the missing link
in renewable energy systems, 2012) ............................................................................................ 22
Figure 3-5 Drawing which shows the efficiencies of the SNG process (Rieke, Power-to-gastechnology-the missing link in renewable energy systems, 2012)............................................... 23
Figure 3-6 Drawing which shows the actual conversion of gases (Rieke, Power-to-gas
technology-the missing link in renewable energy systems, 2012)............................................... 24
Figure 5-1 Calculated cost of the transmission lines needed for the SNG plant (Haraldsson,
2002). ............................................................................................................................................ 31
7/27/2019 Final Thesis - M.sc Sustainable Energy Science - Vignir Bjarnason
http://slidepdf.com/reader/full/final-thesis-msc-sustainable-energy-science-vignir-bjarnason 10/76
x
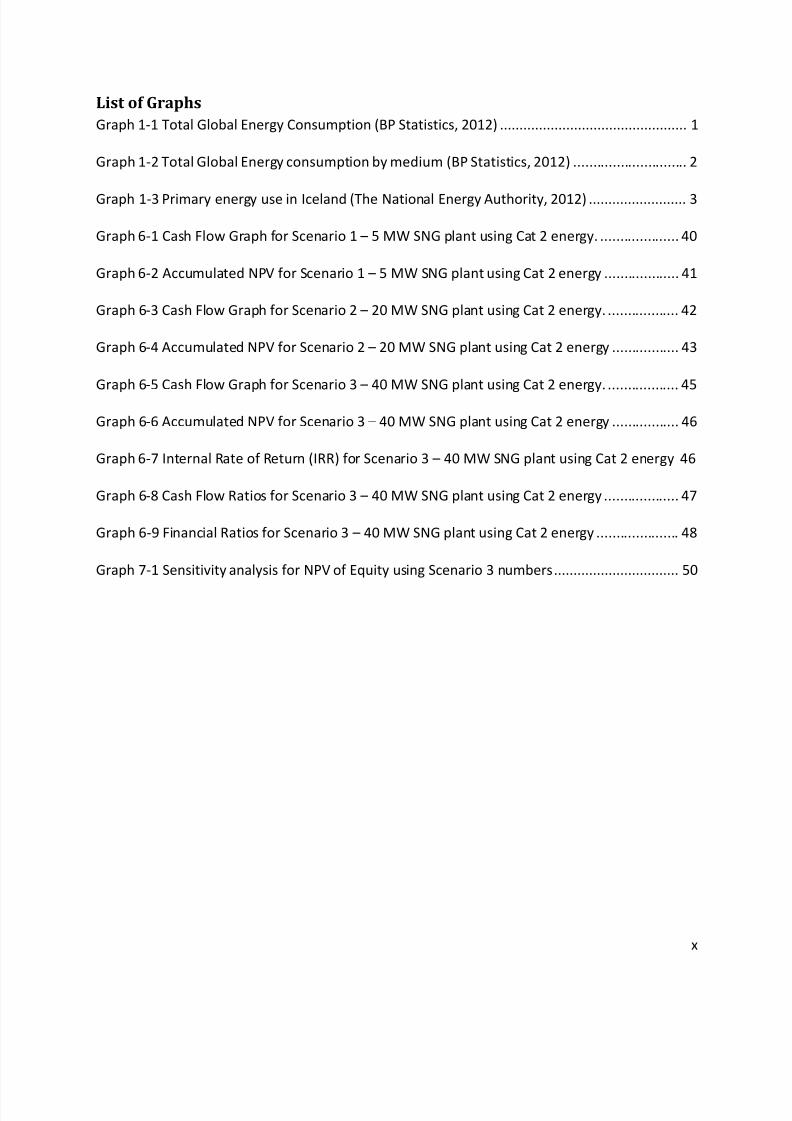
List of GraphsGraph 1-1 Total Global Energy Consumption (BP Statistics, 2012) ................................................ 1
Graph 1-2 Total Global Energy consumption by medium (BP Statistics, 2012) ............................. 2
Graph 1-3 Primary energy use in Iceland (The National Energy Authority, 2012) ......................... 3
Graph 6-1 Cash Flow Graph for Scenario 1 – 5 MW SNG plant using Cat 2 energy. .................... 40
Graph 6-2 Accumulated NPV for Scenario 1 – 5 MW SNG plant using Cat 2 energy ................... 41
Graph 6-3 Cash Flow Graph for Scenario 2 – 20 MW SNG plant using Cat 2 energy. .................. 42
Graph 6-4 Accumulated NPV for Scenario 2 – 20 MW SNG plant using Cat 2 energy ................. 43
Graph 6-5 Cash Flow Graph for Scenario 3 – 40 MW SNG plant using Cat 2 energy. .................. 45
Graph 6-6 Accumulated NPV for Scenario 3 – 40 MW SNG plant using Cat 2 energy ................. 46
Graph 6-7 Internal Rate of Return (IRR) for Scenario 3 – 40 MW SNG plant using Cat 2 energy 46
Graph 6-8 Cash Flow Ratios for Scenario 3 – 40 MW SNG plant using Cat 2 energy ................... 47
Graph 6-9 Financial Ratios for Scenario 3 – 40 MW SNG plant using Cat 2 energy ..................... 48
Graph 7-1 Sensitivity analysis for NPV of Equity using Scenario 3 numbers................................ 50
7/27/2019 Final Thesis - M.sc Sustainable Energy Science - Vignir Bjarnason
http://slidepdf.com/reader/full/final-thesis-msc-sustainable-energy-science-vignir-bjarnason 11/76
xi
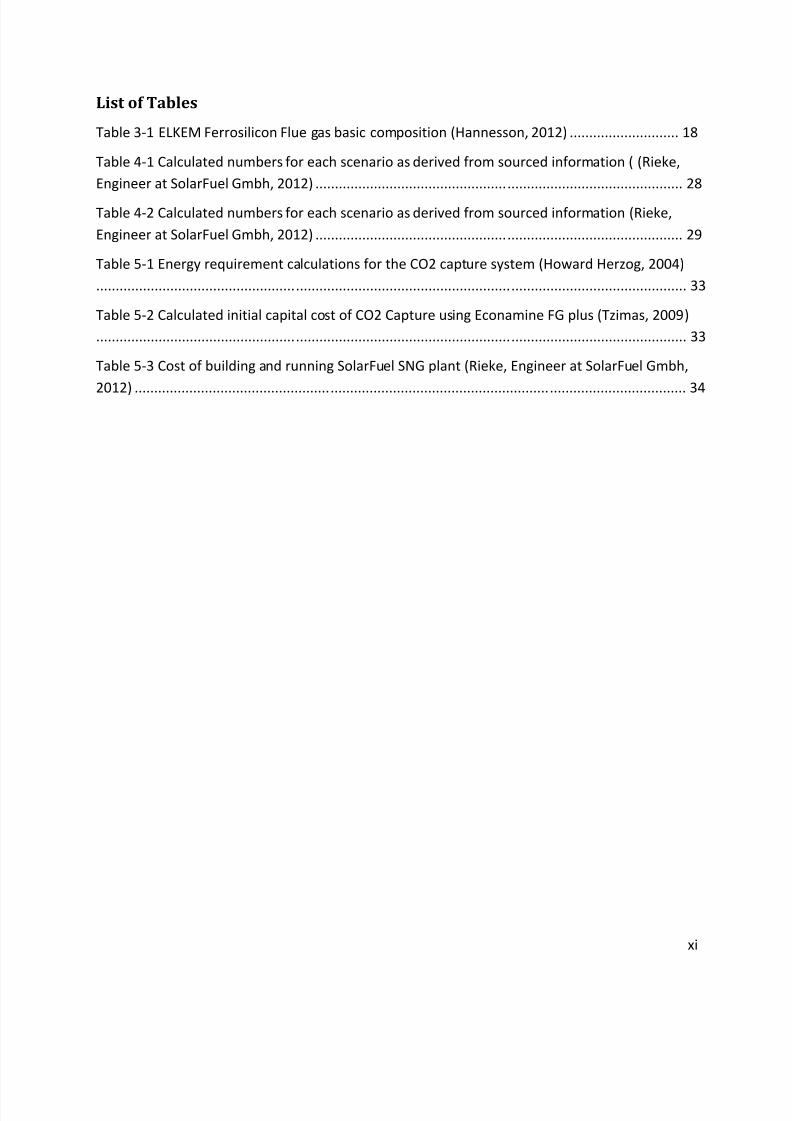
List of Tables
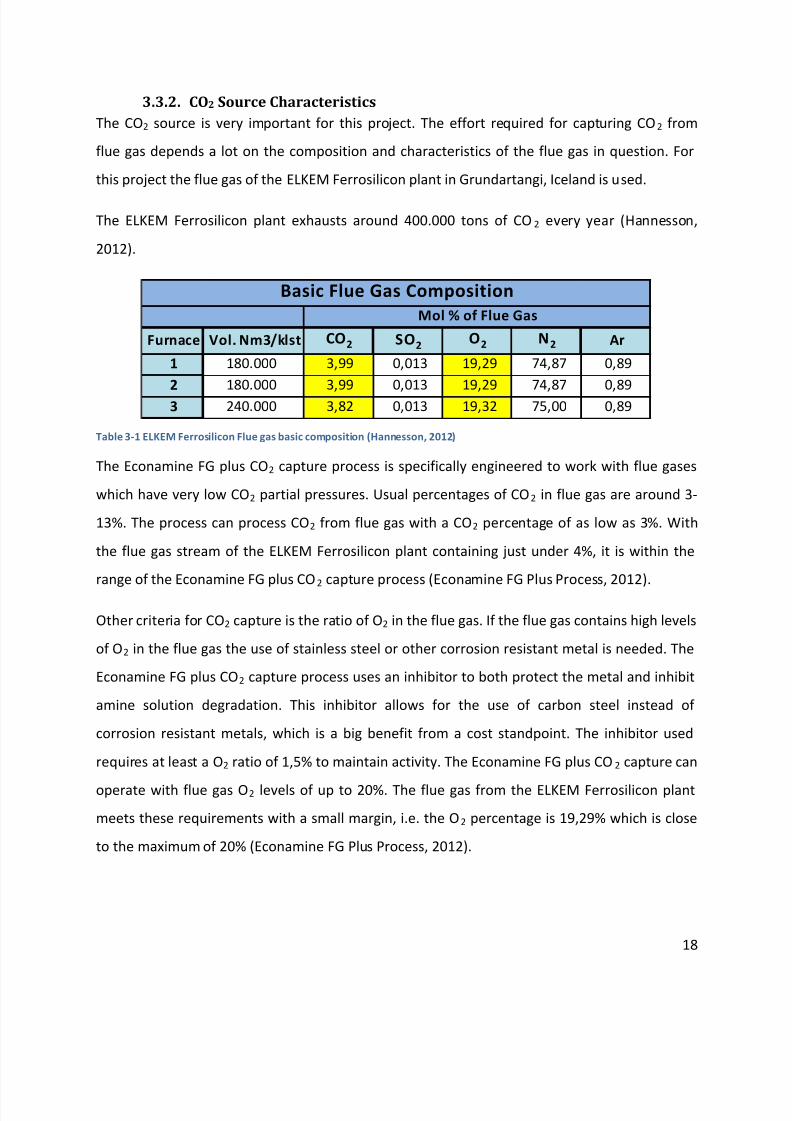
Table 3-1 ELKEM Ferrosilicon Flue gas basic composition (Hannesson, 2012) ............................ 18
Table 4-1 Calculated numbers for each scenario as derived from sourced information ( (Rieke,
Engineer at SolarFuel Gmbh, 2012) .............................................................................................. 28
Table 4-2 Calculated numbers for each scenario as derived from sourced information (Rieke,
Engineer at SolarFuel Gmbh, 2012) .............................................................................................. 29
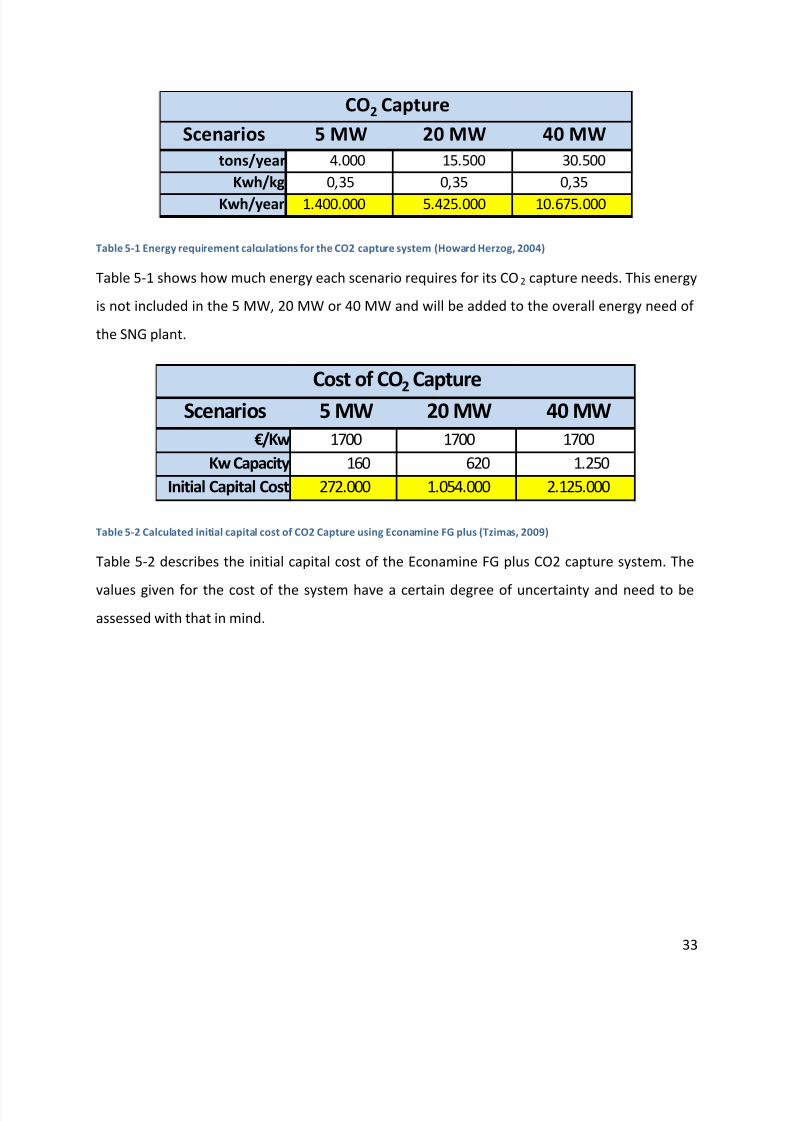
Table 5-1 Energy requirement calculations for the CO2 capture system (Howard Herzog, 2004)
....................................................................................................................................................... 33
Table 5-2 Calculated initial capital cost of CO2 Capture using Econamine FG plus (Tzimas, 2009)
....................................................................................................................................................... 33
Table 5-3 Cost of building and running SolarFuel SNG plant (Rieke, Engineer at SolarFuel Gmbh,
2012) ............................................................................................................................................. 34
7/27/2019 Final Thesis - M.sc Sustainable Energy Science - Vignir Bjarnason
http://slidepdf.com/reader/full/final-thesis-msc-sustainable-energy-science-vignir-bjarnason 12/76
xii
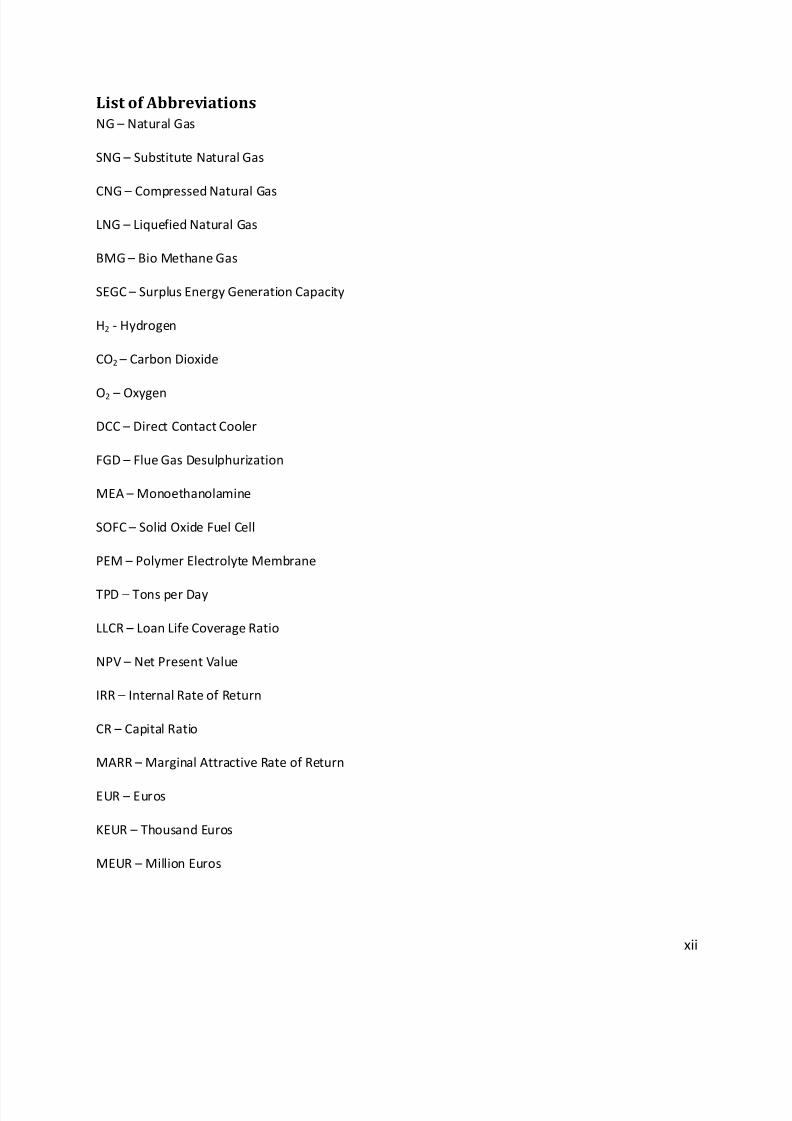
List of AbbreviationsNG – Natural Gas
SNG – Substitute Natural Gas
CNG – Compressed Natural Gas
LNG – Liquefied Natural Gas
BMG – Bio Methane Gas
SEGC – Surplus Energy Generation Capacity
H2 - Hydrogen
CO2 – Carbon Dioxide
O2 – Oxygen
DCC – Direct Contact Cooler
FGD – Flue Gas Desulphurization
MEA – Monoethanolamine
SOFC – Solid Oxide Fuel Cell
PEM – Polymer Electrolyte Membrane
TPD – Tons per Day
LLCR – Loan Life Coverage Ratio
NPV – Net Present Value
IRR – Internal Rate of Return
CR – Capital Ratio
MARR – Marginal Attractive Rate of Return
EUR – Euros
KEUR – Thousand Euros
MEUR – Million Euros
7/27/2019 Final Thesis - M.sc Sustainable Energy Science - Vignir Bjarnason
http://slidepdf.com/reader/full/final-thesis-msc-sustainable-energy-science-vignir-bjarnason 13/76
1
1. Introduction
1.1.Main research motives
Most aspects of the modern lifestyle have some connection to energy. Whether it entailstravelling to and from work, cooking lunch or vacuuming the living room floor, people use
energy in one form or another for most things. This reality creates a huge demand for energy of
all types. The demand for energy can have many aspects ranging from using electricity for space
heating to using fuel to transport goods. Global energy consumption has been on the rise for
decades and does not seem to be diminishing. This trend is clearly visible when the global
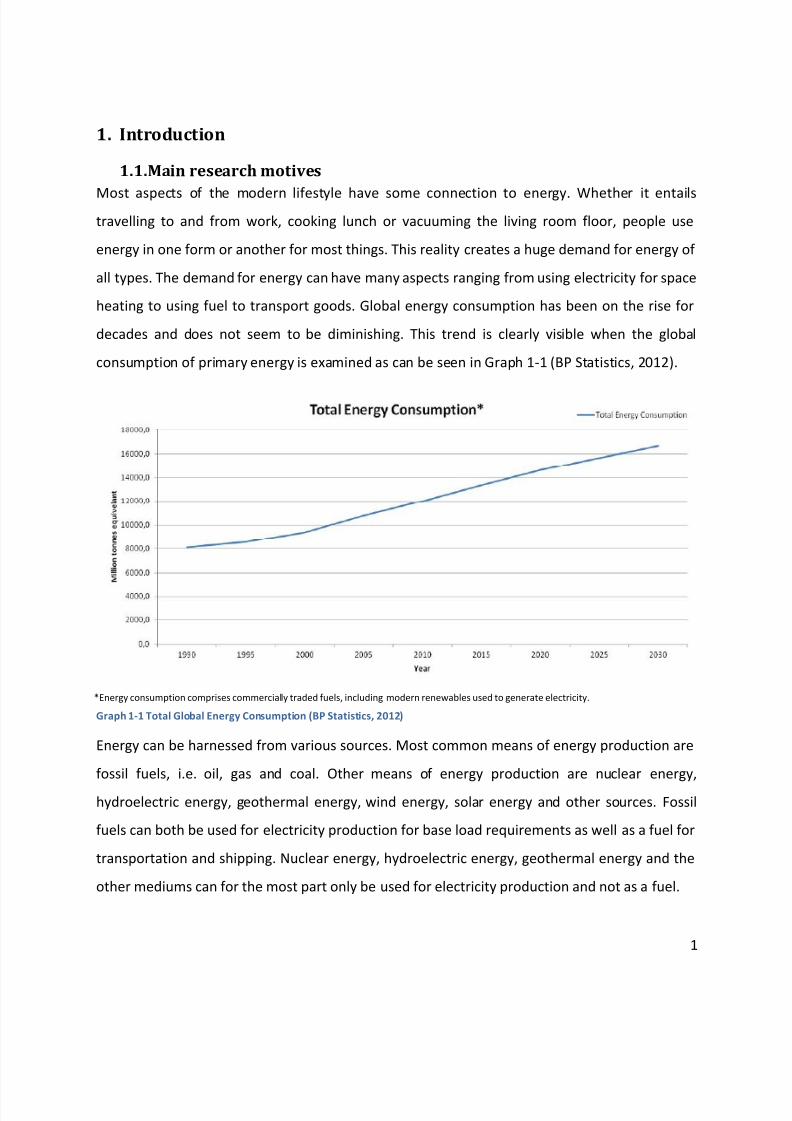
consumption of primary energy is examined as can be seen in Graph 1-1 (BP Statistics, 2012).
Graph 1-1 Total Global Energy Consumption (BP Statistics, 2012)
Energy can be harnessed from various sources. Most common means of energy production are
fossil fuels, i.e. oil, gas and coal. Other means of energy production are nuclear energy,
hydroelectric energy, geothermal energy, wind energy, solar energy and other sources. Fossil
fuels can both be used for electricity production for base load requirements as well as a fuel for
transportation and shipping. Nuclear energy, hydroelectric energy, geothermal energy and the
other mediums can for the most part only be used for electricity production and not as a fuel.
*Energy consumption comprises commercially traded fuels, including modern renewables used to generate electricity.
7/27/2019 Final Thesis - M.sc Sustainable Energy Science - Vignir Bjarnason
http://slidepdf.com/reader/full/final-thesis-msc-sustainable-energy-science-vignir-bjarnason 14/76
2
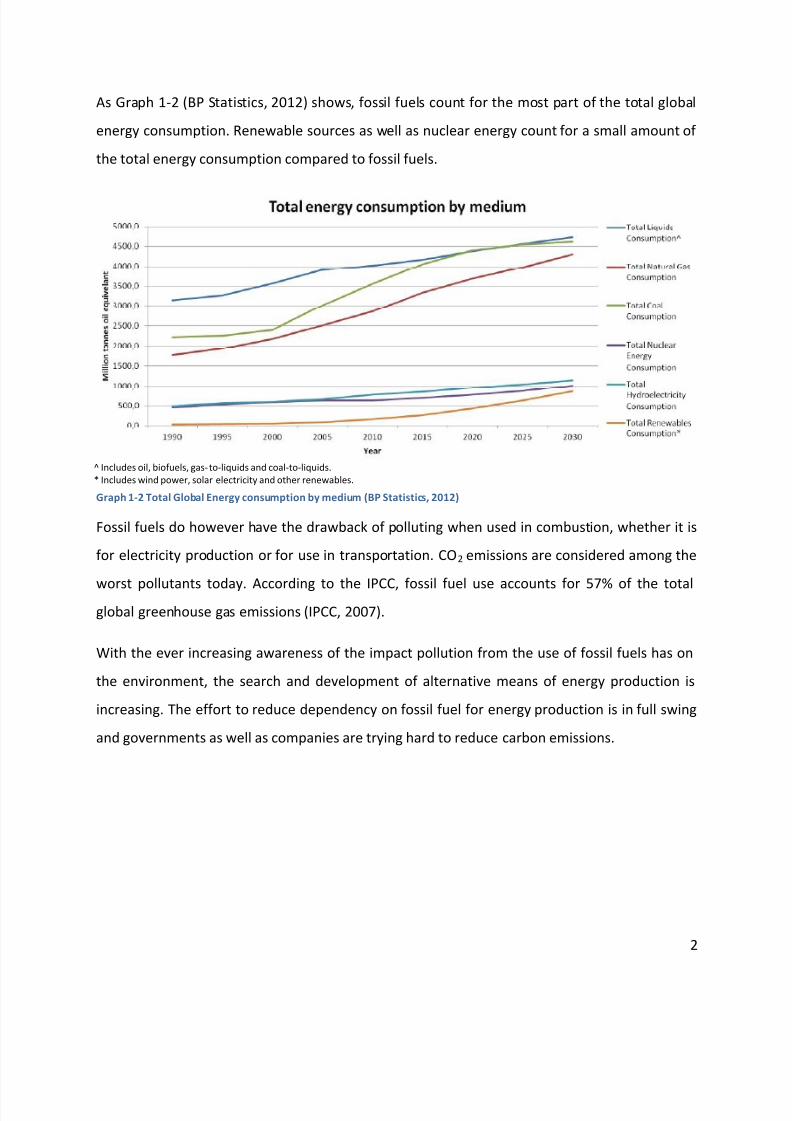
As Graph 1-2 (BP Statistics, 2012) shows, fossil fuels count for the most part of the total global
energy consumption. Renewable sources as well as nuclear energy count for a small amount of
the total energy consumption compared to fossil fuels.
Graph 1-2 Total Global Energy consumption by medium (BP Statistics, 2012)
Fossil fuels do however have the drawback of polluting when used in combustion, whether it is
for electricity production or for use in transportation. CO2 emissions are considered among the
worst pollutants today. According to the IPCC, fossil fuel use accounts for 57% of the totalglobal greenhouse gas emissions (IPCC, 2007).
With the ever increasing awareness of the impact pollution from the use of fossil fuels has on
the environment, the search and development of alternative means of energy production is
increasing. The effort to reduce dependency on fossil fuel for energy production is in full swing
and governments as well as companies are trying hard to reduce carbon emissions.
^ Includes oil, biofuels, gas-to-liquids and coal-to-liquids.* Includes wind power, solar electricity and other renewables.
7/27/2019 Final Thesis - M.sc Sustainable Energy Science - Vignir Bjarnason
http://slidepdf.com/reader/full/final-thesis-msc-sustainable-energy-science-vignir-bjarnason 15/76
3
Iceland is one of the countries that can be considered fortunate in this respect whereas most of
its domestic energy is produced from renewable sources such as hydroelectric sources and
geothermal sources (The National Energy Authority, 2012). The country is rich in possible
sources for both hydroelectricity and geothermal energy. As mentioned above Iceland gets 80%
of its primary energy supply from renewable sources. The remaining 20% is from imported
fossil fuels, which are mostly used in the transportation and fisheries sectors. Iceland is
completely dependent on other nations for its supply of fossil fuels. There is no domestic
production of fossil fuels in Iceland. This means that the country has to import all of its fuel for
transportation and industries from abroad at great cost (European Commission, 2011).
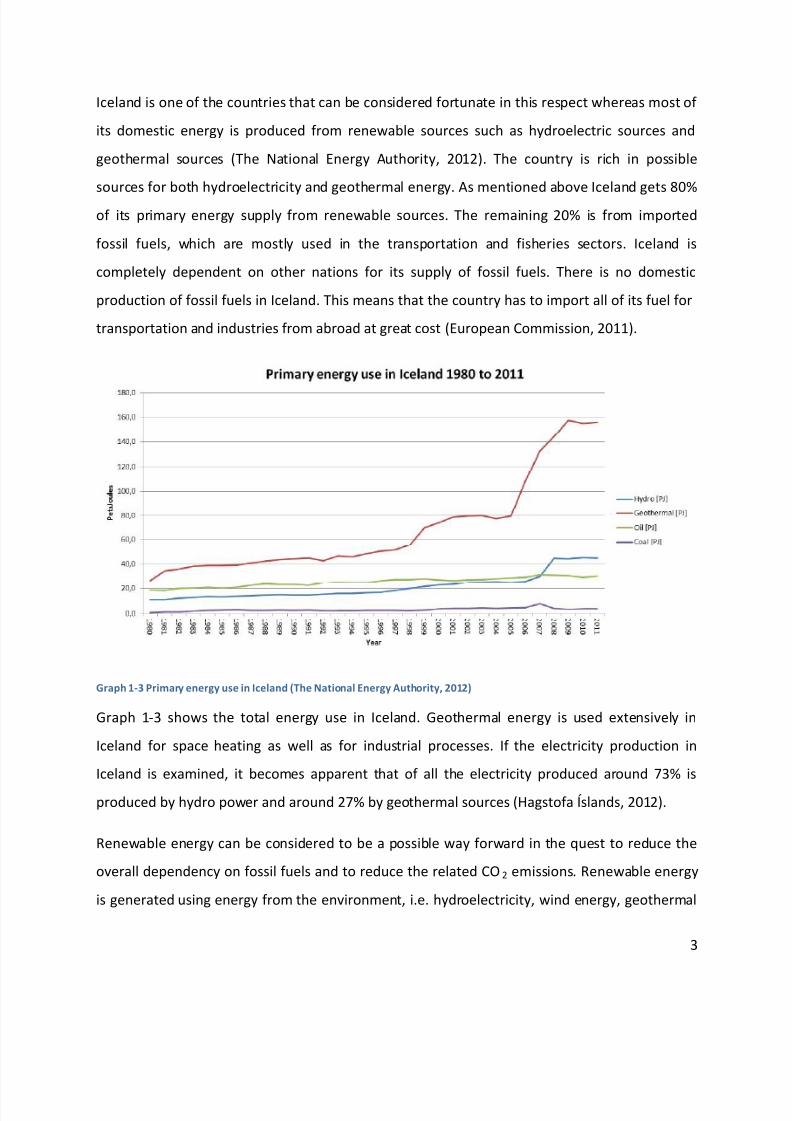
Graph 1-3 Primary energy use in Iceland (The National Energy Authority, 2012)
Graph 1-3 shows the total energy use in Iceland. Geothermal energy is used extensively in
Iceland for space heating as well as for industrial processes. If the electricity production in
Iceland is examined, it becomes apparent that of all the electricity produced around 73% is
produced by hydro power and around 27% by geothermal sources (Hagstofa Íslands, 2012).
Renewable energy can be considered to be a possible way forward in the quest to reduce the
overall dependency on fossil fuels and to reduce the related CO2 emissions. Renewable energy
is generated using energy from the environment, i.e. hydroelectricity, wind energy, geothermal
7/27/2019 Final Thesis - M.sc Sustainable Energy Science - Vignir Bjarnason
http://slidepdf.com/reader/full/final-thesis-msc-sustainable-energy-science-vignir-bjarnason 16/76
4
energy, wave energy or other similar means. Not all countries possess natural resources that
can be harnessed for renewable energy.
Renewable energy sources battle a few flaws, among which are the security of supply. Security
of supply is one of the most important aspects of energy generation, i.e. to be able to predict
how much energy can be produced in the future is essential for any energy producer that
intends to plan ahead. Solar power and wind power are very unstable by nature, wind is
sometimes high and sometimes low, and sunshine isn’t always readily available especially in a
country like Iceland.
The steady nature of hydroelectric energy and geothermal energy has made the two the
favorite form for electricity production in Iceland. The demand for energy is also quite flexible
and can be high at certain times as well as it can be low at other times. Hydroelectric energy
generation is considered quick to respond to changes in demand and it is possible to vary
energy production in line with demand. It is however not possible to store endless amounts of
water. If energy production is slowed down, water builds up to the point where the water starts
to flow into the spillways of the dams, this inevitably leads to energy being wasted.
There is also a tendency to build power plants bigger than absolutely necessary in order to cope
with years where there is a shortage of water. This creates a surplus energy generation capacity
(SEGC) in the years with plenty of water. This surplus energy production capacity is in essence
wasted energy, i.e. when the reservoirs fill up, the water flows over the spillways without
producing any work.
7/27/2019 Final Thesis - M.sc Sustainable Energy Science - Vignir Bjarnason
http://slidepdf.com/reader/full/final-thesis-msc-sustainable-energy-science-vignir-bjarnason 17/76
5
1.2.Energy storageThe SEGC brings up the topic of energy storage, because the surplus capacity could be put to
use if the energy could by stored somehow. There are several methods of storing energy. These
methods include:
Thermal energy storage refers to the method of storing heat directly in solids or fluids.
This method is ideally suited for applications such as space heating, where low quality,
low temperature energy is needed (Ter-Gazarian, 2011).
Flywheel storage refers to the method of storing energy in the form of mechanical kinetic
energy in flywheels. This method has the drawback of only being able to release energy
for a comparatively short time period (Ter-Gazarian, 2011).
Pumped hydro storage refers to the method of pumping water into reservoirs during low
load hours of the day and utilizing the pumped water for energy generation during high
load hours. Pumped storage requires a reservoir and access to plenty of water. Since
pumped hydro requires such specific geographical conditions it can be difficult to realize.
Compressed air storage refers to a method developed by Stal Laval in 1949, which uses
underground caverns as pressure vessels for compressed air. The air is then routed under
high pressure trough a generator to produce energy (Ter-Gazarian, 2011).
Hydrogen and other synthetic fuels refers to the energy storage method of using energy
to power a chemical process that produces a synthetic fuel that can be stored and later
be used for combustion or other means of energy generation (Ter-Gazarian, 2011).
Capacitor bank storage refers to the method of storing energy in the form of an
electrostatic field (Ter-Gazarian, 2011).
Electrochemical energy storage refers to the method of storing energy in primary
batteries, secondary batteries and fuel cells. Here the energy is stored as chemical energy
and later converted to electrical energy (Ter-Gazarian, 2011).
7/27/2019 Final Thesis - M.sc Sustainable Energy Science - Vignir Bjarnason
http://slidepdf.com/reader/full/final-thesis-msc-sustainable-energy-science-vignir-bjarnason 18/76
6
Superconducting magnetic energy storage refers to the experimental method of storing
significant quantities of energy in magnetic fields (Ter-Gazarian, 2011).
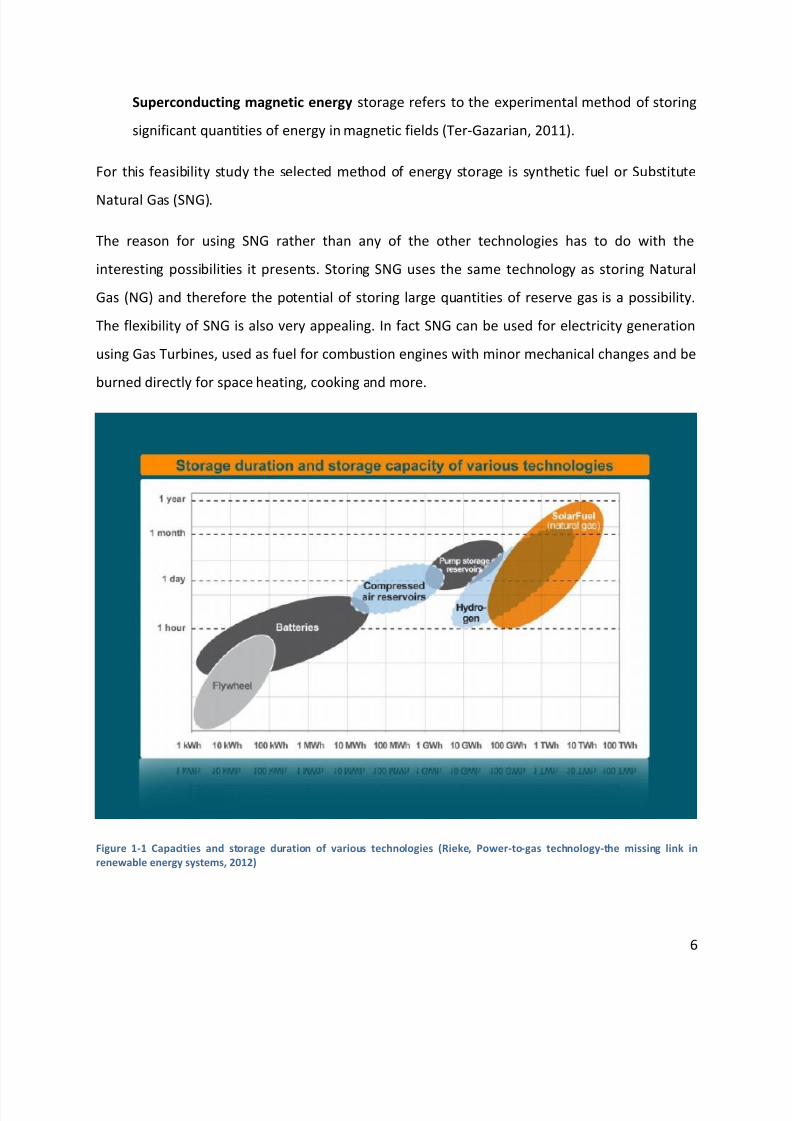
For this feasibility study the selected method of energy storage is synthetic fuel or Substitute
Natural Gas (SNG).
The reason for using SNG rather than any of the other technologies has to do with the
interesting possibilities it presents. Storing SNG uses the same technology as storing Natural
Gas (NG) and therefore the potential of storing large quantities of reserve gas is a possibility.
The flexibility of SNG is also very appealing. In fact SNG can be used for electricity generation
using Gas Turbines, used as fuel for combustion engines with minor mechanical changes and be
burned directly for space heating, cooking and more.
Figure 1-1 Capacities and storage duration of various technologies (Rieke, Power-to-gas technology-the missing link in
renewable energy systems, 2012)
7/27/2019 Final Thesis - M.sc Sustainable Energy Science - Vignir Bjarnason
http://slidepdf.com/reader/full/final-thesis-msc-sustainable-energy-science-vignir-bjarnason 19/76
7
As can be seen from Figure 1-1 the potential of SNG is great. The possibility of storing large
quantities opens up the option of having large reserves of gas to be used at a later date.
The fact that SNG can be used as a fuel for transportation with only minor changes to the
vehicles engines is a huge benefit (M. Mozaffarin, 2004). As stated before, Iceland is completely
dependent on fossil fuel imports to serve its needs. A domestic production of SNG opens up the
possibility of supplying the demand for fossil fuel in Iceland partially or fully with SNG. In all
aspects this would be a great benefit for Iceland. It would reduce Iceland’s dependency on
foreign fossil fuel imports as well as generate revenue inside the country’s economy instead of
having capital flowing out of the economy.
7/27/2019 Final Thesis - M.sc Sustainable Energy Science - Vignir Bjarnason
http://slidepdf.com/reader/full/final-thesis-msc-sustainable-energy-science-vignir-bjarnason 20/76
8
1.3.Main research questionsThe Surplus Energy Generation Capacity (SEGC) in Iceland is the spark that ultimately led to this
project. The question is: Is it possible to have a production cycle that utilizes the SEGC to
produce fuel, so that it can be shut off in the dry periods or high demand periods where all the
water is needed for the already existing customers?
The technology used in the proposed solution is a production cycle which utilizes the SEGC for
the production of Substitute Natural Gas (SNG) or Methane gas. This cycle is also known as the
Sabatier reaction process.
The possibility of using the SEGC for the production of alternative fuel instead of electricity to
the grid is intriguing. This could change Iceland’s dependency on fossil fuel imports as well as
making the country partly self-sufficient with regards to fuel for its transportation and fisheries
sectors.
So the main research questions are:
Is the proposed solution economically feasible?
How much SNG could theoretically be produced using the proposed solution?
How might the domestic production of SNG impact Iceland’s dependency on fossil fuel
imports?
The answers to these questions might help predict the future of SNG production in Iceland, i.e.
if it could serve as a viable alternative fuel.
7/27/2019 Final Thesis - M.sc Sustainable Energy Science - Vignir Bjarnason
http://slidepdf.com/reader/full/final-thesis-msc-sustainable-energy-science-vignir-bjarnason 21/76
9
1.4.Thesis structure and approachThe first chapter serves as the introduction into the inspiration behind the project as well as a
broad description of the project itself and the main research questions.
In the second chapter the main sources of literature used as a basis for this thesis are reviewed.The significance of each source will be stated and how it affects the topic of the thesis.
In chapter 3 the technological aspects of the projects are explored. The technology used for the
generation of the SNG is explained as well as a careful rundown of all the systems used in the
process from electricity to SNG. There will also be a mention of the possible uses of SNG as well
as storage, distribution, etc... The possible sources of CO2 will also be discussed.
In chapter 4 the proposed plant/s will be discussed. The three different scenarios (5MW, 20MWand 40MW) will be laid out and explained before using the information as a basis for the
financial assessment.
In chapter 5 the financial aspects of the project will be explored. Where the revenue is to come
from etc… The possibility to exploit some of the carbon capture schemes such as Cap n Trade,
European Union Emission Trading Scheme (ETS) and more will be examined.
In chapter 6 the information that has been gathered will be used to build a profitabilityassessment which will then establish whether the project can be considered feasible or not. All
assumptions will be stated clearly and the methodology explained. The results of the
assessment will be explained.
In chapter 7 the risk analysis of the project will be performed. This is done to see how the
projects financials will react to different scenarios of revenue and cost. This helps to determine
if the project is in fact a safe option for investment.
In chapter 8 the main results of the project will be summarized and discussed. The possible
impact of the project will also be a topic along with a discussion on the significance of the
project.
In chapter 9 the conclusions of the paper will be discussed.
7/27/2019 Final Thesis - M.sc Sustainable Energy Science - Vignir Bjarnason
http://slidepdf.com/reader/full/final-thesis-msc-sustainable-energy-science-vignir-bjarnason 22/76
10
2. Literature ReviewThe main sources of literature that were used in the process of this project will be addressed
and explained here.
Storing Renewable Energy in the Natural Gas Grid – Methane via Power-to-Gas (P2G): A
Renewable Fuel for Mobility
M. Specht, U. Zuberbuhler, F. Baumgart, B. Feigl, V. Frick, B Sturmer, M. Sterner, G. Waldstein
Centre for Solar Energy and Hydrogen Research (ZSW), Fraunhofer Institute for Wind Energy
and Energy System Technology (IWES), SolarFuel GmbH
This report talks about the possibility of producing SNG, using wind and solar power, for storage
in the German gas grid. It is one of the papers which sparked interest in this topic and
ultimately led to the topic selection of this thesis project.
Hybrid PV-Wind-Renewable Power Methane Plants – An Economic Outlook
Ch. Breyer, S. Rieke, M. Sterner, J. Schmid
Reiner Lemoine Institute, Kassel University, Q-Sells SE, SolarFuel GmbH, Fraunhofer IWES
This report highlights the economic outlook of the SNG production and sparked interest in the
topic of this thesis project.
Fluor’s Econamine FG PlusSM
Technology for CO2 Capture at Coal-Fired Power Plants
S. Reddy, D. Johnson, J. Gilmartin
Power Plant Air Pollutant Control Symposium, Baltimore
This report provides valuable information about the CO2 capture process used in this thesis
project. The Econamine FG Plus process is a proven process which is used around the world.
7/27/2019 Final Thesis - M.sc Sustainable Energy Science - Vignir Bjarnason
http://slidepdf.com/reader/full/final-thesis-msc-sustainable-energy-science-vignir-bjarnason 23/76
11
Energy Storage for Power Systems, 2nd
Edition
A.G. Ter-Gazarian
The Institution of Technology and Engineering, 2011 London
There are several methods that can be used to store renewable energy. The book points out
available ways of storing energy and the pros and cons of each technology.
The method that was selected is, storing renewable energy as a synthetic fuel. There are even
several synthetic fuels that can be used. Probably the best known method is to use Hydrogen
(H2) as a medium. The decision was made to use the method of storing renewable energy as
methane gas or as Substitute Natural Gas (SNG) for the purposes of this project.
Bioenergy and renewable power methane in integrated 100% renewable energy systems –
Limiting global warming by transforming energy systems
Doctoral Dissertation by Dr. Michael Sterner
2009, Kassel University
The main focus of the doctoral dissertation is the use of SNG (a synthetic fuel) to store the
surplus energy produced by solar power and wind power in Germany. The means of storing the
gas is the Natural Gas (NG) infrastructure of Germany, which has a real storage capacity of 217
TWh (Sterner, 2009). The SNG is to be produced at times of high production capacity with low
demand for energy and then stored in the NG pipelines.
The main topic used from the dissertation is the use of the Sabatier reaction process for the
production of SNG. This part of the dissertation is adapted to suit the proposed solution in this
project. The main difference is that the energy available in Iceland is generated by hydro powerand that there is no infrastructure with regard to NG.
7/27/2019 Final Thesis - M.sc Sustainable Energy Science - Vignir Bjarnason
http://slidepdf.com/reader/full/final-thesis-msc-sustainable-energy-science-vignir-bjarnason 24/76
12
3. Technological AspectsThis chapter discusses the different technological aspects and how these aspects affect the
project and its outcome.
The SNG production requires a few things to run. The SNG production itself uses CO 2 and H2 for
the production of SNG. The CO2 is processed from the flue gas of some industrial process and
the H2 is produced via electrolysis of water. Electricity is used to power these processes. The
requirements of the SNG plant dictate where the plant can be set up, these factors are
discussed here.
3.1.Possible locationsWhen the possible locations for the SNG production plant are being considered, the process
itself has to be assessed. The process requires energy in the form of electricity, plus CO2 and
water for the electrolysis. Other factors such as proximity to the highway system have to be
taken into account as well.
Since CO2 is in many cases a byproduct of industry, industrial sites seem to be a logical place to
start. The most common heavy industry in Iceland is Aluminum smelting and Ferrosilicon
production. These industrial processes produce CO2 in great quantities. Another benefit is that
these processes require large industrial sites that could possibly accommodate the synthesisplant. Logistics at these sites are also easier with close proximity to both the highway system as
well as large harbors for transportation. Both Aluminum smelting and Ferrosilicon production
requires large quantities of electricity which means that the High Voltage grid at these
industrial sites are very good and can be modified to accommodate the SNG production.
The Ferrosilicon plant at Grundartangi is the CO2 source that is going to be used for the
purposes of this project. The CO2 source for the project is a deciding factor in determining
where to place the SNG plant and therefore Grundartangi is the site where the SNG plant will
operate for the purposes of this project.
The benefits of setting up the SNG plant at Grundartangi are obvious. With a large scale
Aluminum smelter and a Ferrosilicon plant already in operation, Grundartangi is already a well-
7/27/2019 Final Thesis - M.sc Sustainable Energy Science - Vignir Bjarnason
http://slidepdf.com/reader/full/final-thesis-msc-sustainable-energy-science-vignir-bjarnason 25/76
13
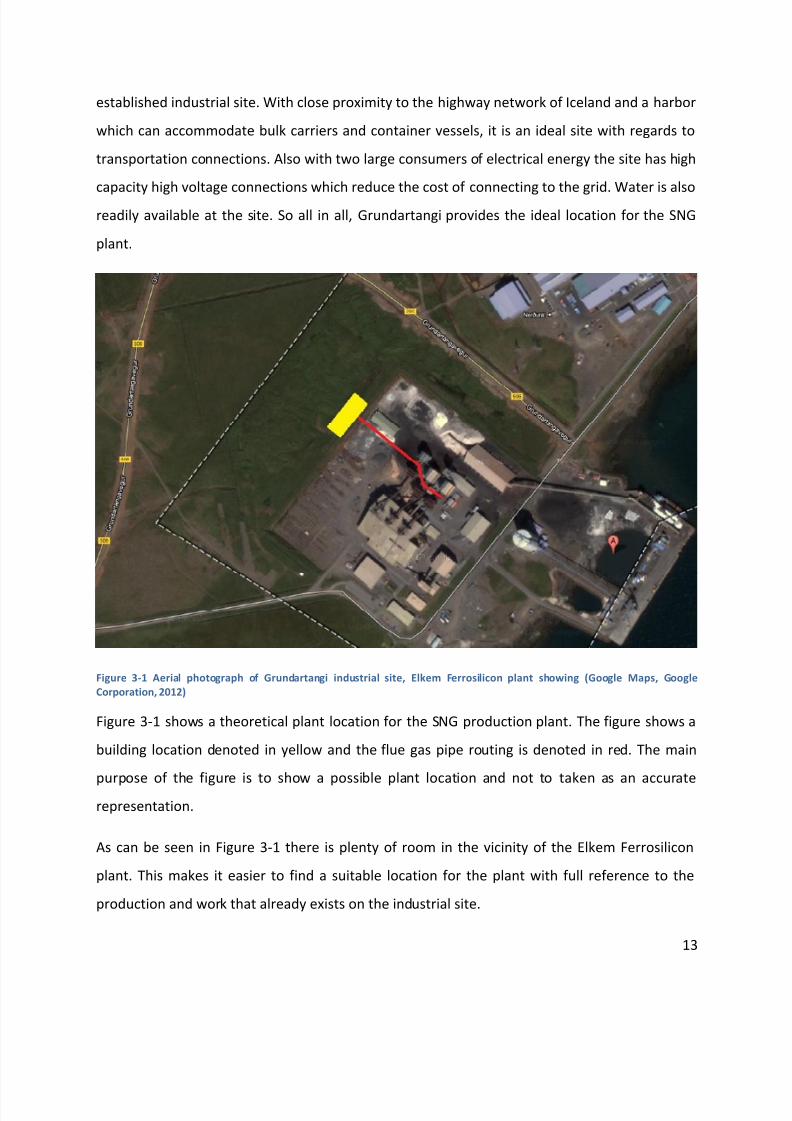
established industrial site. With close proximity to the highway network of Iceland and a harbor
which can accommodate bulk carriers and container vessels, it is an ideal site with regards to
transportation connections. Also with two large consumers of electrical energy the site has high
capacity high voltage connections which reduce the cost of connecting to the grid. Water is also
readily available at the site. So all in all, Grundartangi provides the ideal location for the SNG
plant.
Figure 3-1 Aerial photograph of Grundartangi industrial site, Elkem Ferrosilicon plant showing (Google Maps, Google
Corporation, 2012)
Figure 3-1 shows a theoretical plant location for the SNG production plant. The figure shows a
building location denoted in yellow and the flue gas pipe routing is denoted in red. The main
purpose of the figure is to show a possible plant location and not to taken as an accurate
representation.
As can be seen in Figure 3-1 there is plenty of room in the vicinity of the Elkem Ferrosilicon
plant. This makes it easier to find a suitable location for the plant with full reference to the
production and work that already exists on the industrial site.
7/27/2019 Final Thesis - M.sc Sustainable Energy Science - Vignir Bjarnason
http://slidepdf.com/reader/full/final-thesis-msc-sustainable-energy-science-vignir-bjarnason 26/76
14
3.2.EnergyLandsvirkjun supplies the Ferrosilicon plant at Grundartangi with electricity and therefore grid
connections are readily available.
The main driver behind this research project is to find a use for the off peak and unsecuredenergy which Landsvirkjun has available. The main electricity production of Landsvirkjun is
through hydroelectric installations. These hydroelectric installations are very good at supplying
both base load and peak load energy. The main driver behind the available off peak and
unsecured energy is the different demand. Demand for electricity can vary quite a bit with
regard to time of year and even with regard to time of day.
In the long term, Landsvirkjun assumes that its energy production capacity is fully utilized or to
the point where secure supply is reached. There are periods where the energy production
capacity is not fully utilized, but this surplus is categorized as unsold energy rather than surplus
energy generation capacity which can be had at a lower price (Björnsson, 2012).
The electricity that Landsvirkjun is generating is defined into three categories.
Category 1 – Base load energy – This category is for regular base load energy with
delivery as close to 8760 hours per year as possible. Price and quantity is negotiated with
Landsvirkjun. The quantity available is determined by the quantity of unsold energy
available in the generation system of Landsvirkjun (Björnsson, 2012).
Category 2 – Surplus energy – This category is for surplus energy available in the
generation system. This energy has flexible delivery and Landsvirkjun has the authority to
reduce delivery during dry years to a maximum of 50%. The probability of 100% delivery is
approximately for 50% of years. For approximately 5% of years the possible reduction in
delivery is close to the agreed upon limit of 50%. Readily available energy is close to 70MW (Björnsson, 2012).
7/27/2019 Final Thesis - M.sc Sustainable Energy Science - Vignir Bjarnason
http://slidepdf.com/reader/full/final-thesis-msc-sustainable-energy-science-vignir-bjarnason 27/76
15
Category 3 – Unsecured energy – This category is for the real surplus energy, i.e. this
energy has seasonal availability and there is the possibility of years where there is no
available energy in this category. This might happen in one of every ten years. The
months of the year where this energy is available, are July, August, September and
October. The available quantity is close to 50 MW (Björnsson, 2012).
The energy is as stated above divided into three separate categories. These categories are base
load energy, surplus energy and unsecured energy. The difference between the energy in each
category is availability. The availability also affects the price of the energy as will be discussed in
Chapter 4.
The energy which is the most appealing to use for an SNG plant is the category 2 – surplus
energy. The quantity of energy is around 70 MW and that is quite enough for all the scenarios
proposed for this project. The only issue with the surplus energy would be the security of
supply. As stated above, the availability is 100% delivery for approximately 50% of years. So for
a 10 year period there would be 100% delivery for 5 years, between 100% and 50% for 4-5
years and close to 50% delivery for 0,5-1 year.
The use of the category 3 – unsecured energy will also be explored and as well as the impact of
more downtime vs. the lower energy price.
7/27/2019 Final Thesis - M.sc Sustainable Energy Science - Vignir Bjarnason
http://slidepdf.com/reader/full/final-thesis-msc-sustainable-energy-science-vignir-bjarnason 28/76
16
3.3.CO2 capture technologyThe technology used to capture the CO2 which is one of two gases used for the production of
SNG is very important to the process. Whereas the availability of a source for pure CO2 is very
limited, a chemical process is used to capture CO2 from flue gas.
3.3.1. CO2 Capture using Econamine FG plusThere are a number of methods used for capturing CO2 from various sources. These methods
are Post-combustion capture, Pre-combustion capture, Oxy-fuel combustion and Direct-air
capture. Of these methods, only Post-combustion capture and Direct-air capture can be used in
this project. This is because both Pre-combustion and Oxy-fuel combustion are used to modify
the fuel before combustion or to affect the combustion itself (Sarah M. Forbes, 2008). Since the
CO2
source used in this project is a Ferrosilicon plant using electric arc furnaces, there is no
combustion to modify. Direct-air capture technology has been used in industry for over 70
years, although on a much smaller scale than proposed in this project. The main drawback of
Direct-air capture is its high costs (Manya Ranjan, 2011).
Post-combustion capture refers to a method that removes CO2 from flue gas of industrial
processes. Usually Post-combustion capture systems can be built into existing industrial plants
and power stations without heavy modifications to the original plant. There are several
methods of Post-combustion capture of CO2. The most commonly used method is passing the
flue gas through filters where the CO2 is absorbed into amine based solvents. A change in
temperature or pressure is then used to release the CO2 from the solvent.
The Econamine FG Plus process is one of the premier commercially proven Post-combustion
processes for the recovery of CO2 from flue gases (Dan G. Chapel, 1999). It uses an inhibited 30
wt. % Monoethanolamine (MEA) solution. The features of the process allow the use of carbon
steel instead of stainless steel as well as lower stripper reboiler steam demand, which
translates into more competitive costs. The process can recover 85-90% of the CO2 in flue gas
and produces 99,95%+ pure CO2. The process can be used on SOX containing flue gas after SO2
scrubbing. The additional SO2 scrubbing returns an environmental benefit (Dan G. Chapel,
1999).
7/27/2019 Final Thesis - M.sc Sustainable Energy Science - Vignir Bjarnason
http://slidepdf.com/reader/full/final-thesis-msc-sustainable-energy-science-vignir-bjarnason 29/76
17
Figure 3-2 Schematic drawing of the Econamine FG Plus CO2 capture process (Econamine FG Plus Process, 2012)
Figure 3-1 shows a schematic drawing of a typical Econamine FG Plus CO2 capture flow sheet.
The flue gas feed is in yellow where it enters the Direct Contact Cooler (DCC) which also serves
as a Flue Gas Desulphurization (FGD) unit. The SO2 has to be removed whereas it contributes tothe degradation of the MEA solution if left in the flue gas. The flue needs to be cooled down to
below 50°C before it enters the absorber unit. Lower heat of the flue gas increases the
absorption performance of the MEA solution. Then the flue gas travels to the CO2 absorber
unit. Hereafter the CO2 is denoted in red. From the absorber the CO2 travels through a heat
extractor which generates low pressure steam for the process. From the heat extractor the CO 2
is denoted in purple as Product CO2 (Satish Reddy, 2008).
7/27/2019 Final Thesis - M.sc Sustainable Energy Science - Vignir Bjarnason
http://slidepdf.com/reader/full/final-thesis-msc-sustainable-energy-science-vignir-bjarnason 30/76
18
3.3.2. CO2 Source CharacteristicsThe CO2 source is very important for this project. The effort required for capturing CO2 from
flue gas depends a lot on the composition and characteristics of the flue gas in question. For
this project the flue gas of the ELKEM Ferrosilicon plant in Grundartangi, Iceland is used.
The ELKEM Ferrosilicon plant exhausts around 400.000 tons of CO2 every year (Hannesson,
2012).
Table 3-1 ELKEM Ferrosilicon Flue gas basic composition (Hannesson, 2012)
The Econamine FG plus CO2 capture process is specifically engineered to work with flue gases
which have very low CO2 partial pressures. Usual percentages of CO2 in flue gas are around 3-
13%. The process can process CO2 from flue gas with a CO2 percentage of as low as 3%. With
the flue gas stream of the ELKEM Ferrosilicon plant containing just under 4%, it is within the
range of the Econamine FG plus CO2 capture process (Econamine FG Plus Process, 2012).
Other criteria for CO2 capture is the ratio of O2 in the flue gas. If the flue gas contains high levels
of O2 in the flue gas the use of stainless steel or other corrosion resistant metal is needed. The
Econamine FG plus CO2 capture process uses an inhibitor to both protect the metal and inhibit
amine solution degradation. This inhibitor allows for the use of carbon steel instead of
corrosion resistant metals, which is a big benefit from a cost standpoint. The inhibitor used
requires at least a O2 ratio of 1,5% to maintain activity. The Econamine FG plus CO2 capture can
operate with flue gas O2 levels of up to 20%. The flue gas from the ELKEM Ferrosilicon plant
meets these requirements with a small margin, i.e. the O2 percentage is 19,29% which is close
to the maximum of 20% (Econamine FG Plus Process, 2012).
Furnace Vol. Nm3/klst CO2 SO2O2 N2 Ar
1 180.000 3,99 0,013 19,29 74,87 0,89
2 180.000 3,99 0,013 19,29 74,87 0,89
3 240.000 3,82 0,013 19,32 75,00 0,89
Mol % of Flue Gas
Basic Flue Gas Composition
7/27/2019 Final Thesis - M.sc Sustainable Energy Science - Vignir Bjarnason
http://slidepdf.com/reader/full/final-thesis-msc-sustainable-energy-science-vignir-bjarnason 31/76
19
3.4.Synthesis technologyThe proposed plant solution is to use the Sabatier reaction process for the purpose of
methanation. This production of SNG via the Sabatier reaction has three core processes. The
first core process is the electrolysis, which converts hydroelectricity and water into O2 and H2.
The second core process is a source of CO2, which can be had from various industrial and
natural sources. The third core process is the Sabatier reaction process, this is where the H2 and
CO2 are converted to SNG with water as a byproduct (Ch. Breyer, 2011).
The source for the information on the SNG production plant is SolarFuel GmbH in Germany.
SolarFuel, in collaboration with German research institutes, has successfully developed
technology which enables the conversion of electricity into SNG. This in turn allows SNG to be
stored. SolarFuel has already built and is successfully operating an alpha plant which uses 25kW with an overall power-to-gas efficiency of 40% (Ali-Oettinger, 2012). The power-to-gas
efficiency of larger SNG plants is going to be in the range of 60-63% not utilizing waste heat.
When utilizing waste heat the plant efficiency could reach 80% (Rieke, Power-to-gas
technology-the missing link in renewable energy systems, 2012).
The equipment which constitutes the SolarFuel SNG production plant is an Electrolysis reactor
and a Methanation reactor. The proposed plant also uses a Econamine FG plus CO2 capture
process to supply the CO2 needed for the Methanation.
7/27/2019 Final Thesis - M.sc Sustainable Energy Science - Vignir Bjarnason
http://slidepdf.com/reader/full/final-thesis-msc-sustainable-energy-science-vignir-bjarnason 32/76
20
3.4.1. ElectrolysisElectrolysis has a conversion efficiency of electricity to hydrogen in the range of 62-80%
(Sterner, 2009). Electrolysis uses electricity to decompose water into H2 and O2. The most
widely used technology for electrolysis in industry is alkaline electrolysis. This method uses
caustic potassium hydroxide at a process temperature of 70-140°C. Alkaline electrolysis
equipment uses a working pressure of 1-200 bars and are available and widely used in
capacities of >0,1MWel. Two other methods are available for electrolysis, these are polymer
electrolyte membrane (PEM) and solid oxide fuel cell (SOFC). These methods have drawbacks
such as high costs, small capacities and limited membrane lifetime (Sterner, 2009).
3.4.2. MethanationMethanation is a standard technology used in coal gasification and has been developed for use
in biomass gasification. Approximate efficiency that can be reached in methanizing SNG is 75%-
85% (Sterner, 2009). Methanation is a catalytic exothermal process at temperatures of 180-
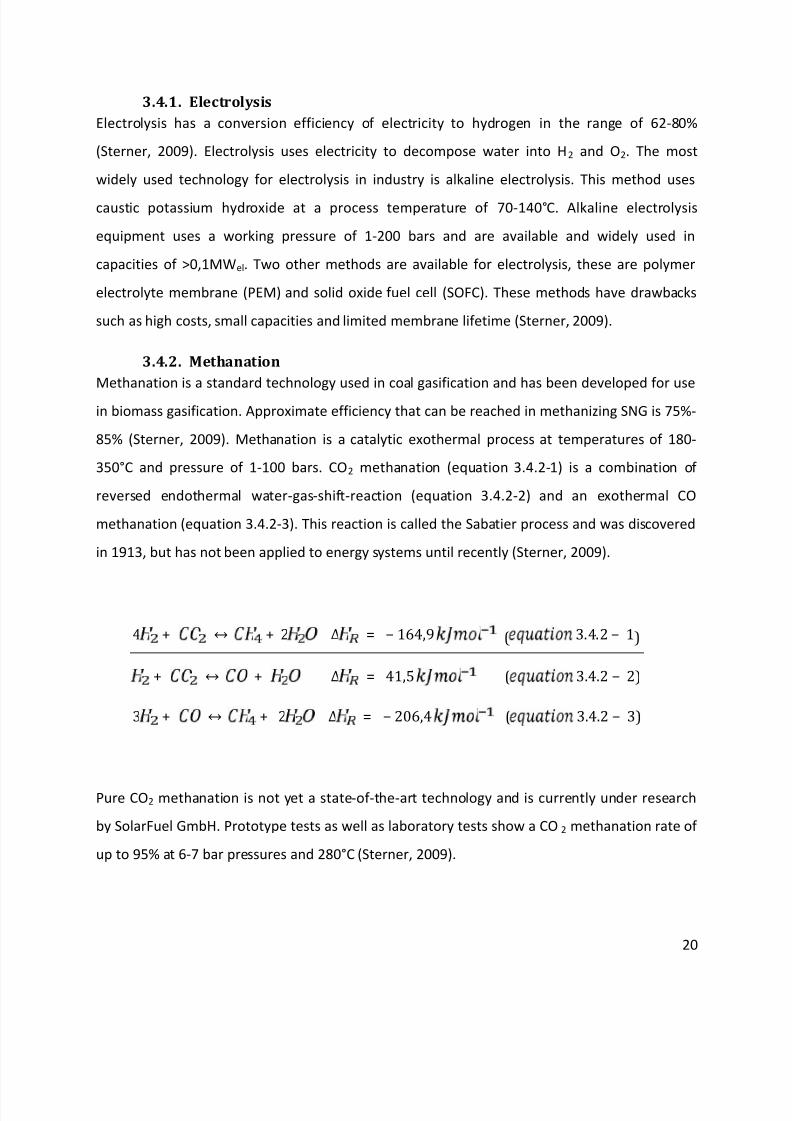
350°C and pressure of 1-100 bars. CO2 methanation (equation 3.4.2-1) is a combination of
reversed endothermal water-gas-shift-reaction (equation 3.4.2-2) and an exothermal CO
methanation (equation 3.4.2-3). This reaction is called the Sabatier process and was discovered
in 1913, but has not been applied to energy systems until recently (Sterner, 2009).
4 + ↔ + 2 ∆ = −164,9 ( 3.4.2 − 1)
+ ↔ + ∆ = 41,5 ( 3.4.2 − 2)
3 + ↔ + 2 ∆ = −206,4 ( 3.4.2 − 3)
Pure CO2 methanation is not yet a state-of-the-art technology and is currently under research
by SolarFuel GmbH. Prototype tests as well as laboratory tests show a CO2 methanation rate of
up to 95% at 6-7 bar pressures and 280°C (Sterner, 2009).
7/27/2019 Final Thesis - M.sc Sustainable Energy Science - Vignir Bjarnason
http://slidepdf.com/reader/full/final-thesis-msc-sustainable-energy-science-vignir-bjarnason 33/76
21
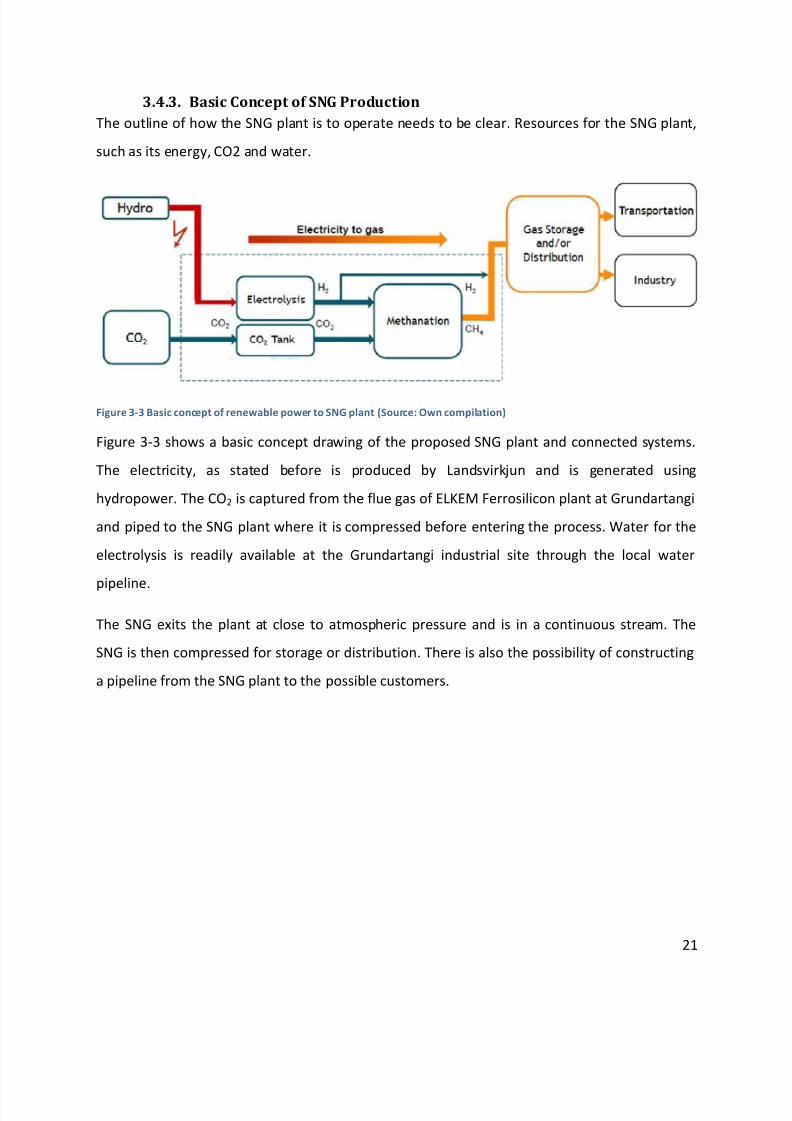
3.4.3. Basic Concept of SNG ProductionThe outline of how the SNG plant is to operate needs to be clear. Resources for the SNG plant,
such as its energy, CO2 and water.
Figure 3-3 Basic concept of renewable power to SNG plant (Source: Own compilation)
Figure 3-3 shows a basic concept drawing of the proposed SNG plant and connected systems.
The electricity, as stated before is produced by Landsvirkjun and is generated using
hydropower. The CO2 is captured from the flue gas of ELKEM Ferrosilicon plant at Grundartangi
and piped to the SNG plant where it is compressed before entering the process. Water for the
electrolysis is readily available at the Grundartangi industrial site through the local water
pipeline.
The SNG exits the plant at close to atmospheric pressure and is in a continuous stream. The
SNG is then compressed for storage or distribution. There is also the possibility of constructing
a pipeline from the SNG plant to the possible customers.
7/27/2019 Final Thesis - M.sc Sustainable Energy Science - Vignir Bjarnason
http://slidepdf.com/reader/full/final-thesis-msc-sustainable-energy-science-vignir-bjarnason 34/76
22
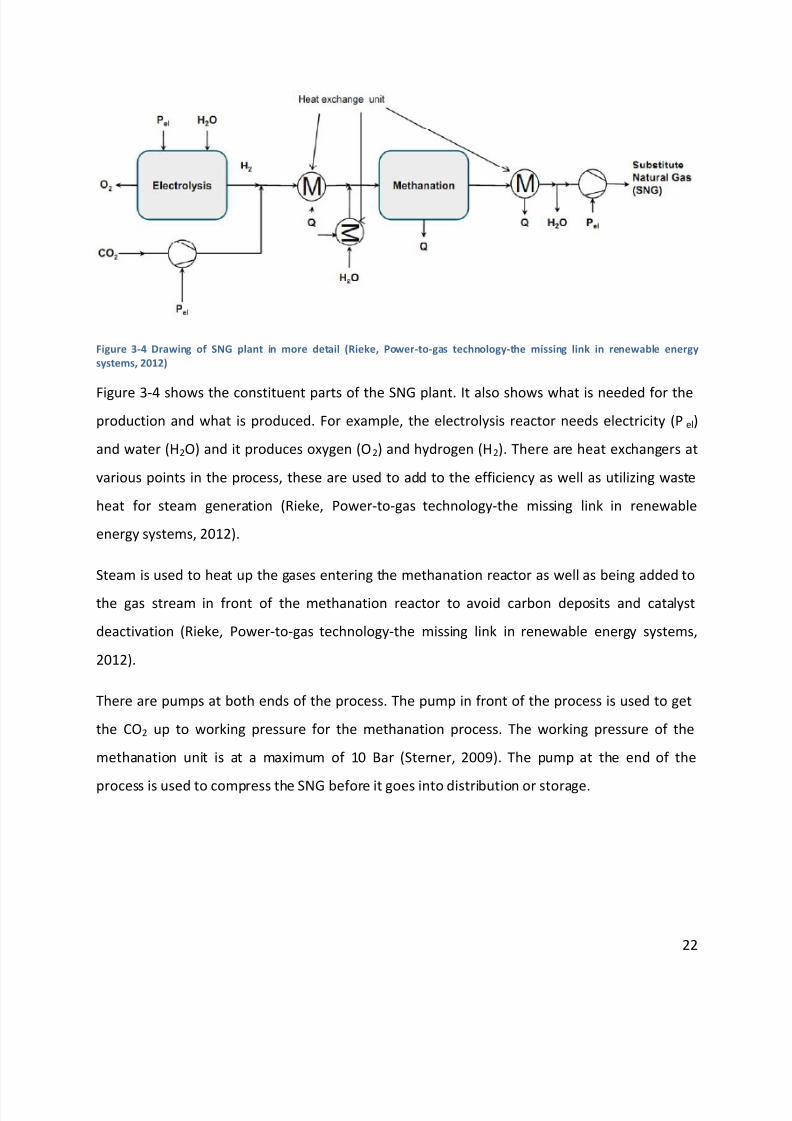
Figure 3-4 Drawing of SNG plant in more detail (Rieke, Power-to-gas technology-the missing link in renewable energy
systems, 2012)
Figure 3-4 shows the constituent parts of the SNG plant. It also shows what is needed for the
production and what is produced. For example, the electrolysis reactor needs electricity (P el)
and water (H2O) and it produces oxygen (O2) and hydrogen (H2). There are heat exchangers at
various points in the process, these are used to add to the efficiency as well as utilizing waste
heat for steam generation (Rieke, Power-to-gas technology-the missing link in renewable
energy systems, 2012).
Steam is used to heat up the gases entering the methanation reactor as well as being added to
the gas stream in front of the methanation reactor to avoid carbon deposits and catalyst
deactivation (Rieke, Power-to-gas technology-the missing link in renewable energy systems,
2012).
There are pumps at both ends of the process. The pump in front of the process is used to get
the CO2 up to working pressure for the methanation process. The working pressure of the
methanation unit is at a maximum of 10 Bar (Sterner, 2009). The pump at the end of the
process is used to compress the SNG before it goes into distribution or storage.
7/27/2019 Final Thesis - M.sc Sustainable Energy Science - Vignir Bjarnason
http://slidepdf.com/reader/full/final-thesis-msc-sustainable-energy-science-vignir-bjarnason 35/76
23
3.4.4. EfficiencyEfficiency is very important. It is one of the most important criteria for success of a process such
as the proposed SNG plant. The efficiency of the SNG plant basically refers to how much of the
initial electricity which is put into the process comes out in the form of SNG and as useful heat.
Since SNG is the main product of the process the efficiency of converting electricity into SNG is
the main concern. Useful heat from the process is a byproduct, which can be used for space
heating or generation of electricity from a steam powered turbine (useful heat >300°C).
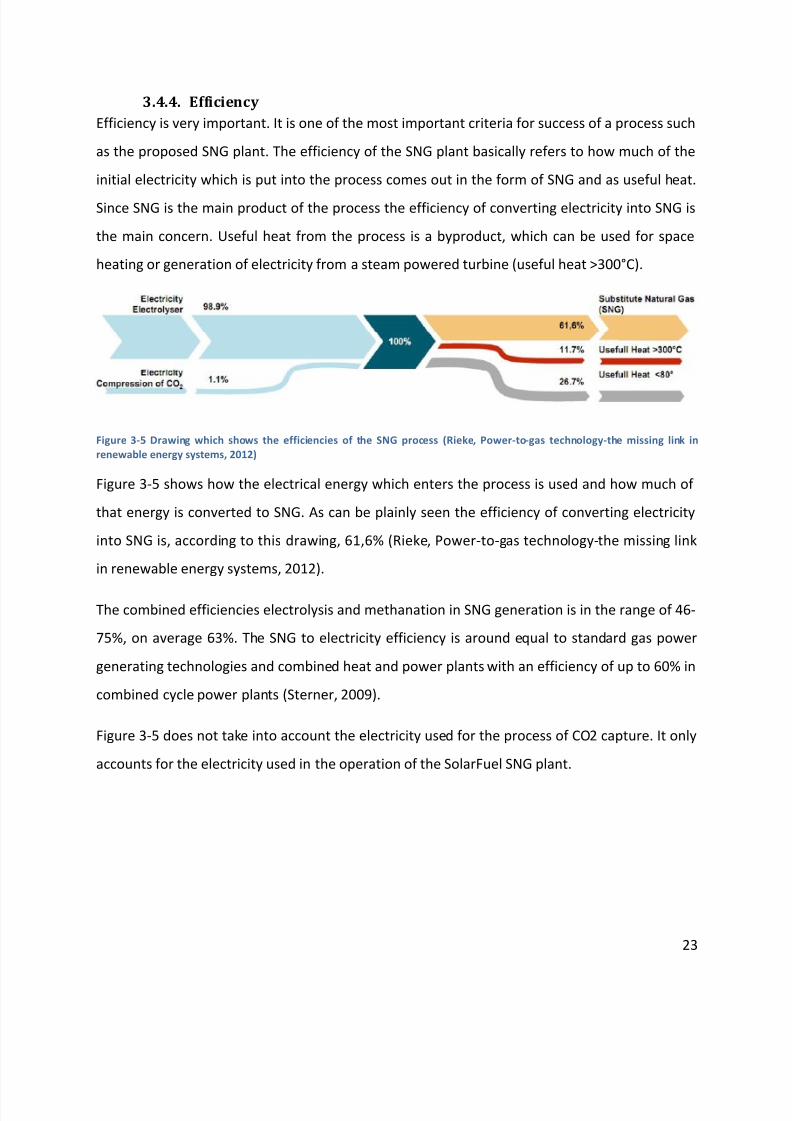
Figure 3-5 Drawing which shows the efficiencies of the SNG process (Rieke, Power-to-gas technology-the missing link in
renewable energy systems, 2012)
Figure 3-5 shows how the electrical energy which enters the process is used and how much of
that energy is converted to SNG. As can be plainly seen the efficiency of converting electricity
into SNG is, according to this drawing, 61,6% (Rieke, Power-to-gas technology-the missing link
in renewable energy systems, 2012).
The combined efficiencies electrolysis and methanation in SNG generation is in the range of 46-
75%, on average 63%. The SNG to electricity efficiency is around equal to standard gas power
generating technologies and combined heat and power plants with an efficiency of up to 60% in
combined cycle power plants (Sterner, 2009).
Figure 3-5 does not take into account the electricity used for the process of CO2 capture. It only
accounts for the electricity used in the operation of the SolarFuel SNG plant.
7/27/2019 Final Thesis - M.sc Sustainable Energy Science - Vignir Bjarnason
http://slidepdf.com/reader/full/final-thesis-msc-sustainable-energy-science-vignir-bjarnason 36/76
24
3.4.5. Gas ConversionThe whole idea of SNG production revolves around conversion of gases. The process is basically
converting H2 and CO2 into CH4. The conversion rate and the properties of the Product Gas are
very important to the success of the process.
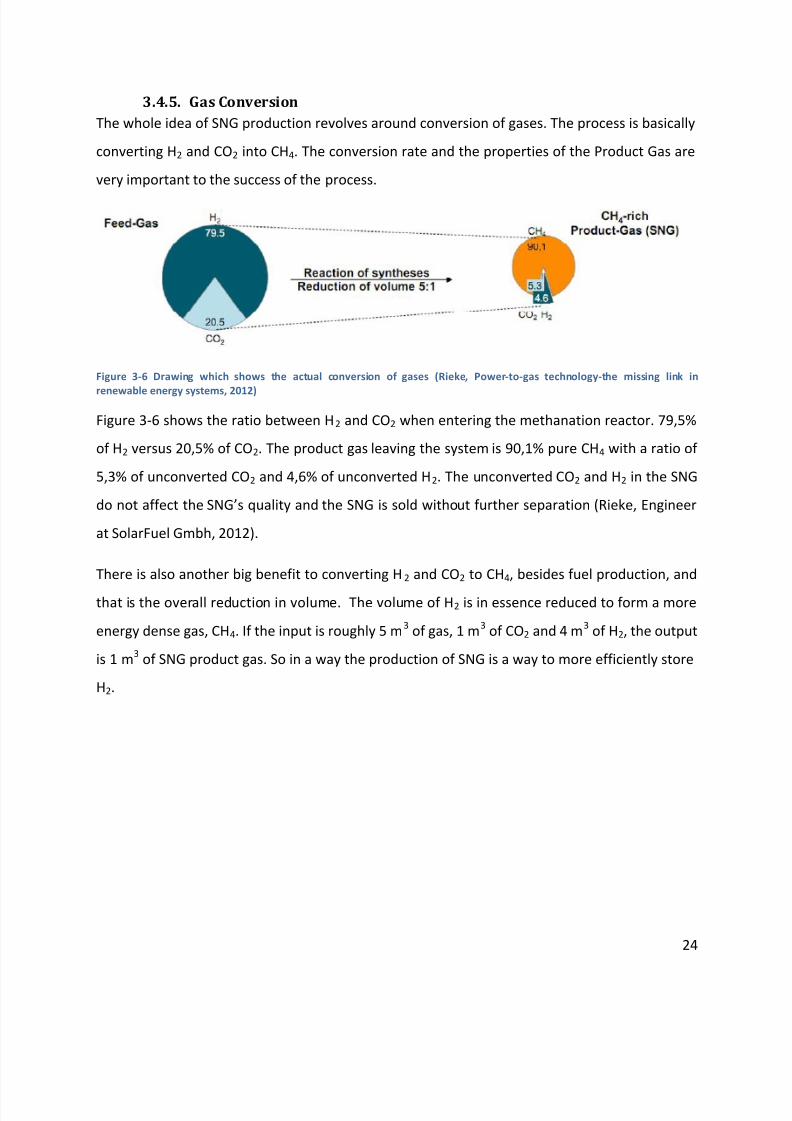
Figure 3-6 Drawing which shows the actual conversion of gases (Rieke, Power-to-gas technology-the missing link in
renewable energy systems, 2012)
Figure 3-6 shows the ratio between H2 and CO2 when entering the methanation reactor. 79,5%
of H2 versus 20,5% of CO2. The product gas leaving the system is 90,1% pure CH4 with a ratio of
5,3% of unconverted CO2 and 4,6% of unconverted H2. The unconverted CO2 and H2 in the SNG
do not affect the SNG’s quality and the SNG is sold without further separation (Rieke, Engineer
at SolarFuel Gmbh, 2012).
There is also another big benefit to converting H2 and CO2 to CH4, besides fuel production, and
that is the overall reduction in volume. The volume of H2 is in essence reduced to form a more
energy dense gas, CH4. If the input is roughly 5 m3 of gas, 1 m3 of CO2 and 4 m3 of H2, the output
is 1 m3 of SNG product gas. So in a way the production of SNG is a way to more efficiently store
H2.
7/27/2019 Final Thesis - M.sc Sustainable Energy Science - Vignir Bjarnason
http://slidepdf.com/reader/full/final-thesis-msc-sustainable-energy-science-vignir-bjarnason 37/76
25
3.5.Transportation and storage methodsIt is assumed that the SNG production plant will only be a wholesale company, supplying the
SNG as a continuous stream of gas at atmospheric pressure or as a compressed gas.
This assumption is made because natural gas (NG) has not been used to a great extent inIceland and therefore there is very little in the form of infrastructure for NG. The only available
method for transportation and storage of gas in Iceland is in the form of compressed natural
gas (CNG) or liquefied natural gas (LNG). Both CNG and LNG use high pressure containers to
store the SNG, with LNG using cryogenic cooling as well. Liquefied gas is stored at around 200
bar pressure and at a -162°C. At this pressure and temperature the SNG takes up approximately
600 times less space than at atmospheric pressure. CNG is natural gas compressed to 200 bar –
275 bar of pressure and stored in thick steel, aluminum or composite containers. Theliquefaction of the SNG is expensive and storage difficult due to the need to keep the liquefied
gas cold. CNG is also expensive but considerably cheaper than LNG.
7/27/2019 Final Thesis - M.sc Sustainable Energy Science - Vignir Bjarnason
http://slidepdf.com/reader/full/final-thesis-msc-sustainable-energy-science-vignir-bjarnason 38/76
26
4. Proposed Plant/sIt is necessary to set up scenarios in order to be able to figure out variables and calculate costs.
For the purposes of this project, three scenarios are set up. The main variable used to
distinguish between the three set ups is the energy requirements of the SolarFuel SNG plant.
This variable controls the size and production of the project.
The energy requirements for this project are 5 MW, 20 MW and 40 MW. These scenarios are
set up to be able to estimate if there is any economy of scale present in the project and to be
able to get an idea of how big the project needs to be in order to make profit. These energy
requirements are also chosen because they fit into the available supply of category 2 – surplus
energy from Landsvirkjun.
A key component of the financial calculations is the available annual running time or how many
hours per year the plant is going to be able to produce SNG. When the annual running time is
figured out the production capacity of each of the three scenarios can be calculated.
It is assumed for all three scenarios that the location of the SNG plant is Grundartangi industrial
site. Access to enough water is assumed to be available. Electricity is assumed to be coming
from Landsvirkjun.
7/27/2019 Final Thesis - M.sc Sustainable Energy Science - Vignir Bjarnason
http://slidepdf.com/reader/full/final-thesis-msc-sustainable-energy-science-vignir-bjarnason 39/76
27
4.1.Annual Running TimeThe energy that can be used from Landsvirkjun is the category 2 – surplus energy and the
category 3 – unsecured energy. Possible down time due to energy shortage presents the
problem of the possibility of having to reduce production during some years. For the purposes
of this project, instead of calculating each year and building in shortage the decision is to use an
average for the available running time.
4.1.1. Category 2 Available Running TimeFrom the information from Landsvirkjun, it is stated that the probability of 100% delivery is in
approximately 50% of years and in approximately 5% of years the reduction is likely to be close
to the agreed upon limit of 50% (Björnsson, 2012).
So in order to figure out how many hours per year the SNG plant can operate it is necessary to
make assumptions. For the purposes of this project it is assumed that, for a 10 year period,
there is 100% delivery for 5 years, 75% delivery for 4 years and 50% delivery for 1 year.
So: (5 ∗1) + (4 ∗0,75) + (1 ∗0,5) = 8,5 => ,
= 0,85 85% delivery can be assumed
There are 8766 hours in one year, which means that it can be assumed that the SNG plan can
operate for 85% of those 8766 hours
So: 8766 ∗0,85 = 7451,1
For the purposes of this project it is assumed that the SNG plant can operate at full capacity for
7400 hours per year.
4.1.2. Category 3 Available Running TimeFor the category 3 energy it is assumed that the energy delivery is close to 50% for 5 years out
of 10 and 35% for 5 years out of 10.
So:(5 ∗0,5) + (5 ∗0,35) = 4,25 => ,
= 0,425 42,5% delivery can be assumed
So:8766 ∗0,425 = 3725,55
For the purposes of this project it is assumed that the SNG plant can operate at full capacity for
3725 hours per year.
7/27/2019 Final Thesis - M.sc Sustainable Energy Science - Vignir Bjarnason
http://slidepdf.com/reader/full/final-thesis-msc-sustainable-energy-science-vignir-bjarnason 40/76
28
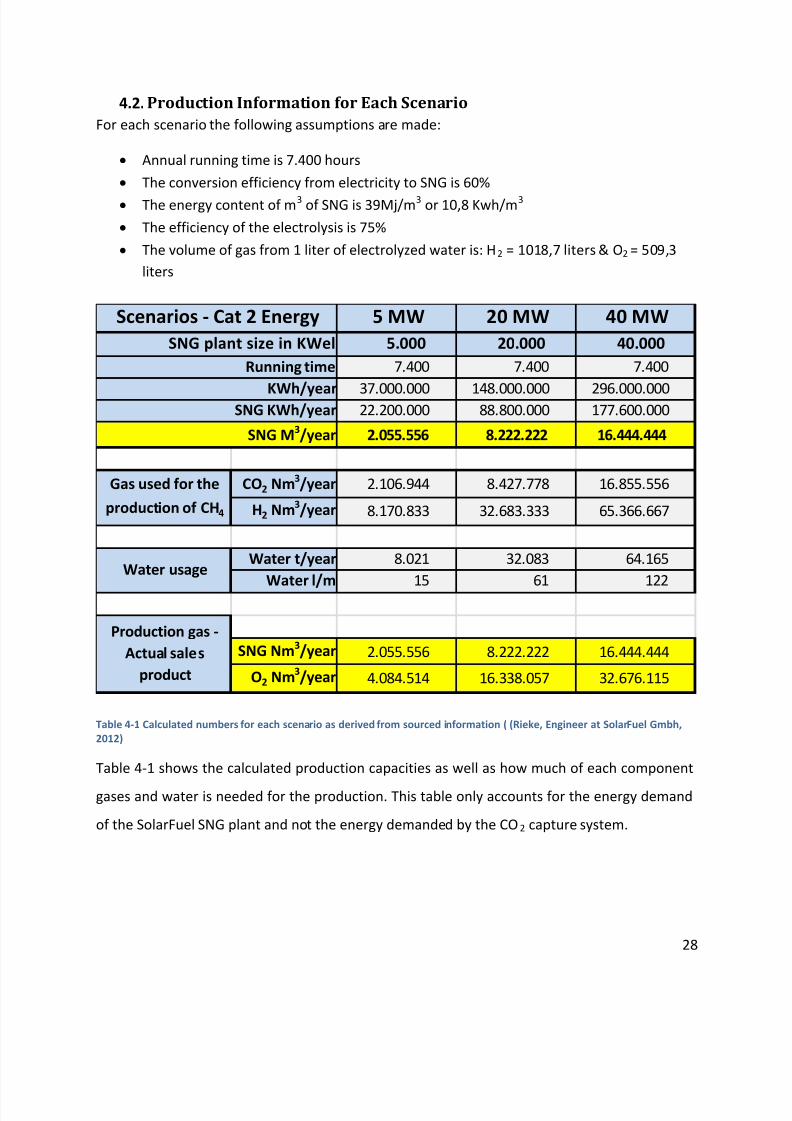
4.2. Production Information for Each ScenarioFor each scenario the following assumptions are made:
Annual running time is 7.400 hours
The conversion efficiency from electricity to SNG is 60%
The energy content of m3 of SNG is 39Mj/m3 or 10,8 Kwh/m3
The efficiency of the electrolysis is 75%
The volume of gas from 1 liter of electrolyzed water is: H2 = 1018,7 liters & O2 = 509,3
liters
Table 4-1 Calculated numbers for each scenario as derived from sourced information ( (Rieke, Engineer at SolarFuel Gmbh,
2012)
Table 4-1 shows the calculated production capacities as well as how much of each component
gases and water is needed for the production. This table only accounts for the energy demand
of the SolarFuel SNG plant and not the energy demanded by the CO2 capture system.
5 MW 20 MW 40 MW
5.000 20.000 40.000
7.400 7.400 7.400
37.000.000 148.000.000 296.000.00022.200.000 88.800.000 177.600.000
2.055.556 8.222.222 16.444.444
CO2 Nm3/year 2.106.944 8.427.778 16.855.556
H2 Nm3/year 8.170.833 32.683.333 65.366.667
Water t/year 8.021 32.083 64.165
Water l/m 15 61 122
SNG Nm3/year 2.055.556 8.222.222 16.444.444
O2 Nm3/year 4.084.514 16.338.057 32.676.115
Water usage
Production gas -
Actual sales
product
Scenarios - Cat 2 Energy
SNG KWh/yearKWh/year
SNG plant size in KWel
Gas used for the
production of CH4
Running time
SNG M3/year
7/27/2019 Final Thesis - M.sc Sustainable Energy Science - Vignir Bjarnason
http://slidepdf.com/reader/full/final-thesis-msc-sustainable-energy-science-vignir-bjarnason 41/76
29
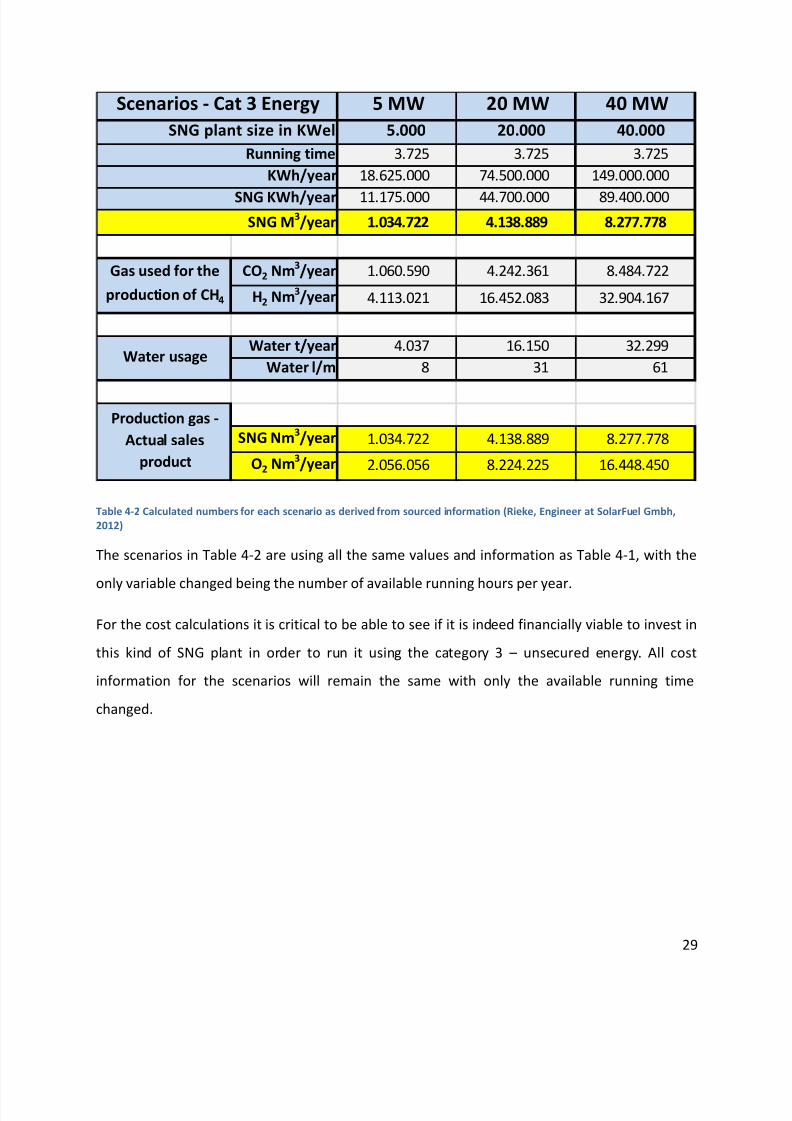
Table 4-2 Calculated numbers for each scenario as derived from sourced information (Rieke, Engineer at SolarFuel Gmbh,
2012)
The scenarios in Table 4-2 are using all the same values and information as Table 4-1, with the
only variable changed being the number of available running hours per year.
For the cost calculations it is critical to be able to see if it is indeed financially viable to invest in
this kind of SNG plant in order to run it using the category 3 – unsecured energy. All cost
information for the scenarios will remain the same with only the available running time
changed.
5 MW 20 MW 40 MW
5.000 20.000 40.000
3.725 3.725 3.725
18.625.000 74.500.000 149.000.000
11.175.000 44.700.000 89.400.0001.034.722 4.138.889 8.277.778
CO2 Nm3/year 1.060.590 4.242.361 8.484.722
H2 Nm3/year 4.113.021 16.452.083 32.904.167
Water t/year 4.037 16.150 32.299
Water l/m 8 31 61
SNG Nm3/year 1.034.722 4.138.889 8.277.778
O2 Nm3/year 2.056.056 8.224.225 16.448.450
SNG KWh/year
SNG M3/year
Gas used for the
production of CH4
Water usage
Production gas -
Actual sales
product
KWh/year
Scenarios - Cat 3 Energy
SNG plant size in KWel
Running time
7/27/2019 Final Thesis - M.sc Sustainable Energy Science - Vignir Bjarnason
http://slidepdf.com/reader/full/final-thesis-msc-sustainable-energy-science-vignir-bjarnason 42/76
30
5. Financial AspectsPrimary concerns for any kind of project are its financial aspects. How much is it going to cost
and which are the main sources of revenue? These are the questions that need answering
before a decision is made to go forward with the project or not. This chapter is an attempt to
answer these questions.
5.1.CostsThe costs are the starting point of any financial analysis. To find the cost information for this
project, some help was needed. Companies which design and produce the equipment needed
were helpful in most cases and provided cost information for the purposes of this project. With
the information from chapter 3 and 4 it is possible to calculate the costs incurred by each of the
three scenarios.
5.1.1. BuildingIn Iceland the weather can become rather extreme at times. In winter there are high winds with
rain, snow and sleet. All this can present a problem for fragile industrial equipment. The only
option is to house the equipment in a building. For this project, a simple steel frame industrial
building is needed.
The CO2 capture equipment is designed to be outside and withstand the elements and therefor
the only equipment which needs to be housed is the SolarFuel methanation equipment, i.e. the
electrolysis reactor and the methanation reactor.
The building only needs to be a simple, industrial building and the space requirements for the
SolarFuel SNG plants are as follows (Rieke, Engineer at SolarFuel Gmbh, 2012).
For an installation of 5 MWel: 1200 m2 is required
For an installation of 20 MWel: 3000 m2 is required
For and installation of 40 MWel: 5000 m2 is required
To get a realistic idea of the building cost in Iceland today, real world examples are an option.
The examples chosen were from two very recently finished industrial projects in Iceland. One
was for a building of 1000 m2 and the other for a building of 4000 m2. These should give a
7/27/2019 Final Thesis - M.sc Sustainable Energy Science - Vignir Bjarnason
http://slidepdf.com/reader/full/final-thesis-msc-sustainable-energy-science-vignir-bjarnason 43/76
31
realistic figure for the cost of the required buildings. Both buildings are very simple industrial
structures which meet the criteria set forth (Þorfinnsson, 2012).
The 1000 m2 building cost was approximately 144.000 ISK/m2 and the building cost for the 4000
m2 building cost was approximately 110.000 ISK/m2. These numbers are for a finished building
with all needed components for work to be started (Þorfinnsson, 2012).
Using the ISK to EUR exchange rate of 164,1 ISK to 1 EUR.
This means, that the cost of construction for the buildings is as follows.
For 5 MWel at 1200 m2 it is 1.053.016 EUR
For 20 MWel at 3000 m2 it is 2.010.968 EUR
For 40 MWel at 5000 m2 it is 3.351.614 EUR
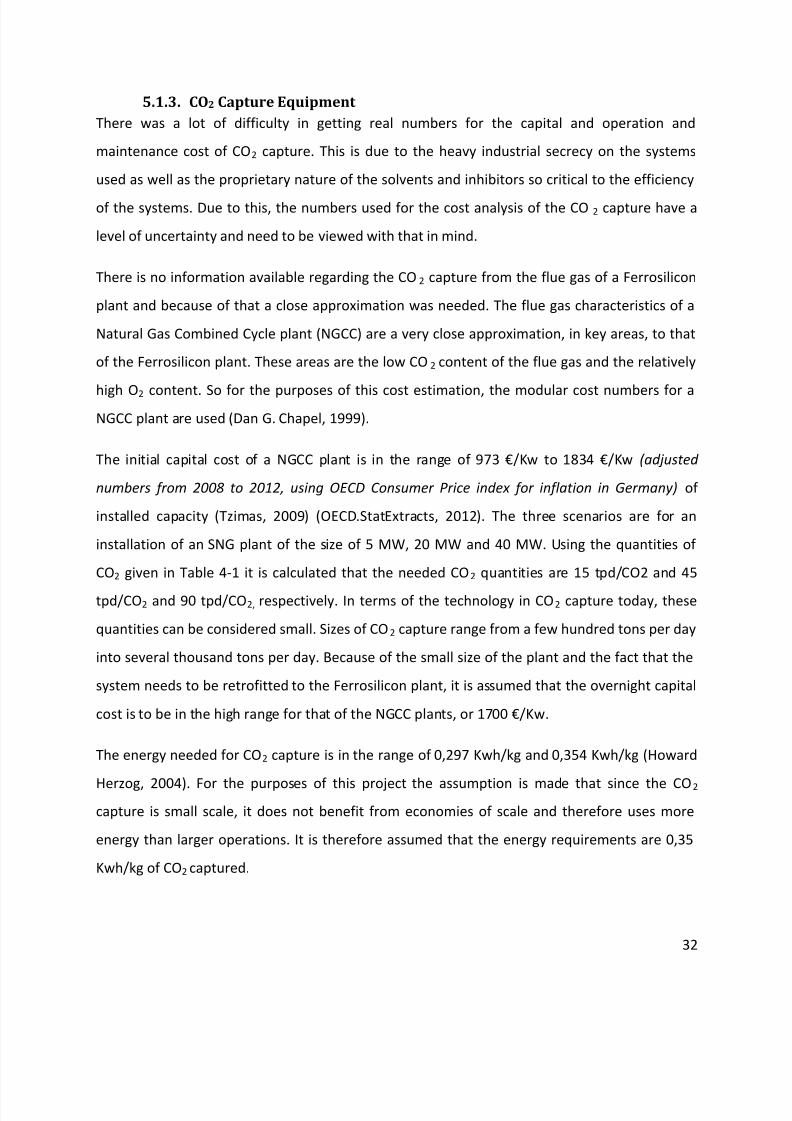
5.1.2. Power Lines and Flue Gas PipingThe need to pipe the flue gas to and from the CO2 capture system calls for added costs. For the
purposes of this project the cost of the flue gas piping and the piping for CO2 from the CO2
capture system into the SNG plant are assumed to be included in the price of the systems. This
is possible due to the small size of the industrial site and the close proximities of the SNG plant
and the CO2 capture system.
The SNG plant requires a 20 Kv connection to the grid (Rieke, Engineer at SolarFuel Gmbh,
2012). The transformer station that supplies Grundartangi industrial site with energy is
approximately 5 km away. The cost of a 25 Kv power line is in the range of 3,2 – 4,2 MISK/Km or
19500 -25600 EUR/KM (Haraldsson, 2002), adjusted using inflation percentages for Iceland
(Hagstofa Íslands, 2012).
Figure 5-1 Calculated cost of the transmission lines needed for the SNG plant (Haraldsson, 2002).
Scenarios 5 MW 20 MW 40 MW
Distance 5 5 5
€/KM 19500 23000 25000
Cost 97.500 115.000 125.000
Transmission Line Cost
7/27/2019 Final Thesis - M.sc Sustainable Energy Science - Vignir Bjarnason
http://slidepdf.com/reader/full/final-thesis-msc-sustainable-energy-science-vignir-bjarnason 44/76
32
5.1.3. CO2 Capture Equipment There was a lot of difficulty in getting real numbers for the capital and operation and
maintenance cost of CO2 capture. This is due to the heavy industrial secrecy on the systems
used as well as the proprietary nature of the solvents and inhibitors so critical to the efficiency
of the systems. Due to this, the numbers used for the cost analysis of the CO 2 capture have a
level of uncertainty and need to be viewed with that in mind.
There is no information available regarding the CO2 capture from the flue gas of a Ferrosilicon
plant and because of that a close approximation was needed. The flue gas characteristics of a
Natural Gas Combined Cycle plant (NGCC) are a very close approximation, in key areas, to that
of the Ferrosilicon plant. These areas are the low CO 2 content of the flue gas and the relatively
high O2 content. So for the purposes of this cost estimation, the modular cost numbers for aNGCC plant are used (Dan G. Chapel, 1999).
The initial capital cost of a NGCC plant is in the range of 973 €/Kw to 1834 €/Kw (adjusted
numbers from 2008 to 2012, using OECD Consumer Price index for inflation in Germany) of
installed capacity (Tzimas, 2009) (OECD.StatExtracts, 2012). The three scenarios are for an
installation of an SNG plant of the size of 5 MW, 20 MW and 40 MW. Using the quantities of
CO2 given in Table 4-1 it is calculated that the needed CO2 quantities are 15 tpd/CO2 and 45
tpd/CO2 and 90 tpd/CO2, respectively. In terms of the technology in CO2 capture today, these
quantities can be considered small. Sizes of CO2 capture range from a few hundred tons per day
into several thousand tons per day. Because of the small size of the plant and the fact that the
system needs to be retrofitted to the Ferrosilicon plant, it is assumed that the overnight capital
cost is to be in the high range for that of the NGCC plants, or 1700 €/Kw.
The energy needed for CO2 capture is in the range of 0,297 Kwh/kg and 0,354 Kwh/kg (Howard
Herzog, 2004). For the purposes of this project the assumption is made that since the CO2
capture is small scale, it does not benefit from economies of scale and therefore uses more
energy than larger operations. It is therefore assumed that the energy requirements are 0,35
Kwh/kg of CO2 captured.
7/27/2019 Final Thesis - M.sc Sustainable Energy Science - Vignir Bjarnason
http://slidepdf.com/reader/full/final-thesis-msc-sustainable-energy-science-vignir-bjarnason 45/76
33
Table 5-1 Energy requirement calculations for the CO2 capture system (Howard Herzog, 2004)
Table 5-1 shows how much energy each scenario requires for its CO2 capture needs. This energy
is not included in the 5 MW, 20 MW or 40 MW and will be added to the overall energy need of
the SNG plant.
Table 5-2 Calculated initial capital cost of CO2 Capture using Econamine FG plus (Tzimas, 2009)
Table 5-2 describes the initial capital cost of the Econamine FG plus CO2 capture system. The
values given for the cost of the system have a certain degree of uncertainty and need to be
assessed with that in mind.
Scenarios 5 MW 20 MW 40 MW
tons/year 4.000 15.500 30.500
Kwh/kg 0,35 0,35 0,35
Kwh/year 1.400.000 5.425.000 10.675.000
CO2 Capture
Scenarios 5 MW 20 MW 40 MW
€/Kw 1700 1700 1700
Kw Capacity 160 620 1.250
Initial Capital Cost 272.000 1.054.000 2.125.000
Cost of CO2
Capture
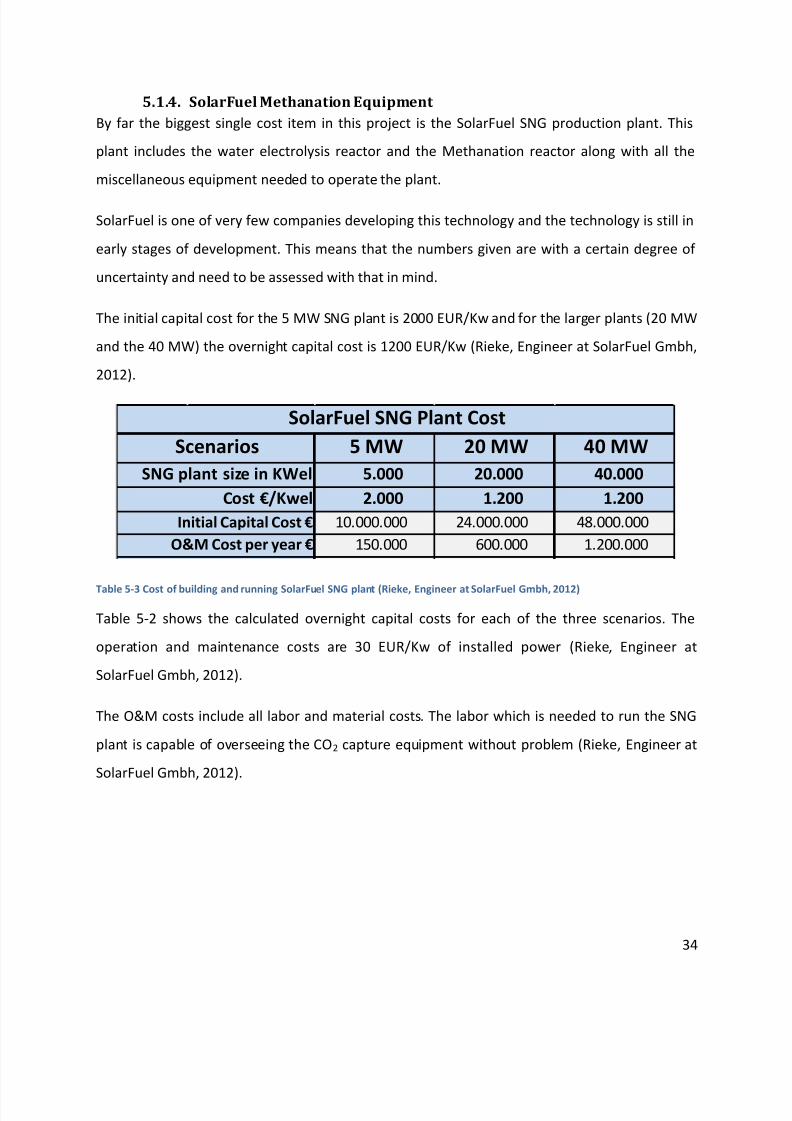
7/27/2019 Final Thesis - M.sc Sustainable Energy Science - Vignir Bjarnason
http://slidepdf.com/reader/full/final-thesis-msc-sustainable-energy-science-vignir-bjarnason 46/76
34
5.1.4. SolarFuel Methanation Equipment By far the biggest single cost item in this project is the SolarFuel SNG production plant. This
plant includes the water electrolysis reactor and the Methanation reactor along with all the
miscellaneous equipment needed to operate the plant.
SolarFuel is one of very few companies developing this technology and the technology is still in
early stages of development. This means that the numbers given are with a certain degree of
uncertainty and need to be assessed with that in mind.
The initial capital cost for the 5 MW SNG plant is 2000 EUR/Kw and for the larger plants (20 MW
and the 40 MW) the overnight capital cost is 1200 EUR/Kw (Rieke, Engineer at SolarFuel Gmbh,
2012).
Table 5-3 Cost of building and running SolarFuel SNG plant (Rieke, Engineer at SolarFuel Gmbh, 2012)
Table 5-2 shows the calculated overnight capital costs for each of the three scenarios. The
operation and maintenance costs are 30 EUR/Kw of installed power (Rieke, Engineer at
SolarFuel Gmbh, 2012).
The O&M costs include all labor and material costs. The labor which is needed to run the SNG
plant is capable of overseeing the CO2 capture equipment without problem (Rieke, Engineer at
SolarFuel Gmbh, 2012).
5 MW 20 MW 40 MW
5.000 20.000 40.000
Cost €/Kwel 2.000 1.200 1.200
10.000.000 24.000.000 48.000.000
150.000 600.000 1.200.000
SolarFuel SNG Plant Cost
Scenarios
SNG plant size in KWel
Initial Capital Cost €
O&M Cost per year €
7/27/2019 Final Thesis - M.sc Sustainable Energy Science - Vignir Bjarnason
http://slidepdf.com/reader/full/final-thesis-msc-sustainable-energy-science-vignir-bjarnason 47/76
35
5.1.5. Price of EnergyThe price of energy from Landsvirkjun is divided into the same three categories as the energy
based on the security of delivery. The energy generation of Landsvirkjun is divided into these
categories, i.e. base load energy, surplus energy and unsecured energy. Each category has
enough available energy and the price per Kwh for each category is as follows (Björnsson,
2012):
Using the ISK to EUR exchange rate of 164,1 ISK to 1 EUR.
Category 1 – Base Load Energy costs 3,4 ISK/Kwh or 0,021 EUR/Kwh
Category 2 – Surplus Energy costs 2,4 ISK/Kwh or 0,015 EUR/Kwh
Category 3 – Unsecured Energy costs 1,7 ISK/Kwh or 0,01 EUR/Kwh
From the energy price it would seem to be most economical to use the category 3 energy. But
with heavy delivery restrictions during some years it could be impossible to make the
investment pay off.
The method used for determining if the delivery restrictions are too heavy for the investment
to be viable is to lower the available running time of the SNG plant but keep all investment
costs at the same level.
7/27/2019 Final Thesis - M.sc Sustainable Energy Science - Vignir Bjarnason
http://slidepdf.com/reader/full/final-thesis-msc-sustainable-energy-science-vignir-bjarnason 48/76
36
5.2.RevenueSimilarly important as the cost of a project is the possible revenue stream of the project. For
this project there are a few possible ways to earn revenue. The main revenue stream is the
product SNG but there are other ways as well.
The electrolysis reactor generates O2 from the electrolysis of water. This O2 can be used in a
variety of industries and might be a sellable product.
The same is also true for CO2. CO2 is used in a variety of industries and could also be a sellable
gas, but with restrictions in quantity as it is one of two main components of SNG.
Another point of interest is the possibility of utilizing the waste heat created by the
methanation process.
5.2.1. SNGSubstitute Natural Gas or SNG is the main product and main revenue earner of this project. The
emphasis is on the efficient production of SNG using the methods described in the previous
chapters. That is why the most important price of any product from this project is the price of
SNG.
In Iceland the closest substitute to SNG is Bio Methane Gas (BMG). The CH4 or Methane gas is
the major gas in both SNG and BMG. That is why the price of BMG will be used as the price that
could possibly be had for SNG (Hermannsson, 2012).
Today BMG is sold through two pump stations to the general public for transportation. It is
being sold by a company called Sorpa and a subsidiary called Metanorka. These companies sell
gas which is captured from municipal waste sites (Hermannsson, 2012).
The price of BMG and by extension the price for SNG is in the range of 80 – 100 ISK/M3. It is
assumed that for the purposes of this project that the price for SNG is 100 ISK/m 3 or 0,61
EUR/m3 (Hermannsson, 2012).
7/27/2019 Final Thesis - M.sc Sustainable Energy Science - Vignir Bjarnason
http://slidepdf.com/reader/full/final-thesis-msc-sustainable-energy-science-vignir-bjarnason 49/76
37
5.2.2. O2
Selling O2 for industrial or commercial use is possible. O2 has very diverse applications and is
used in industrial processes from metallurgy to fish farming. In Iceland the main use for O2 is for
fish farming, where it is used to oxygenate the water (Rafnsson, 2012).
Isaga is the largest producer and seller of industrial gases in Iceland and as such was considered
to be a likely buyer for the O2 produced by the electrolysis (Rafnsson, 2012).
After reviewing the proposed plants and the data the result is that it would prove too expensive
to use the O2 from the SNG plant. This is mainly due to the fact that the O 2 would be provided
at atmospheric pressure. The O2 would either have to be liquefied or compressed for use in
steel cylinders (Rafnsson, 2012).
Liquefaction of the O2 requires cooling the gas to a very low temperature for more efficient
storage but liquefaction uses huge amounts of energy as well as having high capital costs.
Compressing the O2 is another possibility but in this case was considered too expensive to be
viable. The compression would require the gas to be compressed onto steel cylinders which
then are transported to the consumer. The transportation cost coupled with the cost of the
filling station make this possibility difficult (Rafnsson, 2012).
There is however the possibility that with increased activity at the Grundartangi industrial site
there could be on site buyers for the O2 produced by the SNG plant. There are two metallurgy
plants in construction, at Grundartangi, which could possibly be buyers of O2 and CH4 in the
future. The gas would be piped to the plants and they would use the gas as it is produced, with
a storage/buffer unit in between the SNG plant and the consumer (Rafnsson, 2012).
These plants are however not going to be a reality in the near future and can therefore not be
considered buyers at this point in time. This could however change the economics of the
project in the future (Rafnsson, 2012).
7/27/2019 Final Thesis - M.sc Sustainable Energy Science - Vignir Bjarnason
http://slidepdf.com/reader/full/final-thesis-msc-sustainable-energy-science-vignir-bjarnason 50/76
38
5.2.3. CO2
Isaga is also interested in buying CO2 gas, which is another big part of their commercial sales.
Today they produce CO2 by capturing it from the atmosphere which is inherently expensive and
energy intensive (Rafnsson, 2012).
The possibility of selling the excess CO2 to Isaga is interesting. This would only be the quantity
of CO2 which isn’t used in the production of the SNG gas.
However the same difficulties were found with CO2 as were found with the O2, i.e. the expense
of compression, cooling and storage of the gas is simply too high. This means that it is not
financially viable for Isaga to buy the gas at atmospheric pressure and compress it onto tanks
for distribution to customers (Rafnsson, 2012).
5.2.4. Waste Heat Waste heat is another possible source of revenue. The process can, as stated before, yield some
waste heat. This waste heat comes in both high grade heat (>300°C) and low grade heat
(<80°C).
The low grade heat might be useful for space heating or other such utilization. However, since
Grundartangi is situated in an area with large geothermal reservoirs which are utilized for space
heating at a low price, it is not considered financially viable to utilize the small low grade heat
potential of the SNG plant.
The high grade heat could be used to produce steam. This kind of steam generation might
prove beneficial in reducing the CO2 capturing costs, whereas the CO2 capture system uses
steam to boil the CO2 out of the MEA solution. Using the steam could reduce the energy
demand of the system to some degree and thereby increase the financial viability.
For the purposes of this project the steam generation is assumed to be too small to be of any
real value in reducing the energy requirements of the CO2 capture system.
7/27/2019 Final Thesis - M.sc Sustainable Energy Science - Vignir Bjarnason
http://slidepdf.com/reader/full/final-thesis-msc-sustainable-energy-science-vignir-bjarnason 51/76
39
6. Profitability ModelThe three scenarios need to be calculated for profitability in order to figure out the viability of
the project.
Each of the three scenarios are put through the model using two different energy prices and
annual running time. This makes the scenarios six in total.
The main focus is on Scenario 3. This is because Scenario 3 showed the most positive numbers
for financial feasibility. Scenario 1 is not viable and will be covered briefly. Scenario 2 shows
some positive numbers and will also be covered briefly.
6.1.Assumptions
As with any model calculations, some assumptions regarding the model have to be made. Theassumptions made for the profitability model are stated here.
The planning horizon of the project is set at 20 years.
Discount rate or Marginal Attractive Rate of Return (MARR) is set at 6% (real terms).
The construction time of the SNG plant is assumed to be 1 year (2014) and operation could
start the following year (2015).
The financing for this project is considered to be 30% equity and 70% loan. The loan has a
payoff period of 20 years with the repayment of principal starting in 2016. The interest rate for
the loan is 5% per year (real terms) with loan management fees of 2% of the principal of the
loan. The working capital is adjusted according to each scenario and is to cover the initial phase
of the project, i.e. to cover operating expenses, loan management fees and interest before the
project starts to earn revenue.
The depreciation is assumed to be 10% for the SNG plant and CO2 capture system. Depreciation
for the Building is assumed to be 5%. Income tax is 20% in Iceland.
It is assumed that each m3 of SNG is priced at 100 ISK or 0,61 EUR at wholesale (Hermannsson,
2012). It is also assumed that there is sufficient demand for SNG to sell the whole quantity of
produced SNG.
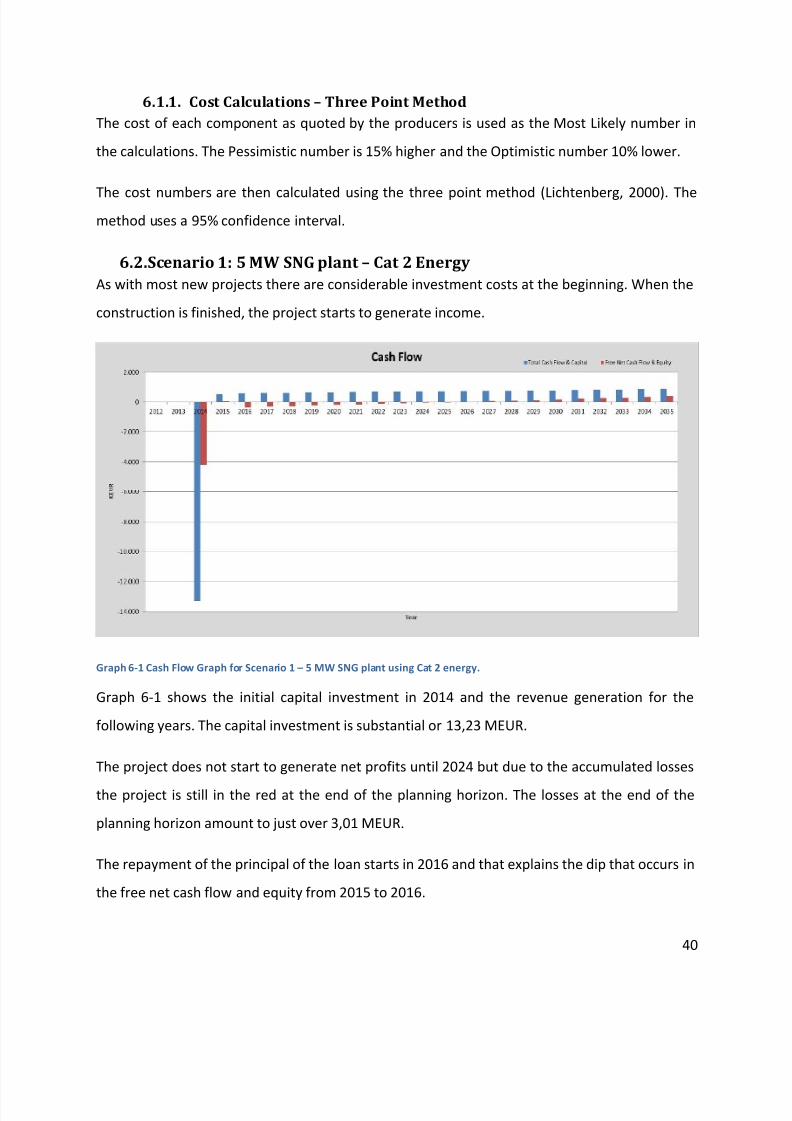
7/27/2019 Final Thesis - M.sc Sustainable Energy Science - Vignir Bjarnason
http://slidepdf.com/reader/full/final-thesis-msc-sustainable-energy-science-vignir-bjarnason 52/76
40
6.1.1. Cost Calculations – Three Point MethodThe cost of each component as quoted by the producers is used as the Most Likely number in
the calculations. The Pessimistic number is 15% higher and the Optimistic number 10% lower.
The cost numbers are then calculated using the three point method (Lichtenberg, 2000). Themethod uses a 95% confidence interval.
6.2.Scenario 1: 5 MW SNG plant – Cat 2 EnergyAs with most new projects there are considerable investment costs at the beginning. When the
construction is finished, the project starts to generate income.
Graph 6-1 Cash Flow Graph for Scenario 1 – 5 MW SNG plant using Cat 2 energy.
Graph 6-1 shows the initial capital investment in 2014 and the revenue generation for the
following years. The capital investment is substantial or 13,23 MEUR.
The project does not start to generate net profits until 2024 but due to the accumulated losses
the project is still in the red at the end of the planning horizon. The losses at the end of the
planning horizon amount to just over 3,01 MEUR.
The repayment of the principal of the loan starts in 2016 and that explains the dip that occurs in
the free net cash flow and equity from 2015 to 2016.
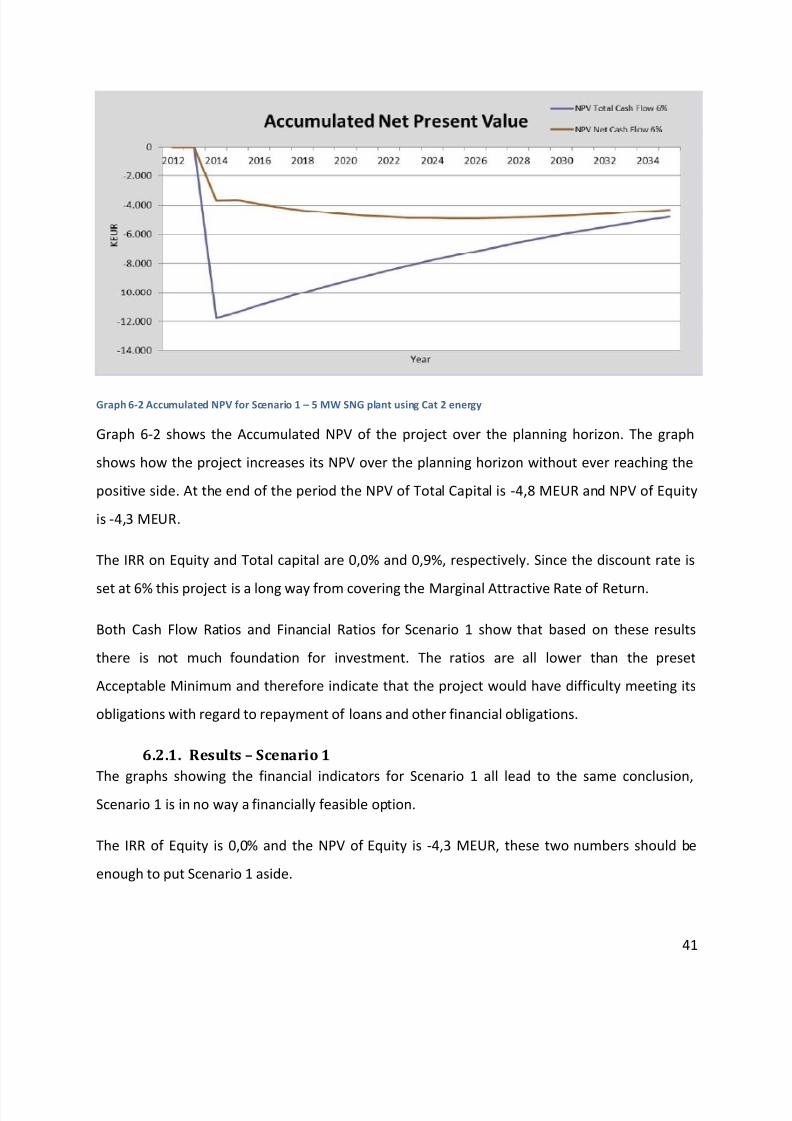
7/27/2019 Final Thesis - M.sc Sustainable Energy Science - Vignir Bjarnason
http://slidepdf.com/reader/full/final-thesis-msc-sustainable-energy-science-vignir-bjarnason 53/76
41
Graph 6-2 Accumulated NPV for Scenario 1 – 5 MW SNG plant using Cat 2 energy
Graph 6-2 shows the Accumulated NPV of the project over the planning horizon. The graph
shows how the project increases its NPV over the planning horizon without ever reaching the
positive side. At the end of the period the NPV of Total Capital is -4,8 MEUR and NPV of Equity
is -4,3 MEUR.
The IRR on Equity and Total capital are 0,0% and 0,9%, respectively. Since the discount rate is
set at 6% this project is a long way from covering the Marginal Attractive Rate of Return.
Both Cash Flow Ratios and Financial Ratios for Scenario 1 show that based on these results
there is not much foundation for investment. The ratios are all lower than the preset
Acceptable Minimum and therefore indicate that the project would have difficulty meeting its
obligations with regard to repayment of loans and other financial obligations.
6.2.1. Results – Scenario 1The graphs showing the financial indicators for Scenario 1 all lead to the same conclusion,
Scenario 1 is in no way a financially feasible option.
The IRR of Equity is 0,0% and the NPV of Equity is -4,3 MEUR, these two numbers should be
enough to put Scenario 1 aside.
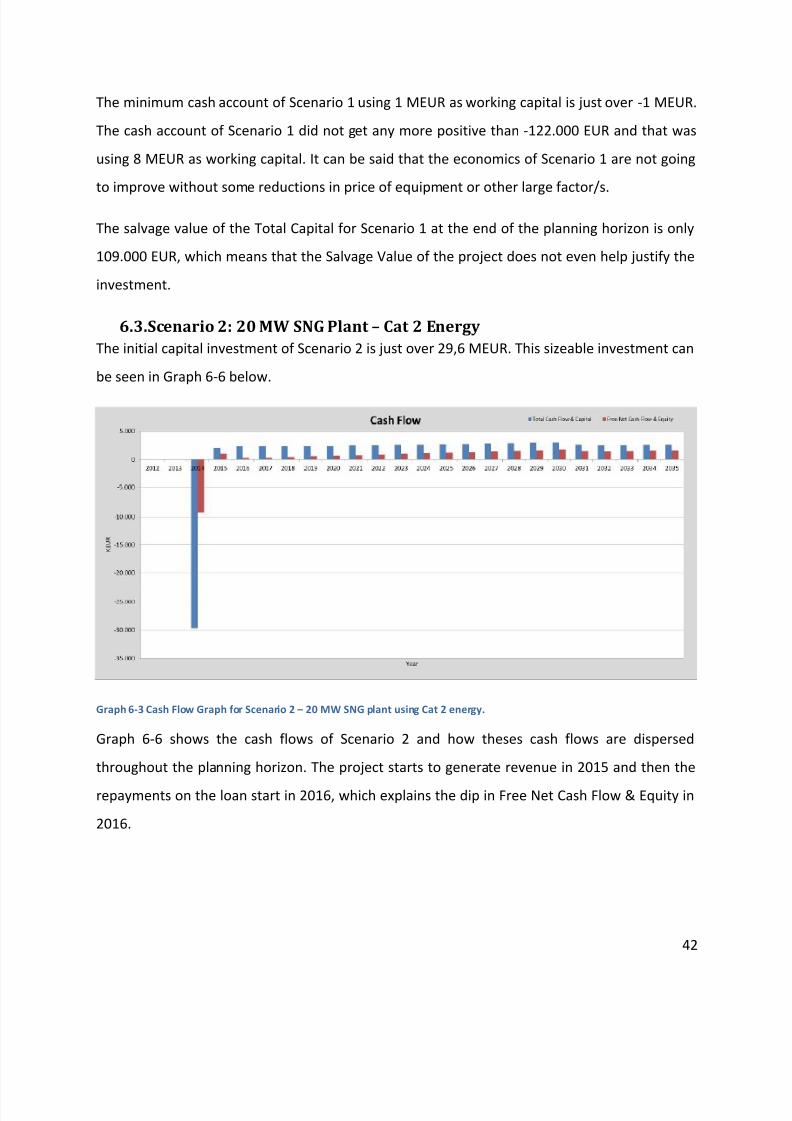
7/27/2019 Final Thesis - M.sc Sustainable Energy Science - Vignir Bjarnason
http://slidepdf.com/reader/full/final-thesis-msc-sustainable-energy-science-vignir-bjarnason 54/76
42
The minimum cash account of Scenario 1 using 1 MEUR as working capital is just over -1 MEUR.
The cash account of Scenario 1 did not get any more positive than -122.000 EUR and that was
using 8 MEUR as working capital. It can be said that the economics of Scenario 1 are not going
to improve without some reductions in price of equipment or other large factor/s.
The salvage value of the Total Capital for Scenario 1 at the end of the planning horizon is only
109.000 EUR, which means that the Salvage Value of the project does not even help justify the
investment.
6.3.Scenario 2: 20 MW SNG Plant – Cat 2 EnergyThe initial capital investment of Scenario 2 is just over 29,6 MEUR. This sizeable investment can
be seen in Graph 6-6 below.
Graph 6-3 Cash Flow Graph for Scenario 2 – 20 MW SNG plant using Cat 2 energy.
Graph 6-6 shows the cash flows of Scenario 2 and how theses cash flows are dispersed
throughout the planning horizon. The project starts to generate revenue in 2015 and then the
repayments on the loan start in 2016, which explains the dip in Free Net Cash Flow & Equity in
2016.
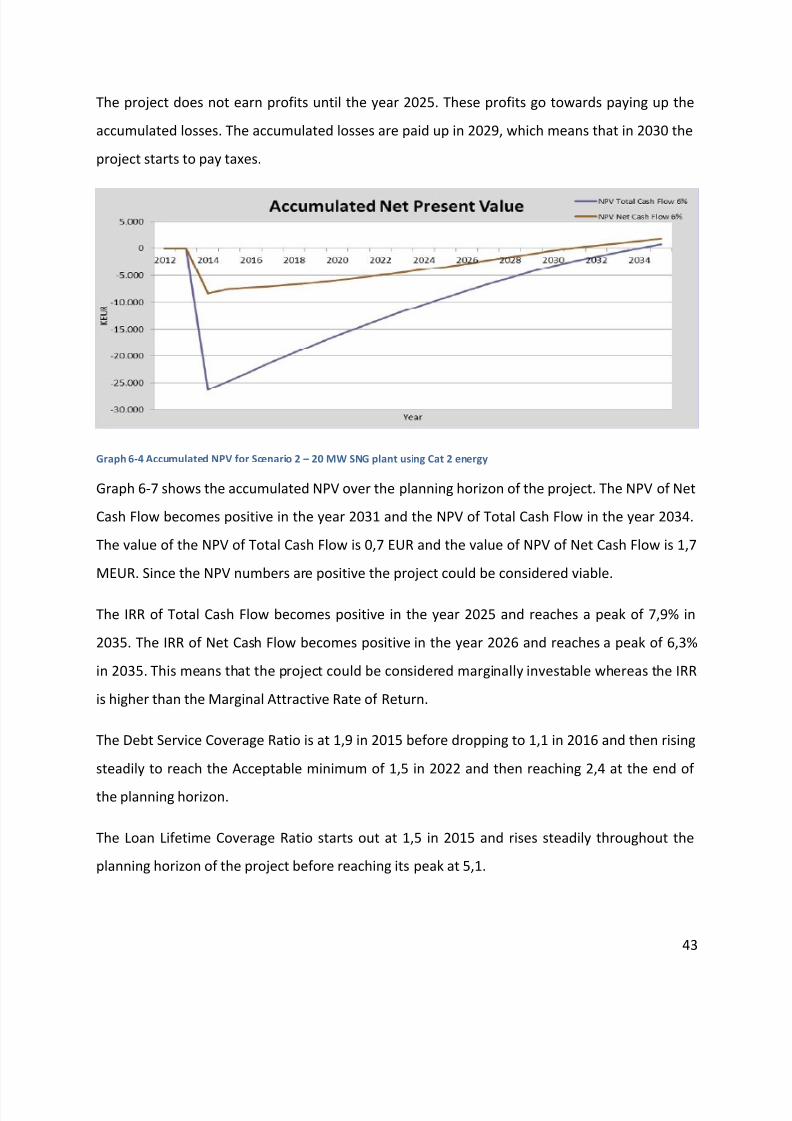
7/27/2019 Final Thesis - M.sc Sustainable Energy Science - Vignir Bjarnason
http://slidepdf.com/reader/full/final-thesis-msc-sustainable-energy-science-vignir-bjarnason 55/76
43
The project does not earn profits until the year 2025. These profits go towards paying up the
accumulated losses. The accumulated losses are paid up in 2029, which means that in 2030 the
project starts to pay taxes.
Graph 6-4 Accumulated NPV for Scenario 2 – 20 MW SNG plant using Cat 2 energy
Graph 6-7 shows the accumulated NPV over the planning horizon of the project. The NPV of Net
Cash Flow becomes positive in the year 2031 and the NPV of Total Cash Flow in the year 2034.
The value of the NPV of Total Cash Flow is 0,7 EUR and the value of NPV of Net Cash Flow is 1,7
MEUR. Since the NPV numbers are positive the project could be considered viable.
The IRR of Total Cash Flow becomes positive in the year 2025 and reaches a peak of 7,9% in
2035. The IRR of Net Cash Flow becomes positive in the year 2026 and reaches a peak of 6,3%
in 2035. This means that the project could be considered marginally investable whereas the IRR
is higher than the Marginal Attractive Rate of Return.
The Debt Service Coverage Ratio is at 1,9 in 2015 before dropping to 1,1 in 2016 and then rising
steadily to reach the Acceptable minimum of 1,5 in 2022 and then reaching 2,4 at the end of
the planning horizon.
The Loan Lifetime Coverage Ratio starts out at 1,5 in 2015 and rises steadily throughout the
planning horizon of the project before reaching its peak at 5,1.
7/27/2019 Final Thesis - M.sc Sustainable Energy Science - Vignir Bjarnason
http://slidepdf.com/reader/full/final-thesis-msc-sustainable-energy-science-vignir-bjarnason 56/76
44
The Liquid Current Ratio of Scenario 2 is very good so the project can be considered to have
good short term financial strength. The Liquid Current Ratio is at 0 in 2014 due to construction
and in 2015 it is 1,2 and covers the acceptable minimum in 2017 at 1,7 and reaches 27,8 at the
end of the planning horizon. The Net Current Ratio is the same as the Liquid Current Ratio
because there is no inventory buildup.
The Internal Value of Shares starts out at 1 and then slowly decreases to -0,8 in 2024 but rises
after that to peak at 2,6 in 2035. The ratio only reached the Acceptable Minimum of 1,5 in
2032.
The Capital Ratio starts out at 0,3 in 2014 and never exceeds the Acceptable Minimum of 1,5
during the planning horizon. The Capital Ratio is at 1 in at the end of the planning horizon.
6.3.1. Results – Scenario 2The IRR of Total and Net Cash Flows suggest that Scenario is marginally profitable. The same
can be said for the NPV of Total and Net Cash Flows. These figures suggest that Scenario is
profitable but only just so. The IRR is only slightly higher than the discount rate or MARR. The
Minimum Cash Account is at 85.000 EUR in 2014 and the Working Capital is at 500.000 EUR.
The Salvage Value of Total Cash Flow is 22,8 MEUR.
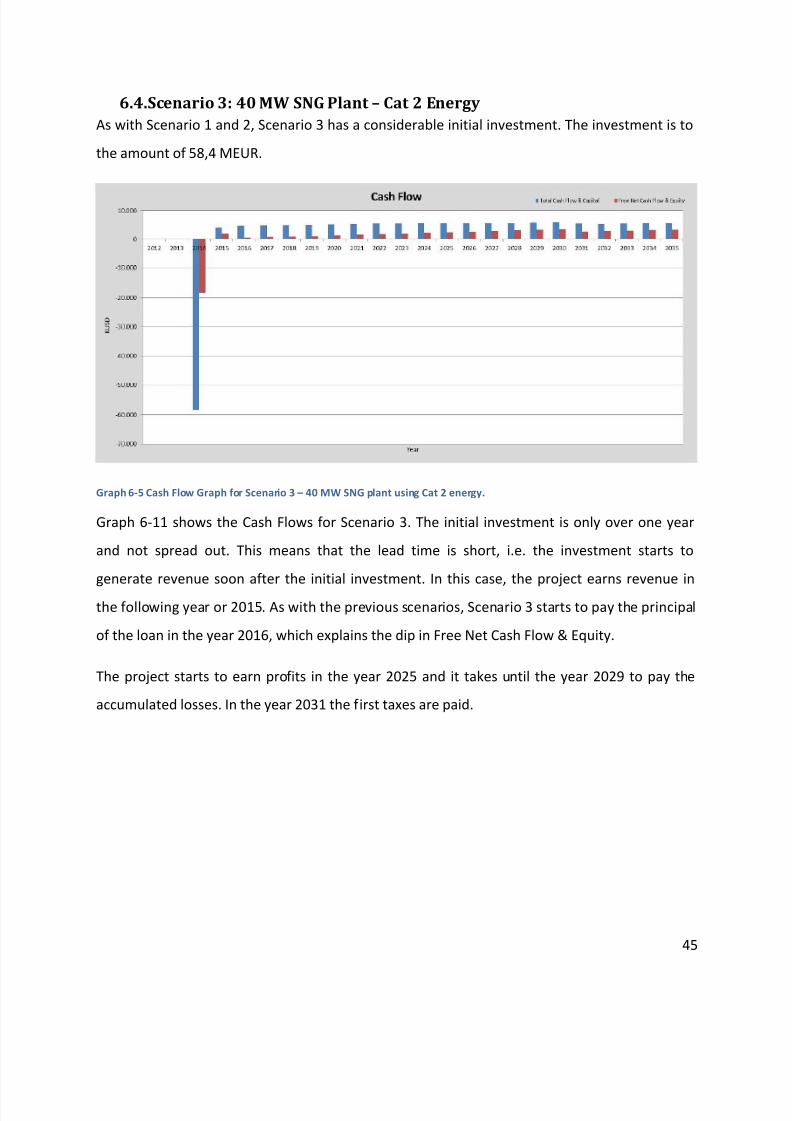
7/27/2019 Final Thesis - M.sc Sustainable Energy Science - Vignir Bjarnason
http://slidepdf.com/reader/full/final-thesis-msc-sustainable-energy-science-vignir-bjarnason 57/76
45
6.4.Scenario 3: 40 MW SNG Plant – Cat 2 EnergyAs with Scenario 1 and 2, Scenario 3 has a considerable initial investment. The investment is to
the amount of 58,4 MEUR.
Graph 6-5 Cash Flow Graph for Scenario 3 – 40 MW SNG plant using Cat 2 energy.
Graph 6-11 shows the Cash Flows for Scenario 3. The initial investment is only over one year
and not spread out. This means that the lead time is short, i.e. the investment starts to
generate revenue soon after the initial investment. In this case, the project earns revenue in
the following year or 2015. As with the previous scenarios, Scenario 3 starts to pay the principal
of the loan in the year 2016, which explains the dip in Free Net Cash Flow & Equity.
The project starts to earn profits in the year 2025 and it takes until the year 2029 to pay the
accumulated losses. In the year 2031 the first taxes are paid.
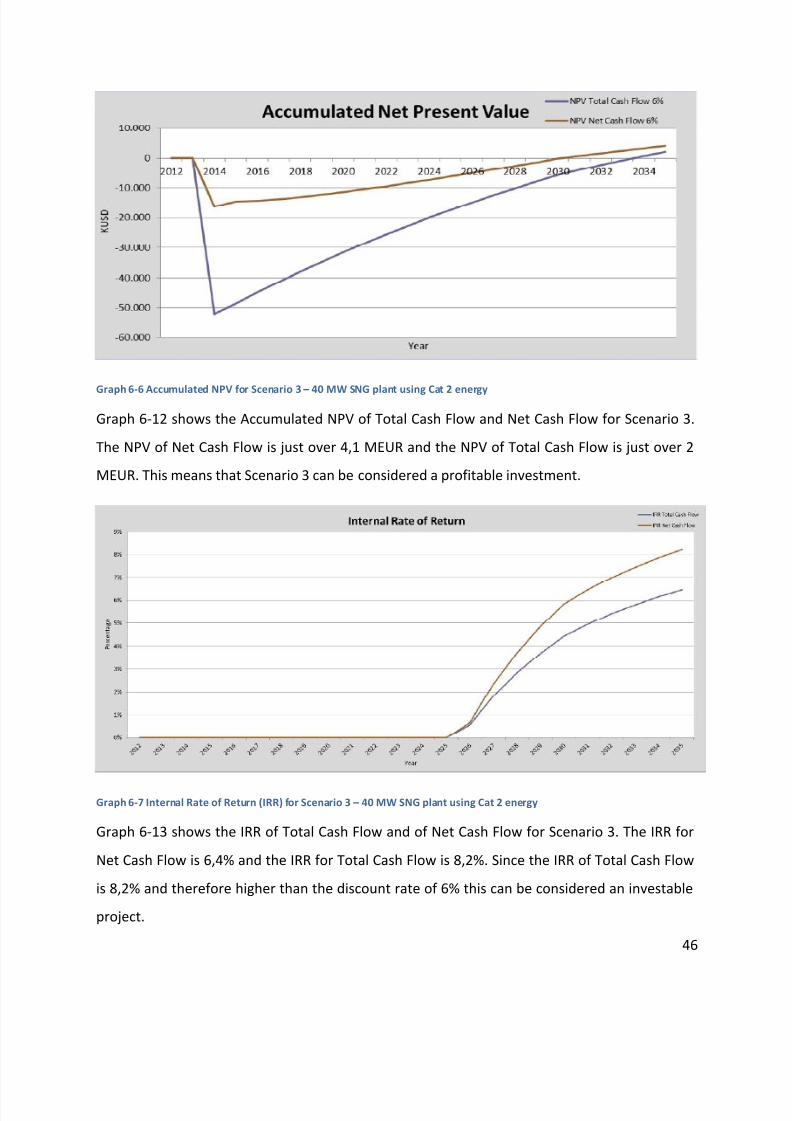
7/27/2019 Final Thesis - M.sc Sustainable Energy Science - Vignir Bjarnason
http://slidepdf.com/reader/full/final-thesis-msc-sustainable-energy-science-vignir-bjarnason 58/76
46
Graph 6-6 Accumulated NPV for Scenario 3 – 40 MW SNG plant using Cat 2 energy
Graph 6-12 shows the Accumulated NPV of Total Cash Flow and Net Cash Flow for Scenario 3.
The NPV of Net Cash Flow is just over 4,1 MEUR and the NPV of Total Cash Flow is just over 2
MEUR. This means that Scenario 3 can be considered a profitable investment.
Graph 6-7 Internal Rate of Return (IRR) for Scenario 3 – 40 MW SNG plant using Cat 2 energy
Graph 6-13 shows the IRR of Total Cash Flow and of Net Cash Flow for Scenario 3. The IRR for
Net Cash Flow is 6,4% and the IRR for Total Cash Flow is 8,2%. Since the IRR of Total Cash Flow
is 8,2% and therefore higher than the discount rate of 6% this can be considered an investable
project.
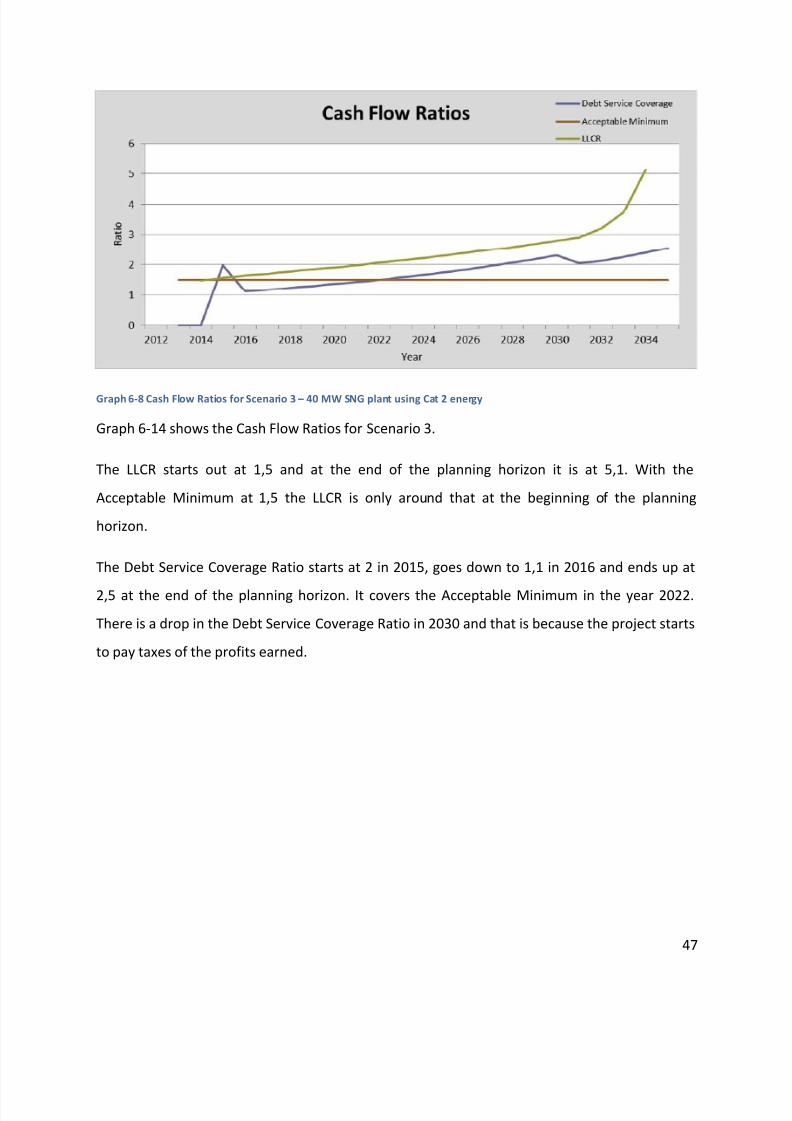
7/27/2019 Final Thesis - M.sc Sustainable Energy Science - Vignir Bjarnason
http://slidepdf.com/reader/full/final-thesis-msc-sustainable-energy-science-vignir-bjarnason 59/76
47
Graph 6-8 Cash Flow Ratios for Scenario 3 – 40 MW SNG plant using Cat 2 energy
Graph 6-14 shows the Cash Flow Ratios for Scenario 3.
The LLCR starts out at 1,5 and at the end of the planning horizon it is at 5,1. With the
Acceptable Minimum at 1,5 the LLCR is only around that at the beginning of the planning
horizon.
The Debt Service Coverage Ratio starts at 2 in 2015, goes down to 1,1 in 2016 and ends up at
2,5 at the end of the planning horizon. It covers the Acceptable Minimum in the year 2022.
There is a drop in the Debt Service Coverage Ratio in 2030 and that is because the project starts
to pay taxes of the profits earned.
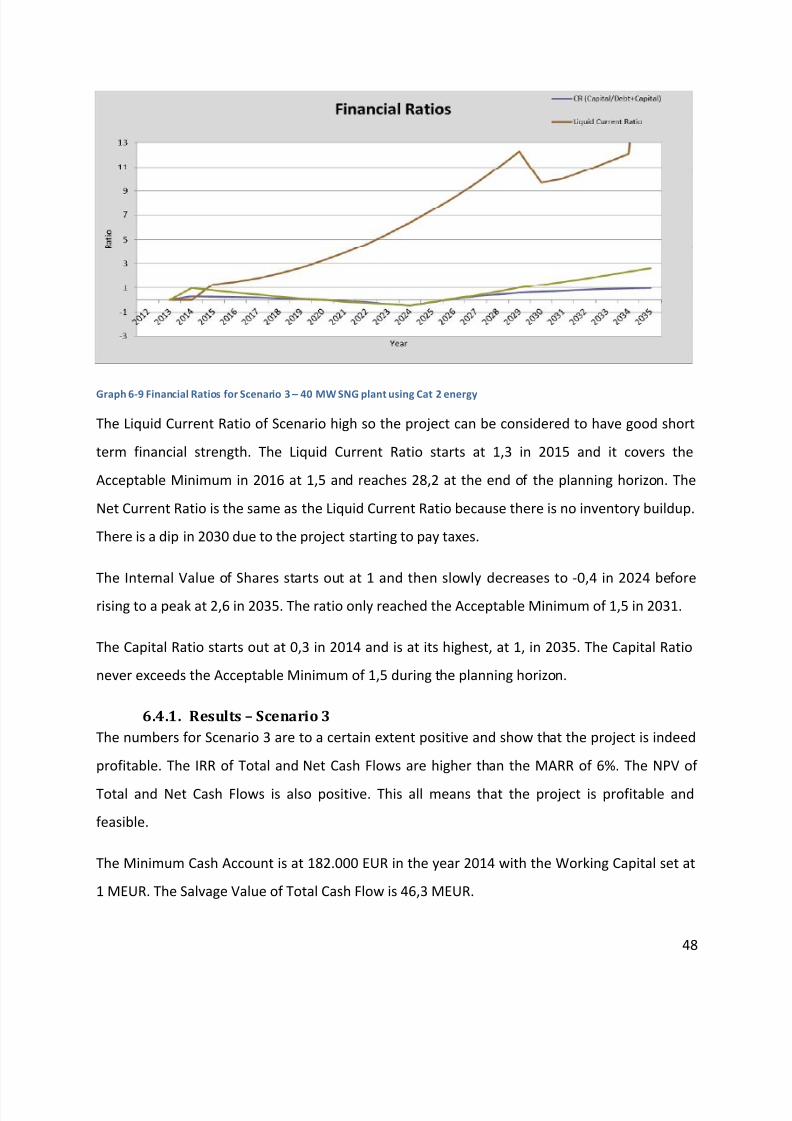
7/27/2019 Final Thesis - M.sc Sustainable Energy Science - Vignir Bjarnason
http://slidepdf.com/reader/full/final-thesis-msc-sustainable-energy-science-vignir-bjarnason 60/76
48
Graph 6-9 Financial Ratios for Scenario 3 – 40 MW SNG plant using Cat 2 energy
The Liquid Current Ratio of Scenario high so the project can be considered to have good short
term financial strength. The Liquid Current Ratio starts at 1,3 in 2015 and it covers the
Acceptable Minimum in 2016 at 1,5 and reaches 28,2 at the end of the planning horizon. The
Net Current Ratio is the same as the Liquid Current Ratio because there is no inventory buildup.
There is a dip in 2030 due to the project starting to pay taxes.
The Internal Value of Shares starts out at 1 and then slowly decreases to -0,4 in 2024 before
rising to a peak at 2,6 in 2035. The ratio only reached the Acceptable Minimum of 1,5 in 2031.
The Capital Ratio starts out at 0,3 in 2014 and is at its highest, at 1, in 2035. The Capital Ratio
never exceeds the Acceptable Minimum of 1,5 during the planning horizon.
6.4.1. Results – Scenario 3The numbers for Scenario 3 are to a certain extent positive and show that the project is indeed
profitable. The IRR of Total and Net Cash Flows are higher than the MARR of 6%. The NPV of
Total and Net Cash Flows is also positive. This all means that the project is profitable and
feasible.
The Minimum Cash Account is at 182.000 EUR in the year 2014 with the Working Capital set at
1 MEUR. The Salvage Value of Total Cash Flow is 46,3 MEUR.
7/27/2019 Final Thesis - M.sc Sustainable Energy Science - Vignir Bjarnason
http://slidepdf.com/reader/full/final-thesis-msc-sustainable-energy-science-vignir-bjarnason 61/76
49
6.5.Scenario 4, 5 And 6 – Using Cat 3 EnergyThe original idea behind this project was to use the unsecured energy or Category 3 energy of
Landsvirkjun. This energy is cheaper than both base load energy and surplus energy but with
much restricted delivery. The price of this energy is 1,7 ISK/Kwh or 0,01 EUR/Kwh. The
calculated available annual running time, according to information from Landsvirkjun, is 3.725
hours per year.
The numbers for Scenarios 1, 2 and 3 were put into the profitability model using the price of
energy and available annual running time of the Category 3 energy, the unsecured energy.
These scenarios are numbered as 4, 5 and 6 and use the cost of 5 MW, 20 MW and 40 MW,
respectively.
The objective is to figure out if the lower price of energy was enough to offset the limited
available running time.
In short, the answer is NO. The limited available running time costs much more in lost
production than the expenditure that is avoided with the lower energy price.
The scenarios were all calculated using the profitability model. The model results showed that
there was no way, using the Category 3 energy with the limited available running time, can be
considered feasible for any of the three scenarios.
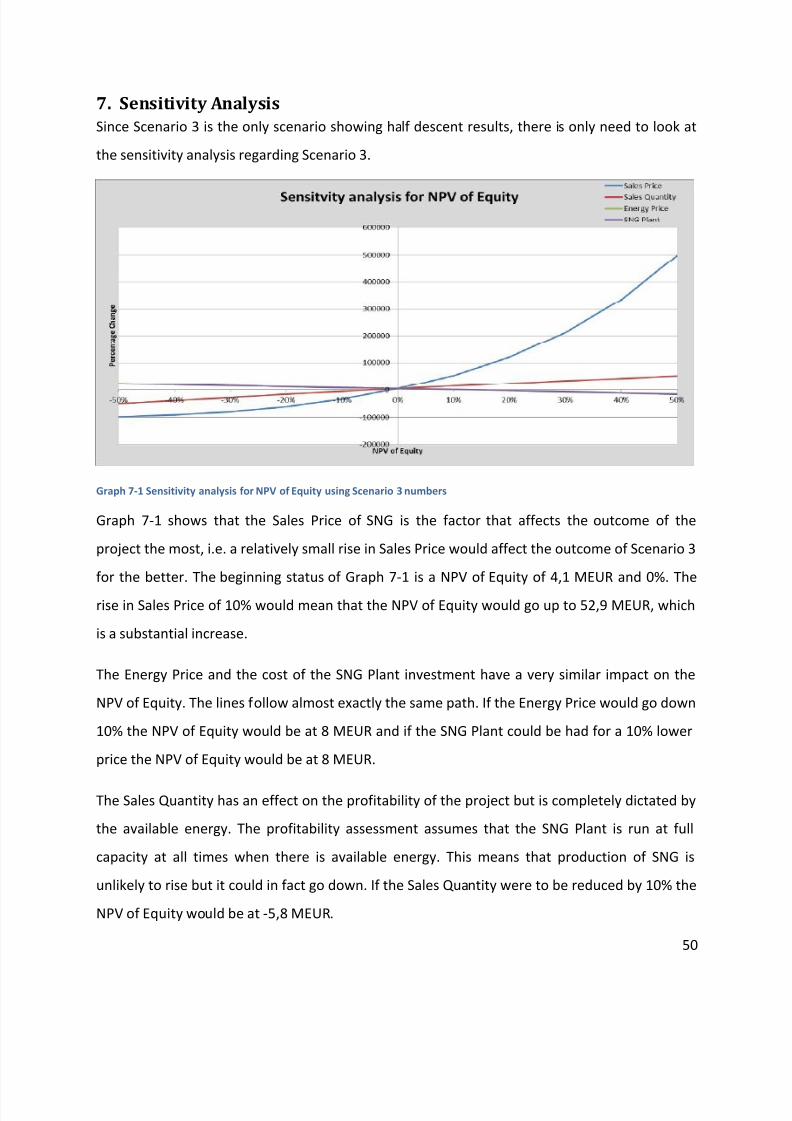
7/27/2019 Final Thesis - M.sc Sustainable Energy Science - Vignir Bjarnason
http://slidepdf.com/reader/full/final-thesis-msc-sustainable-energy-science-vignir-bjarnason 62/76
50
7. Sensitivity AnalysisSince Scenario 3 is the only scenario showing half descent results, there is only need to look at
the sensitivity analysis regarding Scenario 3.
Graph 7-1 Sensitivity analysis for NPV of Equity using Scenario 3 numbers
Graph 7-1 shows that the Sales Price of SNG is the factor that affects the outcome of the
project the most, i.e. a relatively small rise in Sales Price would affect the outcome of Scenario 3
for the better. The beginning status of Graph 7-1 is a NPV of Equity of 4,1 MEUR and 0%. The
rise in Sales Price of 10% would mean that the NPV of Equity would go up to 52,9 MEUR, which
is a substantial increase.
The Energy Price and the cost of the SNG Plant investment have a very similar impact on the
NPV of Equity. The lines follow almost exactly the same path. If the Energy Price would go down
10% the NPV of Equity would be at 8 MEUR and if the SNG Plant could be had for a 10% lower
price the NPV of Equity would be at 8 MEUR.
The Sales Quantity has an effect on the profitability of the project but is completely dictated by
the available energy. The profitability assessment assumes that the SNG Plant is run at full
capacity at all times when there is available energy. This means that production of SNG is
unlikely to rise but it could in fact go down. If the Sales Quantity were to be reduced by 10% the
NPV of Equity would be at -5,8 MEUR.
7/27/2019 Final Thesis - M.sc Sustainable Energy Science - Vignir Bjarnason
http://slidepdf.com/reader/full/final-thesis-msc-sustainable-energy-science-vignir-bjarnason 63/76
51
8. DiscussionThe idea of producing Substitute Natural Gas for domestic use in Iceland is very interesting and
after an extensive data collection and discussions with professionals, the result is that this is a
technically possible solution. There are however a few issues that have to be considered.
When reviewing the results of the profitability model from Scenarios 1, 2 and 3, it is apparent
that there is some economy of scale. The Scenarios get more profitable as the scope of the
projects get bigger. In fact, economy of scale is something that can be expected with large
industrial projects. From the cost quotes for the SNG plant this is obvious, the cost for a small
plant is about 800 EUR/Kwh higher than that of the larger plant.
The technology used for the production of SNG is in fact in the early stages of development and
needs to be proven at an industrial scale before the uncertainty of the project can be set aside.
Although the main concept of the Sabatier reaction process has been known for several
decades, there has not been any real development of the technology for industrial scale
synthetic fuel production until recent years. So, future developments of the technology might
make it more economical.
There is also the issue of greenhouse gases and the quotas on CO 2, which companies such as
Elkem will soon have to purchase to cover their own emissions. This could be an opportunity for
the production of SNG. Since the production of SNG requires a source of CO 2 for its production,
it could help reduce the emissions of industrial processes and minimize the need to buy the
emissions quotas. Instead of emitting CO2 into the atmosphere the gas would be used to
produce sustainable fuel. This could change the economic outlook of the SNG production.
The sensitivity analysis for the Sales Price of SNG shows that a relatively modest increase in
price could change the financial side of the project. So if the price of SNG could be raised from
the current 80 – 100 ISK/m3 the economics of the project could change significantly. The only
way however for the price to change is either by government subsidy or for the fossil fuel prices
to rise to allow the increase in price. Both these options are very uncertain and can’t be taken
for certain.
7/27/2019 Final Thesis - M.sc Sustainable Energy Science - Vignir Bjarnason
http://slidepdf.com/reader/full/final-thesis-msc-sustainable-energy-science-vignir-bjarnason 64/76
52
What also affects the outcome of the Scenarios is the fact that none of the suggested revenue
streams could be used aside from the sales of SNG. The additional revenue which could possibly
be generated from sales of O2, CO2 or waste heat could change the outcome significantly. The
problem with theses revenue streams is that, in Iceland, there is a limited market for them
today and that is probably not going to change in the near future.
Using the Category 3 energy as was planned at the start of the research proved to be very
difficult. This is mainly due to the limited annual availability of energy. The energy is only
available for around 5 months a year and that means that the big investment that goes into the
SNG plant, building and CO2 capture equipment is idle for 7 months out of the year. Scenarios 4,
5 and 6 were calculated by this criterion and did not show any positive financial signs.
Scenario 1 does not present a profitable or viable investment. Scenarios 2 and 3 show signs of
being profitable but only marginally and most likely they are not profitable enough to warrant
taking the inherent risk that comes with such a project. Scenarios 2 and 3 both show signs of
weakness through their Financial and Cash Flow Ratios.
The Financial and Cash Flow Ratios show signs of issues, which mean that even with a positive
IRR and NPV there still could be trouble. The Acceptable Minimum is there for a reason and
none of the ratios should be below the value of 1,5. But many of the ratios are under that for
most of the planning horizon or even the entire time. This suggests that the projects could have
trouble covering debt, financing operations etc. These inherent weaknesses make it difficult to
recommend investment.
7/27/2019 Final Thesis - M.sc Sustainable Energy Science - Vignir Bjarnason
http://slidepdf.com/reader/full/final-thesis-msc-sustainable-energy-science-vignir-bjarnason 65/76
53
9. ConclusionThe main goal of this research project was to find out whether or not there is a financial and
technological foundation for the production of SNG using the surplus energy generated by
Landsvirkjun. All the components of the system already exist. CO2 capture is a proven
technology that has been used in industry for many years. Substitute Natural Gas production is
also a technology that has existed for decades and is being developed for use in today’s energy
market.
The big issue is cost. The technology of SNG production is still in early stages of development
and therefore costs too much to be a viable solution to the problem posed in this research
project. With further development and refinement the viability of SNG production could change
for the better in the future.
Most of the methane produced in Iceland today is from municipal waste and the annual
production is in the range of 1,5 to 2 million m3 of gas (Hermannsson, 2012). The profitability
model came up with a marginally feasible result for the largest SNG production scenario,
Scenario 3. The SNG production quantity of Scenario 3 would increase today’s production of
methane gas by a factor of 9 or 10. This means that in order for Scenario 3 to be successful in
the real world the demand for SNG in Iceland would have to increase dramatically.
Iceland relies on fossil fuel imports to satisfy the needs of its transportation and fishing fleet.
Since SNG can be used as fuel for most internal combustion engines, it could change Iceland’s
dependency on fossil fuel imports. There is however a problem with infrastructure. There are
only two filling stations for methane gas in Iceland. One filling station is in Reykjavik and one
under construction in Akureyri (Hermannsson, 2012).
These are real world problems which could be solved with some determination and the will of
the Government in Iceland. These problems stem from the small size of the Icelandic market.
Although the proposed solution has problems, Iceland being able to produce “Green” fuel for
its domestic market is still an exciting prospect. The benefits of this kind of production are many
and include a decreased dependency on fossil fuel imports, potentially reduced exchange
7/27/2019 Final Thesis - M.sc Sustainable Energy Science - Vignir Bjarnason
http://slidepdf.com/reader/full/final-thesis-msc-sustainable-energy-science-vignir-bjarnason 66/76
54
deficit with foreign countries and increased domestic industrial production promoting work for
Icelanders.
With SNG also being produced using captured CO2 and renewable energy, it would not
contribute to global warming and would be counted as zero emission fuel. The introduction of a
domestically produced fuel could mean big changes in the economy of Iceland as well as
improving its “Green” image.
The questions posed in this research project have been answered. It is technologically possible
to produce SNG using surplus energy. It is however, at best, marginally profitable in the current
economic climate.
7/27/2019 Final Thesis - M.sc Sustainable Energy Science - Vignir Bjarnason
http://slidepdf.com/reader/full/final-thesis-msc-sustainable-energy-science-vignir-bjarnason 67/76
55
BibliographyInterviews
Björnsson, G. (2012, November 15). Manager of Technical Department at Landsvirkjun. (V.
Bjarnason, Interviewer)
Hannesson, Þ. (2012, November 20). Head of Development, ELKEM. (V. Bjarnason, Interviewer)
Hermannsson, D. (2012, October 17). CEO of Metanorka. (V. Bjarnason, Interviewer)
Rafnsson, G. K. (2012, December 4). Vice President of Isaga, Industrial Gases. (V. Bjarnason,
Interviewer)
Rieke, S. (2012). Engineer at SolarFuel Gmbh. (V. Bjarnason, Interviewer)
Þorfinnsson, G. (2012, November 30). Construction Architect. (V. Bjarnason, Interviewer)
Literature
Ali-Oettinger, S. (2012, October 4). Aster Capital leads financing round for SolarFuel. PV
magazine.
BP Statistics. (2012). BP Statistical Review of World Energy June 2012. BP.
Ch. Breyer, S. R. (2011). Hybrid PV-Wind-Renewable Methane Powerplants - A potential
cornerstone of global energy supply. Kassel, Germany: Fraunhofer IWES, SolarFuel
Gmbh, Universitat Kassel, Q-Cells SE, Reiner Lemoine Institut Gmbh.
Dan G. Chapel, C. L. (1999). Recovery of CO2 from Flue Gases: Commercial Trends. Saskatoon,
Canada: Canadian Society of Chemical Engineers.
European Commission. (2011). Screening report - Iceland, Chapter 15 - Energy. Brussels:
European Commission.
Haraldsson, T. Þ. (2002). Vorfundur - Samorka. (p. 10). Rarik - Samorka.
Howard Herzog, J. D. (2004). The Cost of Carbon Capture. Cambridge, MA, USA: Massachusetts
Institute of Technology, MIT.
IPCC, B. M. (2007). Contribution of Working Group III to the Fourth Assessment Report of the
Intergovernmental Panel on Climate Change. Cambridge, United Kingdom and New
York, NY, USA: Cambridge University Press.
Lichtenberg, S. (2000). Proactive Management of uncertainty using the Successive Principle.
Copenhagen, Denmark: Polyteknisk Press.
7/27/2019 Final Thesis - M.sc Sustainable Energy Science - Vignir Bjarnason
http://slidepdf.com/reader/full/final-thesis-msc-sustainable-energy-science-vignir-bjarnason 68/76
56
M. Mozaffarin, R. W. (2004). "Green Gas" as SNG, A Renewable Fuel With Conventional Quality.
Pette, The Netherlands: Energy research centre of the Netherlands, ECN.
Manya Ranjan, H. J. (2011). Feasibility of air capture. Cambridge MA, USA: Elsevier ltd.
Rieke, S. (2012). Power-to-gas technology-the missing link in renewable energy systems. Berlin:Ecosummit.
Sarah M. Forbes, P. V. (2008). CCS Guidelines - Guidelines for Carbon Dioxide Capture, Transport
and Storage. Washington DC, USA: World Resources Institute.
Satish Reddy, D. J. (2008). Fluor's Econamine FG Plus(SM) Technology For CO2 Capture at Coal-
fired Power Plants. Baltimore, USA: Power Plant Air Pollutant Control "Mega"
Symposium.
Sterner, M. (2009). Bioenergy and renewable power methane in integrated 100% renewable
energy systems. Kassel, Germany: Kassel University Press.
Ter-Gazarian, A. (2011). Energy Storage for Power Systems 2nd Ed. London, United Kingdom:
The Institution of Engineering and Technology.
Tzimas, E. (2009). The Cost of Carbon Capture and Storage, Demonstration Projects in Europe.
Petten, The Netherlands: European Commission - JRC Scientific and Technical Reports.
Websites
Econamine FG Plus Process. (2012, November 14). Retrieved from Fluor Corporation Web site:http://www.fluor.com/econamine/Pages/efgprocess.aspx
Google Maps, Google Corporation. (2012, November 23). Retrieved from Google Maps website:
https://maps.google.com/
OECD.StatExtracts. (2012, December 7). Retrieved from CPI indices: http://stats.oecd.org/
Hagstofa Íslands. (2012, December 11). Vefur Hagstofu Íslands. Retrieved from Hagstofa
Íslands: http://www.hagstofa.is
The National Energy Authority. (2012, September 24). Primary energy use: The National Energy Authority . Retrieved from The National Energy Authority Web site:
http://www.nea.is/the-national-energy-authority/energy-statistics/primary-energy/
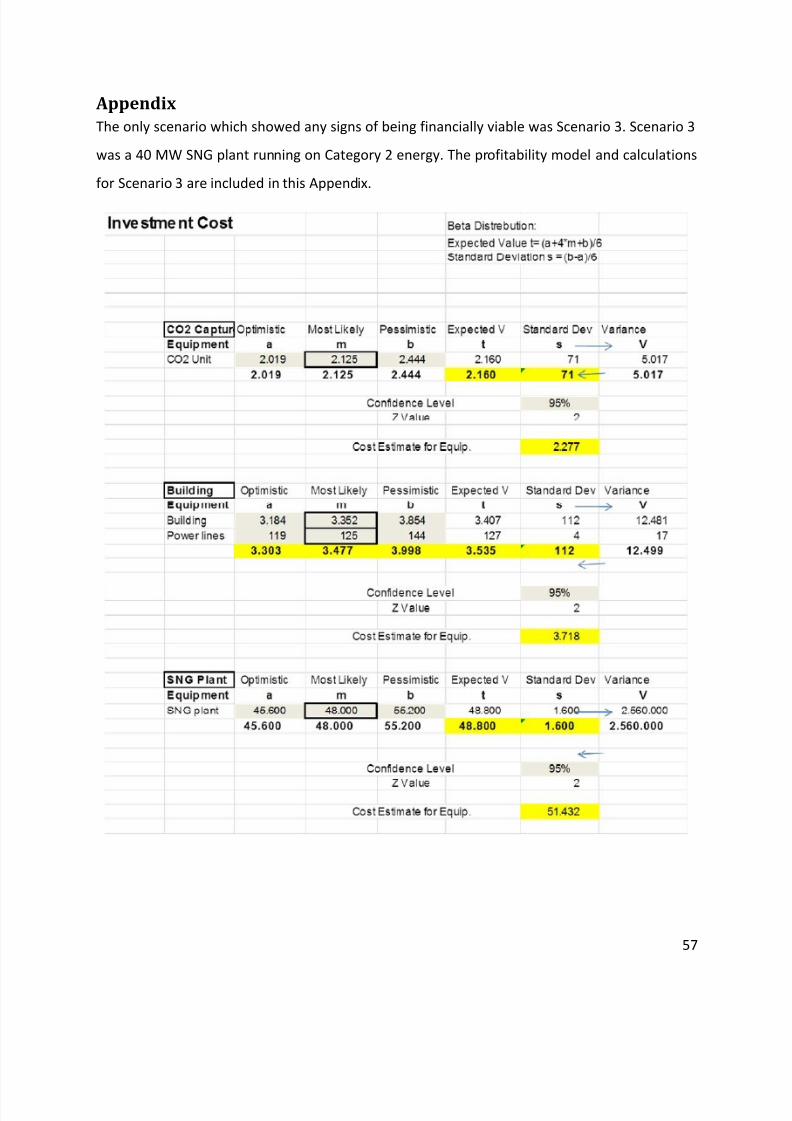
7/27/2019 Final Thesis - M.sc Sustainable Energy Science - Vignir Bjarnason
http://slidepdf.com/reader/full/final-thesis-msc-sustainable-energy-science-vignir-bjarnason 69/76
57
AppendixThe only scenario which showed any signs of being financially viable was Scenario 3. Scenario 3
was a 40 MW SNG plant running on Category 2 energy. The profitability model and calculations
for Scenario 3 are included in this Appendix.
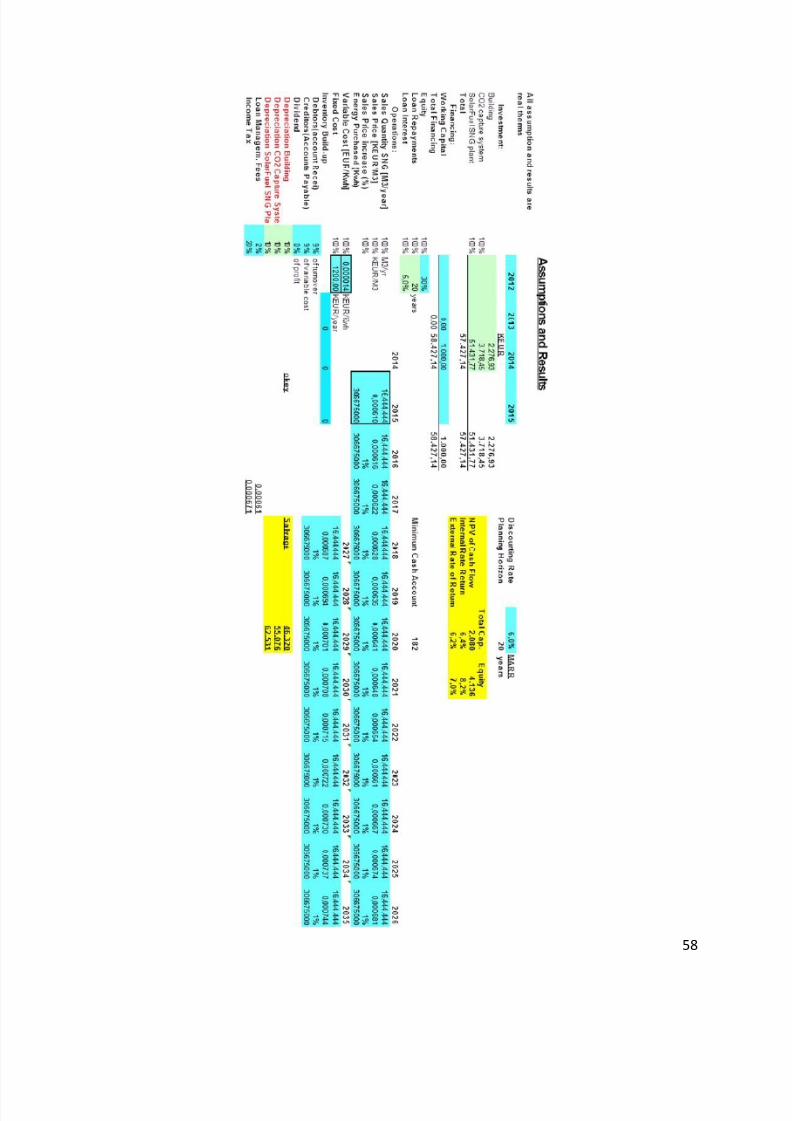
7/27/2019 Final Thesis - M.sc Sustainable Energy Science - Vignir Bjarnason
http://slidepdf.com/reader/full/final-thesis-msc-sustainable-energy-science-vignir-bjarnason 70/76
58
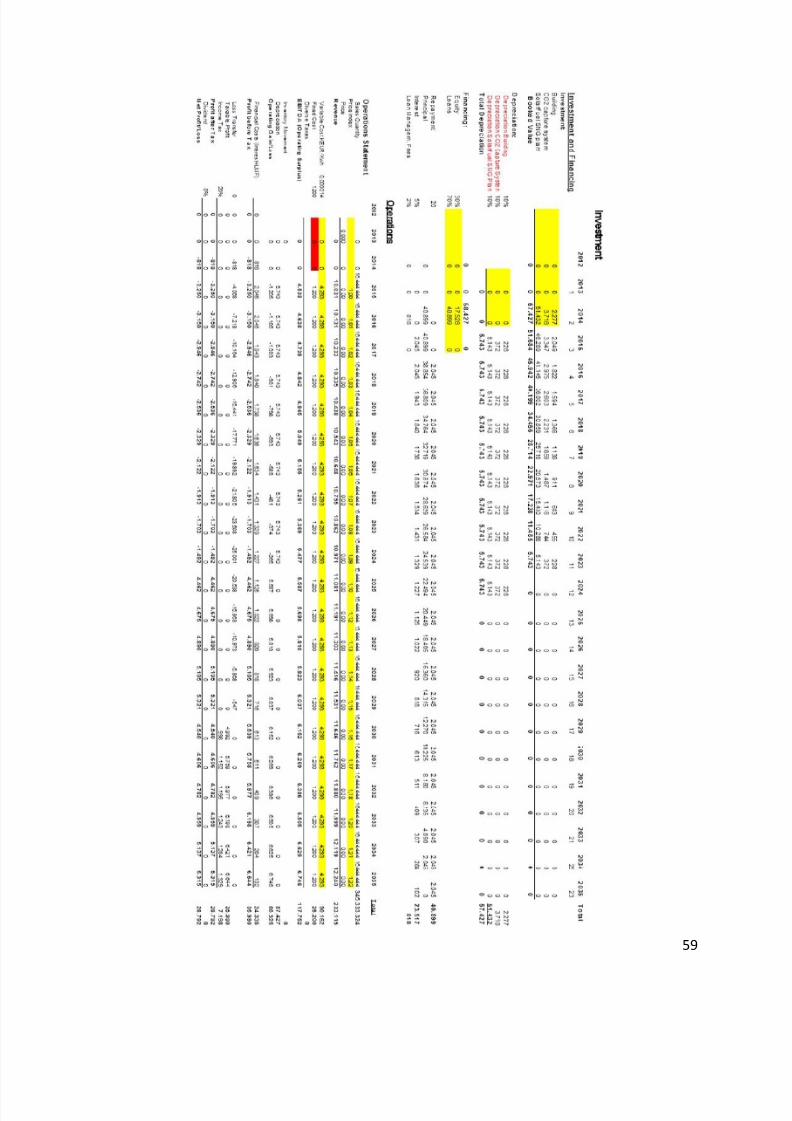
7/27/2019 Final Thesis - M.sc Sustainable Energy Science - Vignir Bjarnason
http://slidepdf.com/reader/full/final-thesis-msc-sustainable-energy-science-vignir-bjarnason 71/76
59
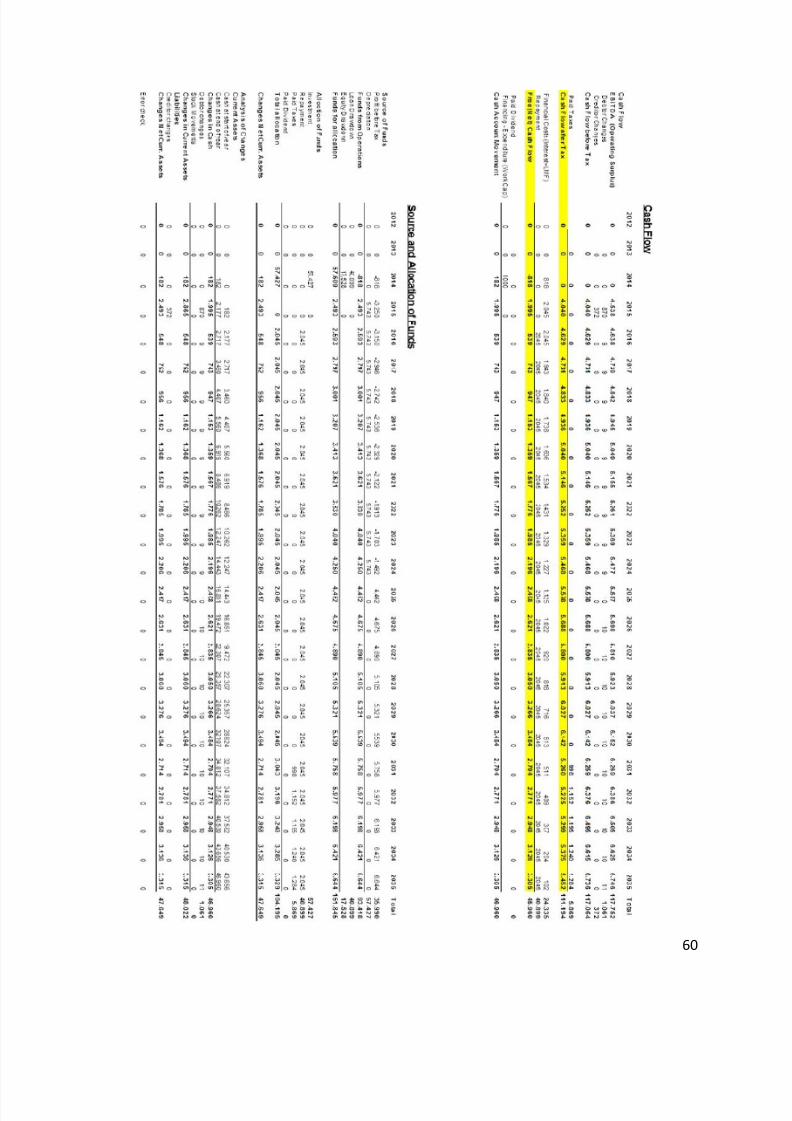
7/27/2019 Final Thesis - M.sc Sustainable Energy Science - Vignir Bjarnason
http://slidepdf.com/reader/full/final-thesis-msc-sustainable-energy-science-vignir-bjarnason 72/76
60
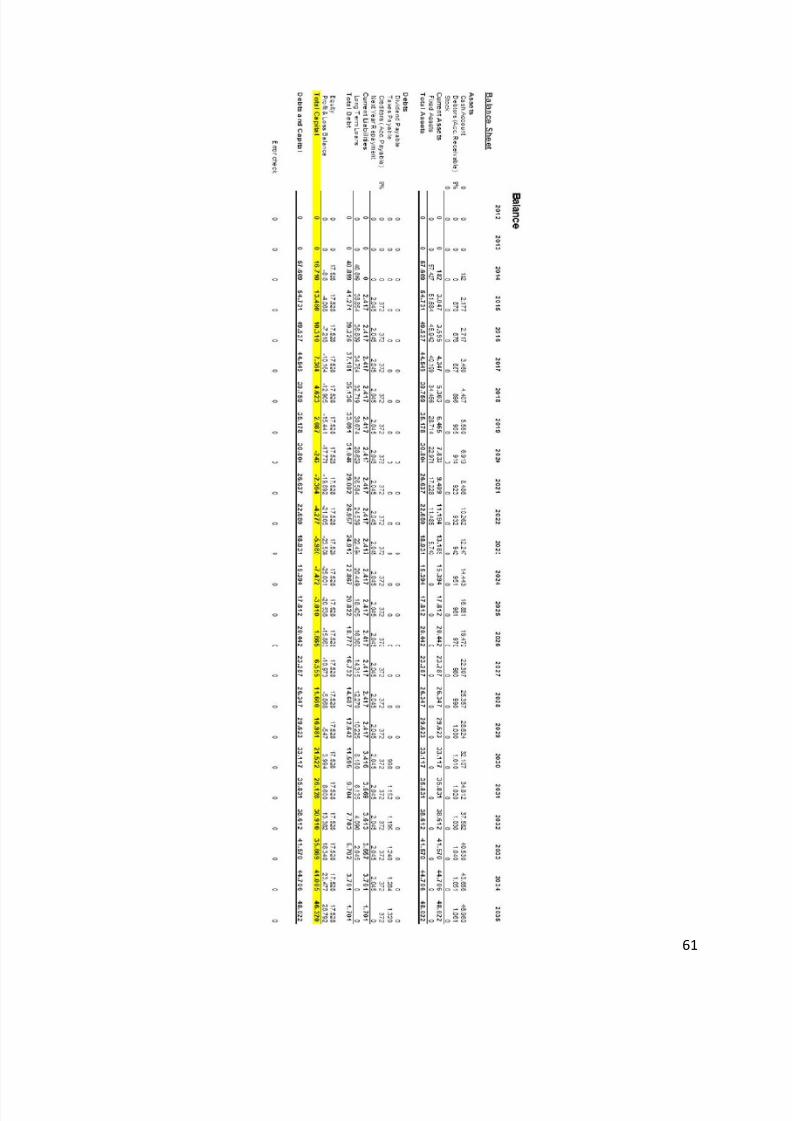
7/27/2019 Final Thesis - M.sc Sustainable Energy Science - Vignir Bjarnason
http://slidepdf.com/reader/full/final-thesis-msc-sustainable-energy-science-vignir-bjarnason 73/76
61
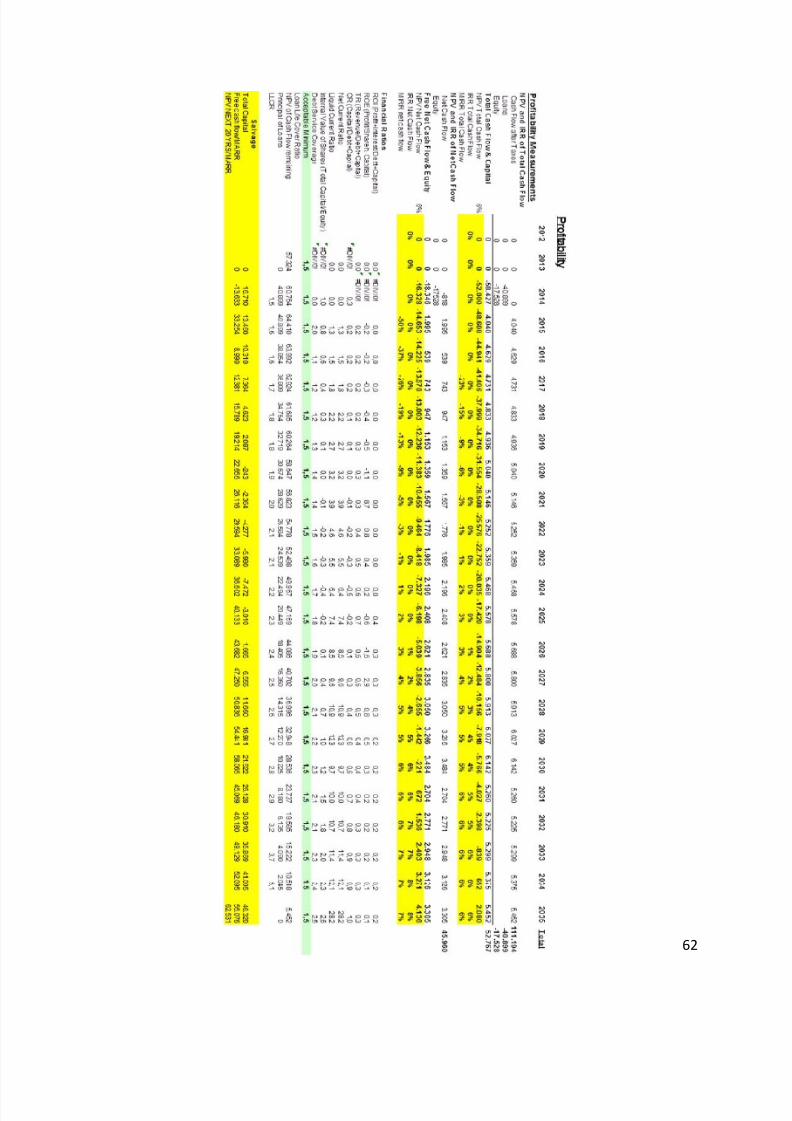
7/27/2019 Final Thesis - M.sc Sustainable Energy Science - Vignir Bjarnason
http://slidepdf.com/reader/full/final-thesis-msc-sustainable-energy-science-vignir-bjarnason 74/76
62
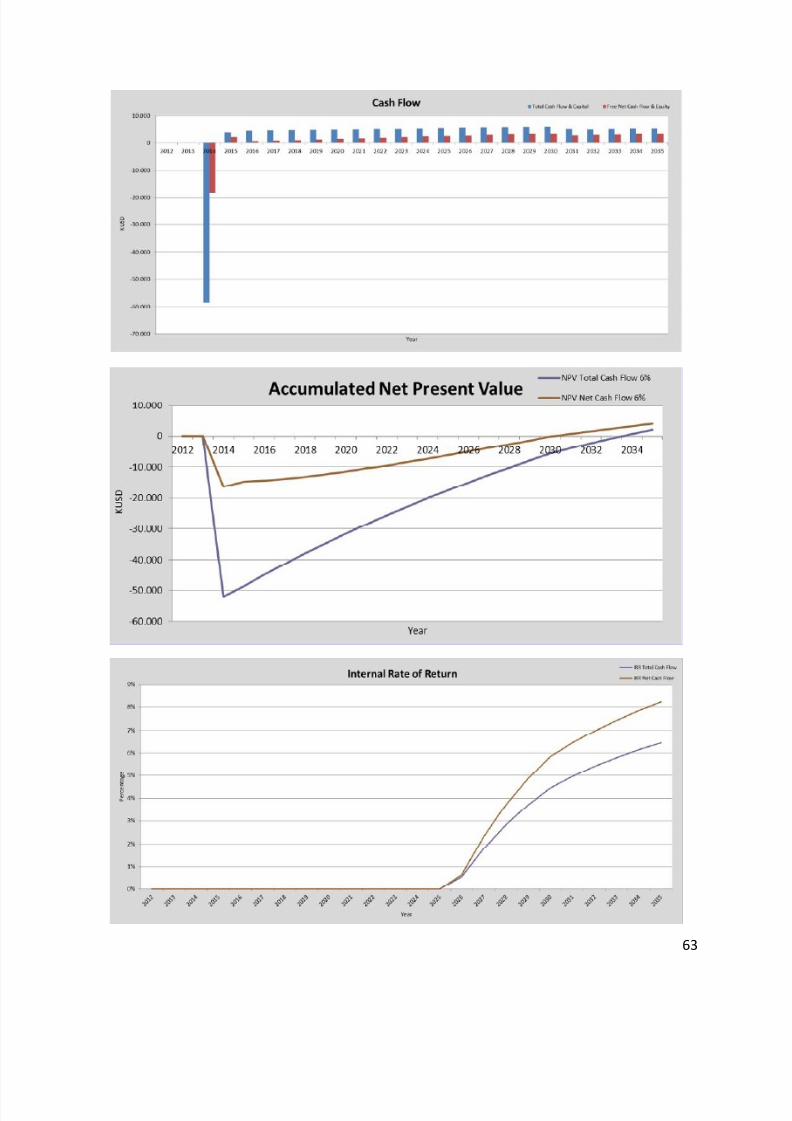
7/27/2019 Final Thesis - M.sc Sustainable Energy Science - Vignir Bjarnason
http://slidepdf.com/reader/full/final-thesis-msc-sustainable-energy-science-vignir-bjarnason 75/76
63
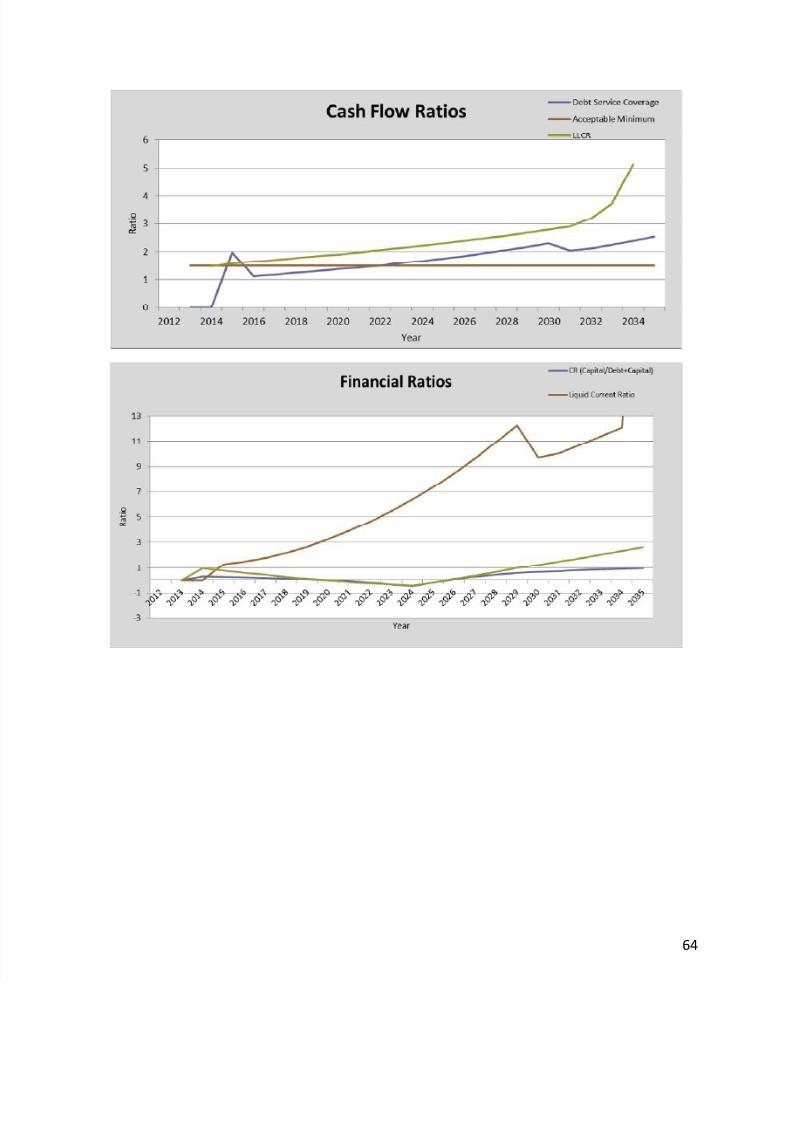
7/27/2019 Final Thesis - M.sc Sustainable Energy Science - Vignir Bjarnason
http://slidepdf.com/reader/full/final-thesis-msc-sustainable-energy-science-vignir-bjarnason 76/76