final report - toronto · final report june 2013 . ... divisions and agencies and applied a core...
TRANSCRIPT

Appendix C
A Service and Organizational Study of Toronto's Emergency Medical Services and Fire Services
Final Report
June 2013

Service Efficiency Review – Toronto Fire Services & Toronto EMS
Page | 1
Table of Contents
1.0 Introduction .................................................................................................................... 3
1.1 Background ......................................................................................................................................... 3
1.2 Project Overview ................................................................................................................................. 4
1.3 Project Methodology .......................................................................................................................... 6
2.0 Toronto Fire Services ....................................................................................................... 9
2.1 An Introduction to Fire Services .......................................................................................................... 9
2.2 Fire Services Data and Statistics........................................................................................................ 17
2.3 Demographics and Fire Related Civilian Injury & Death Statistics .................................................... 37
2.4 Fire Services Staff and Apparatus Requirements .............................................................................. 40
2.5 Fire Service Risk and Mitigation ........................................................................................................ 53
3.0 Toronto Emergency Medical Services ............................................................................. 64
3.1 Advanced Life Support and Advanced Care Paramedics in EMS ...................................................... 64
3.2 Ambulance Offload Time Review across Toronto Hospitals ............................................................. 74
3.3 TEMS Staffing Demand Analysis........................................................................................................ 78
4.0 Consolidated FIRE-EMS Models .................................................................................... 102
4.1 Consolidating TFS and TEMS ........................................................................................................... 102
4.2 The History of Firefighter Response to Medical Events in Ontario................................................. 104
4.3 Firefighters as Paramedics .............................................................................................................. 105
4.4 Legislation and other Factors Affecting EMS and Fire Operational Consolidation ......................... 109
4.5 Firefighter Paramedic Models ......................................................................................................... 113
4.6 Goal of a first responder system ..................................................................................................... 121
4.7 Organizational Analyses of TFS and TEMS ...................................................................................... 130
5.0 Consolidation of Communication Centres ..................................................................... 166
6.0 Jurisdictional Comparison ............................................................................................ 190
7.0 Culture and Change ...................................................................................................... 196

Service Efficiency Review – Toronto Fire Services & Toronto EMS
Page | 2
Appendices ....................................................................................................................... 199
Appendix A – Detailed Jurisdictional Comparison ................................................................................ 200
Appendix B - Assignments and Resources Required at Fire Incidents .................................................. 230
Appendix C – TFS Unit Chart ................................................................................................................. 235
Appendix D – Relationship in volume and percentage, between ‘All Incidents’, ‘Medical Incidents’,
‘False Alarms’, and ‘Fires’, by station response area ............................................................................ 240
Appendix E – Response Times by Fire Station ...................................................................................... 243
Appendix F – Maps Indicating Demographics and Fire Related Civilian Injury & Death ...................... 248
Appendix G – Risk – High Level Overview ............................................................................................. 249
Appendix H – An Examination of Ambulance Offload Times at Hospitals ............................................ 264
Appendix I – TEMS Staffing Analysis Supporting Documentation – 10 Minute Travel Time Target (Not
including 2 Minute Call Taking and Dispatch Time) .............................................................................. 277
Appendix J – TEMS Staffing Analysis Supporting Documentation – 8 Minute 59 Second Response
Target .................................................................................................................................................... 286
Appendix K – Case Study: United Kingdom ........................................................................................... 295
Appendix L – Research Articles ............................................................................................................. 300
Appendix M – Team Background .......................................................................................................... 315

Service Efficiency Review – Toronto Fire Services & Toronto EMS
Page | 3
1.0 Introduction
1.1 Background
In April of 2011, City Council considered a report from the City Manager and Deputy City Manager/Chief Financial Officer regarding the initiation of a Service Review Program, which was intended to help mitigate the 2012 Operating Outlook Pressure and, in the longer term, contribute to resolving the City’s structural deficit.
The Service Review Program includes three key components: A Core Service Review that examines what services the City delivers and at what level; Service Efficiency Studies that examine how the City delivers its services; and A User Fee Review that examines the City’s fees to determine the extent to which they
are fair, and collect the full service cost. KPMG LLP was retained by the City Manager to assist with the Core Service Review which: Reviewed and analyzed all City services, activities and service levels provided by
divisions and agencies and applied a core service filter to services; Identified which services are provided at higher than standard service level;
Conducted a jurisdictional review of comparable municipalities and jurisdictions; and Identified options and opportunities to change services and service levels.
KPMG conducted a core service filter assessment which ranked services by the following categories: Mandatory: required by legislation; Essential: critical to operation of the City; Traditional: provided by virtually all large municipalities for many years; and Other/Discretionary: provided by the City to respond to particular community needs.
KPMG also put forward options and opportunities for the City’s consideration to change services and service levels, provided preliminary information on risks and implications of making these changes and potential timelines for implementation, and provided a high level order of magnitude of potential savings for each opportunity. The opportunities identified through the Core Services Review related to Toronto Emergency Medical Services (TEMS) included: Consider outsourcing some or all of non-emergency inter-facility patient transports Consider eliminating Community Medicine activities. Consider integrating TEMS and TFS organizationally and developing new models to shift
more resources to TEMS response over time.

Service Efficiency Review – Toronto Fire Services & Toronto EMS
Page | 4
The opportunities identified through the Core Services Review related to Toronto Fire Services
(TFS) included: Consider reducing the range of medical calls to which the fire department responds. Consider integrating TEMS and TFS organizationally and developing new models to shift
more resources to TEMS response and less to TFS response over time. Consider the opportunities to improve fire response times and decrease equipment
requirements through dynamic staging. City Council's Executive Committee referred the KPMG opportunities with respect to TEMS and TFS to the City Manager for inclusion in broader service and organizational studies to be reported to Standing Committee and City Council as required.
1.2 Project Overview
The project objective and deliverables were inclusive of the following activities:
A) Documenting and assessing the current operations of TEMS & TFS, including but not limited to:
An analysis of service demand and required resource levels projected through to 2022 taking into consideration public safety performance (such as response times and service levels), demographics, population, traffic, built form, legislative and health and safety
requirements.
Conducting a scientific and academic literature review that identifies industry best practices, emerging challenges and risks that should guide service delivery.
Conducting a scan to identify potential immediate (2012/2013) operational efficiencies considering a range of strategies such as business process re-engineering, outsourcing or alternative service delivery, automation, shared services and service innovation that may result in cost savings.
Identifying estimated high level savings, implementation costs and timeframes of
operational efficiencies and potential risks and implications, including, for example, impacts on service delivery, impacts that are cross-divisional or enterprise-wide and
other effects of proposed changes. B) Conducting an evaluation and analysis of comparable Canadian, American and international jurisdictions to identify a full range of service delivery model options.
Identifying comparator jurisdictions, taking into account scale, population density, complexity, legislative context, economic and social factors, organizational mandates, funding mechanisms including fee-for-service billing, maturity of the service delivery model, and other relevant governance, organizational, and service attributes.
The final list of comparator jurisdictions was approved by the City of Toronto as part of
the study work plan and during the mid-range timeline of the project.

Service Efficiency Review – Toronto Fire Services & Toronto EMS
Page | 5
C) Proposing service delivery and organizational model options that optimize efficiencies
while ensuring service effectiveness. This objective included comparing the proposed models to the current service delivery models and describing the relative advantages and disadvantages of each, including an analysis of:
Key model features including structure, reporting in the City administration, staffing requirements and service delivery attributes;
Comprehensive health and safety risk assessment to consider the impact of proposed service delivery changes on staff and public safety;
Consideration of service delivery models which use resources most efficiently and eliminate or explicitly minimize duplication with respect to responding to medical calls;
Strengths, limitations and challenges including potential implications with respect to service delivery, incident and patient outcomes, funding, collective agreements, wages and pension adjustments;
Organizational cultural impacts, risks to operational and organizational success, and benefits to the City;
Potential risks and mitigation strategies;
Short and long-term training and certification costs if applicable, including wages equipment, tuition, and instructor costs;
Legislative and funding requirements;
Estimated order of magnitude cost savings for 2013 and future years;
Detailed implementation work plan, timelines and estimated implementation costs including phased implementation if appropriate;
The number and locations of fire and EMS stations particularly with respect to the proposed service delivery and organizational model options
Consideration of station requirements including short, medium and long term capital priorities to implement station retrofits if applicable; and
Estimated short, medium and long term operating and capital investments if required.
Areas outside of the scope for the study were:
1. Examining the facilities management, real estate and fleet functions in TEMS & TFS.
2. The Toronto Police Service contribution to the Tiered Emergency Response Agreement.
3. The response time target of 90% was not subject to review as part of this study1. However, travel time was considered in the context of the scientific and academic literature review, the evaluation and analysis of comparable jurisdictions and proposed service delivery and organizational model options, including a comprehensive health and safety risk assessment to consider the impact of any proposed changes on staff and
1 The veracity of 90th percentile fire and EMS targets was not examined as a separate subject. However, there was a necessity to use 90th percentile parameters, either identified by the city or based upon scientific literature, as one of the parameters to determine resource requirements.

Service Efficiency Review – Toronto Fire Services & Toronto EMS
Page | 6
public safety; implications with respect to service delivery and incident and patient
outcomes; potential risks and mitigation strategies; and an assessment of liability issues.
1.3 Project Methodology
Our approach to Toronto’s fire and EMS project was not unlike that of similar projects conducted by other consultant teams, or the techniques that would be used by other consulting companies, except for the magnitude of the assignment and detail with which the data was examined.
The project process included:
Key informant Interviews;
Site visits;
Review and assessment of organizational and staffing models;
Research and analysis of best practices and service delivery models;
Data collection and analysis;
Resource and apparatus modelling;
Fire sub-risk overview;
Concept development and analysis; and
Jurisdiction and literature review.
Interviews
Our interviews included departmental representatives, Fire and EMS Chiefs, Deputies, Divisional Chiefs and other ranks at TFS and TEMS. Interviews and orientations within the fire and EMS departments took place to discuss organizational perspectives, and position roles and responsibilities. The consulting team also conducted interviews with other City divisions to garner a wider understanding of TFS and TEMS and their context within the overall corporate organization.
TFS TEMS Other City Divisions
Policy, Project and Public Information
Special Projects and Emergency Planning
Fire Protection and Public Education
Communications Centre
Staff Services
Operations Division
Information and Communication Systems
Communications Centre
Program Development and Service Quality
Operational Support
Operations
Policy and Project Management
Community Medicine
Public Information and Media
Office of Emergency Management
Human Resources, Employment Services
Toronto Planning: Community Planning; Special Projects
Financial Planning
Deputy City Manager Clusters A, B, and C
Toronto Building

Service Efficiency Review – Toronto Fire Services & Toronto EMS
Page | 7
Facilities and Material Management
Professional Development and Operations Training
Toronto Firefighters Association 3888
Financial Services (shared by fire and EMS)
Communications Systems Engineering
Toronto Paramedic Association
CUPE Local 416
Purchasing and Materials Management
Additionally, Interviews were conducted with base hospital physicians at the Sunnybrook
Centre for Prehospital Medicine as well as with physicians for TEMS and TFS, to understand the base hospitals:
Roles and responsibilities
Support of a revised tiered response protocol with respect to the frequency and circumstances under which fire apparatus and staff are dispatched to medical emergencies
Determination of fire and EMS response parameters
Roles and responsibilities of fire and EMS in medical response
Response criteria perspective and the criticality of response time.
Site Visits
Our process encompassed site visits to fire stations, fire training locations, and an introduction to areas of the city that demonstrated the challenges that firefighters face. Site visits provided an opportunity to add context to project tasks and to gain perspective. The visits included the following stations and the TFS communication centre.
Station 313, Rosedale & Cabbage Town
Station 314, Hospital Row & Queens Park, U of T
Station 325, Regent Park
Station 332, High Rise, Hospital Row, Entertainment District, Rogers Centre, CN Tower,
Union Station, The Path, traffic congestion, underground malls, and subway and hydro vaults
Station 426, Parkdale, the Gardener Expressway, St. Joseph’s Hospital, the Lake Row Housing, old building stock.
Site visits for emergency medical services took a different approach since paramedics are often mobile and not at the stations. In addition to station visits, Pomax observed shift change processes, talked to paramedics on the road and at hospitals, observed hospital offload processes, and spent several days in total at the TEMS communication centre.

Service Efficiency Review – Toronto Fire Services & Toronto EMS
Page | 8
Study Review Principles
This study was based on the following principles:
To rely on factual evidence for concept development and study recommendations;
To understand the issues, concerns or suggestions of front-line fire and EMS responders,
and managers;
To evaluate the experience, success and challenges of other service delivery models;
and
To assess reasonable alternatives and service delivery models within the needs and
constraints of Toronto.
Service Efficiency Review – Toronto Fire Services & Toronto EMS
Page | 9
2.0 Toronto Fire Services
2.1 An Introduction to Fire Services
2.1.1 Fire Fighting and its Challenges
Fire services is an ‘all hazards’ and ‘all response’ agency. In fact, contrary to what most people realize, fighting fires is, fortunately, a small, albeit critical, part of the services fire departments provide. It is also important to understand that TFS responds to over 10,000 incidents a year that are reported as fires to the TFS dispatch centre whereas, in 2011, 2,033 turned out to be
structure fires. The balance are incidents such as no loss outdoor fires, pots on stove, overheating, human perceived emergencies, and other incidents, some of which could become structure fires. The important thing of which to be aware is that when a fire emergency is called into the fire dispatch centre it must be responded to as such.
Complexity of Fire Response
Although the response to a working fire incident is a complex matter, there is not a lot of evidence to indicate what happens when resources do not respond in a timely fashion with sufficient personnel to undertake and complete the critical tasks required for successful intervention. Fires are dynamic events which, without intervention, will progress and grow exponentially, and that is the reason why minutes and seconds count.
Tests by independent agencies inform us that the contents of buildings have changed considerably over the years and, as a result, the type of fuels and heat energy stored in modern furnishings are considerably higher than in wood and natural fabrics of yesterday.
To further complicate matters, from the perspective of the fire crews, lightweight engineered construction materials have added an additional consideration concerning safe operations. The use of lightweight engineered construction material in floors and roofs of newer buildings means that different tactics must be employed to safely engage in interior operations, including extinguishment and rescue. Engineered lumber burns faster than dimensional lumber and
modern furnishings emit high levels of toxicity when ignited. As a result, the window of
opportunity for successful intervention and rescue is greatly reduced. The time to flashover2 has been reduced significantly over the past 20 years and the time for crews to confine a fire to the room of origin has correspondingly been reduced, which underscores the necessity of a timely response. More important, it underscores the importance of prevention and education activities to reduce the incidence of fires, and other steps to reduce danger to occupants and fire fighters. These include covering engineered lumber with drywall or flame retardant paints and installing sprinkler systems.
2 A flashover is the near-simultaneous ignition of most of the directly exposed combustible material in an enclosed area.

Service Efficiency Review – Toronto Fire Services & Toronto EMS
Page | 10
A March 2012 summary report3 from Underwriters Laboratory and the National Institute of
Standards and Technology reviewed the results of a series of experiments aimed at assessing the fire performance of engineered floor systems. The experiments resulted in a number of outcomes, depending on the floor system and whether it was protected by drywall or sprinkler systems, with structural failure occurring at around 5 minutes in cases of a 7.25 inch steel C-joist on 24 inch centers under heavy weight loads, to unlimited structural time when protected by sprinkler systems.
In the United States, changes to the International Residential Code (IRC) require a one hour flame rating for floor assemblies. This will limit builders’ ability to use engineered lumber or I-joists for some flooring systems unless the bottom of the joists is covered with drywall, or
sprinkler systems are installed. Unfortunately, the IRC is a model-code book, so it does not become law unless adopted by a local jurisdiction. Alternatively, manufacturers are producing engineered joists with an applied flame retardant, such as Weyerhaeuser’s product, called ‘Flak Jacket’, which complies with the new one-hour flame rating guideline. Nevertheless, there is a generation of buildings using engineered floor joists that may compromise the safety of occupants and firefighters unless steps are taken to mitigate this risk.
In the 1970s, a National Institute of Standards and Technology (NIST) study found that people had approximately 17 minutes to escape a fire after a smoke alarm activates. But when the institute repeated the study in 2004, it found that the escape window had shrunk to just three minutes for the most susceptible of the population in relatively close proximity to a sudden
intense firei. However, occupants in other areas of a house – for example, a second floor bedroom with the doors closed – have double the time to escape assuming they are quickly alerted by a smoke alarm. This underlines the value of having interconnected smoke alarms so that when one is activated, all are activated. It also underlines the importance of public education so that the public understands the need for smoke alarms and other preventative tactics.
Residential building style and size has changed in the past half century. Prior to the availability of engineered lumber and the use of lightweight steel, which have made it possible to reduce
the number of support walls, houses featured smaller, separated rooms which assisted in confining fires and reducing the availability of oxygen. Expansive living environments also
provide an opportunity for smoke and toxic gasses to spread throughout a house.
Notwithstanding these valid concerns, we will show that except for one circumstance of a building constructed in 2003, all other fire deaths in Toronto in the 3 years for which data was available (2009 – 2011), have occurred in buildings constructed in the 1970s and earlier using dimensional lumber. This suggests that fire risk and deaths may be more related to factors other than building materials.
3http://www.ul.com/global/documents/offerings/industries/buildingmaterials/fireservice/basementfires/2009%20NIST%20ARRA%20Compilati
on%20Report.pdf

Service Efficiency Review – Toronto Fire Services & Toronto EMS
Page | 11
Fire Response Protocols
Fire professionals on our consulting team emphasize the importance of establishing fire response protocols which dispatch sufficient resources to undertake firefighting operations as quickly as possible. They assert that the only resources that should be held back from an original fire response dispatch are apparatus which are of a support nature, and are not needed to perform any of the critical tasks that are required in the successful intervention of a working fire.
It has not been the practice of fire services to provide detailed step by step descriptions of the exact tactical actions taken by individual fire crews while performing firefighting and rescue operations. As a result, it is extremely difficult to deconstruct the activities of response crews as
part of a debriefing process. This has not been a requirement of normal or common practice and has been confined to exceptional circumstances involved in severe injuries, fatalities, or criminal activities that had the potential for action or prosecution through the courts. The norm is that fire incident reports were primarily used by insurance providers as a basis for policy application, and by the Office of the Fire Marshal for determining the cause and origin of fires in the province. However, with the cooperation of TFS, our team has created a high-level process map of firefighting tasks typical of several fire emergencies. It can be found in Appendix B -
Assignments and Resources Required at Fire Incidents.
The total impact of fire is never completely and accurately captured in fire service loss reports. Estimates by fire services are rarely, if ever, confirmed with the insurance industry. The
insurance numbers are usually finalized weeks or months after a fire and there is no process in place for follow up. What is generally captured in fire reports is only the physical loss to the building and contents, without value placed on the net cost or social impact of issues such as temporary relocation while repairs are carried out. The net economic loss from fire is not captured in the fire loss numbers and can, in many instances, far exceed the loss to building and contents. It is accurate to say that the fire report figures are estimates and the process used by the fire service is not an exact science.
Impacts of Fires
Fires in business or industry have a net economic impact on the broader community. It is
possible that a fire may be confined to one business, although it may spread and devastate a larger area particularly if sufficient resources are not in place to intervene and aggressively attack and stop its progress. We can see this impact in rural areas where losses to farm buildings and equipment could be in the millions of dollars because the frequency of fires is not sufficient to warrant the significant costs of implementing a career firefighting service, and travel distances are great.
The impact of a fire can extend well beyond the damage and loss to individual buildings. There is also a direct impact upon the lives and economic outlook for building owners, businesses, and employees, as well as adjacent buildings and businesses.

Service Efficiency Review – Toronto Fire Services & Toronto EMS
Page | 12
Although all reasonable efforts must be taken to respond to and extinguish fires as quickly as
possible, thereby mitigating the associated psychological and net economic impact, the best approach is to improve public education and inspection services and avoid, to the extent possible, the occurrence of fire.
2.1.2 Convergence of Fire Apparatus
Fire stations do not operate as standalone entities. It would be prohibitively expensive, in the City of Toronto, to house all the equipment and apparatus that may be required to provide an appropriate response to all incidents within each station’s response area. Urban based fire departments respond on a station convergence basis, which means that fire trucks from several stations respond simultaneously and converge required resources on the affected location. The
level of that convergence is based upon the risk level of the occupancy and the required critical tasks to be performed in the event of a fire.
A firefighting scenario
Fire services’ equipment, apparatus, and staffing requirements vary and are guided, in large part, by legislation in Ontario; standards and guidelines from entities such as the Ontario Fire Marshall’s Office and the National Fire Protection Association; and a community’s service level profile which is determined by municipal council. Fire extinguishment crews, ladder crews, rescue groups, rapid intervention teams, Incident Management Systems (IMS) positions, and tactical reserve are examples of assignments that must be adequately staffed at the scene of
the working structure fire. In addition, the Incident Commander (IC) needs to consider the total extinguishment staffing requirements based on rate of flow, backup lines, placement of lines above the fire and the establishment of secondary water supply. NFPA 1710: Standard for the Organization and Deployment of Fire Suppression Operations, Emergency Medical Operations, and Special Operations to the public by career fire departments, defines tasks and minimum staffing recommendations for the initial response. These resource levels per task include:
1. Establishing command (minimum one person);
2. Establishing a minimum uninterrupted water supply of 400 GPM (1514 L/min) (minimum
one person);
3. Establishing an attack line and backup line flowing at least 300 GPM (1136l/min)
(minimum four people);
4. One support person for each line (minimum two people);
5. At least one search and rescue team (minimum two people);
6. At least one ventilation team (minimum two people);
7. Establish an initial rapid intervention crew RIC; (minimum two people, expanding to four);
8. If an aerial ladder is in use, a person operating the aerial ladder (minimum one person).
These minimum staffing guidelines total 15 firefighters, expanding to 17 firefighters when an
additional 2 people augment the initial rapid intervention crew. The TFS initial response is

Service Efficiency Review – Toronto Fire Services & Toronto EMS
Page | 13
comprised of 16 to 17 firefighters including the District Chief and Fire Incident Technician
(please see the firefighting tasks process map at the end of this section).
There are occasions where the first-arriving unit(s) control the fire, and the total response defined in NFPA 1710 is not required. As an example, the first-arriving pumper and aerial truck companies conduct the initial attack on a mattress fire inside a residential property. The pumper extinguishes the fire and provides an interrupted water supply as well as the two-out rapid intervention crew4 (RIC). Aerial Truck company members conduct a quick search and rescue with one crew while the other crew vents the building.
On other occasions the staffing needs are greater than the initial response outlined in NFPA 1710. In these cases departments must call for additional alarms (apparatus and staff) in order
to conduct the tasks required during such incidents. Consider a fire on the second floor of an unoccupied auto parts store with external exposures (outside walls) on three sides. Each fire company has an officer, an apparatus operator, and two firefighters on duty.
In a scenario such as this the first arriving officer takes command and gives an initial report indicating a working fire on the second floor while working with another member of the crew in advancing a standard pre-connect hose line to the second floor. As per the standard operating procedure a forward lay 100 mm hose supplies the initial operation from the closest fire hydrant. The apparatus operator remains at the pumper, while the firefighter assigned to the hydrant hooks up and then joins the apparatus operator as part of the initial rapid intervention crew RIC. This assumes that the firefighter hooking up to the hydrant will be able to join the
apparatus operator as a member of the initial RIC before the attack team enters the structure.
The second arriving pumper company will advance an additional hose line to the fire floor to increase the rate of flow or provide a backup hose line to the first-in attack team. Otherwise, they are to advance a hose line to the floor above the fire. Realizing that there is a working fire in a pre-incident plan building that requires a large rate of flow, the officer of the second pumper company plans to back up the initial pumper company by advancing a 65 mm hose line into the building.
The second pumper company would probably not secure a source of water for itself. The
second pumper company officer would radio command to advise that a second source of water
has not been secured. One firefighter from the second pumper joins the firefighter from first pumper to form a dedicated rapid intervention crew. The remaining three crew members from pumper two would advance a 65 mm hose line off the first pumper company’s pumper. The second responding fire pumper is parked out of the way of other arriving apparatus, but in a position to be ready to protect exterior exposures, should it become necessary.
There is a good chance that the water applied from these two hose lines will be adequate to control the fire. Reconnaissance is really the best way to determine the need for more lines to
4 Two firefighters who remain prepared to rescue fellow firefighters in case of an adverse incident that could threaten the welfare of the firefighters extinguishing the fire.

Service Efficiency Review – Toronto Fire Services & Toronto EMS
Page | 14
control the fire. In any case, there is still a critical need to back up the hose lines operating on
the fire floor, secure additional water supplies and get a hose line to the third.
If an aerial truck arrives early there may be a need for this crew to force entry into the building. Otherwise, the pumper company crews will be responsible for this task. The aerial company’s crew will split up with two firefighters providing aerial duties such as horizontal ventilation for the pumper companies working on the second floor, laddering the second floor (and third floor if there is one), and controlling utilities (isolating gas and hydro). The other two members of the aerial truck company will work above the fire, conducting the primary search and checking for fire extension on the third floor.
The first arriving chief officer establishes an exterior stationary command post and confers with
the company commander on the first pumper who was serving as the initial incident commander. Pumper one’s officer advises the chief officer of the progress being made on the fire. After a careful size-up, the chief officer assumes the position of incident commander and develops the following incident action plan:
1 Conduct the primary search of all floors. (Companies currently on the second and third floors will be responsible for searching these floors)
2 Ladder the building on 2nd and 3rd floors to provide alternative egress for firefighters
3 Advance a backup hose line to the second floor
4 Advance a hose line to the third floor
5 Secure a second water supply
6 Stage pumper and truck company as a tactical reserve
7 Plan for possible defensive operation
8 Set up a rehab (a place for firefighters to rest and cool off from the heat of the fire)
Most urban fire departments send a large response to a commercial building or a high-rise building. However, in the immediate example being discussed here, the incident commander’s action plan would include several additional tasks that have not been staffed and there is no tactical reserve where the two person minimum is assigned as a rapid intervention crew.
Continuing operations will require additional resources.
The third pumper is instructed to supply its apparatus with the 100 mm supply line into an advance 45 mm hose line the third floor. The fourth pumper will back up the two lines operating on the fire floor with a 65 mm hose line advanced from the third pumper’s apparatus. At this stage, the members of the aerial truck should be free to complete primary search and check for extension on the first.
A heavy rescue crew, upon arrival, could be assigned as the dedicated rapid intervention crew with one member assigned to become the accountability officer. The two members assigned to the rapid intervention from first pumper and second pumper can now rejoin their company. The third aerial truck company and fifth pumper company would standby two blocks from the
scene. Additional staff officers could be assigned to fill the positions of safety officer or planning

Service Efficiency Review – Toronto Fire Services & Toronto EMS
Page | 15
section chief. While it may be possible to double up on some assignments firefighter safety
must never be compromised.
Without an exposure or rescue problem, and with all companies taking appropriate action, this fire required what would be an extra alarm assignment. Note that three or four firefighters are assigned to each hose line, with the exception of the first line, where only two firefighters are available for interior assignments. Operating a hose line with two firefighters is an absolute minimum and very arduous task. Two firefighters can safely operate a 45 mm hose stream during practice session. During an actual fire, it may be necessary to advance a hose line up stairways, around obstacles, and through multiple doorways, then operate the hose line from a crawling or kneeling position, all of which greatly increase the effort needed to successfully
place a hose line position. Assigning all available personnel from a single company to a hose line not only provides the staffing necessary to properly position and operate the attack line, it also maintains company unity and accountability.
There are circumstances where the apparatus used to deliver staffing to the incident scene is more than sufficient to support an offensive operation. One of the challenges faced by an incident commander is to properly position on-scene apparatus to best utilize their capabilities. Apparatus that are not needed at the incident scene should be parked out of the way, preferably in a position that allows access to water supplies and makes them available to support possible defensive action (exterior operations).
During large-scale incidents, apparatus are often assigned to a staging area. In such a
circumstance the incident commander should designate a staging officer to manage and coordinate all companies assigned to the staging area. At this “stage” the apparatus would have the staffing necessary to function as a unit, such as a pumper company and aerial truck company. Apparatus without adequate staffing would be classified as out of service or parts, rather than staged.
Incident commanders could face the temptation to use on scene apparatus whether they are needed or not. However, more often than not, during offensive operations there is a need for additional staffing, not additional apparatus and placing unnecessary apparatus in an
immediate fire zone could block access if a change in tactics is required.
To conduct a safe and effective offensive operation, an incident commander must consider a number of different factors. One of the most important considerations is to determine whether there are sufficient personnel and resources on scene to deliver the required rate of water flow needed to suppress a fire, and to protect firefighters. In addition, an incident commander would consider the probable duration of the event and the sustainability of critical operations when deploying resources.
Figure 1 lists critical tasks required at a fire at a major occupancy.

Service Efficiency Review – Toronto Fire Services & Toronto EMS
Page | 16
Figure 1 - Major Occupancy Sample Critical Tasks
A graphic depiction of the activities, assignments and resources required for several different
fire incidents can be found at the figures listed below within Appendix
Figure 9 - First Alarm Response Resources Required
Figure 10 - Fire Fighting Process, Bungalow Fire Figure 11 - Second Alarm Response Resources Required Figure 12 - Fire Fighting Process - High Rise
Successful intervention at a working fire is a function of time and resources. Without the proper
resources deployed for the earliest possible intervention, conditions deteriorate and the impact of the fire worsens. Needless to say, those directly affected by the escalation of the fire are the building occupants and the firefighters.
i Tenability time is when the first tenability limit is exceeded 1.5 m (5 ft) from the floor at any point along the primary escape path. The
tolerance of people to fire conditions is a subject of considerable debate worldwide, because it has significant implications for public safety and for product liability. Deciding on appropriate tolerance limits is highly complex because of the broad variability among people and the need for conservatism to protect the more vulnerable portions of any population.
As noted in the National Institute of Standards Technical Note 1455-1, February 2008 Revision, this topic has been the subject of work by an international committee of experts working as ISO Technical Committee (TC) 92, subcommittee (SC) 3. This group has published a technical standard, ISO TS 13571 [26], that recommends limits of human tolerance to fire products. These limits are also consistent with the recommendations in the SFPE Handbook of Fire Protection Engineering [23]. Limits for elevated temperature and toxic gas species were taken from ISO TS 13571. For smoke obscuration, an optical density of 0.25 m-1 was used as a tenability criterion, a value typically used by the smoke alarm industry.
It should be noted that ISO TS 13571 is considered by most (including its principle authors) to be highly conservative, stating that the “... values are intended to assure with high confidence that even vulnerable people will not be incapacitated, then killed.” Thus, any observations based on analyses using these values may look much worse than what would be seen in actual use because tenability is based on the most susceptible of the population. The ISO TS 13571 values represent the best, international consensus so they were used for the primary analysis, but the data has been made available so that others can examine the impact of other limits.
Time Needed for Escape
As with the original Indiana Dunes tests, Technical Note 1455-1 does not select a value of time needed for escape since this is highly variable and is a function of the age and condition of the occupants, travel distances, behavior affecting pre-movement times, etc. An independent analysis of the Indiana Dunes data in 1975 [43] chose 3 min as an (arbitrary) reference number. A subsequent study funded by NIST at the University of Massachusetts (Amherst) [44] found average times needed to awaken sleeping occupants, phone the fire department, and evacuate all family members was about 50 seconds for families with children and nearly 70 seconds for the elderly.

Service Efficiency Review – Toronto Fire Services & Toronto EMS
Page | 17
2.2 Fire Services Data and Statistics
When we think of fire departments, most of us think of firefighting but TFS also responds to many other emergencies including floods, swift water rescue, hazardous materials, natural gas or propane leaks, electrical emergencies, and many others. Clearly, when we don’t know who to call we depend on the fire department. Toronto’s fire services also respond to medical emergencies where they provide rapid assistance to patients in respiratory or cardiac arrest, anaphylactic shock, and other serious situations until paramedics can arrive. Fire fighters then continue to assist paramedics with medical care. Without doubt, Toronto’s fire services are a critical part of public safety in the city.
Sources of Data
Readers should be aware that there are two forms of data used during this discussion of fire services data and statistics. There is a set of information based upon how the details of an incident was received by the fire service call taker and dispatched to the fire responders, and another set that defines the outcome of the incident.
The incident as it was received is usually captured within the Computer Aided Dispatch system or CAD whereas the outcome of the incident may be part of the Record Management System or RMS. For instance, a call for assistance might be received by the fire call taker as a ‘fire’ and the fire responders would be dispatched and given the information of a reported fire. Upon arrival, they might discover a pot on a stove or something overheating, and the incident outcome would be recorded, in the Record Management System, as overheating or ‘pot on stove’ rather than a fire.
Another possibility is a call that could be reported as a garbage container on fire but, upon arrival of the fire crew, it could have spread to a garage or other structure. Therefore, the outcome might be captured in the Record Management System as a structure fire.
We use the Computer Aided Dispatch information to explain incidents received and the Record Management System to explain the result of an incident. This also helps to explain the variance between call type as received and outcome, which could be substantially different.
Emergency Medical Services experiences the same type of variances and tracks them in an effort to determine the relationship between information received at the time of a call being received, the result, and indicators that assist EMS to determine the most appropriate and efficient resource
level required, when a call is received.
Although we usually indicate the source of data throughout this document, readers should recognize that Computer Aided Dispatch (CAD) information is used if it is not expressly noted that Record Management System (RMS) or outcome data is used.
Core fire incident volume
Chart 1- Population Growth Related to Core Fire Incidents, relates historic and expected population change to core incident volume for a corresponding number of years. We have defined ‘Core Incidents’ as all calls to which the fire service responds except for responses to fire alarms and medical calls.

Service Efficiency Review – Toronto Fire Services & Toronto EMS
Page | 18
Medical calls were filtered out because they are responded to, based upon the contingency
capacity within the fire service. To explain this another way, fire services are often available for calls; stations aren’t constantly active or responding to incidents which means that the capacity available, while waiting for a core fire incident to occur, can be used to respond to medical emergencies. Therefore, fire response to medical emergencies should not be an influencing factor on the need for staff and resources within the fire services. However, TFS explains that, except in very rare circumstances, a response is always sent to a medical call. If a fire truck is available at a station within the catchment area of the medical incident, that truck is sent. If the closest station is already occupied on another incident the next closest truck is sent. Nevertheless, the number of responses, each year, to medical calls by the fire service can be reasonably influenced by policy and operations. For example, a revised medical response protocol instituted in June of 2012 is estimated to have reduced the number of fire responses to medical calls from approximately
86,000 to less than 50,000 annually.
As well, although the fire service plays an important role in responding to some medical incidents, ambulances or emergency medical services’ response vehicles would also be responding to the same incidents. There is the possibility that operational discretion could be factored into a decision about fire trucks responding to some medical incidents when the closest station is already engaged. TFS and TEMS, along with direction from their medical advisors, should take this into account when forming response policies.
Alarms have been filtered out because they have declined in volume between 2005 and 2011, in part because of the fines the City has instituted for false alarms, and education of alarm companies
and owners. In 2005 TFS responded to 29,063 alarms ringing and in 2011, 22,4765. The implementation of increased fines and education has positively influenced the number of fire alarms occurring annually. Although there is a possibility that the number of other call types might be influenced by policy, the degree of change is unlikely to be as pronounced as with medical calls and fire alarms. Therefore, the inclusion of fire alarms and medical calls in these calculations would skew the appearance of changes in fire service activity.
When fire service responses from 2005 to 2011 are examined and medical emergencies and alarm calls are filtered out (Chart 1- Population Growth Related to Core Fire Incidents), we find that the fire service’s call volume, by type, has remained stable or declined during that time period. When the core fire incident trend is compared to Toronto’s population growth we can see that there is
actually a decline in incident growth. Put another way, population growth and fire core incident volume are not directly related and Toronto’s population growth is not a signal of increased call volume for the fire service, at least not on a straight-line per capita basis. This is not unique to Toronto. The City of Vancouver Fire and Rescue Service’s Strategic Plan states:
Historically the primary role of most Fire Departments was to respond to fires as they occur. With the evolution of fire and building codes and increased emphasis placed on fire prevention and education, we are seeing that the number of fires have remained quite consistent over the past five years, even though the population has increased.
5 There is a difference in the count between alarms reported by alarm companies (19,933), and all alarms (22,476), because some alarms are called in by other than alarm companies.

Service Efficiency Review – Toronto Fire Services & Toronto EMS
Page | 19
Chart 1- Population Growth Related to Core Fire Incidents

Service Efficiency Review – Toronto Fire Services & Toronto EMS
Page | 20
Chart 2 reflects call volumes, by type, as dispatched, not by outcome or as really found.
Chart 2 - Responses by Type by Year
TFS call load and frequency by time of day
When call load and frequency, by time of day, are examined; that is, the number of incidents and when they occur, we find that the greatest number of emergencies take place between approximately 11:00 AM and 7 PM and decline in frequency until 5:00 AM when they climb slowly to 11:00 AM.
The frequency of calls during the 4:00 to 5:00 AM hour – approximately 900 spread over 365 days for that hour or under 3 incidents in the city, on average, is approximately 30% of the volume of calls received between the 5:00 and 6:00 PM hour (approximately 3300 per hour over 365 days or just over 9 per hour on average). Please see Chart 3.
0
2000
4000
6000
8000
10000
12000
14000
2005
2006
2007
2008
2009
2010
2011

Service Efficiency Review – Toronto Fire Services & Toronto EMS
Page | 21
Chart 3 - Average Number of Core Fire Calls by Hour of Day
To accommodate this call load, TFS nominally6 staffs 128 apparatus (trucks), 24 hours a day, every day of the year. In addition, within it’s available contingency, when apparatus and staff were not responding to core fire calls, TFS responded to another approximately 84,000 medical calls in 2011 to assist the public and TEMS. At the beginning of June 2012 the protocols that determine when fire services should respond to medical calls were revised to increase efficiency and effectiveness. In concert with physicians at Sunnybrook Centre for Prehospital
Medicine, protocols were revised to ensure that TFS responded to medical calls where history and statistics showed that there might be a one in one hundred (1%) chance, or more, that fire
fighter intervention could be of benefit to a patient.
The data continues to be evaluated but early indications are that focusing fire response to medical calls in this manner will reduce the occurrence of response to an average of approximately 4,000 times a month rather than 7,000, while maintaining the same level of benefit to patients.
On average, response to medical calls used approximately 20 minutes of available contingency time or 28,000 hours of staff time (84,000 medical incidents x 20 minutes = 1,680,000 minutes or 28,000 staff hours). The reduction in medical response activity is expected to return
6 In most cases fewer apparatus are staffed because of absences due to vacations, illness, and other paid time off.
0
500
1000
1500
2000
2500
3000
3500
0 1 2 3 4 5 6 7 8 9 10 11 12 13 14 15 16 17 18 19 20 21 22 23
Average Number of Core Fire Calls (non-medical) by Hour of Day 2011

Service Efficiency Review – Toronto Fire Services & Toronto EMS
Page | 22
approximately 11,300 staff hours annually, or 31 staff hours per day across the city, to TFS’s
available contingency.
As noted earlier, Chart 3 shows the average number of fire incidents (calls) that occur during each hour of the day. So, during peak call periods, between 1800 and 1900 hours (6:00 PM and 7:00 PM) 3,250 incidents took place in 2011. The 1800 – 1900 hour time slot occurs once a day or 365 days a year, which means that TFS responds to an average of 9 calls each day during that hour throughout the city. During the 5:00 AM to 6:00 AM time slot that average drops to 2.54 calls throughout the city.
It is important to note that these are averages and the actual number of incidents that occur each day and hour can fluctuate greatly. For example, severe weather often causes a spike in call volume for such things as downed power lines or car accidents. In addition, the number of
apparatus (trucks) that are sent to each incident varies. Some calls, such as a hydro pole fire or assistance at an accident scene, might only require one truck whereas there are occasions when 20 trucks may be required for a working fire.
TFS respond to many residential and commercial fire alarms each year
Other than medical emergencies, alarm responses are the highest frequency of calls received by the TFS. Alarm calls are reported to the TFS by alarm companies which monitor commercial and residential establishments. Most fortunately, out of 19,933 alarm responses in 2011 only 188 (less than 1%), turned out to be fires. By far the greatest number of responses was caused by alarm equipment malfunction, accidental alarms, and alarms tripped on purpose (human
malicious). Details of alarm responses and their outcome can be seen in Chart 4 - Alarm Outcome by Category.
Chart 4 - Alarm Outcome by Category
0
1000
2000
3000
4000
5000
6000
7000

Service Efficiency Review – Toronto Fire Services & Toronto EMS
Page | 23
2.2.1 Fire Service Staffing Pattern and Levels
The TFS staffing summary is shown in Appendix C – TFS Unit Chart by command, district, station, apparatus type, and staffing level. As noted earlier, 128 apparatus are staffed 24 hours a day although it is rare that level of availability is in place. TFS tells us that the equivalent of 2 to 3 fire trucks are usually out of service due to paid absences (sick time, vacation, other owed time off). In addition, hiring freezes have meant that another 2 fire trucks remain unstaffed. As well, up to 16 fire units are removed from front line service for purposes of continuing education and practice. However, these vehicles can be quickly returned to front line service if required because of call load. So, at any given time TFS will staff approximately 123 apparatus although 16 of those might be assigned to training duties.
A question that is sometimes asked is why the fire service requires the same level of staffing at
night when the incidences of calls are 30% of the volume at peak hours. In comparison, police and emergency medical services reduce their staffing levels to reflect the considerably fewer calls that occur during off-peak hours. Toronto’s EMS, for example, may have 84 ambulances
available during peak periods but half that number during some overnight periods when the incidence of call events decreases. The fire service explains that the same level of staffing is required to be able to respond to potential fires within the 4 and 8 minute response targets approved by City Council and as laid out within the National Fire Protection Association Guidelines.
This is a difficult issue to resolve. If the need for fire service staffing levels was based on the
frequency of calls only, there could be a significant reduction in staff and apparatus during some hours. But, if the City subscribes to the philosophy that response time is important no matter the frequency of calls, then allocation of apparatus and staff must be based on the geography that can be covered in four minutes as well as support response by other apparatus within 8 minutes. In that case, staff levels must remain the same 24 hours a day. However, police and EMS decrease their staff levels during off-peak times which may result in an increase in response times due to fewer resources. Nevertheless, the possibility of increased response times is tempered by the fact that incident occurrence is considerably lower than during peak volume periods.
In contrast to police and EMS, fire is staffed based on a full risk model; response time is
considered paramount and the much reduced likelihood of an incident occurring is not taken into account in the determination of staff and equipment required. If the fire service was staffed based on the same probability risk model as police and EMS, costs would decrease dramatically but response times could increase beyond the 4 and 8 minute targets during off peak hours. This possible increase in response times is moderated by the fact that fewer incidents occur, which means the likelihood of a delay occurring is also decreased.
Even if the City of Toronto subscribes to an ‘all risk’ philosophy for fire protection rather than the ‘probability risk’ philosophy that is applied to police and EMS – that is, full staffing must be in place to respond to any type of incident at any hour, even though data shows that the probability of that incident happening is low during some periods of the day fire services
efficiencies can still be accomplished in a planned manner over several years.

Service Efficiency Review – Toronto Fire Services & Toronto EMS
Page | 24
2.2.2 Reserve Capacity and the Diminishing Likelihood of Incidents
An important consideration for emergency services is the ‘reserve capacity’ of the organization. This means the resources that are available to handle the next incident. Police and fire determine required reserve capacity based on statistical history and the likelihood of ‘the next call’ occurring. For instance, if statistics based on day and hour, show that a police service will receive 20 calls for assistance then sufficient staff and vehicles should be available to respond to the historical volume. The average length of call, by type, will be considered in determining the resources required as will an acceptable response time. Some calls for assistance would require an immediate reaction while others might not need to be handled as quickly. Then the police would determine the reserve capacity required to reasonably accommodate peak call loads – again, based on history. That reserve capacity may be 1 additional police car or foot
patrol per district, shared between districts, or whatever other ability may be required to protect the public. Emergency medical services calculates staffing and resource needs based on similar statistics and calculations.
The fire service applies a different metric to resource requirements which is response time. An advantage of applying this metric, rather than response time combined with incident history, is that there is a substantial reserve capacity within TFS. Consider the circumstance of a 2 or 3 alarm fire where 15 to 20 apparatus are on scene at any time. TFS nominally staffs approximately 120 apparatus 24 hours a day. If 20 apparatus are engaged on a fire incident 100 apparatus remain available for response in the city. It is true, though, that firefighters are rotated out of the fire scene because of the physical strain of firefighting, and trucks are moved
around the city to compensate for the rotation and to provide coverage to the response area affected by the fire. But even if 40 trucks are engaged in firefighting or coverage rotation, another 80 remain available to protect the city. Nevertheless, there is always the possibility that other alarm calls, traffic accidents, or other rescues might occur throughout the city at the same time as apparatus and staff are engaged at a 3 alarm fire.
Statistically, these concurrent incidents don’t happen often. Table 1 - Multiple Call Occurrence in Station Area indicates that on a city-wide basis concurrent incidents happened less than 6% of the time in 2011. Although reserve capacity is a vital consideration in staffing any emergency service another factor has to be considered, and that is the diminishing likelihood of additional incidents taking place. Diminishing likelihood is another way of saying “Sooner or later the calls
stop coming in” and the likelihood of the ‘next call’ occurring can be determined from statistical analysis of previous years’ incident volume. In the case of the fire service, as with police and EMS, there will be occasions that the targeted response times cannot be met. Nevertheless, there is ample evidence in this document that reserve capacity is more than adequate within the fire service.
2.2.3 Fire Service Incident Types and Frequency
The relationship, in volume and percentage, between ‘All Incidents’, ‘Medical Incidents’, ‘False Alarms’, and ‘Fires’, by station response area, is shown in Appendix D – Relationship in volume and
percentage, between ‘All Incidents’, ‘Medical Incidents’, ‘False Alarms’, and ‘Fires’, by station response
area. These four categories were chosen because ‘All Incidents’ demonstrates the demand

Service Efficiency Review – Toronto Fire Services & Toronto EMS
Page | 25
within each station area; ‘Medical Incidents’ are the most frequent fire service responses,
alarms ringing (most of which, fortunately, turn out to be ‘False Alarms’), are the second most frequent type of occurrence; and ‘Fires’ are included since that is the category of response that most of us associate with the fire service. ‘Total Calls’ and ‘Medical Calls’ categories were sourced from the Computer Aided Dispatch. ‘False Alarms’ and ‘Fires’ were sourced from the Record Management System because it is only after firefighters have arrived can it be determined whether an alarm was ‘false’ or whether an reported fire turned out to be a fire.
It is important to note that Appendix D – Relationship in volume and percentage, between ‘All
Incidents’, ‘Medical Incidents’, ‘False Alarms’, and ‘Fires’, by station response area indicates only those incidents which took place within the station area. So, as an example, Station 111 responded to only 4 fires within its immediate response area in 2011 but it responded, as part
of the required apparatus, to other station areas on another 36 occasions when there was a fire.
The columns next to each category indicate the percentage that each category of calls makes
up out of the total number of incidents that occur within each station’s response area. For example, in the excerpt from Appendix D – Relationship in volume and percentage, between ‘All
Incidents’, ‘Medical Incidents’, ‘False Alarms’, and ‘Fires’, by station response area, shown below, there were:
2,165 total incidents in station 112’s area in 2011,
1,489 or 69% were responses to medical calls,
188 or 9% of all incidents were false alarms (they were dispatched as ‘alarms ringing’;
they were only found to be false alarms after the fire service’s arrival),
18 or 0.8% of all incidents were fires
Information for all stations is found in Appendix D – Relationship in volume and percentage,
between ‘All Incidents’, ‘Medical Incidents’, ‘False Alarms’, and ‘Fires’, by station response area and indicates that in 2011, 58% of all responses by the fire service were to medical calls, 14% were to alarms, and 1.4% were to fires. Readers should keep in mind that this information is based on outcome of incidents, not as they were dispatched. As noted previously, the fire service may have been dispatched to a fire only to find out that it was an overheated pot on a stove. In that case the Record Management System would record the incident as an overheated pot but it may have become a fire if appropriate action was not taken.
Station 2011 All
Incidents
2011
Medical
Calls
Percent of All Calls
in Station Area
2011 False
AlarmsPercent of All
Calls in Station
Area2
2011 Fires Percent of All
Calls in
Station Area3
Total Percentage
of Medical, False
Alarm, and Fire
Incidents
111 1210 823 68% 109 9% 4 0.3% 77%
112 2165 1489 69% 188 9% 18 0.8% 78%
113 1645 986 60% 187 11% 23 1.4% 73%

Service Efficiency Review – Toronto Fire Services & Toronto EMS
Page | 26
2.2.4 Frequency of Structure Fires Within Each Station Area
Chart 5 - Structure Fires by Month - 2011 indicates the number of structure fires that occurred monthly in 2011 within each station area. The number of fires shown does not include fires other than structure fires; that is, automobile fires, grass fires, and other non-structure fires are not included in this count.
Chart 5 - Structure Fires by Month - 2011
0
50
100
150
200
250
Service Efficiency Review – Toronto Fire Services & Toronto EMS
Page | 27
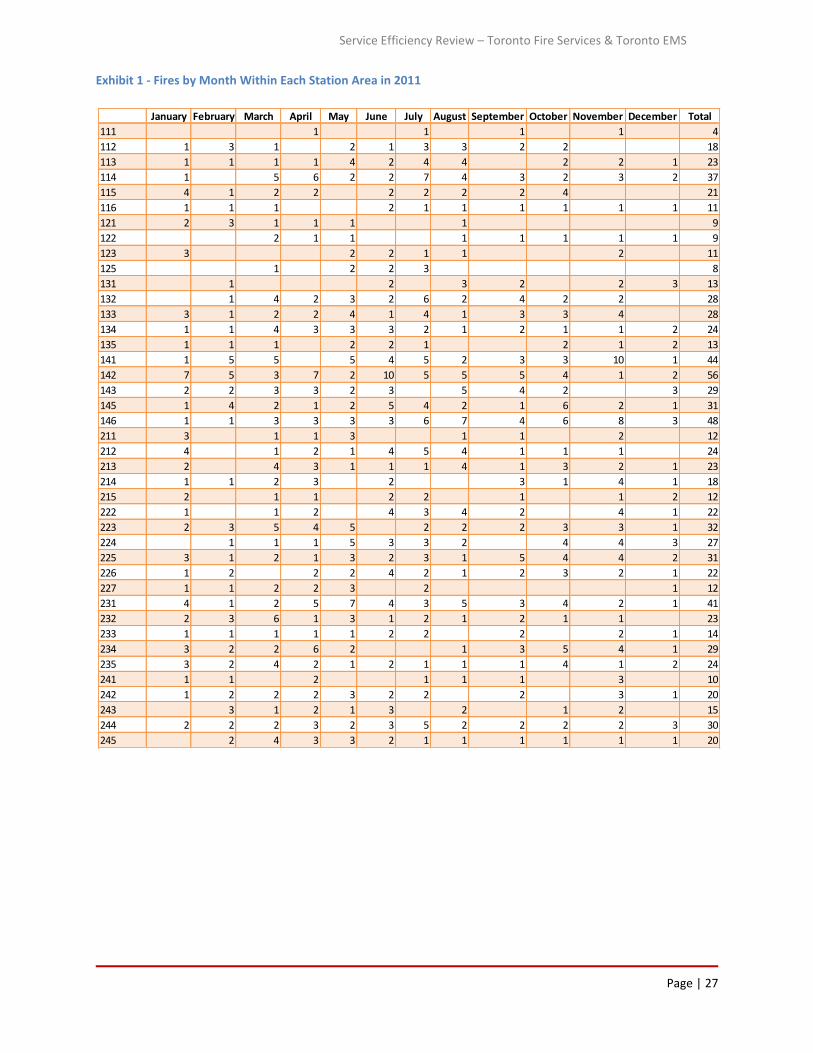
Exhibit 1 - Fires by Month Within Each Station Area in 2011
January February March April May June July August September October November December Total
111 1 1 1 1 4
112 1 3 1 2 1 3 3 2 2 18
113 1 1 1 1 4 2 4 4 2 2 1 23
114 1 5 6 2 2 7 4 3 2 3 2 37
115 4 1 2 2 2 2 2 2 4 21
116 1 1 1 2 1 1 1 1 1 1 11
121 2 3 1 1 1 1 9
122 2 1 1 1 1 1 1 1 9
123 3 2 2 1 1 2 11
125 1 2 2 3 8
131 1 2 3 2 2 3 13
132 1 4 2 3 2 6 2 4 2 2 28
133 3 1 2 2 4 1 4 1 3 3 4 28
134 1 1 4 3 3 3 2 1 2 1 1 2 24
135 1 1 1 2 2 1 2 1 2 13
141 1 5 5 5 4 5 2 3 3 10 1 44
142 7 5 3 7 2 10 5 5 5 4 1 2 56
143 2 2 3 3 2 3 5 4 2 3 29
145 1 4 2 1 2 5 4 2 1 6 2 1 31
146 1 1 3 3 3 3 6 7 4 6 8 3 48
211 3 1 1 3 1 1 2 12
212 4 1 2 1 4 5 4 1 1 1 24
213 2 4 3 1 1 1 4 1 3 2 1 23
214 1 1 2 3 2 3 1 4 1 18
215 2 1 1 2 2 1 1 2 12
222 1 1 2 4 3 4 2 4 1 22
223 2 3 5 4 5 2 2 2 3 3 1 32
224 1 1 1 5 3 3 2 4 4 3 27
225 3 1 2 1 3 2 3 1 5 4 4 2 31
226 1 2 2 2 4 2 1 2 3 2 1 22
227 1 1 2 2 3 2 1 12
231 4 1 2 5 7 4 3 5 3 4 2 1 41
232 2 3 6 1 3 1 2 1 2 1 1 23
233 1 1 1 1 1 2 2 2 2 1 14
234 3 2 2 6 2 1 3 5 4 1 29
235 3 2 4 2 1 2 1 1 1 4 1 2 24
241 1 1 2 1 1 1 3 10
242 1 2 2 2 3 2 2 2 3 1 20
243 3 1 2 1 3 2 1 2 15
244 2 2 2 3 2 3 5 2 2 2 2 3 30
245 2 4 3 3 2 1 1 1 1 1 1 20

Service Efficiency Review – Toronto Fire Services & Toronto EMS
Page | 28
January February March April May June July August September October November December Total
311 2 3 2 3 4 1 1 1 3 20
312 3 2 2 1 4 4 4 4 3 3 30
313 4 2 3 5 2 7 3 2 2 4 4 2 40
314 2 4 6 1 2 2 4 4 5 3 7 1 41
315 3 3 6 1 3 3 5 2 4 4 1 2 37
321 1 1 3 1 1 1 1 2 11
322 5 3 3 2 4 4 1 5 1 2 30
323 2 2 1 3 3 7 2 1 1 22
324 3 3 2 2 1 2 1 1 15
325 4 6 5 4 3 5 7 2 1 11 4 2 54
326 1 1 2 5 1 2 2 1 1 1 17
331 2 1 2 4 5 4 1 2 2 7 1 31
332 3 2 3 3 3 3 6 4 3 11 8 2 51
333 3 2 4 1 2 1 1 1 2 1 4 2 24
334 1 1 2 2 1 1 3 1 2 1 15
335 1 1 2
341 4 4 3 2 2 6 2 4 2 1 30
342 2 1 1 2 1 2 2 4 2 1 1 19
343 1 2 4 1 2 3 2 7 1 2 1 4 30
344 2 1 3 1 3 3 3 1 2 4 2 1 26
345 4 3 2 4 1 4 2 6 2 2 1 31
346 1 1
411 4 4 2 7 3 4 7 7 2 5 8 4 57
412 1 1 4 1 4 2 4 1 18
413 2 5 3 1 3 2 6 3 2 1 2 1 31
415 3 2 1 3 1 3 3 3 1 2 3 2 27
421 3 1 2 2 5 3 1 5 4 4 2 32
422 3 3 2 2 2 2 5 2 1 2 1 25
423 4 4 1 1 1 4 3 4 3 1 6 1 33
424 3 1 1 1 1 7
425 3 1 1 1 3 1 2 12
426 6 6 8 5 6 4 3 3 2 1 3 47
431 1 2 1 1 1 1 1 8
432 2 1 1 5 1 2 1 3 2 2 20
433 4 1 3 1 3 5 1 6 7 1 32
434 3 1 2 4 2 1 2 1 1 17
435 2 4 3 1 3 2 1 2 1 3 3 1 26
441 4 3 4 3 3 1 5 5 2 2 1 1 34
442 2 4 4 3 8 5 3 3 1 2 35
443 1 3 5 3 2 2 2 3 2 3 2 2 30
444 1 1 1 1 1 1 6
445 1 2 4 3 5 4 2 2 2 1 3 1 30
No Stn ID 1 2 3
Total 153 147 194 160 181 195 204 188 155 186 182 88 2033
Data Source: Toronto Fire Service Record Management System

Service Efficiency Review – Toronto Fire Services & Toronto EMS
Page | 29
2.2.5 Fire Response Time by Hour of Day
Fire response is made up of 3 distinct time components over which the fire service has control.
These distinct time components make up the total response time as follows:
1. Alarm to notification – this is from the time the phone rings at the fire dispatch centre to the time fire crews are alerted to an emergency; traditionally, the time the telephone rings has been referred to as the ‘alarm’ time and should not be confused with ‘alarms ringing’.
2. Turnout Time – this is the time from when the crews are alerted of an emergency to the time the fire apparatus (trucks) start moving out of the station;
3. Travel Time – this is the time it takes to drive from the fire station to the incident. It is
sometimes described as ‘wheels rolling to wheels stopped’.
NFPA® 1710 Standard for the Organization and Deployment of Fire Suppression Operations, Emergency Medical Operations, and Special Operations to the Public by Career Fire Departments, 2010 Edition defines these time components and sets targets against which fire services should measure their performance:
Alarm to notification time is defined by NFPA 1710, Section 3.3.53.3 as Alarm Processing Time. The time interval from when the alarm is acknowledged at the communication centre until response information begins to be transmitted via voice or electronic means to emergency response facilities (ERFs) and emergency response units (ERUs) [fire apparatus].
Section 4.1.2.3.3 of NFPA 1710 states: The fire department shall establish a performance objective of having an alarm processing time of not more than 60 seconds for at least 90 percent of the alarms and not more than 90 seconds for at least 99 percent of the alarms, as specified by NFPA 1221.
Turnout Time is defined by Section 3.3.53.8 of NFPA 1710 as the time interval that begins when the emergency response facilities (ERFs) and emergency response units (ERUs) notification process begins by either an audible alarm or visual annunciation or both and ends at the beginning point of travel time. Section 4.1.2.1(2) of NFPA 1710 states: The fire department shall establish the following objectives:
80 seconds for turnout time for fire and special operations response and 60 seconds turnout time for EMS response.
Travel Time is defined by Section 3.3.53.7 as the time interval that begins when a unit is en route to the emergency incident and ends when the unit arrives at the scene. Section 4.1.2.1 (3) of NFPA 1710 states: The fire department shall establish the following objectives:
240 seconds or less travel time for the arrival of the first arriving engine company at a fire suppression incident and 480 seconds or less travel time for the deployment of an initial full alarm assignment at a fire suppression incident.
There is another time component over which the fire department doesn’t have control and that
is the time from ignition to ‘alarm’ (when the fire is reported to the fire communications centre). This time component could be positively affected by public awareness of fire or other

Service Efficiency Review – Toronto Fire Services & Toronto EMS
Page | 30
emergency risk through a robust public education, inspection, prevention, and enforcement
program.
Does daytime traffic have a negative effect on response time?
Appendix E – Response Times by Fire Station examines response times for each fire station, by fire district, response component, and by time of day. This exercise was undertaken because we were informed that daytime traffic has an effect on the time it takes to respond to an emergency; in other words the more traffic there is, the slower the response, and the greater risk to the public if there is a delay in arrival. Intuitively, that concern seems reasonable.
To measure the differential between daytime traffic and nighttime traffic response, we took two six hour blocks of time for the full year of 2011 and compared the following time
components at the 90th percentile:
Alarm to Arrived scene – from the time the telephone rings (the ‘alarm’) at the dispatch
centre to the time the fire crews arrive at the scene
Alerted to Arrived scene – from the time the fire crews are notified by a dispatcher of an emergency to the time they arrive at the scene
Enroute to Arrive (travel time) – from the time the apparatus leaves the station to the
time fire crews arrive at the scene (drive time or travel time)
The two blocks of time were from midnight to 6:00 AM (0000 – 0600 hours), and from noon to 6:00 PM (1200 – 1800 hours) when traffic is heavier or at its peak. The 90th percentile denotes
the time to which 90 percent of calls were responded in 2011. For example, in Appendix E –
Response Times by Fire Station, within the category of ‘Alarm to Arrived Scene’, Station 111 has a 90th percentile time of 10 minutes between 0000 and 0600 hours. This means that between midnight and 6 AM, 90 percent of all calls were responded to in 10 minutes or less and 10% of calls took longer. The 90th percentile is a common measurement point in emergency services.
If daytime traffic impedes response time, then travel (enroute to arrive) should take less time during the 0000 – 0600 hour period than during the 1200 – 1800 hour period, and for the most part it does, although there were 7 stations which showed that travel time took longer at night than during the day; in one case, almost 3 minutes longer than during the day. The majority of fire stations showed that the 90th percentile travel time (wheels rolling to wheels stopped),
was less at night than during the day and that would be expected. But we also discovered that 42 of the stations had a longer response time during the night – when it should take the same or less time than during the day – when turnout time (that is, firefighters alerted at the station until a truck left the station), was taken into account as well as travel time. The apparent inconsistencies are shown in red in Appendix E – Response Times by Fire Station.
There could be several reasons for this discrepancy although the most obvious possibility is that fire fighters sleep at night and it takes longer to pull oneself together and get out of the station in a timely manner. It should be clear that we are not making a negative comment about the fact firefighters sleep. They work 24 hour shifts, firefighting is a strenuous job, and there should be no expectation that they should stay awake for 24 hours. In fact, there could be other
reasons for the apparent delays including the time it takes to navigate from the rest area to the fire trucks at night, or other as yet unknown factors. It is also important to note that the other

Service Efficiency Review – Toronto Fire Services & Toronto EMS
Page | 31
42 stations were able to respond in the same or less time at night than on days so station
design and location of the rest areas in relation to the apparatus floor could also be a cause. TFS is already seeking a resolution to the elongated nighttime responses, and we would expect that when its performance is examined a year from now, the cause of the discrepancy will have been discovered.
Figure 2 - District 1 – Day – Night Response Comparison
Figure 3- District 2 – Day – Night Response Comparison
111
112
113
114
115
116
121
122
123
125
131
132
133
134
135
141
142
143
145
146
0000 to 0600 8.2 8.1 8.1 7.8 7.9 8.4 8.2 9.4 10. 7.9 8.0 8.7 7.4 6.2 7.1 8.1 7.8 10. 7.8 8.1
1200 to 1800 7.0 7.6 6.5 6.9 8.0 9.7 7.2 8.9 7.2 7.8 6.8 7.1 8.2 6.7 6.4 4.3 7.3 9.0 7.7 8.4
0.0
2.0
4.0
6.0
8.0
10.0
12.0
Dis
pa
tch
to
Arr
ive
(m
in.)
TFS - 90th Percentile Response by Station - 2011
211
212
213
214
215
222
223
224
225
226
227
231
232
233
234
235
241
242
243
244
245
0000 to 0600 7.8 8.2 8.5 9.6 8.9 7.6 8.3 8.7 6.8 7.6 8.0 7.8 8.4 7.2 7.7 7.3 7.5 7.7 7.8 8.0 7.6
1200 to 1800 7.2 8.2 7.5 7.4 7.0 6.8 7.3 6.7 6.5 6.5 6.6 7.7 8.0 6.6 7.8 7.8 7.7 7.0 7.1 6.5 6.7
0.0
2.0
4.0
6.0
8.0
10.0
12.0
Dis
pa
tch
to
Arr
ive
(m
in.)
TFS - 90th Percentile Response by Station - 2011

Service Efficiency Review – Toronto Fire Services & Toronto EMS
Page | 32
Figure 4- District 3 – Day – Night Response Comparison
Figure 5- District 4 – Day – Night Response Comparison
311 312 313 314 315 321 322 323 324 325 326 331 332 333 334 341 342 343 344 345 346
0000 to 0600 7.4 6.2 6.1 5.9 6.1 7.8 7.9 6.8 6.5 6.3 6.2 7.0 6.1 6.6 6.4 6.9 6.7 7.5 6.6 6.4 6.3
1200 to 1800 6.4 5.3 6.7 5.4 5.8 6.6 6.9 5.6 5.9 5.2 5.6 6.3 5.5 5.5 6.5 6.7 6.2 6.4 5.6 6.1 6.3
0.0
1.0
2.0
3.0
4.0
5.0
6.0
7.0
8.0
9.0
Dis
pa
tch
to
Arr
ive
(m
in.)
TFS - 90th Percentile Response by Station - 2011
411 412 413 415 421 422 423 424 425 426 431 432 433 434 435 441 442 443 444 445
0000 to 0600 8.1 9.0 7.7 8.7 7.6 6.4 7.2 6.0 8.3 7.2 8.2 8.2 7.7 7.5 7.9 7.8 7.6 8.8 8.8 5.1
1200 to 1800 7.5 7.6 7.7 8.3 6.6 6.3 5.5 6.0 8.9 5.9 7.7 6.8 7.6 7.6 6.8 8.1 7.1 7.1 8.9 8.1
0.0
1.0
2.0
3.0
4.0
5.0
6.0
7.0
8.0
9.0
10.0
Dis
pa
tch
to
Arr
ive
(m
in.)
TFS - 90th Percentile Response by Station - 2011

Service Efficiency Review – Toronto Fire Services & Toronto EMS
Page | 33
2.2.6 Multiple Incident Occurrences by Fire Station Area
Another issue that has to be considered within the frequency of calls is the occurrence of multiple calls; that is, how often does another call occur in a station’s area when the primary responders (the first pumper or rescue unit), is already active with another call. If this circumstance occurs frequently – perhaps more than 30% to 40% of the time, there is a possibility that an adjacent staffed apparatus would need to be deployed to provide secondary coverage when the primary vehicle is dispatched. If the occurrence of a second incident happens frequently, it may be possible that resources would even have to be added to a station area.
Table 1 shows for each fire station, the total number of core7 calls that were received in the
station area, the number of times a second call was received at the same date and hour, and the percentage of time more than one incident took place concurrently.
Multiple events occurred most frequently at station 426 at just over 11% of the time, and the least often at station 434, just under 1.5% of the time. On a service-wide basis the incidence of concurrent incidents is approximately 6%.
Considering the low frequency with which second incidents occur in each station area within the same hour and date as another incident is taking place, there is no indication that any stations require additional apparatus to service call load.
7 Please see 2.2 Fire Services Data and Statistics

Service Efficiency Review – Toronto Fire Services & Toronto EMS
Page | 34
Table 1 - Multiple Call Occurrence in Station Area
Station
Total Number of Core
Calls in 2011 (Not
Medical Calls)
Number of Times in 2011 More
Than One Call Was Received at
the Same Date and Hour
%
Occurrence
111 364 14 3.85%
112 642 30 4.67%
113 601 30 4.99%
114 1069 83 7.76%
115 549 25 4.55%
116 490 15 3.06%
121 577 30 5.20%
122 377 9 2.39%
123 443 21 4.74%
125 366 14 3.83%
131 583 25 4.29%
132 1088 78 7.17%
133 578 29 5.02%
134 882 67 7.60%
135 582 21 3.61%
141 938 71 7.57%
142 1126 86 7.64%
143 577 25 4.33%
145 644 31 4.81%
146 750 49 6.53%
211 297 14 4.71%
212 393 11 2.80%
213 603 33 5.47%
214 378 9 2.38%
215 245 8 3.27%
222 769 42 5.46%
223 860 54 6.28%
224 597 32 5.36%
225 780 46 5.90%
226 766 41 5.35%
227 453 10 2.21%
231 831 46 5.54%
232 714 38 5.32%
233 529 30 5.67%
234 658 28 4.26%
235 541 23 4.25%
241 347 12 3.46%
242 505 26 5.15%
243 515 19 3.69%
244 787 47 5.97%
245 508 18 3.54%

Service Efficiency Review – Toronto Fire Services & Toronto EMS
Page | 35
Station
Total Number of Core
Calls in 2011 (Not
Medical Calls)
Number of Times in 2011 More
Than One Call Was Received at
the Same Date and Hour
%
Occurrence
311 828 53 6.40%
312 946 54 5.71%
313 1202 99 8.24%
314 1626 167 10.27%
315 836 47 5.62%
321 380 15 3.95%
322 750 38 5.07%
323 598 26 4.35%
324 473 12 2.54%
325 1479 131 8.86%
326 413 15 3.63%
331 896 32 3.57%
332 1592 159 9.99%
333 989 77 7.79%
334 648 20 3.09%
335 77 0 0.00%
341 708 40 5.65%
342 385 13 3.38%
343 540 16 2.96%
344 871 53 6.08%
345 754 35 4.64%
346 69 2 2.90%
411 625 22 3.52%
412 486 18 3.70%
413 898 52 5.79%
415 569 25 4.39%
421 705 37 5.25%
422 335 9 2.69%
423 679 36 5.30%
424 223 4 1.79%
425 332 5 1.51%
426 1682 191 11.36%
431 350 12 3.43%
432 412 22 5.34%
433 753 46 6.11%
434 272 4 1.47%
435 595 22 3.70%
441 909 59 6.49%
442 1011 71 7.02%
443 740 45 6.08%
444 433 23 5.31%
445 836 62 7.42%
Total 55207 3209 5.81%

Service Efficiency Review – Toronto Fire Services & Toronto EMS
Page | 36
2.2.7 Conclusions
To help us determine the resource requirements for Toronto’s fire service we reviewed:
The frequency of incidents and type of incidents that occurred in each station area
The frequency of incidents to which apparatus responded in another station area
The outcome of all incidents by major category based upon TFS’s Record Management
System
Multiple call occurrences which examines the number of times annually that more than one core fire call was received in a station area at the same date and hour
All fire and medical calls to which stations responded whether within or outside the
station catchment area
Fire incidents, medical incidents and false alarms for the period 2009 – 2011 to determine trend
The data, when broken into the details that have been provided in the chapter exhibits and appendices, tells us that the fire service responds most often to medical calls – over 84,000 in 2011; next, to alarms – just over 19,900 but declining; then to pot on stove and other cooking incidents (no fire, but could become fire without intervention); and fortunately, down on the frequency scale, structure fires. This observation is not meant to diminish the importance of fire
fighter response to potential fire emergencies. Many of the ‘pot on stove’ or other cooking incidents could quickly become fire emergencies although the frequency of these might be mitigated with strong awareness and public education campaigns.
We found that:
Fire service responses have remained flat or declined between 2005 and 2011. Reports that fire responses are increasing are due to a higher incidence of medical calls, directly due to increased EMS events. A change in guidelines for the response of fire to medical calls will likely result in a decline of over 30,000 annual responses by fire to medical calls and the availability of 12,000 staff hours (about 31 hours of staff time per day, city-wide) to TFS’s available contingency.
TFS’s staffing is based on station location geography and endeavoring to maintain a
consistent response time to incidents no matter the time of day, in accordance with NFPA 1710. To accomplish that, the same number of staff must be available 24 hours a day. However, call volume during some periods of the night declines by almost 70% from peak daytime hours. The alternative to maintaining the same staffing levels at all hours is to institute a probability risk model in the fire service. A probability risk model, similar to police and EMS, recognizes that the probability of an incident occurrence declines significantly during some hours, and accepts the possibility that response times may be protracted for a few of those incidents. Implementing a staffing pattern based
on precepts similar to police and EMS would save a significant amount of money within the fire service.

Service Efficiency Review – Toronto Fire Services & Toronto EMS
Page | 37
Another opportunity is to explore a dynamic staging, predictive modeling, pre-emptive
traffic controls approach to the placement of fire resources and apparatus. This could improve response times and decrease equipment requirements by helping to predict fire response demand and deploy resources accordingly.
In 2011, 58% of all events by the fire service were to medical calls, 14% were to alarms, and 1.4% was to fires. Readers should keep in mind that this information is based on outcome of incidents, not as they were dispatched. The other approximately 27% were to a wide range of incident types.
An indicator of activity level, sufficient to warrant additional resources at the station level is the frequency of other incidents or calls occurring when the station is already
engaged on a call. We found that on a service-wide basis a second call occurs in a station area less than 6% of the time that staff is already responding to an incident. The greatest incidence of this occurring is just over 11% of the time at station 426. The lowest occurrence is 1.47% at station 434.
Considering the low frequency with which second incidents occur in each station area at the same time as another incident is taking place, there is no indication that any stations require additional apparatus to service call load.
2.3 Demographics and Fire Related Civilian Injury & Death Statistics
The incidence of civilian injuries and death due to fire is always a concern for the City and public. The intention of this section is to determine if there is a correlation between civilian major injuries and death and demographic information.
Appendix F – Maps Indicating Demographics and Fire Related Civilian Injury & Death provides 8 maps as a visual reference relating to this discussion.
Demographic data was obtained from the City’s planning department and analyzed at a neighbourhood level to understand trend variations across the city. A neighbourhood level aggregation was chosen because almost all recent (2011) demographic information was detailed only at this level.
Fire related civilian injury and death data, summarized for the years 2009, 2010, and 2011, was obtained from TFS and screened to exclude minor injuries. This data was geocoded to locate the incidents and then researched to observe any demographic trends. The demographic trend observation was performed by superimposing major injury and death statistics on the planning department’s neighbourhood level information. A summary of the factors observed and their respective assessment are presented below.
2011 Population per Neighbourhood
Map 1 (Appendix F – Maps Indicating Demographics and Fire Related Civilian Injury & Death) shows the location of major injuries and death contrasted with neighbourhood level population for

Service Efficiency Review – Toronto Fire Services & Toronto EMS
Page | 38
2011 across the city. Observation does not show any significant relationship between the
neighbourhood level population value and frequency of major injuries and fatalities due to fire.
2011 Population Density per Neighbourhood
Map 2 (Appendix F – Maps Indicating Demographics and Fire Related Civilian Injury & Death) shows major injuries and death locations for 2009 – 2011 compared to 2011 population density by neighbourhood. The population density was obtained by dividing the 2011 population by the physical area of each neighbourhood. Barring a few neighbourhoods, the exhibit demonstrates a general trend of higher frequency of major civilian injuries and death where neighbourhoods are more densely populated. It can be inferred that there may be a higher probability of civilian injuries and death due to fires in more densely populated neighbourhoods.
2011 Senior Population and Population Density per Neighbourhood
Maps 3 and 4 (Appendix F – Maps Indicating Demographics and Fire Related Civilian Injury & Death) present the population and population density respectively for seniors (aged 65+) per neighbourhood (2009 – 2011). Similar to Map 1, the major injuries and death phenomenon do not demonstrate any visible relationship with the senior population. Map 4, the senior population relationship with major injuries and death, indicates the possibility of a higher frequency of major civilian injuries and death where neighbourhoods have a higher density of senior population. The trend is largely similar to the overall population density relationship with major injuries and death observed in Map 2. If any relationship exists, it may be more attributable to population density than seniors’ population. In any event, with the data
available, the relationship cannot be determined.
2006 Average Household Earnings per Neighbourhood
Map 5 (Appendix F – Maps Indicating Demographics and Fire Related Civilian Injury & Death) presents a map of Toronto showing average 2006 household income values per neighbourhood and its relationship to incidences of major injuries and death. The 2006 household earnings values were the latest available at the time of compiling this report and the overall average household earnings for the City of Toronto stood at $80,343 in 2006. The occurrence of major injuries and death for civilians appears to be more prevalent in lower earning neighbourhoods,
and the lowest earning neighbourhoods seem to demonstrate a higher occurrence of such
major injuries and death. In fact, most of the major injuries and death are observed to have happened in neighbourhoods with lower household earnings than the 2006 Toronto average ($80,343), or geographically close to those neighbourhoods. One could theorize this phenomenon by observing that people living in those neighbourhoods may be less likely to have disposable income for fire safety or to undertake fire risk-related residential repairs. On the other hand, there are other modest income neighbourhoods with a low incidence of injuries or deaths. Nevertheless, lower income areas combined with higher density suggest the need for targeted public awareness for fire safety.
2.3.1 Observations - Demographics
A geographic investigation into the relationship between major civilian injury and death due to fire was conducted to find out if there was any trend with relevant demographic indicators. The

Service Efficiency Review – Toronto Fire Services & Toronto EMS
Page | 39
investigation revealed that there is a general prevalence of major injuries and death in
neighbourhoods that are more densely populated than average. There is also a possible trend of such mishaps occurring in neighbourhoods with lower than average household earnings.
We found that, for the years 2009, 2010, and 2011:
1. Of the 39 civilian deaths, 37 occurred in living quarters
i. 21 in single family and semi-detached houses,
ii. 2 in townhouses/row houses, and
iii. 14 in multi-unit residential apartments including high-rises.
The remaining two fire-related deaths occurred in a commercial building and an
institutional building.
2. A breakdown of the age of the buildings was determined and we found:
i. Only 1 out of all 39 properties was built as recently as 2003.
ii. 35 were built in or before 1972.
iii. 1 out of 39 data has no record of year built. However, the adjacent properties were built in 1914 and 1972 respectively.
iv. 8 out of 39 (20.5%) civilian deaths occurred in high rise buildings 7 storeys and higher. Another 7 deaths occurred in buildings between 3 and 6 storeys.
Maps 6, 7, and 8 (Appendix F – Maps Indicating Demographics and Fire Related Civilian Injury &
Death), illustrate the location of civilian major injuries and deaths for years 2009, 2010, and 2011 by neighbourhood.
Major Injury stats (2009-2011):
1. Of the 63 civilian major injury (not fatal) incidents, 1 involved a truck on a roadway. Out of the
remaining 62 incidents, 52 occurred in living quarters:
i. 22 in single family and semi-detached houses,
ii. 4 in townhouses/row houses, and
iii. 24 in multi-unit residential apartments including high-rises).
The non-residential major injuries occurred in Commercial (3), Industrial (2), and Institutional (5)
locations.
2. A breakdown of the age of the buildings indicates that :
i. 9 properties out of 63 do not have a year of build (+1 for the fire injury that happened on
the road). It is understood that a few properties were recently built, but most of them
seem well established buildings built some considerable time ago.
ii. 49 out of 53 properties with documented age were built in or prior to 1973.
iii. 16 out of 63 major injuries occurred in high rise buildings 7 storeys and higher. Another
10 major injuries occurred in buildings between 3 and 6 storeys.
Given this, we assert that a neighbourhood analysis by the fire service, in partnership with
Toronto’s planning department and social services agencies, could assist with targeting prevention and education programs in more vulnerable areas.

Service Efficiency Review – Toronto Fire Services & Toronto EMS
Page | 40
2.3.2 Conclusions
While this is a preliminary investigation, there are indicators of a possible relationship between demographic markers and the occurrence of civilian major injury and death. Therefore, based on the information gathered with the cooperation of Toronto’s Fire Services and Planning Department, we have determined that an increased risk of civilian injury and death may occur in neighbourhoods with a higher population density and lower than average income.
In the period 2009 – 2011, fire deaths have been more prevalent in buildings constructed over 40 years ago and the majority (all except 2), have occurred in residences. Twenty-one of those were in single family or semi-detached, 14 in low or high rise residential apartments, and 2 in town houses or row houses.
The availability of similar data, in the future, would enable TFS to target vulnerable areas for the purpose of increased awareness, education, and prevention and possibly reduce the incidence of fire and the associated risk of civilian injury and death. Although TFS already participates on committees with other City of Toronto departments, a greater presence and scope of involvement would be expected to have a more positive outcome on occurrence of fire and prevention of injury and death. However, TFS would require a much larger cadre of fire prevention and education officials as well as business analysts to analyze statistics and assist with determining the most effective use of targeted prevention techniques.
2.4 Fire Services Staff and Apparatus Requirements
An important part of this project was to determine the fire and EMS resource levels required to protect the city and meet service demand projected through to the year 2022. This section addresses the fire service’s staff and apparatus requirements.
The National Fire Protection Association’s target for the arrival of the first apparatus at a fire suppression incident is 240 seconds travel time or less (4 minutes). This is also the target found in TFS’s 2007 Fire Master Plan.
NFPA 4.1.2.1 (3) states:
The fire department shall establish the following objectives:
(3)*240 seconds or less travel time for the arrival of the first arriving engine company at a fire suppression incident and 480 seconds or less travel time for the deployment of an initial full alarm assignment at a fire suppression incident.
Structural Fire Fighting is defined as The activities of rescue, fire suppression, and property conservation in buildings or other structures, vehicles, rail cars, marine vessels, aircraft, or like properties. And, Fire Suppression is defined as The activities involved in controlling and extinguishing fires.
If the City of Toronto supports the 240 second objective then fire stations should be situated, throughout the city, to accomplish a 4 minute initial response to fire suppression incidents, and
8 minutes of travel time to accomplish a full deployment of staff and apparatus.

Service Efficiency Review – Toronto Fire Services & Toronto EMS
Page | 41
The resource requirement established by the TFS to a reported residential fire requires
response by
2 pumpers
An aerial unit
An X unit (an X apparatus is a truck of any kind that ensures the response delivers at
least 16 firefighters to an incident within 8 minutes). In some cases additional units are sent if one of the initial response apparatus is short staffed due to illness or other absence.
A Rescue or a Squad
A District Chief and Fire Incident Technician (FIT)
A response to a residential fire requires the trucks and accompanying staff shown in Exhibit 2.
Exhibit 2 - Apparatus Required for an Initial Response to a Residential Fire
Within 4 Minutes Within 8 Minutes
Staffing
Min. Max. Min. Max. Min. Max. Min. Max. Min. Max. Min. Max.
4 5 4 5 3 5 4 6 3 5 2 2
FIR Fire - Residential P P A X R/S D
Sixteen fire fighters in 8 minutes is the requirement for a single family dwelling but the number of fire fighters and apparatus varies depending on the situation. A highrise residential fire downtown would require, for initial response:
2 pumpers
An aerial unit
Another unit (X unit)
A Rescue unit or a Squad
A District Chief
A response to a highrise residential fire requires the trucks and accompanying staff shown in Exhibit 3.
Exhibit 3 - Apparatus Required for an Initial Response to a Highrise Residential Fire
Within 4 Minutes Within 8 Minutes
Staffing
Min. Max. Min. Max. Min. Max. Min. Max. Min. Max. Min. Max.
4 5 4 5 3 5 4 6 3 5 2 2

Service Efficiency Review – Toronto Fire Services & Toronto EMS
Page | 42
FIHR Fire - Highrise Residential P P A X R/S D
If the reported fire was at a highrise residential building downtown the response would be as shown in Exhibit 4.
Exhibit 4 - Apparatus Required for an Initial Response to a Highrise Residential Fire Downtown
Within 4 Minutes Within 8 Minutes
Staffing
Min. Max. Min. Max. Min. Max. Min. Max. Min. Max. Min. Max.
4 5 4 5 3 5 4 6 3 5 2 2
FIHRD Fire - Highrise Residential - Downtown P P A R/S H (or X) D
The different apparatus requirements and scenarios shown in Exhibit 2, Exhibit 3, and Exhibit 4 indicate the variables that have to be considered in determining an acceptable resource level to various emergencies. The following sections describe the process to arrive at the conclusions and recommendations.
2.4.1 Determining Resource Requirements to Meet Demand
A significant effort was put into determining the resources required for TFS to meet the objectives stated in NFPA 4.1.2.1 (3) and those in the 2007 Fire Master Plan.
Fire stations in Toronto are situated, to the extent possible, in such a way that apparatus located at those stations can achieve the travel time stipulated by NFPA 4.1.2.1 (3), since fire apparatus most often respond from a station based environment. However, TFS’ records indicate it has not been able to meet a 240 second target 90% of the time.
The process we undertook was designed to determine the resources required to achieve a four minute travel time objective.
Background
The response analysis was completed using ESRI’s ArcGIS mapping software. Environmental Systems Research Institute (ESRI) is the world’s leading developer of geographic information systems. The company indicates it has installed base of more than one million users in more than 350,000 organizations, including most US federal agencies and national mapping agencies, all 50 US state health departments, transportation agencies, forestry companies, utilities, state and local government, schools and universities, non-government organizations, and commercial businesses. Its products are also used by the City of Toronto. ArcGIS is mapping software that enables manipulation of shapefiles and geodatabases. It is widely used for many functions including transportation and response analysis.

Service Efficiency Review – Toronto Fire Services & Toronto EMS
Page | 43
We want to thank Toronto’s Social Development, Finance and Administration Division for
providing the latest, available, Toronto street network dataset for the purpose of completing this analysis. Also, all available TFS response locations were geocoded by SDFA to ensure accuracy of incident location8.
A Basic Explanation of the Analysis Method
The analysis consists of two components:
1. The Mapping Component
Mapping software (ESRI ArcGIS 10.1) was used to plot the routes and distance that an apparatus can travel from a station within a specified period of time.
The end points of these routes are joined forming a polygon. The polygon theoretically defines the area that a vehicle can travel in a given period of time. In this case, the objective was to define the area that can be covered by a fire apparatus within the 4 minute NFPA and City of Toronto target. This process was performed for 80 of TFS’s 82 fire stations except for the seasonal stations located at the Canadian National Exhibition grounds and the Toronto Island.
2. The Mathematical Component
Mathematical tools were used to incorporate the results from the mapping component to determine the apparatus needed to ensure a full assignment can reach incidents in
eight minutes.
This component determines whether there are available resources within or adjacent to each 4 minute polygon to ensure that a full deployment of apparatus and staff can reach each suppression incident within 480 seconds (8 minutes).
A Basic Explanation of the Apparatus Location Analysis
There are three steps to the apparatus location analysis:
The first step is to use ArcGIS to create polygons that represent the theoretical area that can be reached from a fire station within a specified period of time. In this case it was
the 4 and 8 minute targets specified by TFS and NFPA 1710.
The second step is to adjust the polygons to more accurately account for the impact of traffic and other factors.
The third step is to use the adjusted polygons and mathematical calculations to
understand where apparatus should be housed to ensure the TFS response objectives are met.
8 Not all the address information incidents would geocode. Only incidents that matched geocoding parameters were used in the adjustment calculation.

Service Efficiency Review – Toronto Fire Services & Toronto EMS
Page | 44
The first step is to create the polygons. Four minute and eight minute polygons were created
for each TFS station using ESRI’s ArcGIS 10.1 mapping software. These polygons represent the distances apparatus can travel within four and eight minutes respectively from a fire station.
The second step is to adjust the polygons for greater accuracy to more accurately reflect traffic impedance and other factors which could delay the response of fire apparatus. This is because mapping software assumes a normal or typical travel time and may not adequately consider traffic impedance and other factors in Toronto that can impact the time it takes pumpers and aerials to reach incidents.
This adjustment was done based on the difference between the actual time it took for apparatus to travel to incidents and the time suggested by the mapping software. ‘Actual time’
was determined using actual call data from TFS’ computer aided dispatch information9. Since responses to actual incidents usually took longer than the software calculated, the size of the polygons was decreased from those originally created by the mapping software to better reflect the actual responses.
In step 3 fire trucks were relocated from station to station, within the software, to achieve a 4 minute response. The adjusted polygons were used to understand where apparatus should be located to ensure the TFS response requirements could be met. In other words, the placement of apparatus would have to be adjusted to reflect the polygons – and theoretical response areas – that could be reached within 4 minutes.
In addition, eight minute response of a full assignment of apparatus and staff was determined
using a linear programming10 mathematical model (please see the endnote in this section for an explanation of linear programming). The same mathematical program was used to understand where apparatus should be located in order to achieve a full first alarm assignment, within 8 minutes, to all parts of Toronto.
9 The computer aided dispatch is used to capture the time of each stage of each incident from the time an alarm (the telephone call), is received until apparatus returns to a station and is once again available for response. 10
Linear programming is a mathematical optimization process used to find the very best solution from among those available. Best depends
on the problem at hand; in this case, to identify the stations to house pumpers, rescues, and aerials so that the required apparatus type and staff can reach a fire incident within specific periods of time, and doing so with the most efficient level of resources. Linear Programming is a commonly applied form of constraint optimization which is used to seek out the best point of function while respecting various constraints, such as the TFS’s response requirements and the distances apparatus can travel. The main elements of a constrained optimization problem are:
Variables (also called decision variables). The variables usually represent things that you can adjust or control, for example the number of apparatus
Objective Function. This is a mathematical expression that combines the variables to express the goal (to minimize the number of pumpers, rescue units, and aerials needed).
Constraints. These are mathematical expressions that combine the variables to express limits on the possible solutions. For example, at least 16 firefighters and the required apparatus type must arrive at an incident within 8 minutes.
Variable bounds. It is unlikely that the variables in an optimization problem are negatively or positively limitless. Instead the variables usually have bounds; for example, the number of apparatus must be positive and must be integers (You can't have half a pumper!)
In linear programming all of the mathematical expressions for the objective function and constraints are linear. The programming in linear programming is an archaic use of the word ‘programming’ to mean planning. Linear programming can be thought of as ‘planning with linear models’. From: Practical Optimization: A Gentle Introduction; John W. Chinneck, 2001; Carleton University

Service Efficiency Review – Toronto Fire Services & Toronto EMS
Page | 45
The objective of the linear program is to minimize the number of apparatus needed while at the
same time making sure two pumpers (or rescues), and one aerial can reach potential fires within eight minutes. Other apparatus (designated as “X” apparatus), must also reach major incidents so that the first response to residential and commercial alarms includes at least 16 firefighters (including Division Chiefs). Note that the analysis assumed that Division Chiefs would continue to be based from their current station locations.
2.4.2 Caveats and Assumptions
Other staffed fire suppression apparatus (e.g. air light, hazmat and others which are referred to as Specialized Apparatus in Section 3.3.10.3 of NFPA 1710) are not included in the scope of this analysis and may be a necessary component of a second alarm response.
No adjustments have been suggested to Toronto’s current response or use of air light, hazmat, high rise, or other specialized apparatus.
It is assumed the pumper currently on the island will continue to be housed there.
It is assumed that the location of fire stations will not change; e.g., no new stations will be built in new locations or stations closed.
It is assumed that no apparatus will be reduced, increased, or relocated other than those
suggested by the results of this analysis.
Like every other analysis of this kind the assumption is that all staff and apparatus are available and in stations which isn’t always the case.
The variance between what our analysis indicates are the required resource levels to achieve the response metrics to a suppression incident in Toronto, as described above, and TFS’ existing resources requires some caution in its interpretation.
Our analysis indicates that the number of resources required to:
accomplish a 4 minute initial response to a fire suppression incident;
followed by an 8 minute response for the deployment of a full alarm assignment;
applied on a Toronto-wide basis would be 106 apparatus in total compared to TFS’s existing total of 128.
The distribution of these resources, by type, is shown in Table 2, below.
Table 2 - Comparison of Current Apparatus Configuration and Proposed Configuration
Row Apparatus
Type Pumpers Rescue Aerials Squads
Air Light
HazMat Unit
High Rise Unit
Total Apparatus
1 Current Configuration
58 28 30 5 4 2 1 128
2
Analyzed Configuration (Pumpers & Rescues)
72 22 5 4 2 1 106

Service Efficiency Review – Toronto Fire Services & Toronto EMS
Page | 46
Command Units and District Chief Units are not shown in the count since they are external to
the daily staffed apparatus.
Some factors have to be considered
The variance between the analyzed configuration (Row 2 in Table 2) and the current staffing configuration (Row 1) is not as pronounced as it first appears. Some factors have to be considered:
We noted in the section 2.2 Fire Services Data and Statistics, that Toronto’s total apparatus includes a contingency for vacancies and paid absences which could be 2 to 3.5 apparatus a day.
The current resource configuration includes a contingency of up to 16 apparatus a day (or 12.5% of the apparatus) for training purposes; that is, up to 16 trucks a day might be moved from front line service to training. Training is a crucial factor in firefighters’ maintaining competence for the many varied tasks they have to perform. However,
these apparatus can quickly be deployed back to front line service if call volume warrants.
The Pomax analysis assumes 106 pumpers and rescue trucks are required to ensure fire
response to the city within mandated parameters. However, this estimation does not account for the 2.5 to 3 apparatus per day vacant due to paid absences or other reasons. It also does not make allowances for training requirements which currently
utilize 12.5% of the apparatus and front line staff. That equates to another (106 x 12.5%) = 13 apparatus.
Paid absences and training represent 16 apparatus per day, on average, which results in total of (106 + 13 + 3) = 122 apparatus
There is a difference of 6 apparatus between current nominal staffing of 128 and
Pomax’s calculated requirement of 122.
2.4.3 A Re-evaluation of the TFS Resource Analysis
Recognizing that any suggestion that a change in fire resource requirements in Toronto will be closely examined, particularly one that suggests that the fire service can accomplish its existing
response requirements with fewer resources, we undertook a second analysis based on geography, response time, and existing station locations. This assessment was designed to determine if there are any fire stations that provide extensive redundant coverage; that is, the response areas overlap to a great extent, and what impact there would be on geographic and address coverage if they were removed from the fire services system.
The second analysis (the one explained below), is a more traditional method of calculating fire service resource needs and has been used at least twice before in the City of Toronto: in the 1999 Fire and EMS Station Location Study led by KPMG, and for the Fire Master Plan in 2007, also led by KPMG. However, in 1999 and 2007 EMME/2, a transportation planning tool, was
used instead of ArcInfo although they serve similar purposes. This method is commonly used

Service Efficiency Review – Toronto Fire Services & Toronto EMS
Page | 47
for fire and EMS station location analysis as well as determining police ‘beats’, and is widely
used for transportation analysis.
This approach created a Geographic Information Systems (GIS) based simulation model using ArcMAP 1011 and its network analyst extension. The model plots and analyzes the response time contours for the existing stations in Toronto.
The determination and calibration of response time contours is a four-step process12:
1. Geocoding the fire calls onto the network,
2. Assigning speed and travel time to the network links,
3. Generating response time contours (4 minute, and 8 minute) for each station, and
4. Comparing of the number of geocoded calls included in the response contour to the pattern of the total call dataset.
The final three steps are part of an iterative framework. Each step is briefly described below.
Figure 6 - Response time model calibration flow chart
11 ArcMap is one of several applications integrated into ArcGIS for Desktop and is used to view, edit and query geospatial data, and create maps. 12 This four-step process is a standard method in traffic and response analysis.
Generate response time contours
Threshold met?
Geocode Calls
Assign speed, travel time, road restrictions, and
intersection delays to the road network
Compare contours
No
Stop
Yes

Service Efficiency Review – Toronto Fire Services & Toronto EMS
Page | 48
Step 1—Geocode Call Data – Geocode the fire calls data to spatially locate each call on to the
model network.
Normally, this is done through Global Positioning System (GPS) coordinates contained in the call origination point data. Sometimes, the data will not have GPS coordinates, but only a street address. In those cases, the model should have street address range information so that the call origin data can be correctly located in the model. Assigning these call data to the mapping is referred to as geocoding.
This step also includes cleaning of the data, to remove major anomalies, such as partial data entries, street name corrections, and averaging out the response times in case there are multiple instances of fire response to a particular location (assuming the start point was the
same). This step was completed by Toronto’s Social Development, Finance and Administration Unit.
A 75-80 percent accuracy threshold is generally accepted in the industry to account for inaccurate address entries during data creation and transfer. Also all responses that were reported to be over 15 minutes were discarded.
The above matched calls were stratified based on the associated fire station and a response time of 4 minutes or less, and 8 minute or less.
Step 2—Speed, Travel Time, Road Restrictions, Intersection Delays Assignment to the Road Network
a. An initial speed and travel time were assigned to each link on the network based on posted speeds. Travel restrictions including one-way prohibitions were also imposed as posted. This was initially completed by Toronto’s Social Development, Finance & Administration Division.
b. Fire apparatus travel times were further modified to reflect time lost for turning movements at intersections, intersection congestion delays etc.. Some one-way travel restrictions were also eased, meaning emergency vehicles were allowed to violate the one-way travel restrictions on collector roads (short sections on minor streets).
However, no one-way violations were allowed for major arterials, expressways, and
ramps. Any travel restrictions on trails were taken into account.
Step 3—Generate Response Time Contours
a. Four and eight minute response travel time contours for each fire station were developed using the network analyst extension in ArcMap 10. These represent the distance that fire apparatus can travel from its station within 4 and 8 minutes respectively.
b. For all calls that were responded by each station, there were numerous situations where multiple units responded to a call, or multiple responses were made to one location in the course of the year (happens more often in multi-unit residences, for
example). All such multiple response times were averaged for each call originating location. That way the outlier effects are expected to be minimized.

Service Efficiency Review – Toronto Fire Services & Toronto EMS
Page | 49
c. The calculated travel time, travel restrictions, network travel time and intersection
delays, were used as factors to generate the response contours.
Step 4—Comparison of Modeled Time Contours to Actual Data
a. Representative stations were chosen across the City to calibrate the generated contours according to the observed values. Each of the generated travel time contours was compared to the extent of the distribution of the 4.0 minute calls for the respective stations. This was also repeated for 8.0 minute calls.
b. The intersection turning movement delay values were fine-tuned so that the resulting contours reflected the observed values well, both for 4-minute and 8-minute windows. This was done by comparing how many responses the contour wrongly predicted, both
inside and outside the contour (as in points that should have been within a 4 minute or 8 minute contour but were left out, as well as points that were captured within the contour, but should have been out because they were greater than 4 minutes or 8-minutes). The intersection turning movement delay values were adjusted until the variances were reduced as much as possible, or in other words the ArcMap generated contour was best reflecting the observed (real-life TFS) data.
c. The process was repeated with all the representative fire stations to arrive at the overall best combination of the intersection turning movement delay values. The percentage match for 4-minute contours was between 73 and 85%, and the match for 8-minute contours was between 82 and 91%. This is considered an acceptable to very
good match by transportation industry standards.
d. A 75 percent threshold is generally used for attaining calibration because some calls in the dataset have human error in the data generation point, and to also account for outliers in the dataset. Outliers are incident records that appear to have: (1) incorrectly-entered address ranges, (2) trip start and end times that indicate incorrect travel time from the fire hall, or (3) other anomalies. Although there is no scientific basis, the 75 percent threshold is an industry accepted practice for response time modeling.
The resulting 4 and 8 minute coverage contours are shown in the attached maps: Fire Stations:
4-Minute Coverage and Fire Stations: 8-Minute Coverage.
Coverage Overlap Analysis
In the course of our coverage area contours analysis, we noted that fire stations in the city are generally located so as to provide a quick response to calls, especially in the critical first 4 minutes. Nevertheless, it was observed that a few of the stations demonstrated significant overlap of a 4-minute coverage area with adjacent stations, meaning that in case of an emergency call in those areas, there was more than one station that could provide adequate coverage within the first 4-minutes. These are stations 312, 325, 332, 343, and 424. An analysis was conducted to determine the loss of 4-minute coverage if these were removed. In an ideal scenario, there should be no reduction in coverage by removing a station if that station
coverage area was completely overlapped by other station areas. Each scenario was analyzed for 4, and 8-minute travel time contours, first with all fire stations unchanged and, second with

Service Efficiency Review – Toronto Fire Services & Toronto EMS
Page | 50
the absence of the stations mentioned. The coverage comparisons were based on two
parameters: geographic area; and building address points. Note that according to the City’s available maps and statistics, the geographic area of Toronto is 641.45 sq. km., and there are 516,000 address points in the City. Numerical coverage comparisons are presented in Table 3, below.
Table 3 - Contour coverage for Toronto with and without Fire Stations 312, 325, 332, 343 and 424
Contours All Fire Stations Intact
(1)
Without Stations 312, 325, 332, 343 and 424
(2)
Coverage Change (1)-(2)
Geographic
Coverage (%) Address
Coverage (%) Geographic
Coverage (%) Address
Coverage (%) Geographic
Coverage (%) Address
Coverage (%)
4-minute 78.94 90.35 78.91 90.25 0.03 0.10
8-minute 93.21 99.00 93.21 99.00 0.00 0.00
As can be seen from Table 3, the 4-minute coverage change by removing the five fire stations is
about 0.03% geography, and 0.10% address points (0.14 sq. km., and 544 address points respectively). With 8-minute coverage contours, there is no observed loss of coverage if the aforementioned stations were not in place. This shows that fire stations 312, 325, 332, 343, and 424 could be assumed to be redundant and other adjacent stations could provide effective coverage with little loss in 4-min response time limit.
Table 3 indicates that change in total geographic coverage, based on the fire station
adjustments suggested above, is a reduction of 0.03% in 4 minute coverage. Translated to address points, 0.10% (0.14 sq. km., and 544 address points respectively), would fall outside the 4 minute travel time area. With 8-minute coverage contours, there is no observed loss of coverage by removing the aforementioned stations. This indicates that fire stations 312, 325, 332, 343, and 424 can contribute to efficiencies the city may wish to put into place, and other adjacent stations could effectively provide effective coverage with little loss in 4-minute response time limit.
Maps 6 and 7 indicate Toronto’s calculated 4 minute and 8 minute travel time areas. Map 8 is offered as an example and demonstrates concurrent station coverage more clearly than can be
observed in Maps 6 and 7.
Some qualifiers to these results
As has been said many times, our analysis is based on 4 and 8 minute response parameters and the analysis indicated that the 4 and 8 minute targets could be met, with minimal loss of address or geographic coverage even if stations 312, 325, 332, 343, and 424 were not in place. However, except for 343, these stations currently achieve a lower than 4 minute 90th percentile. Specifically, in 2011, the 90th percentile response to the areas covered by these stations were:

Service Efficiency Review – Toronto Fire Services & Toronto EMS
Page | 51
Table 4 - 2011 90th Percentile Response Times for Stations 312, 325, 332, 343, and 424
Station 90th
Percentile Response Time in 2011 in Minutes and seconds
312 3:15
325 3:22
332 3:36
343 4:22
424 3:16
Other than station 424 at 426 Runnymede Road, the other stations are in the downtown core where there is a proliferation of high rise buildings.
Station 343 already has a 90th percentile which exceeds the 4 minute target therefore we would be cautious about any further suggestion that it should become redundant.
Travel time in the 312, 325 and 332 catchment areas would increase by 24 seconds to 45
seconds at the 90th percentile (although they would still achieve the 4 minute travel time target).
The additional travel time from other stations would increase the Initiating Action/Intervention Time in these high-rise areas (NFPA 3.3.53.3 defines Initiating Action/Intervention Time as the time interval from when a unit arrives on the scene to the initiation of emergency mitigation).
Our analysis has to be tempered with operational expertise and realities
Our two analyses indicate that there are opportunities for efficiencies based on a realigned distribution of firefighting apparatus. However, our analysis has to be tempered with operational expertise and realities. During the 2013 budget process, TFS put forward reductions to meet the zero increase budget:
“Five front line emergency response vehicles will be deleted from the operations division
on a permanent basis. This represents a reduction of 83 operations staff, and reassignment of the remaining 17 staff assigned to these vehicles to assist with staffing levels on other vehicles, which may keep more trucks in service on a daily basis.”
“The vehicles proposed for deletion include:”
Table 5 - Table Excerpt from TFS Briefing Note
# of Truck Runs
Truck Address Ward 2011 2010 2009 2008 2007
P424 426 Runnymede Rd. 13 1,350 1,342 1,335 1,331 1,333
P413 1549 Albion Rd. 1 1,676 1,560 2,145 1,603 1,896
P215* 5318 Lawrence Ave. E. 44 720 698 689 653 725
A324* 840 Gerrard St. E. 30 908 936 829 996 1,032
P213* 7 Lapsley Rd. 42 1,690 1,599 1,735 1,486 1,500

Service Efficiency Review – Toronto Fire Services & Toronto EMS
Page | 52
“Four of the five vehicles identified represent secondary trucks in existing fire stations,
and do not result in station closures. The removal of P424 includes a recommendation to close the fire station, which has been recommended through various studies over the years, starting with the Toronto Fire Department Master Fire Plan completed in 1987, the 1999 KPMG study, and most recently in the 2007 Master Fire Plan.”
2.4.4 Observations
The two GIS analyses we conducted using ArcGIS indicates that there is an opportunity for rationalization of resources within TFS, and there are several options to the rationalization. One of the options for apparatus reduction is the one stated in Briefing Note #17.
Although our analysis does not highlight the particular stations discussed in Briefing Note #17 – except for Station 424 – they do support the intent of the Note. However, realignment of apparatus does not have to specifically follow our findings since each step taken to gain efficiency has a secondary effect on other possible efficiencies. The specific re-distribution of stations and apparatus should be left to the operational expertise of the Fire Chief and City of Toronto administration. Nevertheless, since the option laid out in the briefing note is likely the least disruptive of any possibility, that may be the best way to proceed.
Continued analysis could refine resource distribution even further and may discover other configurations of stations and equipment that would achieve an acceptable level of efficiency. However, evidence indicates that the best opportunity for change and future reconfiguration of
apparatus is in conjunction with increased fire prevention and public education initiatives.
The ability to determine the most efficient and effective distribution of resources requires an acceptable support structure. This includes a Business Intelligence tool as noted in Appendix ‘B’ of the 2007 – 2011 Fire Master Plan recommendations as well as sufficient staff to utilize the software and provide detailed information to fire administration.
Existing and future records management systems should be used to identify trends in emergency incidents to identify areas of concern for public educators, to ensure resources are used as effectively as possible. This includes identification of the need for increased use of existing programs, and the need to develop new programs to deal with emerging or new issues.
Business Intelligence project being implemented in 2011 will expand in future years to include RMS data mining/analysis. Establishing an interface between One Step and RMS is a requirement of the initiative.
Changes to the provision of fire services and a shift in the manner of conducting business – that is, an equal emphasis on public education and fire prevention dealt are always controversial. Therefore, it would be reasonable for the City to strongly consider public discussion and consultation as part of future change processes.
2.4.5 Recommendations
Continue to implement Business Intelligence reporting software in TFS as a means to
enhance the availability and depth of statistical and response information. Enhance

Service Efficiency Review – Toronto Fire Services & Toronto EMS
Page | 53
business analysis capability in TFS to maximize the use and capacity of the Business
Intelligence software.
Continue to move forward with the closure of station 424 at 426 Runnymede Road and consider other apparatus rationalization.
2.5 Fire Service Risk and Mitigation
This section examines the concept of ‘risk’ as well as action that has been found, in other jurisdictions, to mitigate risk
2.5.1 Fire Sub-Risk Overview
Typically an Operational Review of the magnitude presented in this report should include a Comprehensive Fire Risk Assessment (CFRA) or analysis in order to quantify and substantiate the final recommendations. Unfortunately, the time and complexity of this task did not allow for a CFRA to be undertaken. Instead, we performed a Fire Sub-Risk Overview which can be found in Appendix G – Risk – High Level Overview and we suggest Toronto should be aware that any rationalization of resources beyond those already recommended in this report, without consideration of a comprehensive review, might result in decisions being made that have unintentional consequences for the city.
A comprehensive review should include a comparison of data from past and current Fire Underwriter Survey (FUS) reports. These reports include a review of factors separate from fire
service readiness and response capability, but which can have an impact upon the community fire risk profile.
Major features assessed during fire protection surveys include:
1. Water supply systems - 30%
2. Fire department administration and operations - 30%
3. Fire service communications - 10%
4. Fire safety control including building and fire prevention codes and their
5. enforcement. - 20%
These functions are measured against recognized standards of fire protection. The insurance ratings dictate part of the cost to Toronto taxpayers for fire damage protection through premium costs. Total costs for fire protection to individual taxpayers and building occupants is the combined total of the fire service portion of their municipal tax and insurance premium costs for fire. Insurance costs can be impacted by the factors considered in a FUS report. In 2002 FUS conducted a survey and prepared a report for the City of Toronto indicating the City had retained its Commercial Classification of 3 pending a review. In the staff report to Council, it was pointed out that Toronto retained its Commercial Classification assisted by the hiring of an additional 55 firefighters which “demonstrated the City would provide the means for TFS to
maintain the appropriate level of fire apparatus in service”. The Underwriters found the City’s fire services at that time to be “generally understaffed to meet its commitments in both its

Service Efficiency Review – Toronto Fire Services & Toronto EMS
Page | 54
vehicle staffing and in important support functions”. A FUS survey has recently been completed
for the City and a discussion of that impact has already been held with City Council. The previous survey (2002) was unavailable to Pomax for review.
It should be emphasized that this risk overview looks at the fire risk issue only and does not include many other response activities provided by TFS.
2.5.2 Observations and Conclusions from the Risk Overview
The City should consider the following actions:
1) Conducting a comprehensive Fire Risk Analysis for the purpose of establishing the level of community risk and the magnitude or extent of potential loss and the probability of
such loss. This analysis should include the involvement of senior building inspection staff.
2) Establishing annual Fire Code Compliance inspections of high risk occupancies by TFS personnel.
3) Adopting an aggressive enforcement policy for all Fire Code violations that impact upon the immediate life safety of the occupants of a building.
4) Establishing a policy and method for reimbursement of every inspection required as a result of non-compliance with the Ontario Fire Code.
5) Piloting the concept of specialty teams for complex occupancies and develop in-house expertise to assist inspectors with the application of the Fire Code in these occupancies.
6) Aggressively pursuing mobile technology solutions to improve the efficiency of inspection and enforcement of the Fire Code requirements for buildings.
7) Establishing a fire prevention activity policy for operations crews including a training program on pertinent areas of the Ontario Fire Code.
8) Establishing a Fire Investigation team which would conduct in-depth investigations of specific fire incidents to determine cause to better identify the “fire problem” in Toronto so that appropriate proactive programs can be tailored to the needs identified by the investigations.
2.5.3 Refocusing on Prevention and Inspection
We noted earlier that, when evaluating an acceptable level of resources and possible efficiencies, the City should take into account the opportunity for change and possible future reconfiguration of apparatus in conjunction with increased fire prevention and public education initiatives. It is important to note that any efficiency in staff and apparatus should not take place in isolation. A robust approach to data capture, analysis, fire prevention, public education, and working with other City agencies will be required in concert with other efficiencies.
The United Kingdom embarked on a journey, more than 10 years ago, to become more efficient in many areas of public service, including fire services. Cities in the United Kingdom focused their efforts on prevention and education during a period of budget reduction and there are
lessons for the City of Toronto in the process used to accomplish efficiencies. We have heard a

Service Efficiency Review – Toronto Fire Services & Toronto EMS
Page | 55
number of comments that there is a different social fabric in the United Kingdom, building
construction and legislation is different, firefighting techniques are different, and those differences cause challenges when trying to apply them to Canada. We listened the concerns and comments that were expressed but applying the process used to accomplish change and efficiency in the UK is easily transferrable to Canada.
We also understand that, intuitively, one would expect that reduced fire response would result in an increased death rate from fire however, that was not the case in the UK. The downward trend in fire deaths, as seen in Chart 6 - United Kingdom Fire Deaths 2002/3 - 2010/11 even while there were reductions in fire staff levels, has been attributed to increased Home Safety Checks, as well as other prevention initiatives and the use of software such as Phoenix and PinPoint13 which helps to determine fluid staffing and apparatus configurations based on hour of the day.
Chart 7 - Accidental Dwelling Fires and Home Fire Risk Assessment demonstrates the decline in dwelling fires in the Greater Manchester area of the United Kingdom in relation to an increase in home fire risk inspections, at the same time as staffing and resource efficiencies were being put into place (please see Chart 8 - United Kingdom Cumulative Staff Reductions). Similar results have been achieved across the United Kingdom.
Please also see Exhibit 5 - London Financial Times - United Kingdom Fire Services' Overhaul from the London Financial Times.
Although Toronto isn’t facing massive budget reductions from a central level of government that were the catalyst for finding new ways of conducting business in the fire services of the
United Kingdom, refocusing efforts on fire prevention and inspection, the utilization of off the shelf software such as Phoenix and PinPoint, and a greater involvement with other City departments, could eventually result in the City experiencing cost savings as was seen in the
United Kingdom.
Additional information about the United Kingdom Fire Service, particularly the City of Manchester can be found in Appendix K –
Case Study: United Kingdom.
Chart 6 - United Kingdom Fire Deaths 2002/3 - 2010/11
13 Phoenix and PinPoint are software programs produced by Active Informatics. Similar programs are available from other software companies.

Service Efficiency Review – Toronto Fire Services & Toronto EMS
Page | 56
Chart 7 - Accidental Dwelling Fires and Home Fire Risk Assessment
Chart 8 - United Kingdom Cumulative Staff Reductions

Service Efficiency Review – Toronto Fire Services & Toronto EMS
Page | 57
Exhibit 5 - London Financial Times - United Kingdom Fire Services' Overhaul

Service Efficiency Review – Toronto Fire Services & Toronto EMS
Page | 58
2.5.4 Prevention/Education/Investigation/Enforcement
Toronto’s Fire Prevention operations meet the minimum requirements of the Fire Protection and Prevention Act with respect to:
a simplified risk assessment
a smoke alarm program
distribution of fire safety education materials
inspections upon complaint or request
However, it is unlikely that they meet the needs of the community related to the City of
Toronto’s building stock, density and demographics. Fire inspections, code enforcement, fire investigation and public education are key components to decreasing fire occurrence as well as the resulting impact upon people and property.
Inspection and enforcement have been long-standing issues throughout Ontario. As far back as December of 1983, the Honourable Justice John Webber issued a Report of the Public Inquiry into Fire Safety in Highrise Buildings. Justice Webber was appointed by Order-In-Council to conduct the inquiry in the aftermath of a number of serious fires in highrise buildings, the bulk of which were in Toronto. Among the recommendations were:
“2.8 Increased funding should be provided to ensure proper inspection by Ontario
Building Code and Ontario Fire Code inspectors of all highrise buildings.”
“2.11 The Ontario Fire Code should be more actively enforced and the courts should impose substantially increased penalties for breaches of the Ontario Fire Code, and upon convictions for Criminal Code offences involving fire safety matters.”
Toronto’s “needs” far outstrip its resources and capabilities related to fire prevention activities. There is a need for TFS to become more proactive with inspection and public education programs. Additionally, a more aggressive code enforcement policy and level of action is needed as a critical component of ensuring compliance with the Ontario Fire Code. Time should be spent preparing a consistent approach to the sentencing aspect of legal proceedings to
maximize the fines assessed, particularly in violations having an impact on immediate life safety.
Fire operations (suppression) personnel should be engaged in more fire prevention related activities as part of their regular duties. And suppression crews should be trained to a level of understanding in the application of the Ontario Fire Code to allow them to carry out at least a basic level of inspection, particularly where there is a mixed commercial/residential use of a building. These crews should also be trained to a level of understanding related to Fire Code requirements for immediate life safety issues, higher risk residential occupancies such as highrise apartments and condos, retirement homes, etc., to the point that they can coordinate inspection and follow up requirements with fire prevention officers.

Service Efficiency Review – Toronto Fire Services & Toronto EMS
Page | 59
Effective prevention and public education begins with knowing what the fire problem is in the
community. Knowing the fire problem requires the investigation and determination of the cause of fires. There should be an effort to investigate every residential fire to determine origin and cause. Where investigations uncover Ontario Fire Code violations there should be a policy for prosecution. Where investigations indicate the possibility of criminal liability, investigators should be working closely with the police with a view to prosecution; for example; criminal negligence in fatalities where there was no working smoke alarm.
The Fire Prevention and Public Education Division has proposed a phased-in, cyclical building inspection program, based upon risk. That proposal is set out in Table 6 - Proposed Risk Based Inspection Chart. Our notes gleaned from interviews with the Fire Prevention and Public
Education Division follow that table. But we don’t believe the implementation to be adequately aggressive. Additionally, the way the process is laid out does not provide the flexibility required to be responsive to the needed mix of inspection and education staff at any time of the program implementation process.
Table 6 - Proposed Risk Based Inspection Chart
OccupancyTotal # of
Occupancies (#)
Hours per
Inspection
(H)
Total Hours
(# x H = T)
Frequency
(F)
(1 = annual)
Total Inspection
Days (TD)
T x F/7
Total Person Years
(TPY)
TD/168
Assembly - General 5,597 1 5597 1 799.6 4.8
Assembly > 150 737 2 1474 1 210.6 1.3
Assembly >300 353 3.5 1235.5 1 176.5 1.1
Elementary Schools 806 3 2418 1 345.4 2.1
High Schools 205 4 820 1 117.1 0.7
Daycares 900 3 2700 1 385.7 2.3
Hospitals 40 80 3200 0.5 228.6 1.4
B1 30 4 120 1 17.1 0.1
B2 221 3 663 1 94.7 0.6
B3 159 2.5 397.5 1 56.8 0.3
Rooming Houses & Group Homes 1,718 2 3436 1 490.9 2.9
Residential High Rise 3,720 4 14880 0.5 1062.9 6.3
Residential Mid Rise 4,257 2 8514 0.5 608.1 3.6
Night Clubs 100 2 200 2 57.1 0.3
Hotel, High Rise 100 5 500 1 71.4 0.4
Hotel, Mid Rise 33 4 132 1 18.9 0.1
Business, Mercantile & Personal Services 20,784 1 20784 0.3 890.7 5.3
High Hazard Industrial Occupancies 2,775 4 11100 1 1585.7 9.4
Medium Hazard Industrial Occupancies 7,919 3 23757 0.5 1696.9 10.1
Low Hazard Industrial Occupancies 964 2 1928 0.3 82.6 0.5
53.6Full Time Insepction Staff Required

Service Efficiency Review – Toronto Fire Services & Toronto EMS
Page | 60
Observations from interviews with the Fire Prevention and Public Education Division
1) Program Basis
a. According to TFS’s experience, most fire death reports that they have reviewed indicate that some fire code violation existed in the building where the death occurred. More effective code enforcement should reduce these tragedies.
b. The inspection staff complement proposed by TFS (Table 6) is based upon information from many very experienced code enforcement people both in Toronto and from the NFPA technical committee which are writing the NFPA 1730 standard for Fire Prevention.
c. TFS suggests that implementation of this program be piloted in one command with 15 dedicated people. We continue to believe a more aggressive approach starting with 27 additional fire prevention staff in 2014 and a further 27 in 2015 will jump-start the prevention program.
2) TFS proposes to consolidate enforcement offices to one office in each command and Public Education into one location for the city.
a. There is an expectation that improvements in supervision and consistency of enforcement would be gained.
b. It is also believed that consolidation would allow the Captain to Inspector ratio and
the District Chief to Captain ratio to be increased resulting in savings when expanding the number of inspection staff.
c. Staff training would be easier and there would be efficiencies in work assignment resulting in better service to the public.
d. TFS expects cost savings as less backfill acting time would be required for the officer ranks, and there would be more efficient use of facilities, support staff, vehicles, etc. Once again, a six month pilot in one command is suggested. Costs should be monitored to prove these expectations.
e. Another expectation is that establishing one Public Education Centre in Toronto will
mean more efficient use of staff time which should result in contact with far more citizens over the year. The theory is that children’s and other groups would travel to TFS for education. However, TFS should provide supporting evidence, from other departments, of reduced staff costs and improved educational opportunities before putting this system into place. It’s possible that increased staff costs from having several public education facilities in the city would be offset by a higher level of awareness, greater public safety, and eventually reduced fire costs.
f. We support any move towards greater education, prevention, and awareness but beliefs and expectations need to be supported with a business case before money is spent to put in place a system that may not deliver on those beliefs and
expectations.

Service Efficiency Review – Toronto Fire Services & Toronto EMS
Page | 61
3) Mobile/portable computing for Fire Code Enforcement inspection work. To work
properly and increase efficiency, inspectors must be able to input data while performing inspections and viewing violations. There must then be the capability to generate a report and send it to the owner of the building in real time. This will require a commitment to acquire and support the appropriate technology. TFS suggests a pilot involving 10 inspectors in one command as a pilot project to assess hardware and software.
4) Specialty teams for complicated occupancies. There are some occupancies in Toronto that are very complicated, high risk and few in number. It is not practical to keep all staff trained and have enough practice to maintain the knowledge in some of these
occupancy types.
5) Operational staff can be used to perform fire code enforcement inspection duties in certain occupancies, and expand public education activities in their station districts.
6) TFS has identified the need to have a Post Fire Investigation team to investigate the cause of fires in Toronto. Three of the 54 recommended fire prevention and inspection staff would be required to initiate this program. This would assist TFS in identifying local trends related to smaller fires and “near misses” upon which risk, response, prevention and education programs can be tailored. Currently only large fire and fire fatality investigations take place. TFS suggests that a pilot project assigning 1 investigator to each Command should be instituted in 2013. These individuals would be Fire Prevention
Officers trained as investigators who could perform fire prevention duties when not actively involved in an investigation.
7) The Ontario Fire Code makes it the responsibility of building owner’s to comply with the Code. Responsible owners who are compliant with the Ontario Fire Code should be entitled to a cyclical inspection as part of what their taxes provide. However, taxpayers should not be burdened with having to pick up the costs for subsequent inspections triggered by non-compliance. To that end, the City should consider a policy and authority to charge building owners for every inspection that is triggered by non-
compliance with the Ontario Fire Code.
References OFC, FPPA, NFPA and TFS proposal
Conclusions and Comments
While we agree with the spirit of the staffing enhancement proposed in Table 6 the staff numbers are inadequate to accommodate an inspection and enforcement program, as well as a public education and prevention program. We observed from the United Kingdom’s experience that a strong inspection and prevention strategy is important, and should be considered an investment in the cost reduction process, if a service-wide cost mitigation initiative is to be successful. The Division has requested and justified 54 new staff for inspections alone whereas,
to meet both inspection and prevention programs the additional complement should be closer to 100 staff.

Service Efficiency Review – Toronto Fire Services & Toronto EMS
Page | 62
As well, instead of new complement being restricted to inspection programs as shown in Table
6, these complement should be a mix of inspection, enforcement, education and prevention, and business analyst staff as required by the Fire Prevention and Public Education Division from time to time.
The annual cost of a fire inspector is $103,430, which includes salary, benefits, and uniform costs.
Annual costs for 54 inspectors would be (54 x $103,430) = $5.4 million
Annual costs for 100 public education and inspection staff would be (100 x $103,430) = $10,343,000
An investment in public education and inspection staff should result in:
a reduced risk and incidence of fires on a per capita basis;
a reduction in false alarms (although that will also affect income due to a reduced level
of fines);
reduced property loss;
a reduced risk of loss of life and injury to both private citizens and firefighters;
the ability for the City to reduce suppression staff over a prolonged period of approximately 10 years; and,
recovery of the cost of inspection and education staff through other efficiencies.
We recognize the realities of a $10.3 million budget implication based on the hiring of 100 additional staff, as well as the logistics of hiring, training, placing staff in the field, implementing associated technology, and coordinating enhanced education and inspection programs. Our expectation is that a program expansion of this magnitude would take place over several years.
Our expectation is that the benefits of an increased education, prevention, and inspection program should become apparent approximately 5 years after implementation by way of a reduction in emergency responses within the operations and fire suppression division. The City may want to evaluate the possibility of further rationalization of fire resources at that time. In the interim, and in preparation for the expected benefits of prevention initiatives, it is important to undertake a comprehensive risk analysis of the City in addition to engaging the
public to discuss the benefits and implications of fire service rationalization.
To achieve a substantial reduction in response costs, the focus of the fire services must change to a human services organization. To spur that change both TEMS and the Fire Services should report to the Deputy City Manager with responsibility for human and social services. Another high priority, after accomplishing this organizational change, is to achieve a refocusing strategy so that fire services can take on a greater role in mitigating the effect of fire and other emergency impacts on the citizens of Toronto by means of education and prevention.

Service Efficiency Review – Toronto Fire Services & Toronto EMS
Page | 63
2.5.5 Recommendations
Implement dynamic staging and use of predictive modeling and pre-emptive traffic controls to better predict demand and more effectively deploy fire resources and apparatus.
Conduct a city-wide comprehensive fire risk analysis to review opportunities for further reductions and rationalization of fire response and suppression resources and apparatus.
Implement a strategy to focus TFS resources on prevention, inspection and public education to reduce the incidence of fires and other emergencies. The strategy should consider increasing public education, prevention, and inspection staff at TFS by 54 FTEs
in the shorter-term with a further increase of 46 FTEs in future years.
Develop a more integrated City approach to emergency prevention and education to
better coordinate City efforts across multiple divisions to reduce fire and other
emergencies, particularly in vulnerable communities.
Adopt an aggressive enforcement policy for Fire Code violations that impact upon the immediate life safety of the occupants of a building.
Establish a policy and method to require building and site owners to bear the cost for follow up inspections required as a result of non-compliance with the Ontario Fire Code.
Establish annual Fire Code Compliance inspections of high risk occupancies.
Establish a Fire Investigation team to conduct in-depth investigations and determine the
cause of fire incidents in Toronto. Improve prevention programs by integrating causes identified by fire investigations into program design.
Train fire suppression crews on key areas of the Ontario Fire Code and utilize them to augment incident prevention and inspection activities.
Pursue mobile technology solutions to improve the efficiency of inspection and
enforcement of Fire Code requirements.

Service Efficiency Review – Toronto Fire Services & Toronto EMS
Page | 64
3.0 Toronto Emergency Medical Services
3.1 Advanced Life Support and Advanced Care Paramedics in EMS
This section examines the level of pre-hospital medical care that should be provided to the City of Toronto and the most effective method of delivering that care. There are some fundamental issues that should be discussed as a precursor to determining the most appropriate level of pre-hospital medical care for Toronto and the method of delivery.
The issues are the 1) utilization of primary and advanced care paramedics and the care they can
provide and 2) the delivery model which includes firefighters.
In this section, the following questions are discussed:
1. Does having advanced life support or advanced care paramedic staff matter? 2. To what extent does having advanced life support or advanced care paramedic staff
matter? 3. How should pre-hospital care be delivered? 4. Does response time matter?
Advanced life support refers to the service provided by advanced care paramedics. So functionally, the terms are used interchangeably, one indicating the service provided and one
indicating the service providers.
The questions of whether advanced life support (ALS) should be provided, to what degree, and in what format have been around since the origins of pre-hospital care. Analyses, research, and publications have been presented by many participants in medical specialties, emergency management, politics, public health, nursing, operational management, and economics.
Indeed, the City of Toronto was an early adopter in Ontario with the introduction of advanced care paramedics in the mid-1980s, a move that helped to create the shift towards advanced pre-hospital care in many other areas of the province. The Ontario Pre-hospital Advanced Life Support (OPALS) study was designed and implemented in the late 1990s to assist the provincial
government in determining whether ALS was of benefit. We examined whether it made a difference in patient morbidity and mortality. TEMS leadership and guidance was instrumental in the development of this initiative, which is now successfully implemented in most major population areas in Ontario where there are advanced care paramedics (ACP).
Given the considerable and available research on ALS, and Toronto’s significant experience with Advanced Care Paramedics, the consulting team’s goal was not to repeat existing research and conventional knowledge. Instead, the approach was to use the team’s extensive knowledge base, experience, and findings from emerging research to analyze the impact of ALS and ACP on patient care and operations.
There are some challenges in applying available literature (research). First, clinical trials can only test what can be measured. Mortality can be measured, is obviously important, and is used
Service Efficiency Review – Toronto Fire Services & Toronto EMS
Page | 65
as the most common outcome. However, only a small percentage of the patients seen by EMS
staff die, so there has to be an extremely large effect in what is being studied in order to change mortality rates. Medical care, both pre-hospital and in-hospital, has its primary effects on morbidity, something that is difficult to measure and quantify.
In order to find hard targets to measure, research relies on proxies. In EMS, the performance of procedures in the field has commonly been used as a proxy measure for ALS intervention. This is why most studies are done on trauma and cardiac arrest. Unfortunately equating the need for procedures with a need for ALS is not a clear association. Experience shows that the ALS intervention with the largest impact on patient care is appropriate critical clinical decision making.
Take a specific critical clinical procedure such as endotracheal intubation, which is the placement of a tube through the vocal cords to aid breathing. The skill in and of itself is difficult to learn and takes repeated practice to maintain, however, the most important part of endotracheal intubation impacting patient care is the decision to perform the skill or not. In some clinical conditions, endotracheal intubation is actually related to negative outcomes. In trials, the patients who did not require endotracheal intubation in the field are often placed in the category of patients not requiring ALS intervention. In reality, those patients received ALS level decision-making and global airway management outside of the placement of a tube. We believe, and the evidence supports, that often the patient not intubated by an ACP received the better ALS decision.
Studies intended to answer the question of ALS utility look primarily at trauma and at mortality rates. Specific to trauma, mortality is tied to the speed of delivery to surgical care; hence the aphorism trauma is a surgical disease. Minimum pre-hospital and emergency department times are required. Procedures in the field are related to increased mortality because apart from a few specific time-critical, life-saving interventions based on sound clinical decision-making – decompression of tension pneumothorax (collapse of a lung under tension), control of major external bleeding, or intubation/global airway management – some advanced procedures only prolong scene times. Research demonstrates that establishing an intravenous (IV) line in the pre-hospital setting does not save lives in trauma. However, the skill and ability of the
paramedic to discern when an IV is appropriate, and to be able to perform the skill when
needed, can be a critical factor in other clinical conditions.
Aspects of the Ontario Pre-hospital Advanced Life Support (OPALS) series of trials2 are frequently cited as showing no benefit from ALS, and a worsening mortality for the most severely injured trauma patients. This is not surprising given what we now know about trauma care. Evidence shows that previous methods of field intubation of patients with head trauma worsened mortality by inadvertently affecting oxygen levels in the blood and carbon dioxide levels in the brain. However the OPALS results have to be evaluated carefully and in their entirety with respect to the performance of ALS care in the pre-hospital setting. Moving from the selection of trauma patients to those with medical issues such as congestive heart failure, it is clear the subset of patients in OPALS with respiratory distress did better with ALS. Treatment
of respiratory distress requires high-level decision making with multiple options available. The training and experience of ACPs becomes apparent in these situations.

Service Efficiency Review – Toronto Fire Services & Toronto EMS
Page | 66
Another difficulty in interpreting the literature with respect to metropolitan Canadian areas is
the definition of Advanced Life Support. Basic life support (BLS) in many countries is provided by responders with skill levels similar to the Canadian Emergency Medical Responder14 however, most countries have no intermediate level provider such as the Canadian primary care paramedic. ALS may be considered any skills above the level of BLS including such things as intravenous fluid administration and basic symptom relief, such as administration of Ventolin for asthma, which in Canada are part of the Primary Care Paramedic National Occupational Competency Profile. A study measuring ALS effect on mortality in asthma, and using ventolin administration as a proxy for ALS care, cannot be generalized to a metro Canadian system. Most asthmatics are now successfully treated by PCPs who are able to administer the required medication. This study will tell us that Ventolin administration makes a difference but cannot
discriminate between ALS and BLS for us. ALS treat the sickest of the asthma patients and while the effect on mortality exists, the number of patients is small and may not show up clearly statistically. Effect on morbidity is large but not measured. A different study would have to be designed, looking specifically at this patient group, to answer the question of ALS effect in severe asthma.
The Cochrane review15 of ALS was performed specifically to answer the question of whether or not low to middle income countries should invest in ALS training. The OPALS study figures prominently in the review. The Cochrane recommendation is that low to middle income countries should invest in emergency department care and basic system efficiencies before considering a move to ALS. A sensible recommendation, but it is critical to interpret these
findings with recognition that they are not talking about systems with ALS in place or where BLS and the receiving emergency department system are already well developed.
With respect to applicability to Toronto, the consulting team would add that as a major metropolitan area, in the heart of a leading developed country, the city of Toronto can in no way be interpreted as a low to middle-income developing area. It has one of the best living standards in Canada and an extensively developed system of primary, tertiary, and quaternary health care. The TEMS system, with extensive funding support from the provincial government, is a key element of the broader health care system.
14 The National Occupational Competency Profile for Paramedics defines Emergency Medical Responders as having successfully completed a recognized training program in emergency patient care and transportation. Historically, EMRs have been the medical first responder in rural and remote communities. They are often associated with volunteer emergency services organizations, and may be the sole provider of emergency medical services in some communities. EMRs may be responsible for initial assessments, the provision of safe and prudent care, and the transport of a patient to the most appropriate health care facility. 15 Cochrane Reviews are systematic reviews of primary research in human health care and health policy, and are internationally recognized as the highest standard in evidence-based health care. They investigate the effects of interventions for prevention, treatment and rehabilitation. They also assess the accuracy of a diagnostic test for a given condition in a specific patient group and setting. They are published online in The Cochrane Library. Each systematic review addresses a clearly formulated question; for example: Can antibiotics help in alleviating the symptoms of a sore throat? All the existing primary research on a topic that meets certain criteria is searched for and collated, and then assessed using stringent guidelines, to establish whether or not there is conclusive evidence about a specific treatment. The reviews are updated regularly, ensuring that treatment decisions can be based on the most up-to-date and reliable evidence.

Service Efficiency Review – Toronto Fire Services & Toronto EMS
Page | 67
3.1.1 Layering and Targeting Strategies
Targeting is the practice of ensuring the right level of responder (primary care paramedic [PCP] or advanced care paramedic [ACP]) is sent to the call. Layering is the practice of sending both levels of responders on some calls. For example, a caller with shortness of breath and a history of asthma who is able to speak clearly over the phone to the call taker and not in distress (MPDS “C” category) requires PCPs to administer anti-asthma medication (Ventolin) and transport to hospital. A patient with a history of asthma who is short of breath but unable to speak without stopping between words (MPDS “D”) may have impending respiratory failure and may require ALS level airway management and intervention. ALS is layered along with BLS. It is possible that once BLS arrives and administers ventolin, the patient could turn around and get better quickly. It is also possible that the patient may not improve with BLS intervention.
BLS can cancel ALS if not required or ALS can attend and help in the early phase of management then clear for the next call. If ALS is required at the scene, this patient is likely sick enough that both paramedics will be required to treat during transport to hospital with one of the PCPs driving. One study in Houston is looking at targeting vs. non-targeting in cardiac arrest found improved survival in the targeted systems10.
In looking at the question of layering and targeting, it is clear from a practical response perspective that multiple, trained clinical responders are required for some high acuity calls. Using cardiac arrest as an example, mortality is tied to response time, quality of cardiopulmonary resuscitation (CPR), timing of defibrillation, and overall efficient scene
management. CPR requires compressions to a 2.5-inch depth at a rate of 100 to 110 compressions per minute. CPR tires the compressor rapidly and it is well established that the quality of compressions deteriorates within one to two, 2-minute cycles. The compressor is changed out every 2 to 4 minutes, requiring a pool of trained responders to draw on. Airway management, defibrillation, IV starts, medication administration, and scene, bystander, and family management add to the complexity of the CPR process. Movement of the patient to the ambulance, often across uneven terrain and up or down stairs, also requires a team to lift/carry/move the stretcher, pay attention to all lines and tubes, and continue care.
Other high acuity calls, such as high acuity trauma and respiratory distress, require similar
numbers of hands at the scene. In effect, the sicker the patient, the more hands are required
for safe treatment and transport. The sickest patients often require two highly trained responders, preferably at the ACP or higher level, in the patient compartment during transportation. Without layering in this small subset of calls, the second paramedic responder rendering care in the ambulance patient compartment would not be available. Patients requiring a layered response are the sickest therefore, time is of the essence. The practice of responding a single unit to assess the patient and call for back up if required, delays care and does not serve the patient optimally. This subset of patients is best served if both responding layers are sent initially and the second layer cancelled by the first arriving vehicle as required. As previously discussed, the responders tasked with possibly cancelling a higher level of responder must have appropriate training and knowledge, and resources to do so safely.
Review by the consulting team shows that the TEMS is a leader in the process of identifying which calls require layering. Hence Toronto’s ALS vehicles can be targeted where they are most

Service Efficiency Review – Toronto Fire Services & Toronto EMS
Page | 68
effective. The recent change in the first responder allocation of the TFS on calls is the first phase
of this longitudinal project. While layering is a common occurrence in EMS systems, targeting is not. This attempt represents cutting edge work and the consulting team supports its continuation. The physicians providing oversight for the Sunnybrook Centre for Prehospital Medicine and TFS all expressed a willingness to work with this project to hone the targeting in the system to achieve best resource allocation practices while also achieving high quality clinical outcomes.
Evidence supporting the layered and targeted approaches from a clinical perspective was generated by Deputy Chief Alan Craig and others from the TEMS, and from a range of other sources. The evidence indicates that for the safe and effective performance of highly technical procedures, and for honing clinical decision making with respect to when to perform those
procedures, the paramedic who completes more procedures gets better at them. An illuminating example involves cardiac arrest and its frequency of occurrence. If we accept the norm of two cardiac arrests per 1,000 people per year, then in a city the size of Toronto, paramedics will respond to about 5,000 cardiac arrests per year (Toronto’s rate of cardiac arrests is somewhat lower). If there are 300 ALS paramedics, and each one of them works with another so that they are in a two-person team, then each ALS paramedic will likely run about 16 cardiac arrests per year. If there are only 100 ALS paramedics, they will run approximately 50 cardiac arrests per year. The evidence presented by Deputy Chief Craig and others indicates the paramedics that respond to more cardiac arrest calls provide better treatment and have higher patient survival rates.
The challenge of course is operational. In a system wanting to ensure ALS is – with some level of predictability (say 90 percent) – on every call that can benefit from it, then services require either a large number of ALS for response time coverage or a combination of BLS and ALS response to deal with both the clinical and the response time issues. If there is less ALS capability in a geographic area, it will likely take longer to get to an incident and a co-responder would need to arrive first. If the gap in time is greater, then you increasingly need that co-responder to have more training, for example to the PCP level.
British Columbia Model
In the British Columbia model for Metro Vancouver, layering and targeting has been the
practice for many years. Of the 72 vehicles staffed at peak daytime hours, only 8 are ALS capable. Yet they achieve a near 90 percent capture rate for the ALS being dispatched on calls that medical oversight has discerned as clinically likely to require an ALS responder. BLS responders are sent on calls that ALS responders are sent on if BLS responders are available. The BLS responders play:
A gatekeeper role – to cancel ALS responders if they are not required, thus freeing ALS
responders for other incidents
A transport role – to transport the patient for the ALS crew while the ALS crew is performing ongoing care to critical patients, where a two-person clinical team is
required in the patient compartment

Service Efficiency Review – Toronto Fire Services & Toronto EMS
Page | 69
A non-ALS care role – to look after and transport the patient following ALS assessment
and determination that ALS care is not required
A primary issue with the British Columbia model of delivery is that the ALS unit is often cancelled while en route or at scene despite the clinical efficacy of the caller telephone triage tool (Medical Priority Dispatch System). Experience within the British Columbia system indicates that up to 70 percent of ALS responses do not result in transport by ALS responders.
The non-transport rate does not mean the ALS provider was not required at the scene. They often intervene briefly or provide a more sophisticated lens on decision making. The ACPs can prevent inappropriate treatment and release by recognizing subtle signs of a more severe disease. For example, an elderly patient with abdominal pain may not look ill despite an
impending catastrophic situation in the abdomen. Elder patients prefer not to be transported to the hospital and will refuse transportation if a paramedic implies they are not ill with a statement such as, “well your vital signs are good and you look OK to me.” A paramedic with less training and experience may accept the patient’s refusal for transportation to the hospital. ACPs are more likely to counsel the patient strongly to go to hospital.
An additional issue with a layered and targeted system is that for a relatively large number of responses, two ambulance resources are required—one ALS and one BLS. Contrarily, some systems with a larger ALS capacity can provide coverage with a single vehicle response but this reduces the number of ALS skills Advanced Care Paramedics will be able to experience. The layered and targeted system provides excellent clinical exposure and competency, and
excellent clinical results. In effect, the goal is to avoid having too few ACPs (not enough to provide service where needed) or too many (dilution of skills leading to an impact on care provision).
Other Roles of the ALS Responder
An important consideration with ALS responders is that they perform a broader role and function than saving lives or performing lifesaving interventions. For example, the value of pain control to patients cannot be overestimated.
Just as every intervention from a physician or a nurse is not expected to be lifesaving, and just as more than 90 percent of all the patients arriving at the emergency department don’t have an
immediately life threatening condition, we also don’t expect an ALS paramedic just to save lives. They are expected to perform good clinical medicine, to reliably discern the critical from the urgent, and the urgent from the non-urgent, and to bridge the time and care appropriately to other health care practitioners. The role of ALS responder is more than emergency intervention management.
3.1.2 The Advanced Life Support Dilemma
The past 30 years of innovation in EMS has placed many former Advanced Care Paramedic interventions into the hands of Primary Care Paramedics and first responder providers. Automated external defibrillators represent a good example of this change. The 35-pound,
orange, Mennen Greatbach units of the 1970s have been replaced with the 5-pound, automated, public access defibrillation units in airports. TEMS is extensively involved in the

Service Efficiency Review – Toronto Fire Services & Toronto EMS
Page | 70
strategy, management, and roll out of public access defibrillation units in Toronto, with patients
surviving potentially deadly events as result of the initiative.
Technology and improved educational programs have allowed Primary Care Paramedics to safely provide increasingly sophisticated care. Unfortunately, the industry throughout North America has been slow to alter the portfolio of ALS providers. The gap between Advanced and Primary care provision has narrowed to the point that the utility of ALS gets put into question. The potential of ALS providers remains untapped. Projects such as the Long and Brier Islands Community Paramedic Project show the potential for expanded use of paramedics in the community.
The London Ambulance Service in the United Kingdom successfully deploys expanded care
paramedics with 2 years of training beyond the ALS level to mitigate low acuity calls and transports. These paramedics also provide better care for patients such as the elderly in long term care facilities who traditionally do not do well in hospitals. These patients have prolonged emergency department times when they do require hospital care and require ambulance transfer both to and from the hospital. (The above information was provided during a communication with Dr. Fionna Moore, Medical Director, London Ambulance Service).
Advanced care paramedics, or an equivalent to the London Emergency Care Paramedic, can be one piece of the mitigation strategy for low acuity calls. These responders can manage simple lacerations, wound management, and, as seen in the Long and Brier Islands Project, communicate with Family Physicians to organize non-urgent solutions to the situation (booked
x-ray, small modifications in medication, etc.), and avoid emergency department transport and visits.
An advanced care paramedic, as the responder in an Emergency Response Vehicle, provides an advantage over using a primary care paramedic in that role. An experienced advanced care paramedic can provide a skilled extra set of hands to a primary care paramedic or advanced care paramedic crew without layering another ambulance. In addition, the training of an advanced care paramedic provides a higher degree of patient safety in a “refusal of care” or “no care rendered” situation as outlined previously.
Paramedics have an ability to be self-directing and work in variable surroundings with various
patients and bystanders. Those that successfully move to the ALS level have a greater degree of leadership and decision-making skills. These skills are honed during ALS training. An issue not discussed, but important in every system, is that ALS paramedics teach. Layered or targeted at a scene, ALS providers mentor and teach BLS paramedics. In a collegial system, the BLS paramedics gain insight and knowledge from the ALS providers every day. This interaction improves the patient care delivered by the BLS paramedics thereby improving the general level of patient care in the system.
3.1.3 Does Response Time Matter?
This raises the question whether response times actually matter. There are many perspectives
on this question. From a clinical perspective, in the small subset of patients experiencing a cardiac arrest, the entire chain of events creates a clear relationship to survival. We also know

Service Efficiency Review – Toronto Fire Services & Toronto EMS
Page | 71
that the nature of ambulance dispatch call taking will create both false positives (responses to
potential cardiac arrest calls that turn out not to be cardiac arrests) and potentially false negatives (responses assessed as some other problem that turn out to be cardiac arrests). Most EMS systems, including TEMS, are based on the premise of improving the specificity16 of the dispatch call type while providing the patient the benefit of any doubt. False positives are the inevitable result.
Almost 40 years ago, based on what was known at the time, EMS experts determined that an 8 minute EMS response was the standard to be achieved. Eight minutes has subsequently been interpreted as 8 minutes 59 seconds and this has become the “gold standard”. Whether this standard is correct or not is difficult to prove in a system where so many factors contribute to both the morbidity and mortality of patients and where the pool of patients is so diverse. It is
important to understand that the 8 minute, 59 second target refers to the entire response time from answering the phone at the dispatch centre to arrival of the paramedics at the patient. Call handling by the dispatcher and the “chute” time of notifying paramedics and getting them onto the road and driving, are all pieces of the 8:59 standard.
In trauma, response time has been shown to be less important than the choice of receiving hospital. Arrival at a trauma receiving hospital first rather than a non-trauma community hospital improves mortality by 25%. On the other hand, response times are clearly important when dealing with time critical problems such as respiratory distress, chest pain/acute coronary syndrome, status epilepticus, stroke, and cardiac arrest. In cardiac arrest (CA), time to
defibrillation for ventricular fibrillation (v. fib) is a primary factor in survival. With the advent of newer CPR techniques, public access defibrillation, and recognition of the time criticality, survival from v.fib CA in metro areas has improved from the 12-14% range pre 2006 to 25-30%. The landmark defibrillation study in Las Vegas showed that patients with a presenting rhythm of v. fib and defibrillated in under 3 minutes had a 74% survival to hospital discharge, neurologically intact2. Survival was 49% in those defibrillated after 3 minutes. A recent 2 year multicenter study in Belgrade, Serbia found that EMS response time of less than 4 minutes was associated with increased survival to hospital discharge and at 1 year3.
A paper from the Resuscitation Outcomes Consortium found that survival is increased in
witnessed cardiac arrest and recommends that patients be educated as to the signs of
impending CA so as to be able to access 911 prior to the arrest4. Status epilepticus is the situation where a seizure does not break spontaneously but continues unremittingly. This is a neurologic emergency as it can result in neurological impairment. A recent review of status epilepticus in children recommends that treatment begin within 5 minutes5.
ST-elevation Myocardial Infarct or STEMI is the type of acute heart attack requiring treatment with cardiac catheterization (percutaneous coronary intervention or PCI) within 90 minutes, for
16 Specificity in this respect means whether the dispatch call determinant based on the Medical Priority Dispatch system call taking algorithm was reflective of the actual patient requirements. Typically in a response evaluation we want to see both sensitivity - the ability of the question or determinant to not miss a patient or avoidance of false negatives - and specificity - the ability to capture only those that it should, or avoidance of false positives

Service Efficiency Review – Toronto Fire Services & Toronto EMS
Page | 72
best outcome. The 90 minute benchmark is calculated from first medical contact. The clock
used to start at first ECG in the emergency department but it has been well proven that recognition of STEMI in the field by paramedics performing ECG and then alerting the cardiac catheterization lab by phone and/or transmission of ECG shortens time intervals dramatically and improves outcomes as dramatically. First paramedic contact to balloon time of 90 minutes is now achievable and TEMS has such a program in place6. However, the identification of STEMI from call intake is extremely difficult. In order to achieve rapid response to STEMI, a rapid response to all non-traumatic chest pain calls is required.
A very recent (2012) report, “Do Emergency Medical System Response Times Matter for Health Outcomes” published in Health Economics, was based on a large sample size extending over a six-year period in the metropolitan-urban setting of Salt Lake City, Utah.17
The abstract of this report offers a conclusive and persuasive statement regarding the impact of EMS response time:
“The introduction of technology aimed at reducing the response times of emergency medical services has been one of the principal innovations in crisis care over the last several decades. These substantial investments have typically been justified by an assumed link between shorter response times and improved health outcomes. However, current medical research does not generally show a relationship between response time and mortality. In this study, we explain the discrepancy between conventional wisdom and mortality; existing medical research fails to account for the endogeneity of incident severity and response times. … We find that response
times significantly affect mortality and the likelihood of being admitted to the hospital, but not procedures or utilization within the hospital.”
The report indicates that response times of less than 2 minutes produced the greatest reductions in mortality, although the study’s author identified that response times less than 10 minutes still reduced mortality relative to longer response times, although not as much as the measurements at the 2, 3, 4, or 5 minute intervals. In reviewing the positive effect of shorter response times on both hospital admission and subsequent EMS system responses to the same patient, clear measures of morbidity reduction in the involved patients based upon response
times, are also demonstrated.
While it is impossible to correlate patient outcome directly with 8 minutes, or 8 minutes 59 seconds there is no suggestion that rapid EMS response is undesirable or unimportant for certain patients. From a strictly medical lens, 8:59 is too long for many patients where treatment should begin within minutes. Cardiac arrest and status epilepticus are two examples. Response times greater than 8 minutes may be medically acceptable in some case but there is no question that it would degrade the mortality in cardiac arrest and likely impact morbidity/mortality for other time critical emergencies. There is no way to predict whether the
17 Wilde, ET. Do Emergency Medical System Response Times Matter for Health Outcomes. Health Economics. 2012. wileyonlinelibrary.com.

Service Efficiency Review – Toronto Fire Services & Toronto EMS
Page | 73
next call will be a low acuity ankle sprain or a cardiac arrest. Generally speaking, the faster the
response the better it is for time sensitive illness and injury, but efforts toward improving response times has to be balanced with system requirements. For example, the cost to improve EMS response to the 5 minute range would more than double the existing EMS budget. A broader population medicine lens is applied to EMS systems to achieve a combination of best patient outcome and system efficiency.
The industry standard of 8:59 has remained in place for many years, as it is the best compromise between medical necessity and operational efficiency. While we cannot say categorically that 8:59 is the “correct” response time, we also cannot say that it is not, nor is there another number that fits the bill as well.
3.1.4 Observations and Conclusions
The TEMS is expected to arrive within 8 minutes and 59 seconds 90 percent of the time when called to the sickest of patients (please see 3.3 TEMS Staffing Demand Analysis - the sickest patients are classified in the Medical Priority Dispatch System algorithm as Delta and Echo.) The TEMS has regularly reported to City Council on this issue because, while the approved response target is 8:59, TEMS has not had a 90th percentile response time better than 10 minutes and 24 seconds since 2002.
As already noted, in addition to the actual system deployment plans, the response time performance to a known target level is a function of the response time zones, system capacity,
and road network. Simply put, if the expected targets, the dynamically-adjusted historical call volume patterns, and the road network capacity are known, a system can be modeled that will achieve the response time targets. TEMS has analyzed this extensively and has drawn the conclusion that to achieve their target performance, additional staffing is required. The consulting team’s analysis concurs with that conclusion.
TEMS requires additional staffing concurrent with the analysis shown in 3.3.2 Method 2 -- Based on an 8 Minute 59 Second Response Parameter.
References
1. Morbidity and Mortality Weekly Review. January 13, 2012 / 61(RR01);1-20 2. Valenzuela, T et al, Outcomes of Rapid Defibrillation by Security Officers after Cardiac Arrest in Casinos. N
Engl J Med 2000; 343:1206-1209 3. Sladjana A. Gordana P. Ana S. Emergency response time after out-of-hospital cardiac arrest. European
Journal of Internal Medicine. 22(4):386-93, 2011 Aug. 4. Hostler D. Thomas EG. Emerson SS. Christenson J. Stiell IG. Rittenberger JC. Gorman KR. Bigham BL.
Callaway CW. Vilke GM. Beaudoin T. Cheskes S. Craig A. Davis DP. Reed A. Idris A. Nichol G. Resuscitation Outcomes Consortium Investigators. Increased survival after EMS witnessed cardiac arrest. Observations from the Resuscitation Outcomes Consortium (ROC) Epistry-Cardiac arrest. Resuscitation. 81(7):826-30, 2010 Jul.
5. Neville BG. Chin RF. Scott RC. Childhood convulsive status epilepticus: epidemiology, management and outcome. Acta Neurologica Scandinavica. Supplementum. 186:21-4, 2007
6. Cheskes S. Turner L. Foggett R. Huiskamp M. Popov D. Thomson S. Sage G. Watson R. Verbeek R. Paramedic contact to balloon in less than 90 minutes: a successful strategy for st-segment elevation myocardial infarction bypass to primary percutaneous coronary intervention in a canadian emergency medical system. Pre-hospital Emergency Care. 15(4):490-8, 2011 Oct-Dec.

Service Efficiency Review – Toronto Fire Services & Toronto EMS
Page | 74
7. Ian G. Stiell MD et al for the OPALS Study Group. The OPALS Major Trauma Study: impact of advanced life-support on survival and morbidity. CMAJ April 22, 2008 vol. 178 no. 9
8. Jayaraman S, Sethi D. Advanced trauma life support training for ambulance crews. Cochrane Database of Systematic Reviews 2010, Issue 1. Art. No.: CD003109. DOI: 10.1002/14651858.CD003109.pub2.
9. Ian G. Stiell et al for the OPALS Study Group Advanced Life Support for Out-of-Hospital Respiratory Distress. N Engl J Med 2007; 356:2156-2164
10. Persse DE. Key CB. Bradley RN. Miller CC. Dhingra A. Cardiac arrest survival as a function of ambulance deployment strategy in a large urban emergency medical services system. Resuscitation. 59(1):97-104, 2003 Oct.
3.2 Ambulance Offload Time Review across Toronto Hospitals
Ambulance offload delays at hospitals absorb a significant EMS resource level. This section, in
conjunction with Appendix H – An Examination of Ambulance Offload Times examines the causes and
possible resolutions
3.2.1 Introduction
Ambulance offload time, that is the time it takes paramedics to transfer the care of a patient to hospital staff, is a concern across Canada. Only a few years ago paramedics could wait for several hours in an emergency department hallway, while a patient remained on the EMS stretcher, before being able to transfer care to hospitals. The reason for these delays was attributed to a lack of hospital beds which, in turn, was attributed to chronic patients awaiting
rooms in long term care facilities. The result was that this ‘bed backup’ worked its way down to the EMS patient who, unless critically ill or injured, remained on the EMS stretcher until an emergency department bed became available.
Significant improvements in hospital wait times have been made across Ontario in the past few years, partly due to nursing staff dedicated to reducing ambulance wait times and ongoing efforts by TEMS to work with hospitals to improve offload efficiencies. TEMS’ hospital wait times now average about 45 minutes although some hospitals have longer wait times than others. It is interesting to note though, that according to the Ontario Municipal Benchmarking Initiative data, some municipalities such as Durham, Hamilton, London, Sudbury, Thunder Bay, Waterloo, and Windsor are experiencing an increase in hospital wait times since 2009. Toronto
has also experienced a slight wait time deterioration (please see Chart 9 - OMBI Data - Percent of
Time Lost to Hospital Turnaround).

Service Efficiency Review – Toronto Fire Services & Toronto EMS
Page | 75
Chart 9 - OMBI Data - Percent of Time Lost to Hospital Turnaround
The consulting team undertook a review of TEMS’ hospital wait times because, from an efficiency point of view, significant vehicle availability can be consumed for hospital wait time (the amount of time paramedics spend waiting in an emergency department hallway). In 2011, Toronto transported approximately 190,000 patients to hospitals. Reducing hospital wait times by an average of 5 minutes conceptually puts 15,800 hours of ambulance time - the equivalent of almost two ambulances 24 hours a day, 7 days a week - back on the road.
However, there is another way to consider hospital wait time. If wait time represents an
average of 15 minutes per patient transported to hospital that represents 47,500 hours of wait time per year based on 190,000 patients (15 X 190,000 = 2,850,000 minutes ÷ 60 = 47,500 hours). If a staff member is paid for 2080 hours a year, 47,500 hours represents (47,500 ÷ 2080 =) 22.8 staff equivalents. But there are 2 paramedics waiting for an average of 15 minutes which doubles this calculation to 45.67 staff equivalents. The average annual salary for a Primary Care Paramedic including benefits and ancillary costs is approximately $108,000 per year which, when multiplied by 45.67 staff equivalents means that hospital wait time represents approximately $4,932,700 a year to TEMS. Fifty percent of EMS costs are borne by the Ministry of Health and Long Term Care and the balance by the City. So, hospital wait time represents a cost of approximately $2,466,000 a year to the City of Toronto. This figure
underlines the urgency of mitigating the number of transportations to hospital, where reasonable.

Service Efficiency Review – Toronto Fire Services & Toronto EMS
Page | 76
Our goal within this section of the project was not to solve the wait time issue since the reasons
that influence ‘wait time’ are complex and the solution is beyond what we can discover in a few weeks of effort. Our goal is to recommend action that the TEMS can take to better define the parameters that influence ambulance offload time.
3.2.2 Observations and Conclusions
Several weeks of effort were committed to trying to determine those things that contribute to offload delays. The most important thing we have discovered is that definitively measuring why paramedics contribute so much to hospital wait time during their working hours is not easy. The solution is unlikely to be found in one component of the overall ambulance offload process. On the other hand, the process is muddy and not clearly defined but delineating the process is
what TEMS needs to do as part of its continuing effort to reduce wait times.
After analyzing the data collected in this study, Pomax also offers the following observations although some of them are hospital centric and TEMS will have to depend on goodwill with the hospitals in order to see these observations accomplished.
Define Transfer of Care as the point when a hospital healthcare provider has been
assigned to a patient and the patient is physically transferred to a hospital stretcher. Ideally, at the point of transfer of care, the EMS staff are released from their healthcare responsibility and accountability. Defining transfer of care this way would enable standardization among hospitals. Currently, interpretation of transfer of care is inconsistent among hospitals.
For validation purposes, implement a transfer of care dual sign-off by the hospital and EMS staff. This enables a mutual agreement and record of when transfer of care took place. Currently the hospital staff determines the transfer of care point.
Through operational efficiency events, identify accountability and create standards of work for both hospital and EMS staff. For example, patient registration by TEMS during post transfer of care should be reconsidered since it may be more appropriate as a hospital activity. Currently, accountability of EMS and hospital staff for pre-transfer time and post-transfer time activity varies among hospitals.
Hospitals should complete operational efficiency events to identify areas of
improvement for both patient flow and workflow as evidenced by the success at Mount Sinai and Toronto General Hospital. Additionally, TEMS should map their workflow to identify standards of work and variations in practices. Currently, not all hospital emergency departments and TEMS have completed formal operational efficiency exercises.
Hospitals should provide their strategy for utilization of RN offload to EMS, including role, responsibility, shift schedule, and contingency planning in the event of short staffing. Furthermore, each hospital should provide an annual report outlining the multi-year trending analysis comparing RN offload coverage and non-RN offload coverage
hours. Each hospital should be encouraged to do peer hospital comparisons. Currently, RN offload utilization is variable among hospitals.

Service Efficiency Review – Toronto Fire Services & Toronto EMS
Page | 77
Review emergency department Wait Time funding agreement (incentive funding
formulae) and consider incentive dollars to include arrival of EMS to triage and triage to transfer of care or ambulance turnaround target time. Consider a penalty equivalent to a reduction in incentive payment for any delay in ambulance turnaround time consistent with the new funding agreement recently introduced in York Region. The current model, that of a monetary incentive for reducing the total emergency department wait time for all patients from triage was established in previous years.
Where possible, TEMS should actively encourage hospitals, through any existing mechanisms, to engage with them in a proactive manner to reduce the number of available ambulance unit hours lost from response capacity through delays in offloading patients within the expected time frames. We are aware that TEMS has been very active in its efforts to solve this problem
considering that recovering ambulance time also results in recovering money and making ambulance hours available to the street.
TEMS should endeavor to make use of an individual or organization with expertise in Lean or Six Sigma-type process reengineering to define, perhaps through process mapping, the practices that take place during hospital waits. Additionally, that person may be able to work with hospitals in streamlining the pre-transfer time and defining an actual transfer of care time. We expect that this will not only recover the cost of investment in a relatively short period of time but may also be available to introduce and imbed Lean principles in all other facets of the emergency medical services department. The time could be shared with TFS which, like other
organizations, would benefit from the introduction of Lean values and philosophy.
Is Offload Wait Time an EMS Contribution to Hospital Care?
Another consideration is whether hospital wait time represents patient care on behalf of the Ontario health care system. EMS is part of Ontario’s health care system and shares in the continuum of care for patients. Paramedics monitor and care for a patient while waiting for a hospital to accept their patient. Without the assistance of paramedics, hospitals would be fully responsible for monitoring and housing patients, many of whom would require a stretcher rather than a waiting room chair. So, we suggest that paramedic wait time at hospitals, by TEMS, represents a benefit to the health care system which could be considered to cost the City approximately $2,466,000 annually.
Although a short term solution is unlikely, this annual cost should be a discussion point with the province and LHINs during budget discussions.
3.2.3 Recommendations
Utilize Lean processes to define the activities that contribute to paramedic wait times at hospitals and identify possible relief techniques.

Service Efficiency Review – Toronto Fire Services & Toronto EMS
Page | 78
3.3 TEMS Staffing Demand Analysis
Calculating the ambulance availability requirements for TEMS is more complex than most municipalities because of the magnitude of the TEMS call volume and because the majority of incidents are responded to from a location other than an ambulance station; for example, from a hospital or other mobile location.
In addition to the Neighbourhood Demand Analysis, authored by TEMS and led by Deputy Chief Alan Craig, we used two other methods to calculate vehicle availability requirements. Both included similar processes, diverging somewhat in methodology but arriving at similar outcomes.
3.3.1 Method 1 -- Based on a 10 minute Travel Time Model (Not including 2 Minute Call Taking and Dispatch Time)
Although there is good evidence that the best time target for Emergency Medical Services to meet, with respect to patient care, is 8 minutes and 59 seconds at the 90th percentile for emergency events (defined as Echo and Delta) (please see 3.1.3 Does Response Time Matter?) we also – for comparative purposes – assessed the resource requirements to achieve a 10 minute travel time target. In this scenario, from the time the call for assistance is received to the time an appropriately staffed ambulance arrives, means that travel time should not exceed 10 minutes at least 90% of the time, plus an additional 2 minutes would be allocated to call taking and dispatch functions for a total time of 12 minutes.
The current TEMS staffing model, by hour of day and day of week was utilized in the actual demand analysis template to provide a baseline for actual work performance and comparison with the preferred staffing model. A visual representation is provided in Figure 7 and more detailed information is provided in Appendix I – TEMS Staffing Analysis Supporting Documentation
– 10 Minute Travel Time Target (Not including 2 Minute Call Taking and Dispatch Time).
Figure 7 -Current Staffed Ambulances Target
0
50
100
1 2 3 4 5 6 7 8 9 10 11 12 13 14 15 16 17 18 19 20 21 22 23 24
Staf
fed
Am
bu
lan
ces
Pla
nn
ed
Toronto EMS Current Staffed Ambulances Target by Hour
and Day of Week
Saturday-Sunday Monday To Friday

Service Efficiency Review – Toronto Fire Services & Toronto EMS
Page | 79
As Figure 7 shows, ambulance staffing during weekdays (Monday to Friday) is planned at a higher level than Saturdays and Sundays other than the early morning hours of 03:00 through 07:00 where staffing levels are the same irrespective of the day of week.
There are two significant challenges represented with this staffing model. First, staffing is increased during various hours Monday through Friday on the historic assumption that service demand is higher during those periods. We know from analysis that actual average daily demand and response volumes do not vary as significantly across these groups as they once did, primarily with the reduction in non-emergency interfacility transfer volumes previously performed by TEMS.
Second, the uniform staffing level during individual hour periods does not reflect analysis that demand and response volume will vary across the days in the selected staffing period (weekday or weekend). For example the planned staffing between 02:00 and 07:00 on Saturdays is the same as it on weeknights while the actual service demand and response volume is much different.
The analysis performed is intended to balance the actual experienced response volumes, based on the 2011 responses by Basic Life Support (BLS) and Advanced Life Support (ALS) ambulances. The desired outcome from this analysis is to demonstrate what staffing levels are required by hour of day and day of week to provide a reliable response to the most acute life threatening emergencies (classified in the Medical Priority Dispatch System (MPDS) as Delta and Echo
responses) within the desired less than 11 minute 59 second time frame at a 90% confidence level.
Key Process Metrics for the Analysis
Responses by specialized ancillary, support, or non-transport vehicles and supervisory
personnel, are not counted in the historical response volumes, and intentionally excluded from the analysis, as an ambulance is also required to respond to each of these events.
Actual response volumes by the ambulance are used rather than event volumes. It is normal within any EMS system that some events require more than one ambulance to respond to them based upon clinical and situational evaluation, such as major motor vehicle
accidents or very complex clinical calls.
Ambulance response volumes have been tabulated into day of week tables providing a specific hourly response volume for each day of the week in a single layered table. For example, the Monday table shows all of the response volumes for each of the Mondays in the entire year, the Tuesday table shows all the hours of all the Tuesdays, and so on.
Time on task provided by TEMS for only the responding ambulances, and averaged out to a
time of day and day of week level, providing 168 individual time measures which, as can be readily seen in Chart 10 can vary significantly. This variance can be attributed to a range of factors including hospital busy periods, traffic patterns and congestion. Adjustment of the
template for the actual average experienced time on task by hour of day and day of week provides an acceptable level of variance in the analysis.

Service Efficiency Review – Toronto Fire Services & Toronto EMS
Page | 80
Chart 10 - Time On Task by Day of Week and Time of Day
Calculations were then performed in the individual day of week summaries to determine, by
hour of day, what the:
Minimum, or lowest, call volume was on any of the individual dates. For example, across 52 Mondays between the hours of 14:00 and 15:00 the smallest number of ambulance responses was 24 (March 14, 2011);
Maximum, or the highest experienced call volume on any of the individual dates. For example across 52 Mondays between the hours of 14:00 and 15:00 the highest number of ambulance responses was 81 (September 12, 2011);
The response volume arithmetic mean (average), median (value in the exact middle of the range), and mode (most frequently occurring value) for each hour were also calculated to provide an understanding of the distribution of volume values. For
example for response volumes across 52 Mondays between the hours of 14:00 and 15:00 the mean was 46.6 responses, the median was essentially the same at 46.5 responses, while the mode was higher at 50 responses, suggestive of a right skewed distribution.
The 90th percentile volume, an indication of the point at which only 1 day in 10 had a higher volume in that particular hour, was also calculated. For example, across 52 Mondays between the hours of 14:00 and 15:00 only 1 day in 10 had a response volume higher than 61 responses.
The "average high" was calculated by using the average of the volumes in each
month to assist in determining any seasonal trends. For example, across 52

Service Efficiency Review – Toronto Fire Services & Toronto EMS
Page | 81
Mondays between the hours of 14:00 and 15:00 the average of the monthly
volumes was 61.3 responses.
The "average peak" was calculated by using the highest representative volumes in each month for that hour of day, and calculating the average of those peak volumes and then multiplying the volume by the TMT (Time Managing Task), or time on task, multiplier. This provides recognition and adjustment for the variance in actual work time duration which may be shorter or longer than the 60 minute duration for that hour period. For example, across 52 Mondays between the hours of 14:00 and 15:00 the calculated average of the monthly peaks times the TMT was the equivalent of 78 responses.
A "smoothed average peak" was developed to adjust for the reality of responses bleeding across individual hours by virtue of both the point in time during that hour that the actual call was received and the actual time on task at times exceeding the physical hour represented within the time period. For calculation purposes the smoothed average peak represents 20% of the average peak volume of the hour before, 60% of the average peak volume of the current hour, and 20% of the average peak volume of the hour after.
Actual current staffing levels from the provided staffing pattern (Figure 8 and Appendix I)
are included to visually demonstrate the actual response capacity. For calculation purposes it is assumed that all planned staffed ambulances are staffed. Discussions with TEMS
management and staff consistently demonstrated that actual staffing is usually lower than planned staffing;
A "UH Adj/Eff Buffer" is inserted into the analysis to reflect the reality that a minimum number of ambulances must be available at the appropriate locations throughout the city at any point in time to provide the required Delta-Echo response time performance with any degree of reliability.
A "Staff To" calculation is then made to determine for each hour of day, and each day of week, what the optimal staffing level should be to achieve this performance. This calculation includes an assumption that the service should provide an adequate number of
staffed ambulances to perform known expected average peak volumes while maintaining a normal response capacity to provide predictable emergency service delivery to the next incoming emergency call through the "UH Adj/Eff Buffer".
The analysis demonstrates that in order to effectively provide service to the existing demand while ensuring ability to respond predictably to life threatening Delta and Echo calls, an increase in ambulance staffing is required. This increase in staffing should reflect known variations in volume by hour of day and day of week, and should likely be in the area of approximately 87,272 ambulance unit hours. While these hours reflect the equivalent of approximately 10 additional ambulances staffed 24 hours a day, our analysis demonstrates staffing must be allocated to those hours showing the most need. As an example, most
weekdays are already adequately staffed between approximately midnight and 6:00 or 7:00

Service Efficiency Review – Toronto Fire Services & Toronto EMS
Page | 82
AM. However, Saturday and Sunday early morning hours require augmented staffing. Other
hours of the day, particularly between 9:00 AM and 5:00 PM require additional staffing.
TEMS has completed extensive work in this area, utilizing an expert third-party scheduling consultant to evaluate several different schedules that will maximize its use of existing resources. On January 23, 2013, TEMS implemented new schedules for paramedics that closely match peak emergency call demand during weekdays and weekends.
In addition to specific staffing increases, the analysis model also provides that some current staffing hours should be adjusted to provide better value for the actual expenditure on response capacity.
Net total increases in staffing hours by day of week are summarized in Table 7
Table 7 - Net Total Recommended Ambulance Hours
Staffing Shortfall
Weekly Hours Annual Hours
Mondays 304 15,809
Tuesdays 258 13,408
Wednesdays 262 13,636
Thursdays 289 15,051
Fridays 307 15,939
Saturdays 150 7,946
Sundays 103 5,479
Total 1,673 87,272
The 87,272 ambulance unit hours represent approximately 100 staff equivalents including those already approved for the 2013 budget year. The calculations shown in Table 8 indicate costs associated with this enhancement over a 10 year period.
Staffing increases shown in years 2015 to 2022 represent expected staffing pressure based on projected per capita EMS events as the population grows. The premise is based on the supposition that if an additional 100 staff represents the right number of paramedics for Toronto’s population by 2014, then that per capita representation should continue resulting in
additional staff. The same principle was applied in 3.3.2 Method 2 -- Based on an 8 Minute 59 Second Response Parameter and Table 9.
Both tables are calculated based on current salary levels.
Table 8 – 10 Year Annual Impact of EMS Staff Increases Based on 100 Staff Equivalents
2012 2013 2014 2015 2016 2017 2018 2019 2020 2021 2022
Number of Paramedics 851 901 951 955 957 959 961 963 965 967 969
Increase (Decrease) from prior year 50 50 4 2 2 2 2 2 2 2
Annual Cost per Paramedic $108,177 $108,177 $108,177 $108,177 $108,177 $108,177 $108,177 $108,177 $108,177 $108,177
Incremental Inc (Dec) in Costs $5,408,870 $5,408,870 $432,710 $216,355 $216,355 $216,355 $216,355 $216,355 $216,355 $216,355
Total Cumulative Inc (Dec) in Costs $5,408,870 $10,817,741 $11,250,451 $11,466,805 $11,683,160 $11,899,515 $12,115,870 $12,332,225 $12,548,579 $12,764,934
Actual Impact After MOH Cost Sharing $2,704,435 $5,408,870 $5,625,225 $5,733,403 $5,841,580 $5,949,757 $6,057,935 $6,166,112 $6,274,290 $6,382,467

Service Efficiency Review – Toronto Fire Services & Toronto EMS
Page | 83
Shift Times
Another important point that we have discovered is that existing shift start times do not coincide with call load times. Currently, TEMS has a shift start time of 10:00 AM to augment vehicle availability for the busiest hours of the day. A best practice is to start shifts a sufficient period of time ahead of expected call load times so that paramedics can arrive at station, check vehicles, equipment, and medication, and be prepared to respond as incident activity increases. However, the red vertical bar on Chart 11 clearly demonstrates that close to peak call loads are occurring by 10:00 AM which is when the primary support shift starts.
TEMS should adjust the current 10:00 AM shift start time to 09:00 AM and, to the extent practical, adjust other shift start and end times to ensure they are synchronized to call load.
Subsequent to this ‘shift start time’ observation first being discussed with TEMS, in addition to implementing new shift schedules to balance the number of staff working on weekdays and weekends, TEMS has incorporated appropriate recommended changes to the shift start and end times that also match peak emergency call demand during each a 24-hour period.
TEMS' new scheduling process appears properly designed to move paramedic resources into predictably high emergency call volume areas and balance paramedic workload.
Chart 11 - Average EMS Incidents by Hour and Day
0.00
5.00
10.00
15.00
20.00
25.00
30.00
35.00
40.00
45.00
50.00
55.00
00
00
-01
00
01
00
-02
00
02
00
-03
00
03
00
-04
00
04
00
-05
00
05
00
-06
00
06
00
-07
00
07
00
-08
00
08
00
-09
00
09
00
-10
00
10
00
-11
00
11
00
-12
00
12
00
-13
00
13
00
-14
00
14
00
-15
00
15
00
-16
00
16
00
-17
00
17
00
-18
00
18
00
-19
00
19
00
-20
00
20
00
-21
00
21
00
-22
00
22
00
-23
00
23
00
-00
00
Ave
rage
Cal
lls p
er
Ho
ur
Average Incidents by Hour and Day
Sunday
Monday
Tuesday
Wednesday
Thursday
Friday
Saturday

Service Efficiency Review – Toronto Fire Services & Toronto EMS
Page | 84
3.3.2 Method 2 -- Based on an 8 Minute 59 Second Response Parameter
There is good evidence that the best time target for Emergency Medical Services to meet with respect to patient care is 8 minutes and 59 seconds at the 90th percentile for emergency events (defined as Echo and Delta)(See 3.1.3 Does Response Time Matter?). To achieve this target, from the time the call for assistance is received to the time an appropriately staffed ambulance arrives, means that travel time should not exceed 6 minutes and 59 seconds at least 90% of the time. The first 2 minutes of the time target are allocated to call taking and dispatch functions.
To achieve a sub 9 minute patient care and response target will require approximately 223,450 additional staffed vehicle hours which translates to approximately 225 additional full time equivalent staff (less recent hiring approvals), at a total annual cost of approximately
$24,000,000 by 2016 (please see Table 9. Again, in accordance with the Ambulance Act the Upper Tier Municipality (Toronto) and the Province of Ontario share the costs of approved ambulance operations on a 50-50 basis.
Table 9 – 10 Year Annual Impact of EMS Staff Increases Based on 225 Staff Equivalents
Our analysis included a spatial examination to ensure sufficient ambulance backup across the city in order to achieve a 6 minute 59 second, or less, travel time to critical emergency calls. The analysis was performed using a simulation model on ESRI ArcMap and its Network Analyst Extension to generate coverage contours.
But first it was necessary to ensure that the ambulance coverage contours that were generated by ArcMap reflected “reality”, that is, intersection queue delays, turn movement delays, etc. The following steps were undertaken to calibrate the generated contour to reflect observed values.
Step 1: Only the Echo and Delta calls were retained for analysis, as they reflected the most
acute, life-threatening emergency conditions.
Step 2: Ambulances in Toronto are on a fluid deployment system so at any time that a call is received an ambulance could be at its own station, covering a different station, or mobile in any area of the city. However, for our analysis it was important that we got a representative sample of data that show multiple ambulance starts from one station location to address emergency calls. Fortunately, there were an adequate number of responses from ambulance stations across the city to provide information needed to properly calibrate the data.
The calibration steps followed the same steps as described in the fire station coverage analysis (See 2.4.3 A Re-evaluation of the TFS Resource Analysis). The intersection delay parameters
thus developed were used to develop coverage contours across the city. However, a major point of difference was that, in the case of EMS, the goal was to cover the full city with as little
Year 2012 2013 2014 2015 2016 2017 2018 2019 2020 2021 2022
Number of Paramedics 851 907 963 1019 1076 1078 1081 1083 1085 1087 1089
Increase (Decrease) from prior year 56 56 56 57 2 3 2 2 2 2
Annual Cost per Paramedic $108,177 $108,177 $108,177 $108,177 $108,177 $108,177 $108,177 $108,177 $108,177 $108,177
Incremental Inc (Dec) in Costs $6,057,935 $6,057,935 $6,057,935 $6,166,112 $216,355 $324,532 $216,355 $216,355 $216,355 $216,355
Total Cumulative Inc (Dec) in Costs $6,057,935 $12,115,870 $18,173,805 $24,339,917 $24,556,272 $24,880,804 $25,097,159 $25,313,514 $25,529,868 $25,746,223
Actual Impact After MOH Cost Sharing $3,028,967 $6,057,935 $9,086,902 $12,169,958 $12,278,136 $12,440,402 $12,548,579 $12,656,757 $12,764,934 $12,873,112

Service Efficiency Review – Toronto Fire Services & Toronto EMS
Page | 85
contour overlap as possible while still providing 6:59 minute travel time coverage. Minimal
overlap translates into a higher level of efficiency. The resulting analysis revealed the need for 27 reserve capacity ambulances to accomplish 6:59 minutes coverage. The resulting contour map is shown as Map 9.
TEMS Staffing Demand Analysis
The current TEMS staffing model, by hour of day and day of week was utilized in the actual demand analysis template to provide a baseline for actual work performance and comparison with the preferred staffing model. A visual representation is provided in Figure 8 below and a summary template outlining the planned staffing is found in Error! Reference source not found..
Figure 8 - Planned Staffing Hours (Current)
As demonstrated in Figure 7 ambulance staffing during weekdays (Monday to Friday) is planned at a higher level that for weekends (Saturdays and Sundays) excepting the early morning hours
of 03:00 through 07:00 where the staffing levels are the same irrespective of the day of week.
There are two significant challenges represented with this staffing model. First, staffing is increased during various hours Monday through Friday on the historic assumption that service demand is higher during those periods. We know from analysis, and confirmation of approach by senior TEMS leaders, that actual average daily demand and response volumes do not vary as significantly across these groups as they once did, primarily with the reduction in non-emergency interfacility transfer volumes previously performed by TEMS.
Second, the uniform staffing level during individual hour periods does not reflect analysis that demand and response volume will vary across the days in the selected staffing period (weekday or weekend). For example the planned staffing between 02:00 AM and 07:00 AM on Saturdays

Service Efficiency Review – Toronto Fire Services & Toronto EMS
Page | 86
is approximately the same as it is on weeknights while the actual service demand and response
volume is much different.
The analysis performed is intended to balance the actual experienced response volumes, based on the 2011 responses by Basic Life Support (BLS) and Advanced Life Support (ALS) ambulances. The desired outcome from this analysis is to demonstrate what staffing levels are required by hour of day and day of week to provide a reliable response to the most acute life threatening emergencies (classified in the medical priority dispatch system as Delta and Echo responses) within the desired less than 9 minute time frame at a 90% confidence level.
Key process metrics for the analysis include the following:
Responses by specialized ancillary, support, or non-transport vehicles and supervisory
personnel, are not counted in the historical response volumes, and intentionally excluded from the analysis, as an ambulance is also required to respond to each of these events.
Actual response volumes by the ambulance are used rather than event volumes. It is
normal, and best practice, within large consolidated EMS systems that some events require more than one ambulance to respond to them based upon clinical and situational evaluation, such as major motor vehicle accidents or very complex clinical calls. Stratification of the available ambulance resources which will result in “layering” of both ALS and BLS resources to the same event in order to provide sufficient high acuity patients to sustain clinical excellence by the ALS practitioners, and still maintaining a high “capture rate” of patients requiring ALS level of care actually receiving it, may exacerbate this
duplication of responses.
Ambulance response volumes have been tabulated into day of week tables providing a specific hourly response volume for each day of the week in a single layered table. For example, the Monday table shows all of the response volumes for each of the Mondays in the entire year, the Tuesday table shows all the hours of all the Tuesdays, and so on.
Figure 9 – Time on Task

Service Efficiency Review – Toronto Fire Services & Toronto EMS
Page | 87
Time on task (represented in the graphic analysis as TMT – Time Managing Task) provided
by TEMS for only the responding ambulances, was independently analyzed for each response and averaged out to a time of day and day of week level, providing 168 individual time measures which, as can be readily seen in Figure 2, above, can vary significantly. This variance can be attributed to a range of factors including hospital busy periods, traffic patterns and congestion. Adjustment of the template for the actual average experienced time on task by hour of day and day of week provides an acceptable level of variance in the analysis.
The actual time on task within the graphic analysis was then adjusted to include provision for necessary rest breaks for staff which are both contractually and ethically required. The allowances included within the analysis was constructed as follows:
o A complete normal work shift for paramedics is established at 12 (12:00) hours.
o Paramedics should normally be provided, to the extent possible given workload
demands and emergency operational needs, a 30 minute meal period and three (3) fifteen (15) minute breaks during their operational shift.
o Mathematical calculation then provides that of a 12:00 hour shift the paramedic actual performance of responses, or immediate availability for responses, should occupy 10 hours and 45 minutes (10:45). This provides a calculation co-efficient of 0.89583333% of the normal work shift being available for, or actually on, assignment.
o The actual time on task (TMT) is then modified (TMT, expressed as a decimal calculation divided by the shift adjustment co-efficient) to adjust for the required work breaks through the entire shift.
Calculations were then performed in the individual day of week summaries to determine, by hour of day, what the:
o minimum, or lowest, call volume was on any of the individual dates. For example, across 52 Mondays between the hours of 14:00 and 15:00 the smallest number of ambulance responses was 24 (March 14, 2011);
o maximum, or the highest experienced call volume on any of the individual dates. For example across 52 Mondays between the hours of 14:00 and 15:00 the highest number of ambulance responses was 81 (September 12, 2011);
o The response volume arithmetic mean (average), median (value in the exact middle of the range), and mode (most frequently occurring value) for each hour were also calculated to provide an understanding of the distribution of volume values. For example for response volumes across 52 Mondays between the hours of 14:00 and 15:00 the mean was 46.6 responses, the median was essentially the same at 46.5 responses, while the mode was higher at 50 responses, suggestive of a right skewed distribution.

Service Efficiency Review – Toronto Fire Services & Toronto EMS
Page | 88
o The 90th percentile volume, an indication of the point at which only 1 day in 10 had
a higher volume in that particular hour, was also calculated. For example, across 52 Mondays between the hours of 14:00 and 15:00 only 1 day in 10 had a response volume higher than 61 responses.
o The "average high" was calculated by using the average of the volumes in each month to assist in determining any seasonal trends. For example, across 52 Mondays between the hours of 14:00 and 15:00 the average of the monthly volumes was 61.3 responses.
o The "average peak" was calculated by using the highest representative volumes in each month for that hour of day, and calculating the average of those peak volumes
and then multiplying the volume by the TMT, or time on task, multiplier. This provides recognition and adjustment for the variance in actual work time duration which may be shorter or longer than the 60 minute duration for that hour period. For example, across 52 Mondays between the hours of 14:00 and 15:00 the calculated average of the monthly peak times, the shift adjusted TMT was the equivalent of 87 responses.
o A "smoothed average peak" was developed to adjust for the reality of responses bleeding across individual hours by virtue of both the point in time during that hour that the actual call was received and the actual time on task at times exceeding the physical hour represented within the time period. For calculation purposes the
smoothed average peak represents 20% of the average peak volume of the hour before, 60% of the average peak volume of the current hour, and 20% of the average peak volume of the hour after.
Actual current staffing levels from the provided staffing pattern (Figure 8 and Appendix I) are
included to visually demonstrate the actual response capacity. For calculation purposes it is assumed that all planned staffed ambulances are staffed. Discussions with TEMS management and staff consistently demonstrated that actual staffing is usually lower than planned staffing;
A "UH Adj/Eff Buffer" is inserted into the analysis to reflect the reality that a minimum
number of ambulances must be available at the appropriate locations throughout the city at any point in time to provide the required Delta-Echo response time performance with any degree of reliability. Independent ESRI based mapping analysis was performed to determine how many individual sectors, or response based polygons, would be required to provide complete coverage of the city based upon a 6 minute and 59 second (6:59) routine response travel time 100% of the time. For clarity the response travel time is the interval recorded as T3 (when the ambulance starts moving on a response) through to T4 (the time they arrive at the scene). Actual call reception and call handling time within the dispatch centre (T0 – call received in dispatch through to T2 – ambulance crew notified of the response) and the crew “chute” time (T2 through to T3) are not included in these
calculations. In combination it is expected that TEMS will manage the combined time from call reception (T0) through to crew notification (T2) within a 2:00 minute time window 90%

Service Efficiency Review – Toronto Fire Services & Toronto EMS
Page | 89
of the time. The combination of a 2:00 time frame for T0 to T2, and a 6:59 time frame for
T2-T4, reliably provides for the combined high acuity emergency response time of 8:59. A pictorial presentation of the ESRI zonal mapping showing the identified response zone polygons was shown previously on Map 9.
Toronto staff analysis (the “Neighbourhood” report) suggests that 28 response zones or
polygons are appropriate. Our independent analysis suggests that there should be 27 response zones.
We intentionally created the response polygons based upon normal posted traffic speed limits and driving patterns to provide flexibility for response. While recognizing that there is not an ambulance station in the exact epicentre of each 6:59 polygon, the general analysis
remains that if an ambulance is available within the polygon, and they are responding on an emergency basis to emergency calls, they should reliably be able to respond to events within the polygon in the desired time frame.
Based on the results of our independent mapping analysis and feedback from TEMS staff, and including standardized time on task measures adjusted for reliable employee breaks, we believe that if 27 ambulances are available 90 percent of the time across the geography, that the response time target of less than 9 minutes for Delta and Echo responses can be achieved at a 90% confidence level.
A "Performance Staffing" calculation is then made to determine for each hour of day, and
each day of week, what the optimal staffing level should be to achieve the desired response time performance. This calculation includes an assumption that the service should provide an adequate number of staffed ambulances to perform known expected average peak volumes while maintaining a normal response capacity to provide predictable emergency service delivery to the next incoming emergency call through the "UH Adj/Eff Buffer". To be clear, the assumption is that throughout the operating period, the number of ambulances on shift will vary based upon known and relatively predictable call patterns. During each operating period, the service should maintain to the best extent possible 27 ambulances strategically placed to ensure response zone coverage and response time performance. The balance of the resources will be consumed consistently at the high average peak levels to manage a smoothed peak volume. This planning provides capacity for excess response
demand, special situations, and dynamic spatial redistribution in an aggressive system status management plan based on predictive analysis as is already provided through the use of the Optima software installed within the TEMS dispatch centre.
Our analysis does not provide for coverage at all times of the absolute peak response levels that may be experienced. Analysis provides an understanding that these peaks are relatively rare, sometimes only happening once a year. There will be situations where the absolute peak demand exceeds the expected vehicle consumption and those situations will be managed through spatial distribution of the calculated effectiveness buffer to the extent possible.
The analysis demonstrates that in order to effectively provide service to the existing demand while ensuring ability to respond predictably to life threatening Delta and Echo calls with a 90%

Service Efficiency Review – Toronto Fire Services & Toronto EMS
Page | 90
confidence level in under 9 minutes, an increase in ambulance staffing is required. This
increase in staffing should reflect known variations in volume by hour of day and day of week, and should likely be in the area of approximately 223,451 staffed ambulance unit hours.
While these hours reflect the equivalent of approximately 25.5 additional ambulances staffed 24 hours a day 7 days a week, our analysis clearly demonstrates that the staffing must be temporally adjusted based upon need. In the current parlance this means that staffing should be through staggered starts to match known and predictable call patterns rather than a small number of selected start and stop shift times across the week. We recognize that TEMS has introduced some of these staggered start periods already to maximally utilize the available resources and they should continue working with the Union representatives on extending, and periodically adjusting, these patterns.
In addition to specific staffing increases, the analysis model also provides that some current staffing hours should be adjusted to provide better value for the actual expenditure on response capacity.
Net total increases in staffing hours by day of week are summarized below.
Table 10
Staffing Shortfall (Unit Hours – rounded)
Weekly Hours Annual Hours
Mondays 589 30,610
Tuesdays 602 31,308
Wednesdays 616 32,045
Thursdays 660 34,307
Fridays 677 35,197
Saturdays 608 32,207
Sundays 524 27,773
Total 4,275 223,451
3.3.3 Observations
While the analysis completed provides the picture of what level of ambulance staffing is
currently required to provide high quality, timely, and responsive service to the residents of the City of Toronto, it is a reflection of a point in time. Variables such as time on task, actual experienced call volumes, and spatial drive time variation will all serve to impact upon the results. For example, if we anticipate that demand and response volume will increase at the same rate that it has historically, which is around 2.78% (see Table 11), then the service will likely respond to approximately 6,000 more service requests next year. If the average time on task, meaning the time from when the ambulance starts on the call through to when it is clear of the call, is the same as the overall average of 75.4 minutes, as adjusted to allow for established breaks, then actual task time will have increased by a full 7,587 unit hours, the equivalent of one ambulance being occupied for almost 21 hours every day of the year.
The consequence of not recognizing the increased workload, or balancing it through various strategies or response reduction such as community paramedicine or enhanced call screening

Service Efficiency Review – Toronto Fire Services & Toronto EMS
Page | 91
and diversion, will predictably result in the service not being able to achieve the desired
response time performance levels. Similarly, changes in road networks or other travel patterns may result in necessary adjustments to the response zone polygons with a consequent increase or decrease in the number of ambulances required for the effectiveness buffer.
If the actual volume change is higher or lower, or the experienced actual time on task changes, or if the call patterns shift to a different temporal distribution, the actual staffing pattern needs to be modified to match these changes to provide the best value and consistency from the available staffing dollars.
3.3.4 Recommendation
Increase TEMS response capacity by 223,451 staffed vehicle hours to meet demand.

Service Efficiency Review – Toronto Fire Services & Toronto EMS
Page | 92
Exhibit 6 - Paramedic Daily Duties Excluding Calls on Shift and Rest Breaks
TORONTO EMS
PARAMEDIC DAILY DUTIES
(excluding calls on shift)
PREP
Swipe On
Take report from
outgoing crew
(Equipment, shift
issues)
Pick up batteries &
check sheets/
envelopes
Personal
protective
equipment
Complete check
sheet – restock as
necessary
ALS/BLS
Drug count
Fill out sheets
Check expiry
dates
-Turn on mobi-cad
-Circle check vehicle
-Swap batteries, radio
check
Log into EPCR
Clean vehicle
Check Zoll
& electronics
Report
deficiencies to
supervisor
Follow up with
incident reports;
other
communications
Station computer
for memos; other
communications
Rendezvous with
drug or equipment
tech
Refuel
Station Cleaning
30 minutes prep time
30 minutes for refueling &
meeting with drug or
equipment tech
END OF SHIFT
Secure vehicle &
drugs (sign out
drugs)
Personal:
Wash up
(10 min)
Personal:
Lock up time
(10 min 35% of
the time)
Linens
Oxygen
Paperwork
EPCR
Total
20 minutes
Swipe Off

Service Efficiency Review – Toronto Fire Services & Toronto EMS
3.3.5 Mitigating the Rise in Call Volumes
Between 2002 and 2011 TEMS has experienced almost a 28% increase in call volume (actual incidents not responses) (Table 11). This upward trend would have been greater except for the efforts of TEMS to reduce non-urgent patient transfers by working with hospitals and other institutions to use other means such as patient transport services, hospital conveyances where available, or family-provided transportation.
Table 11 - EMS Call Volume - Year over Year Percentage Changes 2002 - 2011
TEMS’s call volume trend is increasing at a rate greater than the city’s population growth (Chart
12).
In 2002:
the city’s population was 2,481,510 (this is actually the 2001 population, although the trend line shows fewer than the actual 2001 population)
the total time sensitive EMS call volume was 169,389.
Therefore the calls per capita = 169,389/2,481,510 = 0.0683
In 2006:
the city’s population was 2,503,270
the total time sensitive EMS call volume was 182,474
Therefore the calls per capita = 182,474/2,503,270 = 0.0729
In 2011:
The city’s population was 2,615,070
The total time sensitive EMS call volume was 217,191
Therefore the calls per capita = 217,191/2,615,070 = 0.0831
The growth of calls per capita since 2002 has been (0.0831-0.0683)/0.0683 = 21.67% but
population growth in the same time period has been (2,615,070-2,481,510)/2,481,510 = 5.38%
Therefore, the rate of unique ambulance incidents is increasing at a greater rate than the population. Of course, it is difficult to predict if this trend will continue.
Call Volume - Historical TrendsPercentage
Change
2002 2003 2004 2005 2006 2007 2008 2009 2010 2011 2002-2011 2002-2011 2006-2011
0-Echo 3309 3543 3411 4233 3884 4116 4080 4544 4569 4377
7.07% -3.73% 24.10% -8.24% 5.97% -0.87% 11.37% 0.55% -4.20% 32.28% 3.56% 0.76%
1-Delta 60128 61148 60748 68139 68573 70542 72840 74513 78629 81348
1.70% -0.65% 12.17% 0.64% 2.87% 3.26% 2.30% 5.52% 3.46% 35.29% 3.47% 3.01%
2-Charlie 20849 22982 24803 24329 28595 29555 31187 29829 31639 32309
10.23% 7.92% -1.91% 17.53% 3.36% 5.52% -4.35% 6.07% 2.12% 54.97% 5.17% 5.04%
3-Bravo 52542 54532 53966 50418 50330 52039 52153 55000 58975 61159
3.79% -1.04% -6.57% -0.17% 3.40% 0.22% 5.46% 7.23% 3.70% 16.40% 1.78% 3.30%
4-Alpha 33011 33422 33308 30716 31092 33812 34637 33702 34885 37998
1.25% -0.34% -7.78% 1.22% 8.75% 2.44% -2.70% 3.51% 8.92% 15.11% 1.70% 3.69%
Total Time Sensitive Calls 169839 175627 176236 177835 182474 190064 194897 197588 208697 217191
3.41% 0.35% 0.91% 2.61% 4.16% 2.54% 1.38% 5.62% 4.07% 27.88% 2.78% 3.40%
Average Annual
Change

Service Efficiency Review – Toronto Fire Services & Toronto EMS
Page | 94
Chart 12 - Population and EMS Call Volume Trend
Table 11 - EMS Call Volume - Year over Year Percentage Changes 2002 - 2011 indicates that the average annual change in Total Time Sensitive Calls (blue highlight), was 2.78% from 2002 to 2011, and 3.4% from 2006 to 2011. Based on this history and the indication that EMS call volume per capita has been increasing since 2002, it seems reasonable to expect that TEMS may experience an average annual call volume increase of 2% – 4% over the next 10 years as
Toronto’s population grows. Assuming a conservative growth of 2% per year to 2021, Toronto could experience a total increase of 43,220 unique dispatched incidents between 2012 and 2021. This estimate may be conservative and is dependent upon the growth rate of the city and the success TEMS has with implementing other measures to mitigate call growth.
If this forecast of 43,220 additional unique incidents becomes true, and if the premises shown in the bullets below are accepted, then Toronto will require 9 additional ambulances to keep pace with growth. If the call growth rate is 4%, the city will require 18 additional ambulances in the next 10 years.
There are 12 vehicle hours in a shift
30 minutes are allocated to beginning of shift preparation time (see Exhibit 6)
20 minutes are allocated to end of shift process (see Exhibit 6)
Ideally, 90 minutes are allocated to mealtimes and two refreshment breaks per 12 hour
shift
Therefore,
There are 720 minutes in a shift
140 minutes are allocated to breaks and preparation
580 minutes remain for service provision (incident response)
Each incident that requires patient transport consumes an average of 80 minutes

Service Efficiency Review – Toronto Fire Services & Toronto EMS
Page | 95
Therefore, on average, each ambulance can provide service to (580/80 =) 7.25 incidents
per shift
This calculation does not take into account multiple vehicle responses or peak demand.
In 2011 dollars, to staff and fuel one ambulance 24 hours a day, for 365 days costs $926,735 not including maintenance and support requirements. Therefore 9 ambulances will increase the EMS budget by ($926,735 x 9) = $8,341,000; 18 ambulances will increase the budget by ($926,735 x 18) = $16,681,000. There is the potential, depending on the distribution of call increases (hour of day, day of week), that the growth effect may be less costly but it is not possible to determine at this point. Nevertheless, efforts towards call mitigation will have a direct effect on reducing potential budget increases.
One Initiative is Not Enough
A single initiative cannot reduce call or transport volume sufficiently to make an appreciable difference. A number of separate initiatives is required—some of them in concert with other arms of healthcare. The following examples illustrate some initiatives to consider.
Community (or Expanded Care) Paramedics or MDs in the Communications Centre
Low acuity calls can be rescreened and vetted. During the 2010 Winter Olympics, the British Columbia Ambulance Service placed an EMS physician in their communications centre 16 hours per day to recall low acuity callers (Alpha-Q determinant). Over the 17 days of the Olympics, the
physicians were able to find an alternate solution (no ambulance) for 28 percent of the callers they spoke with. In response to a screening question, two to three callers per day who did require a hospital visit said they would have been willing to take a taxi had that been available. (unpublished, Dr. Karen Wanger, Regional Medical Director, British Columbia Ambulance Service). Patient satisfaction was almost universally good.
Priority Solutions Integrated Access Management
The Priority Solutions Integrated Access Management (PSIAM) system, working in conjunction with the Medical Priority Dispatch System software already in use by TEMS, has the potential to
clinically guide some low acuity ambulance responses to other community alternatives. TEMS should consider implementing this system. Similar systems are already in place in Houston,
Mecklenburg, Melbourne, and areas of the United Kingdom including London. Niagara EMS is currently embarking on the second stage of a clinical trial with this system.
Other “No Send” Decision Rules
Other decision rules also exist for no send protocols or alternate solutions. Dr. Friedberg with TEMS has developed a model for use in the TEMS Central Ambulance Communications Centre. Taxi chits are an oft-cited idea as an alternative to ambulance for ambulatory, low acuity callers.
Service Efficiency Review – Toronto Fire Services & Toronto EMS
Page | 96
3.3.6 Community Paramedicine Program
The Community Paramedicine Program is an ongoing concept and effort by TEMS and its paramedics to provide "added value" for the City within the work already performed.
The following initiatives are part of the Community Paramedicine Program:
Community Referral by EMS (CREMS)
Community Agency Notification
Hot and Cold Weather Response Programs
Influenza Vaccination
Bed Bug Identification and Prevention
Safety programs (e.g., Window and Balcony Safety)
The consultant team member who reviewed the program found it to be very patient and systems focused, and at relatively low cost to the City, particularly considering the Province is paying 50% of the costs. Program costs, which include a small number of complement positions, direct administrative time and some material costs, are not specifically tracked which makes it difficult to assess a cost – benefit.
TEMS indicates that it treats 30% of all residents of Toronto who are 75+ years of age, at least once per year. Many of these calls are not life-threatening or time sensitive and paramedics
are uniquely positioned to connect with the elderly and vulnerable in their homes.
The consulting group KPMG suggested, as part of the Core Service Review, that the Community Paramedicine Program costs the City somewhere in the area of $2.6 million. The direct costs for the program are not well tracked – although we recommend that they should be, as well as capturing possible offsetting savings or deferrals – but they are expected to be significantly lower than $2.6 million. It doesn’t appear that KPMG’s calculations took into account any potential offsetting cost avoidances, although we aren’t sure of this. Further, we are not able to discern the methodology utilized by KPMG to determine which costs were allocated to community paramedicine.
While there is some financial return to TEMS from some of the community paramedicine program activities these returns are not really strongly tracked either, and that is not unusual. Programs such as these are developmental, and many costs are really a theoretical construct – for example, if there are 1,000 ambulance responses mitigated, and the average cost per ambulance response is $500, the mathematically calculated $500,000 isn’t really saved unless actual response capacity can be taken off the road. What occurs is a decrease in future response growth. So ‘savings’ in this case must be measured as avoiding future financial pressures; for example, as described in Chart 12 - Population and EMS Call Volume Trend.
Some staff working in the program may be workplace accommodation type placements; for example, workers returning from WSIB time off. During the review, the consulting team was
advised that all staff involved, excepting 3, are workplace accommodations. Where a worker is injured and must remain off duty due to inability to perform normal duties, a Schedule 2

Service Efficiency Review – Toronto Fire Services & Toronto EMS
Page | 97
employer, such as Toronto, must pay the full cost of wages and benefits through the Workers'
Safety Insurance Board, as well as administration costs. Enabling employees to rejoin productive and related work is important not only to the employee but could be less costly to the employer.
TEMS maintains records of referrals by the Community Referral Program by EMS (CREMS). This is a program whereby paramedics on 911 calls make a note, and with the patient’s consent, refer vulnerable patients to partner agencies such as Community Care Access Centres (CCACs) or other social agencies so that assistance can be provided to patients to promote independent living. Referred patients are often frequent users of ambulance services because they may not have another means of access to health care or they do not have adequate support where they
reside. Therefore, an effective referral may result in the reduction of many additional responses to a single patient by getting them the right care at the right time by the right provider (please see Exhibit 7 - Excerpt from Community Referral Program Records). Approximately 3,900 patients have been referred for further assistance since 2006 with 904 referrals in 2011.
Exhibit 7 - Excerpt from Community Referral Program Records
A CREMS fact sheet, provided by TEMS, is attached at the end of this section and indicates a 50% or more decline in ambulance use for the referred patients. Admittedly, within the scope of the total incidents responded to by TEMS each year, this is a small number of patients. However, the important point is that each program or effort, that mitigates call volume growth, offsets the potential of additional resources being required. Nevertheless, programs that
mitigate growth cannot cost more than the growth being moderated which underlines the importance of accurate tracking and reporting of program benefits.
Date Time
Client Transported to
hospital (Y or N), and if Y, which
hospital?
Local CCAC Existing
or New
Current services for existing clients
or admit/non-admit information for new
clients
Disposition (service changes,
hospitalized, LTCHs, etc.)
Health Issue, Diagnosis, Case Notes
Pre CREMS
EMS Calls
Pre CREMS
Transports
Pre CREMS
Time One Task
Post CREMS
EMS Calls
Post CREMS
Transports
Post CREMS Time On
Task
1-Jan-11
1:17pm Y-York Central Central Still in hospital
awaiting convalescent care
Hallucinations in the morning for the last couple of days. Had a fall and broke
her right shoulder. Lives with husband. Decreased mobility.
3 3 6.71 2 2 6.31
1-Jan-11
2:22pm N TC CCAC New Admitted PSW Alzheimers. Failure to cope with
anxiety. 2 2 3.04 1 1 2.04
2-Jan-11
Y-STMH TC CCAC New Admitted - PSW Respiratory infection. Mobility
concerns. Has a walker 1 1 2.67 0 0 0
3-Jan-11
11:13am Y-SHSC Central New Non admit, declined service 90 years old, depressed and lonely, several calls to EMS. Community
outreach program will be good for him. 4 1 5.63 1 1 1.59
3-Jan-11
6:11pm N CE CCAC Information not
available
92 years old. Fell and was not able to get up. No obvious injuries. Lives
alone. 1 0 0.99 0 0 0
3-Jan-11
10:05am N CE CCAC Information not
available Frequent falls - twice a week. Mobility
decreased. 8 0 7 1 0 0.46
3-Jan-11
6:23pm N TC CCAC New Admitted PSW & PT Elderly, dementia. Freq ambulance response. Trouble with eating and
personal care. 3 2 5.24 0 0 0
3-Jan-11
3:26pm Y-Scarb Grace Central PSW Fell on the right wrist. Elderly, living
alone. 1 1 2.63 0 0 0
4-Jan-11
11:15am Y-STJHC TC CCAC New Admitted - OT Lives alone. Suffering from neglect.
Abdominal discomfort. 3 3 6.41 1 1 1.67
4-Jan-11
9:08am Y-NYGH Central Existing Increase PSW,
add nursing Confused. Acting abnormally for the
last few days. Obese. 4 1 5.14 0 0 0
5-Jan-11
2:56pm N MH CCAC Information not
available
Risk of falls. Fell in the bathroom and was there for 3 hours. High BP.
Unsteady on her feet. 2 2 7.52 0 0 0
5-Jan-11
7:35pm Y-SGH CE CCAC Information not
available SOB. Living condition unkempt. 1 1 1.94 0 0 0
5-Jan-11
6:05pm N TC CCAC Existing PSW increased
Issues with med compliance due to increasing confusion. Needs
assessment on nursing assistance and possible long-term care.
2 0 1.67 0 0 0

Service Efficiency Review – Toronto Fire Services & Toronto EMS
Page | 98
It is possible that referral programs generate greater offsets to partner agencies such as CCACs
and hospitals. An effective referral is understood to have a downstream impact on CCAC discharge (less total time in the CCAC care), increases in flow speed through an emergency department when clients do visit, and decreased length of stay in hospitals. All of these are uncosted significant drivers for health care partners.
Another area for offsetting costs may be in other City departments such as social services (less interactions), housing (improved care and conditions), and other supports. One example of a potential is the flagging of ‘hoarders’ by EMS as they visit patients in their homes. Hoarding is understood to be a cause of the 200 Wellesley St. incident, and prevention of this type of long-term displacement of a high occupancy building at City expense is extremely significant - not to
mention the quality of life and health of all the other residents.
An extremely good example of a very low cost solution to ensure patients receive the right care, and their primary care providers are aware of the EMS response and interactions, is the Community Agency Notification (CAN). In its simplest format, patients are registered with unique identification on an ‘in case of emergency’ (ICE) form that is located in their residence. Where the paramedic has an interaction, they contact the central phone number, key in the unique ID, and then provide a verbal description. The care provider will then receive an email with an attached voice file outlining exactly what is happening to their patient.
Our review leads us to believe that the various community paramedicine program activities can become part of Toronto’s and the province’s social support network. However, there are no
clear evaluation criteria to determine if what the consultants and TEMS senior staff believe is true about community paramedicine, actually is. There are a number of programs such as the Long and Brier Islands Community Paramedic initiative, Winnipeg’s Main Street Project, and numerous programs in the United Kingdom and Europe but most of these meet a need for ancillary agencies rather than EMS. In these examples, EMS serves the purpose of delivering care in the community rather than transporting a patient to hospital that may be some distance away. For example, in the Long and Brier Islands, the closest hospital is almost two hours away so, although adding EMS staff to the island is more costly for EMS, it provides a value and
service to the 1250 residents of the island. In Winnipeg, the cost of EMS service to the Main Street project is equivalent to adding 3 staffed ambulances to the service. However, it is seen as
a significant reduction in hospital costs and a valuable service to the Main Street community, and the cost is not borne by the ambulance service but by the provincial health system. Community Paramedicine is growing across Canada because of its potential to provide patient care alternatives that result in improved outcomes for the patient, the EMS system and society.
So, while we agree that the Community Paramedicine program should continue and be promoted, the costs and benefits should be closely monitored to determine where value is delivered. We suggest that value doesn’t have to be monetary only but it could also be measured in quality of life, particularly for some of Toronto’s population in need of assistance.
Potential community paramedicine activities for the future, focused on the needs of the
patients, the support of the broader health care system, and the unique opportunities for early intervention that the business of paramedicine provides, could include:

Service Efficiency Review – Toronto Fire Services & Toronto EMS
Page | 99
Structured negotiations with the Ontario Ministry of Health and Long Term Care, and the
various LHINs, to create funding sources to extend the concepts of community paramedicine programs.
Creation of a Priority Solutions Integrated Access Management (PSIAM) program for the TEMS Dispatch. PSIAM can be utilized only in dispatch centres accredited in the use of MPDS, and Toronto has achieved that. This system, at its most aggressive, could conceivably see all Alpha level calls triaged from the primary EMS Call Taker to a secondary, more highly trained, call taker who would use PSIAM to elicit further information.
Outcomes may then be:
o dispatch referral of the caller to an alternative community resource (response is not sending an ambulance) - Hear and Refer
o dispatching a higher level Expanded Care Paramedic (ECP) responder assess the routine needs of the patients and provide on scene care rather than transporting to hospital – "See and Refer", "See and Treat", and
o the traditional dispatching of a traditional ambulance with the expectation of transporting to hospital
Establishment of a more highly trained EMS provider to be utilized in conjunction with
PSIAM, dispatched to low acuity calls with the expectation of the single provider performing
either a ‘treat and refer’ of the patient, or a ‘treat and release’ of the patient, instead of transporting to a health care facility. This truly is the concept of mobilized health care and well within the current nature of EMS at an international level, particularly in the UK and Australia.
3.3.7 Conclusions
Community Paramedicine, based on early information from some parts of North America and Europe, is expected to slow the growth of event volumes. Further, it fits with the human services principle of reducing the need for urgent responses to patients that have not had the benefit of preventative care. It is programs that, with continued monitoring and adjustment, can become more valuable as the program grows in sophistication.
The direct costs of the program are not well tracked, although they should be, as well as capturing possible offsetting savings or deferrals. Additional effort should be put into capturing costs and tangible and intangible program benefits.
Community Paramedicine should continue to be delivered in partnership with other City departments, including TFS. The fire department can contribute during the pursuit of its human services initiative of public education, prevention, and inspection.
TEMS should work with the province to investigate opportunities for Community Paramedicine to improve efficiencies, provide improved service to patients' not requiring emergency room visits, and decrease traditional paramedic responses to emergency calls.
3.3.8 Recommendations

Service Efficiency Review – Toronto Fire Services & Toronto EMS
Page | 100
Continue the Community Paramedicine program as part of a strategy to provide the
most appropriate patient treatment and reduce emergency medical response call demand.
Exhibit 8 - Community Paramedicine Information Sheet from TEMS
Community Referrals by EMS
Paramedics may be the first, and in some cases, the only health care
provider to make contact with our most vulnerable and marginalized
patients.
Since the TEMS Community Referrals by Emergency Medical Services Program was rolled out in 2008,
there have been over 3,700 referrals made to Toronto CCAC's by TEMS paramedics for over 3,200
patients.
All paramedics are in a unique position to advocate for patients who are not already receiving services
at home by making a referral to CCAC. Most of these patients would not have been identified by CCAC
as they have yet to be connected with home services even after discharge from hospital. Of those who
are receiving services, additional referrals by paramedics can increase their opportunity to receive more
services at home thereby mitigating further calls to 911 and hospital visits.
2011 Referral Summary
904 CREMS referrals made in 2011.
Below is a chart demonstrating the number of calls, transports and time-on-task that referred patients
had generated 6 months before their referral (Pre-CREMS), as well as the number of calls, transports,
time-on-task and a percent change for those same patients 6 months post referral (Post-CREMS).
Pre-CREMS Post-CREMS
Calls Transports ToT Calls %* Transports %* ToT %*
2715 1654 4597.28 1340 -50.6% 582 -64.8% 1898.87 -58.7%
ToT – Time on Task
%* = Percent change calculated by (Pre-CREMS – Post-CREMS) / Pre-CREMS
CCAC Definition – A Community Care Access Centre (CCAC) connect patients with the care they need at
home and within their community. CCAC helps patients/clients stay in their home longer by providing
care in the home and by coordinating care in the community, including specialized support services
(nursing, occupational therapy, physiotherapy, social services, pharmacy, etc..). There are a total of 4
CCAC's that fall within the City of Toronto's catchment area.
Service Efficiency Review – Toronto Fire Services & Toronto EMS
Page | 101
Toronto Central CCAC receives approximately 40-45% of the Community Referrals submitted by
TEMS Paramedics.
The selection of nursing, personal support (PSW), occupational therapy, physiotherapy is based
on the significant impact these services have on a patient's health and their risk for injury.
Providing nursing care in the home is much more cost effective than in a hospital setting; this
type of nursing care may include wound care, diabetes/medication/hypertension management,
urinary catheter care.
Providing physiotherapy, occupational therapy and/or personal support is extremely valuable in
preventing falls in the home which can result in significant health problems, frequent calls to
911, and hospitalizations.

Service Efficiency Review – Toronto Fire Services & Toronto EMS
Page | 102
4.0 Consolidated FIRE-EMS Models
An important objective of this study is to determine the efficacy of a consolidated fire – EMS department for the City of Toronto. This section examines evidence to help determine the medical, operational and economic feasibility of such a service delivery structure. Intuitively, many people support the idea of a combined fire – EMS delivery structure assuming that it will save money and be more effective in the provision of emergency medical services. This section examines the facts including, where available, the documented experience of other jurisdictions and its applicability to the City of Toronto. The examination is based on existing legislation and
an understanding that legislation, regulations, and directives will not change significantly in the foreseeable future.
4.1 Consolidating TFS and TEMS
Consolidation Would be Essential if Response Operations were Combined
Consolidating the emergency medical services and fire services in a single organization would be essential if the response operations were combined. In some cities, the apparatus and staff that are used to respond to medical emergencies are cross-trained and used to support fire suppression response. In such cities, combining the EMS and fire response functions into a
single department is essential. Not only must operational response be coordinated but staff must be trained to ensure an effective response. In Toronto, by contrast, while the fire services and emergency medical services coordinate their response to some (but not all) medical calls, staff members are not cross-trained. Combining operations in a single department therefore is not imperative.
Consolidation Would Create Some Benefits
Consolidating the emergency medical services and fire services in a single department has the potential to create benefits. Some efficiencies would likely result if the support functions of the EMS department and fire department were more closely tied, in the same way as cooperation
with other divisions and corporate partners could create efficiencies and benefits. In particular, efficiencies might be achieved in the following areas:
Communications
Quartermaster and warehousing
Vehicle maintenance (for some vehicles)
Equipment maintenance
Radio repair and maintenance
Facility maintenance
Technology support

Service Efficiency Review – Toronto Fire Services & Toronto EMS
Page | 103
The area where the benefits of consolidation would likely be greatest – communications –
might be difficult to capture. The TEMS' communications function is fully supported and funded by the province and must conform to provincial requirements. Managing a communications centre that meets city EMS, provincial, and city fire requirements would be difficult. In addition, some of the benefits of the consolidation would be offset by the administrative costs associated with tracking costs and making appropriate charge-backs to the province.
Consolidation Benefits Offset by Other Factors
The leaders of TFS and TEMS share a commitment to effective management, developing sound systems to: (1) support operational efficiency and improved service, and (2) strengthening data based decision making. In addition, the chief of each department is focusing on key strategic
initiatives. For example, the TEMS chief is focused on identifying ways to provide alternative service delivery options that will reduce the growth of call volume. The Fire Chief is evaluating how response alternatives might vary by areas of the city.
However, the approach taken to implement these improvements will vary significantly in each department. If the departments were consolidated, the challenging task of implementing improved management practices and systems in each department would be multiplied. Moreover, the effort that would be required to establish a consolidated department would divert attention from each department’s strategic initiatives.
We have not been able to find any records of a consolidation having gone relatively smoothly
but there is evidence that merging of separate fire and emergency medical services is often beset with challenges. There can be many reasons for this including collective agreements, personality clashes – both at the front line staff level as well as senior administration – and operating differences. The City of Winnipeg is an example of an organization that consolidated fire and EMS and, 15 years later, have come close to resolving the many issues that occurred.
Consolidation is usually precipitated by financial issues, service provision shortfalls, or because the idea of amalgamation is championed by a senior administrator in fire or EMS. However, although there are a number of publications advocating fire and EMS mergers, we have not been able to find any independent studies that lay out evidence that a consolidated entity is
financially, operationally, or organizationally advantageous in the circumstance where the two
organizations are competent.
From an organizational perspective, as can be seen within this part of the report, consolidation will not reduce the number of administrative staff since there are not position responsibilities within each organization that can be assumed by one or the other organization. In other words, senior staff do not have time on their hands to take on a larger role. Some duties may be pushed from a Deputy to a Division Chief or Commander because, in a consolidated organization a Deputy may take on a greater scope of responsibility, but the number of people required to satisfy a function will remain the same.
Service Efficiency Review – Toronto Fire Services & Toronto EMS
Page | 104
Collaborating Instead of Consolidating
TFS and TEMS do not need to be combined to take advantage of the benefits of coordinating the delivery of support services. By working closely together, as with other divisions and corporate partners, the managers of support functions in each department can find ways to create synergies, reduce costs, and improve operational performance. Indeed, these managers should be expected to work together to leverage the resources of each department to the benefit of both departments. It is worth noting that the two departments—who share a manager to oversee financial operations—are already working together to reduce costs.
4.1.1 Conclusion and Observations
Consolidation is usually precipitated by financial issues, service provision shortfalls, or because the idea of amalgamation is championed by a senior administrator in fire or EMS. However, although there are a number of publications advocating fire and EMS mergers, we have not been able to find any independent studies that lay out evidence that a consolidated entity is financially, operationally, or organizationally advantageous in the circumstance where the two organizations are competent. However, there is ample evidence that merging of separate fire and emergency medical services is often beset with challenges.
Considering the documented upheaval of organizational consolidation of fire and emergency medical services, and
Considering there is no evidence that a consolidated entity is financially, operationally,
or organizationally advantageous in the circumstance where the two organizations are competent, and
Considering that by working closely together, and with other divisions and corporate
partners, managers within fire and EMS can find ways to create synergies, reduce costs, and improve operational performance
We find that there are no reasons to consider the consolidation of the TEMS and TFS.
4.1.2 Recommendation
Do not consolidate TFS and TEMS.
4.2 The History of Firefighter Response to Medical Events in Ontario
Very few people are aware of the origin of firefighter response to medical events in Ontario. The principal author of this report was significantly involved in the early discussions that led to the decision by the Emergency Health Services Branch (EHSB) of the Ministry of Health to introduce and promote the practice of firefighter medical response.
In the early 1990s, prior to the downloading of ambulance service responsibility from the province to municipalities, a city in what is now Halton Region requested additional ambulance coverage because they believed that response, in some cases, was not sufficiently rapid. An
analysis of this request by Emergency Health Services Branch led decision makers to believe that coverage in the requesting city was adequate in comparison to similar cities. However,

Service Efficiency Review – Toronto Fire Services & Toronto EMS
Page | 105
EHSB recognized that the request and pressure for augmented ambulance coverage would
continue, and the belief was that if this city was successful similar requests would be received from other municipalities at a significant cost to the province. The strategy was decided upon to acknowledge the municipality’s concern but to suggest that the city should take on some of the responsibility of protecting its citizens, via the practice of firefighter response, when ambulance response was delayed beyond normal response times. In fact, over a period of time, the decision was made to actively promote this concept throughout Ontario. This promotion included having Emergency Health Services Branch regional and head office staff conduct presentations to municipal councils to convince municipalities that fire services should respond to medical emergencies if an ambulance was delayed beyond the normal response times.
Over several years, the practice of fire department response to medical incidents was expanded by Emergency Health Services Branch based on medical research, but also political expediency and liability concerns. The decision was made that expanded fire department response, beyond those occasions when an ambulance was abnormally delayed, might help to save lives, such as in cases of cardiac arrest, but also reduced liability for Ministry of Health dispatch centres in case actual events turned out to be more serious than initially determined. Over the ensuing years firefighter medical response has become a normal practice in many Ontario municipalities. Nevertheless, some jurisdictions have decided to scale back firefighter medical response due to the cost and lack of evidence that response time has an impact on the majority of patient ailments and injury; for example, some jurisdictions will send firefighters to cardiac
calls only.
4.3 Firefighters as Paramedics
Firefighters fulfilling the role of paramedics or emergency medical technicians are a model that is found more commonly in the United States and, to a lesser extent, in some limited areas of Canada. Where firefighters perform a paramedic role, over and above an initial co-responder role such as is currently performed by the TFS, it is typically in one of the following configurations:
Provision of all ambulance service activities, meaning that firefighters trained as
paramedics actually staff the ambulances which are operated directly by the fire service;
Provision of some ambulance service activities, meaning that firefighters trained as
paramedics staff some of the ambulances within a community, and perform some of the responses, while another agency or organization staffs their own ambulances with trained paramedics and also responds to some of the calls for service within the community;
Provision of either basic or advanced care by firefighters trained as paramedics as part of a responding fire apparatus. Ambulance service and patient transportation is provided by another agency or organization which staffs their own ambulances with
trained paramedics and responds to the same calls.

Service Efficiency Review – Toronto Fire Services & Toronto EMS
Page | 106
In the United States, where firefighter paramedics are most prevalent, and with which we, in
Canada, are most familiar, those models came about because of the nature of private ambulance services; for example:
Some private ambulance services supported themselves by directly billing patients in much the same way that happened in Ontario over 40 years ago (private for profit). That was not a viable business model and even the most conscientious ambulance services could not always be counted on to deliver assistance when required. Municipalities turned to fire departments, a stable organization with available service capacity (available time), to provide emergency medical services.
Ambulance service did not exist; fire assumed the responsibility by virtue of it being an
established, stable entity.
In a few municipalities, Philadelphia for example, EMS also acts as an adjunct for
firefighting. Ambulance service in some United States jurisdictions is not as in demand as in Ontario due to the differences in insurance coverage. Therefore, since EMS is not busy, comparatively speaking, there is time available to support firefighting duties. This was a model prevalent in some parts of Alberta until early 2009. In Alberta municipalities such as Lethbridge, Red Deer, Fort McMurray, Medicine Hat, and many smaller locations, a fire truck and ambulance would be sent to almost all fire incidents which would allow five firefighters – including two firefighter paramedics from the ambulance – to be the initial response to fires. This response model reduced the need
for firefighters. In the same way, two paramedics and three firefighters would respond to medical calls, in part to keep the team together in case of a fire.
In April of 2009 Alberta moved ambulance service from a municipal responsibility to a provincial health responsibility and is moving away, as quickly as possible, from paramedics acting as firefighters, although this practice still exists in a few locations.
4.3.1 The Winnipeg Experience
A Canadian system which is often held out as an example of an effective fire-fighter paramedic service, and is used to support the argument in favor of implementing a similar model in other
communities, is Winnipeg. However, it is important to understand the background to how the Winnipeg Fire and Emergency Medical Services amalgamation came to be, at what cost the model was established, what challenges were encountered, and what benefits are being derived. We visited the Winnipeg Fire and Emergency Services in July of 2012 as part of our research into Toronto’s project.
The Winnipeg Fire Paramedic Service (WFPS) is an amalgamated fire and ambulance organization. The functions and different alignment of the two services are recognized in terms of funding. Fire services are municipally funded and EMS costs are shared between the Manitoba Health Ministry, the City of Winnipeg, and end user revenues.
In the 1970s Winnipeg’s ambulance services were privately operated, plus there were four fire rescue units responding to 30,000 calls a year. Firefighters who staffed the fire rescue units

Service Efficiency Review – Toronto Fire Services & Toronto EMS
Page | 107
were trained in first aid and occasionally transported patients, however there was virtually no
interaction between fire and the private ambulance services.
In June, 1975 a provincial and municipal political will emerged to improve the quality of services being provided by the two emergency organizations. The province eliminated all private ambulance companies and assumed both operational and budgetary responsibility for EMS through the Health Ministry. A municipal training program was developed and delivered to all firefighters, and a revised fire services infrastructure was gradually created.
In 1980 the Winnipeg Fire Chief recommended full amalgamation of fire and ambulance departments to a city Ad Hoc Committee. In response, the city engaged the services of J.E. Peterson & Associates to conduct a feasibility study. The consultant group recommended full
amalgamation and projected a potential cost saving of approximately $1.5 million per year. This recommendation was not immediately implemented but in 1986, Council approved an operational audit of the Winnipeg Fire Department to be conducted by Cresap, McCormick and Paget who made several recommendations, projecting significant savings, such as:
Reducing duplication of pumpers (6 pumpers and 108 firefighters) with an annual cost saving of over $4 million.
Closing two fire stations with an annual cost saving of $3.5 million.
Not adding Driver/Aids for district chiefs
Reducing the overstaffing in the communication centre.
Council resolved to phase in the recommendations over seven years. As the recommendations were being phased in, talk of amalgamation was rekindled in the 1994 working paper A New Direction for Civic Administration18. This was followed by an interim report to the Board of Commissioners outlining the history and progress to date with respect to amalgamating city services. This report19, prepared by Frank S. Kowal, executive assistant to the Commissioner of Protection, Parks and Culture, dated October 31, 1995, actually recommended that the Winnipeg Fire Department and the Winnipeg Ambulance Department NOT be amalgamated.
In 1997 consultant George Cuff was retained by the Winnipeg City Council to conduct an Organizational Review and Performance Assessment20, the terms of reference being the
amalgamation of as many services as possible provided by the City of Winnipeg. At the same time (1997) Gary R. Richardson completed his Masters of Public Administration thesis; An Analysis of fire department and ambulance integration from a process perspective: Utilizing Winnipeg, Manitoba as a case study.21 The most salient conclusion he reached after two years of studying the pros and cons of amalgamation efforts across North America and Winnipeg was that:
18 City of Winnipeg, A New Direction for Civic Administration, April 1994 19 Kowals, Frank, Executive Assistant to the Commissioner of Protection, Parks and Culture. Re: Proposed Amalgamation of the Fire and Ambulance Departments. October, 1995. 20 Cuff, George B. & Associates. Organizational Review and Performance Assessment: A corporate review. 1997. 21 Richards, Gary R. An analysis of fire department and ambulance integration from a process perspective: Utilizing Winnipeg, Manitoba as a case study. National Library of Canada, 1996.

Service Efficiency Review – Toronto Fire Services & Toronto EMS
Page | 108
“While it is apparent that if Winnipeg wants more efficient and effective emergency services, a
full amalgamation of the Fire and Ambulance departments is a way to achieve them it is also as evident that the process through which this is achieved is crucial to success, for despite the content of other reports, it was universally the process that determined success or failure in the jurisdictions studied.”
Richardson further concluded that ultimately amalgamation “is a people problem” and as such “the process must involve the people who will work in whatever system is created.”
At the same time as ongoing discussions about consolidation were taking place, fire and ambulance services were amalgamated in 1998 with little to no notice of senior fire or EMS staff. The rationale for amalgamation with fire services ‘taking over’ ambulance was very
simple. At that time, fire services had a better and more established management system and physical infrastructure, and establishing a similar structure for EMS could be avoided with amalgamation. The fact that personnel details were not addressed at the time of amalgamation created significant difficulties that continue to linger almost 15 years later. The two major issues were the cultural differences between the services, and labor relations.
The cultural differences became amplified when the two services were brought into close proximity by sharing space in a station. There have been numerous problems encountered, including forms of harassment, which were well publicized in the media. Our interviews with senior staff indicate these events have subsided; however, labor relations problems continue to be an issue. There are five unions in the amalgamated service, resulting in significant wage and
working condition differences. This situation inadvertently provided an opportunity for cross-trained applicants to enter the amalgamated service as a paramedic, with the intent of moving to fire as soon as the opportunity presented itself since movement to the fire discipline is considered an advancement. Management has stopped this practice, particularly due to the effects on EMS staffing.
The current chief and his senior staff are of the belief that when the amalgamation decision was made it should have been implemented with a clean slate wherein all staff would have to apply for positions. The chief believes that use of a carefully designed selection process would have
afforded the opportunity to “weed out” those with extreme negatively polarized cultural and
labor relations views.
The internal volatility of Winnipeg’s combined fire and emergency medical services have subsided since its early years; however, there is no evidence that the existing configuration is operationally or monetarily more or less effective than a separate fire – EMS model. Winnipeg did not track the differential in costs between the previous separated model and the existing. This is because the decision to consolidate was made for political rather than operational or financial reasons.
4.3.2 Other Research Findings
We researched literature in an effort to find studies that offer reasonable operational,
organizational, or financial evidence to conclude that there are advantages to one or more of the firefighter paramedic models. The results are that:

Service Efficiency Review – Toronto Fire Services & Toronto EMS
Page | 109
We have not found literature that proves a firefighter paramedic model is more efficient
or advantageous than the system Toronto currently enjoys.
Where the literature recommends a model, it is one that fits the municipality or jurisdiction being studied and is not held out as being applicable to other jurisdictions.
Literature that recommends fire based EMS systems is usually published by
organizations such as the International Fire Fighters' Association or the International Association of Fire Chiefs which could be considered by some to have a bias towards that model. As noted previously, although we read studies from, or sponsored by, fire or EMS associations, we were very cautious about using them unless they contained compelling evidence with respect to the subject matter.
In some cases, conclusions within the literature were based on anecdotal information; for example, in some studies there may have been no baseline for measurement, neither was there prospective or historical data gathering but the ‘prevailing opinion’
within the municipality or organization was that their firefighter paramedic model was advantageous.
In Alberta, since 2009, urban emergency medical services have been transitioned away
from a fire centric model to a health services model even though some small municipalities still operate ambulances through their fire department under contract to Alberta Health Services.
In summary, we were unable to find literature that provides evidence of a fire – EMS model being financially, operationally or organizationally superior to the model Toronto currently enjoys.
The important point to note is that each jurisdiction, where firefighter paramedic response is provided, arrived at that delivery model as a result of a variety of factors. It has suited the specific needs of the jurisdiction to adopt that model, often without financial or operational evidence, but it does not mean the experience is transferrable to Toronto. In addition, the change process has taken a significant number of years and the costs of that change process have not been tracked.
4.4 Legislation and other Factors Affecting EMS and Fire Operational Consolidation
Almost all jurisdictions are required to operate within comprehensive legislative, regulatory, and medical oversight parameters which are applicable regardless of the provider type.
The consulting team reviewed and analyzed the following to derive the conclusions presented at the end of this section:
1. relevant publications and legislation;
2. consulting team knowledge of the TFS and EMS operations derived from information
collected as part of the overall study; and,
3. existing consulting team knowledge of public safety and public safety services.

Service Efficiency Review – Toronto Fire Services & Toronto EMS
Page | 110
Ambulance Regulation and Current Ambulance Requirements
In Ontario, patient transportation to a hospital or other destination requires an ambulance that is fully equipped and staffed in accordance with legislated and regulatory requirements. The ambulance service must operate in accordance with the Ambulance Act (Ambulance Act, R.S.O. 1990, Chapter A.19), and all of the regulations, policies, and certification standards required there under (which we refer to as the ‘legislative requirements’). The legislative requirements are considerable in depth and breadth.
The TFS and TEMS currently operate cooperatively as independent elements under a single overarching municipal organization structure. The City of Toronto is responsible for meeting applicable land ambulance legislation including: staffing, operations, response times,
equipment standards, training, qualifications, certification, and particular operational standards. The Ambulance Act, Part 5, Section 8, outlines that where an individual or agency wishes to operate an ambulance service a "certificate to operate" is required. In addition, this certificate is subject to initial, scheduled periodic, and unscheduled scrutiny and review from the certifying authority, which is currently the Ministry of Health and Long-term Care (MOHLTC).
Toronto is also responsible for ensuring paramedics practice in accordance with MOHLTC requirements as specified in the Basic Life Support Care Standards and the Advanced Life Support Care Standards. Additionally, Toronto must be aligned and work with a designated base hospital program for the purpose of medical oversight and delegation of medical acts. The
base hospital program is funded and guided by the MOHLTC through a performance agreement to ensure consistency, continuity, quality, and accountability. The base hospital is the Sunnybrook Centre for Pre-hospital Medicine.
However, because the TFS does not currently provide ambulance service, it is not required to operate or function in accordance with the Ambulance Act and legislative requirements.
Ambulance Act
The Ambulance Act defines ambulance service as follows:
“ambulance service” means, subject to subsection (2), a service that is held out to the
public as available for the conveyance of persons by ambulance"; and
“land ambulance services” includes all services provided by an ambulance service in connection with the transportation of persons by land";
If Toronto decides to combine fire and EMS services into a single operating entity – meaning a complete merger of roles and functions – the ambulance service elements of the new operating entity will have to be defined.
If Toronto decides upon a firefighter paramedic model that results in some firefighters achieving certification as either Primary Care or Advanced Care Paramedics, and if those skills are delivered to patients by firefighters, then it is possible – perhaps likely – that the MOHLTC
will consider that as being the provision of ambulance service. Such service delivery would then be subject to legislation and regulation as part of an ambulance service. This is probably true no

Service Efficiency Review – Toronto Fire Services & Toronto EMS
Page | 111
matter the organizational model; that is, within a consolidated fire – EMS system or,
alternatively, the delivery of PCP or ACP patient care by the fire service.
As a concrete example, the TEMS currently operates a number of single-person response units, each staffed by either a primary care paramedic (PCP) or an advanced care paramedic (APC). The MOHLTC qualifies these units as emergency response vehicles, or ERVs. In compliance with MOHLTC requirements, the paramedics assigned to an ERV must be qualified in accordance with the Ambulance Act and legislated requirements. The paramedics must practice their profession in accordance with the published mandatory care standards22,23,24.
"As a condition of employment, each employee and volunteer in the applicant/operator's service, who is required to provide patient care, will provide such patient care in
accordance with the standards set out in the Basic Life Support Patient Care Standards (version 1.0) dated October 1995, and where applicable, the Advanced Life Support Patient Care Standards published by the Ministry as those documents may be amended from time to time."
Paramedics operating an Emergency Response Vehicle are subject to ongoing review and evaluation by both the service operator and the base hospital for the performance of medical acts.
Further, to satisfy mandatory service review criteria when operating an Emergency Response Vehicle, the equipment utilized must match the equipment mandated by the MOHLTC:
“Each vehicle used as an emergency response vehicle in the applicant/operator's service shall contain as a minimum the accessory and patient care equipment set out in the document titled ‘Provincial Equipment Standards for Ontario Ambulance Services,’ published by the Ministry of Health and Long-Term Care.”
Additionally, the vehicle in which they respond must meet all MOHLTC criteria for selection and maintenance.
“Each emergency response vehicle used in the applicant's service and the patient care and accessory equipment contained therein shall be maintained in a safe operating condition,
in a clean and sanitary condition and in proper working order.
Only ambulances and emergency response vehicles that comply with the applicable version at time of manufacture of ‘Ontario Provincial Ambulance and Emergency Response Vehicle Standard,’ published by the Ministry as may be amended from time to time, are or will be used in the applicant/operator's ambulance service.”
22Ontario Basic Life Support Patient Care Standards http://www.ambulance-transition.com/pdf_documents/bls_patient_care_standards_2.0.pdf 23 Ontario Advanced Life Support Patient Care Standards http://www.ambulance-transition.com/pdf_documents/standards_advanced_life_supports_patient_care.pdf 24 Ambulance Service Patient Care and Transportation Standards http://www.ambulance-transition.com/pdf_documents/standards_amb_service_patient_care_transportation.pdf

Service Efficiency Review – Toronto Fire Services & Toronto EMS
Page | 112
Notwithstanding these requirements, the consulting team expects that the City of Toronto has
the capability of satisfying the legislation and regulations as laid out by the Ministry of Health should a firefighter-paramedic initial response model be adopted. Nevertheless, these are considerations that must be taken into account and will require negotiation with the Ministry of Health and Long Term Care.
The Impact of Legislation on Changes to EMS Service
If the City of Toronto decides to modify its pre-hospital patient care response methodology by staffing fire apparatus with paramedics, there must be clarity with respect to legislative mandate. As noted previously, all TFS personnel and operations currently are outside the control, jurisdiction, and oversight of the Ambulance Act.
If fire apparatus are staffed with firefighter paramedics and the fire service and EMS continue as separate entities rather than consolidated:
1. Would firefighter paramedics qualified at the Primary or Advanced Care Paramedic level and, providing medical care, be certified to provide that care in accordance with the Ambulance Act?
2. Would fire service equipment and vehicles utilized in the performance of a firefighter paramedic medical response (pumpers, rescues) be subject to the requirements mandated for vehicles and equipment in accordance with the Ambulance Act?
Even in the case of an organizational merger where the two entities would become the Toronto Fire and Emergency Medical Service (or the Toronto Emergency Medical and Fire Service) the question of applicability of the vehicle and equipment standards remains.
A review of the Toronto Professional Firefighters' Association, Local 3888, and the City of Toronto collective agreement does not reveal any paramedic classification within the TFS. A review of other TFS policies and procedures, and discussions with fire and EMS senior staff indicate that, while primary firefighter training and retraining cycles include requirements for some medical responder training, there is no recognized professional standard or training which would qualify a firefighter to be recognized or practice as a paramedic.
Legislated change occurs when it benefits the province and patients. The history of change
since the initial 1969 enactment of the Ambulance Act and the 1974 initial regulations pursuant to the act, suggests broad political, medical, and public support would be required, and while not out of the question, such change is unlikely to occur. So one premise guiding this discussion, and for the consulting team’s recommendations, is that the legislative requirements will remain essentially unchanged for the foreseeable future.

Service Efficiency Review – Toronto Fire Services & Toronto EMS
Page | 113
4.5 Firefighter Paramedic Models
From an operational perspective, there are a limited number of ways in which firefighter paramedics (FFPs) can be implemented. In a general sense, the higher level models include potential for:
1. Separate staffing by occupational specialty – firefighting staff are trained as firefighters, paramedic staff are trained as paramedics, and staff function in their primary occupational role.
2. Separate staffing with overlap of training for some – some of the paramedics and firefighters are cross trained, and wherever they are, they work in both roles
3. Combined staff – all staff are trained as firefighters and paramedics (generally referred to as cross trained).
4.5.1 Fire First Responders Acting as Gatekeepers
An operational model that was suggested to the consulting team during early project orientation meetings with fire service deputies and division chiefs, was that of the fire service acting as gatekeepers; that is, responding to medical emergencies and, where possible or practical, not also sending EMS until confirmation of a need by the arriving fire paramedic, or advising EMS to change the response urgency, or even cancelling the response. The concept is
to make use of available fire service resources to alleviate call volume pressure on the emergency medical services system.
TEMS documented approximately 352,000 responses in 2011 and approximately 190,100 patients transported. The volume difference between responses and patients carried is because more than one ambulance may be sent to an incident; for example, an ACP and PCP ambulance, as well as an emergency response unit, could be sent to the same incident, patients may refuse transport to hospital, or there may not be patients at an incident. Another factor which contributes to the volume variance is that there may be no available ambulances within an acceptable response distance from an event so the closest ambulance is sent, which may be
some distance away. Then, when a closer ambulance becomes available, the first ambulance is
cancelled and a closer ambulance is dispatched. Records then show that two ambulances responded to one incident. Ambulances which have been dispatched to a non-life threatening incident can be reassigned to a higher priority call thereby delaying a lower priority call. For example, we are aware of an incident when ambulances, originally dispatched to a non-life threatening call, were reassigned 9 times. That incident would register 9 responses but only one patient carried. The concept suggested by TFS is intended, in part, to reduce the number of responses by single PCP medical emergency response vehicles, BLS and ALS ambulances, due to multiple dispatches.
Some EMS systems utilize primary care paramedic responders as gatekeepers to assist in managing the allocation of other resources. In some situations, this role may be filled by a
primary care paramedic crew in a regular ambulance. They would make a clinical determination

Service Efficiency Review – Toronto Fire Services & Toronto EMS
Page | 114
whether an advanced care paramedic (ACP) is required. In other models, including Toronto and
many other Ontario systems, a single PCP may be sent as a sole responder in an emergency response unit to determine whether either a basic life support (BLS) or an advanced life support (ALS) ambulance is required. The Winnipeg Fire and Paramedic Service uses a variation on this role through assignment of a PCP, as part of a full fire response team and apparatus, to some events to determine whether an ambulance response is required.
A gatekeeping role to preserve ambulance response capacity presumes a relatively sophisticated level of knowledge and skill by the PCP practitioner. Such skills are normally achieved through training, medical oversight, and extensive clinical experience. While cancellation or deferral of an ambulance response due to no patient being found at a reported
incident is relatively easy and generally risk tolerant, the cancellation or deferral of an ambulance response based on a clinical assessment of patient need is a different matter. A high level of training and thorough knowledge and understanding of pathophysiology is required to safely cancel responding paramedics or to treat and release.
As already noted, the TFS does not require a PCP level of training, and instead, relies upon an appropriate, but less qualified level, similar to an emergency medical responder (EMR). In making a determination whether first responders trained at an EMR level can safely assess patients (to decide whether an ambulance response can be cancelled or deferred), the consulting team looked to other jurisdictions and literature to determine efficacy and safety, but there was no literature available supporting such a conclusion.
The consulting team has knowledge from an unpublished trial involving qualified fire first responders at the Surrey Fire Department in British Columbia, trained at a level equivalent to that of the TFS, and the BC Emergency and Health Services Commission. The goal of the study was to determine whether a fire department response – without a concurrent EMS response to some motor vehicle accidents, and firefighter determination as to whether an ambulance was in fact required – would be clinically safe. A corollary to this was the economic evaluation of what ambulance resources would be saved by this response model. The rationale for selecting motor vehicle accidents for this review was primarily the high rate of ambulance cancellation
on scene due to patient refusal of service.
The trial was discontinued from a patient safety perspective as the medical oversight responsible for evaluation of the study determined that firefighters trained at the first responder level, or the higher emergency medical responder level, did not possess the clinical interpretive skills required to consistently and safely determine that patient medical care was not required.
4.5.2 Training
Paramedicine is the practice of medicine and must be viewed as part of the entire health care system continuum. The care provided at the primary care and advanced care paramedic level is unquestionably a significant factor in the health, wellbeing, and survival of patients using the ambulance system. There is an extensive history outlining the development of training levels
and the professional certification required to be a paramedic.

Service Efficiency Review – Toronto Fire Services & Toronto EMS
Page | 115
Overview information received from the TFS outlines that firefighting staff are trained to the
equivalent of the EMR level through an in-house training process. Medical oversight of the training is provided under contract by Dr. Michael Feldman, the base hospital physician assigned to the TFS. Dr. Noah Forman is also under contract with TFS and primarily deals with Occupational Safety and Health (OSH), but liaises with the base hospital.
In descriptive terms, firefighters are trained in first aid procedures, cardiopulmonary resuscitation, use of an automated external defibrillator, and assisting patients to take their own medications. Use of an EpiPen® auto-injector to treat anaphylaxis (severe allergic reactions) was added to their skill set in 2012. An overall descriptive comparison of emergency medical responder training with the PCP and ACP training can be seen in Exhibit 9.
Exhibit 9 - Skills and Knowledge Guide for Pre-hospital Skills in Ontario
Basic firefighter recruit training is achieved over a 9 week period. Within those 9 weeks, a 2-week classroom component involving in-house training based on the emergency medical responder curriculum, and other needs as determined by the involved physicians, is provided.
In addition, recruits complete a 1-week, online, self-directed, computer-based emergency

Service Efficiency Review – Toronto Fire Services & Toronto EMS
Page | 116
medical responder training module. New recruits therefore receive a total of approximately 120
hours of EMR training.
Further module training in EMR activities was described as being two, 4-hour classroom sessions plus two, 1-hour online self-directed sessions annually. This represents a total maintenance requirement of around 10 hours per year for emergency medical responder training.
4.5.3 Accredited EMR Training Programs
The National Occupational Competency Profiles (NOCPs) for responders25 outlines EMR training as the entry level of recognized training for pre-hospital care. The NOCPs were developed
through a Human Resources and Development Canada grant as a joint project between the Paramedic Association of Canada and the Canadian Medical Association (CMA). Accreditation of training and education programs meeting the criteria is performed through the Conjoint Accreditation Services26. There are currently 68 institutions across Canada accredited to provide paramedic training at the four levels (Emergency Medical Responder; Primary Care Paramedic; Advanced Care Paramedic; and Critical Care Paramedic or CCP). While there are no Ontario institutions listed by the Conjoint Accreditation Services as being currently accredited for EMR training27, some unaccredited training programs such as the Advanced Rescue Consulting28 4-week course, the First Responder Ontario29 3-week course, and the 15-day Emergency Services Academy30 course are available.
The validity of an accredited training program for paramedic practice has been supported through the Coalition of Paramedic Regulators (COPR)31 in the national development of interprovincial mobility and recognition of educational practice established to facilitate the Trade and Industry Labour Mobility Act (TILMA).
Firefighters, EMR Training, and Eligibility to Practice as a Paramedic
Dr. Michael Feldman, Medical Director, EMS Special Operations/Firefighter Emergency Patient Care Program at Sunnybrook Centre for Pre-hospital Medicine, indicates that TFS medical training was originally based on and now exceeds the Ontario Fire Marshal Emergency Patient
Care II standard. He also states that Toronto firefighter medical training meets or exceeds the following standards:
Ontario Fire Marshal’s Emergency Patient Care II standard
25 National Occupational Competency Profile for Paramedic Practitioners http://www.cepcp.ca/main/paramedic/ems/NOCP.pdf 26 Canadian Medical Association Conjoint Accreditation Program http://www.cma.ca/learning/conjointaccreditation 27 http://www.cma.ca/index.php?ci_id=50602&la_id=1#PARA-ON 28 http://www.arcrescue.com/fr.htm#mfr 29 http://www.froems.com/training.html 30 http://www.esacanada.com/programs_responder.php 31 Coalition of Paramedic Regulators (COPR) http://www.copr.ca/

Service Efficiency Review – Toronto Fire Services & Toronto EMS
Page | 117
The Paramedic Association of Canada National Occupational Competency Profile for
Emergency Medical Responders
The Ontario Ministry of Health and Long-Term Care Emergency Health Services Branch "Basic Life Support Standards"
Dr. Feldman notes that the program “is not recognized by an external certifying agency per se, but our base hospital is part of the team that sets the standards for Ontario. There is no available accreditation for firefighter medical training at our level, and we have intentionally not accepted the lower standards offered by other programs. The certification of our program is therefore by the Medical Council of the Sunnybrook Centre for Pre-hospital Medicine. The training (and associated quality assurance process) is mandatory for defibrillation and
administration of epinephrine.”
Firefighters and Eligibility to Practice as a Paramedic
Even though many of Toronto’s firefighters achieve a level of qualification as described by Dr. Feldman, and training for epinephrine administration and defibrillation is mandatory for all firefighters, the training does not provide eligibility to practice or work in a patient care capacity in a land ambulance service in the Province of Ontario. This means that in order for a firefighter to be qualified to perform patient care as part of a land ambulance service, upgrading or conversion of staff would be required.
The TFS Chief advised the consulting team that around 100 firefighters are trained at the
emergency medical care assistant (EMCA) level but we were not able to determine the number that are qualified at the Advanced EMCA level32, which is the essential prerequisite for employment in Ontario as a primary care paramedic. For the purpose of this analysis we have assumed that all of these EMCA-trained firefighters are qualified at the advanced level.
In documents provided to the consulting team, the TFS noted there are normally 128 pieces of fire apparatus at 82 stations available for deployment each day. To ensure that one firefighter paramedic is available for response from each station would require 411 firefighter paramedics including a contingency for absence replacement (please see Table 12 and Table 13).
Table 12 – Annual Firefighter Paramedic Hours Required
Number of Fire Stations
Number of Firefighter Paramedics (FFP) per Station
Hours per Day
Days per Year
Total FFP Hours Annually
82 1 24 365 718,320
Table 13 - Total Firefighter Paramedic Complement Required
Annual Hours of Work per FFP 2184
FFP required to staff stations (718,320 ÷ 2184) 329
32 Successful graduation from a certified ambulance program at a college of applied arts and technology provides a diploma in Paramedicine and eligibility to write the provincial Advanced Emergency Medical Care Assistant (AEMCA) exams. Successful completion of the provincial certification exam qualifies a candidate as an Advanced Emergency Medical Care Attendant and then eligible to be trained and certified by a designated Base Hospital to practice as a Primary Care Paramedic

Service Efficiency Review – Toronto Fire Services & Toronto EMS
Page | 118
Absence contingency for vacation, Illness, etc. (25% of 329) 82
Total FFP required (329 + 82) 411
The training program for primary care paramedics generally includes a two year or four semester academic stream at an Ontario accredited primary care paramedic training program. Candidates must complete the academic training program and then succeed in the provincial Advanced Emergency Medical Care Assistant (AEMCA) examination and certification process. Once provincially certified as an AEMCA, the paramedic then must successfully complete specialized base hospital training and skills certification before actually practicing as a primary care paramedic. Moving sufficient firefighters forward to achieve a goal of having a primary care paramedic in every station would require significant time and costs. In addition to tuition
and travel costs, the cost of wages, process development, and management costs would be considerable.
The Collective Agreement between the Toronto Professional Fire Fighters Association (TPFFA) Local 3888 and the City of Toronto, Article 51.01, states:
"Should the TFS require certificates of qualification in addition to what is presently required for the current positions coming within the 3888 Unit, the cost of such certification shall be borne by the City."
We have calculated the average annual cost of a firefighter (based on information supplied by TFS) to be $107,896 including salary, benefits, uniforms, dry cleaning, and other employment
costs. Tuition and other related costs for the 2-year paramedic program are estimated at approximately $15,000 per student33.
Therefore, the estimate to train 411 firefighters to the PCP level would be approximately $6.16 million for tuition, books, and other requirements, plus a direct replacement wage cost of $67.11 million (411 complement, minus 100 [current trained EMCA complement] multiplied by $107,896). This calculation assumes a 100 percent success rate in both the program and the provincial certification examination, which has not been the actual experience. Prudence would suggest at least a 10 percent remediation rate, further increasing the cost.
There are ways to mitigate this cost, of course.
It may be possible to negotiate a reduced student rate with one of the accredited
primary care paramedic training programs
It may be possible to hire primary care paramedics and train them as fire fighters as attrition occurs in the existing TFS ranks. However, at the expected rate of attrition this option could take up to 5 years to achieve. This also assumes that TFS complement levels stay at the current rate or the process could take several more years
The estimated 100 EMCAs currently employed by TFS may already be certified which might reduce the costs of training or the duration of the tuition option
33 Humber College example: http://www.humber.ca/program/paramedic

Service Efficiency Review – Toronto Fire Services & Toronto EMS
Page | 119
The Toronto Professional Fire Fighters' Association may be willing to negotiate a form of
reduced compensation to a firefighter paramedic configuration.
In any event, our estimation (unless there is an arrangement to mitigate the cost), is either $73.29 ($67.13 + $6.16) million to train sufficient firefighters to the Advanced EMCA level – probably over a period of 2.5 to 3 years – or a lower but, as yet, unknown cost while attrition allows TFS to hire qualified AEMCAs.
In any event, accomplishing an objective of ensuring a qualified primary care paramedic is available at each fire station, at all times, in order to achieve a firefighter paramedic model of ambulance service delivery is expected to be an expensive and lengthy undertaking.
4.5.4 Advanced Care Paramedic (Advanced Life Support) Firefighter Medical Efficacy
There are some jurisdictions, notably in the United States, where advanced care paramedics are deployed on fire apparatus. One of the considerations in evaluating the potential to move forward with sufficient firefighters at the advanced care level – aside from the skills retention and training capacity issues, and assuming success in the training program – is that significant further expense would be incurred. Tuition for an accredited advanced care paramedic program is much higher, generally ranging at around $35,000 per candidate, as a result of the more intense clinical exposure and related costs. A further full year of training, including supervised clinical placement, is required. Finally, ambulance service knowledge, based on the development of advanced care paramedic capacity, indicates that experience as a primary care
paramedic, as well as suitability for the advanced training, is essential. Not all primary care paramedics are either capable or successful in advanced care paramedic training.
4.5.5 Cultural Differences between Paramedics and Firefighters
The consulting team sees a number of challenges to be overcome, including a cultural divide, should there be a desire to provide firefighter advanced life support. The cultural issue, seen by most EMS physicians and operations experts, was also voiced by the TEMS Base Hospital, physicians and the TFS’ physicians. Advanced life support decision-making and scene management require independence and an ability to tailor care to changing environments. Fire
service culture is more paramilitary, both a necessity and a virtue in that work environment. People who successfully pursue a career in emergency medical services may not be well suited
from a personality standpoint to be successful in a fire service role, and vice versa. This cultural phenomenon is observed in the nursing profession and other areas of healthcare. Different personality types choose different medical specialties: cardiology versus dermatology versus emergency medicine. Cultural differences were stated to be a primary challenge within the consolidation of fire and emergency medical services in Winnipeg.
4.5.6 Challenge of Maintaining Skills
Another challenge to Advanced Life Support (ALS) staffing on fire apparatus involves skills maintenance and maintenance of competency. Current research shows that skill maintenance and competency can be negatively affected in an all advanced life support ambulance system
where practitioners are not regularly utilizing their skills and knowledge. The consulting team

Service Efficiency Review – Toronto Fire Services & Toronto EMS
Page | 120
believes these same challenges would be exacerbated in an advanced life support fire
apparatus response system.
Because most patients calling 911 do not have an immediately life-threatening problem, an advanced life support paramedic in an all ALS system (ALS on every ambulance) will see low acuity patients more often than not, and the small proportion of patients with immediate life threatening problems will be dispersed among many. Hence advanced life support paramedics will not complete difficult procedures on a regular basis and will have difficulty maintaining skills. Skills maintenance then has to be confirmed in clinical laboratory sessions, classroom exposures, and even in hospital operating rooms. While this is possible, it is expensive and does not make up for the experience gained in real time situations.
The TFS arrives at Echo and Delta events before TEMS 67 percent of the time (although EMS reaches the scene within 2 minutes of the fire service in just over 60% of the cases when fire arrives first). Considering this small window between the arrival of the fire and emergency medical services, the opportunity for an advanced care paramedic on a pumper to assess, treat, and perform procedures will be rare (please see Chart 13 - Fire - EMS Arrival). Skills maintenance generally requires such things as at least one intubation every 3 months and other continuing medical education exercises requiring rotation through hospital operating rooms. According to Dr. Rick Verbeek, anesthesiologists are charging increasing amounts to have paramedics in the operating room. In the British Columbia experience, and in many other jurisdictions, there is a similar issue of saturation, where it is becoming difficult to
accommodate paramedics in operating rooms along with medical students and anesthesiology residents. While we have not specifically canvassed training facility capacity, we believe that adding firefighters or more paramedics may not be logistically possible in the system.
Chart 13 - Fire - EMS Arrival
4.5.7 Women as ALS Providers on Fire Apparatus
0%
10%
20%
30%
40%
50%
60%
70%
80%
90%
Echo Delta Echo & Delta
EMS Arrives Before TFS
EMS≤ 1 minute of TFS
EMS≤ 2 minutes of TFS

Service Efficiency Review – Toronto Fire Services & Toronto EMS
Page | 121
Opportunities for women in EMS have improved steadily over time and women now make up
30 to 40 percent of the ambulance system workforce. Women are regularly found in both junior and senior managerial roles. While opportunities for women in fire services do exist, they are not as well established or defined. The consulting team believes that any initiative to shift paramedic responsibilities to a fire based model would need to include strategies from a gender and equity perspective to ensure a comprehensive balance is sustained at the outset.
4.6 Goal of a first responder system
An important question for Toronto to ask is, what is the objective of placing a primary care
paramedic or advanced care paramedic on fire apparatus? The original intention of the first responder system was for TFS to provide needed time-critical interventions for the few additional minutes that it might take TEMS to arrive. It is an appropriate supplement to EMS response of time-critical emergencies.
There are a few time-critical medical emergencies that require intervention within minutes, such as
cardiac arrest,
anaphylaxis (severe allergic reactions),
respiratory failure,
tension pneumothorax, and
airway obstruction
First responder occupational competency profiles were designed to address those time-critical incidents that are reasonably recognized and treated with the minimal training available at this level.
The TFS already has the tools to deal with these problems – for example CPR and automatic external defibrillators for cardiac arrest, and bag and mask ventilation for respiratory failure, and recently, Epi-pens for the treatment of anaphylaxis was added to the TFS capability. The
other time-critical problems are more complex: tension pneumothorax is the collapse of a lung under tension. It is not a common occurrence; documented 18 times in the past year according to TEMS data (personal communication, Dr. Karen Wanger with Dr. Rick Verbeek). Tension pneumothorax is difficult to recognize and decompression is a skill with potentially significant complications making it an advanced life support level maneuver. Airway obstruction is similarly uncommon and requires ALS level training and experience with laryngoscope and Magill forceps to resolve. Therefore, the TFS already has the skills to intervene in the majority of time-critical events when they arrive first.
Other time urgent problems requiring advanced life support care (chest pain, respiratory distress, stroke, and shock states) are not critical over an additional 2- to 5-minute span while
waiting for EMS. During that interval, fire first responders apply oxygen as required, organize the scene, and gather vital sign and medication information. These efforts improve the

Service Efficiency Review – Toronto Fire Services & Toronto EMS
Page | 122
efficiency of the EMS crew at their arrival. There is little advantage for the expense of training
firefighters to a higher level. Most respondents we interviewed (not paramedics), said the money would be better spent improving EMS response times and improving TFS response times to the calls they currently attend.
4.6.1 Shift Patterns
The shifting of medical responsibility, particularly at a higher and more intense clinical level, requires an understanding of the effect of extended work hours on clinical competency and safety.
The Toronto Professional Firefighters' Association, in an extensive document outlining their
position on extended shifts, maintained that it is preferable to schedule work on a 24-hour shift model, where firefighters work a continuous 24-hour period with allowance and provisions for rest during the shift34. Based upon a negotiations mandate, this schedule supplanted the previously negotiated 10/14 two-shift a day approach, which is outlined in their collective agreement. Operational staffing for TFS is best described as a flat staffing model, with exactly the same number of apparatus normally scheduled around the clock.
Toronto firefighters work approximately 91, 24-hour days, or 2,184 hours of service availability per year. Although the 24-hour shift model ensures maximal fire response capacity to events at all times of the day, it does not facilitate peak hour staffing changes, with reductions in planned staffing complement over the predictable slow time periods of the day. Further, a 24-hour-shift
model assumes adequate time for rest during the shift, a reality that is not provided for in a high performance, dynamic deployment, EMS system such as that operated by TEMS.
This model of staffing, and the actual shift duration, is distinct from the TEMS. The TEMS call volume has peaks and valleys in a relatively predictable manner and provides the ability to shift resources to the time periods in which they are needed. For example, planned peak daytime staffing is 84 units, and the lowest planned nighttime staffing is between 02:00 and 06:00 when 42 units are staffed. Currently, TEMS operational staffing is primarily based on 12 hour shifts, with staggered start and end times to maintain continuity and peak load capacity.
Historically, fire services stand ready for maximal response at any time of the day. This means that there are periods when fire service capacity is available and ready, rather than in use. The
culture and history around fire services includes the provision of sleeping quarters (bedrooms), rules, and regulations around use of them, and expectations with respect to the ability to rest during a portion of the shift. This approach is of course distinct from the emergency medical services culture and the operations of the TEMS.
Shift Models Can Influence Patient Care
Shift models can influence patient care. Can a paramedic working on the fire schedule provide consistent and high-quality patient care at any point during their shift? The International
34 Response to City Ergonomics Department, report on the 24 hour shift: TPFFA, undated.

Service Efficiency Review – Toronto Fire Services & Toronto EMS
Page | 123
Association of Fire Chiefs (IAFC)35 takes a potentially differing view on the issue of shift duration
in identifying that:
"...highly publicized fatigue-related adverse events have necessitated reform. The authors congratulate the organizations funding this work for anticipating the continued need to juxtapose the work demands and job structures of firefighters and EMS responders and the excellence in performance that typifies those professions. We believe that as the poet said, limits in human abilities must be acknowledged, and adjusting to dynamic work influences is critical for continuing to exceed existing high performance standards, while maintaining the health and wellbeing of firefighters and EMS responders."
The current TFS 24-hour shift pattern may provide a schedule satisfactory for labor relations for
the TPFFA and the City. However, it is not a suitable schedule from which paramedics can practice safe patient care. Research is increasingly demonstrating that where paramedics and health care workers are working long hours and receive insufficient rest, they make clinical errors. These are preventable clinical errors that can influence patient morbidity and mortality.
In clearly concluding that the shifts of health care workers need to be managed and reduced, Lockley et al. stated in their recent report36 that:
"The weight of evidence strongly suggests that extended-duration work shifts significantly increase fatigue and impair performance and safety. From the standpoint of both providers and patients, the hours routinely worked by health care providers in the United States are unsafe. To
reduce the unacceptably high rate of preventable fatigue-related medical error and injuries among health care workers, the United States must establish and enforce safe work-hour limits.”
In a frightening sample summarizing the effect of a 24-hour shift on medical interns as health care providers, the researchers describe that:
"(interns)....working traditional schedules with recurrent 24-hour shifts:
Make 36 percent more serious medical errors than those whose scheduled work is limited to 16 consecutive hours
Make five times as many serious diagnostic errors
Have twice as many on-the-job attentional failures
Suffer 61 percent more needlestick and other sharp injuries after their 20th consecutive hour of work
Double their risk of a motor vehicle crash when driving home after 24 hours of
work
Experience a 1.5 to 2 standard deviation (S.D.) deterioration in performance relative to baseline rested performance on both clinical and nonclinical tasks
35 International Association of Fire Chiefs: The Effects of Sleep Deprivation on Firefighters and EMS Responders, June 2007. 36 Effects of Health Care Provider Work Hours and Sleep Deprivation on Safety and Performance. Steven W. Lockley, PhD et al., The Joint Commission Journal on Quality and Patient Safety. Nov 2007. Vol 33 Number 11 Supplement

Service Efficiency Review – Toronto Fire Services & Toronto EMS
Page | 124
Suffer decrements in performance commensurate with those induced by a blood
alcohol level of 0.05 to 0.10 percent"
Translating this to the EMS world, Patterson et al.37 provided similar conclusions regarding risk of medical error, harm, injury, and safety for paramedics in stating that:
"After controlling for confounding, we identified 1.9 greater odds of injury (95 percent CI 1.1, 3.3), 2.2 greater odds of medical error or AE (95 percent CI 1.4, 3.3), and 3.6 greater odds of safety-compromising behavior (95 percent CI 1.5, 8.3) among fatigued respondents versus non-fatigued respondents. One of the key causative factors identified in this research was EMS workers working 24-hour shifts."
Finally, Patterson et al.38 provide similar findings in their review of EMS workers, with clear linkage between the issue of fatigue and working extended shift hours.
"Shift length is likely related to fatigue, with longer EMS shifts potentially impairing certain aspects of job performance. 33 Individuals who stay awake for 19 or 24 hours show impairment on a simple reaction time test similar to research subjects with blood alcohol concentrations of 0.05 percent and 0.10 percent, respectively."
Shift Models and Performance
The consulting team is not aware of ambulance service providers in major metropolitan centers across Canada and the U.S. (with some fire-based exceptions in the U.S.) with a 24-hour shift
pattern. The consulting team cannot support such a pattern for a clinical patient care provider. While the practice is already existent at the primary first responder level for the TFS, the consulting team believes the risk, based on evidence, of 24-hour shifts is too clear at the higher qualification levels where paramedics have clinical decision making and focused, precise, clinical care responsibility.
Considering that shift overruns due to patient care are not infrequent in Emergency Medical Services the consulting team will not support a paramedic shift model that exceeds 12 hours duration, rather than 16 hours as noted earlier.
This concern influences the provision and integration of paramedic responders within the TFS
response team. An agreement with the TPFFA would need to be achieved if the idea of firefighter paramedics is entertained. The agreement would have to outline that either the scheduling provisions for TFS operations be reverted to maximum 12-hour shift staffing, or alternatively, that medical responders working as part of TFS be on a different staffing and delivery pattern than responders that do not have an advanced clinical practice role. Acting upon this concern could have a financial impact on the TFS operations, potentially requiring an
37 Association Between Poor Sleep, Fatigue, and Safety Outcomes in Emergency Medical Services Providers. P Daniel Patterson, PhD. et al., Pre-hospital Emergency Care. 2012;16:86–97. 38 Sleep Quality and Fatigue Among Pre-hospital Providers. P Daniel Patterson, PhD, MPH, et al. Pre-hospital Emergency Care, April/June 2010. Volume 14, Number 2.

Service Efficiency Review – Toronto Fire Services & Toronto EMS
Page | 125
increase in operational firefighting staff to support an appropriate work pattern. Whether it has
an impact in the form of increased staffing or not, the effect of having staff with 12 and 24 hour shift patterns staffing a single pumper will cause operational inefficiencies within the fire services. For example, overtime is likely to increase and, in some cases, an incoming paramedic firefighter may not have an apparatus to staff if the pumper is out of the station at shift change.

Service Efficiency Review – Toronto Fire Services & Toronto EMS
Page | 126
4.6.2 Fire Response Volumes to Medical Events
At the outset of this project, the data provided by the TFS indicated that, in 2011, it responded to 84,710 medical events. The frequency of medical responses had increased by about 19 percent over the 7-year period starting in 2005. This represents fire response to approximately 24% of all EMS events and 44% of patients transported by EMS.
In June of 2012, based on research and recommendations from base hospital physicians and an authoritative panel, and incorporating both TEMS and TFS medical oversight, the City implemented a change to protocols which reduced the annual number of fire responses to medical events to approximately 50,000 while maintaining an appropriate clinical service delivery model. First responders are now being assigned to events where there is a 1 percent or
more expectation of first responder intervention having the possibility of a more positive patient outcome.
If, in a paramedic firefighter model, the fire service responded to most medical calls (there were 254,514 unique medical incidents in 2011), the TFS response volume would increase by more than 200,000 medical responses per year from current. The impact of this increase on the TFS staff’s ability to rest within a 24-hour shift would be significant. Further, equipment and operating costs for the TFS fire apparatus (currently approximately $4.98 per kilometer), would potentially rise steeply.
Alternatively, to avoid responding to such a high volume of incidents even in a paramedic
firefighter response model, TFS could continue the existing practice of responding to only those calls where there is a 1 percent or more expectation of first responder intervention having the possibility of a more positive patient outcome. However, the disadvantage of that response model is the impact on skills maintenance for a firefighter paramedic insofar as there would be approximately 84 firefighter paramedics on duty at any time responding to a total of 50,000 incidents annually or an average of 136 a day. There would be some days when individual firefighter paramedics would encounter only one or two patients - or possibly none – and there will be many times when patients will not require an intervention of the nature that would allow firefighter paramedics to practice and maintain skills. In the model discussed here, skills
maintenance would be a challenge not only for firefighter paramedics, but it might reduce the
opportunity for EMS paramedics to practice and maintain their skills since there would be more paramedics on the road resulting in staff saturation.
If all or most fire apparatus are staffed by a firefighter paramedic, then perhaps – as in Winnipeg – only fire apparatus may need to be sent to some calls. However, the decision as to which calls require a firefighter paramedic, but not an ambulance, pending assessment by a firefighter paramedic, would have to be based on base hospital physician input.
For response to high acuity calls, where the skills of the responding paramedic may be required, research would be required to determine which calls are clinically safe to send only a single responder (no backup). If a backup is required (as in about 75 percent of the cases), the backup is delayed unless it is dispatched at the outset of the call. For example, motor vehicle accidents
may or may not have a patient, and a patient may or may not be critical. Yet a delayed response to a motor vehicle accident can delay needed and appropriate high-level clinical care and

Service Efficiency Review – Toronto Fire Services & Toronto EMS
Page | 127
transportation. Severe trauma is one of the actual clinical indicators that empirical research
almost uniformly reports as benefitting from shorter times to definitive care. Delaying ambulance response to these patients speculatively would be equivalent to delaying ambulance transport times.
We must keep in mind that one of the considerations for the implementation of firefighter paramedics is to reduce call volume pressure on emergency medical services possibly by firefighter paramedics attending some incidents and then deciding whether an ambulance is needed rather than dispatching one immediately. Ministry of Health and Long Term Care concurrence would be required as, presently, there is no option for the emergency medical services dispatch centre to not send an ambulance to a service request. In fact, legislation
requires that an ambulance be sent to every request. Therefore, it is likely that legislative change would have to be put in place in order to delay ambulance dispatch, in some cases, until firefighter paramedics make a decision that transportation is required.
There is no evidence that, within existing legislation, there will be an impact in the form of reduced ambulance responses because of the implementation of paramedics on fire trucks. Therefore, we are not able to find an advantage in this regard by utilizing firefighter paramedics.
Decision-making by a paramedic in regards to the need for ambulance clinical treatment/transportation includes a high risk factor, and such decision-making requires extensive medical oversight. Some systems send single paramedics to low acuity events to
determine if there is a need for other treatment (or referral other than hospital transport). Essentially, this is the model that the TEMS is attempting to put into place as part of their community paramedicine approach. The paradox of this approach is that the ambulance responses best served by this model are the low acuity calls—calls to which the TFS do not respond.
Typically, systems implementing low acuity response models, such as the expanded care paramedic model used in the UK, use higher trained paramedics (the equivalent of an advanced care paramedic with additional training). From a clinical perspective, this creates less risk of
adverse outcomes. Further, low acuity response models generally use a single responder in a
low acuity response vehicle, not a full fire response crew with a major piece of equipment. In low acuity calls, less is better. So the primary care paramedic, as part of the fire crew, is likely not the best utilization of resources on low acuity calls. A firefighter paramedic response model does not present any advantage to mitigation programs such as community paramedicine.
The model that Toronto uses today includes a fire first responder, trained to an acceptable level to provide immediate, short-term interventions as part of a continuum of care, supported by higher trained paramedics and appropriate transport units.
4.6.3 Considerations and Conclusions
Certainly, Toronto has a robust, system-leading ambulance service unlike the history of some
locations in the United States; it does not have several ambulance services as there were in

Service Efficiency Review – Toronto Fire Services & Toronto EMS
Page | 128
Winnipeg; and Toronto does not have an ambulance service with available time to fight fires as
in Philadelphia or some parts of Alberta.
So the key questions are:
1. What Toronto-centric operational reasons are there for adopting one of the firefighting paramedic models?
2. Will a combined fire – EMS patient care delivery model be beneficial to citizens of the City of Toronto, and why?
There are two possible primary consolidation models:
1. Consolidate the fire – EMS system; and
2. The implementation of paramedics on fire trucks to alleviate pressure on the EMS system.
Considering that:
There are factors that must be taken into account with respect to legislation and response vehicles that will require negotiation with the Ministry of Health and Long Term Care.
A gatekeeping role to preserve ambulance response capacity presumes a relatively sophisticated level of knowledge and skill by the primary care practitioner. Such skills are normally achieved through training, medical oversight, and extensive clinical
experience.
To train 411 firefighters to the PCP level would cost approximately $6.16 million for
tuition, books, and other requirements, plus a direct wage cost of $67.13 million.
Cultural differences were stated to be a primary challenge within the consolidation of fire and emergency medical services in Winnipeg.
Skills maintenance will be a challenge due to the added number of EMS practitioners
within the fire service. Skills will have to be honed in a hospital setting adding additional training and staff replacement costs.
Opportunities for women in fire services are not as well established or defined as in EMS. Any initiative to shift paramedic responsibilities to a fire based model would need to include strategies from a gender and equity perspective to ensure a comprehensive balance is sustained at the outset.
The TFS arrives at Echo and Delta events before TEMS 67% of the time but TEMS reaches the scene within 2 minutes of the fire service in just over 60% of the cases when fire arrives first.
The original intention of the first responder system was for TFS to provide needed time-
critical interventions for the few additional minutes that it might take TEMS to arrive. It
is an appropriate supplement, not a substitute, to TEMS response on time-critical emergencies.

Service Efficiency Review – Toronto Fire Services & Toronto EMS
Page | 129
The TFS already has the tools and training to deal with the comparatively few time-
critical medical emergencies that require intervention within minutes until paramedics can arrive.
Most respondents we interviewed (not paramedics), said the money would be better spent improving EMS response times and improving TFS response times to the calls they currently attend.
Firefighters work a 24 hour shift pattern. There is ample evidence that shifts in excess of
16 hours – likely less – are detrimental to patient treatment as well as practitioners.
There is no evidence that, within existing legislation, there will be an impact in the form
of reduced ambulance responses because of the implementation of paramedics on fire trucks. Therefore, there is no advantage in this regard by utilizing firefighter paramedics.
The firefighter paramedic response model does not present any advantage to mitigation
programs such as community paramedicine.
Our review has led to the following conclusions:
There is no advantage to a firefighter paramedic service delivery model in Toronto. Startup costs are significant and maintenance of skills will present a significant challenge.
The implementation of paramedics within the fire service, whether as part of an integration of TFS and TEMS or the continuation of the two entities would require extensive review of operating parameters. Toronto leadership and the MOHLTC would have to discuss the applicability of the Ambulance Act and other regulations to a firefighter paramedic response model.
System modification to train firefighters as paramedics in order to place a paramedic on
one apparatus per station would require an expenditure of greater than ($6.16 + $67.13) = $73 million or more. Alternatively, hiring paramedics, upon attrition in the firefighter ranks, and training them as firefighters, would take approximately 5 years or more to achieve.
System modification to place a paramedic on every, or most, responding fire apparatus would likely not result in improved clinical outcomes.
System modification to place a paramedic on every, or most, responding fire apparatus
would require those personnel to be scheduled in a clinically acceptable, supportable, and safe shift pattern (not 24 hour shifts), which could increase the cost of TFS operations.
The existing responder training level for TFS personnel is clinically appropriate for immediate response to most medical or traumatic injuries, when responders are appropriately trained and qualified paramedics follow closely.

Service Efficiency Review – Toronto Fire Services & Toronto EMS
Page | 130
Based on the evidence of other major cities as well as our analysis of Toronto, there is
no benefit to a firefighter paramedic model in Toronto – in fact there are several disadvantages.
We also recognize that the idea of firefighter paramedics has been a subject of much debate in Toronto and North America. In Toronto, at least, this examination should conclude the debate.
4.6.4 Recommendation
Do not consider implementing a firefighter-paramedic model of pre-hospital emergency
medical care in either an organizationally consolidated entity or in the existing separate
organizational design.
4.7 Organizational Analyses of TFS and TEMS
This section of the report provides
a) An organizational design assessment of the TFS and TEMS, and
b) The potential for consolidation of the TFS and TEMS from a design perspective.
The section is divided into five parts:
Approach to conducting organizational assessments
Framework for evaluating organizational alternatives
Organizational alternatives for the emergency medical services
Organizational alternatives for the fire services, and
Potential consolidation of the fire services and emergency medical services
4.7.1 Overall Approach to Conducting Organizational Assessments
Organizational Analysis is More Art than Science
Determining an organizational structure that is objectively best for an entity is generally not possible. Knowledgeable leaders and even experts may disagree about the virtues of different structures. Within the range of reasonable alternatives, some observers might prefer one alternative while others might prefer another.
In addition, the structure that will work best for an organization depends on its people, management systems, culture, and priorities. For example, an organizational structure that is theoretically sound will not serve an organization well unless the existing staff has the capabilities to implement the structure39. Available management systems also affect what
39 Of course, if the structure is sound, an organization might work to develop the staff capabilities needed to support the structure and implement the structure over time.

Service Efficiency Review – Toronto Fire Services & Toronto EMS
Page | 131
organizational structures are practical. In general, more effective information and
communications systems are needed to implement a decentralized structure than to implement a more centralized structure. Moreover, the culture of an organization influences organizational features that should be emphasized. While an organization with a strong culture of accountability may not need a structure that facilitates accountability, other organizations may need organizational structures to enhance accountability and performance. Organizational priorities—which may change over time—also influence the types of structures that will work best for an organization.
The management style and capabilities of key leaders also influence the type of structure that should be implemented. No matter how capable, all managers have strengths and weaknesses.
An effective structure leverages managerial strengths and compensates for short-comings.
Organizational Analysis Should Explicitly Consider Tradeoffs in Organizational Alternatives
The art of organizational design centers on making tradeoffs. An organizational structure designed to help an organization achieve one set of objectives and priorities may be ill suited to support efforts to achieve different objectives. Hence, effectively evaluating organizational alternatives requires making these tradeoffs explicit. To the extent possible, tradeoffs implicit in an entity’s organizational structure should reflect the organization’s needs and priorities.
The Systematic Approach Taken to Develop and Evaluate Organizational Alternatives
Our general approach to developing recommended organizational structures for each department has seven steps:
1. Identify purposes of organizational structures used to evaluate organizational alternatives
2. Weight the relative value of each organizational purpose
3. Develop alternative structures using structural paradigms
4. Use an organizational purposes framework to evaluate each alternative
5. Develop an organizational alternative that combines the best features of the most promising alternatives
6. Assess the viability of this alternative given each department’s people, systems, and culture
7. Use the evaluation framework to confirm benefits of the recommended structure
Taking this approach has a number of advantages:
A systematic approach is taken to assess the relative merits of alternative organizational structures
Evaluation criteria are weighted to reflect the city of Toronto’s priorities
The best features of the paradigmatic organizational structures are combined to develop the recommended structure

Service Efficiency Review – Toronto Fire Services & Toronto EMS
Page | 132
The recommended structure is assessed in terms of its viability; this ensures that a theoretically sound organizational structure, which may not be operationally or otherwise practical, will not be recommended.
4.7.2 Evaluation Framework
The framework that was used to evaluate organizational alternatives was developed in two steps. First, core purposes of organizational structure were identified. Next, each core purpose was weighted to reflect its relative importance to the city of Toronto.
Core Purposes of Organizational Structure
Sixteen core purposes of organizational structure were identified:
Oversight: Oversee the work of subordinates and work to ensure unit objectives are
met;
Accountability: Facilitate efforts to hold individuals accountable for achieving organizational objectives;
Decision-making and authority: Clarify the individuals who are responsible for making key decisions, and assign to them, the authority needed to make, and as necessary, enforce decisions;
Expertise and judgment: Allow the organization to benefit from the expertise and
judgment of key personnel;
Internal communications: Provide a vehicle through which information is communicated from one part of the organization to another;
External communications: Facilitate efforts to communicate effectively with external
stakeholders;
Coaching/support: Provide mechanisms for ensuring individuals have the support they need to effectively achieve organizational objectives;
Flexibility: Support efforts to respond effectively to emerging needs and to proactively address issues;
Sustainability in addressing long-term objectives: Facilitate efforts to take a consistent
approach to addressing long-term objectives;
Values: Highlight functions that are consistent with and communicate organizational values to both internal and external stakeholders;
Capabilities: Ensure that the capabilities crucial to organizational success (for example,
understanding citizen needs or establishing effective performance management systems) are available;
Service: Facilitate efforts to provide high-quality services that are tailored to resident
needs;

Service Efficiency Review – Toronto Fire Services & Toronto EMS
Page | 133
Organizational structure costs: Minimize the structure’s costs;
Operational cost-effectiveness: Support efforts to make efficient use of resources throughout the organization and to leverage synergies among similar functions;
Employee development: Create opportunities to engage employees (allowing them to
develop needed capabilities) and support succession planning;
Reduce risks and liabilities: Provide checks and balances and other features that reduce the organization’s risks and liabilities.
Weighting of Core Organizational Purposes
Each organizational purpose was weighted to reflect its relative priority to the City of Toronto (based on the consultants’ understanding of these priorities). The relative priority for each purpose was weighted so that the sum of the weights for all purposes equaled 1 (see Error!
eference source not found.).
Table 14 - Weight Given to Each Organizational Purpose
Organizational Purpose Weighting
Accountability 0.105
Operational cost-effectiveness 0.105
Service 0.105
Flexibility 0.093
Sustainability 0.093
Capabilities 0.075
Decision-making and authority 0.063
Organizational structure costs 0.063
Oversight 0.063
Expertise and judgment 0.050
External communications 0.040
Internal communications 0.040
Values 0.030
Coaching/support 0.025
Employee development 0.025
Reduce risks and liabilities 0.025
Total all purposes 1.000
Evaluation Framework
To evaluate organizational alternatives each potential structure is rated on a 5-point scale where a rating of 1 means the structure does “not at all” support the organizational purpose and a rating of 5 means the structure “fully supports” the organizational purpose. Multiplying
the weighting for each organizational purpose by the rating for each purpose and then

Service Efficiency Review – Toronto Fire Services & Toronto EMS
Page | 134
summing them over all organizational purposes results in a single evaluation score that can be
used to assess the relative merits of alternative structures.
For the intents of this analysis, the current structure is rated a 3 for each organizational purpose (and therefore has an overall evaluation score of 3.0 after the weighted scores for each organizational purpose is summed). The ratings for each organizational purpose for each organizational alternative presented will be compared to the current structure. Consequently, the overall evaluation score for each alternative reflects a comparison to the current structure.
4.7.3 TEMS Organizational Assessment
The development of organizational alternatives for the emergency medical services proceeded
in a number of steps:
Step 1—Develop alternative structures using the structural paradigms
Step 2—Evaluate each alternative
Step 3—Develop an organizational alternative that combines the best features of the most promising alternatives
Step 4—Assess the viability of this alternative
Step 5—Confirm the benefits of the recommended structure
Four paradigmatic organizational structures were developed:
1. Geographic—Deploys and organizes resources by geographic area
2. Management expertise—Organizes resources around the management expertise needed to perform specific activities
3. Customer—Organizes the department by customer grouping
4. Key functions—Identifies key functions needed for organizational success and organizes around those functions
Geographic Structure
In a geographically oriented structure, service delivery is organized around geographic areas. Geographic managers are charged with tailoring services to address the needs of each geographic area. Support functions and activities are assigned to geographic units as long as it is cost-effective to do so.
Table 40 presents the structure of the emergency medical services as if it were organized geographically. The primary difference between a geographic structure and the current structure is that the programs that support more effective operations (the dedicated offload nursing program) and alternative approaches to providing service (the Cardiac Safe City Program and the Community Paramedicine Program are assigned to the operations unit. In this
structure, the commanders who are responsible for each geographic district would not only be

Service Efficiency Review – Toronto Fire Services & Toronto EMS
Page | 135
charged with ensuring high quality EMS services are provided, but also charged with efforts to
provide service alternatives.
As compared to the current structure, a geographically oriented structure represents an improvement in three areas: accountability, service, and flexibility.
Table 15—Structure of the Emergency Medical Services if Organized Geographically
Organizational Purpose Weighting Score Total Comments
Accountability 0.105 4.000 0.420 Accountability for the full range of service alternatives in a given geographic area is enhanced
Operational cost-effectiveness 0.105 3.000 0.315
Service 0.105 4.000 0.420 Strengthens ability to tailor services to needs
Flexibility 0.093 4.000 0.372 Ability to adjust services to reflect emerging needs in a given area is enhanced
Sustainability 0.093 3.000 0.279
Capabilities 0.075 3.000 0.225
Decision-making and authority 0.063 3.000 0.189
Organizational structure costs 0.063 3.000 0.189
Oversight 0.063 3.000 0.189
Expertise and judgment 0.050 3.000 0.150
External communications 0.040 3.000 0.120
Internal communications 0.040 3.000 0.120
Values 0.030 3.000 0.090
Coaching/support 0.025 3.000 0.075
Employee development 0.025 3.000 0.075
Reduce risks and liabilities 0.025 3.000 0.075
Total all purposes 1.000 3.303

Service Efficiency Review – Toronto Fire Services & Toronto EMS
Page | 136
GEOGRAPHICALLY ORIENTED EMERGENCY MEDICAL SERVICES STRUCTURE
Communications Centre Operations
Systems Performance
Education and Quality Improvement
EMS Planning
Area Operations
Specialized Services
Cardiac Safe Cities Program
Community Paramedicine
Dedicated Offload Nursing Program
Special Event Planning
Finance & Administration
Materials & Equipment
Communications Systems
Fleet Operations
Scheduling
Education & Development
Professional Standards
Emergency Medical Consultant
Special Projects
Chief
Emergency Medical Services
Deputy Chief
Communications Centre
Deputy Chief
Operations
Deputy Chief
Operational Support
Deputy Chief
Service Quality
Commander
Policy and Project Management
Commander
Business Services

Service Efficiency Review – Toronto Fire Services & Toronto EMS
Page | 137
Management Expertise Oriented Structure
The expertise of managers drives a structure focused on leveraging managerial skills and experience. This organizational alternative takes as an assumption that managers who are effective managing one type of enterprise may be less effective handling another type of enterprise. Moreover, when structures are organized around management expertise, the staff assigned to units tends to have similar capabilities. This often facilitates efforts to leverage staff expertise across units.
Table 16 presents the structure of the emergency medical services if it were organized around management expertise. The structure groups EMS functions into areas requiring different
management skills and abilities:
24-hour emergency operations
Non-emergency support
Human resource management
Program development and management
Systemic improvement
External relations
The operations unit would include both EMS response and communications operations—both
of which are 24-hour enterprises. The communications function, however, would only include 24-hour operations. The systems performance function that is currently part of the communications division would report to the systemic improvement unit. The EMS planning function would be assigned to the technical support functions, and the communications training would be assigned to human resources.
In this structure, non-emergency support functions would also be organized into units that can leverage managerial skills: finance and administration, repair and maintenance, technical support, procurement and stores and scheduling.
A structure organized around management expertise represents an improvement over the current structure in seven areas: accountability, operational cost-effectiveness, service,
capabilities, expertise and judgment, external communications, and employee development.
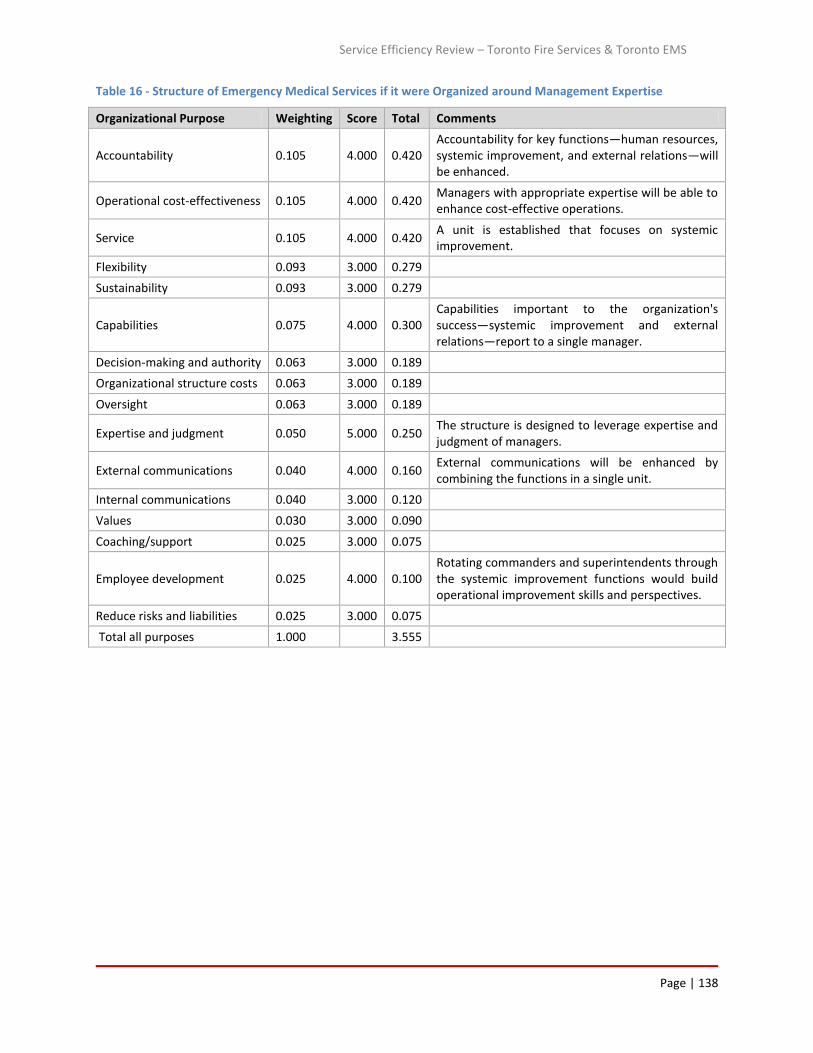
Service Efficiency Review – Toronto Fire Services & Toronto EMS
Page | 138
Table 16 - Structure of Emergency Medical Services if it were Organized around Management Expertise
Organizational Purpose Weighting Score Total Comments
Accountability 0.105 4.000 0.420 Accountability for key functions—human resources, systemic improvement, and external relations—will be enhanced.
Operational cost-effectiveness 0.105 4.000 0.420 Managers with appropriate expertise will be able to enhance cost-effective operations.
Service 0.105 4.000 0.420 A unit is established that focuses on systemic improvement.
Flexibility 0.093 3.000 0.279
Sustainability 0.093 3.000 0.279
Capabilities 0.075 4.000 0.300 Capabilities important to the organization's success—systemic improvement and external relations—report to a single manager.
Decision-making and authority 0.063 3.000 0.189
Organizational structure costs 0.063 3.000 0.189
Oversight 0.063 3.000 0.189
Expertise and judgment 0.050 5.000 0.250 The structure is designed to leverage expertise and judgment of managers.
External communications 0.040 4.000 0.160 External communications will be enhanced by combining the functions in a single unit.
Internal communications 0.040 3.000 0.120
Values 0.030 3.000 0.090
Coaching/support 0.025 3.000 0.075
Employee development 0.025 4.000 0.100 Rotating commanders and superintendents through the systemic improvement functions would build operational improvement skills and perspectives.
Reduce risks and liabilities 0.025 3.000 0.075
Total all purposes 1.000 3.555

Service Efficiency Review – Toronto Fire Services & Toronto EMS
Page | 139
EMS STRUCTURE ORGANIZED AROUND MANAGEMENT EXPERTISE
Education & Development
Labor Relations
Recruitment
Area Operations
Specialized Services
Communications Center Operations
Special Event Planning
Finance & Administration
Repair & Maintenance
Technical Support
Procurement & Stores
Scheduling
Cardiac Safe Cities Program
Community Paramedicine Program
Offload Nursing Program
Systems Performance
Standard Operation Procedures
City Council Liaison
External Agency Liaison
Professional Standards
Chief
Emergency Medical Services
Deputy Chief
Human Resources
Deputy Chief
Operations
Deputy Chief
Operational Support
Deputy Chief
Program Development and Management
Commander
Systemic Improvement
Commander
External Relations

Service Efficiency Review – Toronto Fire Services & Toronto EMS
Page | 140
Customer Oriented Structure
Table 17 presents the structure of the emergency medical services if it were organized around customer groupings. Four customer groupings were used in developing this organizational alternative:
1. Emergency response customers
2. Non-emergency response customers
3. Internal customers
4. External stakeholders While a customer-oriented structure would reduce the number of senior managers needed and would potentially improve service – accountability, operational cost-effectiveness, flexibility,
capabilities and expertise, and judgment would suffer.
Key Functions Oriented Structure
Table 18 presents the structure of the emergency medical services if it were organized around the activities and functions that are the most important to the department’s success. The key functions were identified based on discussions with department leaders and the experience of
the consulting team:
Management and operational analysis
Emergency response
Human resource management
Alternative response
Communications
Operational support
External relationship management
A key functions organization represents an improvement over the current structure in seven areas: accountability; operational effectiveness; service; sustainability; capabilities; external communications; values; and employee development.

Service Efficiency Review – Toronto Fire Services & Toronto EMS
Page | 141
Table 17 - Structure of Emergency Medical Services if it were organized around Customer Groupings
Organizational Purpose Weighting Score Total Comments
Accountability 0.105 2.000 0.210 Assigning disparate functions to the same organizational units will limit accountability for the performance of some functions.
Operational cost-effectiveness 0.105 2.000 0.210 Separating responsibility for critical care transport from emergency response may increase costs.
Service 0.105 4.000 0.420 Services can be tailored to better meet the needs of customers.
Flexibility 0.093 2.000 0.186 Assigning staff who address the needs of different customers to the different units limits operational flexibility.
Sustainability 0.093 3.000 0.279
Capabilities 0.075 2.000 0.150
Responsibility for functions critical to organizational success (for example, human resources and systemic improvement) has a lower organizational profile.
Decision-making and authority 0.063 3.000 0.189
Organizational structure costs 0.063 4.000 0.252 Fewer senior managers are needed to implement this structure.
Oversight 0.063 3.000 0.189
Expertise and judgment 0.050 2.000 0.100 Combining disparate functions to the same organizational units makes it more difficult to leverage expertise and judgment.
External communications 0.040 3.000 0.120
Internal communications 0.040 3.000 0.120
Values 0.030 3.000 0.090
Coaching/support 0.025 3.000 0.075
Employee development 0.025 3.000 0.075
Reduce risks and liabilities 0.025 3.000 0.075
Total all purposes 1.000 2.740

Page | 142
CUSTOMER ORIENTED EMS STRUCTURE (Customer Groupings)
City Council Liaison
External Agency Liaison
Professional Standards
Area Operations
Specialized Services
Communications Centre Operations
Special Event Planning
Finance and Administration
Repair and Maintenance
Technical Support
Procurement and Stores
Scheduling
Human Resources
Systematic Improvement
Cardiac Safe Cities Program
Community Paramedic and Medicine Program
Dedicated Offload Nursing Program
Critical Care Transport
Chief
Emergency Medical Services
Deputy Chief
External Customers
Deputy Chief
Emergency Customers
Deputy Chief
Internal Customers
Deputy Chief
Non-Emergency Customers

Service Efficiency Review – Toronto Fire Services & Toronto EMS
Page | 143
Table 18 - Structure of the Emergency Medical Services as if it Were Organized Around Key Functions
Organizational Purpose Weighting Score Total Comments
Accountability 0.105 4.000 0.420 Accountability for the functions most critical to the department's success is well defined.
Operational cost-effectiveness 0.105 4.000 0.420 A unit is established specifically responsible for identifying opportunities to improve management and operations.
Service 0.105 5.000 0.525
Flexibility 0.093 3.000 0.279
Sustainability 0.093 4.000 0.372
The structure emphasizes the department's key strategic initiatives—the need to develop and implement alternative service delivery options
Capabilities 0.075 5.000 0.375 The structure is organized around the capabilities most critical to the department’s success.
Decision-making and authority 0.063 3.000 0.189
Organizational structure costs 0.063 2.000 0.126 Implementing a customer oriented structure will increase management needs somewhat.
Oversight 0.063 3.000 0.189
Expertise and judgment 0.050 3.000 0.150
External communications 0.040 4.000 0.160 A unit is dedicated to supporting external communications.
Internal communications 0.040 3.000 0.120
Values 0.030 5.000 0.150 The structure reflects the functions that are most important to the department’s success.
Coaching/support 0.025 3.000 0.075
Employee development 0.025 4.000 0.100
A unit is established that focuses on employee quality; rotating staff through the systemic improvement unit will also develop needed skills.
Reduce risks and liabilities 0.025 3.000 0.075
Total all purposes 1.000 3.725

Service Efficiency Review – Toronto Fire Services & Toronto EMS
Page | 144
Chief
Emergency Medical Services
Deputy Chief
Human Resources
Deputy Chief
Emergency Response
Deputy Chief
Operational Support
Deputy Chief
Alternative Response
Deputy Chief
Communications Center
Commander
Management and Operational
Analysis
Commander
External Relations
Finance and Administration
Repair and Maintenance
Technical Support
Procurement and Stores
Scheduling
KEY FUNCTIONS ORIENTED EMS STRUCTURE
Labor Relations
Recruitment
Education and Professional Development
Area Operations
Specialized Services
Special Event Planning
Communication centre Operations
Systems Performance
Education and Quality Improvement
EMS Planning
Cardiac Safe Cities Program
Community Paramedic and Medicine Program
Systems Performance
Standard
Operating Procedures
City Council Liaison
External Agency Liaison
Professional Standards
Dedicated Offload Nursing Program

Service Efficiency Review – Toronto Fire Services & Toronto EMS
Page | 145
4.7.4 TEMS Recommended Structure
The recommended organizational structure for EMS is that of a geographic orientation but tempered to reflect management expertise.
Key features of the Recommended Structure
Promising features of each paradigmatic organizational structure were used to develop the recommended structure presented in Table 19. This structure organizes the delivery of the department’s core services geographically. Unlike in the geographic structural alternative, however, this geographic orientation is tempered to reflect management expertise. For
example, instead of assigning responsibility for managing service delivery alternatives to the section managers, responsibility for developing alternative service delivery approaches is assigned to its own unit. Geographic managers will, however, have a strong incentive to implement viable alternative service delivery approaches because they will be held accountable for managing call volume in their regions.
The key functions necessary to the department’s success – systemic improvement, external relations, human resources, operations, operational support, and alternative service delivery – are highlighted in the recommended structure. This structure will enhance accountability for performing these key functions. The structure also facilitates a manager’s ability to focus on what they do best.
The Deputy Chief—Alternative Service Delivery will focus exclusively on developing and supporting the implementation of these programs.40
The Deputy Chief—Human Resources will be responsible for ensuring the quality of department staff.
All 24-hour operations – The EMS response and transport as well as communications—
are assigned to the Deputy Chief – Operations.41
Responsibility for performance improvement efforts is assigned to a single manager.42
Responsibility for external relations – which is especially important to a department
whose funding is provided by both the province and the City – is assigned to a single
manager.
40 The offload nursing program reports to the Deputy Chief whose operating unit directly benefits from this program. 41 Communications support functions (e.g., systems performance, education and quality improvement, and EMS planning) are assigned to units focusing on these issues for the entire department. 42 The operations superintendents who report centrally and currently support improvement efforts are assigned to this unit.

Service Efficiency Review – Toronto Fire Services & Toronto EMS
Page | 146
Table 19 - Recommended Structure of the Emergency Medical Services—Geographically Organized Structure Tempered to Reflect Management Expertise
Organizational Purpose Weighting Score Total Comments
Accountability 0.105 4.000 0.420 Accountability for the functions most critical to the department's success is well defined.
Operational cost-effectiveness 0.105 4.000 0.420
A unit is established specifically to be responsible for identifying opportunities to improve management, and the operations segment is incorporated in the structure; the structure also facilitates efforts to leverage management expertise.
Service 0.105 4.000 0.420 The unit’s focuses on systemic improvement will also focus on improving services.
Flexibility 0.093 3.000 0.279
Sustainability 0.093 4.000 0.372 The structure emphasizes the department's key strategic initiatives—the need to develop and implement alternative service delivery options.
Capabilities 0.075 5.000 0.375 The structure is organized around the capabilities most critical to the department’s success.
Decision-making and authority 0.063 3.000 0.189
Organizational structure costs 0.063 4.000 0.252 Implementing this structure will modestly reduce organization structure costs.
Oversight 0.063 3.000 0.189
Expertise and judgment 0.050 5.000 0.250 The structure is designed to leverage expertise and judgment of managers.
External communications 0.040 4.000 0.160 A unit is dedicated to supporting external communications.
Internal communications 0.040 3.000 0.120
Values 0.030 5.000 0.150 The structure reflects the functions that are most important to the department’s success.
Coaching/support 0.025 3.000 0.075
Employee development 0.025 4.000 0.100 A unit is established that focuses on employee quality; rotating staff through the systemic improvement unit will also develop needed skills.
Reduce risks and liabilities 0.025 3.000 0.075
Total all purposes 1.000 3.846

Service Efficiency Review – Toronto Fire Services & Toronto EMS
Page | 147
Operational support units are organized based on types of expertise needed to manage the
units.
Viability of the Recommended Structure
Implementing the recommended structure is viable. No people, systems, or cultural barriers should hinder implementation of the recommended organizational structure because the structure retains key features of the department’s service delivery and support systems. However, the recommended reorganization of key functions should allow the EMS chief to leverage the skills of key managers more effectively.
The only barrier to implementation relates to funding. The recommended structure assigns functions that are currently dedicated to the Communications Division (systems performance, education and quality improvement, and EMS planning) to units that serve the entire organization. Because communications operations are currently 100 percent funded by the province, these crucial communications support functions are also fully funded by the province. If the recommended structure is implemented, these functions must continue to be fully funded by the province.
Benefits of the Recommended Structure
The recommended structure represents a significant improvement over the current structure
and each of the paradigmatic alternatives. The overall rating of 3.846 for the recommended structure is higher than the score for the other alternatives and is significantly higher than the rating of 3.000 for the current structure.
Observations
We discussed the organizational recommendation with the Chief of TEMS. Our discussions revealed some challenges in implementing and operating within the recommended structure, particularly with the span of control for the Deputy Chief of Operations which could make this organizational design unwieldy. Nevertheless, the Chief will consider the analysis and
recommendations as he assesses the best fit organizational design for Emergency Medical
Services.

Service Efficiency Review – Toronto Fire Services & Toronto EMS
Page | 148
EMERGENCY MEDICAL SERVICES RECOMMENDED ORGANIZATIONAL STRUCTURE
Systems Performance
Standard Operation Procedures
City Council Liaison
External Agency Liaison
Professional Standards
Education & Development
Labor Relations
Recruitment
Area Operations
Specialized Services
Communications Centre Operations
Special Event Planning
Offload Nursing Program
Finance and Administration
Repair and Maintenance
Technical Support
Procurement and Stores
Scheduling
Cardiac Safe Cities Program
Community Paramedic and Medicine Program
Chief
Emergency Medical Services
Deputy Chief
Human Resources
Deputy Chief
Operations
Deputy Chief
Operational Support
Deputy Chief
Alternative Service Delivery
Commander
Systemic Improvement
Commander
External Relations
Service Efficiency Review – Toronto Fire Services & Toronto EMS
Page | 149
4.7.5 TFS Organizational Assessment
The development of organizational alternatives for the fire service followed the same steps as for the Emergency Medical Services. In addition, the same four paradigmatic organizational structures were developed for the fire services—geographic, management expertise, customer, and key functions.
1. Geographic—Deploys and organizes resources by geographic area
2. Management expertise—Organizes resources around the management expertise needed to perform specific activities
3. Customer—Organizes the department by customer grouping
4. Key functions—Identifies key functions needed for organizational success and organizes around those functions
Geographic Structure
Table 20 presents a fire service organizational structure using the geography paradigm. In this organizational alternative, a single manager would be responsible for the delivery of the full range of fire department services in an area. This responsibility would include fire suppression, EMS response, fire code inspection, and enforcement. A centralized prevention and public education unit would be retained, however, to perform functions that cannot be effectively decentralized. These prevention and education functions include developing public education
programs, implementing citywide public education programs, providing support for enforcement cases that will go to court, and working with stakeholders to identify alternative approaches to complying with the fire code. A geographically organized structure supports key organizational purposes more effectively than the current structure. Organizing services geographically enhances accountability, promotes flexibility, and facilitates efforts to use fire suppression staff to more broadly support fire department objectives.

Service Efficiency Review – Toronto Fire Services & Toronto EMS
Page | 150
Table 20 - Structure of the Fire Service if Organized by Geography
Organizational Purpose Weighting Score Total Comments
Accountability 0.105 4.000 0.420 Accountability for the level of service provided in a given geographic area is enhanced.
Operational Cost-Effectiveness 0.105 5.000 0.525 This structure facilitates efforts to use suppression staff to support inspection and public education needs.
Service 0.105 5.000 0.525 Creates opportunity to tailor services to needs; substantially more inspections will be performed and public education efforts will be enhanced.
Flexibility 0.093 4.000 0.372 Ability to adjust services to reflect needs in a given area is enhanced.
Sustainability 0.093 3.000 0.279
Capabilities 0.075 3.000 0.225
Decision-Making And Authority 0.063 3.000 0.189
Organizational Structure Costs 0.063 3.000 0.189
Oversight 0.063 3.000 0.189
Expertise And Judgment 0.050 3.000 0.150
External Communications 0.040 3.000 0.120
Internal Communications 0.040 3.000 0.120
Values 0.030 3.000 0.090
Coaching/Support 0.025 3.000 0.075
Employee Development 0.025 3.000 0.075
Reduce Risks And Liabilities 0.025 3.000 0.075
Total All Purposes 1.000 3.618

Service Efficiency Review – Toronto Fire Services & Toronto EMS
Page | 151
GEOGRAPHICALLY ORIENTED FIRE SERVICE STRUCTURE
Emergency Planning and Research
Health and Safety
Public Information and Media Communications
City Council Liaison
External Agency Liaison
Citywide Programs
Legal Support
Code Compliance
Area Fire Code Inspection and Enforcement
Area Public Education
Area Public Education
Fire Suppression and EMS Response
Communications
Staff Services
Information and Communication Systems
Finance and Administration
Facilities and Materials Management
Attendance Management
Business Analyst
Mechanical Maintenance
Professional Development and Operations Training
Chief
Fire Services
Deputy Chief
City Level Prevention and Public Education
Deputy Chief
Operations
Deputy Chief
Staff Services and Communications
Deputy Chief
Professional Development and
Mechanical Maintenance
Division Chief
Policy, Project and Public Information
Division Chief
Special Projects and Emergency Planning

Service Efficiency Review – Toronto Fire Services & Toronto EMS
Page | 152
Management Expertise Oriented Structure
Table 21 presents the structure of the fire services if it were organized around management expertise. In this alternative, all 24 operations—fire suppression, EMS response, and communications—are assigned to a single manager. The structure also leverages the skills and experience of managers in the following areas:
Fire prevention and public education
Support services
Human resources
External relations
Emergency planning and research
Health and safety In addition, in this structure support services are grouped to reflect the skills and expertise of support services managers. A structure that is organized around management expertise meets organizational purposes somewhat more effectively than the current structure. While changes from the current
structure are modest, organizing around the skills and expertise of managers will enhance accountability, operational cost-effectiveness and expertise and judgment.

Service Efficiency Review – Toronto Fire Services & Toronto EMS
Page | 153
Table 21 - Structure Of The Fire Services Organized Around Management Expertise
Organizational Purpose Weighting Score Total Comments
Accountability 0.105 4.000 0.420 Accountability for selected functions—external relations and human resources—will be enhanced.
Operational cost-effectiveness 0.105 4.000 0.420 Managers with appropriate expertise will be able to enhance cost-effective operations; but changes as compared to current structure are modest.
Service 0.105 3.000 0.315
Flexibility 0.093 3.000 0.279
Sustainability 0.093 3.000 0.279
Capabilities 0.075 3.000 0.225
Decision-making and authority 0.063 3.000 0.189
Organizational structure costs 0.063 3.000 0.189
Oversight 0.063 3.000 0.189
Expertise and judgment 0.050 4.000 0.200 The structure is designed to leverage expertise and judgment of managers; but changes as compared to the current structure are modest.
External communications 0.040 3.000 0.120
Internal communications 0.040 3.000 0.120
Values 0.030 3.000 0.090
Coaching/support 0.025 3.000 0.075
Employee development 0.025 3.000 0.075
Reduce risks and liabilities 0.025 3.000 0.075
Total all purposes 1.000 3.260

Service Efficiency Review – Toronto Fire Services & Toronto EMS
Page | 154
Public Information and Media Communications
City Council Liaison
External Agency Liaison
Emergency Planning and Research
Health and Safety
Citywide Programs
Legal Support
Code Compliance
Fire Suppression and EMS Response
Area Fire Code Inspection and Enforcement
Area Public Education
Communications
Staff Services
Information and Communication Systems
Finance and Administration
Facilities and Materials Management
Mechanical Maintenance
Professional Development and Operations Training
MANAGEMENT EXPERTISE ORIENTED FIRE SERVICES STRUCTURE
Chief
Fire Services
Deputy Chief
City Level Prevention and Public Education
Deputy Chief
Operations
Deputy Chief
Staff Services and Communications
Deputy Chief
Professional Development and
Mechanical Maintenance
Division Chief
Policy, Project and Public Information
Division Chief
Special Projects and Emergency Planning

Service Efficiency Review – Toronto Fire Services & Toronto EMS
Page | 155
Customer Oriented Structure
Table 22 presents the structure of the fire services if it were organized around customer groupings. As with the EMS paradigm, four customer groupings were used in developing this organizational alternative:
Emergency response customers
Non-emergency response customers
Internal customers
External stakeholders
A customer oriented structure meets fire services needs less well than the current structure. While service will be enhanced and fewer management positions are needed, a customer oriented structure reduces accountability, flexibility, capabilities, and expertise and judgment.
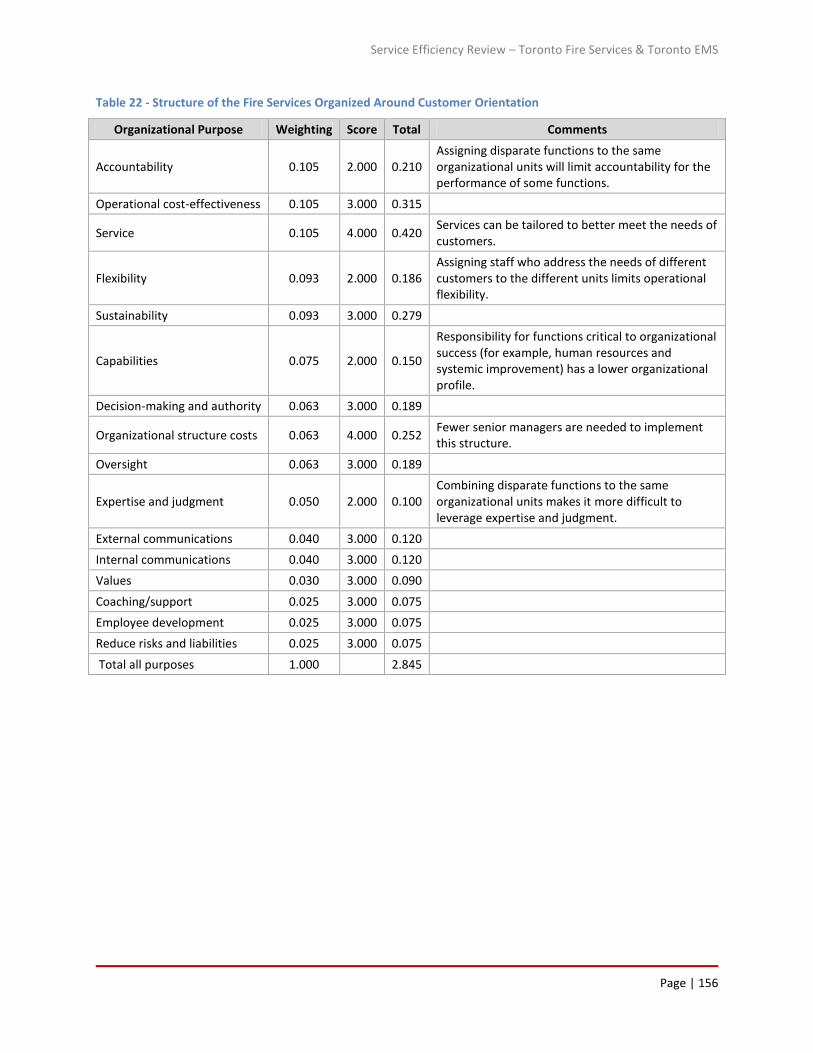
Service Efficiency Review – Toronto Fire Services & Toronto EMS
Page | 156
Table 22 - Structure of the Fire Services Organized Around Customer Orientation
Organizational Purpose Weighting Score Total Comments
Accountability 0.105 2.000 0.210 Assigning disparate functions to the same organizational units will limit accountability for the performance of some functions.
Operational cost-effectiveness 0.105 3.000 0.315
Service 0.105 4.000 0.420 Services can be tailored to better meet the needs of customers.
Flexibility 0.093 2.000 0.186 Assigning staff who address the needs of different customers to the different units limits operational flexibility.
Sustainability 0.093 3.000 0.279
Capabilities 0.075 2.000 0.150
Responsibility for functions critical to organizational success (for example, human resources and systemic improvement) has a lower organizational profile.
Decision-making and authority 0.063 3.000 0.189
Organizational structure costs 0.063 4.000 0.252 Fewer senior managers are needed to implement this structure.
Oversight 0.063 3.000 0.189
Expertise and judgment 0.050 2.000 0.100 Combining disparate functions to the same organizational units makes it more difficult to leverage expertise and judgment.
External communications 0.040 3.000 0.120
Internal communications 0.040 3.000 0.120
Values 0.030 3.000 0.090
Coaching/support 0.025 3.000 0.075
Employee development 0.025 3.000 0.075
Reduce risks and liabilities 0.025 3.000 0.075
Total all purposes 1.000 2.845

Service Efficiency Review – Toronto Fire Services & Toronto EMS
Page | 157
Public Information and Media Communications
City Council Liaison
External Agency Liaison
Fire Suppression and EMS Response
Communications
Staff Services
Information and Communication Systems
Finance and Administration
Facilities and Materials Management
Mechanical Maintenance
Professional Development and Operations Training
Emergency Planning and Research
Health and Safety
Fire Code Inspection and Enforcement
Public Education
CUSTOMER ORIENTED FIRE SERVICES STRUCTURE
Chief
Fire Services
Deputy Chief
External Customers
Deputy Chief
Emergency Customers
Deputy Chief
Internal Customers
Deputy Chief
Non-Emergency Customers

Service Efficiency Review – Toronto Fire Services & Toronto EMS
Page | 158
Key Functions Oriented Structure
Table 23 presents the structure of the fire services if it were organized around the activities and functions that are the most important to the department’s success. These key functions were identified based on based on discussions with department leaders and the experience of the POMAX consulting team:
Emergency response
Fire prevention and public education
Operational support
Human resources
External relations
Systemic improvement
Risk management
Health and safety A key functions organizational structure represents an improvement over the current structure
in a number of areas. While a key functions structure is more expensive than the current structure, this structure is rated higher than the current structure in terms of accountability, operational cost-effectiveness, service, sustainability, capabilities, external communications, values, employee development, and reducing risks and liabilities.

Service Efficiency Review – Toronto Fire Services & Toronto EMS
Page | 159
Table 23 - Structure of the Fire Services Organized Around the Activities and Functions Most Important To Success (Key Functions)
Organizational Purpose Weighting Score Total Comments
Accountability 0.105 4.000 0.420 Accountability for the functions most critical to the department's success is well defined.
Operational cost-effectiveness 0.105 4.000 0.420 A unit is established specifically responsible for identifying opportunities to improve management and operations.
Service 0.105 4.000 0.420 A unit is established that is responsible for improving operational performance.
Flexibility 0.093 3.000 0.279
Sustainability 0.093 4.000 0.372
By emphasizing risk management the structure supports a consistent focus on determining how best to use resources to manage risks in a way that reflects city needs.
Capabilities 0.075 5.000 0.375 The structure is organized around the capabilities most critical to the department’s success.
Decision-making and authority 0.063 3.000 0.189
Organizational structure costs 0.063 2.000 0.126 Implementing a customer oriented structure will increase management needs somewhat.
Oversight 0.063 3.000 0.189
Expertise and judgment 0.050 3.000 0.150
External communications 0.040 4.000 0.160 A unit is dedicated to supporting external communications.
Internal communications 0.040 3.000 0.120
Values 0.030 5.000 0.150 The structure reflects the functions that are most important to the department’s success.
Coaching/support 0.025 3.000 0.075
Employee development 0.025 4.000 0.100 A unit is established that focuses on employee quality; rotating staff through the systemic improvement unit will also develop needed skills.
Reduce risks and liabilities 0.025 5.000 0.125 Functions are emphasized that promote employee safety and the fire service’s management of risks.
Total all purposes 1.000 3.670

Service Efficiency Review – Toronto Fire Services & Toronto EMS
Page | 160
KEY FUNCTIONS ORIENTED FIRE SERVICES STRUCTURE
Fire Code Inspection and Enforcement
Public Education
Legal Support
Alternate Approaches to Code Compliance
Public Information and Media Communications
City Council Liaison
External Agency Liaison
Fire Suppression and EMS Response
Communications
Quartermaster
Information and Communication Systems
Finance and Administration
Facilities and Materials Management
Mechanical Maintenance
Professional Development and Operations Training
Recruiting
Attendance Management
Chief
Fire Services
Deputy Chief
Fire Prevention and Public Education
Deputy Chief
Emergency Response
Deputy Chief
Operational Support
Deputy Chief
Human Resources
Division Chief
External Relations
Division Chief
Systemic Improvement
District Chief
Health and Safety
District Chief
Risk Management

Service Efficiency Review – Toronto Fire Services & Toronto EMS
Page | 161
4.7.6 TFS Recommended Structure
Key Features of the Recommended Structure
Promising features of each paradigmatic organizational structure were used to develop the recommended structure presented in

Service Efficiency Review – Toronto Fire Services & Toronto EMS
Page | 162
Table 24. The structure organizes the delivery of the department’s core services geographically. A single manager is responsible for the full range of fire services services—suppression, medical response, inspections, and education—in each organizational area. Assigning these responsibilities to the same manager will facilitate the integration of these services. In addition, the geographic manager will be charged with ensuring fire suppression staff support all department services. The structure also leverages the expertise of key managers:
The Deputy Chief—Operations oversees all 24-hour operations
Support functions—that cannot be assigned to geographic districts—are grouped based
on management expertise
A single manager is responsible for ensuring the quality of fire services employees
The department’s analytic capabilities will be assigned to a single unit that will support strategic (e.g., risk management), tactical (e.g., operational practices) and management (e.g., using data to drive decision making) improvements43
The structure highlights key functions that are crucial to the department’s long-term success—risk management, and management and operational improvement.
Viability of the Recommended Structure
While the recommended organizational structure is viable, successfully implementing the
structure will require a shift in the department’s orientation. In particular, organizing service delivery by region—and holding managers accountable for the full range of fire department services provided in that region—will require a major shift in orientation for the department. Instead of assigning responsibility for services into different organizational silos, managers will be required to integrate services and to leverage all the resources reporting to them to achieve organizational objectives. In an organization the size of the TFS, ensuring the expectation that fire suppression crews support inspection and public education activities is consistently implemented will be difficult unless a single manager is accountable for both functions.
43 Because this function reports directly to the chief, it will be positioned to have broad influence on the department.

Service Efficiency Review – Toronto Fire Services & Toronto EMS
Page | 163
Table 24 - The Recommended Structure Of The Fire Services (Geographic Orientation)
Organizational Purpose Weighting Score Total Comments
Accountability 0.105 5.000 0.525 Combining service delivery by geographic area facilitates efforts to leverage suppression staff to support inspection and public education needs
Operational cost-effectiveness 0.105 5.000 0.525 Creates opportunity to tailor services to needs; substantially more inspections will be performed and public education efforts will be enhanced.
Service 0.105 4.000 0.420 Ability to adjust services to reflect needs in a given area is enhanced.
Flexibility 0.093 4.000 0.372 Ability to adjust services to reflect needs in a given area is enhanced.
Sustainability 0.093 4.000 0.372 The structure emphasizes the department's key strategic initiatives—the need to develop and implement alternative service delivery options
Capabilities 0.075 4.000 0.300
By emphasizing risk management the structure supports a consistent effort on determining how best to use resources to manage risks in a way that reflects city needs.
Decision-making and authority 0.063 5.000 0.315 The structure is organized around the capabilities most critical to the department’s success.
Organizational structure costs 0.063 3.000 0.189
Oversight 0.063 3.000 0.189
Expertise and judgment 0.050 4.000 0.200 The structure is designed to leverage expertise and judgment of managers; but changes as compared to the current structure are modest.
External communications 0.040 4.000 0.160 A unit is dedicated to supporting external communications.
Internal communications 0.040 3.000 0.120
Values 0.030 5.000 0.150 The structure reflects the functions that are most important to the department’s success.
Coaching/support 0.025 3.000 0.075
Employee development 0.025 4.000 0.100 A unit is established that focuses on employee quality; rotating staff through the systemic improvement unit will also develop needed skills.
Reduce risks and liabilities 0.025 5.000 0.125 Functions are emphasized that promote employee safety and the fire service's management of risks.
Total all purposes 1.000 4.137

Service Efficiency Review – Toronto Fire Services & Toronto EMS
Page | 164
Other aspects of the recommended structure will also require a change in culture. For example, using analysis and information to drive decision making about all aspects of the department’s operations will represent a change for many department managers. Again, unless the expectation that information be used to drive decision making is supported by an organizational change, implementing this concept will be difficult.
Other aspects of the recommended structure reflect a reorganization of responsibilities to take advantage of the expertise of managers and should not be difficult to implement.
Benefits of the Recommended Structure
The recommended structure represents a significant improvement over the current structure
and each of the paradigmatic alternatives. The overall rating of 4.137 for the recommended structure is higher than the other alternatives presented in the study, and it is significantly higher than the rating of 3.000 for the current structure.
Toronto’s Fire Chief sees some challenges with implementing the recommended structure.
TFS was in the process of organizational realignment before this report was received. The Chief expressed some concern about the breadth of responsibility, particularly for the Deputy Chief of Operations, in this structure. Similar to the perspective of the Chief of TEMS, the Fire Chief will take into account the ideas and discussion presented in this section as organizational priorities are implemented.

Service Efficiency Review – Toronto Fire Services & Toronto EMS
Page | 165
FIRE SERVICES RECOMMENDED ORGANIZATIONAL STRUCTURE
Citywide Programs
Legal Support
Code Compliance
Public Information and Media Communications
City Council Liaison
External Agency Liaison
Emergency Planning and Research
Risk Management
Operational Analysis
Management Analysis
Fire Suppression and Medical Response
Area Fire Code Inspection and Enforcement
Area Public Education
Communications
Health and Safety
Quartermaster
Information and Communication Systems
Finance and Administration
Facilities and Materials Management
Mechanical Maintenance
Professional Development and Operations Training
Recruiting
Attendance Management
Chief
Fire Services
Division Chief
City Level Prevention and Public Education
Deputy Chief
Operations
Deputy Chief
Support Services
Deputy Chief
Human Resources
Division Chief
External Relations
Division Chief
Risk Management and Systemic Improvement

Service Efficiency Review – Toronto Fire Services & Toronto EMS
Page | 166
5.0 Consolidation of Communication Centres
One of the questions to be answered by the Toronto Service and Organizational Study is whether it is feasible and desirable to consolidate the TFS and TEMS communication centres.
Consolidation is most often feasible from a technical infrastructure and facilities point of view and easier to achieve when the amalgamation involves a single emergency discipline (police or fire or EMS). Greater challenges are experienced from an operational, financial, governance or political point of view particularly when multi-jurisdictional agencies (police, fire, EMS) are considered for dispatch amalgamation. Differences in staff qualification criteria, intake training,
the need for staff to learn dissimilar operational methods, continuing education, maintaining skill sets by discipline, and the stressors of changing dispatch roles (switching between police, fire, and ambulance methods) all have a profound impact on the operation of consolidated dispatch centers as well as field operations.
People who have not had the opportunity to experience the day to day work of emergency call taking and dispatching sometimes wonder what difficulty there is in answering a telephone and sending an emergency responder to an address – but it is a difficult job for many reasons, and only a minority of the population have the aptitude for it and even fewer can learn all the skill sets required to call take and dispatch for two or three types of emergency services.
Consolidation success can be characterized in several different ways. Building and technical
infrastructure consolidation may be a success even if the dispatch entities continue to operate individually (co-housing). In this way radio, secure power systems, data communication systems and backups may be housed in one or two locations and used by all entities. A common computer aided dispatch and other systems (geographic information systems, automatic vehicle location, telephony) may be more easily supported than different systems at different locations. A common backup communications center would be expected to eventually reduce costs and improve productivity.
Dispatch consolidation would be a significant culture change no matter to what degree the
consolidation takes place and it would have to be handled as carefully as any cultural shift, or a
jurisdiction will find itself coping with the personnel fallout for, literally, the next generation.
Intuition tells us that dispatch consolidation is straightforward - but it is far from simple. Dispatch consolidation is usually explored because of the need to reduce expenditures and avoid costs but in some cases the initial capital cost of amalgamation has an extended period before cost recovery takes place. The greatest cost avoidance can be expected in salaries, wages, and benefits since the degree of scale will mean that fewer staff are required in a fully consolidated dispatch center. However, staff reductions also bring forward the issues of human resource management and, possibly, separation costs. In addition, lengthier intake training periods – due to needing to train new hires to dispatch each emergency service - and continuing education will offset some savings. And the possibility of increased staff turnover
because of the rigors of dispatching different emergency response disciplines with different

Service Efficiency Review – Toronto Fire Services & Toronto EMS
Page | 167
policies, procedures, standing orders, and methods might also represent additional costs,
sometimes very significant.
Even though there are many pitfalls to consolidation, it can be successful assuming that the feasibility is carefully studied, all aspects of buildings, technology, backup facilities, and staff change are taken into account, and a comprehensive strategy and project plan are employed to transition into a consolidated environment. Achieving success could take from 3 to 10 years depending on how success is defined.
The feasibility of consolidating the fire and EMS dispatch centres has to be examined from the perspectives of staff levels, technology, funding, organization, and operation. It’s possible that a negative report on any one or two of these areas could negate the feasibility of consolidation.
In Ontario, the consolidation of fire and EMS communication centres has another major implication to be considered. That is, Ontario’s Ministry of Health and Long Term Care funds almost all of the operation and most of the technology of Toronto’s ambulance communication centres at the 100% level. And, those areas which are not funded – such as some of the technology – are closely legislated and regulated in much the same way as emergency medical services in Ontario. Toronto is somewhat unique in Ontario since it operates its own ambulance communication centre, as does Niagara region, whereas most other ambulance communication centres in the province are either directly operated by the Ministry of Health and Long Term Care or are under contract to operate like an MOHLTC centre. However, this uniqueness will not preclude Toronto from having to negotiate possible changes to staff and technology
funding levels if the City moves forward with consolidation; nor will the City have full control over the type of technology that can be installed if it has an impact on the provincial platform.
5.1.1 Staffing and Technology
The primary areas of consideration when evaluating consolidation feasibility are staffing and technology. In some cases, consolidation will allow a similar level of work that is being accomplished by two or more centers, to be accomplished in a combined centre, using fewer full time equivalents. This is because in any environment that incoming calls cannot – or should not – be delayed before answering, there has to be a reasonable level of staff availability, or
surplus capacity, to accommodate peak call loads. A consolidated communications centre may
be able to reduce the surplus capacity experienced in each communications centre while still ensuring sufficient capacity to handle incoming calls during peak activity times.
Our review included examining the staff levels at the EMS and fire communications centres to determine if staff resources were adequate in both organizations and then assessing whether efficiencies gained within a consolidated entity would offset the technical and initial operational costs of consolidation.
We also examined the technical impact of consolidation and the expected period of recovery before evaluating the possible organization and operation of a combined communications centre.

Service Efficiency Review – Toronto Fire Services & Toronto EMS
Page | 168
5.1.2 TEMS
As we noted previously, one of the considerations and complications in determining EMS communications staff levels is that the communications staff are fully funded by the Ministry of Health and Long Term Care. So, while we can make recommendations with respect to EMS communications staff levels, the City of Toronto will have to negotiate funding with the Emergency Health Services Branch of MOHLTC.
Calculating the required call taker and dispatcher staff levels at EMS was a complicated process since the levels fluctuate depending on call volume, time of day, and day of week. Our initial calculations assumed a static base level of call takers and dispatchers; for example, 4 call takers and 4 quadrant dispatchers 24 hours a day with some increase based on peak event (call)
volumes. In fact, this isn’t the case. There can be as few as one or two call takers and two dispatchers on duty depending on the time of day or night. Unusual increases in event load are compensated by supervisory staff assisting as necessary. This is a laudable and cost efficient approach to staffing the communications centre except it results in understaffing over many hours of the day and night thereby decreasing capacity for supervisory oversight and quality assurance.
Another factor has to be considered: the communications centre staffing has to be considered as part of the overall EMS response to patient events. The staffing demand analysis in the 3.3 TEMS Staffing Demand Analysis section of this report, calculates paramedic resource levels, based on response to the most urgent patients, within 8 minutes and 59 seconds of the call for
assistance being received at the EMS communications centre. This response target includes 2 minutes for call takers and dispatchers to receive the call; determine the most appropriate EMS resource to respond to the incident and assign it, and a maximum travel time of 6 minutes and 59 seconds for paramedics to reach the incident. The two minute dispatch handling time target can usually be met when calls are received in a linear fashion (one at a time), but becomes much more difficult as call volumes increase and dispatchers have to conduct multiple resource assignments, which is almost consistently the case at TEMS. So, any inability for communications centre staff to achieve a two minute call taking and dispatch time target
partially negates the benefit of staffing paramedic resources to achieve a sub 7 minute travel time. TEMS acknowledges that the 2 minute call receiving and dispatch target is not currently
being met.
The EMS communications staff level calculation spreadsheets leading to our conclusions are attached44. These indicate the requirement for an additional 3 full time equivalents assuming that there is a minimum of 4 call takers and 4 dispatchers 24 hours a day. However, as noted previously, there can be as few as one or two call takers and two dispatchers on duty depending on the time of day or night. Unusual increases in event load are compensated by
44 The staff level calculation worksheets are attached as an exhibit but they are complicated to the extent that readers will not be able to understand the process unless they are able to see the formulas in each cell and, even with that, the spreadsheets and conclusions probably require ‘live’ explanations. We’re happy to provide those live explanations and assist TEMS in any way we can.

Service Efficiency Review – Toronto Fire Services & Toronto EMS
Page | 169
supervisory staff assisting as necessary but results in understaffing over many hours of the day
and night thereby decreasing capacity for supervisory oversight and quality assurance.
To ensure accuracy of EMS communications centre staffing needs, recalculation of the staffing levels should be undertaken by EMS on an hour by hour and day by day basis to reflect the true full time equivalent requirements. Pomax’s working paper calculations lead us to believe the true additional FTE requirement is likely to be 8 or more depending upon the actual fluctuation in existing staff levels.
The recalculation can be accomplished by TEMS, using our worksheets and formulas, and we would be pleased to assist as required. We did not go further with calculations since EMS communications staff levels is an item which the City has to negotiate with the Emergency
Health Services Branch of the MOHLTC and a live calculation tool, such as our spreadsheets, might assist during those negotiations.
5.1.3 TFS
A review of the current call taker and dispatcher staffing levels for the TFS (TFS) was completed in order to determine if an appropriate staffing model was in place with respect to total call volume as well as the required operational duties and responsibilities.
The TFS communicator staffing analysis was conducted based on the Erlang C formula; Erlang C is a standardized telecommunications engineering formula used for communications and call centres that use queuing technology. Erlang C expresses the probability that calls may be
queued as opposed to immediately being served. If all call takers or dispatchers are busy when a call or dispatch event is presented, the incident is queued. Erlang C calculates the probability of queuing offered traffic, assuming that blocked calls or events stay in the system until they can be handled. In addition to Erlang modeling of the TFS Communication Centre, a TFS dispatcher per hour workload analysis was completed and a peer review of total annualized call volumes, call taker and dispatcher staffing levels, and the performance based service standard used to determine staffing levels was conducted of Vancouver Fire Rescue Service, Calgary Fire Department, and Ottawa Fire Service.
Erlang calculations only consider the measurable components of a communication centre when determining the total resources required; the components are average calls per hour, average
time per call, and the acceptable service level (average delay or percentage of calls answered within a set number of seconds). In public safety communication centres, and specifically fire dispatch centres, there are other factors that must be considered when determining appropriate staffing levels. These factors include mass calling events that overwhelm a communication centre and the various tasks and responsibilities required of call takers and dispatchers throughout the course of an emergency event in support of fire operations.
Based on the Erlang C modeling of the TFS call taker and dispatcher staffing levels, and consideration of other factors that must be addressed when determining appropriate staffing levels for fire dispatch centre, the following comments are offered.

Service Efficiency Review – Toronto Fire Services & Toronto EMS
Page | 170
Call Taking Function
The calculated call taker staffing level results are based on Erlang C calculations and identifies a minimum of three (3) call takers for day shift and two (2) for night shift; this is based on the existing business model of call taking.
Other call taking configurations were considered such as: (a) having administration calls answered by an administrative staff person, at least during peak daytime hours (administration calls are currently answered by call takers, and (b) excluding both administration calls and calls from TEMS. The rationale for these considerations is that it may be more cost effective to have administration calls handled by TFS administration staff. This option should be further investigated.
The option of excluding calls from emergency medical services was considered as EMS indicated that they will be soon using a computer interface for all communications on medical calls. Currently, medical calls are presented directly to the TFS dispatch queue via the computer aided dispatch interface while additional information, lift assist requests, and similar information is transmitted by telephone.
Dispatch Function
The calculated dispatcher staffing levels, based on Erlang C calculations and the workload per hour analysis, identify a minimum of three (3) dispatchers required for both day and night shifts. As a result of the random nature of dispatcher support activities during an active incident
and to account for large scale events and instances of extreme dispatcher activity (e.g., severe weather events, tactical dispatching, etc.) the minimum dispatcher staffing level should be four (4) for both day and night shifts.
TFS should consider moving to a revised dispatcher staffing level of four (4) dispatchers for both day and night shifts from the current staffing level of six (6) dispatchers for both day and night shifts.
5.1.4 Methodology
The industry standard accepted methodology for public safety staffing analyses is the use of Erlang calculations. There are three North American organizations responsible for establishing
the administrative and operational guidelines and procedures for Public Safety Answering Points (PSAP). These are the Association of Communication Officials (APCO), the National Fire Protection Association (NFPA), and the National Emergency Number Association (NENA).
In 2003, NENA formally adopted Erlang formula calculations as the baseline for staffing in their PSAP Staffing Guidelines Report45. In addition to the staffing report, NENA’s Resource List refers to Erlang for staffing requirements.46
With respect to fire service operations, NFPA describes itself as “the world's leading advocate of fire prevention and an authoritative source on public safety”47 and is often considered the
45 NENA website http://www.nena.org/?page=psap_staffingguide&terms=staffing 46 NENA website http://www.nena.org/?page=HR_ResourceList

Service Efficiency Review – Toronto Fire Services & Toronto EMS
Page | 171
North American industry benchmark with respect to fire service operations including
emergency call answering and dispatching. The applicable standard for PSAP operations is NFPA 1221-Standard for the Installation, Maintenance, and Use of Emergency Service Communications Systems. While 1221 speaks to the issue of PSAP staffing it does not prescribe the total number of staff positions; rather it states that “the AHJ (Authority Having Jurisdiction) shall ensure that there are sufficient telecommunicators available to effect the prompt receipt and processing of alarms needed to meet the requirements of Section 7.4”48. To this end, NFPA provides prescriptive performance targets with respect to the emergency call answering and dispatching of resources.49
Section 7.4 includes the following:
7.4.1 Ninety-five percent of alarms received on emergency lines shall be answered within 15 seconds, and 99 percent of alarms shall be answered within 40 seconds.
7.4.2 Ninety percent of emergency alarm dispatching shall be completed within 60 seconds, and 99 percent of alarm processing shall be completed within 90 seconds.50
During the time of the TFS Communications Centre review, the NFPA adopted the latest version of the 1221 standard (2013 edition) which has changed the performance measurement for emergency alarm dispatching. For purposes of comparison, the most current version of NFPA
1221 (2013) states the following for alarm processing:
7.4.1 Ninety-five percent of alarms received on emergency lines shall be answered within 15 seconds, and 99 percent of alarms shall be answered within 40 seconds.
7.4.2 With the exception of the calls types identified in Section 7.4.2.2, 80 percent of emergency alarm dispatching shall be completed within 60 seconds, and 95 percent of alarm processing shall be completed within 106 seconds.51
7.4.2.2 Emergency alarm processing for the following call types shall be completed
within 90 seconds 90 percent of the time and within 120 seconds 99 percent of
the time:
1. Calls requiring emergency medical dispatch questioning and pre-arrival instructions
2. Calls requiring language translation 3. Calls requiring the use of a TTY/TDD device or audio/video relay services
47 NFPA website http://www.nfpa.org/categorylist.asp?categoryid=143&url=about%20us 48 NFPA 1221 Section 7.3.1 49 NFPA 1221 Section 7.4 50 Refer to Appendix B 51 Refer to Appendix B

Service Efficiency Review – Toronto Fire Services & Toronto EMS
Page | 172
4. Calls of a criminal activity that require information vital to emergency
responder safety prior to dispatching units 5. Hazardous material incident 6. Technical rescue
The 2010 version of NFPA 1221 did not provide different performance measurements based on specific call types.
For purposes of this staffing analysis, alarm processing standards as per the 2012 version NFPA 1221 are considered. TFS’ current Quality Assurance program is based on the performance criteria of the 2010 version of the standard; therefore, these performance metrics are used to
ensure common and consistent comparison of current performance management.
5.1.5 Erlang Calculations
Erlang calculations are standardized, scientific-based telecommunications engineering calculations used extensively throughout industry, including public safety, to determine a number of unknown communications centre variables, such as the total number of telephone lines required or the total number of staff required in a call centre. A number of metrics are considered in Erlang calculations and the appropriate Erlang formula is selected based on the configuration of the centre.
As the TFS Communications Centre uses queuing technology for both the call taking and
dispatching activities, this analysis was completed using the Erlang C formula. Erlang C expresses the probability that calls may be queued as opposed to immediately being served. If all call takers or dispatchers are busy when an incident is presented, the call is queued. Erlang C calculates the probability of queuing calls, assuming that blocked calls or events stay in the system until they can be handled.
5.1.6 Metrics
The metrics used to assist in the determination of staffing levels at the TFS Communications Centre were provided by TFS:
Table 25 - Staffing Analysis Metrics
Staffing Analysis Metrics
Metric Value
1. Average annual total call volume (emergency and non-emergency calls) 241,813
2. Average annual total administration calls 147,821
3. Average annual total emergency calls 142,263
4. Average offer to answer time for non-emergency calls 4 seconds
5. Average offer to answer time for emergency calls 4 seconds
6. Average call taker time for non-emergency calls 41 seconds
7. Average weighted call taker time for various options52
: 7.1. All calls
46 seconds
52 10% of captain’s line call volume has been assumed in call taker loading

Service Efficiency Review – Toronto Fire Services & Toronto EMS
Page | 173
7.2. Administration calls excluded 7.3. Administration and TEMS calls excluded 7.4. TEMS calls excluded
54 seconds 57 seconds 46 seconds
8. Average total dispatch time 66 seconds
9. Target time to answer calls (percentile as per NFPA 1221-2010) 95% of calls in 15 seconds 99% of calls in 40 seconds
10. Target time to dispatch event (percentile as per NFPA 1221 - 2010) 90% of calls in 60 seconds 99% of calls in 90 seconds
TFS has indicated “our goal is to dispatch every call as it comes in”53. As such, in addition to the NFPA 1221’s performance metrics, an analysis was completed based on all calls (emergency and non-emergency) being answered as they “come in”.
5.1.7 Site Visit
A site visit was conducted of the TFS Communications Centre. During the time on site, District
Chief Pade provided a comprehensive overview of the centre’s operations. In addition, time was spent meeting with a call taker and a dispatcher in order to review these operations and question the staff on typical duties and any associated challenges. Lastly, a meeting was held with Division Chief Vera Maute and Executive Officer Scott Robinson.
Functional Role Descriptions
To ensure that all of the necessary tasks required of TFS Call Takers and Dispatchers were
considered as part of this analysis, functional job descriptions were requested and reviewed54. This was necessary to ensure that in addition to the standard responsibilities of each position being considered in the analysis there were no unique or specialized tasks that are required of TFS call takers or dispatchers.
A review of the functional role descriptions identifies that the tasks and responsibilities are typical of the industry. There are no tasks or responsibilities that are beyond the scope of normal operations and that would negatively affect their ability to answer and process emergency calls for service.
5.1.8 Staffing Analysis
An analysis of the current staffing levels for Call Takers and Dispatchers was completed using the Erlang C formula. The following table summarizes the results of the analysis:
53 Email from Division Chief Vera Maute dated September 13, 2012 54 The functional job descriptions of Call Taker and Dispatcher can be found in Appendix B

Service Efficiency Review – Toronto Fire Services & Toronto EMS
Page | 174
Table 26 - TFS Communications Centre Staffing Analysis
TFS Communications Centre Staffing Analysis
Call Takers
Shift Current Staffing
Levels Erlang C Calculated Staffing
Levels (NFPA 1221-2010) Comments
Option #1
Day 4 3 Includes 9-1-1 lines, fire emergency line, TEMS line, administration line and 10% of captain’s line call volume
Night 3 2
Option #2
Day 4 2 Includes 9-1-1 lines, fire emergency line, TEMS line, and 10% of captain’s line call volume. Administration line excluded.
Night 3 2
Option #3
Day 4 2 Includes 9-1-1 lines, fire emergency line, and 10% of captain’s line call volume. Administration line and TEMS line excluded.
Night 3 2
Option #4
Day 4 2 Includes 9-1-1 lines, fire emergency line, administration line, and 10% of captain’s line call volume. TEMS line excluded.
Night 3 2
Dispatchers
Shift Current Staffing
Levels Erlang C Calculated Staffing
Levels (NFPA 1221-2010) Comments
Day 6 4 Erlang calculated dispatcher staffing levels only consider the time required to process the alarm (call received to station alerted) and it does not account for the time required for ongoing communication and support of the responding unit(s).
Night 6 4
Various options of call taker work loading were analyzed, ranging from a high workload level of handling all of the current telephone activity (status quo) to a low of call takers only handling emergency calls (9-1-1 lines and the emergency direct line only plus an percentage of overflow from the captain’s line).
Erlang C calculations for the dispatch function only address the time required for the initial dispatch of an emergency event (the time from receipt of the emergency alarm until the fire
station(s) is alerted. However, it is important to consider that dispatchers are involved in ongoing communications and activities after the event has been dispatched, and this impacts the centre’s overall incident handling capacity. While there is no statistical data that measures the average time a dispatcher is committed to a call nor is there any industry standard or best practice information in this regard, a calculation of assumed dispatcher workload per hour was completed.
The time that a dispatcher is busy with ongoing communication and other activities directly related to the support of an emergency call varies greatly and is largely dependent on the nature of the incident. For events such as medical calls, there is typically minimal interaction between the incident commander and the dispatcher thereby allowing the dispatcher to pay
attention to other events and perform dispatch related functions. In contrast, for large events such as structure fires or hazardous materials incidents, a dispatcher may be dedicated to the

Service Efficiency Review – Toronto Fire Services & Toronto EMS
Page | 175
incident55 for an extended period of time and is therefore unavailable to dispatch any other
emergency calls. For purposes of determining dispatcher workload per hour, the analysis assumed an average of 180 seconds (three minutes) of dispatcher time required for medical calls and 600 seconds (ten minutes) for all other call types. Based on this analysis, a minimum of three (3) dispatchers are required for both day and night shifts in order to both meet the NFPA criteria for dispatch processing as well as perform the assumed workload per hour.
Due to the random nature of dispatcher support activities and to account for large scale incidents and instances of extreme dispatcher activity (e.g., severe weather events), our recommendation is that the minimum dispatcher staffing level be four (4) for both day and night shifts.
As noted above, during the time that the staffing analysis was being conducted, the National Fire Protection Association released a new version of NFPA 1221 (2013). The significant change with respect to performance management in the new version is a reduction of the percentile for dispatching emergency alarms. Prior to the 2013 version, this performance measurement was 90% of calls dispatched in 60 seconds and in the new version the percentile is 80%.
The dispatcher staffing analysis was re-evaluated in consideration of this performance management change and there is no change in the minimum number of dispatchers required.
5.1.9 Current Performance Measurement
TFS has adopted NFPA 1221 as the performance target for emergency call taking and
dispatching. However, we found that TFS has limited statistical data regarding its current performance management based on the NFPA 1221 90th percentile due to “a systemic problem causing a delay in the calltaker/dispatcher handoff”56. The identified issue was not resolved until a Computer Aided Dispatch upgrade was completed in the fall of 2011. After the upgrade was completed and all staff had become familiar with the appropriate operating procedures, performance management analysis and reporting was undertaken.
Based on the available data (January 2011 to May 2011), the average for alarm processing for TFS is 1:06 (one minute and six seconds). As per NFPA 1221 (2010), the prescribed threshold of
is “ninety percent of emergency alarm dispatching shall be completed within 60 seconds, and 99 percent of alarm processing shall be completed within 99 seconds.”
Table 27 – TFS Communications Centre Performance Management Summary
TFS Communications Centre Performance Management Summary
TFS Measured Average - 90th
Percentile
NFPA 1221 (2010) – 90th
Percentile
NFPA 1221 (2013) – 80th
Percentile
1:06 1:00 1:00
The dispatch performance management of the TFS Communications Centre – for the period examined – did not meet the 90th percentile requirement of the 2010 standard yet it would
55 NFPA 1221 Section 7.3.3 56 Email from Division Chief Vera Maute dated September 17, 2012

Service Efficiency Review – Toronto Fire Services & Toronto EMS
Page | 176
probably meet the 80th percentile requirement of the 2013 standard of NFPA 1221. TFS
calculates call taker and dispatcher performance based on a model of “all calls in” even though NFPA 1221 refers to the processing of emergency alarms57 and allows for the exclusion of non-emergency calls from quality assurance and performance management analysis.
5.1.10 Data Analysis Considerations and Limitations
Erlang C calculations are linear in their approach as they do not account for some of the unique operational situations that typically occur in public safety dispatch centres. Staffing analyses using Erlang formulas account for identifiable technical and mathematical probabilities associated to call centres. Erlang derived staffing levels are accurate and reliable when the considered variables are clearly quantifiable and measurable.
Considerations
In public safety call taking and dispatching, there are some variables that are not quantifiable yet they have an impact on Communications centre operations and standards of service. Accordingly, there are considerations and limitations that should also be considered, in addition to the Erlang C calculations, in order to understand the complexities of a public safety Communications centre and determine appropriate staffing levels to meet adopted performance standards.
The following have been considered:
Call volumes were calculated as an average using seven years of TFS published data
We noted that there appears to be a significant increase in administration calls starting in 2009.
Medical calls were excluded from the total of all events that lead to a dispatchable event. As these calls are transferred directly to the dispatch queue in the TFS Communications Centre, these events are not presented to the call takers and therefore do not add to their average total number of calls.
TEMS has noted that they will soon be starting to use the CAD to CAD interface for all
communication with TFS regarding medical calls; therefore, annual calls to TFS from
TEMS will significantly decrease.
Limitations
The following limitations must be noted in the staffing analysis:
Mass/multiple call events to the communications centre. The statistical data representing
total number of emergency calls processed in the communications centre only account for a single call being received to report the emergency. Mass calling to the communication centre will occur with significant events such as
large fires, motor vehicle crashes on highways, and other similar high-profile
57 Refer to Section 7.4.2 of NFPA 1221

Service Efficiency Review – Toronto Fire Services & Toronto EMS
Page | 177
emergency incidents. In many of these instances the communications centre can
receive very high number of emergency calls. Each call must be answered and the caller interrogated to determine if they are reporting the same incident and not, in fact, calling to report a new emergency event.
Multiple calling will occur during severe weather events such as wind storms or significant weather situations such as snow storms, freezing rain, etc. In these situations, multiple calls will be received in the communications centre reporting an exceptionally high number of emergency events. Often these are separate emergencies and not mass calling of the same event.
Erlang calculations only account for the resources required for the presentation of a call and the disposition of the call based on prescribed performance criteria. In fire service
communications, this involves: disposition of calls (emergency or non-emergency) by call takers involving call answer,
interrogation and call completion (termination of call or creation of an event for the dispatcher)
presentation of dispatch event to dispatcher and the notification of the event to the appropriate fire station(s)
Erlang calculations do not consider the multitude of tasks that are required of both dispatchers and call takers during an emergency incident. During an emergency incident, a dispatcher is required to perform several tasks in support of fire operations, thereby effectively removing the dispatcher from being available to participate in
another emergency event.
5.1.11 Fire Dispatch Survey
In order to help qualify appropriate minimum staffing levels for call takers and dispatchers for TFS, three Canadian fire services were surveyed: Vancouver Fire Rescue, Calgary Fire Department, and Ottawa Fire Department.
The departments were surveyed on total number of calls to their fire dispatch centres (emergency and non-emergency), call taker and dispatcher staffing levels, and the staffing
model used to determine these levels. The information is summarized in Table 28.
Table 28 – Summary of Peer Review Staffing Levels
Peer Review of TFS Communications Centre Staffing Levels
Department Total call volume
(2011) Call Takers Dispatchers Staffing Model
Toronto
Average Call Volume 241,813 4 6 NFPA 1221
Average Without Administration Calls
111,041
Vancouver Fire Rescue 44,388 Shared 2
Calgary Fire Department 47,968 Shared 2 NFPA 1221
Ottawa Fire Services 85,382 3 3 NFPA 1221

Service Efficiency Review – Toronto Fire Services & Toronto EMS
Page | 178
Vancouver Fire Rescue is dispatched by EComm (Emergency Communications for Southwest
BC), a multi-jurisdictional agency that provides primary 9-1-1 call answer as well as emergency dispatch and communications for 30 police and fire agencies throughout south-east British Columbia. As part of the EComm operational model, Vancouver Fire Rescue is dispatched by two dedicated dispatchers while call taking is handled by shared call takers.
Calgary Fire Department is dispatched by the City of Calgary’s Public Safety Communications (PSC) unit. As part of the City of Calgary’s PSC operational model, Calgary Fire Department is dispatched by two dedicated dispatchers while call taking is handled by call takers who work for PSC. In late 2012, the dispatch staffing model was increased to two dedicated dispatchers as previous to this Calgary Fire Department had one dedicated dispatcher.
Ottawa indicates that it tries to maintain a staff of 6 between 07:00hrs to 17:00hrs, Monday to Friday and part-time dispatchers are used in a replacement role. When fully staffed with 7 positions, there are 3 call takers, one supervisor and three dispatchers. When staffing is at 6, there are two call takers, one supervisor and three dispatchers and, when at minimum staffing of 5, one call taker, one supervisor and three dispatchers.
5.1.12 Conclusion – TFS Call Taker and Dispatcher Staffing Levels
Our analysis of existing call taker and dispatch staffing levels indicates there is available capacity in both areas.
Communications Centre Technology
POMAX personnel reviewed the use of technology in the TFS and Emergency Medical Services communications centres, looking for potential efficiencies and savings in the application, implementation, and ongoing maintenance of systems.
We determined that there are three primary models, or options, for communications technology, each of which is driven by the potential organizational and operational design of the two communications centres. The capital and maintenance cost of these options may also influence the operational design of the communications centres.
Option 1: Consolidate into a single centre with combined operations in a shared room with shared technologies and common computer aided dispatch (CAD). Implementation would be
done in a single conversion. This cost of this option has been estimated over five years including annual maintenance (Please see Table 30 – Technology Financial Options).
Option 2: Separate dispatch centres but with shared technology with possible graduated progression to a fully consolidated centre.
Option 3: The existing organizational and operational configuration would continue with separate dispatch centers, technology would not be shared – except the radio system as noted below – but two additional dispatcher consoles and a minimum of one call taker console would be added to the TEMS communications centre to accommodate additional staff that may be negotiated with the Ministry of Health and Long Term Care. These positions are physical seats
and desk space. They should not be confused with full time equivalents. The additional physical

Service Efficiency Review – Toronto Fire Services & Toronto EMS
Page | 179
positions do not become a factor in considering costs if MOHLTC agrees to pay for the
technology and positions as part of staffing increases.
Options 1 and 2 involve the consolidation of technology platforms in order to improve communications between the dispatch centres, cost avoidance for new technology upgrades, and cost savings through reduction in annual operating and personnel costs.
Since there is currently a shared radio system, and plans to migrate to a new radio system that is shared by all public safety agencies, we did not review the use of the radio system other than to consider that the voice logging recorder equipment will be replaced under that project.
The technologies considered include the following:
Computer Aided Dispatch (CAD)
Telephony
Recording Systems
5.1.13 Computer Aided Dispatch (CAD)
Toronto’s Fire Service and Emergency Medical Services use Tier 1 CAD systems (Intergraph and TriTech58 CAD respectively), that have large client bases of EMS, fire and combined EMS/Fire dispatch operations. Either product could be utilized effectively to support fire and EMS operations on the same platform in an amalgamated dispatch operation or shared technology; however, there are a number of factors to be considered.
We also considered the possibility of adding EMS and fire to the Intergraph CAD system used by the Toronto Police Service because of possible benefits such as economy of scale, or the electronic exchange of information between police, fire, and EMS. However, because of security considerations, police services rarely allow non-police access to their CAD and maintain dispatch platforms separate from other organizations. For example, the City of Calgary had an initiative in place that intended to have police, fire, and EMS housed in one dispatch centre with all communications staff being able to dispatch all emergency services. Throughout that initiative Calgary Police Services maintained a separate CAD system. The initiative did not come to fruition and the three organizations, while housed in the same dispatch room, operate as separate entities.
Both Intergraph and VisiCad have a large number of clients operating fire and EMS communications centers, and either product would work well in the scenarios outlined in options 1 or 2. Our next step was to consider the number of interfaces that each system has and the resource effort that would be required to port those interfaces to the other platform.
Based on experience working with both vendors in numerous locations including Alberta Health Services; the Province of Ontario; EMS in the Regions of York, Durham, Peel, Halton, the County of Simcoe; Edmonton Fire; Vancouver (E-Comm); BC Ambulance; and others, POMAX’s experience is that TriTech is more open to the type of customization and interface development that has been done by TEMS. Intergraph tends to develop all its interfaces on a time and
58 TriTech’s computer aided dispatch is also known as VisiCAD

Service Efficiency Review – Toronto Fire Services & Toronto EMS
Page | 180
materials basis and does not support clients’ in-house interface development. Moreover there
are multiple CAD associated external interfaces in use at EMS that would have to be built into the Intergraph installation if EMS were to use Intergraph CAD. TFS has comparatively fewer interfaces to the EMS CAD platform, fire RMS (record management system) and MOSCAD (Motorola Supervisory Control and Data Acquisition) for fire hall alerting.
TFS Interfaces
MOSCAD
Fire Link and Sun Pro message server to link to the fire record management system
iMobile with integrated GPS
TEMS Interfaces
Locution Station/Vehicle Alerting
Alert Line (medical alarm monitoring)
First Watch (performance monitoring against key performance indicators)
Avtech Internet Protocol (IP) telephony
GPS interfaces
Patient Distribution System
Optima (Siren Live Deployment and Siren Live Dispatch) *
Seamless dispatch/vehicle transfer (Future) ** * Optima Corporation’s real-time products include Siren Live Deployment and Siren Live
Dispatch. The latter product was primarily developed for Toronto and is intended to assist dispatchers by recommending vehicle assignments. Siren Live Deployment is software that monitors the status of resources as well as historical call volume by day of week and time of day and then uses predictive analytics to forecast changes in the system over the next 20 minutes to assist dispatchers with best possible coverage decisions with least possible vehicle movement.
** Ambulance communications centres (ACS) and Central Ambulance Communications Centres59 (CACC), surrounding Toronto use a customized version of the TriTech CAD. The principal customization was around 'seamlessness' which allows any ambulance
communications centre to receive and generate an incident and send it electronically to
another ACS thus providing 'seamless' ambulance service and vehicle following (tracking and monitoring). Although TEMS’ communications centres do not yet have the facility to participate in this form of electronic information exchange, it is expected to do so in the future although a target date is not yet firm. Seamlessness is considered a critical component to providing ambulance services in Ontario.
This application can also facilitate the handling of calls along the municipal border of Toronto. In some circumstances, an ambulance emergency call can be routed to a communications
59 Central Ambulance Communication Centres are operated by the Ontario Ministry of Health and Long Term Care; Ambulance Communications Centres are operated by municipalities or other non- Ministry of Health organizations (e.g. Toronto, Niagara Region, Kingston-Frontenac, etc.). Both CACCs and ACSs perform the same functions and use the same or similar equipment. Except for some minor variances, both CACCs and ACS are fully funded by MOHLTC.

Service Efficiency Review – Toronto Fire Services & Toronto EMS
Page | 181
centre that is not the one responsible for the geographic area in which an emergency occurs.
This could be due to the caller contacting emergency services on behalf of a family member in another municipality, a cell phone call, or other reason. In such circumstances, ‘seamless functionality’ permits the dispatch centre receiving the call to take all pertinent information – as if it was the dispatch centre responsible for the geographic area of the incident – and electronically transfer the information to the correct dispatch centre. Without ‘seamless functionality’ the dispatch centre receiving the call would have to take information from the caller, telephone the responding dispatch centre, and verbally transfer the information which would use up valuable minutes. ‘Seamless functionality’ still results in delays of several seconds to a minute on individual calls but is much superior to a manual transfer of information.
Another feature of electronic seamlessness is the ability to transfer vehicle and patient information from one dispatch centre to another. For example, in a situation where a patient is transferred from Mississauga General to St. Michael’s Hospital in Toronto, the Mississauga CACC could transfer vehicle information and dispatch-level patient information to the VisiCAD system at TEMS. TEMS could monitor and track the status of that vehicle as it completes the call. Similarly when a Toronto vehicle takes a patient to a surrounding jurisdiction, the CACC in that jurisdiction could update the dispatch records, saving time and resources for TEMS in the completion of the dispatch record.
An additional TriTech advantage is that it has an established interface to Locution, an automated alerting system that provides computer generated spoken alerting instead of a
dispatcher having to enunciate call information to responders. This saves dispatcher time which, on a per call basis isn’t substantial, but is cumulative. Locution’s traditional install base is fire departments, including some locations in Canada, such as Vancouver and Edmonton, which means that it could be implemented at Toronto’s fire stations. The installation of Locution would also solve another problem faced by TFS. Currently, the TFS crew alerting system operates on a consecutive alert basis. This means that when several stations have to be alerted to respond to an incident, each station is notified consecutively so delays in responses occur since the last station may be notified 20 to 30 seconds after the first station. Locution is capable of concurrent notification thus possibly reducing overall response times of a full complement of
firefighters and apparatus.
Factors to consider in deciding on an acceptable CAD are outlined in Table 29 - Computer Aided Dispatch Considerations.
Table 29 - Computer Aided Dispatch Considerations
CAD Pro Con
TriTech The Ministry of Health pays for a significant portion of the capital and operational budget
Future plans are to achieve ‘seamlessness’ with Ontario’s other CACCs and ACSs to support handover of vehicle and call data on transfers into and out of the city
There are more systems interfaced to the EMS CAD than the Fire CAD
Able to add fire halls to Locution Alerting System,
No local support staff
US vendor so all payments in US funds (although that is less of a problem with the dollar at or close to par)
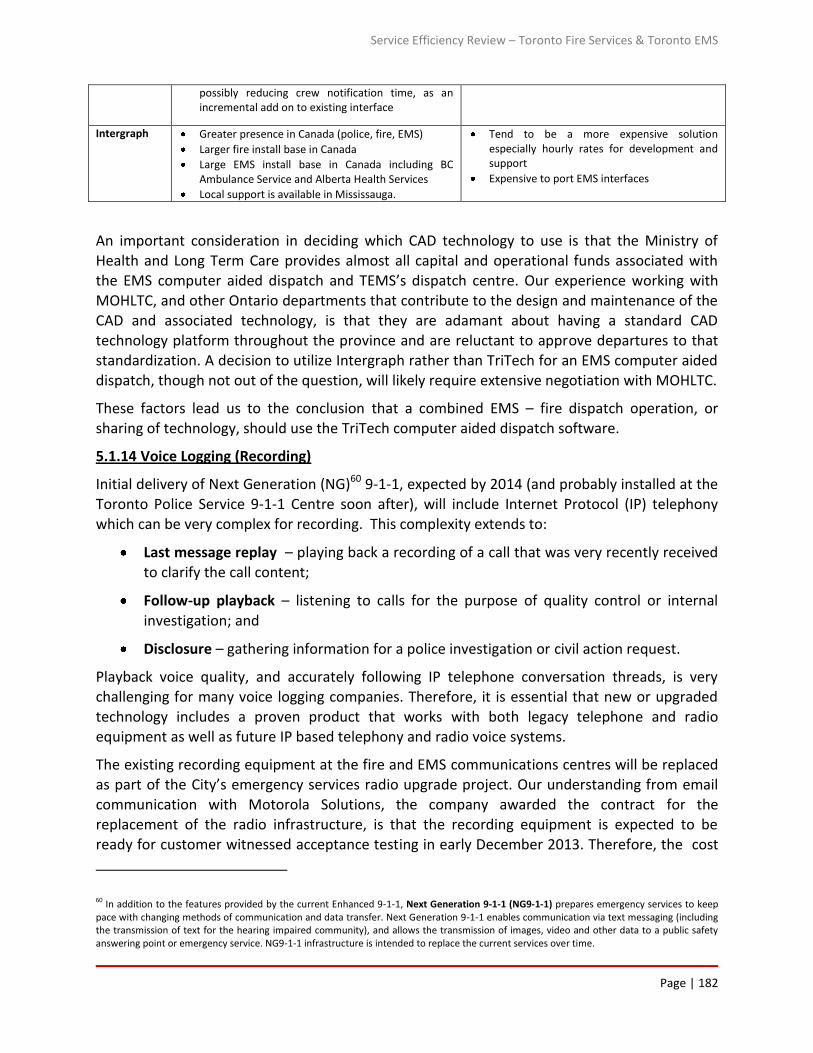
Service Efficiency Review – Toronto Fire Services & Toronto EMS
Page | 182
possibly reducing crew notification time, as an incremental add on to existing interface
Intergraph Greater presence in Canada (police, fire, EMS)
Larger fire install base in Canada
Large EMS install base in Canada including BC Ambulance Service and Alberta Health Services
Local support is available in Mississauga.
Tend to be a more expensive solution especially hourly rates for development and support
Expensive to port EMS interfaces
An important consideration in deciding which CAD technology to use is that the Ministry of Health and Long Term Care provides almost all capital and operational funds associated with the EMS computer aided dispatch and TEMS’s dispatch centre. Our experience working with
MOHLTC, and other Ontario departments that contribute to the design and maintenance of the CAD and associated technology, is that they are adamant about having a standard CAD technology platform throughout the province and are reluctant to approve departures to that standardization. A decision to utilize Intergraph rather than TriTech for an EMS computer aided
dispatch, though not out of the question, will likely require extensive negotiation with MOHLTC.
These factors lead us to the conclusion that a combined EMS – fire dispatch operation, or sharing of technology, should use the TriTech computer aided dispatch software.
5.1.14 Voice Logging (Recording)
Initial delivery of Next Generation (NG)60 9-1-1, expected by 2014 (and probably installed at the
Toronto Police Service 9-1-1 Centre soon after), will include Internet Protocol (IP) telephony which can be very complex for recording. This complexity extends to:
Last message replay – playing back a recording of a call that was very recently received to clarify the call content;
Follow-up playback – listening to calls for the purpose of quality control or internal
investigation; and
Disclosure – gathering information for a police investigation or civil action request.
Playback voice quality, and accurately following IP telephone conversation threads, is very challenging for many voice logging companies. Therefore, it is essential that new or upgraded
technology includes a proven product that works with both legacy telephone and radio equipment as well as future IP based telephony and radio voice systems.
The existing recording equipment at the fire and EMS communications centres will be replaced as part of the City’s emergency services radio upgrade project. Our understanding from email communication with Motorola Solutions, the company awarded the contract for the replacement of the radio infrastructure, is that the recording equipment is expected to be ready for customer witnessed acceptance testing in early December 2013. Therefore, the cost
60 In addition to the features provided by the current Enhanced 9-1-1, Next Generation 9-1-1 (NG9-1-1) prepares emergency services to keep pace with changing methods of communication and data transfer. Next Generation 9-1-1 enables communication via text messaging (including the transmission of text for the hearing impaired community), and allows the transmission of images, video and other data to a public safety answering point or emergency service. NG9-1-1 infrastructure is intended to replace the current services over time.

Service Efficiency Review – Toronto Fire Services & Toronto EMS
Page | 183
of recording equipment for existing fire and EMS dispatch positions is already captured within
the radio system replacement project, but it does not include the cost of two additional dispatcher positions (option 3) since this was not anticipated at the time of the Motorola contract award.
5.1.15 Telephony
As noted in the voice logging section, next generation (NG) 9-1-1 will include voice over IP. The Toronto Police Service and the 9-1-1 centre will be on the leading edge of this deployment by 2014, which means that to avoid the need for additional interfaces to transition from the police (9-1-1) IP system to a conventional or legacy telephone system – particularly at the fire communications centre – both TFS and the TEMS will need to have IP telephony in place. TEMS
uses a Computer Telephony Interface61 (CTI) system, manufactured by a company called Avtec, that is partially IP based, but the fire service employs a traditional Nortel Option 61 Private Branch Exchange62 (PBX) that is not CTI or IP based. TEMS, via a relatively simple incremental upgrade to the Avtec system, can make it fully IP and the fire service can then utilize the same telephone switch rather than purchasing a new, separate unit.
So, if we assume that a consolidation of Fire and EMS Dispatch would use a TriTech CAD that TFS and TEMS will go onto an upgraded NICE63 logging system, and that TFS will join the TEMS Avtech telephony platform then two consolidation options are available:
Option 1: Consolidate into a single centre (EMS location) with combined operations in a shared
room with shared technologies and common CAD. Implementation would be done in a single conversion. This option has been calculated over five years with annual maintenance.
Option 2: Separate dispatch centres but with shared technology with graduated progression. Two additional EMS positions (year 1); step by step implementation of each primary technology for fire; expect primary technologies in need of urgent attention (the TFS phone system, voice logging recorders) would be shared first (year 1) and other technologies (i.e. CAD, Mobile) would be shared later (year 3). Physical consolidation of the communications centres would not be part of this scope; however, with an increase in shared technologies some barriers to consolidation would be removed. This option does not include costs of new workstations for
fire as it does not consider the relocation to EMS. This option has been calculated over five
years with annual maintenance.
Note that these costs (shown in Table 30 – Technology Financial Options) are the one-time costs for primary technologies and their related annual support/maintenance costs and therefore do not include internal implementation costs (project management, support/IT Staff) or base infrastructure impact costs (i.e. internal networks, building modifications.)
61 Computer telephony interface is the use of computers to manage telephone calls. 62 Private Branch Exchange: A private branch exchange (PBX) is a telephone exchange that serves a particular office, as opposed to one that a common carrier or telephone company operates for many businesses or for the general public. 63 Neptune Intelligence Computer Engineering (NICE) Systems Ltd. specializes in telephone voice recording, data security, and surveillance as well as systems that analyse this recorded data and metadata. The company serves various industries, such as financial services, telecommunications, healthcare, outsourcers, retail, media, travel, service providers, and utilities.

Service Efficiency Review – Toronto Fire Services & Toronto EMS
Page | 184
Assumptions:
1. Primary technologies are:
a. CAD (VisiCAD) – Based on total costs for 12 or 14 seats with test seats (used by developers to test changes (5 seats), training (5 for dispatch, 5 for mobile), disaster recovery and production environments). This increase in physical seats and desk space may require renovations to the EMS communications centre or, possibly, a physical separation between call takers and dispatchers. For example, call takers could utilize the space in the current TFS communications centre while dispatchers are housed in the EMS communications centre space.
b. Mobile software for crew use (VisiNet Mobile)
c. Voice Logging (NICE) (Option 2 includes 2 new logging recorder positions for EMS)
d. Phones (AVTec) (as this is required for each option, option 1 will require 12 new and option 2 will require 14)
e. Console furniture (one per new workstation at EMS. Option 1 will require 12 new for Fire at EMS location and Option 2 will only require 2 new for EMS)
f. ALERT line (one per workstation as all can operate as call takers)
g. Decision Support (Optima) (EMS dispatchers only) Only 2 additional in each option
h. Medical Protocol Software (ProQA) (All positions)
i. No Fire ProQA
j. Backup voice radio for dispatcher positions (1 per dispatcher) in case the main radio system fails
k. CAD environments include TEST (5 licenses), TRAINING (5 licenses) and DR (Disaster Recovery) which require a full set of additional licenses.
2. All existing dispatch servers are capable of supporting the addition of 12 fire CAD
workstations and would not need to be replaced until the next scheduled replacement date. Therefore, no replacement server hardware costs have been included.
3. Option 1 includes small efficiency gains through call taker consolidation that will allow EMS to achieve additional dispatch resources without adding staff.
Note: The next major release for Intergraph’s iMobile software is a new product called Mobile for Public Safety. It will require retraining of existing users so that would be a logical time to migrate from iMobile to the TriTech VisiNet Mobile, for which the licence cost is essentially 50% less expensive. For the 174 Fire mobiles there is a savings of $172,260 on the software licences ($990 savings per licence).

Service Efficiency Review – Toronto Fire Services & Toronto EMS
Page | 185
Table 30 – Technology Financial Options
Option 1 – Full Consolidation Option 2 – Shared Technology
One Time Annual Maintenance over 5 Years
One Time Annual Maintenance over 5 Years
Tritech CAD and Visinet Mobile for Fire $712,745 $517,875 $733,745 $333,825
Locution $738,000 $203,650 $738,000 $122,190
ProQA $34,800 $31,320 $5,800 $5,220
Workstations $372,000 $93,000 $62,000 $15,500
ALERT $10,200 $9,180 $1,700 $1,530
Backup Radio $18,000 $16,200 $3,000 $2,700
Decision Support $1,200 $1,080 $189,000 $170,100
$1,886,945 $872,305 $1,733,245 $651,065
Option 2, shared technology, is approximately $153,000 less expensive in capital costs (one time), and approximately $200,000 less expensive in ongoing maintenance costs over a 5-year period than option 1, full consolidation.
5.1.16 Examining the Options and Feasibility of Consolidation
Our calculations of required fire service call taker and dispatcher staffing indicates that, to meet NFPA 1221 performance guidelines for the existing call taking model, the minimum number of call takers required is three during peak daytime periods and two at night. That’s a reduction of
one complement position 24 hours a day.
Our calculation of TFS staff levels required for dispatching indicates that 3 dispatchers are required 24 hours a day. But, due to the random nature of dispatcher support activities and to account for large scale incidents and instances of extreme dispatcher activity (e.g. severe weather events), we recommend that the minimum dispatcher staffing level should be four for both day and night shifts. This is two less than the current complement of 6 dispatchers 24 hours a day.
Option 1: Consolidate the TEMS and TFS communications centres
The result of this analysis indicates that 3 call taker – dispatcher staff positions could be
reduced in the TFS communications centre resulting in an annual saving of $1.3 million when benefits and paid absences are taken into account (Table 31). In an amalgamated EMS – fire communications centre option these 3 complement could offset 3 positions required by emergency medical services. However, since the Ministry of Health and Long Term Care funds 100% of the TEMS communication centre staff cost, consolidating fire and EMS communications and using fire complement positions to offset needed staffing for EMS would really result in Toronto assuming some of the cost of a currently fully funded communication centre.

Service Efficiency Review – Toronto Fire Services & Toronto EMS
Page | 186
Table 31 - TFS Staff Complement Cost Recovery
Staff hrs/day days total hours
FTE Salary Annual Result
Paid Absences
%
Paid Absences
$
Benefits 27.2%
Total Cost
3 24 365 26280 12 $75,000 $902,473 25% $225,618 $245,473 $1,373,563
Option 2: Consolidate the communications centres and reduce staff levels at the fire communication centre as a separate action
Another option would be to reduce the staff levels at the TFS communication centre as well as consolidating the two dispatch centres. This would result in an annual saving of over $1.3
million in TFS staff cost, but there would be no obvious operational or monetary benefit directly related to consolidating the 2 centres.
Option 3: Continue with separate communications centres but share technology and infrastructure
A third option would be to continue with separate communication centres, reduce the TFS communications staffing levels thus saving approximately $1.3 million a year, and share technology platforms whenever possible. For example, when it is time to upgrade the fire service’s Intergraph computer aided dispatch, Toronto should assess the possibility of sharing the EMS computer aided dispatch platform to see if it is possible to reduce forward technology costs. This option may be possible if it does not impose on the Ministry of Health and Long
Term Care concerns about a standard EMS CAD platform across Ontario. Other systems such as Decision Support and Locution may also be able to be implemented by TFS at a reduced cost. Savings could also be realized by TFS utilizing the EMS telephone platform.
Option 4: Continue with separate communications centres, share technology and infrastructure; generate revenue to offset TFS staff costs
A fourth option is similar to option 3 except there would be no staff reduction in the fire communications centre except perhaps through attrition. Instead, TFS could consider revenue generation in the form of offering call taking and dispatch services to other municipalities. A
number of municipalities in the Greater Toronto Area and further afield are seeking ways to
reduce costs, often by outsourcing their dispatch function. The City may want to consider reducing costs by increasing revenue. The concept does raise some labour relations considerations as do any of these options other than the status quo.
5.1.17 Other Considerations in Consolidation
There are factors other than technology and staffing that have to be taken into account when considering the possibility of consolidation. For example, in Toronto, the amalgamation of fire and EMS communications centres would bring together two different union groups performing the same job, with slightly different pay scales and substantially different working condition agreements. Experience at other communications centres, where these issues were not
resolved before amalgamation, has shown that it was a point of contention for many years.

Service Efficiency Review – Toronto Fire Services & Toronto EMS
Page | 187
Consolidation of the two centres could also precipitate opening negotiations with Emergency
Health Services Branch of the Ministry of Health and Long Term Care with respect to a new shared funding model.
We also recognize that consolidations are monetarily successful when reductions in staff costs offset initial infrastructure and technology costs, and thereafter reduce costs compared to operating more than one communications centre. In this case, some staff reductions can be accomplished without consolidation, as can sharing of infrastructure and technology. Since consolidations are often hampered by labour relations issues that can continue for a substantial period of time (10 to 15 years is not uncommon), consolidation should not be a consideration if similar cost reduction can be achieved in a less intrusive manner.
Finally, we have not considered here the possible reduction of information technology or other support staff in the case of a full consolidation. Even though it is probable that some form of support staff rationalization could take place within 3 to 5 years, the actual positions are not easily identifiable and there would probably be reasonable counterpoints to support staff reduction. For example, moving fire to a different technology platform will require appropriately qualified project staff for approximately 2 years. Nevertheless even a shared technology initiative, as we have described in this chapter, would likely result in eventual reduced technology support staff needs.
One other factor has to be taken into account and that is, in a consolidated model, there should be the eventual rationalization of supervisory positions from the current levels. For example,
would all EMS communications centre supervisor and fire communications captain positions be required in a consolidated communications centre? Probably not, and it is possible that 30% or more of the positions could eventually be reduced. However, history at other consolidated communications centres shows that it is likely to be several years before a consolidated centre functions at a high enough level to allow the reduction of supervisory positions. Therefore, this possibility was not factored into the overall equation. Also, the issue of negotiating a new funding model with the Ministry of Health must be kept in mind. The MOHLTC would probably also want to benefit from reduced costs resulting from a consolidated dispatch model.
5.1.18 Observations and Conclusions
As we noted in the introduction of this section, the feasibility of consolidating the fire and EMS dispatch centres has to be examined from the perspectives of staff levels, technology, funding, organization, and operation. We indicated that a negative report on any one or two of these areas could negate the feasibility of consolidation.
Our assessment indicates that the benefits of consolidating the currently separate fire and emergency medical service centres can be achieved without consolidation. In fact, consolidating the centres will precipitate the negative effects of labour relations issues, and the possibility of opening up communications centre funding negotiations with the Ministry of Health and Long Term Care.

Service Efficiency Review – Toronto Fire Services & Toronto EMS
Page | 188
The two communications centres are already housed in the same building, use the same radio
communications system and other infrastructure, and have an opportunity to reduce future technology costs, particularly in the fire service, by building onto existing EMS technology platforms.
5.1.19 Recommendations
Do not move to a full operational consolidation of the TFS and TEMS communications centres but evaluate sharing technology platforms when upgrading emergency services communications technology.
Evaluate opportunities for the TFS communications centre to provide service to other
municipal fire departments to generate revenue and offset costs.
Advocate with the Ministry of Health and Long Term Care for acceptable staff levels for
the TEMS communications centre.

Service Efficiency Review – Toronto Fire Services & Toronto EMS
Page | 189
NFPA Alarm Time Line
2010 Version
2013 Version

Service Efficiency Review – Toronto Fire Services & Toronto EMS
Page | 190
6.0 Jurisdictional Comparison
The intent of jurisdictional comparators is to determine if there are practices or benchmarks in other municipalities that may be locally beneficial to either TFS or TEMS.
Several potential comparator municipalities were discussed with both fire and EMS. The fire service chose Houston, Chicago, and Edmonton as comparable municipalities. Responses to our contact and survey inquiries were received from Houston and Edmonton but Chicago declined. TEMS felt that international locations would provide information most applicable to TEMS. Surveys were sent to New South Wales Ambulance, and Ambulance Victoria in Australia, and
direct inquiries were made to personal contacts in the United Kingdom.
The survey results can be found on the following pages. They are interesting and probably most useful to fire and emergency medical service professionals in comparing response criteria. For example, Houston responds to a reported high rise fire with 6 pumpers, 4 aerials, 4 District Chiefs, 1 BLS ambulance, 1 ALS ambulance, and 1 Safety Officer, whereas Toronto responds with 2 pumpers, an aerial, a rescue or a squad, one other apparatus, and a District Chief. On the other hand, Houston sends one apparatus to a report of an alarm but Toronto sends 3 apparatus. The survey response detail can be found in Appendix A – Detailed Jurisdictional
Comparison.
The benefits of emergency medical services information from Australia may not be significant.
The Australian organizations are substantially larger with respect to area covered and population base – they respond to urban, rural, and remote environments – and employ approximately 4,000 staff each.
Information from the Ambulance Trusts of England was provided to us in their standard report form rather than in the survey format, and is included in tables in this section. Please note that statistical information from the Ambulance Trusts of England shows the month of June 2012 only whereas all other tables provide annual statistics.
Of interest is Table 39 in this section which indicates the proportion of incidents managed
without the need for transport to an Accident and Emergency Department. This table
represents efforts being made by the Ambulance Trusts to treat patients in their residences or on scene, where appropriate, rather than transporting to hospital. This is similar to one of Toronto’s initiatives with the Community Paramedicine Program. On average, throughout England, approximately 35% of patients are treated without needing to be transported to an Accident and Emergency Department. This practice, where appropriate, reduces the pressure on ambulance resources with respect to transportation time, hospital wait times, and emergency department patient load.
Comparison highlights for Houston, Edmonton, Ambulance Victoria, Ambulance New South Wales, and Toronto are shown in Table 32 to Table 37 in this section. The United Kingdom ambulance information for England can be found in Table 38 to Table 39 in this section. The
detailed survey information for Houston, Edmonton, Ambulance Victoria, and Ambulance New South Wales can be found in Appendix A - Detailed Jurisdictional Comparison.

Service Efficiency Review – Toronto Fire Services & Toronto EMS
Page | 191
6.1.1 Survey Results
Table 32 - Jurisdictional Comparators - Population, Area, and Service Type
Area (KM2) Population Service Type Notes
Toronto 641 2.79 million Separate fire and EMS
Houston Fire - EMS 1,554 2.1 million Combined fire - EMS
Edmonton Fire 700 817,500 Fire
Ambulance Victoria 227,490 5.575 million EMS State wide
Ambulance New South Wales 801,600 7.25 million EMS State wide
Table 33 Jurisdictional Comparators - Staff Levels
Full Time Equivalents Front Line Firefighters Paramedics Notes
Toronto Fire 3,182.3 2,786
Houston Fire - EMS 3,970 1,726 450
Edmonton Fire 1,117 951
TEMS 1,220.5 933
Ambulance Victoria 3,826 2,725
Ambulance New South Wales 4,241.8 3,231.4
Table 34 - Jurisdictional Comparators - Budget
Budget Notes
Toronto Fire $370,125,800 2012 Approved
Houston Fire - EMS $433,218,000 For Emergency Response (including fire and EMS): $326,508,622
Edmonton Fire $166,137,000 Net of Revenue
TEMS $174,487,500 2012 Approved
Ambulance Victoria $572,620,000 2011-2012 in Australia dollars (AUD and Canadian dollar are at par)
Ambulance New South Wales $690,000,000 2011-2012 in Australia dollars (AUD and Canadian dollar are at par)

Service Efficiency Review – Toronto Fire Services & Toronto EMS
Page | 192
Table 35 - Jurisdictional Comparators - Stations
Stations Notes
Toronto Fire 84
Houston Fire - EMS 92 84 ambulances are housed at fire stations – supported by private ambulance services
Edmonton Fire 26
TEMS 45
Ambulance Victoria 246
Ambulance New South Wales 226
Table 36 - Jurisdictional Comparators - Incidents
EMS Incidents Fire Incidents Other Incidents Notes Toronto Fire 86,380 58,954
Houston Fire - EMS 230,605 46,200
Edmonton Fire 36,384 9,104 (structural fires, non-structural fires, and alarms)
TEMS 217,190
Ambulance Victoria 489,857
Ambulance New South Wales 865,725
Table 37 - Jurisdictional Comparators – Response Time – Call Receipt to Arrive at Incident
Fire Suppression Emergencies 90
th
Percentile (mm:ss)
Fire Suppression Emergencies
Average (mm:ss)
EMS Emergencies 90
th Percentile
(mm:ss)
EMS Emergencies Average (mm:ss) Notes
Toronto Fire 7:39
Fire and EMS responses combined
Houston Fire - EMS 11:24 7:25 10:57 Not Reported Minutes and Seconds
Edmonton Fire 8:30 5:47 See details Not Reported
TEMS 10:54 Echo 13:18 (Delta)
Ambulance Victoria 22:04 13:26 Statewide
Ambulance New South Wales 20:27 10:70 Sydney only

Service Efficiency Review – Toronto Fire Services & Toronto EMS
Page | 193
6.1.2 Ambulance Trusts in England
Table 38, below indicates the performance parameters for Red 1 EMS incidents at various Ambulance Trusts in England. Red 1 calls are very similar to EMS Echo calls in Toronto. In England, Red 1 calls are described as “… the most time critical, and cover cardiac arrest patients who are not breathing and do not have a pulse, and other severe conditions such as airway obstruction”. The Department of Health in England notes that Red 1 patients account for less than 5% of all calls, similar to most areas of North America and Toronto.
The target response time for Red 1 calls, from the time the call for assistance is received by the ambulance call taker (known as Call Connect), until a paramedic arrives at the incident is 8 minutes, in 75% of cases. The paramedic arriving within 8 minutes does not have to be in a transport capable ambulance but a transport capable ambulance is expected to arrive within 19 minutes 75% of the time. Fire does not respond to medical calls in most areas of England.
Table 38 - Ambulance Trusts in England - Red 1 Call Performance (Echo) – June 2012 Statistics
Name
Number of Red 1 calls
resulting in an
emergency response
Number of Red 1 calls
resulting in an
emergency response
within 8 minutes
Proportion of calls
responded to
within 8 minutes
95th percentile of time from
Call Connect of a Red 1 call to an
emergency response arriving at
the scene of the incident
England 10,376 7,825 75.4% -
East Midlands Ambulance Service NHS Trust 2,109 1,637 77.6% 14.4
East of England Ambulance Service NHS Trust 788 561 71.2% 15.3
Great Western Ambulance Service NHS Trust 542 424 78.2% 13.4
Isle of Wight NHS Trust 17 12 70.6% 11.3
London Ambulance Service NHS Trust 1,191 898 75.4% 16.4
North East Ambulance Service NHS Trust 220 169 76.8% 12.2
North West Ambulance Service NHS Trust 2,486 1,882 75.7% 15.4
South Central Ambulance Service NHS Foundation Trust 423 306 72.3% 17.0
South East Coast Ambulance Service NHS Foundation Trust 419 296 70.6% 16.7
South Western Ambulance Service NHS Foundation Trust 226 154 68.1% 15.0
West Midlands Ambulance Service NHS Trust 507 406 80.1% 12.2
Yorkshire Ambulance Service NHS Trust 1,448 1,080 74.6% 13.8

Service Efficiency Review – Toronto Fire Services & Toronto EMS
Page | 194
Table 39, below, shows the number of EMS calls in June 2012 where patients were given telephone advice, or treated at the
scene, and then went to a location other than an emergency department. Column 7 indicates the percentage of patients treated without need for transport to an Accident and Emergency Department. One of the objectives of Toronto’s Emergency Medical Services is to eventually reduce the number of patient responses and transports to hospital, where appropriate, or the growth of patient responses and transports to hospital, through the Community Paramedicine Program and other practices.
Table 39- Ambulance calls closed with telephone advice or managed without transport to Accident and Emergency (where clinically appropriate) - June 2012 Statistics
1 2 3 4 5 6 7
Name
All emergency calls
that receive a
telephone or face-to-
face response from
the ambulance
service
Number of calls
resolved by telephone
advice
Proportion of calls
closed by
telephone advice
All emergency calls
that receive a face-to-
face response from
the ambulance service
Number of patients
discharged after treatment at
the scene or onward referral
to an alternative care pathway
and those with a patient
journey to a destination other
than Type 1 or 2 A&E
Proportion of incidents
managed without need for
transport to Accident and
Emergency department
England 519,277 31,435 6.1% 511,930 181,587 35.5%
East Midlands Ambulance Service NHS Trust 50,216 3,494 7.0% 46,669 18,834 40.4%
East of England Ambulance Service NHS Trust 56,318 3,956 7.0% 57,916 26,640 46.0%
Great Western Ambulance Service NHS Trust 17,949 1,725 9.6% 16,657 8,018 48.1%
Isle of Wight NHS Trust 1,730 134 7.7% 1,596 748 46.9%
London Ambulance Service NHS Trust 93,032 5,048 5.4% 87,984 28,225 32.1%
North East Ambulance Service NHS Trust 27,185 992 3.6% 26,887 8,444 31.4%
North West Ambulance Service NHS Trust 70,323 2,425 3.4% 68,539 15,817 23.1%
South Central Ambulance Service NHS Foundation Trust 14,563 1,743 12.0% 31,574 12,942 41.0%
South East Coast Ambulance Service NHS Foundation Trust 45,963 3,785 8.2% 42,178 17,399 41.3%
South Western Ambulance Service NHS Foundation Trust 30,762 1,768 5.7% 27,166 13,180 48.5%
West Midlands Ambulance Service NHS Trust 61,926 3,886 6.3% 58,040 20,213 34.8%
Yorkshire Ambulance Service NHS Trust 49,310 2,479 5.0% 46,724 11,127 23.8%

Service Efficiency Review – Toronto Fire Services & Toronto EMS
Page | 195
Table 40, below, indicates the percentage of patients who re-contact the ambulance system in England after being provided
advice by telephone (no face-to-face contact) (column 4) and the percentage who re-contact after being treated and discharged at the scene instead of being transported to hospital (column 7). The intent of the telephone contact, and on-scene treatment and discharge where appropriate, is to reduce the number of patient responses and transports to hospital. Similar practices are under consideration at TEMS. Country-wide, 14% of patients who are given telephone advice rather than ambulance response re-contacted the ambulance service within 24 hours. Approximately 6% of patients who are treated and discharged at the scene (no
transport to hospital) re-contact the ambulance service within 24 hours.
Table 40 - Ambulance Trusts in England - Patient Re-contact Percentage After Telephone Advice and On-scene treatment - June 2012 Statistics
Please see Appendix A - Detailed Jurisdictional Comparison for additional service comparator details.
1 2 3 4 5 6 7
NameCalls closed with
telephone advice
Calls closed with
telephone advice
where re-contact
occurs within 24 hours
Proportion of
patients who re-
contacted following
dischange of care,
by telephone
within 24 hours
Patients treated and
discharged on scene
Patients treated and
discharged on scene where re-
contact occurs within 24 hours
Proportion of patients who
re-contacted following
treatment and discharge at
the scene, within 24 hours
England 31,435 4,386 14.0% 166,850 9,879 5.9%
East Midlands Ambulance Service NHS Trust 3,494 165 4.7% 14,508 943 6.5%
East of England Ambulance Service NHS Trust 3,956 522 13.2% 21,291 1,492 7.0%
Great Western Ambulance Service NHS Trust 1,725 251 14.6% 7,063 320 4.5%
Isle of Wight NHS Trust 134 6 4.5% 514 8 1.6%
London Ambulance Service NHS Trust 5,048 138 2.7% 33,776 1,399 4.1%
North East Ambulance Service NHS Trust 992 161 16.2% 6,014 287 4.8%
North West Ambulance Service NHS Trust 2,425 771 31.8% 14,004 838 6.0%
South Central Ambulance Service NHS Foundation Trust 1,743 367 21.1% 12,820 1,022 8.0%
South East Coast Ambulance Service NHS Foundation Trust 3,785 469 12.4% 15,285 742 4.9%
South Western Ambulance Service NHS Foundation Trust 1,768 271 15.3% 11,848 882 7.4%
West Midlands Ambulance Service NHS Trust 3,886 574 14.8% 19,910 1,115 5.6%
Yorkshire Ambulance Service NHS Trust 2,479 691 27.9% 9,817 831 8.5%

Service Efficiency Review – Toronto Fire Services & Toronto EMS
Page | 196
7.0 Culture and Change
One of the tasks within this project is to “propose service delivery and organizational model options that optimize efficiencies while ensuring service effectiveness”. Within that task is the need to identify organizational cultural impacts that a proposed concept might produce, since cultural factors generally are considered to be potential barriers to change.
Fire and emergency medical services are generally accepted to have cultures specific to each organization. This part of the report discusses the relevance and implications of change and
cultures.
Culture Defined
Human growth and development professionals subscribe to the premise that people, and the organizations they create, develop in an invariant64 hierarchical sequence of stages, one of which sets out the concept of work culture. A cognitive developmental orientation characterized as a ‘reference group’ perspective describes a stage at which a group’s culture is predominant and can be identified by a structure in thinking. This ‘reference group’ can include any occupation such as social workers, physicians, engineers, nurses, fire fighters, or paramedics. Simply put, almost all of us have the same approach and perspective to our jobs as
others in our work group or profession that do essentially the same job. Sometimes, when someone inside or external to our reference group puts forward a new way of achieving the purpose of the job function, it may be seen as exciting, and therefore embraced, or contrary and possibly resisted or condemned as wrong thinking.
As a result of socialization over time, individuals subscribe to the group’s beliefs, values and ways of doing things. In fact, it’s possible that individuals choose some of these professions based on their existing thought process and social perspective. Fire and pre-hospital emergency medical services staff are no different to others and, with few exceptions, become socialized to their respective profession’s culture. Understanding culture in these general terms helps to explain why some changes are readily embraced while others aren’t. This understanding can
also assist with developing methods to facilitate change.
The most significant stage content for both services is the belief in, and the value placed, on a timely response to emergency situations, utilizing their skills to ensure public safety and, to the extent possible, preventing incidents from taking place.
A reference group’s perspective represents the beliefs, values, and ways of doing things (culture). Emergency medical and fire services culture is one of helping people in time of vulnerability. The tools of their trade include education, equipment, vehicles, medications, and research informed procedures. When the tools change and the adjustment is perceived as
64 Something that does not change under a transformation, such as from one reference frame to another.

Service Efficiency Review – Toronto Fire Services & Toronto EMS
Page | 197
beneficial, both services tend to embrace rather than resist these types of innovations. In some cases, change may be supported by evidence, sometimes not, but if it is intuitively seen as useful it is often accepted. This applies to all professions, not just fire and EMS.
On the other hand, if a change is seen as striking at a core belief of a profession it is strongly resisted with few exceptions. It is often, for all of us not just fire and pre-hospital emergency medical services, difficult to accept a paradigm shift that finds new ways of accomplishing our core purpose or, in fact, changes our core purpose.
The axiom about structural change is that a formidable force is required to precipitate it. The
necessary force is often referred to as a ‘burning platform’ which can mean any number of events but common to all is decisive action. Without decisive action and a clear strategy, change in structure can often be indefinitely deferred. As long as decisive action is not taken
and a structural change is not imminent, there is nothing to be lost by agreeing to a paradigm shift in the future, thereby essentially protecting the stage structure status quo.
Our efforts in consulting comparable municipalities, examining studies and consultant reports, and visiting locations such as Winnipeg and Manchester, for the purpose of researching this assignment, has convinced us that jurisdictions, internationally, are exploring different methods, equipment, tools, deployment and crewing configurations to do the job better and more efficiently. In the United Kingdom an ideological shift, which places fire prevention and
education as equally important to fire response, started more than 10 years ago in reaction to a fiscal burning platform.
Also in the UK, emergency medical services place an increased focus on becoming a mobile health resource; a similar shift can be observed in the Long and Brier Islands Community Paramedic project in Nova Scotia. Instead of being primarily reactive, these emergency medical services are proactive by taking health care to a full range of patient groups while decreasing transports to hospitals.
This report is about change. It is about the ability of the City of Toronto to move its emergency services in the direction of prevention, proactivity, the reduction or avoidance of cost, and
towards viewing the human services perspective as equally important as emergency response. It’s about recognizing that even though emergency response will continue to be an important part of the fire and emergency medical services departments’ role, strengthened prevention, public education, and proven but different ways of delivering service and care should be the future of Toronto’s emergency services. The focus of Toronto’s fire and EMS departments should be their role in the social fabric of the city – that is, preventing fires; treating patients in their residences when possible; promoting public awareness of health, fire, and safety risk; and protecting the most vulnerable in the municipality.
We hope that this report is a catalyst that helps to move the emergency services towards a new way of doing business but we aren’t naïve. There will be great resistance to some parts of
this report; there will be statements about increasing the risk to the public, that the traditional response to emergencies is of greatest importance, and anecdotes will be offered to support

Service Efficiency Review – Toronto Fire Services & Toronto EMS
Page | 198
those contentions. Nevertheless, we encourage everyone to read this report to find out why reducing or avoiding cost while achieving the same level of service, and promoting the human and social services side of emergency services, is indeed possible and proven.
Notwithstanding the reality that there will always be a need to save someone’s life medically, to rescue someone from a potential fatality, or to suppress a blaze, the better value for money is to apply resources to decreasing the risk of the events occurring. Primary focus on prevention requires a structural change in thinking, which then precipitates a new culture with different beliefs and values. How this emerges is determined by how well the change is
managed once transition is triggered by decisive action. Most importantly, change must involve the people who will create the new culture.

Service Efficiency Review – Toronto Fire Services & Toronto EMS
Page | 199
Appendices

Service Efficiency Review – Toronto Fire Services & Toronto EMS
Page | 200
Appendix A – Detailed Jurisdictional Comparison
Fire Service Jurisdictional Comparators
DEMOGRAPHICS
Location Comparator Criteria
Population Coverage Area (Sq.mi/km) Median Household Income % below poverty level
Houston, Texas 2,145,146 599 $ 42,962 21.0 %
Edmonton, Alberta 817,498 270 $ 84,100 14.1%
SERVICES
Location Comparator Criteria
Is BLS First Response Provided to Medical
Emergencies?
Is ALS First Response Provided to Medical
Emergencies?
Does the department deploy BLS ambulances
that respond to emergency incidents &
transport patients?
Does the department deploy ALS ambulances
that respond to emergency incidents &
transport patients?
Does the department provide non-emergency transport services (eg. hospital to hospital)?
Houston, Texas Yes Yes Yes Yes No
Edmonton, Alberta Emergency Medical Response level only
provided by Fire Rescue Operations personnel.
No No No No

Service Efficiency Review – Toronto Fire Services & Toronto EMS
Page | 201
STAFFING
Location Comparator Criteria
Total # of budgeted department employees
Total # of budgeted
uniform staff
Total # of budgeted firefighters
Total # of budgeted
civilian staff
Are paramedics uniform or civilian?
Total # of budgeted paramedics
Houston, Texas 3970 3851 Firefighter- 1726 (including 98
probationary FF)
119 uniform 450
Edmonton, Alberta 1,117 1,081 951 36 n/a n/a
ORGANIZATIONAL STRUCTURE
Location Comparator Criteria
Do emergency medical response
staff (other than 1st
responders) report
in a separate organizational “line” from fire
suppression personnel
If no, what is the rank structure for
this unit
If no, what is the number of budgeted
positions for each rank
If yes, what is the fire
suppression rank structure
If yes, what is the number of
budgeted positions for
each fire suppression
rank
If yes, what is the EMS rank
structure
If yes, what is the
number of budgeted
positions for each EMS
rank
Houston, Texas No Firefighter, Engineer/Operator
(EO), Captain, Senior Captain, District Chief, Deputy Chief
Firefighter- 1,726 (including 98
probationary FF) EO- 1, 065
Captain-431 Sr. Captain- 156
District Chief-102 Deputy Chief- 8
n/a n/a n/a n/a
Edmonton, Alberta
n/a n/a n/a n/a n/a n/a n/a

Service Efficiency Review – Toronto Fire Services & Toronto EMS
Page | 202
BUDGET (latest fiscal year)
Location Comparator Criteria
Total department budget Total budgeted amount for fire
operations
Total budgeted amount for EMS
operations
Houston, Texas $433,218,057 For Emergency Response (including fire and EMS): $326,508,622
Combined under fire operations
Edmonton, Alberta $166,137,000 (net of revenue) $120,953,000 (net of revenue) n/a
STATIONS/APPARATUS
Location Comparator Criteria
Does the department deploy ALS engine or
ladder companies
Number of stations with staffed firefighting
and/or EMS apparatus:
Number of staffed apparatus (by type) deployed 24-hours a day:
Number of staffed
apparatus (by type)
deployed for less than 24-hours a day
Minimum number of staff assigned to each
fire suppression apparatus by type of
apparatus:
Houston, Texas
No 92 (including 4 ARFF stations and 1 Haz-Mat station)
87 engines 37 trucks (ladders/towers/quints) 21 district chiefs (16 with Incident Commander Technicians) 11 boosters 50 transport basic life support (BLS) units (ambulances) 34 transport advance life support (ALS) units (medics and squads) 11 non-transport ALS units (squads) 2 medical safety units 450 credentialed Paramedics 10 EMS supervisors 3 haz-mat units (including 1 foam pumper) 3 rescue trucks (additionally 2 reserve rescue trucks) 11 crash trucks (additionally 2 reserve
none engines, ladders- 4; district chiefs- 2; ALS, BLS units- 2; rescue, ARFF, haz-mat- 4

Service Efficiency Review – Toronto Fire Services & Toronto EMS
Page | 203
crash trucks) 3 cascade Trucks 1 rehab truck 1 command van 3 safety officers 10 evacuation boats 8 rescue boats 2 utility vehicles 1 mobile ventilation unit
Edmonton, Alberta
We do not provide ALS service. Engine (pumper) and Ladder units provide EMR first response only
26 (Includes a new station to be operational shortly)
27 Pumpers, 8 Ladders, 6 Rescues, 5 Tankers, 1 Hazmat
--- 4 for Pumper, Ladder, Rescue, HAZMAT has 5, 2 for Tankers If there is only a single pumper unit assigned to a station it is staffed with a minimum of 5 personnel
STATIONS/APPARATUS – CONT.
Location Comparator Criteria
Mix of staff assigned to each type of fire
suppression apparatus (e.g. firefighter,
firefighter/paramedic, firefighter/EMT)
Minimum number of staff
assigned to each type of
EMS unit (by type of unit):
Mix of staff assigned to each type of EMS unit (e.g. paramedics, EMTs, other) by type of EMS unit
Number of specialized hazardous materials apparatus deployed
Does the department
have a replacement cycle for fire suppression apparatus
If yes, what is the
replacement cycle
Does the department
have a replacement
cycle for EMS units
If yes, what is the
replacement cycle
Houston, Texas
engine- 1 captain, 1 EO, 2 firefighters; ladder- I sr. captain, 1 EO, 2 firefighters; district chief- 1 district chief, 1- EO;
2 BLS- 1 EO (EMT), 1 firefighter (EMT); ALS- 1 EO (Paramedic), 1 firefighter
2 Yes HFD fire apparatus are considered frontline a minimum of 8 years before
Yes HFD replacement cycle for EMS units is based on actual vehicle

Service Efficiency Review – Toronto Fire Services & Toronto EMS
Page | 204
(paramedic being considered for replacement/ reserve program. The average service life of HFD heavy apparatus is 8 to 12 yrs
mileage. 120k to 150k is the average mileage an EMS unit must have before it’s considered for replacement. HFD remounts its box modules on new cab chassis.
Edmonton, Alberta
All staff are firefighters n/a n/a 2 (1 staffed and the other shared crew with Pumper)
Yes 13 years for Pumper, 17 years for Rescue, Ladder, and Tanker, and 10 years for Hazmat unit.
n/a n/a
INCIDENTS (FOR LATEST YEAR AVAILABLE)
Location Comparator Criteria
Total number of incidents
responded to
Total number of fire suppression incidents
responded to:
Total number of EMS incidents responded to
Total number of other incidents responded to
Houston, Texas (2011) 276,805 46,200 230,605 NONE
Edmonton, Alberta 36,384 9,104 (structural fires, non-
structural fires, and alarms)
23,731 3,549

Service Efficiency Review – Toronto Fire Services & Toronto EMS
Page | 205
OPERATIONAL RESPONSE
Location Comparator Criteria
What is the number and type of apparatus/staff (including battalion chiefs and/or deputy chiefs) which respond to the following
types of incidents:
Car fire Car fire
with injuries
Dumpster/trash fire
Grass/brush fire
Alarm in an apartment
Alarm in a dwelling
(non-apartment)
Dwelling fire
High rise fire
Apartment or
commercial building under 7 stories
Houston, Texas
1 Engine 1 Engine, 1 BLS
1 Engine 1 Engine, 1 Booster
1 Engine 1 Engine 3 Engines, 1 Ladder, 1 District Chief, 1 BLS
6 Engines, 4 Ladders, 4 District Chiefs, 1 BLS, 1 ALS, 1 Safety Officer
4 Engines, 2 Ladders, 2 District Chiefs, 1 BLS, 1 Safety Officer
Edmonton, Alberta
1 P, 1 L or T, 1 HZ if Hazmat present
2 P, 1 R, 1 L, 1 T, 1 DC, 1 HZ if Hazmat present
1 P 1 P, 1 T, 1 ATP 2 P, 1 R, 1 L, 1 T, 1 DC, 1 HZ if Hazmat present
2 P, 1 R, 1 L, 1 T, 1 DC, 1 HZ if Hazmat present
3 P, 1 R, 1 L, 1 T, 1 DC
3 P, 1 R, 2 L, 1 T, 1 DC
3 P, 1 R, 2 L, 1 T, 1 DC, 1 HZ if Hazmat present

Service Efficiency Review – Toronto Fire Services & Toronto EMS
Page | 206
Location Comparator Criteria
What is the number and type of apparatus/staff (including battalion chiefs and/or deputy chiefs) which respond to the following types of incidents:
BLS ALS Auto
accident
Auto accident – extrication
needed
Industrial fire
Hazardous materials incident
Subway fire
Does the department comply with two-in two-
out standards
Are battalion
chiefs assigned
aides? Drivers?
Houston, Texas closest apparatus with EMT’s
closest apparatus with Paramedics
closest EMT 1 Engine, 1 Ladder, 1 District Chief, 1 BLS, 1 Rescue truck
4 Engines, 2 Ladders, 2 District Chiefs, 1 BLS, 1 Safety Officer
4 Engines, 1 Ladder, 1 District Chief, 1 BLS, 1 Safety Officer, 1 Haz-Mat
n/a yes Yes, they are the same position
Edmonton, Alberta
n/a n/a 1 P, 1 L or 1T 1 P, 1 R, 1 L or 1T
3 P, 1 R, 2 L, 1 T, 1 DC, 1 HZ if Hazmat present
1 P, 1 HZ, (1 R, 1 DC, and 2 P added depending upon incident type)
3 P, 1 R, 2 L, 1 T, 1 DC, 1 HZ, 1 SAL
Firefighters are tracked going in and out through accountability worksheet
No

Service Efficiency Review – Toronto Fire Services & Toronto EMS
Page | 207
CALL-TAKING AND DISPATCH SERVICES
Location Comparator Criteria
Does the department’s
call-taking and dispatch unit function
as the primary or
the secondary PSAP for
answering 911 calls?
Are fire/EMS call-taking
services provided in-
house? (Services after the
initial 911 call has been answered should be
considered call-taking
services for these
questions)
If yes, what is the shift
schedule for call-takers?
If yes, how many seats are typically staffed for each shift?
If yes, number of budgeted
uniform positions
(excluding managers/
supervisors):
If yes, number of budgeted uniform manager/supervis
or positions
If yes, number of budgeted
civilian staff positions
(excluding managers/
supervisors):
If yes, number of budgeted
civilian manager/ supervisor positions
If call-taking is not
provided in-house who
provides the service and at what cost
to the fire department
?
Houston, Texas
Primary No --- --- --- --- --- --- City of Houston Emergency Center, cost not available
Edmonton, Alberta
Secondary PSAP
Only Fire call-taking services
2 - 10 hrs day shifts, 2 - 14 hrs night shifts, 2 days off, 2 - 10 hrs day shifts, 2 - 14 hrs night shifts, 6 days off
Minimum of 2 and up to 5 based on staffing level and/or call volume
29 (total Call-takers and Dispatchers)
9 in total for the Communications Centre (8 Officers and 1 Chief)
--- --- n/a
Note: the terminology is a little limiting – hopefully this provides a better picture of the staffing in the centre. There is a minimum of 6 uniformed personnel (maximum of 9) assigned per shift covering call evaluation, dispatch, on-scene support. Out of this staffing there are always 2 officers assigned per shift, the number of Emergency Communication Specialists (ECS) can vary between 4 and 7.

Service Efficiency Review – Toronto Fire Services & Toronto EMS
Page | 208
There is 1 ECS position assigned to day shifts only Monday to Friday. There are 2 additional uniformed positions to support training and technical support filled on a rotational basis. There is one Chief. Total Staffing is 40 uniformed personnel
CALL-TAKING AND DISPATCH SERVICES – CONT.
Location Comparator Criteria
Are dispatch services provided in-house
If yes, what is the shift schedule
for dispatchers
If yes, how may dispatch seats are typically
staffed on each shift?
If yes, number of budgeted
uniform staff positions
(excluding managers/su
pervisors):
If yes, number of budgeted uniform
manager/supervisor positions
If yes, number of budgeted civilian
staff positions: (excluding managers/ supervisors
If yes, number of budgeted
civilian manager/ supervisor positions:
If dispatch is not provided in-house who provides the
service and at what cost to
the fire department?
Is a priority dispatch system
used (e.g., are some calls held
before being
dispatched if no unit is available
to respond)?
Is a commercial fire or EMS call taking tool used (such as Medical Priority
Dispatch or Fire Priority
Dispatch
Houston, Texas
yes 24 hours 15 11 3 0 0 --- No No
Edmonton, Alberta
Yes, for Fire units only
Same as call-takers
2 29 (total Call-takers and Dispatchers)
9 in total for the Communications Centre (8 Officers and 1 Chief)
--- --- n/a Yes, we have not yet had an occasion when no Fire Rescue unit is available to respond.
Yes, Fire Priority Dispatch

Service Efficiency Review – Toronto Fire Services & Toronto EMS
Page | 209
RESPONSE TIMES (PLEASE INDICATE IF RESPONSE TIMES ARE IN MINUTES AND SECONDS OR MINUTES AND FRACTIONS OF MINUTES) (.1 minute = 6 seconds)
Location Comparator Criteria
What is the
average response time to
fire suppressi
on emergenc
y calls? (from call receipt to arrival at
scene)
What is the
average response time for
first responder
s to medical
calls? (from call receipt to arrival at
scene)
What is the
average response time of
ALS apparatus
to ALS emergenc
y calls? (from call receipt to arrival at
scene)
What is the
average response time of
BLS apparatus to BLS
emergency calls?
(from call
receipt to arrival at scene)
What is the
average response time to
EMS non-
emergency calls?
(from call
receipt to arrival at scene
What is the 90
th
percentile response time to
fire suppressi
on emergenc
y calls? (from call receipt to arrival at
scene)
What is the 90
th
percentile response time for
first responder
s to medical
calls? (from call receipt to arrival at
scene)
What is the 90
th
percentile response time of
ALS apparatus
to ALS emergenc
y calls? (from call receipt to arrival at
scene)
What is the 90
th
percentile response time of
BLS apparatus
to BLS emergenc
y calls? (from call receipt to arrival at
scene)
What is the 90
th
percentile response time to
EMS non-emergenc
y calls? (from call receipt to arrival at
scene)
What is the 90
th
percentile response time to
fire suppressi
on emergenc
y calls? (from call receipt to arrival at
scene)
Houston, Texas
Minutes & seconds
7:25 7:50 not available
not available
not available
11:24 10:57 not available
not available
not available
11:24
Edmonton, Alberta
Minutes & seconds
5 min 47 sec (all front-line Fire unit types)
7 min 1 sec (Pumper unit type and for B, C, D, and E emergency medical calls)
n/a n/a 12 min 9 sec (Pumper unit type and for “A” non-emergency medical calls)
8 min 30 sec (Pumper unit type)
10 min 20 sec (Pumper unit type and for B, C, D, and E emergency medical calls)
n/a n/a Please see note below
Not provided
Note: 40 min 36 sec (Pumper unit type for “A” non-emergency medical calls). These calls are not automatically sent to Fire Communications Centre and transferred by Alberta Health Services (AHS) to us only if Fire assistance is required which is well after the call was received by AHS and EMS arrival mainly for lift assists at the scene and/or hospital.
SHIFT SCHEDULES (e.g., 24-hour, 2-10s, 2-14s, 4-8s)

Service Efficiency Review – Toronto Fire Services & Toronto EMS
Page | 210
Location Comparator Criteria
For staff assigned to fire suppression apparatus
For paramedics assigned to EMS units
For EMTs assigned to EMS units
For staff assigned to provide training
Houston, Texas 24- hour on, 24- hour off, 24 hour on, 5 days off with rotating debit day each month.
same as fire suppression same as fire suppression 5 days, 40 hours per week, or 4-10’s, 40 hours per week
Edmonton, Alberta 2 - 10 hrs day shifts, 2 - 14 hrs night shifts, 2 days off, 2 - 10 hrs day shifts, 2 - 14 hrs night shifts, 6 days off
n/a n/a 4 - 11.08 hrs day shifts, 2 days off, 4 - 11.08 hrs day shifts, 6 days off
PAID WORK WEEK (Number of hours)
Location Comparator Criteria
For staff assigned to fire
suppression units
For staff assigned to EMS/rescue
units
For arson investigators
For staff assigned to
provide training
Is premium or overtime pay included as part of the
regular work week for any
employee
If yes, for which functions/positions
If yes, how is overtime pay structured for each position
(e.g. time and a half;
percentage of weekly pay)
Houston, Texas 46.7 hours per week
46.7 hours per week
40 hours per week
40 hours per week
No --- ---
Edmonton, Alberta
42 n/a 42 38.75 No --- ---

Service Efficiency Review – Toronto Fire Services & Toronto EMS
Page | 211
INCENTIVE PAY
Location Comparator Criteria
What types of additional
certification/training result in incentive pay
If incentive pay is provided, what is
the percent of salary or dollar
amount
Is there a maximum and what is the
maximum
Do first-line supervisors qualify for incentive pay
if they have required certification/training
Do managers qualify for incentive pay if they have
required certification/training?
Houston, Texas see attachment schedule see attachment schedule
see attachment schedule
Yes Yes
Edmonton, Alberta n/a --- --- --- ---
TRAINING
Location Comparator Criteria
Number of hours devoted to formal in-service training: for
firefighters
Number of hours devoted to formal in-service
training for paramedics
Does the department require mandatory physical
training for uniform staff
Does the Department take apparatus and staff out of
front line service for training purposes
(apparatus and staff are put back into front line
service if call volume warrants)
Houston, Texas Minimum 20 hours per month Minimum 20 hours per
month
No Yes
Edmonton, Alberta (1) 4 to 6 “Core Competency Skills” maintenance programs each ranging between 2 to 6 hours. (2) “Medical Core Competency” programs every quarterly ranging between 2 to 4 hours. (3) Fall protection recertification training every 3 years which is about 4 hours. For specialized teams; Technical Rescue Team run quarterly programs each for about 4 hours. Hazmat team
n/a No, but there is a Health
and Wellness program in
place that provides
guidance and fitness
direction. Each Fire station
has fitness equipment for
the crews to work out and
train.
Yes, if required for the
training and depending
upon the training being
conducted.

Service Efficiency Review – Toronto Fire Services & Toronto EMS
Page | 212
run various programs (river booming exercises 4 times a year {full day}, mass decontamination once a year {2 to 4 hrs} and equipment review 1 to 2 hrs in length twice a month.
EMERGENCY MEDICAL OPERATIONS: EMS Staff
Location Comparator Criteria
Is the medical director a full-time position Are staff assigned to ALS
ambulances also firefighters Are staff assigned to BLS
ambulances also firefighters
Houston, Texas yes yes yes
Edmonton, Alberta NOTE: we have a medical Director retained on contract to provide support to the First responders Program. This is not a full time position.
n/a n/a

Service Efficiency Review – Toronto Fire Services & Toronto EMS
Page | 213
EMS BILLING
Location Comparator Criteria
Is EMS billing outsourced or performed in-
house
If outsourced to which company and at what cost
(Percent of receipts, percent of collections)?
If in-house, what is the number of budgeted
uniform staff assigned to this
function?
If in-house, what is the number of budgeted
civilian staff assigned to this
function
What is the percent of individuals receiving
services who are billed?
What is the collection rate?
Does the department charge for
medical services when there is no
transport
Houston, Texas outsourced Zerox, cost not available
--- --- Not available Not available No
Edmonton, Alberta
n/a n/a n/a n/a n/a n/a n/a
FALSE ALARM BILLING
Location Comparator Criteria
Does the Department
bill for commercial
and industrial false alarms? If
yes, what is the rate per responding apparatus?
Does the
Department
bill for
residential
false alarms? If
yes, what is
the rate per
responding
apparatus?
What
number of
false alarms
were billed in
the last year
for which you
have
records?
Is False Alarm
billing
outsourced or
performed in-
house?
If outsourced
to which
company and
at what cost
(Percent of
receipts,
percent of
collections)?
If in-house,
what is the
number of
budgeted
uniform staff
assigned to
this
function?
If in-house,
what is the
number of
budgeted
civilian staff
assigned to
this function?
On average,
how many
days elapse
from the
time the
false alarm
occurs until
and invoice
is sent out?
Houston, Texas
Yes, $325.00 per false alarm
No 17,471 In-house --- None 10 employees,
but they have
other
permitting
duties as well
10 days
Edmonton, Alberta
Yes, We charge per response. First response;
Yes, same as
above. Rates
926 false
alarms were
Assume this is
supposed to
n/a 1 person
(Assistant
1 Clerical Next
working day

Service Efficiency Review – Toronto Fire Services & Toronto EMS
Page | 214
No Charge, Second Response; $76.00, Third Response; $380.00, Fourth Response and each subsequent response; $758.00. Security alarms routed to the Fire Rescue Services are charged $758.00 /per response. These responses are to the same premises during each calendar year. Note rates are not per apparatus but per call. The Fee for Services Bylaw is currently under review and rates may increase in 2013.
are not
calculated per
apparatus but
per call
confirmed as
false in the
past year.
say false alarm
billing in which
case the
following
applies:
In-House
Fire Marshall)

Service Efficiency Review – Toronto Fire Services & Toronto EMS
Page | 215
FIRE PREVENTION
Location Comparator Criteria
Are targets established
for code enforcement?
If yes, what are the targets
Are targets established for building
plan review? If yes, what
are the targets
Number of full-time uniform
positions budgeted for
fire prevention activities
related to code enforcement and building plan review
How many of these
positions are supervisory
Number of full-time civilian
positions budgeted for
fire prevention activities
related to code enforcement and building plan review):
How many of these positions
are supervisory
Number of full-time uniform
positions budgeted for fire
prevention outreach
activities (that is, activities that are not related
to code enforcement and building plan review):
How many of these positions
are supervisory
Number of full-time civilian
positions budgeted for fire
prevention outreach
activities (that is, activities that are
not related to code enforcement and building plan
review):
How many of these positions
are supervisory
Houston, Texas
no no 122 25 0 0 6 2 0 0
Edmonton, Alberta
Please see note below
No 35 1 FM, 2 AFM, 7 Captains total = 10
none none 5 1 Captain none none
Note: Yes, we follow a Council Approved Quality Management Plan, we inspect all Risk 4 inspections (High Probability and High Consequence)( Maximum Risk) on a yearly basis and all Risk 3 inspections (Low Probability and High Consequence)( High/Special Risk) every 2 years. This year’s target is 9660 inspections. Lower risk inspections (Risk 1 & 2) are done on a complaint or request basis.

Service Efficiency Review – Toronto Fire Services & Toronto EMS
Page | 216
ARSON INVESTIGATIONS
Location Comparator Criteria
Are arson investigations
the responsibility of the police department or the fire
department?
If responsibility of the fire
department are investigators
civilian or uniform staff?
If responsibility of the fire
department, do arson investigators
have law enforcement
powers?
If responsibility of the fire department
how many arson cases were
investigated in the past 12 months?
If responsibility of the fire
department, what is the shift
schedule for arson
investigators?
If responsibility of the fire
department number of
budgeted arson investigator positions:
How many of these
positions are supervisory?
Houston, Texas
fire department
uniform yes 1, 053 3 shifts: day,
night, weekend
68 16
Edmonton, Alberta
The City of Edmonton Fire Rescue and the City of Edmonton Police Services jointly conduct Arson Investigations. Fire Investigators are responsible for determining the Origin, Cause, and Circumstance of all fires. The Edmonton Police Service use the Fire Investigators determination
Total of 13 full-time uniformed staff for the Fire Investigations section
Fire Investigators do not have law enforcement powers.
Fire Investigators typically conduct approximately 900 fires per year. Approximately 30% of these fires are determined to be caused by arson. An additional 5% of the fires that have an undetermined cause are also investigated, totaling 35% of fires in Edmonton are investigated by EPS Arson Detectives.
2 - 10 hrs day shifts, 2 - 14 hrs night shifts, 2 days off, 2 - 10 hrs day shifts, 2 - 14 hrs night shifts, 6 days off
13 Fire Investigators (includes the Chief of Investigations and 4 Senior Captains) conduct Arson Investigations.
5 - The Chief of Fire Investigations and 4 Senior Captains who are responsible to supervise their platoon.

Service Efficiency Review – Toronto Fire Services & Toronto EMS
Page | 217
as a basis to conduct a criminal investigation to determine who is criminally responsible for causing the fire.
PERSONNEL
Location Comparator Criteria
Are new firefighter
hires required to be certified firefighters?
Are new paramedic
hires required to be certified
paramedics?
Does the department
require mandatory
annual physical exams?
Are employment candidates required to
pass a fitness test?
What are the educational requirements for new firefighter
hires
What are the educational requirements for new paramedic
hires?
Houston, Texas
Yes No No Yes FIREFIGHTER TRAINEE: Applicants must have a minimum of sixty (60) transferable semester college credit hours from an accredited learning institution of higher education recognized by the State Board of Education in the State in which the college resides and accredited by the Southern Association of Colleges and Schools or a similar regional association recognized by the United States Department of Education, and a High School Diploma or General Equivalency Diploma (GED). Acceptable hours are those with a grade of “C” or better of each course
PARAMEDIC FIREFIGHTER: Paramedics must have a minimum of 15 transferable semester college credit hours with a minimum grade of “C” or better in each college level course taken from an accredited college/university. A “Course Completion Certificate” for Firefighter, EMT or Paramedic programs may be accepted in lieu of the 15 transferable college credit hours provided that the program meets TCFP and TDSHS licensing standards. Applicants must have an active Texas Department of State Health

Service Efficiency Review – Toronto Fire Services & Toronto EMS
Page | 218
taken from an accredited college or university. Not more than two (2) one (1) hour Recreational Physical Education courses will be accepted. CERTIFIED FIREFIGHTER/EMT TRAINEE: Certified Firefighter/EMT Trainees must have a minimum of 15 transferable semester college credit hours with a minimum grade of “C” or better in each college level course taken from an accredited college/university. A “Course Completion Certificate” for Firefighter, EMT or Paramedic programs may be accepted in lieu of the 15 transferable semester college credit hours provided that the program meets TCFP and TDSHS licensing standards. Applicant must be in possession of an active Texas Commission on Fire Protection State Firefighter Certification Basic or higher, and an active Texas Department of State Health Services EMT Basic or higher certification.
Services EMT-Paramedic certification or license.
Edmonton, Alberta
no n/a No, annual physical exams participation is voluntary, confidential, and non-punitive.
Yes Grade 12 n/a
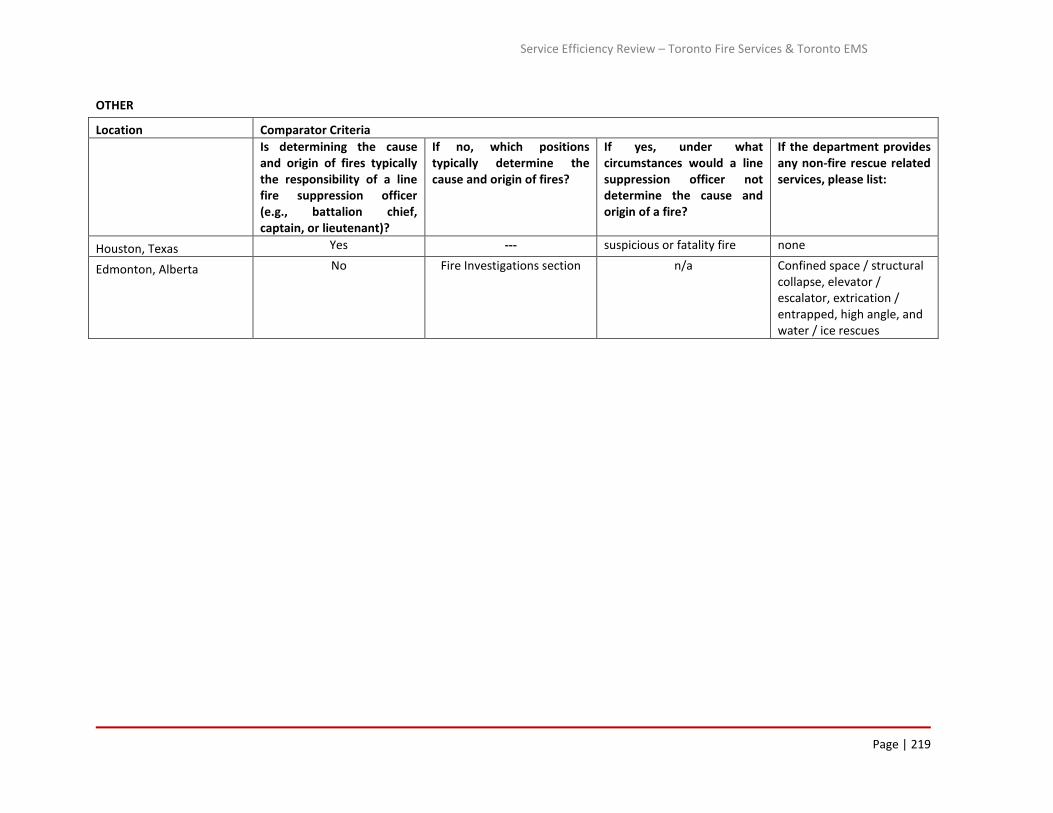
Service Efficiency Review – Toronto Fire Services & Toronto EMS
Page | 219
OTHER
Location Comparator Criteria
Is determining the cause and origin of fires typically the responsibility of a line fire suppression officer (e.g., battalion chief, captain, or lieutenant)?
If no, which positions typically determine the cause and origin of fires?
If yes, under what circumstances would a line suppression officer not determine the cause and origin of a fire?
If the department provides any non-fire rescue related services, please list:
Houston, Texas Yes --- suspicious or fatality fire none
Edmonton, Alberta No Fire Investigations section n/a Confined space / structural collapse, elevator / escalator, extrication / entrapped, high angle, and water / ice rescues

Service Efficiency Review – Toronto Fire Services & Toronto EMS
Page | 220
Emergency Medical Service Jurisdictional Comparators
DEMOGRAPHICS
Location Comparator Criteria
Population Coverage Area (Sq.mi/km) Median Household Income % below poverty level
Ambulance Victoria 5,574,500 State of Victoria 227,490.91 km2 $AUD 73,944
New South Wales 7.25 million 801,600 km2 $1,099 disposable income 11%
SERVICES
Location Comparator Criteria
Is BLS First Response Provided to Medical
Emergencies?
Is ALS First Response Provided to Medical
Emergencies?
Does the department deploy BLS ambulances
that respond to emergency incidents &
transport patients?
Does the department deploy ALS ambulances
that respond to emergency incidents &
transport patients?
Does the department provide non-emergency transport services (eg. hospital to hospital)?
Ambulance Victoria ALS only Yes No Yes Yes, primarily contracted
New South Wales Yes Yes Yes Yes Yes
STAFFING
Location Comparator Criteria
Total # of budgeted department employees
Total # of budgeted uniform staff
Total # of budgeted frontline paramedics
Total # of budgeted
civilian staff
Are paramedics uniform or
civilian?
Total # of budgeted
paramedics
Ambulance Victoria 774 3052 2725 N/A N/A N/A
New South Wales 4,241.8 FTE
3762.63 full time equivalent staff as at 1 October 2012 under our definition of “Operations”. This includes paramedics, operational managers, control centre officers, Aeromedical staff, non-emergency patient transport staff, nurses, executive assistants for operations.
3231.44 full time equivalent staff using the definition of a paramedic employed in a frontline paramedic position i.e. not an paramedic who is an educator or an emergency call taker/dispatcher

Service Efficiency Review – Toronto Fire Services & Toronto EMS
Page | 221
ORGANIZATIONAL STRUCTURE
Location Comparator Criteria
Please describe the department’s rank structure What is the number of budgeted positions for each rank?
Ambulance Victoria See attached NA – We don’t budget by rank
New South Wales
Rank for paramedic positions are shown in next column in hierarchy order: General Manager Operations Directors Operations Deputy Director Operations Zone Managers District Managers Station Officers
General Manager Operations = 1 FTE Director Metropolitan Operations = 1 FTE Director Regional Operations = 1 FTE Deputy Directors Operations = 8 FTE Zone Managers = 18 FTE District Managers = 118 FTE Station Officer = 289
BUDGET (latest fiscal year)
Location Comparator Criteria
Total department
budget
Is the total budgeted amount for EMS operations the same as the
total department budget?
Total budgeted overtime amount
Total overtime amount budgeted for paid lunch breaks
Ambulance Victoria
Expenditure across all services in 2011-12 financial year was $572.620 million AUD Source: 2011-12 Ambulance Victoria Annual Report operating statement page 51
No. AV provides non-emergency road and air services. Approximately 19% of budgeted expenditure is allocated to non-emergency services. The majority of non-emergency services in metropolitan areas are provided through outsourced contract arrangements with third party private providers. It is important to note that AV is a semi-independent Statutory Authority and not within the Health Department. Source: internal AV reports – this information is not published externally
Overtime expenditure in 2011-12 was $47.2 million AUD Source: internal AV reports – this information is not published externally
AV includes meal allowances in the base rate that allows AV to instruct crews where and when (within agreed timeframes) to have a meal break. There are also allowances paid for late and spoilt meals on a sliding scale. AV has not agreed at this point to associate any overtime pays to not accessing a meal break. Estimated cost in penalties for 2012 (Statewide) is $3.5m. does not allocate a budget for paid lunch breaks – overtime is either for a replacement full shift, incidental (at end of rostered shift) or built into the roster (which allows for a shift pattern totaling above the weekly hours)

Service Efficiency Review – Toronto Fire Services & Toronto EMS
Page | 222
New South Wales
$690 Million AUD Not Answered Not Answered
Overtime is not budgeted for paid lunch breaks. Penalty payments may arise from missed crib breaks or crib breaks away from station with a budget for these two penalties of $3.7 million
STATIONS/APPARATUS
Location Comparator Criteria
Number of
staffed EMS stations
Number of staffed ambulances or other response vehicles (by type) deployed 24-hours a day
Number of staffed ambulances or other response vehicles (by type) deployed for
less than 24-hours a day:
Number of staff
assigned to each type of
response vehicle:
Does the department have a replacement cycle for EMS vehicles
Ambulance Victoria
246
162 x 2 person ALS single stretcher ambulances 12 x 1 person MICA single responders (no stretcher capacity) 15 x 2 person MICA stretcher capacity 5 x single person MICA Helicopter 1 x 1 person fixed wing
18 X 2 person stretcher ambulances 10 hrs a day 40 x 2 person stretcher ambulances 10 hrs a day 4 x 2 person MICA stretcher 3 x 1 person MICA single responders 12 hr (no stretcher capacity) 2 x 1 person fixed wing
As in previous columns
230,000 kms
New South Wales
226
999 EMS & non-emergency vehicles 428 single responder & operational support vehicles 87 general support
- -
1 x single responder
vehicles 2 x BLS, ALS
Majority of fleet is leased for maximum of 3 years, 4WD vehicles 3 for 4 years

Service Efficiency Review – Toronto Fire Services & Toronto EMS
Page | 223
INCIDENTS (FOR LATEST YEAR AVAILABLE)
Location Comparator Criteria
Total number of incidents responded to
Total number of EMS incidents responded to:
Total number of other incidents responded to
Ambulance Victoria 801,583 489,857 (includes 4,418
emergency responses from Air Ambulance)
311,996
New South Wales 1,183,795 (2011/12) 865,725 318,070
CALL-TAKING AND DISPATCH SERVICES
Location Comparator Criteria
Does the department’s call-taking and dispatch
unit function as the primary or the secondary PSAP for answering 911
calls?
Are EMS call-taking services provided in-house? (Services after the initial 911 call (or similar emergency access
number) has been answered should be considered call-taking services for these
questions)
If yes, what is the shift schedule for call-
takers?
If yes, how many seats are typically staffed for each
shift?
If yes, number of budgeted uniform
positions (excluding managers/supervisors)
Ambulance Victoria
N/A
No, EMS call taking & dispatch is provided by Emergency Services Telecommunications Authority (ESTA) – a state, statutory authority.
N/A N/A N/A
New South Wales
Secondary provider (after Telstra) for both call taking and dispatch utilising Medical Priority Dispatch Systems and VisiCAD.
Telstra (major telecommunications provider) in Melbourne or Sydney and transferred to the correct Emergency Service Organisation.
Call takers working 24 hours a day, the primary rosters in the larger Control Centres are 12 hour shifts supplemented with shorter shift for the peak periods during the day and evening.
Minimum of 10 call takers across the state during the middle of the night with up to 30 during peak periods.
There are a total of 92.04 (Full Time Equivalent) Call taking positions and 134.48 (Full Time Equivalent) dispatch positions there are no specified uniform or non-uniform positions.

Service Efficiency Review – Toronto Fire Services & Toronto EMS
Page | 224
Location Comparator Criteria
If yes, number of budgeted uniform
manager/supervisor positions
If yes, number of budgeted civilian staff
positions (excluding managers/supervisors)
If yes, number of budgeted
civilian manager/supervisor positions
If call-taking is not provided in-
house who provides the
service and at what cost to the
department?
Is a priority dispatch system
used (e.g., are some calls held before
being dispatched if no unit is available
to respond)?
Is a commercial EMS call taking
tool used (such as Medical Priority
Dispatch or Criteria Based
Dispatch)?
Ambulance Victoria
N/A
No, EMS call taking & dispatch is provided by Emergency Services Telecommunications Authority (ESTA) – a state, statutory authority.
N/A
ESTA. Cost $19.6m (State-wide CTD/CAD Services Costs for 2012/13 Financial Year)
Yes – AMPDS event descriptor is immediately linked to an AV Dispatch Grid which determines the type and number of response resources or whether an event can be transferred to the AV Referral Service (where a secondary triage process occurs)N/A
Medical Priority Dispatch System
New South Wales
48 uniformed manager/supervisor positions across 4 Control Centres.
As in previous cell Nil, no appointed civilian manager/supervisor positions
N/A Yes MPDS

Service Efficiency Review – Toronto Fire Services & Toronto EMS
Page | 225
RESPONSE TIMES (PLEASE INDICATE IF RESPONSE TIMES ARE IN MINUTES AND SECONDS OR MINUTES AND FRACTIONS OF MINUTES) (.1 minute = 6 seconds)
Location Comparator
What is the average response time for first
responders to medical calls? (from call receipt to arrival at
scene)
What is the average response time of ALS
transport capable vehicles to ALS emergency calls?
(from call receipt to arrival at scene)
What is the average response time of BLS
transport capable vehicles to BLS emergency calls?
(from call receipt to arrival at scene)
What is the average response time to EMS non-emergency calls? (from call receipt to arrival at scene)
Ambulance Victoria
13 minutes 26 seconds Note: Only statewide Code 1 (Time Critical) response times are used, Code 2 (Acute Non-Critical) and Code 3 (Routine) incidents are excluded. Note that nearest available ambulance dispatched regardless of ALS or Intensive Care
13 minutes 26 seconds Note: Only statewide Code 1 (Time Critical) response times are used, Code 2 (Acute Non-Critical) and Code 3 (Routine) incidents are excluded. Note that nearest available ambulance dispatched regardless of ALS or Intensive Care
N/A
Not applicable as all Ambulance Victoria’s non-emergency transports are pre-booked. Crew arrives at patient location at agreed pre-determined time.
New South Wales
Notes on ASNSW response time measurement
In accordance with the Australian standard the Ambulance Service of New South Wales (ASNSW) only reports ambulance response times in terms of the 50th and 90th percentile for Priority 1 (P1) incidents i.e. emergency cases requiring an immediate response. In New South Wales ambulance response time is calculated from the time the incident is recorded in the dispatch queue to the time the first ambulance vehicle arrives at scene. The time point data used are sourced from ASNSW Computer Aided Dispatch system.
ASNSW does not compile separate response time information for ALS and BLS.
Provided below are the 2011-12 50th and 90th percentile response times (minutes) for the whole of the state of New South Wales and for the capital city Sydney.
New South Wales
Ambulance 50th Percentile Response Time (minutes) to emergency (P1) incidents, New South Wales, 2011-12
10.93
New South Wales Ambulance 50th Percentile Response Time (minutes) to emergency (P1) incidents,
10.70

Service Efficiency Review – Toronto Fire Services & Toronto EMS
Page | 226
Sydney, 2011-12
New South Wales
Ambulance 90th Percentile Response Time (minutes) to emergency (P1) incidents, New South Wales, 2011- 12
22.52
New South Wales
Ambulance 90th Percentile Response Time (minutes) to emergency (P1) incidents, Sydney, 2011-12
20.07
RESPONSE TIMES – CONT.
Location Comparator
What is the 90th percentile response time for first
responders to medical calls? (from call receipt to arrival at
scene)
What is the 90th percentile response time of ALS
transport capable vehicles to ALS emergency calls?
(from call receipt to arrival at scene)
What is the 90th percentile response time of BLS
transport capable vehicles to BLS emergency calls?
(from call receipt to arrival at scene)
What is the 90th percentile response time to EMS non-emergency calls? (from call receipt to arrival at scene)
Ambulance Victoria
22 minutes 4 seconds Note: Only statewide Code 1 (Time Critical) response times are used, Code 2 (Acute Non-Critical) and Code 3 (Routine) incidents are excluded. This is statewide figure, metropolitan use of fire service is faster.
22 minutes 4 seconds Note: Only statewide Code 1 (Time Critical) response times are used, Code 2 (Acute Non-Critical) and Code 3 (Routine) incidents are excluded.
N/A
Not applicable as all Ambulance Victoria’s non-emergency transports are pre-booked. Crew arrives at patient location at agreed pre-determined time.
SHIFT SCHEDULES (e.g., 24-hour, 2-10s, 2-14s, 4-8s)
Location Comparator
Please provide general information on your shift schedules Are part time or casual staff employed as paramedics?
Ambulance Victoria
10/14 = 2 x 10 hr. days and 2 x 14 hr. nights and 4 days off. Blended roster =10 hr. day plus 10 or 12 hr. day plus 10 or 12 hr. afternoon and a 14 hour nightshift. These are the main rosters there are a variety of others
Yes

Service Efficiency Review – Toronto Fire Services & Toronto EMS
Page | 227
New South Wales
Metropolitan – 4 days on x 5 days off (12 hour shifts) Rural – Predominately 8 hour shifts matched to demand (with on-call components) averaging 38 hours a week. 7 days on with no more than 14 in 28 nights on-call. Roster/demand matching review undertaken every 6 months
Yes (part time)
PAID WORK WEEK (NUMBER OF HOURS)
Location Comparator
For staff assigned
to EMS/rescue units
For staff assigned to provide
training
Is premium or overtime pay included as part of the regular work week for
any employee?
If yes, for which functions/positions?
If yes, how is overtime pay structured for each position (e.g. time and a half;
percentage of weekly pay)?
Ambulance Victoria N/A N/A N/A N/A N/A
New South Wales
38 hours 38 hours No – overtime and/or penalties are
only paid as worked N/A N/A
INCENTIVE PAY
Location Comparator
What types of additional
certification/training result in incentive pay?
If incentive pay is provided, what is the percent of salary or
dollar amount?
Is there a maximum and what is the
maximum?
Do first-line supervisors qualify for incentive pay
if they have required certification/training?
Do managers qualify for incentive pay if they
have required certification/training?
Ambulance Victoria
N/A N/A N/A N/A N/A
New South Wales
Higher level Clinical qualifications receive specialist allowances
This is built into the wage structure. This varies depending on period of service. Equates to approximately $40 per week for 1st year specialist up to $80 per week for 3rd year (and greater) specialist.
See previous cell
No No

Service Efficiency Review – Toronto Fire Services & Toronto EMS
Page | 228
TRAINING
Location Comparator
Number of hours devoted
to formal in-service training for paramedics:
Does the department require mandatory physical training for uniform staff?
Does the department take vehicles and staff out of front line service for training purposes (apparatus and staff are
put back into front line service if call volume warrants)
Is the medical director a full-time position?
Ambulance Victoria 93,258 No Not Answered
No. AV operates under Standing Orders approved by Health Department.
New South Wales 1 week every 18 months
average Only for specialist access
Paramedics Yes. Staff are allocated to a designated training workshop
every 18 months No
PERSONNEL
Location Comparator
Are new paramedic hires required to be
certified paramedics?
Does the department require mandatory
annual physical exams?
Are employment candidates required to pass a fitness
test?
What are the educational requirements for new
paramedic hires?
Ambulance Victoria
They need to have completed an approved university Health Science degree qualification as a paramedic
No Yes Bachelor Degree
New South Wales
No, untrained paramedics become qualified after 3 years of training and practical on the job experience. Graduates with recognized paramedic degrees become qualified after around 35 weeks of training and practical on the job experience. Former paramedics or people with other medical qualifications and suitable prior work experience such as registered nurses and defence force medics, become qualified after receiving an appropriate amount of training and practical experience. Once qualified and certified, paramedics are required to maintain their certificate to practice every 3 years.
We have not had mandatory physical examinations in the past. However from 2012 onwards paramedics will be required to perform a mandatory 6 medical examination every 3 years.
All new operational employees, (paramedics, control centre officers, patient transport officers) are required to pass a comprehensive medical examination. Paramedics and Patient Transport Officers are currently required to pass a step test assessing their cardiovascular fitness which is associated with job tasks such as administering CPR.
We are transitioning to tertiary entry for paramedics i.e. they will require a recognized paramedic degree. However at the moment we also accept applicants with no qualifications or medical experience and provide 3 years of on the job training and practical experience resulting in awarding of a Diploma by our internal registered training organization.

Service Efficiency Review – Toronto Fire Services & Toronto EMS
Page | 229
OTHER
Location Comparator
Does fire or police services provide first
responder service? If so, under what circumstances?
What is fee structure for paramedic care or ambulance transportation?
Ambulance Victoria
Fire for suspected cardiac arrest cases
Fee for service using rates published by Victorian Department of Health (emergency fees) – see
http://www.health.vic.gov.au/ambulance/fees.htm or Ambulance Victoria (non-emergency fees) – see
http://www.ambulance.vic.gov.au/About-Us/Fees.html
New South Wales Various agencies may provide a community first responder service in remote locations
Ambulance services are fee for service, however exemptions exist for pensioners, holders of health care concession cards etc. Refer to the attached policy on Ambulance fees.
OTHER – CONT.
Location Comparator
Does state or national health insurance cover all or part
of the cost of ambulance care and transportation? Is there a portion of the cost paid by the patient?
If so, how much?
Ambulance Victoria
Transports covered for holders of State pension or health care concession cards, see: http://www.health.vic.gov.au/ambulance/guidelines/concessions.htm National coverage provided for war veterans through Department of Veterans Affairs, see: http://www.dva.gov.au/BENEFITSANDSERVICES/TRANSPORT/Pages/amb%20trans.aspx Private health insurance and ambulance insurance also available but paid for by public Transport Accident Commission (TAC) and Worksafe pay for transports relating to road accidents and workplace accidents respectively under their rules: See www.tac.vic.gov.au and www.worksafe.vic.gov.au
No co-payment for transports under State Health Care Card or Pensioner concession (State government concession) or for eligible war veterans transports (Federal government concession). Patients not covered by a concession, or covered under TAC or Worksafe are liable to pay 100% of the published fee. Ambulance Victoria offers an ambulance membership scheme that enables the public to ensure against these costs (members of the scheme are covered for 100% of Ambulance Victoria fees for medically necessary transports as outlined in the AV Membership Scheme Business Rules, see the AV website: http://www.ambulance.vic.gov.au/Media/docs/32220%20AV%20Business%20Rules%2012pp%20DL-a86cb1b7-a4c8-4cda-b5ab-901df156a9d0-0.pdf for a copy of the business rules)
New South Wales
No – although the State Government provides a subsidy of 49% of the cost of emergency medical services to NSW residents (as determined by the NSW Independent Pricing and Regulatory Tribunal)
Yes – 51% of the cost of emergency medical services as determined by the NSW Independent Pricing and Regulatory Tribunal assuming the patient is not otherwise exempt or covered by private health insurance. On most occasions this results in a charge of $350-$400 for patients who are not otherwise covered.

Service Efficiency Review – Toronto Fire Services & Toronto EMS
Page | 230
Appendix B - Assignments and Resources Required at Fire Incidents

Service Efficiency Review – Toronto Fire Services & Toronto EMS
Page | 231
Toronto Fire Services
First Alarm Response Resources
PUMPER #1
4 staff
PUMPER #2
4 staff
AERIAL #1
3 staff
DISTRICT CHIEF
1F.I.T.
1
-Initial size up
-Capt may act
as entry control;
gather tags
-Initial radio
report
-Determine
strategies &
tactics
-1 FF becomes
pump operator
-2 FF set initial
attack lines
-Connect
hoses from
hydrant to 1st
pump
-2 FF Search
& Rescue
- 2 FF Backup
line
established
- Interim Rapid
Intervention
Team (I.R.I.T.)
FUNCTIONS
-Ventilation
-1 FF Set up
truck for aerial
operations
EN ROUTE ON SCENE
-Monitoring radio
channels; i.e.
people trapped,
non-working
hydrants, location
of hydrants
-Monitor MDTs
- Assess current
plan; adjust plan
-Deploy incoming
resources
-Establish base
location in case of
Second Alarm
-Incident
Commander
passes
command to
District Chief
-District Chief
reassigns
Incident
Commander
-Re-evaluates
planning
based on
existing
situation
EN ROUTE ON SCENE
Drives DC
Vehicle-Records
activities as they
take place
-Monitors
strategic
communication
channel on
second alarm
-Searches for
building plans
&audits
-Gathers
information to
write reports
(hydro,
insurance,
tenants)
P1 P2 A1
DC1 FIT1
Figure 9 - First Alarm Response Resources Required

Service Efficiency Review – Toronto Fire Services & Toronto EMS
Page | 232
Fire Fighting Process: Bungalow Fire
Alarm At Station
Turn Out
Call Received to
Alarm
2 FF on hose
1 FF on pump
1 Incident
Commander
Arrive Scene
Initial Report on
Arrival
Initial Size Up
1st Truck
Road Response
2nd
Truck
Arrives
Implement
Strategies &
Tactics
Entry Control
(count people &
track where they
are)
Turn Off Utilities
2 FF in charge of
second hose
Rapid Intervention
Team
Usually 2nd
crew
Search for
Occupants 2 FF
Ventilation 3 FF
3rd
Truck (Aerial)
Arrives
Salvage
2 FF
Secondary Search
Extinguish Fire
Initial Knock Down
Overhaul
Check if fire is out
– walls & ceilings
Determine cause
& origin
Remove damaged
materials
Enclose access
points in roof &
walls
Repack equipment
on trucks
Gathering
information for
reports
60 seconds 0 seconds 80 seconds
4 minute target
10 seconds
2 minutes
Air Light Truck
Two Trucks Staging
Reserve
(minimum 7 FF)
10 minutes
20 minutes
FF Rehab20 minutes
20 minutes
District Chief
& F.I.T.
3 minutes
Figure 10 - Fire Fighting Process, Bungalow Fire

Service Efficiency Review – Toronto Fire Services & Toronto EMS
Page | 233
PUMPER #3
4 staff
PUMPER #4
4 staff
PUMPER #5
4 staff
DISTRICT CHIEF &
F.I.T.
Captain
becomes
Base Officer
(IC of Base
Sector)
3 FF sent
forward to
staging
FF prepared
for rotation
into scene
4 FF deployed
to Sector B
Search &
Rescue,
potential fire
fighting of
neighboring
houses
Deployed to
Section Delta
Search &
Rescue,
potential fire
fighting of
neighboring
houses
Request District
Chief as Sector
Officer
Number of
District Chiefs
depends on
circumstances
FUNCTIONS
P5P4P3 DC2
SQUAD
3 staff
Take over fire
attack role
from pump #1
AERIAL #2
3 staff
Potentially
used for
egress, rescue,
fire attack,
ventilation
AIR LIGHT
TRUCK
2 staff
Exchange
SCBA bottles
Light setup at
night
COMMAND
VEHICLE
1 staff
HAZMAT
Set up
command
vehicle
Air
monitoring,
water run off
PLATOON
CHIEF
Media
Councillors
MOE
Social
Services
SOGs
P&P
Squad A2 AL CV HAZPC
Rapid Intervention
Team (Rescue
Pumper)
1 team of 4 FF
Gather
equipment;
T.I.C., R.I.T.
Kit, change
SCBA to 1
hour bottle,
recon scene,
security grates.
RIT
Figure 11 - Second Alarm Response Resources Required
Figure 12 - Fire Fighting Process - High Rise

Service Efficiency Review – Toronto Fire Services & Toronto EMS
Page | 234
Fire Fighting Process: High Rise
7.5 minutes
Proceed to Lobby
3 F.F.
Gather
information;
alarms sounding
Example 9th floor,
take control of
elevator
1 F.F. Remains in
elevator
Proceed to 2
floors below fire
Walk up 2 floors
(note: tool packs
are being carried)
Discover smoke
Initiate 2nd
Alarm
Additional 7-10 minutes
First 2 trucks -
Wheels stop at
curb
2nd
Pumper
4 F.F.
Captain assumes
voice communications,
lobby control
Pump operator, hook
into stand pipe
2 F.F.
In lobby, backup crew
to 1st crew
2 F.F.
1 Aerial
3 F.F.
Possibly:
-Ventilation
-Search & Rescue
-Securing stairwell
ventilation or egress
-aerial operations
rescue
High Rise Truck
3 F.F.
Modules:
-Air
-Communications
-Ventilation
-Move equipment
up stairs
Possibly:
-Back up to 2nd
crew
-Air Supply to 2
floors below
-I.R.I.T.
-Staging
-Secure stair wells
D.C. & F.I.T. (x 2)
Incident Commander
Coordinates Staging
Safety Control
Command Vehicle
2 FITs
1 FIT operating
communications
1 FIT monitoring
command board
and
documentation
2nd
Aerial
To Section A
Ventilation
1 Stairwell for
ventilation
1 Stairwell for
evacuation
Assign DC to
Safety Officer
R.I.T.
2 floors below fire
Platoon Chief
PC takes
command
1st in DC to fire
control
Staging Floor
Set up Rehab
Rehab Officer
(1)
Documentation
Checking
Floors above
fire
2 F.F.
Checking
Floors below
fire
2 F.F.
Transport Air
Bottles to
staging
2 F.F.
SAFETY
CONTROL
Hazmat
3 F.F.
Air Monitoring for
F.F. safety
Other
-8 to 10 F.F. to
staging area,
relief crews
- Salvage
Operations
-Evacuees:
DC requests
TTC buses
Track
Residents
Evacuated
1 FIT
HIGH RISE RESOURCE SUMMARY:
Approximately 44 Fire Fighters
Including staging & base
10-13 vehicles

Service Efficiency Review – Toronto Fire Services & Toronto EMS
Page | 235
Appendix C – TFS Unit Chart

Service Efficiency Review – Toronto Fire Services & Toronto EMS
Page | 236
City of Toronto Fire Services Unit Staffing ChartStaffing Legend:
Full Min Full Min Full Min Full Min
5 4 6 4 5 3 5 3
Air Light DC
Full Min Full Min Full Min Full Min Full Min
3 2 1 1 2 2 5 3 5 3
'Min' refers to the minimum number of staff to be assigned to the vehicle for that vehicle to be in service.
Command Units staffed by management.
5 staff are assigned to vehicles for administrative purposes; this takes into consideration the staffing levels needed to allow for vacation and unscheduled absence.
Rescues are assigned either 5 or 6 as an administrative number and run with 4.
SPECIAL OPS & COMMAND & UNITS
COMMAND DISTRICT Stations Pumpers Rescue Aerials Squads Air LightCommand
UnitsDC Units
HazMat
Unit
High
Rise
Unit
Full Min
Staff Levels
1 - North
1 111 1 1 7 6
112 1 6 4
113 1 1 10 7 Hazmat Pumper
114 1 1 1 1 14 10 Air Light Unit, CMD unit
115 1 6 4
116 1 5 4
2 121 1 5 4
122 1 6 4
123 1 1 7 6
125 1 5 4
3 131 1 1 10 7
132 1 1 7 6
133 1 1 11 7
134 1 6 4
135 1 1 10 7
4 141 1 5 4
142 1 1 1 12 9
143 1 1 10 7
145 1 1 10 7
146 1 5 4
Command 1 Total: 20 15 5 6 1 1 1 4 1 0 157 115
Staffing
Pumpers Rescue Aerials
Command
TYPE & NUMBER OF UNITS
Squads
High Rise Unit HazMat Unit
Hazmat Materials Unit; Haz Support
Unit
District 1 Unstaffed Units
HS145 HazMat Support
DE145 Decon Unit
DS145 Decon Unit

Service Efficiency Review – Toronto Fire Services & Toronto EMS
Page | 237
SPECIAL OPS & COMMAND & UNITS
COMMAND DISTRICT Stations Pumpers Rescue Aerials Squads Air LightCommand
UnitsDC Units
HazMat
Unit
High
Rise
Unit
Full Min
Staff Levels
2 - East
1 211 1 5 4 Water Tanker
212 1 1 7 6
213 1 1 10 7
214 1 6 4
215 1 1 10 7
2 222 1 1 10 7
223 1 5 4 Support 7 - bluff rescue pumper
224 1 1 11 8
225 1 1 8 6
226 1 1 10 7
227 1 5 4
3 231 1 1 1 1 16 11 Air Light Unit
232 1 1 10 7 Bluff Rescue
233 1 5 4
234 1 5 4 Decon Unit
235 1 6 4 Husar, Trench Rescue
4 241 1 6 4 Typhoon Fan
242 1 1 7 6
243 1 6 4
244 1 1 10 7
245 1 5 4
Command 2 Total: 21 15 7 6 1 1 0 4 0 0 163 119
TYPE & NUMBER OF UNITS Staffing
TS125 Trench Support
TRS235 Trench Rescue
District 2 Unstaffed Units
WT211 Water Tanker
SUP7 Support
DE234 Decon Unit
HS234 HazMat Support

Service Efficiency Review – Toronto Fire Services & Toronto EMS
Page | 238
COMMAND DISTRICT Stations Pumpers Rescue Aerials Squads Air LightCommand
UnitsDC Units
HazMat
Unit
High
Rise
Unit
Full Min
Staff Levels
3- South
1 311 1 5 4
312 1 1 1 12 9
313 1 1 10 7
314 1 5 4
315 1 1 10 7
2 321 1 1 11 7
322 1 1 10 7
323 1 1 7 6
324 1 1 10 7
325 1 1 1 16 11
326 1 6 4
3 331 1 1 1 15 10 Tower Aerials
332 1 1 1 1 1 18 13 Hazmat Unit; CMD Unit; Haz support
333 1 1 1 13 9 Air Light Unit
334 1 5 4 Fireboat
335 1 5 4 Quint
4 341 1 1 11 7
342 1 5 4
343 1 5 4
344 1 5 4
345 1 1 1 13 9 Box 12
346
Command 3 Total: 21 17 5 10 2 1 1 4 1 1 197 141
District 3 Unstaffed Units
HS332 HazMat Support
Box 12 (Station 345)
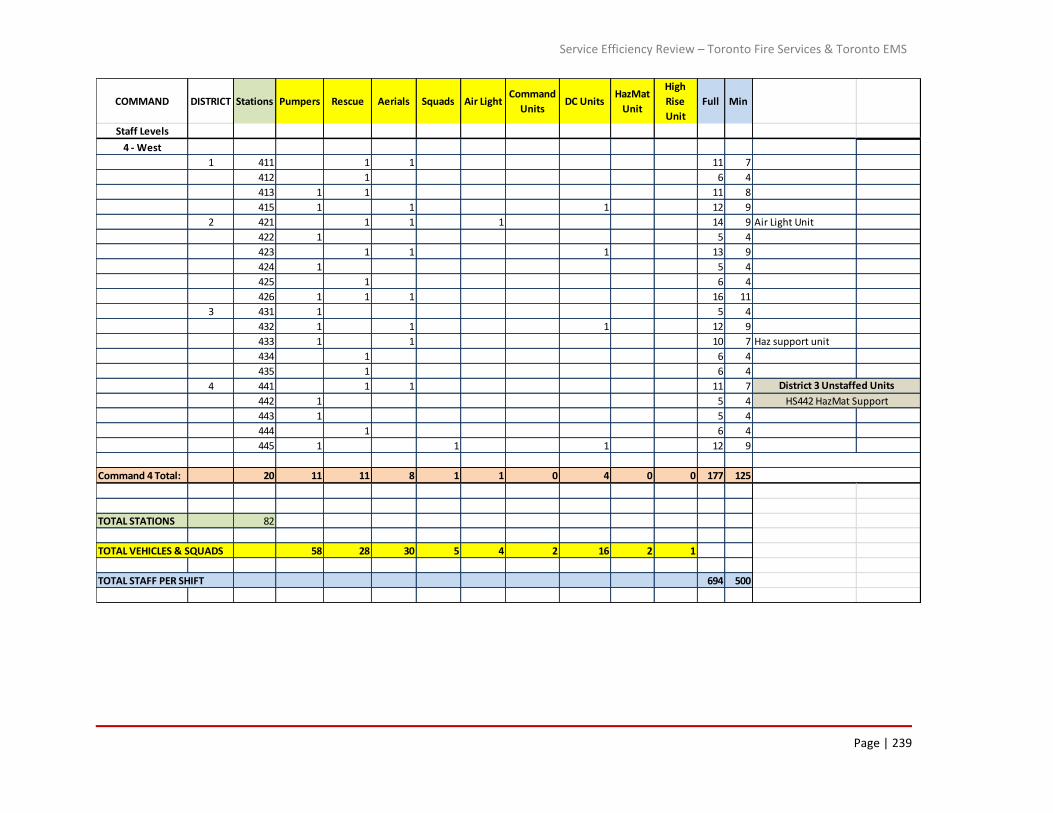
Service Efficiency Review – Toronto Fire Services & Toronto EMS
Page | 239
COMMAND DISTRICT Stations Pumpers Rescue Aerials Squads Air LightCommand
UnitsDC Units
HazMat
Unit
High
Rise
Unit
Full Min
Staff Levels
4 - West
1 411 1 1 11 7
412 1 6 4
413 1 1 11 8
415 1 1 1 12 9
2 421 1 1 1 14 9 Air Light Unit
422 1 5 4
423 1 1 1 13 9
424 1 5 4
425 1 6 4
426 1 1 1 16 11
3 431 1 5 4
432 1 1 1 12 9
433 1 1 10 7 Haz support unit
434 1 6 4
435 1 6 4
4 441 1 1 11 7
442 1 5 4
443 1 5 4
444 1 6 4
445 1 1 1 12 9
Command 4 Total: 20 11 11 8 1 1 0 4 0 0 177 125
TOTAL STATIONS 82
TOTAL VEHICLES & SQUADS 58 28 30 5 4 2 16 2 1
TOTAL STAFF PER SHIFT 694 500
District 3 Unstaffed Units
HS442 HazMat Support

Service Efficiency Review – Toronto Fire Services & Toronto EMS
Page | 240
Appendix D – Relationship in volume and percentage, between ‘All Incidents’,
‘Medical Incidents’, ‘False Alarms’, and ‘Fires’, by station response area

Service Efficiency Review – Toronto Fire Services & Toronto EMS
Page | 241
Station 2011 All
Incidents
2011
Medical
Calls
Percent of All Calls
in Station Area
2011 False
AlarmsPercent of All
Calls in Station
Area2
2011 Fires Percent of All
Calls in
Station Area3
Total Percentage
of Medical, False
Alarm, and Fire
Incidents
111 1210 823 68% 109 9% 4 0.3% 77%
112 2165 1489 69% 188 9% 18 0.8% 78%
113 1645 986 60% 187 11% 23 1.4% 73%
114 2874 1703 59% 387 13% 37 1.3% 74%
115 1373 793 58% 166 12% 21 1.5% 71%
116 1076 536 50% 137 13% 11 1.0% 64%
121 1149 531 46% 184 16% 9 0.8% 63%
122 820 391 48% 153 19% 9 1.1% 67%
123 1212 729 60% 159 13% 11 0.9% 74%
125 971 533 55% 145 15% 8 0.8% 71%
131 1070 428 40% 270 25% 13 1.2% 66%
132 2665 1498 56% 325 12% 28 1.1% 69%
133 1603 962 60% 188 12% 28 1.7% 73%
134 2342 1346 57% 324 14% 24 1.0% 72%
135 1165 527 45% 236 20% 13 1.1% 67%
141 1942 964 50% 443 23% 44 2.3% 75%
142 2974 1752 59% 393 13% 56 1.9% 74%
143 1637 993 61% 161 10% 29 1.8% 72%
145 1622 864 53% 182 11% 31 1.9% 66%
146 1790 915 51% 234 13% 48 2.7% 67%
211 737 345 47% 118 16% 12 1.6% 64%
212 980 569 58% 93 9% 24 2.4% 70%
213 1614 940 58% 192 12% 23 1.4% 72%
214 899 483 54% 81 9% 18 2.0% 65%
215 754 484 64% 62 8% 12 1.6% 74%
222 2408 1539 64% 281 12% 22 0.9% 76%
223 2450 1532 63% 235 10% 32 1.3% 73%
224 1736 1063 61% 155 9% 27 1.6% 72%
225 2174 1314 60% 221 10% 31 1.4% 72%
226 2135 1316 62% 275 13% 22 1.0% 76%
227 1116 614 55% 109 10% 12 1.1% 66%
231 2524 1620 64% 270 11% 41 1.6% 77%
232 2098 1296 62% 244 12% 23 1.1% 74%
233 1615 1033 64% 152 9% 14 0.9% 74%
234 2023 1330 66% 192 9% 29 1.4% 77%
235 1720 1124 65% 145 8% 24 1.4% 75%
241 1102 675 61% 142 13% 10 0.9% 75%
242 1350 801 59% 161 12% 20 1.5% 73%
243 1234 692 56% 197 16% 15 1.2% 73%
244 2060 1190 58% 273 13% 30 1.5% 72%
245 1432 821 57% 159 11% 20 1.4% 70%

Service Efficiency Review – Toronto Fire Services & Toronto EMS in the City of Toronto
Page | 242
Station 2011 All
Incidents
2011
Medical
Calls
Percent of All Calls
in Station Area
2011 False
AlarmsPercent of All
Calls in Station
Area2
2011 Fires Percent of All
Calls in
Station Area3
Total Percentage
of Medical, False
Alarm, and Fire
Incidents
311 1986 1039 52% 400 20% 20 1.0% 73%
312 2193 1196 55% 504 23% 30 1.4% 79%
313 2977 1628 55% 539 18% 40 1.3% 74%
314 4310 2578 60% 980 23% 41 1.0% 84%
315 2614 1660 64% 342 13% 37 1.4% 78%
321 898 453 50% 165 18% 11 1.2% 70%
322 2154 1288 60% 244 11% 30 1.4% 73%
323 1815 1171 65% 164 9% 22 1.2% 75%
324 1492 961 64% 178 12% 15 1.0% 77%
325 3885 2216 57% 785 20% 54 1.4% 79%
326 942 512 54% 121 13% 17 1.8% 69%
331 2193 1227 56% 366 17% 31 1.4% 74%
332 4031 2346 58% 867 22% 51 1.3% 81%
333 2154 1097 51% 472 22% 24 1.1% 74%
334 1420 711 50% 316 22% 15 1.1% 73%
335 139 25 18% 9 6% 2 1.4% 26%
341 2161 1412 65% 178 8% 30 1.4% 75%
342 1194 792 66% 73 6% 19 1.6% 74%
343 1496 920 61% 170 11% 30 2.0% 75%
344 2067 1162 56% 296 14% 26 1.3% 72%
345 1991 1204 60% 231 12% 31 1.6% 74%
346 164 92 56% 51 31% 1 0.6% 88%
411 1584 897 57% 176 11% 57 3.6% 71%
412 1065 535 50% 192 18% 18 1.7% 70%
413 2526 1555 62% 307 12% 31 1.2% 75%
415 1425 813 57% 156 11% 27 1.9% 70%
421 2107 1294 61% 241 11% 32 1.5% 74%
422 1009 663 66% 75 7% 25 2.5% 76%
423 1685 971 58% 177 11% 33 2.0% 70%
424 687 458 67% 60 9% 7 1.0% 76%
425 778 431 55% 99 13% 12 1.5% 70%
426 4517 2630 58% 611 14% 47 1.0% 73%
431 1144 726 63% 125 11% 8 0.7% 75%
432 1004 546 54% 138 14% 20 2.0% 70%
433 1971 1144 58% 205 10% 32 1.6% 70%
434 857 507 59% 90 11% 17 2.0% 72%
435 1469 830 57% 173 12% 26 1.8% 70%
441 1907 887 47% 338 18% 34 1.8% 66%
442 2455 1386 56% 354 14% 35 1.4% 72%
443 2194 1368 62% 255 12% 30 1.4% 75%
444 1178 695 59% 128 11% 6 0.5% 70%
445 2023 1136 56% 251 12% 30 1.5% 70%
No Station ID 7 4 3 3
Grand Total 145334 84710 58% 19933 14% 2033 1.4% 73%
Data Sources:
Total Calls and Medical Calls: CAD Data - Event Detail
Fire and False Alarms: RMS Data

Service Efficiency Review – Toronto Fire Services & Toronto EMS in the City of Toronto
Page | 243
Appendix E – Response Times by Fire Station

Service Efficiency Review – Toronto Fire Services & Toronto EMS
Page | 244
Exhibit A - Day - Night Comparison 2011 District 190th Percentile
Station 111 112 113 114 115 116 121 122 123 125 131 132 133 134 135 141 142 143 145 146
Alarm to Arrive (min) 0000 to 0600 10.0 9.1 9.9 9.4 9.0 11.8 10.0 10.1 11.5 9.1 9.1 10.0 9.6 7.9 8.5 9.3 9.0 11.4 8.6 9.5
1200 to 1800 8.2 9.1 7.8 8.1 9.0 11.2 8.5 10.3 8.7 10.0 7.9 8.5 9.8 8.7 7.7 9.0 8.7 11.1 9.0 9.8
Differential 1.8 0.0 2.1 1.3 0.0 0.6 1.5 -0.3 2.7 -0.9 1.2 1.6 -0.2 -0.8 0.8 0.4 0.3 0.2 -0.4 -0.3
111 112 113 114 115 116 121 122 123 125 131 132 133 134 135 141 142 143 145 146
Alerted to Arrive (min) 0000 to 0600 8.2 8.1 8.1 7.8 7.9 8.4 8.2 9.4 10.2 7.9 8.0 8.7 7.4 6.2 7.1 8.1 7.8 10.0 7.8 8.1
1200 to 1800 7.0 7.6 6.5 6.9 8.0 9.7 7.2 8.9 7.2 7.8 6.8 7.1 8.2 6.7 6.4 4.3 7.3 9.0 7.7 8.4
Differential 1.1 0.5 1.7 0.9 -0.1 -1.3 0.9 0.5 2.9 0.1 1.1 1.6 -0.8 -0.5 0.8 3.9 0.5 1.0 0.1 -0.3
111 112 113 114 115 116 121 122 123 125 131 132 133 134 135 141 142 143 145 146
Enroute To Arrive (min) 0000 to 0600 5.2 4.7 5.3 5.1 5.2 5.5 5.4 6.3 8.3 5.1 5.7 6.2 4.7 3.9 4.2 5.3 5.3 7.6 5.1 5.2
1200 to 1800 5.3 5.7 5.3 5.3 6.4 7.7 5.3 6.0 5.5 5.5 5.1 5.5 6.1 5.0 4.7 5.8 5.6 7.3 6.0 6.2
Differential -0.1 -1.0 0.0 -0.2 -1.2 -2.2 0.1 0.3 2.8 -0.4 0.6 0.8 -1.4 -1.1 -0.5 -0.5 -0.3 0.3 -0.9 -1.0
Comparing night to day, enroute to arrived scene
differential should be ~0.0 min or less between 0000
- 0600 than 1200 - 1800
111 112 113 114 115 116 121 122 123 125 131 132 133 134 135 141 142 143 145 146
0000 to 0600 46 77 64 125 74 48 62 34 38 30 69 94 90 86 74 123 158 82 56 76
1200 to 1800 109 196 216 353 182 153 165 157 131 107 238 324 230 234 277 215 391 252 200 206
0000 to 0600 42 75 64 139 65 58 67 33 42 42 59 108 79 98 61 151 146 64 72 92
1200 to 1800 97 206 215 361 169 186 185 150 151 128 211 412 184 316 224 306 385 199 225 260
0000 to 0600 30.1 20.6 26.0 24.9 25.5 21.4 26.2 21.8 21.5 33.9 19.9 22.4 25.0 21.3 20.5 26.8 23.3 28.6 33.0 28.6
1200 to 1800 20.5 20.5 23.7 24.5 25.4 23.8 19.6 20.6 25.0 33.8 15.8 23.3 23.7 20.3 18.9 23.3 20.6 22.7 25.2 24.8
Comparing night to day, dispatched to arrived scene
differential should be ~0.0 min or less between 0000
- 0600 than 1200 - 1800
Average time out of service per call (min)
Comparing night to day, call received to arrived
scene differential should be ~0.0 min or less
between 0000 - 0600 than 1200 - 1800
Number of Incidents Apparatus Housed In Station
Responded To (2011)
Number of Incidents in Station Area

Service Efficiency Review – Toronto Fire Services & Toronto EMS
Page | 245
Exhibit B - Day - Night Comparison 2011 District 290th Percentile
Station 211 212 213 214 215 222 223 224 225 226 227 231 232 233 234 235 241 242 243 244 245
Alarm to Arrive (min) 0000 to 0600 9.1 9.0 10.5 10.8 10.7 8.8 9.9 10.3 8.6 9.4 9.8 9.5 9.8 8.2 8.9 9.2 9.1 8.9 9.1 9.3 8.6
1200 to 1800 8.3 10.1 9.0 9.3 8.7 8.2 8.6 8.2 7.7 8.2 8.1 8.9 10.2 7.9 9.3 9.1 9.4 8.0 8.2 8.3 9.1
Differential 0.7 -1.1 1.5 1.6 2.0 0.6 1.3 2.1 0.9 1.2 1.7 0.6 -0.5 0.3 -0.4 0.1 -0.3 1.0 0.9 1.0 -0.5
211 212 213 214 215 222 223 224 225 226 227 231 232 233 234 235 241 242 243 244 245
Alerted to Arrive (min) 0000 to 0600 7.8 8.2 8.5 9.6 8.9 7.6 8.3 8.7 6.8 7.6 8.0 7.8 8.4 7.2 7.7 7.3 7.5 7.7 7.8 8.0 7.6
1200 to 1800 7.2 8.2 7.5 7.4 7.0 6.8 7.3 6.7 6.5 6.5 6.6 7.7 8.0 6.6 7.8 7.8 7.7 7.0 7.1 6.5 6.7
Differential 0.6 0.0 1.0 2.2 1.9 0.8 1.0 2.0 0.3 1.1 1.4 0.1 0.4 0.6 -0.1 -0.5 -0.2 0.8 0.6 1.5 0.9
211 212 213 214 215 222 223 224 225 226 227 231 232 233 234 235 241 242 243 244 245
Enroute To Arrive (min) 0000 to 0600 5.5 5.2 5.8 6.9 6.4 4.5 6.2 5.0 4.2 4.6 5.3 5.4 5.7 4.5 4.8 4.7 4.4 5.4 5.4 5.4 5.2
1200 to 1800 5.7 6.1 5.7 5.5 5.3 5.3 5.5 4.5 4.7 4.7 4.7 5.7 6.4 5.1 5.8 5.7 5.5 5.3 5.3 4.8 5.3
Differential -0.2 -0.9 0.1 1.4 1.1 -0.8 0.7 0.5 -0.5 0.0 0.7 -0.3 -0.7 -0.6 -1.0 -1.0 -1.2 0.1 0.0 0.6 -0.1
Comparing night to day, enroute to arrived scene
differential should be ~0.0 min or less between 0000
- 0600 than 1200 - 1800
211 212 213 214 215 222 223 224 225 226 227 231 232 233 234 235 241 242 243 244 245
0000 to 0600 26 49 72 43 41 98 93 92 87 104 55 91 106 48 79 65 26 50 55 70 57
1200 to 1800 77 129 185 139 115 235 217 216 197 259 134 295 293 162 184 180 95 160 172 277 165
0000 to 0600 34 52 80 41 36 109 103 88 117 105 59 88 91 58 77 62 37 48 54 74 57
1200 to 1800 103 122 194 145 81 230 294 199 244 254 142 299 247 173 205 192 115 181 187 280 178
0000 to 0600 20.9 24.2 23.7 26.1 36.7 21.1 27.1 20.8 23.1 20.7 20.6 24.7 20.0 23.9 22.9 24.4 21.5 26.2 29.6 20.4 23.3
1200 to 1800 15.3 23.4 20.2 19.9 19.0 19.8 21.2 17.8 18.5 18.5 22.2 19.2 18.4 23.9 22.9 18.1 19.9 19.9 18.5 18.0 20.4
Comparing night to day, dispatched to arrived scene
differential should be ~0.0 min or less between 0000
- 0600 than 1200 - 1800
Average time out of service per call (min)
Comparing night to day, call received to arrived
scene differential should be ~0.0 min or less
between 0000 - 0600 than 1200 - 1800
Number of Incidents Apparatus Housed In Station
Responded To (2011)
Number of Incidents in Station Area

Service Efficiency Review – Toronto Fire Services & Toronto EMS
Page | 246
Exhibit C - Day - Night Comparison 2011 District 390th Percentile
Station 311 312 313 314 315 321 322 323 324 325 326 331 332 333 334 341 342 343 344 345 346
Alarm to Arrive (min) 0000 to 0600 9.3 7.7 7.5 6.9 7.8 9.6 8.6 8.3 7.7 7.6 7.7 8.3 7.5 7.8 7.8 8.3 7.6 9.9 7.9 7.8 8.1
1200 to 1800 7.5 6.7 9.1 6.8 7.2 8.6 8.8 7.0 7.9 6.5 7.2 7.4 6.8 6.9 8.7 8.2 7.1 8.0 7.0 7.6 7.1
Differential 1.8 1.0 -1.6 0.1 0.6 0.9 -0.2 1.3 -0.1 1.1 0.5 0.9 0.7 0.9 -0.9 0.1 0.5 1.9 0.9 0.2 1.0
311 312 313 314 315 321 322 323 324 325 326 331 332 333 334 341 342 343 344 345 346
Alerted to Arrive (min) 0000 to 0600 7.4 6.2 6.1 5.9 6.1 7.8 7.9 6.8 6.5 6.3 6.2 7.0 6.1 6.6 6.4 6.9 6.7 7.5 6.6 6.4 6.3
1200 to 1800 6.4 5.3 6.7 5.4 5.8 6.6 6.9 5.6 5.9 5.2 5.6 6.3 5.5 5.5 6.5 6.7 6.2 6.4 5.6 6.1 6.3
Differential 1.0 0.9 -0.6 0.5 0.3 1.1 1.0 1.2 0.6 1.1 0.7 0.7 0.6 1.1 -0.2 0.2 0.5 1.2 1.0 0.4 0.0
311 312 313 314 315 321 322 323 324 325 326 331 332 333 334 341 342 343 344 345 346
Enroute To Arrive (min) 0000 to 0600 4.4 3.6 4.0 3.5 3.9 5.4 4.5 4.1 3.7 3.6 3.8 4.1 3.6 3.9 4.2 4.1 4.5 4.5 4.5 4.2 2.4
1200 to 1800 4.3 3.9 5.3 3.8 4.3 4.8 5.1 4.0 4.2 3.7 3.8 4.5 4.2 4.0 5.1 5.1 4.6 4.7 4.1 4.4 3.5
Differential 0.2 -0.3 -1.3 -0.3 -0.4 0.6 -0.6 0.0 -0.5 -0.1 0.0 -0.4 -0.6 -0.1 -0.9 -1.0 -0.1 -0.2 0.4 -0.2 -1.1
Comparing night to day, enroute to arrived scene
differential should be ~0.0 min or less between 0000
- 0600 than 1200 - 1800
311 312 313 314 315 321 322 323 324 325 326 331 332 333 334 341 342 343 344 345 346
0000 to 0600 64 158 170 182 148 38 87 69 70 266 62 172 204 153 72 89 55 56 115 113 1
1200 to 1800 208 383 350 333 295 160 254 181 165 510 142 297 342 301 150 272 120 156 295 266 3
0000 to 0600 87 139 177 258 140 28 88 83 70 247 56 151 301 168 93 87 62 69 108 111 11
1200 to 1800 306 313 418 529 280 150 261 210 152 439 134 244 455 297 208 261 134 189 301 246 19
0000 to 0600 31.7 17.4 16.8 18.2 20.4 33.9 20.7 27.3 22.4 16.6 20.4 22.4 19.5 20.5 23.3 24.7 22.5 26.7 24.5 22.7 42.7
1200 to 1800 19.2 16.5 17.9 16.0 18.0 20.1 20.1 17.1 17.9 15.6 19.1 19.6 19.0 17.6 23.5 22.5 25.2 22.2 18.8 19.7 11.7
Comparing night to day, dispatched to arrived scene
differential should be ~0.0 min or less between 0000
- 0600 than 1200 - 1800
Average time out of service per call (min)
Comparing night to day, call received to arrived
scene differential should be ~0.0 min or less
between 0000 - 0600 than 1200 - 1800
Number of Incidents Apparatus Housed In Station
Responded To (2011)
Number of Incidents in Station Area

Service Efficiency Review – Toronto Fire Services & Toronto EMS
Page | 247
Exhibit D - Day - Night Comparison 2011 District 490th Percentile
Station 411 412 413 415 421 422 423 424 425 426 431 432 433 434 435 441 442 443 444 445
Alarm to Arrive (min) 0000 to 0600 9.4 10.1 9.0 10.4 9.4 8.3 8.0 7.0 10.3 8.8 9.6 9.6 9.4 9.0 9.8 9.3 9.0 10.3 11.1 10.0
1200 to 1800 9.2 9.1 8.9 9.5 8.1 7.5 7.2 8.2 10.8 7.4 8.8 8.1 9.4 8.9 8.3 9.7 8.7 8.7 10.6 9.9
Differential 0.2 1.0 0.0 0.9 1.3 0.8 0.8 -1.2 -0.5 1.3 0.8 1.5 0.0 0.1 1.5 -0.4 0.3 1.6 0.5 0.2
411 412 413 415 421 422 423 424 425 426 431 432 433 434 435 441 442 443 444 445
Alerted to Arrive (min) 0000 to 0600 8.1 9.0 7.7 8.7 7.6 6.4 7.2 6.0 8.3 7.2 8.2 8.2 7.7 7.5 7.9 7.8 7.6 8.8 8.8 5.1
1200 to 1800 7.5 7.6 7.7 8.3 6.6 6.3 5.5 6.0 8.9 5.9 7.7 6.8 7.6 7.6 6.8 8.1 7.1 7.1 8.9 8.1
Differential 0.5 1.3 0.0 0.4 1.0 0.1 1.7 0.0 -0.6 1.2 0.5 1.4 0.1 -0.2 1.2 -0.3 0.5 1.7 -0.1 -2.9
411 412 413 415 421 422 423 424 425 426 431 432 433 434 435 441 442 443 444 445
Enroute To Arrive (min) 0000 to 0600 5.2 6.1 4.6 6.1 4.4 4.3 4.2 4.2 5.5 4.5 5.1 5.8 5.0 5.1 5.0 5.5 5.1 5.5 6.1 5.7
1200 to 1800 5.7 5.9 5.3 6.3 4.7 4.8 4.1 4.1 7.1 4.4 6.0 5.0 5.7 5.7 5.2 6.3 5.5 5.1 6.6 6.4
Differential -0.6 0.2 -0.7 -0.2 -0.3 -0.5 0.1 0.1 -1.6 0.1 -0.9 0.8 -0.7 -0.6 -0.2 -0.8 -0.4 0.5 -0.5 -0.6
Comparing night to day, enroute to arrived scene
differential should be ~0.0 min or less between 0000
- 0600 than 1200 - 1800
411 412 413 415 421 422 423 424 425 426 431 432 433 434 435 441 442 443 444 445
0000 to 0600 65 62 131 72 78 43 85 38 46 238 29 43 106 23 88 98 130 69 54 88
1200 to 1800 199 131 309 230 262 110 208 112 116 483 95 141 220 86 170 274 300 208 169 248
0000 to 0600 69 71 124 61 81 38 98 31 42 247 35 41 106 26 100 113 150 78 44 116
1200 to 1800 222 166 277 208 256 106 226 71 117 531 115 150 245 99 183 300 361 280 173 268
0000 to 0600 30.3 27.9 25.4 23.5 28.3 27.0 29.2 29.9 26.9 22.3 16.0 25.1 24.0 22.8 22.0 27.3 24.1 24.3 25.0 25.4
1200 to 1800 26.5 23.2 22.0 22.5 21.3 22.1 20.7 21.7 22.1 18.9 18.7 21.7 23.7 21.6 22.1 27.3 22.5 22.4 23.0 24.1
Notes
Comparing night to day, dispatched to arrived scene
differential should be ~0.0 min or less between 0000
- 0600 than 1200 - 1800
771 calls in the 0000 to 0600 window had road response times less than 1.5 minutes or more than 15 minutes and the times were not included in the calculations. (The calls were included in the counts)
2406 calls in the 1200 to 1800 window had road response times less than 1.5 minutes or more than 15 minutes and the times were not included in the calculations. (The calls were included in the counts)
Average time out of service per call (min)
Comparing night to day, call received to arrived
scene differential should be ~0.0 min or less
between 0000 - 0600 than 1200 - 1800
Number of Incidents Apparatus Housed In Station
Responded To (2011)
Number of Incidents in Station Area

Service Efficiency Review – Toronto Fire Services & Toronto EMS
Page | 248
Appendix F – Maps Indicating Demographics and Fire Related Civilian Injury &
Death

Service Efficiency Review – Toronto Fire Services & Toronto EMS
Page | 249
Appendix G – Risk – High Level Overview
Risk – High Level Overview In place of the Comprehensive Fire Risk Analysis, a general high level review of the fire risk for the City of Toronto was done using the Office of the Ontario Fire Marshal (OFM) document entitled “Comprehensive Fire Safety Effectiveness Model: Fire Risk Sub-Model, June 2009” as the guideline for this cursory overview. Much of the content of this section is taken from the Fire Marshal’s Guideline. In the document risk is defined as a measure of the probability and consequence of an adverse effect to health, property, organization, environment, or community as a result of an
event, activity or operation. For the purposes of the Fire Risk Sub-model, such an event refers to a fire incident along with the effects of heat, smoke, and toxicity threats generated from the incident. The Fire Risk Sub-Model offers guidance on the likelihood of events, the consequence levels of events, along with suggestions for matching probability and consequence to priority levels for attention and action.
Table 41 - Likelihood Levels as Defined by the Ontario Fire Marshal
The OFM suggests that the frequency of incidents should only be used as a general guide when determining this value. It should be complemented with consideration of events that occur within other communities. Events that have not taken place for a long time in one community may occur more frequently elsewhere.
Description Level Specifics
Rare 1 -may occur in exceptional circumstances -no incidents in the past 15 years
Unlikely 2 -could occur at some time, especially if circumstances change
-5 to 15 years since last incident
Possible 3 -might occur under current circumstances -1 incident in the past 5 years
Likely 4 -will probably occur at some time under current circumstances
-multiple or recurring incidents in the past 5 years
Almost Certain 5 -expected to occur in most circumstances unless circumstances change
-multiple or recurring incidents in the past year

Service Efficiency Review – Toronto Fire Services & Toronto EMS
Page | 250
Table 42 - Consequence Levels as Defined by the Ontario Fire Marshal
Description Level Specifics
Insignificant
1
1. no life safety issue
2. limited valued or no property loss
3. no impact to local economy and/or
4. no effect on general living conditions
Minor
2
1. potential risk to life safety of occupants
2. minor property loss
3. minimal disruption to business activity and/or
4. minimal impact on general living conditions
Moderate
3
1. threat to life safety of occupants
2. moderate property loss
3. poses threat to small businesses and/or
4. could pose threat to quality of the environment
Major
4
1. potential for a large loss of life
2. would result in significant property damage
3. significant threat to large businesses, local economy and tourism, and/or
4. impact to the environment would result in a short term partial evacuation
of local residents and businesses
Catastrophic
5
1. significant loss of life
2. multiple property damage to significant portion of the municipality
3. long term disruption of businesses, local employment, and tourism and/or
4. environmental damage that would result in long-term evacuation of local
residents and businesses
The consequences, as a result of fire, are the potential loss or negative outcomes associated with the event. The application of professional judgment and reviews of past occurrences are important methods used for quantifying consequence levels. Estimating the consequence level due to fire involves an evaluation of four components:
Life Safety Injuries or loss of life due to occupant and firefighter exposure to life threatening fire
or other situations; Property Loss
Monetary losses relating to private and public buildings, property content, irreplaceable assets, significant historic/symbolic landmarks and critical infrastructure;
Economic Impact Monetary losses associated with property income, business closures, downturn in
tourism, tax assessment value, employment layoffs;
Environmental Impact

Service Efficiency Review – Toronto Fire Services & Toronto EMS
Page | 251
Harm to human and non-human (i.e. wildlife, fish and vegetation) species of life and
general decline in quality of life within the community due to air/water/soil contamination as a result of fire and fire suppression activities.
Risk and priority levels are defined as follows and shown in the matrix in :
L=Low Risk - Priority Level 1 (L1)-manage by routine programs and procedures,
maintain risk monitoring
M = Moderate Risk Priority Level 2 (L2)-requires specific allocation of management responsibility including monitoring and response procedures
H = High Risk Priority - Level 3 (L3)-community threat, senior management attention
needed
E = Extreme Risk - Priority Level 4 (L4)-serious threat, detailed research and management planning required at senior levels
Table 43 - Ontario Fire Marshal Risk Analysis Matrix
Probability Consequence
1
(Insignificant)
2
(Minor)
3
Moderate
4
(Major)
5
(Catastrophic)
1 (Rare) L (L1) L (L1) M (L2) H (L3) H (L3)
2 (Unlikely) L (L1) L (L1) M (L2) H (L3) E (L4)
3 (Possible) L (L1) M (L2) H (L3) E (L4) E (L4)
4 (Likely) M (L2) H (L3) H (L3) E (L4) E (L4)
5 (Almost Certain) H (L3) H (L3) H (L3) E (L4) E (L4)
The OFM Sub Risk Model document provides an overview of the considerations for each risk factor and offers some samples of concerns related to a Community Fire Risk Profile. Property Stock Building Height and Area Building Age and Construction Building Exposures Demographic Profile Geography/Topography
Past Fire Loss Fuel Load In each of these identified risk factors identified by the OFM, Toronto has a number of areas of concern. The city has the most diverse property stock in Ontario. There are large areas of the City, identified by the Planning Department as centres and avenues for future growth where existing buildings predate the National Building Code and the Ontario Building Code. Toronto has more highrise buildings than any other city in the province and is among the leaders in highrise building numbers across North America. According to a report dated December 2, 2011 in the Toronto Star, Toronto ranked No. 1 in North American cities for
highrises under construction in 2011 with 150 while No. 2 Mexico City had 88 and No. 3 New York City had 86. Of the 150 in Toronto, 140 were condo towers, 15 were office towers, 10

Service Efficiency Review – Toronto Fire Services & Toronto EMS
Page | 252
were rental buildings, 6 were hospitals and 4 were hotels. The same report pointed out that
Toronto ranked second in North America for the number of highrise buildings with 1,879. According to the report 39% of Toronto households were now in highrise buildings. Many of Toronto’s buildings in the core centres are closely constructed or connected to each other. Accessibility and response can be impeded by traffic and construction congestion, streetcar transit infrastructure and rush hour volumes. Toronto has a significant history of large fire and other major incidents involving building and neighbourhood evacuations and economic impact upon businesses where TFS is the lead response group (Sunrise Propane explosion, Queen Street West fire, 2 Secord Avenue Hydro Vault explosion, 200 Wellesley highrise fire). In addition to hazardous and combustible materials housed in industrial and
commercial operations throughout the city, there are large quantities of these materials being transported through the city on highways, streets and rail lines. Toronto is on the flight path for three airports. HIRA (Hazardous Incident Risk Assessment) Report It is a requirement from municipalities under the Emergency Management and Civil Protection Act that “in developing its emergency management program, every municipality shall identify and assess the various hazards and risks to public safety that could give rise to emergencies and identify the facilities and other elements of the infrastructure that are at risk of being affected by emergencies”
A review of the TFS's role in Community Emergency Preparedness and Response shows that 90.3% of the Specific Hazards identified in the community HIRA report will involve TFS as a major responder. In addition, 80.6% of identified HIRA specific hazards are not directly related to firefighting but fall within the areas for which TFS is trained and equipped to provide emergency service The 31 hazards identified in the report are potential long-term events which will deplete normal response capabilities The HIRA report states High, Medium and Low probability phases in which TFS would be a
major responder where 87.5% of the hazards are in the High and Medium range. It should be pointed out that TFS would be a major responder where these types of events occur at a level below that of a declared emergency. These include but are not limited to special operations such as wildland/interface firefighting, technical rescue, marine firefighting, joint operations responses, urban search and rescue, mass casualty response, hazardous materials mitigation, counter-terrorist response, and incident management teams for disaster response. In addition, TFS responds to water and ice rescue, vehicle extrication, and other public hazards, many of which are typically high risk and which require specialized skills, knowledge and abilities from firefighters. TFS is a critical component in the all hazards
protection provided to those living or visiting in Toronto.

Service Efficiency Review – Toronto Fire Services & Toronto EMS
Page | 253
Reference:
HIRA report, report to City Council (FUS) 2002 and FUS report
TFS Simplified Risk Assessment (Material Supplement) June 2012 TORONTO The City of Toronto is a large, densely populated urban city with all of the complex attributes of other large cities, and then some. Toronto ranks in the top ten cities in the world in high-rise buildings per capita. Toronto has risks that most other cities its size do not have to contend with - subway system, the PATH system, island residents, island airport, CN Tower, to name a few. There are 41 Special Structures identified by Toronto City Planning, Research and Information, 30 of which are located within the area bounded by Spadina, Dundas, Jarvis
and Lake Ontario. They have also identified that the vast majority of buildings in Toronto were constructed from pre-1900 to 1970 (332,317 buildings out of 451,460 or 73.6%). This puts construction of the majority of buildings in Toronto prior to the enactment of the Ontario Building Code (1975) and the Ontario Fire Code (1981).
The Toronto City Planning, Policy & Research Unit has estimated Toronto's daytime population at approximately 3,045,417 people. This figure is roughly 430,000 people more than the city's population. Commuters coming into the city to work, as well as students and tourists account for much of the daily increase.
The city also received approximately 152,000 applications for residential units between 2006 and 2011. Of these, 40,000 proposed units have been approved but not yet under construction, and another 38,450 are under construction but not yet completed. Taken together, these 78,500 (currently) un-occupied units could house up to an additional 140,500 people. However, to put this into perspective, the city’s population is not expected to grow to that extent until after 2028, assuming growth remains steady. Readers should also reference Chart 1- Population Growth Related to Core Fire Incidents which indicates:
When fire service responses from 2005 to 2011 are examined and medical emergencies
and alarm calls are filtered out … we find that the fire service’s call volume, by type, has
remained stable or declined during that time period. When the core fire incident trend is
compared to Toronto’s population growth we can see that there is actually a decline in
incident growth. Put another way, population growth and fire core incident volume are not
directly related and Toronto’s population growth is not a signal of increased call volume
for the fire service, at least not on a straight-line per capita basis.
So, while we recognize that infrastructure and population growth can affect risk, evidence indicates that there is not a correlation between elevated risk just because of growth; other factors have to be in place also, and TFS has the opportunity to ameliorate any increase in risk through education, prevention, leading a lobby for changes to the fire code and building code (such as residential sprinklers), and increased enforcement.

Service Efficiency Review – Toronto Fire Services & Toronto EMS
Page | 254
Toronto's population is continuing to shift. In the five years since the 2006 Census, Toronto
has continued to gain older adults; the share of adults 75+ years has increased from 7.0% to 7.2%. At the same time, the number of children 0-4 has also increased by 5,530 or 4.1%. The two fastest growing age groups between 2006 and 2011 were people aged 60-64 years and 85+ years. Those aged 60-64 grew by 28.8% (from 109,465 to 140,965) while the 85+ group increased 5% (from 43,100 to 54,965). According to projections prepared by the City Planning Division, between 1996 and 2011 the number of seniors was expected to grow by 39,315 persons or by 12.3%. The 2011 census data shows the actual change among Toronto seniors 65+ is 18.0% - well above the projected estimates.
The senior cohort in Toronto is expected to increase strongly in the coming years. Between 2011 and 2031 City Planning projects the size of this group to increase by one-third. Charts 14 and 15 from the Ontario Fire Marshal’s Office illustrates the death rate and the death risk by age group for the province of Ontario. The Ontario Fire Marshal reports that people in the 50+ age bracket are the most vulnerable group when it comes to fire fatality in Ontario although there is indication that this is the case in Toronto. Nevertheless, we don’t dispute that this is accurate on a province-wide basis.

Service Efficiency Review – Toronto Fire Services & Toronto EMS
Page | 255
Chart 14 - Ontario-wide Fire Deaths by Age
Chart 15 - Fire Death Risk Index

Service Efficiency Review – Toronto Fire Services & Toronto EMS
Page | 256
This is a growing demographic group in Toronto which will need more attention in terms of public education efforts for fire safety, and with inspections of fire code compliance where this group lives in residential settings that include highrise apartments and condominiums, retirement or assisted living settings, nursing homes and other care facilities. Toronto’s age cohorts according to Statistics Canada can be found in Table 36.
Table 44 - StatCan Toronto Age Cohort
2001 2006 2011
Population % Population % Population %
0-4 143,510 5.78% 134980 5.39% 140510 5.37%
05-14 290310 11.70% 274640 10.97% 260350 9.96%
15-24 308415 12.43% 318655 12.73% 333515 12.75%
25-34 413020 16.64% 385925 15.42% 413015 15.79%
35-44 429860 17.32% 415615 16.60% 387805 14.83%
45-54 337470 13.60% 362425 14.48% 398915 15.25%
55-64 221080 8.91% 257585 10.29% 303495 11.61%
65-74 185180 7.46% 178995 7.15% 188630 7.21%
75-84 116400 4.69% 131350 5.25% 133845 5.12%
85+ 36265 1.46% 43100 1.72% 54965 2.10%
2,481,510 100.00% 2,503,270 100.00% 2,615,045 100.00%
Upon further examination though, we find that a general decline in fire related incidents offsets whatever growth may be expected because of an aging demographic. Table 45 -
Percentage and Population Change, by Cohort, Between 2006 and 2011, demonstrates the percentage and population change, by cohort, between 2006 and 2011 based on StatCan information.

Service Efficiency Review – Toronto Fire Services & Toronto EMS
Page | 257
Table 45 - Percentage and Population Change, by Cohort, Between 2006 and 2011
According to StatCan Toronto’s population grew by 111,775 between 2006 and 2011 (). In 2011 TFS’s core incidents per capita was 0.014 or 1.39%. The highest incidents per capita was 0.015 in 2006. If one assumes that incident volume is directly related to population, then the fire service should have seen an increase of 1,559 incidents between 2006 and 2011 (population growth of 111,775 x 1.39% = 1,559). In actuality there was a decrease of core calls (non-medical, non-alarm) of 1,535 during the same period (2.2 Fire Services Data and
Statistics). Therefore, we conclude, in the case of TFS, population growth does not translate into an increase in incidents.
Operations Structural firefighting operations are complex in nature and require both simultaneous and sequential tasks to be performed for safe and successful intervention and mitigation of an incident. Structural fires can range from small detached sheds or storage facilities to multi-storey, multi-use high-rise buildings or huge commercial/industrial facilities. The larger the building, the more complex structural firefighting operations become, and greater become the number of tasks that have to be performed. Fires in small structures as well as large structures require sustainability of required tasks in order to achieve the objectives of rescue, control and extinguishment, and protection of property and the environment. In
order to be able to operate safely, an organizational structure (Incident Command/Incident Management) is put into play at each and every event involving the fire service. The critical
2005 - 2011
2006 2011 Percentage Change Population Change
Fire Response
Per Capita*
0-4 134980 140510 4.1% 5,530 1.39%
05-14 274640 260350 -5.2% -14,290
15-24 318655 333515 4.7% 14,860
25-34 385925 413015 7.0% 27,090
35-44 415615 387805 -6.7% -27,810
45-54 362425 398915 10.1% 36,490
55-64 257585 303495 17.8% 45,910
65-74 178995 188630 5.4% 9,635
75-84 131350 133845 1.9% 2,495
85+ 43100 54965 27.5% 11,865
StatCan Population Change 2001 - 2011 111,775
Call Growth that Should Occur if Per Capita Hypothesis is True 1559
Actual Call Change 2005 - 2011 (Chart 2) -1535
*Non-medical, non-alarm calls per capita 2011

Service Efficiency Review – Toronto Fire Services & Toronto EMS
Page | 258
tasks are assigned to teams as part of the overall plan established by the incident
commander. The timely and coordinated performance of the critical tasks determines the level of success of firefighting operations. Time is always the enemy when dealing with fire. The fire expands exponentially from the point of origin to the room of origin; from incipient stage to flashover; from room of origin to multiple rooms; from contents alone to contents and structural components. Fire does not stand still and wait patiently for attention and intervention. “The Office of the Fire Marshal (OFM) recognizes an organized, rapid, aggressive and offensive approach to fire suppression as the most effective strategy to mitigate a fire, therefore potentially reducing the loss of life and property. This strategy is based upon the
OFM Fire Progression Curve (See graph below). A fire grows upon itself exponentially - time versus fire growth.

Service Efficiency Review – Toronto Fire Services & Toronto EMS
Page | 259

Service Efficiency Review – Toronto Fire Services & Toronto EMS
Page | 260
The impact of time on fire growth cannot be underestimated and an understanding of the
time/fire growth relationship is essential when assessing risks and developing response standards, protocols and fireground tactics.” (OFM Operational Planning: A Guide to Matching Resource Deployment and Risk, January 24, 2011) TFS operates out of 82 fire stations in 4 command districts. The mapping of residential fire locations over the past 3 years shows that fires have occurred in every command and virtually every station district. Similar mapping for commercial/industrial fires shows that these fires occur within each of the commands and in most station districts over the period. Currently TFS is sending sufficient resources as first response to single family residences in
suburban setting areas based upon the NFPA 1710 Standard (since the addition of the extra vehicle in July of 2012). It should be pointed out that the NFPA 1710 standard is based upon a suburban setting response to a single family, two-storey residence of 2,000 square feet or less with no basement and no exposures. Where there is a basement, exposures, more than 2 storeys and or a larger dwelling, adjustments in response must be made to address the additional task requirements. Where TFS is responding to urban single family dwellings with any of the additional conditions there should be an increase in first response resources. NFPA 1710 states:
5.2.4 Deployment.
5.2.4.1.1 The fire department’s fire suppression resources shall be deployed to provide for the arrival
of an pumper company within a 240-second travel time to 90 percent of the incidents as established
in Chapter 4.
5.2.4.1.2* Personnel assigned to the initial arriving company shall have the capability to implement
an initial rapid intervention crew (IRIC).
5.2.4.2 Initial Full Alarm Assignment Capability.
5.2.4.2.1 The fire department shall have the capability to de- ploy an initial full alarm assignment
within a 480-second travel time to 90 percent of the incidents as established in Chapter 4.
5.2.4.2.2* The initial full alarm assignment to a structure fire in a typical 2000 ft2 (186 m2), two-story
single-family dwelling without basement and with no exposures shall provide for the following:
(1) Establishment of incident command outside of the hazard area for the overall coordination and
direction of the initial full alarm assignment with a minimum of one individual dedicated to this task
(2) Establishment of an uninterrupted water supply of a minimum of 400 gpm (1520 L/min) for 30
minutes with sup- ply line(s) maintained by an operator
(3) Establishment of an effective water flow application rate of 300 gpm (1140 L/min) from two
handlines, each of which has a minimum flow rate of 100 gpm (380 L/min) with each handline
operated by a minimum of two individuals to effectively and safely maintain the line
(4) Provision of one support person for each attack and backup line deployed to provide hydrant
hookup and to assist in laying of hose lines, utility control, and forcible entry
(5) Provision of at least one victim search and rescue team with each such team consisting of a
minimum of two individuals (6) Provision of at least one team, consisting of a minimum of two
individuals, to raise ground ladders and perform ventilation

Service Efficiency Review – Toronto Fire Services & Toronto EMS
Page | 261
(6) Provision of at least one team, consisting of a minimum of two individuals, to raise ground ladders
and perform ventilation
(7) If an aerial device is used in operations, one person to function as an aerial operator and maintain
primary control of the aerial device at all times
(8) Establishment of an IRIC consisting of a minimum of two properly equipped and trained
individuals
5.2.4.2.3* Fire departments that respond to fires in high-, medium-, or low-hazard occupancies that
present hazards greater than those found in the low-hazard occupancy described in 5.2.4.2.2 shall
deploy additional resources on the initial alarm.
5.2.4.3 Additional Alarm Assignments.
5.2.4.3.1* The fire department shall have the capability to deploy additional alarm assignments that
can provide for additional command staff, personnel, and additional services, including the
application of water to the fire; engagement in search and rescue, forcible entry, ventilation, and
preservation of property; safety and accountability for personnel; and provision of support activities
for those situations that are beyond the capability of the initial full alarm assignment.
5.2.4.3.2 When an incident escalates beyond an initial full alarm assignment or when significant risk
is present to the fire fighters due to the magnitude of the incident, the incident commander shall
upgrade the IRIC to a full rapid intervention crew(s) (RIC) that consists of an officer and at least three
fire- fighters who are fully equipped and trained in RIC operations.
5.2.4.3.3 An incident safety officer shall be deployed to all incidents that escalate beyond an initial
full alarm assignment or when significant risk is present to fire fighters.
5.2.4.3.4 The incident safety officer shall ensure that the safety and health system is established as
required in Section 6.1.”
The range of critical tasks taken from “Operational Planning: An Official Guide to Matching Resource Deployment and Risk - January 24, 2011” issued by the OFM is set out on the following page. The matrix illustrates the complexity and magnitude of tasks that may need to be performed by firefighters, in many cases simultaneously, in order to minimize the impacts of a working fire on people, property and business.

Service Efficiency Review – Toronto Fire Services & Toronto EMS
Page | 262
Critical Task Matrix (Form 300A)
Low Risk Moderate
Risk High Risk
Extreme Risk
Fireground Critical Tasks LERL UERL LERL UERL LERL UERL LERL UERL
Incident Command* 1 1 1 1 1 1 1 1
Pump Operator 1 1 1 1 1 1 1 1
Attack Line (Confine & Extinguish)
2 2 2 2 2 2 2 2
Additional Pump Operator(s) 0 0 0 2 2 4 4 6
Additional Attack Line (Confine & Extinguish) + Backup
0 0 0 4 4 8 8 12
Incident Response (Note: Where zero or no number has been assigned, the task may be performed at the direction of the incident commander.)
Search & Rescue 0 0 2 4 2 6 2 8
Initial Rapid Intervention Team (IRIT)
0 0 4 6 8 16 12 22
Ventilation 0 2 2 2 2 4 2 8
Water Supply – pressurized 0 1 1 1 1 1 1 2
Water Supply – non-pressurized 0 3 1 4 2 6 4 8
Forcible Entry Team 0 0 0 0 0 1 0 1
Utilities 0 1 1 1 1 1 1 1
Laddering (Ground Ladders) 0 2 0 2 0 4 0 6
Laddering (Aerial or elevating device operator)
0 0 0 2 0 2 0 2
Exposure Protection 0 4 2 6 2 6
Incident Safety Officer 0 1 1 1 1 1
Accountability 1 1 1 1 1 1
Entry Control 0 2 1 4 1 4
Rehabilitation 0 1 1 1 1 1
Salvage 0 2 2 2 2 2
Lighting 0 2 0 2
Directing Occupants 0 4 0 4
Scribe 1 1 1 1
Sector Officers 1 4 1 4
Air Management (air refilling station, etc.)
1 2
Other or Additional Response Considerations
Logistics Officer
Administrative and/or Finance Officer
Planning Officer
Evacuations (large scale)
Communications (dispatch)
Public Information Officer
Overhaul
Additional Firefighters
Summary
Incident Response Range 4 13 16 43 36 83 49 108
Total Fire Department including External
Fire Call Incident Response Range (+, –, within)

Service Efficiency Review – Toronto Fire Services & Toronto EMS
Page | 263
Critical Task Matrix (Form 300A)
Low Risk Moderate
Risk High Risk
Extreme Risk
Fireground Critical Tasks LERL UERL LERL UERL LERL UERL LERL UERL
Notes:
LERL = Lower Effective Response Level & UERL = Upper Effective Response Level, [together form the critical staffing range] This tool provides a range of staffing requirements only. Actual numbers may vary depending on the fire risk that exists in the municipality. Tasks performed on fireground based on decisions made by Incident Commander.
Planning moderate, high and extreme risk occupancies/locations will further validate staffing requirements.
Simultaneous events will require further consideration due to additional personnel requirements beyond the scope of this matrix. *Incident Command will assume responsibilities of the incident safety officer, accountability and entry control when no person has been assigned.

Service Efficiency Review – Toronto Fire Services & Toronto EMS
Page | 264
Appendix H – An Examination of Ambulance Offload Times at Hospitals
Terminology and Concepts
The following terminology and concepts are used throughout the discussion of ambulance offload times: Ambulance offload time is the total time between ambulance arrival at the hospital and ambulance departure from the hospital. Transfer of care is the process (or point) at which patient care is transferred from the EMS
staff to the hospital staff. Pre-transfer time starts when the ambulance arrives at the hospital and ends when transfer of care takes place.
Post-transfer time starts when transfer of care is completed (hospital accepts responsibility for the patient) and ends when the ambulance leaves the hospital. Transfer of care time is the time required to compete the transfer-of-care process.
Concepts of Ambulance Offload Time
Ambulance offload time can be divided into two segments: pre-transfer time and post-transfer time. Pre-transfer time is typically dependent on the performance of the
hospital. Post-transfer time is typically dependent on the performance of the EMS staff (Figure 13, below).
Figure 13 - Schematic showing how ambulance offload time can be analyzed
Pre-Transfer Time
(normally hospital dependent)
Post-Transfer Time
(normally EMS dependent)
Ambulance
arrives
Transfer
of care
Ambulance
Departs
Documentation, Equipment &
Vehicle Cleanup & Preparation

Service Efficiency Review – Toronto Fire Services & Toronto EMS
Page | 265
Delayed Availability
The ideal ambulance offloading scenario would include a clear transfer of patient care at the transfer of care point. In other words, transfer of care will take place once the hospital reports via the Patient Destination System65 that transfer has occurred. However, it has been reported, and we have observed that paramedics sometimes continue to be delayed after transfer of care has been reported because a report still has to be given to the receiving nurse or other reasons for delay occur. Theoretically, once transfer of care is completed, and reported, EMS staff would be free to prepare their ambulance and equipment for the next assignment and leave the hospital. That is not always the case.
Realistically, and in most current offloading scenarios, the hospital and EMS share accountability during transfer of care. Transfer of care is a process, not a point in time, and this can delay availability of the EMS staff.
What do EMS Staff do During Post-Transfer Time?
Once transfer of care takes place, the EMS staff are free to leave. However, they must also complete a number of tasks before they can respond to the next call. These tasks can include: cleaning and making up the stretcher after the patient disembarks, recovering and cleaning EMS equipment that could be with the patient, restocking the ambulance, completing patient care records, and more. Some of these tasks can be accomplished by one paramedic during the wait time while the second paramedic monitors the patient.
When post-transfer time is measured, errors can occur. For example, the emergency department may have pushed the button that notifies the TEMS dispatch that the patient has been accepted, but the patient may not have been transferred to an emergency department stretcher. The patient could be on a hospital stretcher but the nurse who will care for the patient has not yet received the transfer report from the paramedics. When false post-transfer times were noted, they were not included in the analyses.
Ambulance Offload Time versus Pre-Transfer and Post-Transfer Times
The data indicates a relatively linear correlation between ambulance offload time and the pre-transfer time (blue points) which are both at a 90th percentile calculation (Chart 16).
This suggests that the ambulance offload time is directly correlated to the pre-transfer time. In other words, the longer the pre-transfer time, the longer the ambulance offload time.
The data also shows that post-transfer time (red points) is not linear with the ambulance offload time. The data is clustered around 80 minutes of ambulance offload time. However, there are some outliers with 100+ minutes of ambulance offload time (at a 90th percentile calculation). Hence, the relationship between ambulance offload time and post-transfer
65
An interconnecting system between TEMS and Toronto area hospitals which suggests patient destination based on hospital activity and patient severity. Emergency departments also use the patient destination system to report, to the TEMS communication centre, when transfer of care has taken place.

Service Efficiency Review – Toronto Fire Services & Toronto EMS
Page | 266
Outliers in Post-
Transfer Time
time is not linear. Moreover, the post-transfer times have a narrower range, with some outliers. The overall impact of pre-transfer time and post-transfer time on ambulance offload time deserves further review.
Chart 16 - 2011 Correlation between ambulance offload time versus pre-transfer time and post-transfer time by station area level (i.e. location of the call)
Ambulance Offload Times at Toronto Hospitals
We note that the five hospitals with the longest ambulance offload times in 2011 (measured at the 90th percentile), are also hospitals that have an RN offload initiative
(Chart 17). The RN offload initiative makes RNs available at a hospital to facilitate the ambulance offload process. In these five hospitals, the RN initiative may not be achieving the results expected.
There are Toronto hospitals, however, that have had successes with the RN offload initiative. A contributing factor, particularly in the average ambulance offload time for all hospitals, is the change to the Pay-For-Results performance initiative by the Ministry of Health and the Local Health Integration Network (MOH/LHIN), where overall emergency wait times have improved significantly. A reduction in overall emergency department wait times assists in reducing the time that paramedics have to wait to transfer their patients to
the care of emergency departments. Therefore, it is possible that the combination of the

Service Efficiency Review – Toronto Fire Services & Toronto EMS
Page | 267
Pay-For-Results performance initiative and the RN offload initiative have contributed to reduce emergency department wait times.
Chart 17 - 2011 Data Showing the Five Toronto Hospitals with the Highest Ambulance Offload Times and the Average Ambulance Offload Times for all Hospitals
66
Transfer of Care Time
The time to complete the transfer of care process was analyzed among hospitals. Currently, hospitals indicate transfer of care time in the Patient Destination System (PDS) by pushing a button which sends a signal to the ambulance communications centre’s computer aided dispatch. Transfer of care times are considered invalid when transfer of care is captured after the ambulance leaves the hospital. Additionally, calculations in pre-transfer times and post-transfer times will be incorrect if the transfer of care times is not correctly captured.
Table 46 - Number of transports in 2011 with valid and invalid transfer of care times shows that 78% of transfer of care times are valid among the 173,308 transport records captured in 2011. But the level of compliance for capturing valid transfer of care times varies among hospitals, with Etobicoke General and Humber Finch having 44.0% and 75.3% compliance rates respectively, below the average of 78%. These two hospitals are also among the five Toronto hospitals with the longest ambulance offload time (Chart 17).
Currently, TEMS sends monthly compliance reports to each hospital that shows transfer of care times, and this practice encourages improvements in data capture compliance.
66 The All Hospitals calculation includes all hospital transports in the Patient Destination System (PDS)

Service Efficiency Review – Toronto Fire Services & Toronto EMS
Page | 268
Capturing valid transfer of care times is critical to understanding the performance of pre-transfer times and post-transfer times.

Service Efficiency Review – Toronto Fire Services & Toronto EMS
Page | 269
Table 46 - Number of transports in 2011 with valid and invalid transfer of care times
Invalid Transfer of Care Times
67
Valid Transfer of Care Times
Institutions Without Transfer of Care measurements
Total Transports Captured
% Inclusion of Pre-transfer time and post-transfer time Calculation Based on Valid Transfer of Care Times
Ajax
40 40
Brampton
23 23
Branson
2 2
Credit Valley
23 23
East General 3,179 11,686
14,865 78.6
Etobicoke General 5,412 4,254
9,666 44.0
Humber Church 2,937 10,062
12,999 77.4
Humber Finch 2,377 7,234
9,611 75.3
Markham Stouffville
143 143
Trillium - Mississauga General
1,205 990
2,195 45.1
Mount Sinai 1,419 10,357
11,776 88.0
North York General 2,818 10,811
13,629 79.3
Scarborough Centenary 1,766 8,426
10,192 82.7
Scarborough General 3,124 10,099
13,223 76.4
Scarborough Grace 1,940 7,254
9,194 78.9
Sick Kids 633 1,818
2,451 74.2
St Joseph's 4,641 11,091
15,732 70.5
St Mikes 1,707 10,831
12,538 86.4
Sunnybrook 2,900 9,871
12,771 77.3
Toronto General 1,090 9,022
10,112 89.2
Toronto Western 845 11,141
11,986 93.0
Women's College
2 2
York
135 135
Grand Total 37,993 134,947 368 173,308 Average = 78.0
67
If either the pre-transfer time or post-transfer time is negative, then that record for the pre-transfer time or post-transfer time calculation is not included.

Service Efficiency Review – Toronto Fire Services & Toronto EMS
Page | 270
Pre-Transfer Times and Post-Transfer Times
Pre-transfer Times
The five Toronto hospitals with the longest ambulance offload times were also examined for pre-transfer time and post-transfer time performance. Chart 18, Chart 19, and Chart 20, below show that hospitals with the longest ambulance offload times also have longer than average pre-transfer times. Four of the five hospitals (with Sunnybrook being the exception) had pre-transfer times much higher than the 90th percentile ambulance offload times of all hospitals. Etobicoke General had the highest pre-transfer time at 72.35 minutes (90th Percentile).
Chart 18 - 2011 90th Percentile pre-transfer times for all hospitals and the five hospitals with the highest pre-transfer times
68
68 Calculations include all hospital transports in the PDS system. The five individual hospitals have the RN offload initiative.
72.35
65.38 63.18
45.18
54.98
42.45
0.00
10.00
20.00
30.00
40.00
50.00
60.00
70.00
80.00
Etobicoke General Humber Church Scarborough Grace Sunnybrook Humber Finch All Hospitals
90th
Pe
rcen
tile
pre
-tra
nsf
er t
ime
(min
ute
s)

Service Efficiency Review – Toronto Fire Services & Toronto EMS
Page | 271
Post-Transfer Times
An analysis of post-transfer times shows only two out of five hospitals had post-transfer times higher than that of all hospitals. This suggests that longer ambulance offload times are not necessarily attributed to longer post-transfer times Chart 16 - 2011 Correlation
between ambulance offload time versus pre-transfer time and post-transfer time by station area
level (i.e. location of the call) and Chart 19. Interestingly, Sunnybrook’s ambulance offload time is influenced more by post-transfer time than pre-transfer time. Etobicoke General had both longer pre-transfer times and post-transfer times, indicating both time categories are contributing to longer ambulance offload times (Chart 18, page 270, and Chart 19 page 272).
As noted earlier, Etobicoke General and Humber Finch hospitals had a low rate of capture for transfer of care times (Table 46 - Number of transports in 2011 with valid and invalid transfer of care times). Hence the smaller sample size of valid transfer of care times should
be considered in the interpretation of pre-transfer time and post-transfer time analyses.
In general, longer pre-transfer times impact ambulance offload times. Here, EMS staff are dependent on internal hospital processes which reduces their ability to control or limit their wait time. There are some cases, however, where post-transfer times seem to contribute to the ambulance off-load time, especially at Etobicoke General and Sunnybrook hospitals (Chart 19).
Some observations suggest that this may be due to the EMS staff being involved in a hospital’s patient flow processes such as registration during peak times. If this is the case, then there may be a shared accountability between hospitals and EMS staff during post-transfer time. This is in conflict with the ideal scenario where the EMS staff is relieved of patient care immediately after transfer of care.
Ideally, in order to verify the apparent conflicting observation and results, hospitals should conduct work flow mapping to better understand and define the work load of each party during post-transfer time. Our observation notwithstanding, we also recognize that work flow mapping ambulance offload time may not be hospitals’ highest priority.

Service Efficiency Review – Toronto Fire Services & Toronto EMS
Page | 272
Chart 19 - 2011 90th Percentile post-transfer times for all hospitals and the five hospitals with the highest pre-transfer times
69
RN Offload Coverage
The RN offload initiative is a MOHLTC initiative launched in the fall of 2008. The initiative includes funding for RN support at each of the participating Toronto hospitals for specific hours of the day. Some hospitals receive 16 hours/day of RN support while other hospitals receive 12 hours/day of RN support. The goal of the RN offload initiative is to expedite the patient offload process, thus reducing the ambulance offload time.
For the discussion below:
Chart 20 compares pre-transfer times to RN offload coverage using a 90th percentile
analysis.
Chart 21 compares post-transfer times to RN offload coverage using an average value analysis.
Chart 22 compares post-transfer times to RN offload coverage using a 90th percentile analysis.
Chart 23 compares pre-transfer times to RN offload coverage using an average value
analysis
69
Calculations include all hospital transports in the PDS system. The five individual hospitals have the RN offload initiative
68.45
58.57 55.78
69.08
53.61
57.22
0.00
10.00
20.00
30.00
40.00
50.00
60.00
70.00
80.00
Etobicoke General Humber Church Scarborough Grace Sunnybrook Humber Finch All Hospitals
90th
Pe
rcen
tile
of
po
st-t
ran
sfer
tim
e (m
inu
tes)

Service Efficiency Review – Toronto Fire Services & Toronto EMS
Page | 273
Again, the hospitals listed in these charts have the highest ambulance offload times of the hospitals considered in this study.
The data appears to show there is no significant difference between having RN offload coverage and not having RN offload coverage as it relates to pre-transfer times and post-transfer times with the exception of Humber Church hospital (Chart 20 and Chart 22).
Since funding for offload registered nurses is aimed at those times with peak emergency department volumes, it is possible that offload delays would be significantly longer if offload RNs were not available. In Humber Church, the RN offload initiative seems to reduce the pre-transfer time significantly from 88.0 minutes during no RN offload coverage
to 58.1 minutes during RN offload coverage (Chart 20).
Chart 21 and Chart 22

Service Efficiency Review – Toronto Fire Services & Toronto EMS
Page | 274
Chart 23 shows a greater than expected difference between average and 90th percentile calculations, with average offload values appearing to be significantly lower. This is explained by the fact that average calculations included outliers where very short durations offset very long durations. For 90th percentile calculations, some outliers are excluded.
Out of ten transports, at 90th percentile, nine transports would have certain offload values. For example, in Chart 22, at Etobicoke General, wait time during pre-transfer time is within 74.4 minutes nine of ten times during RN offload coverage hours. Thus, it is useful to view the data at 90th percentile, where the calculations include a majority of the offload durations in realistic terms rather than simply looking at average values where outliers may skew the analysis.
Chart 20 – A comparison of pre-transfer times with and without RN offload coverage from January to September 2011 (90
th percentile analysis)
Etobicoke General
Humber Church Scarborough
Grace Sunnybrook Humber Finch
Yes - RN Offload 74.4 58.1 65.3 47.7 53.7
No - RN Offload 69.4 88.0 63.8 37.9 45.9
0.0
10.0
20.0
30.0
40.0
50.0
60.0
70.0
80.0
90.0
100.0
90th
Pe
rcen
tile
pre
-tra
nsf
er t
ime
(min
ute
s)
Yes = 6890 No = 1662
Yes = 3723 No = 2150
Yes = 5317 No = 3427
Yes = 4716 No = 1336
Yes = 5286 No = 1324

Service Efficiency Review – Toronto Fire Services & Toronto EMS
Page | 275
Chart 21 - A comparison of post-transfer times with and without RN offload coverage from January to September 2011 (averages analyzed)
Chart 22 - A comparison of post-transfer times with and without RN offload coverage from January to September 2011 (90
th percentile analysis)
Etobicoke General Humber Church Scarborough Grace Sunnybrook Humber Finch
Yes - RN Offload 32.7 28.3 36.8 22.2 27.4
No - RN Offload 27.5 38.2 36.5 44.1 33.8
0.0
10.0
20.0
30.0
40.0
50.0
60.0
70.0
80.0
90.0
100.0
Ave
rage
pre
-tra
nsf
er t
ime
(min
ute
s)
Yes = 5286 No = 1324
Yes = 6890 No = 1662
Yes = 3723 No = 2150
Yes = 5317 No = 3427
Yes = 4716 No = 1336
Etobicoke General Humber Church Scarborough Grace Sunnybrook Humber Finch
Yes - RN Offload 65.8 59.8 55.9 69.8 54.8
No - RN Offload 58.5 54.1 54.3 67.3 49.5
0.0
10.0
20.0
30.0
40.0
50.0
60.0
70.0
80.0
90.0
100.0 9
0th
Pe
rcen
tile
po
st-t
ran
sfer
tim
e (m
inu
tes)
Yes = 5286 No = 1324
Yes = 6890 No = 1662
Yes = 3723 No = 2150
Yes = 5317 No = 3427
Yes = 4716 No = 1336

Service Efficiency Review – Toronto Fire Services & Toronto EMS
Page | 276
Chart 23 - A comparison of pre-transfer times with and without RN offload coverage from January to September 2011 (averages analyzed)
Summary of Results
An analysis of the data enables us to make the following general observations:
1. The longer the pre-transfer time, the longer the ambulance offload time (logical observation).
2. There was no linear correlation between post-transfer time and ambulance offload time. With a couple of exceptions, longer post-transfer times did not consistently result in longer ambulance offload times.
3. Some hospitals have improved ambulance offload times by participating in the RN offload initiative. The five hospitals with the longest ambulance offload times, however, also participate in the RN offload initiative.
4. There does not appear to be a significant difference between having RN offload
coverage and not having RN offload coverage as it relates to pre-transfer times and post-transfer times with the exception of Humber Church hospital. However, since funding for offload registered nurses is aimed at those times with peak emergency department volumes, it is possible that offload delays would be significantly longer if offload RNs were not available.
5. Recording valid transfer of care times can provide valuable information for process improvement. Of 173,308 transport records captured in 2011, 78 percent of the transfer of care times is valid which means that 22% aren’t.
6. Establishment of a rigorous Lean management review process for all elements and
factors of the pre- and post-transfer of care time intervals at each of the involved receiving hospital sites would likely be of value.
Etobicoke General Humber Church Scarborough Grace Sunnybrook Humber Finch
Yes - RN Offload 39.0 37.0 31.8 17.7 25.6
No - RN Offload 35.9 30.6 29.6 42.6 29.3
0.0
10.0
20.0
30.0
40.0
50.0
60.0
70.0
80.0
90.0
100.0 A
vera
ge p
ost
-tra
nsf
er t
ime
(min
ute
s)
Yes = 5286 No = 1324
Yes = 6890 No = 1662
Yes = 3723 No = 2150
Yes = 5317 No = 3427
Yes = 4716 No = 1336

Service Efficiency Review – Toronto Fire Services & Toronto EMS
Page | 277
Appendix I – TEMS Staffing Analysis Supporting Documentation – 10 Minute Travel
Time Target (Not including 2 Minute Call Taking and Dispatch Time)

Service Efficiency Review – Toronto Fire Services & Toronto EMS
Page | 278
TEMS Staffing Model by Hour of Day and Day of Week:
Planned Staffing Pattern Source: TEMS (Alan Craig - August 2012)
Station MONDAY TUESDAY WEDNESDAY THURSDAY FRIDAY SATURDAY SUNDAY
00-01 52.5 52.5 52.5 52.5 52.5 47.25 47.25
01-02 52.5 52.5 52.5 52.5 52.5 47.25 47.25
02-03 42 42 42 42 42 42 42
03-04 42 42 42 42 42 42 42
04-05 42 42 42 42 42 42 42
05-06 42 42 42 42 42 42 42
06-07 42 42 42 42 42 42 42
07-08 63 63 63 63 63 52.5 52.5
08-09 63 63 63 63 63 52.5 52.5
09-10 63 63 63 63 63 52.5 52.5
10-11 73.5 73.5 73.5 73.5 73.5 57.75 57.75
11-12 73.5 73.5 73.5 73.5 73.5 57.75 57.75
12-13 73.5 73.5 73.5 73.5 73.5 57.75 57.75
13-14 73.5 73.5 73.5 73.5 73.5 57.75 57.75
14-15 84 84 84 84 84 63 63
15-16 84 84 84 84 84 63 63
16-17 84 84 84 84 84 63 63
17-18 84 84 84 84 84 63 63
18-19 84 84 84 84 84 63 63
19-20 63 63 63 63 63 52.5 52.5
20-21 63 63 63 63 63 52.5 52.5
21-22 63 63 63 63 63 52.5 52.5
22-23 52.5 52.5 52.5 52.5 52.5 47.25 47.25
23-24 52.5 52.5 52.5 52.5 52.5 47.25 47.25

Service Efficiency Review – Toronto Fire Services & Toronto EMS
Page | 279
Mondays Analysis Summary and Chart
Note: Yellow Drop Bar represents staffing gap, Blank Drop Bar represents potential surplus capacity
Total Responses 1250 1060 968 853 711 759 988 1402 2003 2485 2629 2599 2524 2425 2273 2149 2254 2161 2243 1968 1947 1763 1826 1337
Min 10 10 9 8 3 4 7 12 18 19 20 26 28 24 29 24 24 21 18 9 21 23 15 11
Max 51 54 37 30 22 26 32 44 72 71 78 92 69 81 73 58 62 81 69 56 72 53 54 48
Mean 24.0 20.4 18.6 16.4 13.7 14.6 19.0 27.0 38.5 47.8 50.6 50.0 48.5 46.6 43.7 41.3 43.3 41.6 43.1 37.8 38.2 34.6 35.8 26.2
Median 23 19 18 16 13 14 18 25 36 48 52.5 50.5 48 46.5 43 42 43.5 41 43 38.5 37 34 35 26
Mode 25 17 20 19 12 13 18 24 36 43 55 55 37 50 53 47 45 45 43 42 32 35 29 19
StDev 8.7 8.0 6.2 4.9 4.6 4.4 6.0 8.0 11.4 9.7 12.6 12.7 9.4 11.2 8.5 8.3 8.9 10.1 10.3 9.6 10.9 7.0 9.0 7.5
Avg high 37.1 31.4 27.6 23.2 20.2 20.8 27.4 38.2 53.1 62.2 68.3 69.5 63.3 61.3 56.5 54.8 58.3 55.1 58.2 49.6 53.8 44.8 49.3 36.8
90th Percentile Rank 32.2 31 26.2 23.2 20 19.2 27.2 38.4 54.2 58.4 65.2 62.4 63 61 54.2 53 56.6 51.2 56.2 50.2 53 43.3 48 35.9
TMT Multiplier 1.08 1.08 1.06 1.04 1.11 1.12 1.04 1.21 1.21 1.23 1.23 1.22 1.22 1.27 1.28 1.29 1.24 1.20 1.10 1.30 1.17 1.14 1.16 1.13
Avg Peak 40 34 29 24 22 23 29 46 64 77 84 85 77 78 73 71 72 66 65 65 62 51 57 42
2x StDev + Mean 41.4 36.3 31.1 26.3 22.8 23.5 31.1 42.9 61.3 67.1 75.7 75.4 67.4 69.0 60.6 58.0 61.1 61.7 63.6 57.0 60.0 48.5 53.7 41.2
Smoothed Average Peak 39.63 34.2 29 24.7 22.9 24.2 31 46.3 63.2 75.76 82.8 83.22 78.963 76.63 73.26 71.6 70.94 67.22 65.266 64.4 60.2 54.5 53 43.1
Blended Demand 37.8 33.8 28.8 24.7 21.9 22.3 29.8 42.5 59.6 67.1 74.6 73.7 69.8 68.9 62.7 60.9 62.9 60.0 61.7 57.2 57.7 48.7 51.6 40.1
UH Adj/Eff Buffer 20 20 20 20 20 20 20 20 20 20 20 20 20 20 20 20 20 20 20 20 20 20 20 20
Staff To Level 60 54 49 45 43 44 51 66 83 96 103 103 99 97 93 92 91 87 85 84 80 74 73 63
Adjust from Current Staffing 7 2 7 3 1 2 9 3 20 33 29 30 25 23 9 8 7 3 1 21 17 11 21 11
Current Staffing 52.5 52.5 42 42 42 42 42 63 63 63 73.5 73.5 73.5 73.5 84 84 84 84 84 63 63 63 52.5 52.5

Service Efficiency Review – Toronto Fire Services & Toronto EMS
Page | 280
Tuesdays Analysis Summary and Chart
Note: Yellow Drop Bar represents staffing gap, Blank Drop Bar represents potential surplus capacity
Total Responses 1164 997 881 794 656 697 859 1361 1911 2466 2599 2603 2478 2430 2400 2332 2345 2182 2262 2197 1989 1950 1881 1354
Min 12 9 6 7 7 5 6 13 13 32 28 26 30 21 32 24 30 26 25 26 21 17 22 15
Max 34 32 34 26 24 25 33 46 51 71 76 73 71 68 70 66 69 68 65 71 71 60 84 42
Mean 22.8 19.5 17.3 15.6 12.9 13.7 16.5 26.2 36.8 47.4 50.0 50.1 47.7 46.7 46.2 44.8 45.1 42.0 43.5 42.3 38.3 37.5 36.2 26.0
Median 23 19 18 15 12 14 15 26 37 46.5 50 50 46 46.5 44 46 43 41 44 41 37 37.5 35.5 26
Mode 25 19 19 12 10 11 15 27 37 41 50 50 46 49 42 48 40 30 46 35 40 35 31 30
StDev 5.0 4.7 5.4 4.6 3.5 4.4 5.6 5.9 8.0 8.7 10.7 9.8 9.8 10.2 9.4 9.4 10.2 9.8 8.9 9.7 9.3 9.2 10.6 5.9
Avg high 30.0 26.8 23.8 22.5 17.8 19.9 25.3 34.5 47.6 62.0 67.3 64.8 61.6 60.9 59.9 56.1 60.6 56.3 56.8 55.1 52.1 50.5 51.4 34.5
90th Percentile Rank 29 25 22.3 21.3 18 18.3 24.2 34 48.2 58 65.2 64.2 62.4 61.2 58.2 56.2 60.2 54.2 53.2 56 47.6 49.2 46.2 34
TMT Multiplier 1.10 1.07 1.08 1.06 1.04 1.16 0.97 1.25 1.23 1.25 1.24 1.24 1.23 1.30 1.26 1.23 1.20 1.16 1.02 1.08 1.15 1.09 1.15 1.11
Avg Peak 33 29 26 24 18 23 25 43 59 77 83 80 76 79 76 69 73 66 58 59 61 55 59 38
2x StDev + Mean 32.9 29.0 28.1 24.8 20.0 22.4 27.7 38.0 52.8 64.7 71.5 69.7 67.3 67.2 65.0 63.6 65.5 61.5 61.3 61.6 56.8 56.0 57.4 37.9
Smoothed Average Peak 33.89 28.9 25.9 23.2 20.5 22.5 28 42.6 59.3 74.71 81.25 80.06 77.59 77.96 75.093 71.02 70.51 65.43 59.668 59.4 59.4 57 54.2 41.9
Blended Demand 31.9 27.6 25.4 23.1 19.5 21.1 26.6 38.2 53.4 65.8 72.6 71.3 69.1 68.8 66.1 63.6 65.4 60.4 58.0 59.0 54.6 54.1 52.6 38.0
UH Adj/Eff Buffer 20 20 20 20 20 20 20 20 20 20 20 20 20 20 20 20 20 20 20 20 20 20 20 20
Staff To Level 54 49 46 43 40 42 48 63 79 95 101 100 98 98 95 91 91 85 80 79 79 77 74 62
Adjust from Current Staffing 1 -4 4 1 -2 0 6 0 16 32 28 27 24 24 11 7 7 1 -4 16 16 14 22 9
Current Staffing 52.5 52.5 42 42 42 42 42 63 63 63 73.5 73.5 73.5 73.5 84 84 84 84 84 63 63 63 52.5 52.5

Service Efficiency Review – Toronto Fire Services & Toronto EMS
Page | 281
Wednesdays Analysis Summary and Chart
Note: Yellow Drop Bar represents staffing gap, Blank Drop Bar represents potential surplus capacity
Total Responses 1175 1067 863 802 718 664 979 1294 1971 2432 2615 2508 2496 2352 2318 2266 2290 2225 2438 2139 2117 1902 1821 1361
Min 10 9 8 7 8 4 7 10 24 25 33 34 26 26 30 24 30 19 29 20 24 22 19 14
Max 39 36 38 27 34 23 33 39 65 84 70 66 79 68 73 62 70 65 66 71 63 54 86 46
Mean 22.6 20.5 16.6 15.4 13.8 12.8 18.8 24.9 37.9 46.8 50.3 48.2 48.0 45.2 44.6 43.6 44.0 42.8 46.9 41.1 40.7 36.6 35.0 26.2
Median 22 20 15.5 15.5 12.5 12 19 25 36.5 47 49 47 46 45 45 41.5 42.5 42.5 45.5 41 39.5 36 34.5 26
Mode 18 13 14 18 12 10 20 28 30 50 47 47 40 41 46 37 38 39 42 30 45 33 28 24
StDev 6.4 6.4 5.9 4.5 4.8 4.2 5.7 7.1 8.4 11.8 8.9 7.2 10.7 8.9 9.3 8.3 9.2 8.9 10.9 11.1 8.8 7.2 11.2 6.9
Avg high 31.8 29.8 24.8 21.4 20.6 17.8 26.5 36.0 51.4 62.1 64.7 60.8 63.8 59.0 60.0 55.7 60.1 55.0 64.5 57.3 54.6 46.8 50.4 36.3
90th Percentile Rank 31.2 29 23 21 18.2 20 26 32 47 60 61.2 59.6 60.4 60 56.4 55.6 56.2 53 63.2 52.6 53.2 45 48 33.6
TMT Multiplier 1.12 1.03 1.04 1.03 1.09 1.11 0.94 1.22 1.25 1.20 1.23 1.21 1.26 1.29 1.28 1.23 1.22 1.16 1.02 1.10 1.12 1.09 1.13 1.15
Avg Peak 36 31 26 22 22 20 25 44 64 74 79 74 80 76 77 69 73 64 66 63 61 51 57 42
2x StDev + Mean 35.4 33.2 28.3 24.5 23.5 21.2 30.3 39.0 54.7 70.4 68.1 62.7 69.5 63.0 63.2 60.1 62.5 60.5 68.7 63.4 58.3 51.0 57.4 39.9
Smoothed Average Peak 35.28 30.8 26.1 22.9 21.8 21.3 27.7 44.1 62.2 73.37 77.15 75.99 77.97 77.01 75.241 71.58 70.67 66.2 64.83 63.1 59.4 54 52.7 42.9
Blended Demand 34.0 31.0 25.8 22.8 21.1 20.8 28.0 38.4 54.6 67.9 68.8 66.1 69.3 66.7 64.9 62.4 63.1 59.9 65.6 59.7 57.0 50.0 52.7 38.8
UH Adj/Eff Buffer 20 20 20 20 20 20 20 20 20 20 20 20 20 20 20 20 20 20 20 20 20 20 20 20
Staff To Level 55 51 46 43 42 41 48 64 82 93 97 96 98 97 95 92 91 86 85 83 79 74 73 63
Adjust from Current Staffing 3 -2 4 1 0 -1 6 1 19 30 24 22 24 24 11 8 7 2 1 20 16 11 20 10
Current Staffing 52.5 52.5 42 42 42 42 42 63 63 63 73.5 73.5 73.5 73.5 84 84 84 84 84 63 63 63 52.5 52.5

Service Efficiency Review – Toronto Fire Services & Toronto EMS
Page | 282
Thursdays Analysis Summary and Chart
Note: Yellow Drop Bar represents staffing gap, Blank Drop Bar represents potential surplus capacity
Total Responses 1127 1024 890 752 613 737 1033 1507 2132 2558 2687 2628 2592 2532 2499 2499 2208 2142 2357 2188 1950 2010 1909 1575
Min 12 5 7 6 4 7 7 13 27 25 28 31 30 31 27 33 28 26 28 21 25 19 18 13
Max 36 34 33 23 22 25 34 56 65 84 81 82 79 72 75 72 71 71 76 68 67 66 68 49
Mean 21.7 19.7 17.1 14.5 11.8 14.2 19.9 29.0 41.0 49.2 51.7 50.5 49.8 48.7 48.1 48.1 42.5 41.2 45.3 42.1 37.5 38.7 36.7 30.3
Median 21 19 16 14.5 12 13.5 20 27 40 49.5 52 48 47.5 47.5 47 49 41 41 45 40 38 39 37 30
Mode 17 16 16 12 13 12 16 27 38 48 40 57 63 43 44 53 41 36 42 39 43 39 34 32
StDev 5.6 6.4 6.4 4.2 4.3 4.6 6.0 7.5 8.6 11.1 11.1 10.3 12.0 10.3 10.8 8.2 8.1 8.9 11.0 10.6 8.3 9.0 9.0 7.6
Avg high 29.8 28.1 25.3 19.9 18.2 20.2 27.9 40.3 54.8 67.2 69.7 66.5 67.7 64.3 63.1 61.8 55.0 54.2 60.2 57.4 49.7 51.1 49.0 41.9
90th Percentile Rank 27 28 25 20 17 20 26.2 36.4 54 60.6 63.2 62.4 64.2 64 62.4 60 51 52 60.4 57.4 47 49 46.2 40.2
TMT Multiplier 1.09 1.03 1.05 1.08 1.14 1.13 0.94 1.21 1.24 1.20 1.22 1.22 1.23 1.24 1.24 1.23 1.19 1.14 1.01 1.11 1.17 1.08 1.11 1.05
Avg Peak 32 29 27 21 21 23 26 49 68 81 84 80 83 80 78 77 65 61 61 64 58 55 55 44
2x StDev + Mean 32.9 32.5 30.0 22.9 20.5 23.3 31.8 44.0 58.3 71.4 73.9 71.2 73.7 69.3 69.6 64.5 58.6 58.9 67.2 63.2 54.1 56.7 54.7 45.6
Smoothed Average Peak 33.55 29.2 26.1 22.3 21.3 23 30.1 48.2 66.9 78.88 82.36 81.33 81.842 80.07 78.042 74.69 66.88 62.08 61.386 61.9 58.6 55.7 52.6 44.5
Blended Demand 31.1 29.9 27.0 21.7 19.6 22.1 29.4 42.9 59.7 70.3 73.1 71.6 73.3 71.1 70.0 66.4 58.8 57.7 63.0 60.9 53.3 53.8 51.2 43.4
UH Adj/Eff Buffer 20 20 20 20 20 20 20 20 20 20 20 20 20 20 20 20 20 20 20 20 20 20 20 20
Staff To Level 54 49 46 42 41 43 50 68 87 99 102 101 102 100 98 95 87 82 81 82 79 76 73 65
Adjust from Current Staffing 1 -3 4 0 -1 1 8 5 24 36 29 28 28 27 14 11 3 -2 -3 19 16 13 20 12
Current Staffing 52.5 52.5 42 42 42 42 42 63 63 63 73.5 73.5 73.5 73.5 84 84 84 84 84 63 63 63 52.5 52.5

Service Efficiency Review – Toronto Fire Services & Toronto EMS
Page | 283
Fridays Analysis Summary and Chart
Note: Yellow Drop Bar represents staffing gap, Blank Drop Bar represents potential surplus capacity
Total Responses 1272 1214 1146 848 736 749 1001 1322 1901 2369 2479 2476 2521 2587 2472 2377 2267 2353 2347 2213 2098 1991 2016 1697
Min 14 13 8 8 5 8 6 12 21 30 27 32 27 18 29 30 22 21 28 25 23 22 25 22
Max 46 52 36 26 24 25 36 40 57 81 75 64 71 77 102 74 81 89 65 76 65 64 64 61
Mean 24.5 23.3 22.0 16.3 14.2 14.4 19.3 25.4 36.6 45.6 47.7 47.6 48.5 49.8 47.5 45.7 43.6 45.3 45.1 42.6 40.3 38.3 38.8 32.6
Median 23.5 22 21.5 16.5 14.5 14 18.5 25 36 44 47 47.5 48 50 46 45.5 42 44 44 40 38.5 38 37 30.5
Mode 29 22 20 19 17 15 21 22 37 37 47 43 48 39 47 38 39 40 44 40 37 49 44 28
StDev 7.0 8.1 6.8 4.3 4.4 4.1 6.2 5.6 8.7 9.4 10.1 9.2 10.8 11.5 12.6 9.4 11.3 13.1 10.5 10.6 8.9 8.5 9.3 8.2
Avg high 35.0 34.3 31.7 22.8 19.7 20.0 27.9 33.8 48.4 57.7 62.3 61.8 65.0 64.5 66.3 60.9 60.5 61.8 60.4 58.1 54.0 50.8 50.9 45.9
90th Percentile Rank 31.2 32.2 31.2 22.2 19 20 27 34 49.4 57 60.2 60 62.2 63.6 59.8 54 56.8 60.4 59.2 54 50.2 49 51 44.4
TMT Multiplier 1.02 1.04 1.02 1.02 1.08 1.15 0.93 1.26 1.25 1.23 1.23 1.21 1.24 1.23 1.24 1.25 1.23 1.11 1.04 1.09 1.10 1.14 1.15 1.07
Avg Peak 36 36 32 23 21 23 26 43 61 71 78 75 81 79 82 76 74 68 63 63 59 58 59 49
2x StDev + Mean 38.4 39.5 35.6 24.9 22.9 22.6 31.7 36.6 53.9 64.4 67.8 66.1 70.2 72.8 72.8 64.5 66.2 71.4 66.2 63.8 58.2 55.3 57.5 49.0
Smoothed Average Peak 37.42 35 31.1 24.7 21.9 23.1 28.8 43.3 59.1 70.17 76.03 76.86 79.311 80 80.316 76.89 73.56 68.53 63.96 62.2 59.6 58.4 56.8 51.6
Blended Demand 35.7 35.5 32.6 23.9 21.3 21.9 29.2 38.0 54.1 63.8 68.0 67.7 70.6 72.1 71.0 65.1 65.5 66.8 63.1 60.0 56.0 54.2 55.1 48.3
UH Adj/Eff Buffer 20 20 20 20 20 20 20 20 20 20 20 20 20 20 20 20 20 20 20 20 20 20 20 20
Staff To Level 57 55 51 45 42 43 49 63 79 90 96 97 99 100 100 97 94 89 84 82 80 78 77 72
Adjust from Current Staffing 5 2 9 3 0 1 7 0 16 27 23 23 26 26 16 13 10 5 0 19 17 15 24 19
Current Staffing 52.5 52.5 42 42 42 42 42 63 63 63 73.5 73.5 73.5 73.5 84 84 84 84 84 63 63 63 52.5 52.5

Service Efficiency Review – Toronto Fire Services & Toronto EMS
Page | 284
Saturdays Analysis Summary and Chart
Note: Yellow Drop Bar represents staffing gap, Blank Drop Bar represents potential surplus capacity
Total Responses 1817 1563 1691 1363 990 819 954 1104 1403 1767 1882 2088 2142 2229 2178 2098 2131 2036 2245 2176 2088 2089 2045 1876
Min 19 11 14 14 7 6 10 8 17 19 23 14 21 25 25 28 21 22 20 18 23 23 18 13
Max 81 85 77 71 37 30 29 32 41 53 55 67 75 78 79 65 77 64 69 75 65 71 66 59
Mean 34.3 29.5 31.9 25.7 18.7 15.5 18.0 20.8 26.5 33.3 35.5 39.4 40.4 42.1 41.1 39.6 40.2 38.4 42.4 41.1 39.4 39.4 38.6 35.4
Median 33 27 31 25 18 15 18 21 26 32 34 37 38 41 38 37 39 39 41 38 40 38 38 36
Mode 27 23 28 29 18 14 15 26 28 29 34 37 34 41 31 37 38 39 41 35 34 38 40 27
StDev 10.4 11.1 11.9 8.8 5.7 4.5 5.3 5.9 5.5 8.5 7.1 10.7 11.0 10.7 11.0 9.2 11.7 8.7 9.1 10.6 9.6 9.5 10.1 9.9
Avg high 50.1 44.2 47.8 36.3 26.3 21.5 25.4 28.3 34.7 46.8 46.9 53.8 54.3 56.8 58.0 53.2 57.3 50.1 55.9 57.6 52.7 52.6 55.8 50.3
90th Percentile Rank 44.6 38 43.6 32.2 25 21 25 28 34.4 46 44.2 53 58.2 56.8 54.4 51.2 52.2 48.4 54.2 58 50.6 50.4 50 46
TMT Multiplier 1.04 0.96 0.93 0.94 1.04 1.04 0.88 1.16 1.19 1.12 1.15 1.13 1.09 1.13 1.11 1.10 1.09 1.06 0.93 1.04 1.07 1.05 1.09 1.04
Avg Peak 52 42 44 34 27 22 22 33 41 52 54 61 59 64 64 59 62 54 52 60 56 55 61 52
2x StDev + Mean 55.1 51.8 55.6 43.2 30.1 24.5 28.6 32.5 37.4 50.3 49.7 60.8 62.4 63.4 63.1 58.0 63.6 55.8 60.6 62.3 58.6 58.4 58.7 55.1
Smoothed Average Peak 49.42 44.7 41.9 34.7 27.7 23.3 24.4 32.4 41.9 50.54 54.93 58.9 60.243 63.05 63.071 60.49 59.9 55.02 53.638 57.4 56.8 56.7 58.1 52.7
Blended Demand 49.7 44.8 47.0 36.7 27.6 22.9 26.0 31.0 37.9 48.9 49.6 57.6 60.3 61.1 60.2 56.6 58.6 53.1 56.1 59.2 55.3 55.2 55.6 51.3
UH Adj/Eff Buffer 20 20 20 20 20 20 20 20 20 20 20 20 20 20 20 20 20 20 20 20 20 20 20 20
Staff To Level 69 65 62 55 48 43 44 52 62 71 75 79 80 83 83 80 80 75 74 77 77 77 78 73
Adjust from Current Staffing 17 12 20 13 6 1 2 -11 -1 8 1 5 7 10 -1 -4 -4 -9 -10 14 14 14 26 20
Current Staffing 52.5 52.5 42 42 42 42 42 63 63 63 73.5 73.5 73.5 73.5 84 84 84 84 84 63 63 63 52.5 52.5

Service Efficiency Review – Toronto Fire Services & Toronto EMS
Page | 285
Sundays Analysis Summary and Chart
Note: Yellow Drop Bar represents staffing gap, Blank Drop Bar represents potential surplus capacity
Total Responses 1777 1700 1728 1421 1024 807 975 1042 1260 1693 1867 1997 2015 2017 1975 2008 1954 1869 1986 2102 1916 1802 1629 1493
Min 17 16 12 12 8 8 8 9 11 20 22 25 20 17 24 17 22 18 17 20 21 17 14 13
Max 70 54 64 60 37 27 38 32 38 63 60 64 66 58 62 63 56 59 60 64 52 60 51 51
Mean 34.2 32.7 33.9 27.3 19.7 15.5 18.8 20.0 24.2 32.6 35.9 38.4 38.8 38.8 38.0 38.6 37.6 35.9 38.2 40.4 36.8 34.7 31.3 28.7
Median 34 31 34 26 20 14.5 18 19 24 33 36 36 38 38 35.5 38.5 37 35 37 40 38 36 32 27
Mode 41 26 34 26 20 11 14 18 27 38 38 35 30 44 35 36 35 33 37 33 38 37 33 24
StDev 9.6 9.6 10.1 9.4 5.6 4.3 6.0 5.8 5.9 7.9 8.4 8.7 8.3 8.1 9.3 9.3 7.4 8.5 8.4 10.4 8.7 8.4 8.2 9.32
Avg high 47.1 44.8 47.0 39.8 27.8 21.7 27.4 29.3 32.7 44.2 49.3 52.9 50.8 49.5 52.4 51.6 48.9 49.1 49.0 55.6 50.3 47.6 42.0 39.8
90th Percentile Rank 41.6 49.2 47.6 35.4 26.2 21 25 27.2 32.2 40 44 48.6 48.2 51 50.4 49.4 47.2 47 50 52.2 48 43.2 42 41.4
TMT Multiplier 0.98 0.95 0.90 0.92 0.99 1.05 0.90 1.17 1.23 1.17 1.14 1.14 1.15 1.16 1.15 1.14 1.12 1.10 0.94 1.05 1.10 1.09 1.13 1.11
Avg Peak 46 43 42 37 27 23 25 34 40 52 56 61 59 58 60 59 55 54 46 58 55 52 48 44
2x StDev + Mean 53.4 52.0 54.1 46.1 30.8 24.2 30.7 31.6 36.1 48.4 52.6 55.9 55.4 55.1 56.5 57.2 52.4 53.0 55.0 61.2 54.3 51.5 47.7 47.3
Smoothed Average Peak 46.69 43.4 41.3 35.8 28.1 24 26.3 33.6 41.4 50.32 56.21 59.48 59.424 58.89 59.584 58.36 55.31 52.43 50.273 55.5 55.3 51.8 48 43.9
Blended Demand 47.2 48.2 47.7 39.1 28.4 23.1 27.3 30.8 36.6 46.2 50.9 54.7 54.4 55.0 55.5 55.0 51.6 50.8 51.8 56.3 52.5 48.8 45.9 44.2
UH Adj/Eff Buffer 20 20 20 20 20 20 20 20 20 20 20 20 20 20 20 20 20 20 20 20 20 20 20 20
Staff To Level 67 63 61 56 48 44 46 54 61 70 76 79 79 79 80 78 75 72 70 75 75 72 68 64
Adjust from Current Staffing 14 11 19 14 6 2 4 -9 -2 7 3 6 6 5 -4 -6 -9 -12 -14 12 12 9 15 11
Current Staffing 52.5 52.5 42 42 42 42 42 63 63 63 73.5 73.5 73.5 73.5 84 84 84 84 84 63 63 63 52.5 52.5

Service Efficiency Review – Toronto Fire Services & Toronto EMS
Page | 286
Appendix J – TEMS Staffing Analysis Supporting Documentation – 8 Minute 59 Second
Response Target

Service Efficiency Review – Toronto Fire Services & Toronto EMS
Page | 287
Existing TEMS Staffing Model by Hour of Day and Day of Week:
Planned Staffing Pattern Source: TEMS (Alan Craig - August 2012)
Station MONDAY TUESDAY WEDNESDAY THURSDAY FRIDAY SATURDAY SUNDAY
00-01 52.5 52.5 52.5 52.5 52.5 47.25 47.25
01-02 52.5 52.5 52.5 52.5 52.5 47.25 47.25
02-03 42 42 42 42 42 42 42
03-04 42 42 42 42 42 42 42
04-05 42 42 42 42 42 42 42
05-06 42 42 42 42 42 42 42
06-07 42 42 42 42 42 42 42
07-08 63 63 63 63 63 52.5 52.5
08-09 63 63 63 63 63 52.5 52.5
09-10 63 63 63 63 63 52.5 52.5
10-11 73.5 73.5 73.5 73.5 73.5 57.75 57.75
11-12 73.5 73.5 73.5 73.5 73.5 57.75 57.75
12-13 73.5 73.5 73.5 73.5 73.5 57.75 57.75
13-14 73.5 73.5 73.5 73.5 73.5 57.75 57.75
14-15 84 84 84 84 84 63 63
15-16 84 84 84 84 84 63 63
16-17 84 84 84 84 84 63 63
17-18 84 84 84 84 84 63 63
18-19 84 84 84 84 84 63 63
19-20 63 63 63 63 63 52.5 52.5
20-21 63 63 63 63 63 52.5 52.5
21-22 63 63 63 63 63 52.5 52.5
22-23 52.5 52.5 52.5 52.5 52.5 47.25 47.25
23-24 52.5 52.5 52.5 52.5 52.5 47.25 47.25

Service Efficiency Review – Toronto Fire Services & Toronto EMS
Page | 288
Mondays Analysis Summary and Chart
Note: Yellow Drop Bar represents staffing gap, Blank Drop Bar represents potential surplus capacity

Service Efficiency Review – Toronto Fire Services & Toronto EMS
Page | 289
Tuesdays Analysis Summary and Chart
Note: Yellow Drop Bar represents staffing gap, Blank Drop Bar represents potential surplus capacity

Service Efficiency Review – Toronto Fire Services & Toronto EMS
Page | 290
Wednesdays Analysis Summary and Chart
Note: Yellow Drop Bar represents staffing gap, Blank Drop Bar represents potential surplus capacity

Service Efficiency Review – Toronto Fire Services & Toronto EMS
Page | 291
Thursdays Analysis Summary and Chart
Note: Yellow Drop Bar represents staffing gap, Blank Drop Bar represents potential surplus capacity

Service Efficiency Review – Toronto Fire Services & Toronto EMS
Page | 292
Fridays Analysis Summary and Chart
Note: Yellow Drop Bar represents staffing gap, Blank Drop Bar represents potential surplus capacity

Service Efficiency Review – Toronto Fire Services & Toronto EMS
Page | 293
Saturdays Analysis Summary and Chart
Note: Yellow Drop Bar represents staffing gap, Blank Drop Bar represents potential surplus capacity

Service Efficiency Review – Toronto Fire Services & Toronto EMS
Page | 294
Sundays Analysis Summary and Chart
Note: Yellow Drop Bar represents staffing gap, Blank Drop Bar represents potential surplus capacity

Service Efficiency Review – Toronto Fire Services & Toronto EMS
Page | 295
Appendix K – Case Study: United Kingdom
In the past 10 years emergency services in the United Kingdom have been subject to working within a progressively shrinking financial envelope yet have been able to maintain effectiveness and service to the public. In the case of fire services, changes were precipitated by a thirty to thirty-five percent, four-year staged loss of national government grant revenue which accounted for seventy percent (70%) of municipal fire service budgets. We became aware of the United Kingdom’s experience in increasing effectiveness and reducing costs through seminars on risk and probability provided by the Public Entity Risk Institute70. Several presentations on value initiatives were offered by the Greater Manchester Fire and Rescue
Service (GMFRS). From a budget of one hundred and ten million pounds (£110M) the service was compelled to function within eighty million pounds (£80M).
Manchester is not the only municipality in the United Kingdom that has found ways of
maintaining a strong level of emergency services protection within diminishing financial circumstances. Many other municipalities have accomplished the same successes as Manchester by using data effectively and basing performance objectives on that data. We made a 5-day visit to the Greater Manchester Fire and Rescue Service in July 2012 to understand the scope of their accomplishments and have been in frequent contact for follow up and clarification purposes.
The United Kingdom’s emergency services’ effectiveness accomplishments required a shift in philosophy and a change in culture towards focusing on information gathering, prevention, and protection efforts. This included initiatives such as Home Safety Check (HSC) targeting, and engaging suppression staff in prevention and public fire safety awareness efforts.
Manchester’s change in their approach to fire service included ongoing public consultation and transparency, a management will to assert their legitimate authority when necessary, and a business model approach to providing a vital community service that is more than emergency based.
The Greater Manchester Area
The Greater Manchester Area is the UK’s third most populous urban area as the result of amalgamating ten boroughs in April of 1974. Greater Manchester Fire and Rescue Service covers an area of approximately 1,277 square kilometres (vs. 641.45 in Toronto) and serves a local population of approximately 2.6 million residents. As in Toronto there is significant diversity (400 languages spoken), and a considerable number of people who work in Manchester but live elsewhere.
70 PERI provides public entities, small businesses, and nonprofit organizations with enterprise risk management information, training, data, and data analysis. PERI’s goal, as stated on their website, is to be an organization that is seen by its principal customers and stakeholders as the independent thought leader and definitive resource in the field of risk management; as a constant innovator; and as a ready source of practical and highly valued products (Wikipedia)

Service Efficiency Review – Toronto Fire Services & Toronto EMS
Page | 296
Manchester does not have the predominance of high-rise buildings common in Toronto and
there are a greater number of impoverished areas and high unemployment rate due to the off-shore relocation of its textile and manufacturing base. The streetscape and rush hour traffic patterns, for the most part, are not unlike that of Toronto with areas in both cities posing accessibility challenges.
The GMFRS has 1,794 uniformed and 423 non-uniformed staff at 41 fire stations, responding to 55,000 emergency calls annually. This is comparable to Toronto’s call volume when response to medical calls are not included in Toronto’s count. Manchester doesn’t respond to medical events. The city has not hired any new fire fighters since 2009 and, reportedly, has no plans to do so in the foreseeable future. The city is anticipating an overall reduction of 50% in the
number of fire fighters from the start of the austerity measures to its completion in another five years.
Change strategies are vetted with key stakeholders and frequent public consultations occur. These include
Ongoing use of risk analyses data that revealed the predictability of fire occurrences, resulting in variable staffing of stations and apparatus.
Response standards which are available to the public, and performance in meeting those standards is publicly reported each quarter.
In Greater Manchester, the determination of local risks is enhanced by the use of a commercial
off-the-shelf software program called Phoenix71. The key inputs to the program include three years of historical fire incident data such as the number of occurrences, time of day, location, and whether the incident was accidental or deliberate. Risk levels are then assigned based on station location and political wards. Risk level determination also serves to drive fire prevention initiatives, such as Home Fire Risk Assessments, in that the higher the risk the greater the fire prevention initiatives. But it also defines staff levels and the number of apparatus that are in service at certain times of the day.
There are over 1.1 million domestic properties across Greater Manchester (vs. 516,000 address point in Toronto), and each year approximately 60,000 Home Fire Risk Assessments are completed. The emphasis on the activity is driven by research on domestic fires that indicate
fires occur primarily as a result of lifestyle choices, attitudes and behaviours, rather than by pure accident. To gain more access to the most vulnerable population, GMFRS has partnered with other services, established a volunteer program, and hired a Bridging Cultures Coordinator.
Since April 2003 Fire and Rescue Services in England have been required to produce Integrated Risk Management Plans (IRMPs) that outline:
How a Fire and Rescue Service identifies risk
Strategies for reducing the risk, and
How resources are deployed to an emergency
71 Active Informatics – Pheonix FRS http://activeinformatics.com/separate/downloads/PhoenixFRS.pdf

Service Efficiency Review – Toronto Fire Services & Toronto EMS
Page | 297
Greater Manchester’s Fire Prevention Strategy is integral to their IRMP and is described in their
2012-2015 Prevention Strategy Consultation Document accessible on their website72.
While the GMFRS has a statutory responsibility and considers itself to have a moral obligation to undertake a community safety role, fire services’ initiatives in this regard were enhanced by legislation in 2005 that shifted considerable responsibility to property owners – particularly commercial property owners – to manage their own fire risk. Fire service prevention and protection personnel will aid and advise in the creation of fire safety and prevention measures but it is the responsibility of the ‘owner’ to actually create, implement and monitor the measures. Prevention and protection personnel then will examine that the measures are in place and enforce them.
The following chart shows an associative decline in accidental dwelling fires in the Greater Manchester Area as Home Fire risk Assessments increased.
Chart 14 - Home Fire Risk Assessment Chart
72 http://www.manchesterfire.gov.uk/

Service Efficiency Review – Toronto Fire Services & Toronto EMS
Page | 298
In a six year period during which initiatives were being implemented to shift the fire service
focus to fire prevention as much as fire response
Dwelling fires are reported to have decreased 40% and
Fire fatalities are reported to have decreased 50%
Summary
The Greater Manchester Fire and Rescue Service, like other emergency services in the United Kingdom, has responded creatively to a 30% budget reduction, with additional cuts expected by 2015, while maintaining firefighter health and safety standards and a level of service to the community as before the loss in funding.
The process has been a gradual and data informed one. Many efficiency strategies were pilot tested and every initiative is monitored by objective means. For example, targeting high risk areas with fire prevention strategies is reported to reduce risk status categorization, and more is being done with less mostly because of fire prevention and education initiatives, and shifting responsibility, when appropriate, to property owners.
Toronto and Manchester are dissimilar in many ways and we are not suggesting that the changes implemented in Manchester and the United Kingdom can be simply transferred to Toronto. But the efficiency and effectiveness processes and practices that were used in the United Kingdom can be adapted to any jurisdiction.
Manchester References:
Greater Manchester Fire and Rescue Service Corporate Plan 2012-2015 / Page 6 & 7 http://www.manchesterfire.gov.uk/media/182111/corporate%20plan%202012%20final.pdf
Have Your Say! The Blueprint Discussion Paper. Working Together
The Blueprint Discussion Paper – What You Said! Working Together
Greater Manchester Fire and Rescue Service, Risk Model, November 2010 http://www.manchesterfire.gov.uk/media/111904/gmfrs_risk_model.pdf
Greater Manchester Fire and Rescue Service – Resource Deployment Model (April 2011-March 2012 – Version 1.2 June 2011) http://www.manchesterfire.gov.uk/media/111774/resource_deployment_model.pdf
Task Analysis and Optimum Crewing Levels – An Examination of Tasks at Operational Incidents, November 2010 http://www.manchesterfire.gov.uk/media/111888/task_analysis_report.pdf
Unwanted Fire Signals Strategy, February 2010
http://www.manchesterfire.gov.uk/media/16445/uwfs-strategy-v3.pdf
Greater Manchester Fire and Rescue Service, Draft Road Safety Strategy, 2012-2015
http://authority.manchesterfire.gov.uk/Published/C00000186/M00000354/AI00001396/$RoadSafetyStrategyVersion115.doc.pdf
HSC Targeting, Identification of Home Safety Check Addresses 2012/13
Greater Manchester Fire and Rescue Service, Draft Home Safety Strategy, 2012-2015
http://www.manchesterfire.gov.uk/media/172114/hsc_strategy.pdf
Prevention Strategy 2012-2015, Consultation Document
http://www.manchesterfire.gov.uk/media/172130/prevention_strategy.pdf
Prevention and Protection Directorate Organization Chart
Greater Manchester Fire and Rescue Service, Prevention Strategy 2012-2015 Consultation Document, Page 25
http://www.manchesterfire.gov.uk/media/172130/prevention_strategy.pdf
Fire and Rescue Short Course. Sample pages from student book.
http://www.asdan.org.uk/media/downloads/Fire%20and%20Rescue%20SC%20sample%20pages.pdf
Greater Manchester Fire and Rescue Service, Strategy for Protection in the Built Environment, 2011-2014 http://www.manchesterfire.gov.uk/media/153475/strategyforprotectioninthebuiltenvironment2011_2014.pdf

Service Efficiency Review – Toronto Fire Services & Toronto EMS
Page | 299
Department of Health UK, Taking Healthcare to the Patient. Transforming NHS Ambulance Services (2005) http://www.dh.gov.uk/en/Publicationsandstatistics/Publications/PublicationsPolicyAndGuidance/DH_4114269
Inside HART Hazardous Area Response Team. New base for East of England Hart Edition 6 Autumn 2010 http://naru.org.uk/wp-content/uploads/2012/03/inside_hart_edition_6_a416pp_w.pdf
Inside HART Hazardous Area Response Team. Urban Search and Rescue
Edition 3 Winter 2009 http://naru.org.uk/wp-content/uploads/2012/03/inside_hart_edition_3.pdf
Inside Hart Hazardous Area Response Team, Ambulance staff in the inner cordon. Edition 2 Autumn 2009 http://naru.org.uk/wp-content/uploads/2012/03/inside_hart_edition_2_a4_v4s.pdf
Ambulance HART Hazardous Area Response Team, Ambulance Staff in the Inner Cordon. www.ambulancehart.org; http://naru.org.uk/naru-work-activities/naru-work-activities-capability-deliverables-hart-programme/hart-training/
Youth United, Supporting Inclusion Program http://www.communities.gov.uk/news/newsroom/2078966
Youth United, Department for Communities & Local Government & HRH the Prince of Wales: Supporting Inclusion Programme – Programme Overview
Greater Manchester Fire and Rescue Service Strategic Intent Document Repositioning our Fire and Rescue Service A Blueprint for continued success in a changing world http://www.manchesterfire.gov.uk/media/67818/strategic_intent_document.pdf
Executive Summary http://www.manchesterfire.gov.uk/media/67821/sid_executive_summary.pdf
Greater Manchester Fire and Rescue Service Corporate Plan 2012-2015 http://www.manchesterfire.gov.uk/media/182111/corporate%20plan%202012%20final.pdf
REFERENCES
Burke, Warner, W. and Litwin, George H., A causal model of organizational performance and
change. Journal of Management, 1992, Vol. 18, No. 3, 523-545.
Kohlberg, Lawrance. Stage and sequence: The cognitive developmental approach to socialization. In
Goslin, D.A. (Ed.), Handbook of socialization theory and research. Rand McNally: Chicago, Il., 1969.
Parker, Marty, Culture connection. McGraw Hill: Toronto, 2012.
Richards, Gary, R., An analysis of fire department and ambulance integration from a process
perspective: Utilizing Winnipeg, Manitoba as a case study. National Library of Canada, 1996.

Service Efficiency Review – Toronto Fire Services & Toronto EMS
Page | 300
Appendix L – Research Articles
A message that can save lives. Fort Erie smoke alarm campaign starts next week. (2012, May 31). Niagarathisweek.com Retrieve from http://www.niagarathisweek.com/news/article/1366025--a-message-that-can-save-lives Al-Shaqsi, S.Z.K. (2010, Jan). Response time as a sole performance indicator in EMS: pitfalls and solutions. Retrieved from http://www.dovepress.com/response-time-as-a-sole-performance-indicator-in-ems-pitfalls-and-solu-peer-reviewed-article-OAEM-recommendation1 Altus Group Economic Consulting. (2010, Dec 9). Gap and statistical analysis on housing sprinkler systems. Retrieved from http://www.chba.ca/uploads/Policy%20Archive/2011/P4319%20NRC%20FINAL%20ReportAmend.pdf Averill, J, Moore-Merrell, L, Barowy, A, Santos, R, Peacock, R, Notarianni, K, Wissoker, D. (2010, Apr). Report on residential fireground field experiments. Retrieved from International Association of Fire Chiefs website at http://www.iafc.org/files/deptAdmin_NISTdeploymentReport.pdf Ayesha. (2012, July 31). True impact of the government cuts on UK fire services. Mode PR. Retrieved from http://www.modepr.co.uk/modepr-news/true-impact-of-the-government-cuts-on-uk-fire-services Be a hero 2007. Omaha.com. Retrieved from http://www.omaha.com/assets/pdf/OW4832415.PDF Benichou N, Su J.Z., Bwalya A.C., Lougheed G.D., Taber B.C., Leroux P, Thomas J.R. Fire performance of houses. Phase 1. Study of unprotected floor assemblies in basement fire scenarios. National research council Canada. 2009. Retrieved from ftp://ftp.cmhc-schl.gc.ca/chic-ccdh/Research_Reports-Rapports_de_recherche/eng_unilingual/Ca1%20MH%2009F36_FPH%20Report_Part%205%20UF-06%20UF-06R%20and%20UF-06RR.pdf Benichou, N.; Yung, D.; Hadjisophocleous, G.(1999). Impact of Fire Department Response and Mandatory Sprinkler Protection on Life Risks in Residential Communities. Retrieved from National Research Council Canada website at http://archive.nrc-cnrc.gc.ca/obj/irc/doc/pubs/nrcc38819/nrcc38819.pdf Berman J. A growing and aging population and its impacts to EMS service delivery for the city of Lacey, WA. Retrieved from U.S. Fire Administration and Fema website at http://www.usfa.fema.gov/pdf/efop/efo42861.pdf Bigham, B, Kennedy,S, Morrison, L. Expanding paramedic scope of practice in the community. Retrieved from http://communityparamedic.ca/site/media/download_gallery/Community%20Paramedicine%20Report%202010.pdf Bissell, R, Seaman, K, Bass, R, Racht, E, Gilbert, C, Weltge, A, Doctor, M, Moriarity, S, Eslinger, D, Doherty, R. Change the scope of practice of paramedics? An EMS/public health policy perspective. Pre-hospital Emergency Care 1993:2, 140-149. Retrieved from http://www.ncbi.nlm.nih.gov/pubmed/10225648

Service Efficiency Review – Toronto Fire Services & Toronto EMS
Page | 301
Branstetter, Z. (2012, Aug 27). Emergency responses could be 2 minutes longer. Tulsa World. Retrieved from http://www.tulsaworld.com/news/article.aspx?subjectid=11&articleid=20120827_11_A1_EMSAam681989 Brattain, S. (2012, Sept 27). Fire union leader: cuts jeopardize public safety. The Herald Bulletin. Retrieved from http://heraldbulletin.com/crime/x1241980419/Fire-union-leader-Cuts-jeopardize-public-safety Brindle, D. (2012, Oct 2). Firefighter home visits offer elderly people more than just safety advice. The Guardian. Retrieved from http://www.guardian.co.uk/society/2012/oct/02/firefighter-home-visits-offer-elderly-people Bronson, J.R. (2009, Aug). Residential sprinkler systems and the benefits of the fire service. Retrieved from U.S. Fire Administration and Fema at http://www.usfa.fema.gov/pdf/efop/efo44037.pdf Brooks, B. (2012). Philadelphia fire department begins rolling brownouts. Fire Department Network News. Retrieved from http://www.fdnntv.com/Philadelphia-Fire-Department-Rolling-Brownouts Brown LH, Devine S.(2008, Oct). EMS & health promotion: a next step in the collaboration between EMS and public health. EMS World. Retrieved from http://www.emsworld.com/article/10320821/ems-health-promotion Brown, H. (2005, Dec). Economic analysis of residential fire sprinkler systems. Retrieved from National Institute of Standards and Technology website at http://fire.nist.gov/bfrlpubs/build05/PDF/b05013.pdf Brown, L, Devine, S. EMS & health promotion, a next step in the collaboration between EMS and public health. Retrieved from http://www.emedhealth.com/files/Public_Health_Perspectives.pdf Burton, R. (2011, Aug). Baby boomers: what effects will they have on the demands for EMS in the city of Norfolk. Retrieved from U.S. Fire Administration and Fema website at http://www.usfa.fema.gov/pdf/efop/efo45810.pdf Butry, D. Brown, M. Fuller, S. (2007, Sept). Benefit-cost analysis of residential fire sprinkler systems. Retrieved from National Institute of Standards and Technology at http://residentialfiresprinklers.com/blog/wp-content/uploads/2008/05/NISTIR_7451_Oct07.pdf Bwalya, A, Sultan, M, Benichou, N. (2004, Mar 9). A Pilot Survey of Fire Loads in Canadian Homes. Retrieved from http://archive.nrc-cnrc.gc.ca/obj/irc/doc/pubs/rr/rr159/rr159.pdf C,A. (2011, August 4). Fire-response times are up, but city says brown outs are not to blame. Message posted to http://www.firstin.wordpress.com/category/fire-station-closings/ Case study: How EMT health screening program helps seniors Screening program enhanced access to medical, social services for at-risk, rural-dwelling older adults. (2012 May,3). EMS1.com. Retrieved from http://www.ems1.com/research-reviews/articles/1281851-Case-study-How-EMT-health-screening-program-helps-seniors/

Service Efficiency Review – Toronto Fire Services & Toronto EMS
Page | 302
Celock, J., Sledge, M. (2012, July 13). Fire Department Cuts Force Firefighters To Watch And Wait. Huffington Post. Retrieved from http://www.huffingtonpost.com/2012/07/13/fire-department-cuts-a-thousand-cuts_n_1659671.html Chu, I, Vaca, F, Stratton, S Chakravarthy, B, Hoonpongsimanont, W, Lotfipour, S. Geriatric Trauma Care: Challenges Facing Emergency Medical Services. Cal J Emerg Med. 2007 May; 8(2): 51–55. Retrieved from http://www.ncbi.nlm.nih.gov/pmc/articles/PMC2860422/ Clare J, Garis L, Plecas C, Jennings C. (2012). Reduced frequency and severity of residential fires following delivery of fire prevention education by on duty fire fighters: Cluster randomized controlled study. Journal of Safety Research, 43, 123-128. Retrieved from http://www.surrey.ca/files/DCT_Reduced_Frequency_and_Severity_of_Residential_Fires.pdf Clark M, FitzGerald G, Older people's use of ambulance services: a population based analysis. J Accid Emerg Med. 1999 March; 16(2): 108–111. Retrieved from http://www.ncbi.nlm.nih.gov/pmc/articles/PMC1343292/ Clark, D, Dainiak, C, Reeder, S. Decreasing incidence of burn injury in a rural state. Injury Prevention 2000;6:259–262. Retrieved from http://injuryprevention.bmj.com/content/6/4/259.full.pdf+html Cobb, R, Waters, M. Save My Fire Station, Save My House. ISO Mitigation Online. Retrieved from http://www.isomitigation.com/ppc/fire-station.html Commission on Fire Accreditation International. (2012, July 18). Accreditation report. Retrieved from http://www.westmetrofire.org/DocumentCenter/View/2068 Community paramedics helping those on the fringes ( 2011, Jan 10). CTV news. Retrieved from http://www.ctvnews.ca/community-paramedics-helping-those-on-the-fringes-1.594246 Cooper S, Barrett B, Black S, et al. (2004, Apr 13).The emerging role of the emergency care practitioner. Emerg Med J 2004;21:614-8. Retrieved from http://emj.bmj.com/content/21/5/614.long Corporate Report. (2012, July 18). Homesafe program in Surrey. Retrieved from http://www.surrey.ca/bylawsandcouncillibrary/CR_2012-R181.pdf. Cox, B. (2012). Guil-Rand cuts will jeopardize public safety. Archdale-Trinity News. Retrieved from http://www.archdaletrinitynews.net/view/full_story/17518205/article-Guil-Rand-cuts-will-jeopardize-public-safety?instance=main_article Cox, M.Jr. ( 2006, Oct). A case for residential sprinklers for single family dwellings in Anne Arundel County, Maryland. Retrieved from U.S. Fire Administration and Fema website at http://www.usfa.fema.gov/pdf/efop/efo41194.pdf Dalton J, Backstrom R, Kerber S. (2009, Oct 1). Structural Collapse: The hidden dangers of residential fires. Fire Engineering. Retrieved from http://www.fireengineering.com/articles/print/volume-162/issue-10/features/structural-collapse.html Dauphin, S. Surprising new information on fire safety. Old house web. Retrieved from http://www.oldhouseweb.com/blog/surprising-new-information-on-fire-safety/

Service Efficiency Review – Toronto Fire Services & Toronto EMS
Page | 303
Davidson, S. Georgia Fires Up Prevention Programs to Save Lives. Retrieved from Centers of Disease Control and Prevention website at http://www.cdc.gov/injury/pdfs/GADPH_SuccessStory-a.pdf Dixon, P. A fine balance How to marry emergency response with efficiency, cost and public expectation. Retrieved from Firefighting in Canada website at http://www.firefightingincanada.com/content/view/3872/132/ Dixon, S., Mason, S., Knowles, E., Colwell, B., Wardrope, J., Snooks, H., Gorringe, R .• Perrin, J., & Nicholls, J. (2009). Is it cost effective to introduce paramedic practitioners for older people to the ambulance service? Results of a cluster randomized control trial. Emergency Medicine Journal. Retrieved from http://emj.bmj.com/content/26/6/446.full.pdf+html Dmuchowski, M. (2004,May). Residential sprinklers for Frederick County, Maryland- a quick response. Retrieved from U.S. Fire Administration and Fema website http://www.usfa.fema.gov/pdf/efop/efo37004.pdf Dominick, D. (2004, Jan). Benefits of residential sprinkler installation for new construction in Northfield Township. Retrieved from U.S. Fire Administration and Fema website at http://www.usfa.fema.gov/pdf/efop/efo36544.pdf Downing, A, Wilson, R. Older people's use of Accident and Emergency services. Age Ageing (2004) 34 (1): 24-30. Retrieved from http://ageing.oxfordjournals.org/content/34/1/24.short Doy, R., & Turner, K. (2004). The Giraffe: the emergency care practitioner; Fit for purpose? The East Anglian experience. Emergency Medicine Journal, 21, 356-366. Retrieved from http://emj.bmj.com/content/21/3/365.full.pdf Doyle, J. (2010, Jan 15). Community Paramedics Expand Health-Care Access. JEMS. Retrieved from http://www.jems.com/article/leadership-professionalism/community-paramedics-expand-he Elder, A, Squires, T, Busuttil, A. (1996). Fire fatalities in elderly people. Age and Ageing 25:214-216. Retrieved from http://ageing.oxfordjournals.org/content/25/3/214.full.pdf+html. Emergency medical services chiefs of Canada. (2011) Community Paramedicine. Retrieved from http://www.paramedicsofmanitoba.ca/storage/Self-Regulation/Tab_2.PDF Emergency Medical Services Chiefs of Canada. (2011). Community paramedicine. Retrieved from http://ircp.info/Portals/22/Downloads/Policy/2012%20EMSCC%20CP%20Submission%20to%20Canadian%20Parliament.pdf Emergency medical services: Agenda for the future. Retrieved from http://www.nhtsa.gov/people/injury/ems/agenda/ EMS and public health bulletin: A strategy for enhancing community health care. Retrieved from http://www.naemt.org/Libraries/NAEMT%20Documents/EMS%20%20Public%20Health%20Summary%20Bulletin%20Oct%2002.sflb Erich, J. (2012, Mar 1).Who You Callin’ Community Paramedics? EMS World. Retrieved from http://www.emsworld.com/article/10686290/who-you-callin-community-paramedics

Service Efficiency Review – Toronto Fire Services & Toronto EMS
Page | 304
Federal emergency management agency (FEMA). (2005). Residential fires and older adult casualties Retrieved from U.S. Fire Administration and Fema website at http://www.usfa.fema.gov/downloads/pdf/statistics/v5i3.pdf Federal emergency management agency (FEMA).(2007). Fire risk to older adults. Retrieved from U.S. Fire Administration and Fema website at www.usfa.fema.gov/downloads/pdf/publications/fa-300.pdf Fey, C. Balancing risk and public expectations in EMS incident response. Retrieved from U.S. Fire Administration and Fema website at http://www.usfa.fema.gov/pdf/efop/efo44463.pdf Finkelstein, E. (2012, June 19). Dangerous impact on residents, businesses if fire stations are closed, manpower cut. Labor Tribune. Retrieved from . http://labortribune.com/dangerous-impact-on-residents-businesses-if-fire-stations-are-closed-manpower-cut/ Fire Experience, Smoke Alarms and Sprinklers in Canadian Houses: CMHC Research to 2005. (2005, April). Retrieved from Canada Home and Mortgage Corporation website at http://www.cmhc-schl.gc.ca/odpub/pdf/63945.pdf?lang=en Fire service deployment: assessing community vulnerability. Retrieved from National Fire Protection Association at http://www.nfpa.org/assets/files//PDF/UrbanFireVulnerability.pdf Fire sprinkler initiative. (2010, June 10). Debunking the "New Homes are Safer" argument. Retrieved from National Fire Protection Association website at http://nfpa.typepad.com/firesprinklerinitiative/2010/05/debunking-the-argument-that-new-homes-are-safer-homes.html Firefighter safety threatened by floor joists.(2012, Apr 13). CBC News. Retrieved from http://www.cbc.ca/news/canada/windsor/story/2012/04/13/wdr-firefighters-floor-joists.html Fleischman, R, McConnell, J, Adams, A, Hedges, J, Newgard, C. Injury As A Marker For Emergency Medical Services Use In Medicare Patients. Prehosp Emerg Care. 2010 ; 14(4): 425–432. Retrieved from http://www.ncbi.nlm.nih.gov/pmc/articles/PMC2992380/pdf/nihms208367.pdf Fleming, R. (2012, Aug 24). Letter: new homes need fire sprinklers. Woodbridge Patch. Retrieved from http://woodbridge.patch.com/articles/letter-new-homes-need-fire-sprinklers Ford J, (1997). Saving Lives, Saving Money, Automatic sprinklers: A 10 year study: A detailed history of the effects of the automatic sprinkler code in Scottsdale, Arizona. Retrieved from http://www.15300.com/dowloads/sprinklers.pdf Garis Len, (2012). Corporate Report, Fire Chief, Surrey, B.C. Retrieved from http://www.surrey.ca/bylawsandcouncillibrary/CR_2012-R181.pdf Garis, L, Clare, J. (2012, Aug). Evaluating Stakeholder Concerns with Wood Frame Buildings and Fire Risk. Retrieved from http://www.ufv.ca/Assets/CCJR/Publications/Bill+52.pdf Garis, L. The impact of residential sprinklers on public fire protection. Proceedings: Customers, Changes & New Challenges Reinventing The Fire Service An International Conference. Retrieved from http://www.surrey.ca/files/DCT_The_Impact_of_Residential_Sprinklers_on_Public_Fire_Protection.pdf

Service Efficiency Review – Toronto Fire Services & Toronto EMS
Page | 305
Garrisi, G. (2004, Mar). Residential sprinkler systems in Yuba City. Retrieved from U.S. Fire Administration and Fema website at http://www.usfa.fema.gov/pdf/efop/efo36959.pdf Gauk, M. (2012, June 22). Slow firefighting responses may worsen. Daily News. Retrieved from http://www2.canada.com/nanaimodailynews/story.html?id=d009dbbf-9f64-46b2-8d57-6e769797178b George, G, Jell, C, Todd, B. Effect of population ageing on emergency department speed and efficiency: a historical perspective from a district general hospital in the UK. Emerg Med J2006;23:379-383. Retrieved from http://emj.bmj.com/content/23/5/379.short Gerson, L.W., Shvarch, L. Emergency medical service utilization by the elderly. Ann Emerg Med. 1982 Nov 11 (11):610-2. Retrieved from http://www.annemergmed.com/article/S0196-0644(82)80202-3/abstract Glaser. S. (2003, Dec). Hazard analysis of persons sixty five and older residing within the Stillwater fire department response district. Retrieved from U.S. Fire Administration and Fema website at http://www.usfa.fema.gov/pdf/efop/efo36418.pdf Greuel, W. (2012, May 18). Analysis of the Los Angeles fire department response times. Retrieved Sept from http://www.scribd.com/doc/94055923/Controller-Audit-on-LAFD-Response-Times Haddix, A, Mallonee, S, Waxweiler, R, Douglas, M. Cost effectiveness analysis of a smoke alarm giveaway program in Oklahoma City, Oklahoma. Inj Prev 2001;7:276-281. Retrieved from http://injuryprevention.bmj.com/content/7/4/276.full Hall J. (2012, Mar). US experience with sprinklers. Retrieved from National Fire Protection Association website at http://www.nfpa.org/assets/files/pdf/os.sprinklers.pdf. Harvey, A.L., Gerard, W.C., Rice, G.F., Finch, H.H. Actual vs perceived ems response time. Pre-hospital Emergency Care Journal 1999, Vol. 3, No. 1 , Pages 11-14 (doi:10.1080/10903129908958898). Retrieved from http://pubget.com/paper/9921733/Actual_vs_perceived_EMS_response_time Hauswald, M. (2002). Can Paramedics Safely Decide Which Patients Do Not Need Ambulance Transport or Emergency Department Care? Pre-hospital Emergency Care, 6, 383-386. Retrieved from http://www.ncbi.nlm.nih.gov/pubmed/12385602 Health Affairs, 25, no.3 (2006):w141-w149. Retrieved from http://content.healthaffairs.org/content/25/3/w141.full.pdf+html Hempstead, D. (2011, Jan 4). New homes burn faster. C News. Retrieved from http://cnews.canoe.ca/CNEWS/Canada/2011/01/24/17007276.html Heussner, K. (2011, Feb 2). With modern furnishing, homes burn faster. ABC news. Retrieved from http://abcnews.go.com/Technology/modern-furnishing-homes-burn-faster/story?id=12806666 Hicken, M. (2012, Aug 10). New homes burn faster but states resist sprinklers. Reuters. Retrieved from http://www.reuters.com/article/2012/08/10/us-usa-home-building-idUSBRE8790DX20120810

Service Efficiency Review – Toronto Fire Services & Toronto EMS
Page | 306
Ho,C. (2012, July 27). Firefighters' union censures Chief Bruce Burrell over safety standards, response times. Calgary Herald. Retrieved from http://www.calgaryherald.com/news/calgary/Firefighters+union+censures+Chief+Bruce+Burrell+over+safety/6997110/story.html Home fire sprinklers. Retrieved from http://simsburyfire.org/Pages/FMO/sprinklers.htm Huppert, B. (2012, May 2). Should fire sprinklers be required in new homes? Kare 11. Retrieved from http://www.kare11.com/rss/article/974829/14/Should-fire-sprinklers-be-required-in-new-homes IAFF fights for staffing. (2012, Sept 13). FDNN TV. Retrieved from http://www.fdnntv.com/International-Association-of-Fire-Fighters-Fights-for-Staffing ICMA Consulting Services. (2011, Dec). Fire Operations Assessment and Data Analysis. Retrieved from http://www.ci.ann-arbor.mi.us/news/Documents/2012_News_Releases/Ann_Arbor_Final_Report_Fire_Operations_and_Data_Analysis.pdf Illinois fire sprinkler coalition. Home fire sprinkler fact sheet. Retrieved from http://www.homelifesafety.com/fire-sprinkler-facts.html In small and large cities alike, firefighters have gone from heroes to budget bait. Governing the States and Localities. Retrieved from http://www.governing.com/topics/public-workforce/firefighters-feel-squeeze-shrinking-budgets.html In Wake Of Fire That Killed Larchmont Police Captain, Light-Weight Construction Homes Under Scrutiny. (2012, June 27). CBS New York. Retrieved from http://newyork.cbslocal.com/2012/06/27/in-wake-of-fire-that-killed-larchmont-police-captain-light-weight-construction-homes-under-scrutiny/ International association of firefighters. Emergency medical services: a guidebook for fire based systems. Retrieved from International Association of Firefighters website at http://www.iaff.org/tech/PDF/EMSGuideBk.pdf Isman, K. (1995, Jan). Fire sprinklers save lives and money... The economics of retrofit. Retrieved from http://www.firemarshals.org/pdf/F2%20-%20FIRE%20SPRINKLERS%20SAVE%20LIVES%20AND%20MONEY.pdf Joerger, S.(2001). A side by side comparison of new and old construction. Fire Engineering. Retrieved from http://www.fireengineering.com/articles/print/volume-164/issue-9/features/a-sidebyside-comparison-of-new-and-old-construction.html Johnson, K. (2011, Sept 18). Responding before a call is needed. The New York Times. Retrieved from http://www.nytimes.com/2011/09/19/us/community-paramedics-seek-to-prevent-emergencies-too.html Johnston, J. (2003, Sept 18). Reducing the vulnerability to risk from structure fires within the city of Waco through sprinkler systems. Retrieved from U.S. Fire Administration and Fema website at http://www.usfa.fema.gov/pdf/efop/efo36369.pdf

Service Efficiency Review – Toronto Fire Services & Toronto EMS
Page | 307
Joint Committee on Rural Emergency Care (JCREC) National Association of State Emergency Medical Services Officials National Organization of State Offices of Rural Health State Perspectives Discussion Paper on Development of Community Paramedic Programs. Retrieved from http://www.naemt.org/Libraries/NAEMT%20Documents/CP%20Discussion%20Paper.sflb Joint legislative audit and review commission. (2004, Nov). Review of emergency medical services in Virginia. Retrieved from http://jlarc.state.va.us/Reports/Rpt312.pdf Jones, R, Kazdin, A, Haney, J. (1981). Social validation and training of emergency fire safety skills for potential injury prevention and life saving. J Appl Behav Anal. 1981 Fall; 14(3): 249–260. Retrieved from http://www.ncbi.nlm.nih.gov/pmc/articles/PMC1308211/?page=1 Kerkman, D. Justification of public education within the Wisconsin Rapids fire department. Retrieved from U.S. Fire Association and Fema website at http://www.usfa.fema.gov/pdf/efop/efo42702.pdf Kose, S. (1999), Emergence of aged populace: who is at higher risk in fires?. Fire Mater, 23:6 337–340. Retrieved from http://onlinelibrary.wiley.com/doi/10.1002/(SICI)1099-1018(199911/12)23:6%3C337::AID-FAM708%3E3.0.CO;2-O/abstract Kroboth, J. (2003, Jan). Developing and evaluating response time criteria. Retrieved from U.S. Fire Administration and Fema website at http://www.usfa.fema.gov/pdf/efop/efo36379.pdf Kue,R, Ramstrom, E, Weisberg, S, Restuccia, M. Evaluation of an emergency medical services-based social services referral program for elderly patients. Pre-hospital Emergency Care, 2009, Vol. 13, No. 3 : Pages 273-279. Retrieved from http://informahealthcare.com/doi/abs/10.1080/10903120802706179 Lahart, B. (2009, Nov). Older adult risk reduction analysis for the Denton fire department. Retrieved from http://s3.amazonaws.com/zanran_storage/www.usfa.dhs.gov/ContentPages/565768954.pdf Lennon T, Hopkin D.(2011). Fire performance of new residential buildings. Retrieved from NHBC Foundation website at http://www.nhbcfoundation.org/LinkClick.aspx?fileticket=EJSNE0XbyHo%3d&tabid=470&mid=1069 Leonard, J. (2012, June 9). Economic Incentives of Residential Sprinklers for Homeowners FST381 Analytical Approaches for the Fire and Emergency Services. Retrieved from http://aerospace.ceas.uc.edu/content/dam/aero/docs/fire/Papers/Sprinklers.pdf Linares, A, Linares, H. Burn prevention: the need for a comprehensive approach. Burns, 16:4, August
1990, Pages 281–285. Retrieved from http://www.ncbi.nlm.nih.gov/pubmed/2257071 Lowthian J, Jolley D, Curtis A, Currell A, Cameron P, Stoelwinder J, McNeil J. The challenges of population ageing: accelerating demand for emergency ambulance services by older patients, 1995-2015. Med J Aust 2011; 194 (11): 574-578. Retrieved from https://www.mja.com.au/journal/2011/194/11/challenges-population-ageing-accelerating-demand-emergency-ambulance-services Lowthian, J, Cameron, P, Stoelwinder, J, Curtis, A, Currell, A, Cooke, M, McNeil, J. Increasing utilization of emergency ambulances. Australian Health Review, 2011, 35, 63–69. Retrieved from http://www.publish.csiro.au/?act=view_file&file_id=AH09866.pdf

Service Efficiency Review – Toronto Fire Services & Toronto EMS
Page | 308
Mackay, A, Rothman, K. The Incidence and Severity of Burn Injuries Following Project Burn Prevention. Retrieved from http://ajph.aphapublications.org/doi/pdf/10.2105/AJPH.72.3.248 Madrzykowski D, Fleming R. Residential Sprinkler Systems. Retrieved from National Institute of Standards and Technology website at http://fire.nist.gov/bfrlpubs/fire08/PDF/f08007.pdf Madrzykowski, D.; Fleming, R.(2002, Feb). Review of Residential Sprinkler Systems: Research and Standards. Retrieved from U.S. Fire Administration and Fema website at http://www.usfa.fema.gov/downloads/pdf/nistir6941.pdf. Mallonee, S., Istre, G. R., Rosenberg, M., Reddish-Douglas, M., Jordan, F., Silverstein, P., et al. (1996). Surveillance and prevention of residential-fire injuries. New England Journal of Medicine, 335(1), 27–31. Retrieved from http://www.nejm.org/doi/pdf/10.1056/NEJM199607043350106 Martin-Misener R, Barbara Downe-Wamboldt, Ed Cain, Marilyn Girouard. Cost effectiveness and outcomes of a nurse practitioner–paramedic–family physician model of care: the Long and Brier Islands study. Primary Health Care Research & Development 2009;10:14-25. Mason S, Coleman P, O'Keeffe C, Ratcliffe J, Nicholl J. The evolution of the emergency care practitioner role in England: experiences and impact. Emerg Med J 2006;23:435-9. Retrieved from http://www.ncbi.nlm.nih.gov/pmc/articles/PMC2464893/pdf/387.pdf Mason, S, Knowles, E, Colwell, B, Dixon, S, Wardrope, J, Gorringe, R, Snooks, H, Perrin, J, Nicholl, J. (2007, Aug 8). Effectiveness of paramedic practitioners in attending 999 calls from elderly people in the community: cluster randomized controlled trial. BMJ 2007;335:919. Retrieved from http://www.bmj.com/content/335/7626/919.full Mason, S, O'Keeffe, C, Coleman, P, Edlin, R, Nicholl, J.(2007, Apr). Effectiveness of emergency care practitioners working within existing emergency service models of care. Emerg Med J. 2007 April; 24(4): 239–243. Retrieved from http://www.ncbi.nlm.nih.gov/pmc/articles/PMC2658226/?tool=pubmed Mason, S., Wardrope, J., & Perrin, J. (2003). Developing a community paramedic practitioner intermediate care support scheme for older people with minor conditions. Pre-hospital Medicine, 20, 196-198. Retrieved from http://www.ncbi.nlm.nih.gov/pubmed/12642544 McCallion, T. (2012, Feb 16) The Great Ambulance Response Time Debate Continues. JEMS. Retrieved from http://www.jems.com/article/ems-insider/great-ambulance-response-time-debate McConnel, C, Wilson, R. The demand for pre-hospital emergency services in an aging society. Social
science and medicine. Volume 46, Issue 8, 15 April 1998, Pages 1027–1031. Retrieved from http://www.sciencedirect.com/science/article/pii/S0277953697100296 McLoughlin, E, Vince, C.J, Lee, A.M., Crawford, J.D.(1982, March),. Project burn prevention: Outcomes and implications. Am J Public Health. Retrieved from http://www.ncbi.nlm.nih.gov/pmc/articles/PMC1649807/?page=1. McManis Associates, John T. O'Hagan and Associates, (1984, June). Dallas fire department staffing level study. Retrieved from Fema website at http://www.lrc.fema.gov/downloads/coll_dallasfire.pdf

Service Efficiency Review – Toronto Fire Services & Toronto EMS
Page | 309
Melby, V. and Ryan, A. (2005), Caring for older people in pre-hospital emergency care: can nurses make a difference? Journal of Clinical Nursing, 14: 1141–1150. Retrieved from http://onlinelibrary.wiley.com/doi/10.1111/j.1365-2702.2005.01222.x/abstract?deniedAccessCustomisedMessage=&userIsAuthenticated=false Miller, I, Davey, J. (2007, May). The risks, perceptions, and experiences of fire among older people. Retrieved from http://www.fire.org.nz/Research/Publishsed-reports/Documents/risks%20perceptions%20%20experiences%20of%20fire%20among%20older%20people%20-%20final%20report.pdf Ministry of Community Safety and Correctional Services. (2011 Oct). Residential Fatalities: Children, Adults, Seniors ministry of community safety and correctional services. Retrieved from Ontario Ministry of Community Safety and Correctional Services website at http://www.mcscs.jus.gov.on.ca/english/FireMarshal/MediaRelationsandResources/FireStatistics/OntarioFatalities/HomeFireFatalitiesChildrenAdultsSeniors/stats_fatal_res.html Misner, D. (2003). Community Paramedicine: Part of an Integrated Healthcare System. Emergency MedicalServices, 34 (4), 89-90. Retrieved from http://www.gov.ns.ca/health/ehs/documents/Community%20Paramedicine%20Article.pdf Monday, C. (2000, Aug). Optimal staffing levels for firefighter effectiveness and mitigation of firefighter injuries. Retrieved from U.S. Fire Administration and Fema website at http://www.usfa.fema.gov/pdf/efop/efo24986.pdf Moore, F. (2000, Jan). Residential sprinklers a viable solution for small towns. Retrieved from U.S. Fire Administration and Fema website at http://www.usfa.fema.gov/pdf/efop/efo30793.pdf Morin, B. (2012, Mar 22). Newer built homes prove to burn faster, pose greater fire hazard. Stonyplain Reporter.com. Retrieved from http://www.stonyplainreporter.com/2012/03/22/newer-built-homes-prove-to-burn-faster-pose-greater-fire-hazard-2 Mund, E. (2010 Oct, 31). Grounding frequent flyers. EMS World. Retrieved from http://www.emsworld.com/article/10319160/grounding-frequent-flyers National Fire Prevention Association. (2011, June). Third needs assessment of the U.S. fire service. Retrieved from http://www.nfpa.org/assets/files//2011NeedsAssessment.pdf. Newport Partners.(2008, Sept). Home fire sprinkler cost assessment. The Fire Protection Research Foundation. Retrieved from http://www.nfpa.org/assets/files//PDF/Research/FireSprinklerCostAssessment.pdf\ Nordli, B. (2012, June 9). City officials, union at odds over effects of cuts to North Las Vegas Fire Department. Las Vegas Sun. Retrieved from http://www.lasvegassun.com/news/2012/jun/29/city-officials-union-odds-over-effects-cuts-north-/ NRC-CNRC. (2011, June). Researching fire performance of construction materials in houses. 16:2 Retrieved from http://www.nrc-cnrc.gc.ca/obj/ci-ic/doc/v16n2e.pdf

Service Efficiency Review – Toronto Fire Services & Toronto EMS
Page | 310
O'Brien, W. (2011, Sept 27). Police, fire officials describe impact of funding cuts. BDN Connection. Retrieved from http://www.beloitdailynews.com/news/local/police-fire-officials-describe-impact-of-funding-cuts/article_776337f0-e931-11e0-be06-001cc4c002e0.html Office of the city auditor Portland, Oregon (2010,Jul).Portland fire & rescue: emergency response time goal not met, though PF&R strives for excellence. Retrieved from http://www.portlandonline.com/auditor/index.cfm?a=307535&c=51639 Office of the city auditor. (2011, Apr). Performance audit of fire-rescue's emergency medical services. Significant opportunities for improvements exist to strengthen oversight, recover costs and enhance response time reporting. Retrieved from http://www.sandiego.gov/auditor/reports/fy11_pdf/audit/11-017.pdf Pace, MA. (2012, Sept 27). Building a Community: Part 2. EMS world. Retrieved from http://www.emsworld.com/article/10785768/building-a-community-part-2 Persse, D, Jarvis, J, Corpening, J, Harris, B. (2008, Jan 8). Customer satisfaction in a large urban fire department emergency medical services system. Academic Emergency Medicine, 11: 106–110. Retrieved from http://onlinelibrary.wiley.com/doi/10.1197/j.aem.2003.07.020/pdf Peterson, G. (2004, Apr). Developing a risk reduction program for Roseville's older adults. Retrieved from U.S. Fire Administration and Fema website at http://www.usfa.fema.gov/pdf/efop/efo37064.pdf Platts-Mills, Tf, Leacock, B, Cabanas, JG, Shofer, FS, McLean, SA. Emergency medical services use by the elderly: analysis of a statewide database. Prehosp Emerg Care. 2010 Jul-Sept 14(3):329-33. Retrieved from http://www.ncbi.nlm.nih.gov/pubmed/20507220 Potter, T. (2011, Nov 6). Dangers of modern life: homes now burn faster than before. Retrieved from http://www.mcclatchydc.com/2011/11/06/129447/dangers-of-modern-life-homes-now.html Quantative evaluation of fire and EMS mobilization times. Retrieved from National Fire Protection Association website at http://www.nfpa.org/assets/files/PDF/Research/MobilizationPart3.pdf Raven S, Tippett V, Ferguson J-G, Smith S. An exploration of expanded paramedic healthcare roles for Queensland: The University of Queensland; 2006. Retrieved from http://www.jephc.com/Vol5_Issue3/QLDReport.pdf Reeve C, Pashen D, Mumme H, De la Rue S, Cheffins T. Expanding the role of paramedics in northern Queensland: an evaluation of population health training. Aust J Rural Health 2008;16:370-5. Retrieved from http://www.ncbi.nlm.nih.gov/pubmed/19032210 Residential fire fatalities: children, adults and seniors. Retrieved from Ontario Ministry of community safety and correctional services website at http://www.mcscs.jus.gov.on.ca/english/FireMarshal/MediaRelationsandResources/FireStatistics/OntarioFatalities/HomeFireFatalitiesChildrenAdultsSeniors/stats_fatal_res.html Residential Fire Sprinklers - Protecting What You Value the Most - A Report on Vancouver's 10 Year Statistics on Residential Fire Sprinklers: Home Fire Sprinkler Coalition, (2005). Retrieved from http://www.firesprinklers.org.uk/Services/Documents/Vancouver%20report.pdf

Service Efficiency Review – Toronto Fire Services & Toronto EMS
Page | 311
Riley C, Strong A. No more bread and butter: Kitchener-Waterloo study proves new materials burn differently. Retrieved from Firefighting in Canada website at http://www.firefightingincanada.com/content/view/2132/132/ Rinke, M, Dietrich, E, Kodeck, T, Westcoat, K. Operation care: a pilot case management intervention for frequent emergency medical system users. Am. Journal of Emergency medicine. (2011). Retrieved from http://www.healthcareaccessmaryland.org/site/wp-content/uploads/2011/02/JEMS-Article.pdf Robbins, A.P, Wade, C.A., Bengtsson, M.J., Howard, N.P., Soja, E. Revision of the cost effectiveness analysis of home sprinkler systems including sustainability. Retrieved on Sept 28, 2012 from . http://www.fire.org.nz/Research/Publishsed-Reports/Documents/d7a38d2d938e2c7aa36f6c4cb4a2ec38.pdf Robertson-Steel, I. Reforming emergency care: the ambulance impact. A personal view. Emerg Med J2004;21:207-211. Retrieved on Oct 4, 2012 from http://emj.bmj.com/content/21/2/207.short Robyn, K. (2012, May 15). Older patients-knowing where they're coming from. EMS World. Retrieved from http://www.emsworld.com/article/10324320/older-patients-knowing-where-theyre-coming-from Rogers. B. (2005, Sept). Determining a true response time and methods that could improve response times for the Centerville-Osterville-Marston Mills department of fire rescue and emergency services. Retrieved from U.S. Fire Administration and Fema website at http://www.usfa.fema.gov/pdf/efop/efo45312.pdf Rohr, Kimberley D. (2003). U.S. Experience with Sprinklers. National Fire Protection Association. Retrieved from http://trans-ennis.com/National%20Firer%20Protectio%20Association.pdf Salem Professional Firefighter Local 314. Say no to fire station closures. Retrieved from http://www.salemfirefighters.net/mobile/index.cfm?zone=/unionactive/view_page.cfm&page=INFO20Fire20Station201120Closure20 Sawyers, H. (2010, Sept 14).The Fight Over Fire Sprinklers in New Homes. A change to the International Residential Code may make fire sprinklers mandatory in new homes. But builders think the measure will be far too costly. Who is right? Popular Mechanics. Retrieved from http://www.popularmechanics.com/home/improvement/security/the-fight-over-fire-sprinklers-in-new-homes Schaenman P, Stambourgh H, Rossomando C, Jennings C, Perroni C. (1990) Proving public fire education works. Tri Data Corp. Retrieved from http://www.sysplan.com/documents/tridata/prevention/PublicFireEdu.pdf Schwarz, d, Grnsso, J, Miles, C, Holmes, J, Sutton, R. An injury prevention program in an urban African-American community. Retrieved from http://ajph.aphapublications.org/doi/pdf/10.2105/AJPH.83.5.675 Shah, M. N., Bazarian, J. J., Lerner, E. B., Fairbanks, R. J., Barker, W. H., Auinger, P. and Friedman, B. (2007), The Epidemiology of Emergency Medical Services Use by Older Adults: An Analysis of the National Hospital Ambulatory Medical Care Survey. Academic Emergency Medicine, 14: 441–447. doi: 10.1111/j.1553-2712.2007.tb01804.x.

Service Efficiency Review – Toronto Fire Services & Toronto EMS
Page | 312
Shaw, G. (2012, Mar). The next big thing: paramedicine for burdened EDs. Emergency Medicine News. Retrieved from http://journals.lww.com/em-news/Citation/2012/03000/Breaking_News__The_Next_Big_Thing__Paramedicine.2.aspx Shipp, B. (2012, Feb 7). Irving firefighters say cuts put them and the public at risk. WFAA.com. Retrieved from http://www.wfaa.com/news/investigates/Ir-138876649.html Siarnicki, R. (2001, Jan). Residential sprinklers: one community's experience twelve years after mandatory implementation. Retrieved from the North Carolina State Fireman's Association website at http://www.ncsfa.com/pdf/PrinceGeorgeStudy.pdf Silvestri, S., Rothrock, S., Kennedy, D., Ladde, J., Bryant, M., & Pagane, J. (2002). Can Paramedics Accurately Identify Patients who do not require Emergency Department Care? Pre-hospital Emergency Care, 6 (4), 387-390. Retrieved on Oct 3, 2012 from http://www.ncbi.nlm.nih.gov/pubmed/12385603 Smith, R. (2004, Sept). Increasing the installation of residential sprinkler system in new construction within the Placer consolidated fire protection district. Retrieved from U.S. Fire Administration and Fema website at http://www.usfa.fema.gov/pdf/efop/efo37321.pdf Snooks H, Kearsley N, Dale J, Halter M, Redhead J, Cheung WY. Towards primary care for non-serious 999 callers: results of a controlled study of "treat and refer" protocols for ambulance crews. Quality & Safety in Health Care 2004;13:435-43. Retrieved from http://qualitysafety.bmj.com/content/13/6/435.full.pdf+html Socha, S. (2008, Apr). Sprinklers are not optional. A proactive approach to risk reduction at the Mohegan tribe. Retrieved from U.S. Fire Administration and Fema website at http://www.usfa.fema.gov/pdf/efop/efo41900.pdf Spaite, D, Criss, E, Valenzuela, T, Meislin, H, Ross, J. Geriatric injury: an analysis of pre-hospital demographics, mechanisms, and patterns. Annual of emergency medicine. 1990, Dec, 19(12):1418-1421. Retrieved from http://www.sciencedirect.com/science/article/pii/S0196064405826113 Strunk, B, Ginsburg, P, Banker, M. The Effect Of Population Aging On Future Hospital Demand. Health Affairs, 25, no.3 (2006):w141-w149. Retrieved on Oct 4, 2012 from http://content.healthaffairs.org/content/25/3/w141.full.pdf+html Summerville, W. Reducing fire and life safety risks for Kernersville's senior citzens. Retrieved from U.S. Fire Administration and Fema website at http://www.usfa.fema.gov/pdf/efop/efo45098.pdf Surveillance and prevention of residential-fire injuries. New England Journal of Medicine, 335(1), 27–31. Retrieved from http://www.nejm.org/doi/pdf/10.1056/NEJM199607043350106 Sznajder, M, Leduc, S, Janvrin, M, Bonnin, M, Aegerter, P, Baudier, F, Chevallier, B. (2003). Home delivery of an injury prevention kit for children in four French cities: a controlled randomized trial. Injury Prevention 2003;9:261–265. Retrieved from http://injuryprevention.bmj.com/content/9/3/261.full.pdf+html

Service Efficiency Review – Toronto Fire Services & Toronto EMS
Page | 313
Taylor, J. (2012, Sept 21). Firefighter admits arson risk fears after Newman Government cuts to fire programs for youths. Northern Times. Retrieved from http://www.couriermail.com.au/questnews/moreton/firefighter-admits-arson-risk-fears-after-newman-government-cuts-to-fire-programs-for-youths/story-fn8m0yu3-1226477728604 The fire risk series: fire risks for older adults. Retrieved for Cornell University website at http://www.environmentalgeriatrics.com/home_safety/fire_risk_series.html The fire-rescue plan 2012-2015.(2012, Mar). Retrieved from http://www.richmond.ca/__shared/assets/firerescueplan32847.PDF Tokuda, Y, Abe, T, Ishimatsu, S, Hinohara, S. (2010). Ambulance Transport of the Oldest Old in Tokyo: A Population-Based Study. Journal of Epidemiology. Vol 20 (2010). No 6. P 468-472. Retrieved on Oct 4, 2012 from . https://www.jstage.jst.go.jp/article/jea/20/6/20_JE20090210/_article Transcontinental Staff. (2011, May 12). Paramedicine pilot begins in West Prince. The Guardian. Retrieved from http://www.theguardian.pe.ca/News/Local/2011-05-12/article-2501653/Paramedicine-pilot-begins-in-West-Prince-/1 Trevino M, White L, Meischke H, Eisenberg M. (2008, Oct 1).A new sphere for EMS. EMS World. Retrieved from http://www.emsworld.com/article/10320824/a-new-sphere-for-ems?page=2 TriData Corporation. (1999). Fire risks for older adults. Retrieved from U.S. Fire Administration and Fema website at http://www.usfa.fema.gov/downloads/pdf/publications/older.pdf U.S. Fire Administration. Home fire sprinklers save lives. Retrieved from U.S. Fire Administration and Fema website at http://www.usfa.fema.gov/citizens/home_fire_prev/sprinklers/ Underwriters Laboratories Inc. (2009, Jan 30). Report on structural stability of engineered lumber in fire conditions. Retrieved from http://www.ul.com/global/documents/offerings/industries/buildingmaterials/fireservice/NC10412-20090130-Report-Independent.pdf Varone, J. (1994, Nov). Providence fire department staffing study. Retrieved from U.S. Fire Administration and Fema website at http://www.usfa.fema.gov/downloads/pdf/tr_94cv.pdf Walker, H.S. (2005, Sept). Indentifying and overcoming barriers to the implementation of legislation mandating residential sprinklers in Quincy, Illinois. Retrieved from U.S. Fire Administration and Fema website at http://www.usfa.fema.gov/pdf/efop/efo38541.pdf Walters, J. (2011, Jan). Governing. Firefighters Feel the Squeeze of Shrinking Budgets In small and large cities alike, firefighters have gone from heroes to budget bait. Retrieved on Oct 4, 2012 from http://www.governing.com/topics/public-workforce/firefighters-feel-squeeze-shrinking-budgets.html Wang, H. Community Paramedicine. (2011). Retrieved from http://www.ircp.info/Portals/22/Downloads/Research/Community%20Paramedicine%20Summary%20of%20Evidence%20-%20Hui%20Wang%20%202011%20January%2028.pdf
Service Efficiency Review – Toronto Fire Services & Toronto EMS
Page | 314
Warda, Ly, Tenenbein, M, Moffatt, M. (1999). House fire injury prevention update. Part I. A review of risk factors for fatal and non-fatal house fire injury. Injury Prevention 1999;5:145–150. Retrieved on Oct 3, 2012 from http://injuryprevention.bmj.com/content/5/2/145.full.pdf+html Warda, L, Tenenbein, M, Moffatt, M. (1999). House fire injury prevention update. Part II. A review of the effectiveness of preventive interventions. Injury Prevention 1999;5:217–225 217. Retrieved on Oct 3, 2012 from http://injuryprevention.bmj.com/content/5/3/217.full.pdf+html Weatherby S, (2009). Benefits of residential fire sprinklers: Prince George's County 15-year history with its single-family residential dwelling fire sprinkler ordinance. Retrieved from http://www.ci.medford.or.us/files/prince-georges-county-report.pdf West, G. (2008, Jan). Exploring the feasibility of meeting NFPA 1710 response time standards at Northwest fire/rescue district. Retrieved from U.S. Fire Administration and Fema website at http://www.usfa.fema.gov/pdf/efop/efo41722.pdf Wilber, S, Gerson, L, Terrell, K, Carpenter, C, Shah, M, Heard, K, Hwang, U. (2006, Dec). Geriatric Emergency Medicine and the 2006 Institute of Medicine Reports from the Committee on the Future of Emergency Care in the U.S. Health System. Academic Emergency Medicine. 13:12 pages 1345–1351. Retrieved from http://onlinelibrary.wiley.com/doi/10.1197/j.aem.2006.09.050/pdf Williams, B. (2012, June 12). Minneapolis firefighter injuries on the rise. MPR News. Retrieved from http://minnesota.publicradio.org/display/web/2012/06/12/labor/fire-department-injuries/ Williams, D. (2007, January). 2006 JEMS 200-city survey: EMS from all angles. Journal of Emergency Medicine. Retrieved from http://www.jems.com/sites/default/files/2006jems200citysurvey-full_tcm16-13547.pdf. Wofford, J.L, Moran, W, Heuser, M, Schwartz, E, Velez, R, Mittlemark, M. Emergency medical transport of the elderly; a population based study. Am J Emerg Med. 1995 May;13(3):297-300. Retrieved from http://www.ajemjournal.com/article/0735-6757(95)90203-1/abstract Wolk, A. (2002, June). Encouraging voluntary installation of residential sprinkler systems in the city of Camas, Washington. Retrieved from U.S. Fire Administration and Fema website at http://www.usfa.fema.gov/pdf/efop/efo34684.pdf Workers Revolution Party. (2012, Aug 17). Public and firefighters' safety needlessly put at risk says East Sussex FBU. Workers Revolutionary Party. Retrieved from http://www.wrp.org.uk/news/7831 Ytterstad, B, Smith, G, Coggan, C. (1998). Harstad injury prevention study: prevention of burns in young children by community based intervention. Injury Prevention. Retrieved from http://injuryprevention.bmj.com/content/4/3/176.full
Service Efficiency Review – Toronto Fire Services & Toronto EMS
Page | 315
Appendix M – Team Background
A consortium of companies contributed to Toronto’s project. In addition to Pomax Consulting which lead the project, it included Berkshire Advisors, MGT of America, and Stantec.
Our team is composed of individuals with extensive experience and qualifications in their respective fields. We have decided to include a short team summary here because we consider it important for readers to understand the qualifications, effort and expertise that went into this project.
Patrick R. Burke LL.B. retired as the Fire Marshal of Ontario in November of 2010. His career in community safety spans well over 40 years. Pat joined the Windsor Fire Department in 1968,
working his way up through the ranks as a firefighter, lieutenant and acting captain, and being promoted to Deputy Fire Chief in 1994. In February of 2002 Pat was appointed Fire Chief of Niagara Falls, and served in that capacity until his appointment as Fire Marshal. He has coordinated all activities of fire services including firefighting, fire prevention, communications and training. In addition to the duties of Fire Chief, Pat has served on numerous Boards and Committees. Pat also pursued a law degree at the University of Windsor, and was called to the Ontario bar in 1992. In addition to his law degree, Pat also has a Bachelor of Arts in Sociology from the University of Windsor and a diploma in Labour Studies from the Labour College of Canada at the University of Montreal.
Jim Kay was General Manager and Chief of the Hamilton, Ontario Emergency Services. As Chief,
he was responsible for the direct oversight of fire and EMS services, administration, emergency management, and the corporate radio system, as well as a staff of 1,150 at 31 work sites, covering an area of over 1,200 square kilometers. Jim received his Diploma in Public Administration from the University of Western Ontario in London, Ontario, and is currently working on a Public Administration Degree at Ryerson University. Jim has over 30 years of demonstrated fire service experience and an overall understanding of the delivery of emergency services.
Winston Minor of Berkshire Advisors served as a leader in the Atlanta, Georgia Fire Department
for more than 29 years and served as Atlanta’s fire chief for over seven years until his retirement. He managed an annual budget of approximately $60 million and strove to continue
the delivery of high quality services when the city’s budget situation resulted in the availability of considerably fewer resources. Chief Minor commanded over 900 employees and 35 fire stations.
Dr. Karen Wanger, MDCM, FRCPC, FACEP, is a Royal College Board certified emergency physician with subspecialty expertise in EMS Medical Direction and 13 years of experience providing medical oversight and direction for the BC Ambulance Service, the largest single provider service in Canada. Her training in both Canada and the US gives her a solid knowledge of EMS across North America and her in-depth understanding of EMS operations in addition to medical oversight makes her unique in the industry. She has a record of successful completion
of multiple complex, multi-stakeholder projects. Most recently Karen served as the Acting Vice President, Medical Programs for the Emergency and Health Services Commission in BC. Dr.

Service Efficiency Review – Toronto Fire Services & Toronto EMS
Page | 316
Wanger is an active promoter of EMS across Canada and the US and is a frequent speaker at
national and international conferences. She serves as physician member-at-large on the Board of Directors of the National Association of EMS Physicians and has recently been elected for a second term. Karen has twenty years of clinical experience in the Emergency Department of St. Paul’s Hospital, a downtown, academic, tertiary care facility in Vancouver, British Columbia.
Michael Sanderson MStJ, MHSc, BA, AEMCA, is an internationally recognized Emergency Medical System administrator. With an extensive background gained during more than 38 years of EMS service, his experiences include hospital, government, and volunteer service delivery in Ontario and British Columbia. As a member of the Ontario Land Ambulance Transition Taskforce Michael was actively involved in the development of policy, legislation, and direction related to the transfer of land ambulance responsibility to Upper Tier Municipalities in Ontario.
His experiences include both operational and professional executive board positions at local, provincial, and national levels. He has chaired numerous national and provincial committees including ones dealing with EMS and health care integration activity and first responder activities. Michael recently completed 11 years of service as the senior operational leader for the Lower Mainland Region of the British Columbia Ambulance Service, one of four operating regions in BC. In this role he was responsible for land ambulance and dispatch operations of one of the largest EMS operations in Canada, covering more than 90,000 square kilometers with a population of 2.6 million people. A graduate of the University of Toronto MHSc (Health Administration) program, Michael has also completed a BA (Sociology) at Wilfrid Laurier University, and is a graduate of the Humber College Ambulance and Emergency Care Program.
JoEllen Walker BA, MS, MBA, from Berkshire Advisors is an expert in quantitative and qualitative data analysis and process improvement, and has extensive experience using GIS databases to evaluate fire and EMS deployment strategies. She has conducted numerous technical studies that focused on using mathematical programming and statistical tools and metrics to analyze complex problems. She has modeled staffing needs for numerous public safety agencies including the Florida Highway Patrol; Phoenix, Arizona; Oklahoma City, Oklahoma; Memphis, Tennessee; Raleigh, North Carolina; West Palm Beach, Florida; Kansas City, Missouri; Lake County, Florida; Scottsdale, Arizona; Philadelphia, Pennsylvania; Wilmington, Delaware; Hamilton, Ohio; Ocala, Florida; and Dallas, Texas.
Prior to joining Berkshire Advisors, Ms. Coe spent nearly 15 years working in Telcordia
Technology’s Quality Center. Her proficiency includes GIS mapping, ISO 9000, linear programming, Malcolm Baldrige quality assurance, process analysis, queuing analysis, and Six Sigma. Ms. Walker is certified by the American Society of Quality as a Certified Quality Engineer, Certified Reliability Engineer, and Certified Quality Auditor. JoEllen holds a B.A. degree, cum laude from Hiram College; an M.S. degree from the University of Florida; and an M.B.A. degree from the Wharton School of the University of Pennsylvania.
Bryna Rabishaw RN., MBA from Stantec Inc. has over 25 years of experience in healthcare. Her area of expertise includes strategic planning and management of clinical services and systems, including utilizing LEAN methodology and processes to maximize efficiency, effectiveness and
provide optimal patient experience. She has integrated health services for regional and tertiary clinical programs. As a Director of Regional Programs in Ontario, Bryna formed an appreciation

Service Efficiency Review – Toronto Fire Services & Toronto EMS
Page | 317
of utilization of EMS for acute patient transfers, such as Code STEMI, and the reliance on high
functioning non-urgent patient transportation to sustain patient flow through repatriation. Bryna worked in collaboration with Local Health Integration Networks and other healthcare centers to develop signed repatriation agreements to sustain responsibilities, achieve MOHLTC targets, and address wait time volumes. Bryna was also involved with the Critical Care Secretariat Surge Capacity planning which required the orchestration of EMS to ensure minor and moderate surge planning in collaboration with Criticall.
Amy Hayashi MBA, MSc. Physiology-Neuroscience; from Stantec Inc. Amy’s expertise includes strong analytical and problem-solving skills using both clinical health information and financial databases, while identifying and presenting operational inefficiencies and improvements. Amy’s experience includes acting as the Project Lead for the Ministry of Health and Long-Term Care,
Critical Care Secretariat, which involved implementing a surge management strategy across Ontario hospitals. This initiative included building partnerships with stakeholders, including EMS, hospitals and Local Health Integration Networks, identifying strengths and barriers, and the development and rollout of an electronic strategy toolkit. She has worked with decision support for major trauma centers with critical care, emergency and trauma portfolios.
Michael Walker, BA MBA the President of Berkshire Advisers has 26 years of experience evaluating the organization, management, and operations of government operations including scores of fire and emergency departments. He has conducted studies for more than 100 local and state governments, including fire and EMS operations in Philadelphia, Pennsylvania; Dallas, Texas; Memphis, Tennessee; West Palm Beach, Florida; Ocala, Florida; Newport, Rhode Island;
Arlington County, Virginia; Auburn, New York; Newport, Rhode Island,; Ottawa, Ontario; Pensacola, Florida; and Texas City, Texas.
Linus Li, MBA, CPA, CMA, CFM, CIA from MGT of America has over 20 years of experience conducting audits and reviews of state and local government entities. He has a broad knowledge base in conducting financial, compliance, and operational reviews of government agencies in diverse areas, such as public safety, education, and health care. Mr. Li received his undergraduate degree in Accounting and Information Systems from the University of Washington, and his Master of Business Administration from California State University, Sacramento. He is a Certified Public Accountant, a Certified Management Accountant, a Certified Financial Manager, a Certified
Internal Auditor, and a member of the Institute of Internal Auditors and Institute of Management
Accountants.
Mr. Li served as an Audit Supervisor/Senior Auditor Evaluator for the California State Auditor. In that role, he conducted numerous financial, compliance, and performance audits of various state agencies such as the California Department of Motor Vehicles, the California Department of Transportation, and the Governor’s Office of Planning and Research. Mr. Li also worked as a financial auditor for a public accounting firm, where he was responsible for conducting external financial audits of local governments and other entities.
Alex Polgar Ph.D., R.S.W. is a Principal of POMAX Consulting. In a thirty-five year career span he has applied his clinical and extensive assessment skills to addressing challenges such as
organizational and operational environments and the related impact on job performance, and assessing and optimizing work place performance. Alex’s abilities include specialized services

Service Efficiency Review – Toronto Fire Services & Toronto EMS
Page | 318
such as change management, organizational and operational structure, and their role in service
delivery; creating a positive and productive work culture; environmental analysis to define work culture; organization specific recruitment and selection policies, procedures and training in the application of the methods; strategic planning; policy and procedure auditing; and, developing, implementing and evaluating orientation and in-service training initiatives.
Glen Miller, BSc, MBA, a Partner at Pomax, specializes in Information Technology & Telephony Systems for Public Safety. He has an extensive 25 year international background in Fire, EMS and Police communications and IT systems in government, nonprofit, and vendor organizations. He was the Chair of the Association of 911 Service Providers of BC (www.abc911.ca); Chair of the British Columbia Chapter of NENA; and the former president of APCO Canada. Glen has a Bachelor of Science degree in Computer Science from the University of Western Ontario, and a
Master of Business Administration from the University of Liverpool. His thesis topic was “Using Technology to Affect Organizational Changes that Improve Fire Response Time”.
Glen has been most recently employed as the Director of Information Technology for Emergency Communications for Southwest British Columbia (E-Comm), in Vancouver. E-Comm provides 911 emergency call-taking and consolidated dispatch services to police, fire and ambulance agencies in southwest British Columbia serving a population base of over 2 million people. As a member of the Executive Leadership Team, Glen was responsible for the management of an IT Department of 40 people. He has implemented a number of mission critical systems including computer-aided dispatch, telephony systems, 9-1-1, Police & Fire Records Management, and Emergency Management Systems as well as upgrading telephone
switching equipment to next generation IP based 9-1-1 telephony.
Keith Meldrum of POMAX has over 15 years of local government public safety administration and operations experience. His expertise is in fire service administration, governance, and the operations and management of large centralized fire dispatch and communications systems. He has extensive experience in Computer Aided Dispatch and Records Management Systems, human resources and technology management. Until recently, Keith was the Chief Communications Officer for the Prince George Fire Rescue Service. As part of the senior management team, he was responsible for the management and operation of the centralized fire dispatch as well as radio, data, and technology systems for the fire department. The Prince
George fire dispatch centre is the largest in western Canada in terms of agencies served and
geographical service area, providing service to 82 fire and rescue agencies throughout 300,000 km2. He has extensive experience in fire service operations including Emergency Operations Centre (EOC) management. Keith is an Applied Science Technologist (AScT) in engineering technology, a Registered Technology Manager (RTMgr), and a member of the Applied Science Technologists and Technicians of British Columbia. He is certified to the Incident Command System 300 level and is completing a Bachelor of Technology degree.
Prasenjit Roy, MASc., P.Eng. is a Senior Associate at POMAX Consulting. Prasenjit is a licensed professional engineer with over 14 years of experience. Prasenjit has successfully completed and reviewed many complex response time analysis models, traffic engineering, transportation
planning and travel demand forecasting projects, and has worked both as a consultant Project Engineer in one of the largest multinational firms, and in the public sector approval authority as

Service Efficiency Review – Toronto Fire Services & Toronto EMS
Page | 319
Senior Engineer and Manager. Prasenjit’s experience includes managing and developing
computer models that simulate travel times on the road network and optimizes those travel times, system wide. He has co-ordinated and managed a number of major multi-disciplinary assignments, including environmental assessments for road and transit projects. Prasenjit is also a contributing author of Canadian Capacity Guide for Signalized Intersections. Prasenjit’s experience includes municipal planning, demographics and their effect on municipal resources.
Gopa Pal, MSc. from POMAX is a municipal planner and experienced in demography and its implication on municipal resources. Gopa has over four years of experience in one of Canada’s largest transportation consulting firms. She is an expert on planning compliance related issues, transportation planning in the urban environment and has extensive knowledge and experience in Geographic Information Systems (GIS) traffic impact studies, traffic operations, circulation,
access, parking analysis and management, noise impact studies, noise compliance certifications, field work, data collection and design tasks. She is also proficient in SYNCHRO traffic analysis software, along with AutoCAD, and various Noise analysis software.
Terry Owen, B. Comm. of POMAX was, until recently, Chief of Emergency Systems for the City of Edmonton Fire and Rescue Services and responsible for managing all public safety technology used by Fire Rescue Services, and dispatching technologies, including radio systems, mobile computer technologies and related telecommunications.
Jon Hambides, a principal in Pomax, led the project. Jon Hambides has in-depth knowledge of the operation and administration of emergency services throughout North America as well as a strong knowledge of best practices and benchmarking in the emergency services industry. Jon’s 30 year career includes experience in key senior management positions in emergency services prior to consulting.
Formerly the Manager of Resource Development for Emergency Medical Services with the Ministry of Health, he was responsible for leadership of the province’s EMS emergency response preparedness program; leadership of education and training programs for 5,000 paramedics and communications staff; system wide occupational safety and health; system wide evaluation, testing, and purchase of advanced life support and basic life support patient care equipment used in 1200 Ambulances and support vehicles; the widely referenced Ontario Pre-hospital Advanced Life Support Study; paramedic certification programs and exams; and strategic leadership for the operation and amalgamation of 21 EMS Communications Centers in the largest state run EMS system in the world at that time.