final report to alaska housing finance · pdf filefinal report to alaska housing finance...
TRANSCRIPT
Final Report to Alaska Housing Finance
Corporation
December 31, 2012
Submitted to: Scott Waterman
Alaska Housing Finance Corporation 4300 Boniface Parkway Anchorage, AK 99504
Cold Climate Housing Research Center
P.O. Box 82489
Fairbanks, AK 99708
Telephone: 907.457.3454 Fax: 907.457.3456
www.cchrc.org
Moisture Measurement in Polyurethane Foam Insulation
Moisture Measurement in Foam Insulation
www.cchrc.org
2
Month Day, Year
Submitted to: Client Name Client Address
Moisture Measurement in Polyurethane Foam Insulation
Cold Climate Housing Research Center
written by
Robbin Garber‐Slaght
December 31, 2012
Disclaimer: The research conducted or products tested used the methodologies described in this report. CCHRC cautions
that different results might be obtained using different test methodologies. CCHRC suggests caution in drawing
inferences regarding the research or products beyond the circumstances described in this report.
Moisture Measurement in Foam Insulation
www.cchrc.org
3
Contents Overview ................................................................................................................................................................................. 4
Literature Review .................................................................................................................................................................... 5
Summary ............................................................................................................................................................................. 5
Wood Moisture Sensors ...................................................................................................................................................... 5
Other Moisture Measurement Methods ............................................................................................................................ 8
Foam Moisture Studies ....................................................................................................................................................... 8
Foam Moisture Sensor Testing ............................................................................................................................................... 9
Initial Testing: Anaktuvuk Pass ............................................................................................................................................ 9
Sensor Development ........................................................................................................................................................... 9
Testing in Quinhagak Prototype Mockup ..................................................................................................................... 10
Immersion Testing Setup .............................................................................................................................................. 11
Immersion Testing Results ............................................................................................................................................ 11
Quinhagak Case Study ........................................................................................................................................................... 14
Quinhagak Data ................................................................................................................................................................. 15
Conclusions and Future Study ............................................................................................................................................... 19
References ............................................................................................................................................................................ 20
Moisture Measurement in Foam Insulation
www.cchrc.org
4
Overview Construction materials are changing rapidly and are just as rapidly being put to use in residential construction. These quick changes can leave the building science community playing catch‐up. The prevalent use of new foam insulations is an example of a quickly changing material. There are a variety of foams on the market today, from expanded to extruded to spray in‐situ. All of these foam insulations have excellent insulation potential, but their moisture performance is less understood. This is important because moisture in insulating foam will lower its thermal performance and could change its structural strength (Hedin, 1977). The Cold Climate Housing Research Center (CCHRC) has been working with a variety of partners to design and construct homes using closed‐cell spray polyurethane foam to insulate the entire envelope (walls, foundation, and roof). In order to gain a better understanding of polyurethane moisture performance, CCHRC conducted this study of ways to measure moisture in foam. This was accomplished by conducting a literature review on the topic, conducting tests on foam samples in the laboratory, and conducting a field test on a prototype structure. Expanded and extruded polystyrenes have the capacity to get wet and to hold moisture. A 3‐inch thick sheet (2 by 8 feet in area) of extruded polystyrene can weigh 3.0 kg when installed new on a flat roof, but it can be more than twice as heavy when the roof is replaced in 25 to 30 years (I. Benesch, personal communication, August 31, 2009). Most of the weight increase is due to moisture accumulation in the foam. Based on observations in the CCHRC lab, the sheets can dry somewhat if left in a warm environment with enough air movement around each sheet, however they do not recover their initial resistance to heat loss, and sheets stacked right next to each other or installed in a wall or roof with a vapor barrier have no space to dry and can continue to accumulate moisture. Closed‐cell sprayed polyurethane foams have a small capacity to hold water. In one instance, submerging a sample for 3 months had almost no effect on the moisture content of the foam. But what if the foam is installed in a wet environment and in a configuration that doesn’t allow drying for several years? Research summarized by Bomberg and Lstiburek (1998) shows that polyurethane foam absorbs relatively little water under isothermal immersion tests in comparison to being exposed to moisture under a constant thermal gradient. The newly constructed homes designed by the CCHRC Sustainable Northern Communities program enable testing to answer this question in different parts of Alaska. The Quinhagak house is in a particularly challenging environment with respect to moisture due to the abundance of wind‐driven precipitation and poorly‐drained soils. To better understand the moisture performance of the closed‐cell polyurethane, CCHRC has deployed moisture sensors in the foam walls, roof and foundation of the Quinhagak house. In order to study moisture in the Quinhagak walls, CCHRC researched moisture measuring technology. This paper presents the findings of a literature review of the use of moisture sensors in building science as well as some preliminary findings of new research into moisture sensors in foams.
Moisture Measurement in Foam Insulation
www.cchrc.org
5
Literature Review
Summary Said (2007) provides an extensive look at moisture measurement methods for building envelopes. The article focuses mostly on measurements in wood, although brick and ceramics are mentioned. Here is a basic summary list of the four major types of moisture content sensors (Said, 2007, 2004).
Resistance Based ‐ measure moisture in terms of resistance or dielectric properties which vary with moisture
o Moisture pins (embedded directly into a wooden member) o Brick, ceramic and stone sensors (wires attached to a ceramic, brick, or stone block) o Duff probe (wires attached to a wood block) o Moisture measuring dowel and disc (probes attached to a dowel or disc)
Voltage Based ‐ measure moisture using DC voltage across a known resistor o Sereda moisture sensor (electrochemical cell) o Printed circuit condensation sensors
Thermal Based ‐ use the change in temperature to determine moisture o Thermal heat‐sink method (moisture content based on change in temperature) o Thermal conductivity method (soil sensor)
Moisture Diagnostic Methods ‐ usually used to identify problem areas o Resistance Type meters (hand held pin meters) o Capacitance Type meter (radio frequency signals comparative only) o Electromagnetic Wave Methods – Time Domain Reflectometry (TDR) (measures dielectric constant
by emitting short/high frequency pulses and processes the reflected waves) o IR Thermography (survey tool)
There are pros and cons to each type of moisture content sensor. All of the moisture content sensors presented here are specific to the wood and to the location where they are placed. The pin type sensors are specific to the small area between the pins, so it is best to employ several in the area to be monitored. The resistance based sensors are the most common and easy to use; they are also capable of providing a relative percent of moisture content for some mediums. Researchers should be aware that long‐term use of resistance pins can cause errors due to polarization, and alternating voltage is necessary to avoid these errors. Voltage based sensors are very effective at detecting condensation events, but do not provide a percent moisture content beyond wet or dry. Thermal based sensors have been used extensively in soils and there are new studies that employ them in building envelopes (Ye et al., 2007), but are relatively new and untried in buildings. Moisture diagnostic methods are not long‐term in‐situ methods. They involve hand‐held meters that can provide an immediate reading of the presence of moisture in a specific location in the wall. The depth of the reading varies based on the meter, as does the type of material the meter can read accurately. These meters are useful for evaluating existing buildings in order to discover moisture problems.
Wood Moisture Sensors Moisture content in wood has been studied for several decades and fairly accurate measurement devices exist. There are a variety of moisture meters on the market that can determine the moisture content of wood framed walls. Existing sensors use resistance, voltage, capacitance, or microwave based methods. However, they are limited mainly to wood components of the wall.
Moisture Measurement in Foam Insulation
www.cchrc.org
6
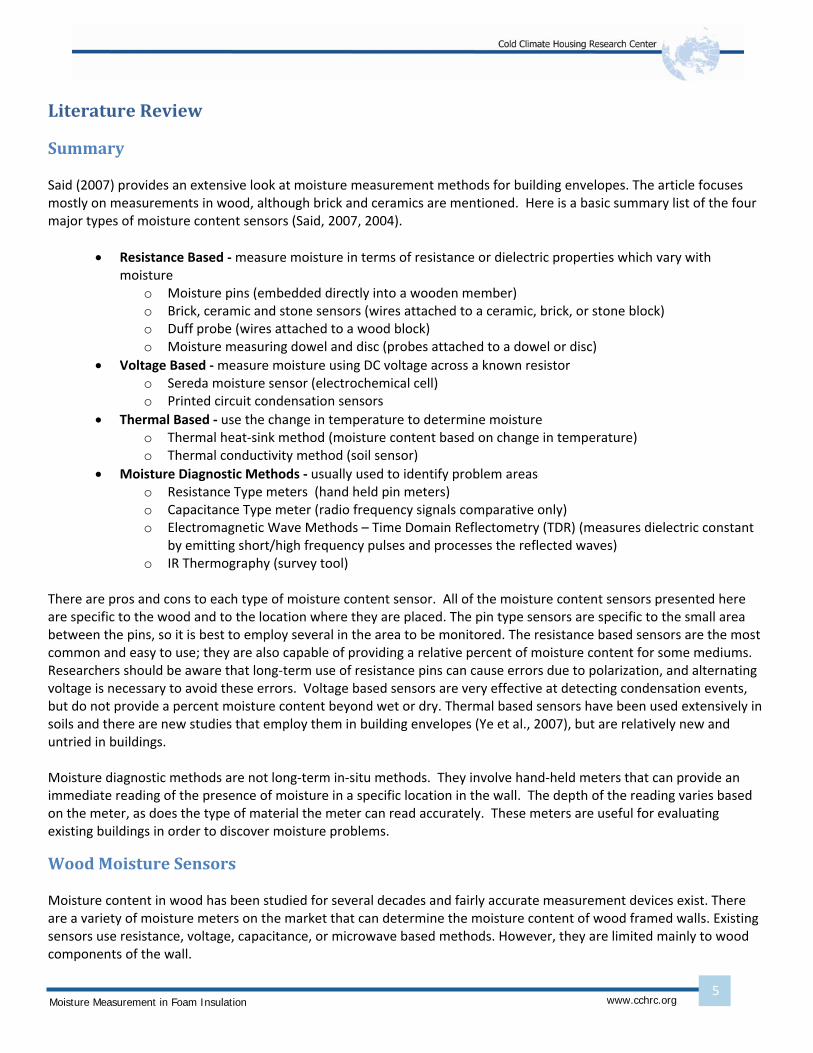
This research concentrated on the resistance moisture pins. The resistance‐based pins have been in use in the timber industry for quite some time, and have been used in a long list of research projects. They are simple to use, and easy and inexpensive to fabricate. Resistance pins are based on the simple principle that as the wood gains moisture its electrical resistance drops. The simplest version of a resistance moisture pin is to solder wire leads to the head of two brass or copper nails (Figure 1). The two nails are then embedded in a wood member of the structure at a certain distance from each other (usually about 1 inch). Both nails need to be embedded to the same depth. They should be placed in a line parallel to the grain in an area of straight grain free of knots and other abnormalities. The exposed part of the nails should be electrically insulated to prevent an electrical short in the event that bulk moisture accumulates on the top of the wood. Additionally, a temperature sensor should be embedded in the wood in the same area as the moisture pins, because the correlation between moisture and electrical resistance is dependent on temperature.
Figure 1. Installation of resistance moisture pins and temperature sensor in a plate (foreground) near plywood sheathing (background). The black sensor (left) is a thermistor embedded in the wood. The two brass nails are 1 inch apart.
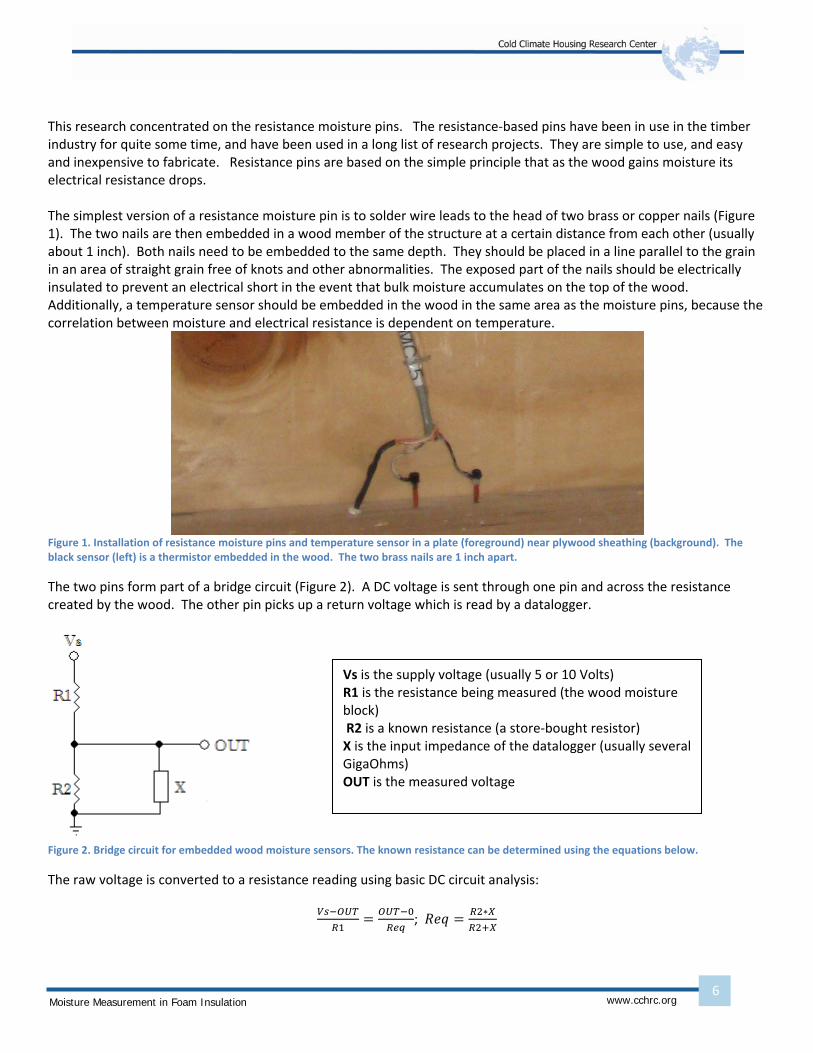
The two pins form part of a bridge circuit (Figure 2). A DC voltage is sent through one pin and across the resistance created by the wood. The other pin picks up a return voltage which is read by a datalogger.
Figure 2. Bridge circuit for embedded wood moisture sensors. The known resistance can be determined using the equations below.
The raw voltage is converted to a resistance reading using basic DC circuit analysis:
;
Vs is the supply voltage (usually 5 or 10 Volts) R1 is the resistance being measured (the wood moisture block) R2 is a known resistance (a store‐bought resistor) X is the input impedance of the datalogger (usually several GigaOhms) OUT is the measured voltage
Moisture Measurement in Foam Insulation
www.cchrc.org
7
1
11
1 1
The US Forest Service Forest Products Lab created graphs that linked moisture content of wood to electrical resistance at a specific temperature (James, 1988). Straube, Onysko, and Schumacher (2002) converted some of that data into a generic moisture content equation:
2.99 2.113 1 (1)
where R1 is the reading in ohms and MC is the moisture content percentage for Douglas fir
This moisture content is then corrected for temperature and species (Garrahan, 1991):
MC%
0.567 0.026 0.000051 2
0.881 1.0056A (2)
where Temp is the temperature at the sensor in °C, A and B are coefficients specific to wood species, and MC is the uncorrected moisture content percentage from equation 1
Most of the construction wood used in Alaska is coastal Douglas fir for which A=0.813 and B=1.888 (Evans, 2001). Choosing the known resistance (R2) can be tricky. According to Straube et al. equation 1 is relatively accurate between 7
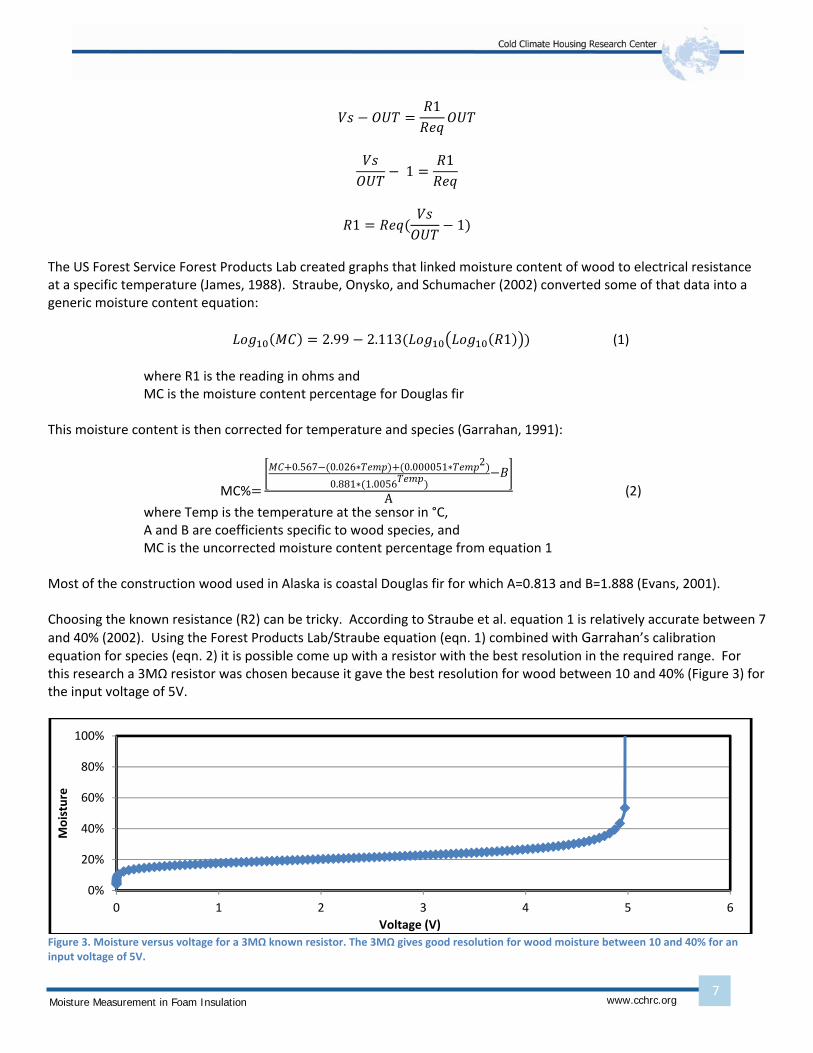
and 40% (2002). Using the Forest Products Lab/Straube equation (eqn. 1) combined with Garrahan’s calibration equation for species (eqn. 2) it is possible come up with a resistor with the best resolution in the required range. For this research a 3MΩ resistor was chosen because it gave the best resolution for wood between 10 and 40% (Figure 3) for the input voltage of 5V.
Figure 3. Moisture versus voltage for a 3MΩ known resistor. The 3MΩ gives good resolution for wood moisture between 10 and 40% for an input voltage of 5V.
0%
20%
40%
60%
80%
100%
0 1 2 3 4 5 6
Moisture
Voltage (V)
Moisture Measurement in Foam Insulation
www.cchrc.org
8
Other Moisture Measurement Methods Time‐Domain Reflectometry (TDR) uses the return time of an electromagnetic signal to measure the dielectric constant of a material. The dielectric constant varies with moisture and if the nature of the material is well known the moisture content can be simply calculated. Originally designed to find imperfections in electrical cable, TDR has been used in building science surveys in the past with some success (e.g. McFadden, 1989). TDR meters are not usually used in long‐term in‐situ testing of walls and tend to be expensive. Relative humidity sensors can also be useful in measuring moisture content inside of walls. Combining a relative humidity sensor with a temperature sensor allows for the determination of the dew point within the wall and gives an estimate of the number of condensation events within the wall. The relative humidity within the wall cavity can be used to determine a rough equivalent wood moisture content assuming that the air and wood are close to equilibrium. However, relative humidity sensors record the humidity in the air relative to the air’s holding capacity at a specific temperature, so they do not give the direct moisture content of the wall structure. A thermal dual probe uses two needles to determine the moisture content of a medium. One needle sends out an electrical pulse of energy, the other needle senses the rise in temperature. Knowing the volumetric heat capacity of the dry medium, the moisture content of the medium can be determined. Ye and Davies et al. (2004, 2007, and 2009) have conducted several tests on this method in building materials with some success. A thermal dual probe sensor has potential for use in foams, but was not studied here.
Foam Moisture Studies There are several different varieties of foam insulation designed for buildings: expanded polystyrene (EPS), extruded polystyrene (XPS), one‐part polyurethane foam, polyisocyanurate, closed‐cell spray polyurethane (ccSPF) and open‐cell spray polyurethane. Each type of foam has different thermal and moisture properties. Additionally, foam chemistry has changed in the past 30 years to limit ozone depleting chemicals as well as improve the product. Foam insulations have been used in residential housing since the 1950s. In the late 1970s and early 1980s a flurry of building science studies looked into the moisture characteristics of foam. Moisture in foam insulations decreases the resistance to heat transfer (or R‐value) and may change the physical structure of the foam (Hedin, 1977). Additionally, foam that has absorbed moisture can be susceptible to damage from freeze/thaw cycles, allowing for further absorption of moisture (Kaplar, 1974). Moisture absorption in foams is dependent on the type of foam but also on the environmental conditions. Simultaneous thermal and moisture gradients (thermal moisture drive [TMD]) will have detrimental effects on the thermal performance and dimensional stability of closed‐cell foams (Schwartz, Bomberg, Kumaran, 1989). Freeze/thaw cycles affect polystyrenes more than polyurethanes, whereas polyurethanes are more susceptible to TMD than polystyrenes (Bomberg, Lstiburek, 1998). Closed‐cell spray polyurethane foams do not absorb water like wood does; in fact foam that is sitting in water may retain some of that water when it is removed from the water, but it dries out within a few days. This may not be the case in a freeze/thaw environment; Kaplar (1974) found polyurethanes will accumulate moisture over repeated freeze/thaw cycles. Similarly, research from the early 1990s summarized by Bomberg and Lstiburek (1998) show that polyurethane foam samples increased 1.17 to 5.21% in mass after 168 freeze/thaw cycles. Newer foams may perform differently, but few tests have been published on newer foams.
Moisture Measurement in Foam Insulation
www.cchrc.org
9
Foam Moisture Sensor Testing Up to this point, research focused on wood as there is extensive literature on the topic, and very little information on other building materials. CCHRC’s newly designed and built prototype homes use very little wood, and except for the roof trusses, that wood is not in locations that are susceptible to moisture infiltration. These new homes are mostly framed with metal studs and insulated with sprayed polyurethane foam. These have moisture and electrical properties substantially different than wood, yet there may be potential for moisture to get into the foam and cause concern. Moisture in insulating foam will lower its thermal performance and could change its structural strength (Hedin, 1977). Additionally, moisture in the building envelope can promote mold growth and rot in susceptible areas (near wood and paper). Using the studies of wood and brick moisture as a jumping off point, CCHRC started by applying some of the methods used in these studies to problems in understanding the moisture content in spray foams.
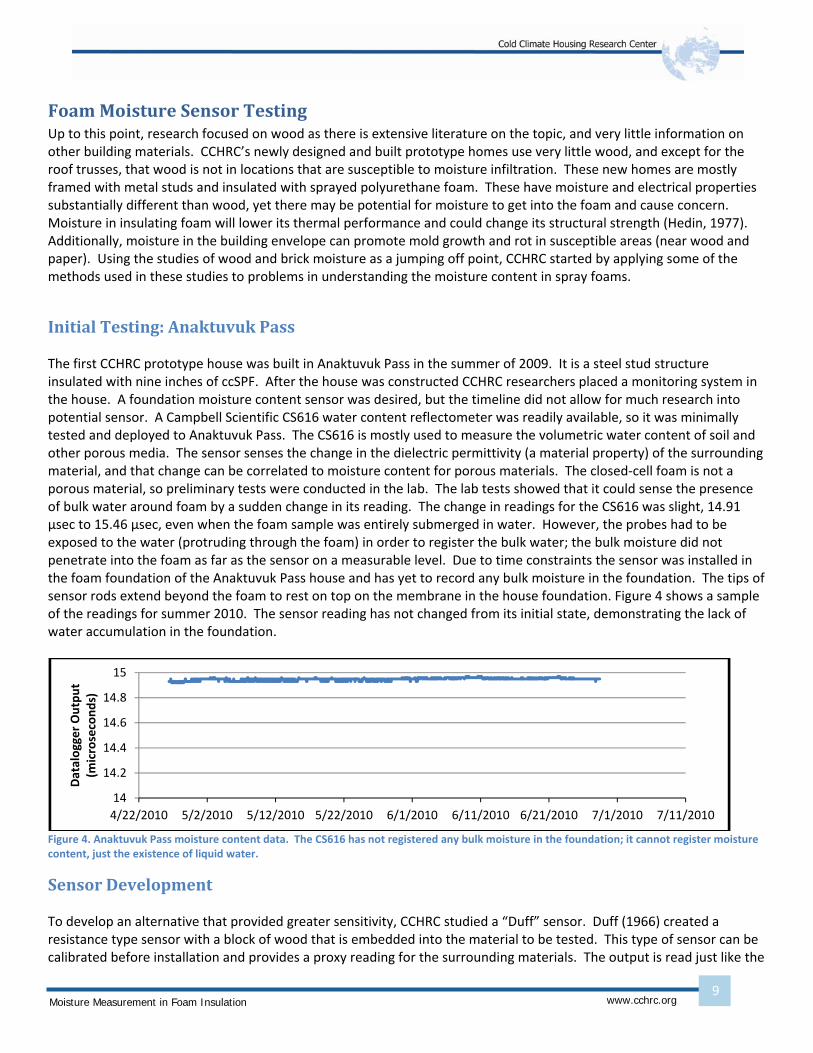
Initial Testing: Anaktuvuk Pass The first CCHRC prototype house was built in Anaktuvuk Pass in the summer of 2009. It is a steel stud structure insulated with nine inches of ccSPF. After the house was constructed CCHRC researchers placed a monitoring system in the house. A foundation moisture content sensor was desired, but the timeline did not allow for much research into potential sensor. A Campbell Scientific CS616 water content reflectometer was readily available, so it was minimally tested and deployed to Anaktuvuk Pass. The CS616 is mostly used to measure the volumetric water content of soil and other porous media. The sensor senses the change in the dielectric permittivity (a material property) of the surrounding material, and that change can be correlated to moisture content for porous materials. The closed‐cell foam is not a porous material, so preliminary tests were conducted in the lab. The lab tests showed that it could sense the presence of bulk water around foam by a sudden change in its reading. The change in readings for the CS616 was slight, 14.91 µsec to 15.46 µsec, even when the foam sample was entirely submerged in water. However, the probes had to be exposed to the water (protruding through the foam) in order to register the bulk water; the bulk moisture did not penetrate into the foam as far as the sensor on a measurable level. Due to time constraints the sensor was installed in the foam foundation of the Anaktuvuk Pass house and has yet to record any bulk moisture in the foundation. The tips of sensor rods extend beyond the foam to rest on top on the membrane in the house foundation. Figure 4 shows a sample of the readings for summer 2010. The sensor reading has not changed from its initial state, demonstrating the lack of water accumulation in the foundation.
Figure 4. Anaktuvuk Pass moisture content data. The CS616 has not registered any bulk moisture in the foundation; it cannot register moisture content, just the existence of liquid water.
Sensor Development To develop an alternative that provided greater sensitivity, CCHRC studied a “Duff” sensor. Duff (1966) created a resistance type sensor with a block of wood that is embedded into the material to be tested. This type of sensor can be calibrated before installation and provides a proxy reading for the surrounding materials. The output is read just like the
14
14.2
14.4
14.6
14.8
15
4/22/2010 5/2/2010 5/12/2010 5/22/2010 6/1/2010 6/11/2010 6/21/2010 7/1/2010 7/11/2010
Datalogger Output
(microseconds)
Moisture Measurement in Foam Insulation
www.cchrc.org
10
resistance pins. However, this sensor will only provide an accurate moisture content of the wood block. The moisture content of the surroundings can be estimated from the content of the block, if the surrounding material is similar to the block or if there’s a known correlation between the moisture content of the block and the surrounding material. Wood is not very similar to spray foam so the research expanded to look beyond wood as a surrogate moisture meter. The Institute for Research in Construction at the National Research Council of Canada has done several studies using moisture sensors to determine the moisture content in brick construction materials (Maurenbrecher, et al., 1998, Said, et al., 1999). The brick proxy sensor with wires attached is usually epoxied to a brick wall and used to monitor whether the wall is wet or dry. Three different sensor types were constructed, similar to the sensors explained in Said’s 2007 article on moisture content sensors. One inch by one inch blocks of 0.5‐inch thick balsa wood were cut and brass pins embedded 0.75 inches apart and held in place with friction and a small amount of silver conductive epoxy. Brick blocks were cut to approximately 0.75 inch by 1.25 inch by 0.5 inch thick with a diamond blade wet tile saw. The brick sizes are more approximate due to fluctuations in the cutting system. Wires were attached to the sides of the bricks using silver conductive epoxy; the wires are approximately 0.75 inch apart. Several spray foam blocks were also created 1 by 1 by 0.5 inches in size with wires embedded 0.75 inch apart.
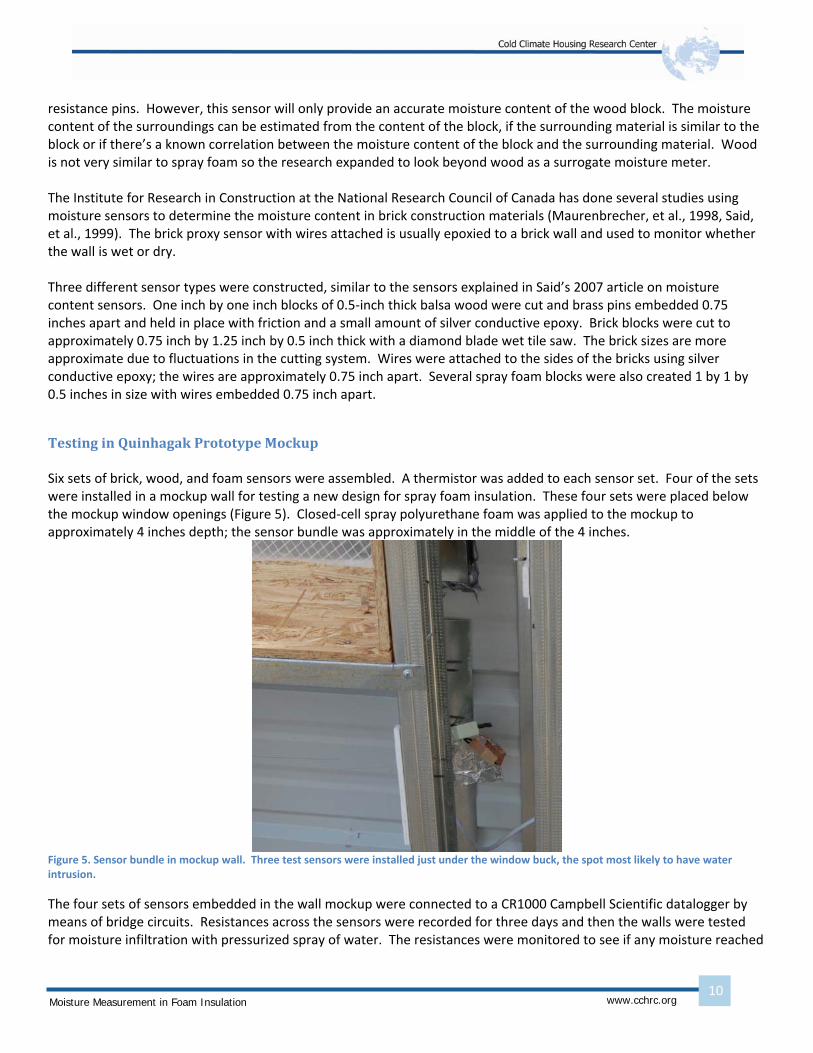
Testing in Quinhagak Prototype Mockup Six sets of brick, wood, and foam sensors were assembled. A thermistor was added to each sensor set. Four of the sets were installed in a mockup wall for testing a new design for spray foam insulation. These four sets were placed below the mockup window openings (Figure 5). Closed‐cell spray polyurethane foam was applied to the mockup to approximately 4 inches depth; the sensor bundle was approximately in the middle of the 4 inches.
Figure 5. Sensor bundle in mockup wall. Three test sensors were installed just under the window buck, the spot most likely to have water intrusion.
The four sets of sensors embedded in the wall mockup were connected to a CR1000 Campbell Scientific datalogger by means of bridge circuits. Resistances across the sensors were recorded for three days and then the walls were tested for moisture infiltration with pressurized spray of water. The resistances were monitored to see if any moisture reached
Moisture Measurement in Foam Insulation
www.cchrc.org
11
the sensor locations. There was no visible water penetration into the foam and there were no changes in readings from the 12 sensors.
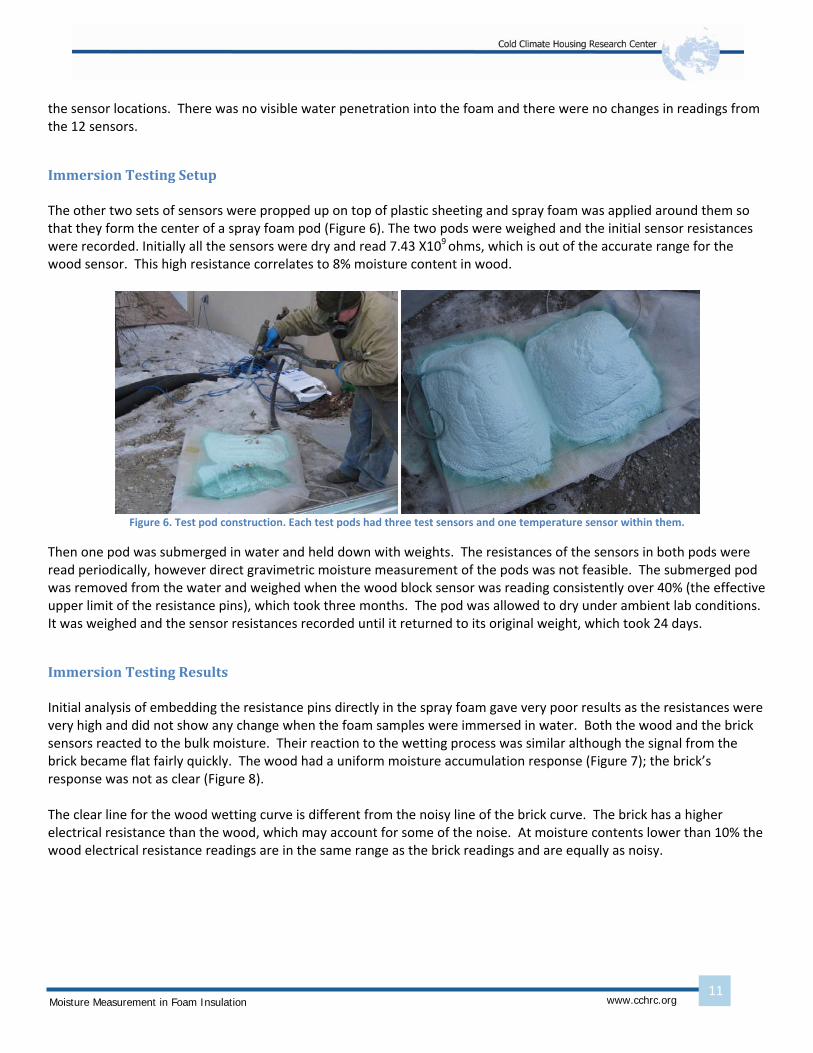
Immersion Testing Setup The other two sets of sensors were propped up on top of plastic sheeting and spray foam was applied around them so that they form the center of a spray foam pod (Figure 6). The two pods were weighed and the initial sensor resistances were recorded. Initially all the sensors were dry and read 7.43 X10⁹ ohms, which is out of the accurate range for the wood sensor. This high resistance correlates to 8% moisture content in wood.
Figure 6. Test pod construction. Each test pods had three test sensors and one temperature sensor within them.
Then one pod was submerged in water and held down with weights. The resistances of the sensors in both pods were read periodically, however direct gravimetric moisture measurement of the pods was not feasible. The submerged pod was removed from the water and weighed when the wood block sensor was reading consistently over 40% (the effective upper limit of the resistance pins), which took three months. The pod was allowed to dry under ambient lab conditions. It was weighed and the sensor resistances recorded until it returned to its original weight, which took 24 days.
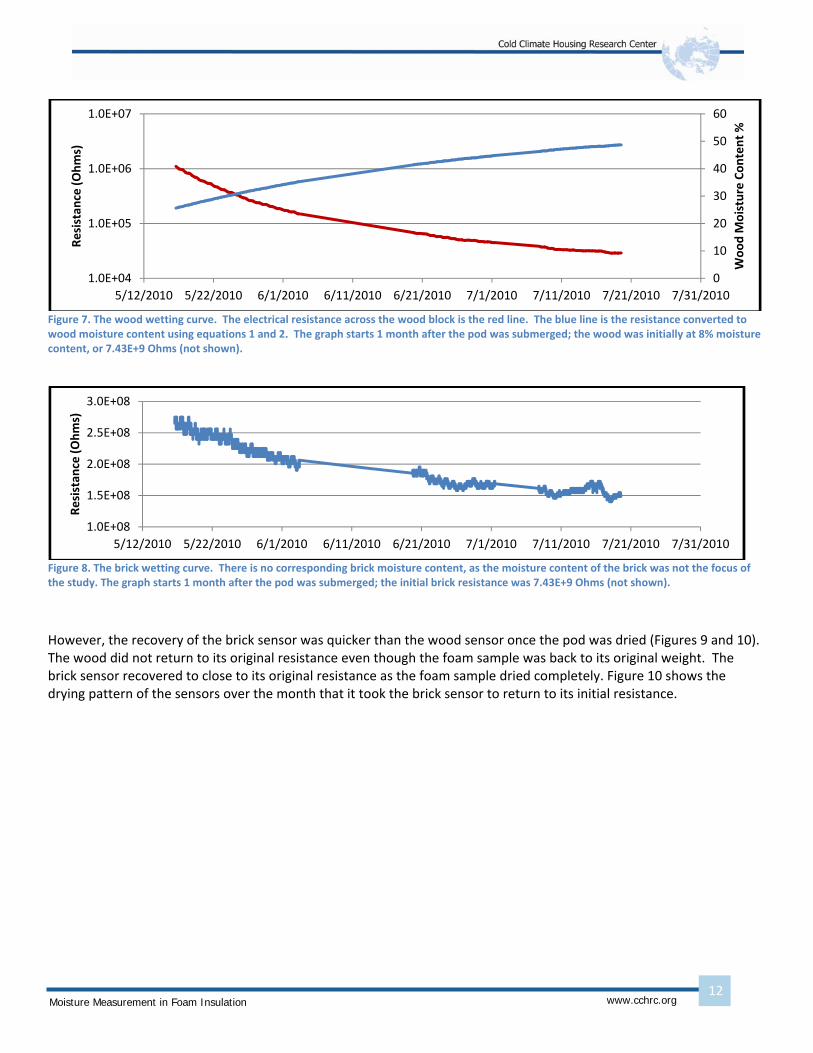
Immersion Testing Results Initial analysis of embedding the resistance pins directly in the spray foam gave very poor results as the resistances were very high and did not show any change when the foam samples were immersed in water. Both the wood and the brick sensors reacted to the bulk moisture. Their reaction to the wetting process was similar although the signal from the brick became flat fairly quickly. The wood had a uniform moisture accumulation response (Figure 7); the brick’s response was not as clear (Figure 8). The clear line for the wood wetting curve is different from the noisy line of the brick curve. The brick has a higher electrical resistance than the wood, which may account for some of the noise. At moisture contents lower than 10% the wood electrical resistance readings are in the same range as the brick readings and are equally as noisy.
Moisture Measurement in Foam Insulation
www.cchrc.org
12
Figure 7. The wood wetting curve. The electrical resistance across the wood block is the red line. The blue line is the resistance converted to wood moisture content using equations 1 and 2. The graph starts 1 month after the pod was submerged; the wood was initially at 8% moisture content, or 7.43E+9 Ohms (not shown).
Figure 8. The brick wetting curve. There is no corresponding brick moisture content, as the moisture content of the brick was not the focus of the study. The graph starts 1 month after the pod was submerged; the initial brick resistance was 7.43E+9 Ohms (not shown).
However, the recovery of the brick sensor was quicker than the wood sensor once the pod was dried (Figures 9 and 10). The wood did not return to its original resistance even though the foam sample was back to its original weight. The brick sensor recovered to close to its original resistance as the foam sample dried completely. Figure 10 shows the drying pattern of the sensors over the month that it took the brick sensor to return to its initial resistance.
0
10
20
30
40
50
60
1.0E+04
1.0E+05
1.0E+06
1.0E+07
5/12/2010 5/22/2010 6/1/2010 6/11/2010 6/21/2010 7/1/2010 7/11/2010 7/21/2010 7/31/2010
Wood M
oisture Content %
Resistan
ce (Ohms)
1.0E+08
1.5E+08
2.0E+08
2.5E+08
3.0E+08
5/12/2010 5/22/2010 6/1/2010 6/11/2010 6/21/2010 7/1/2010 7/11/2010 7/21/2010 7/31/2010
Resistan
ce (Ohms)
Moisture Measurement in Foam Insulation
www.cchrc.org
13
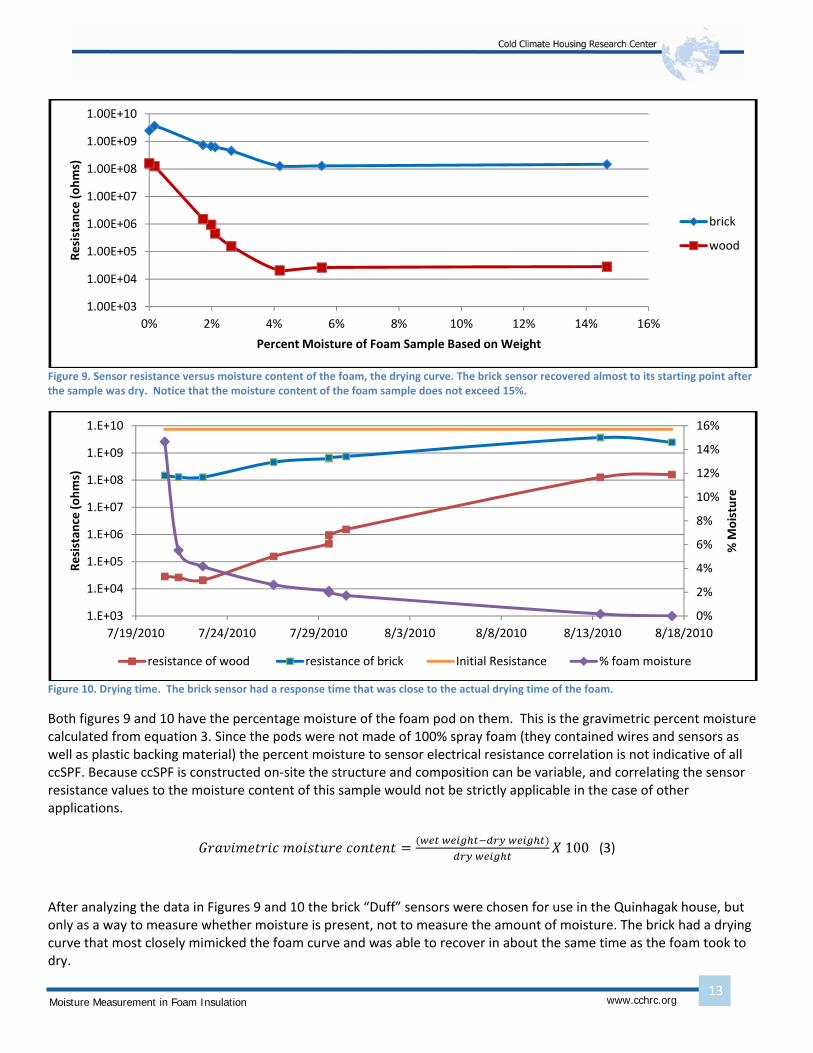
Figure 9. Sensor resistance versus moisture content of the foam, the drying curve. The brick sensor recovered almost to its starting point after the sample was dry. Notice that the moisture content of the foam sample does not exceed 15%.
Figure 10. Drying time. The brick sensor had a response time that was close to the actual drying time of the foam.
Both figures 9 and 10 have the percentage moisture of the foam pod on them. This is the gravimetric percent moisture calculated from equation 3. Since the pods were not made of 100% spray foam (they contained wires and sensors as well as plastic backing material) the percent moisture to sensor electrical resistance correlation is not indicative of all ccSPF. Because ccSPF is constructed on‐site the structure and composition can be variable, and correlating the sensor resistance values to the moisture content of this sample would not be strictly applicable in the case of other applications.
100 (3)
After analyzing the data in Figures 9 and 10 the brick “Duff” sensors were chosen for use in the Quinhagak house, but only as a way to measure whether moisture is present, not to measure the amount of moisture. The brick had a drying curve that most closely mimicked the foam curve and was able to recover in about the same time as the foam took to dry.
1.00E+03
1.00E+04
1.00E+05
1.00E+06
1.00E+07
1.00E+08
1.00E+09
1.00E+10
0% 2% 4% 6% 8% 10% 12% 14% 16%
Resistan
ce (ohms)
Percent Moisture of Foam Sample Based on Weight
brick
wood
0%
2%
4%
6%
8%
10%
12%
14%
16%
1.E+03
1.E+04
1.E+05
1.E+06
1.E+07
1.E+08
1.E+09
1.E+10
7/19/2010 7/24/2010 7/29/2010 8/3/2010 8/8/2010 8/13/2010 8/18/2010
% M
oisture
Resistan
ce (ohms)
resistance of wood resistance of brick Initial Resistance % foam moisture
Moisture Measurement in Foam Insulation
www.cchrc.org
14
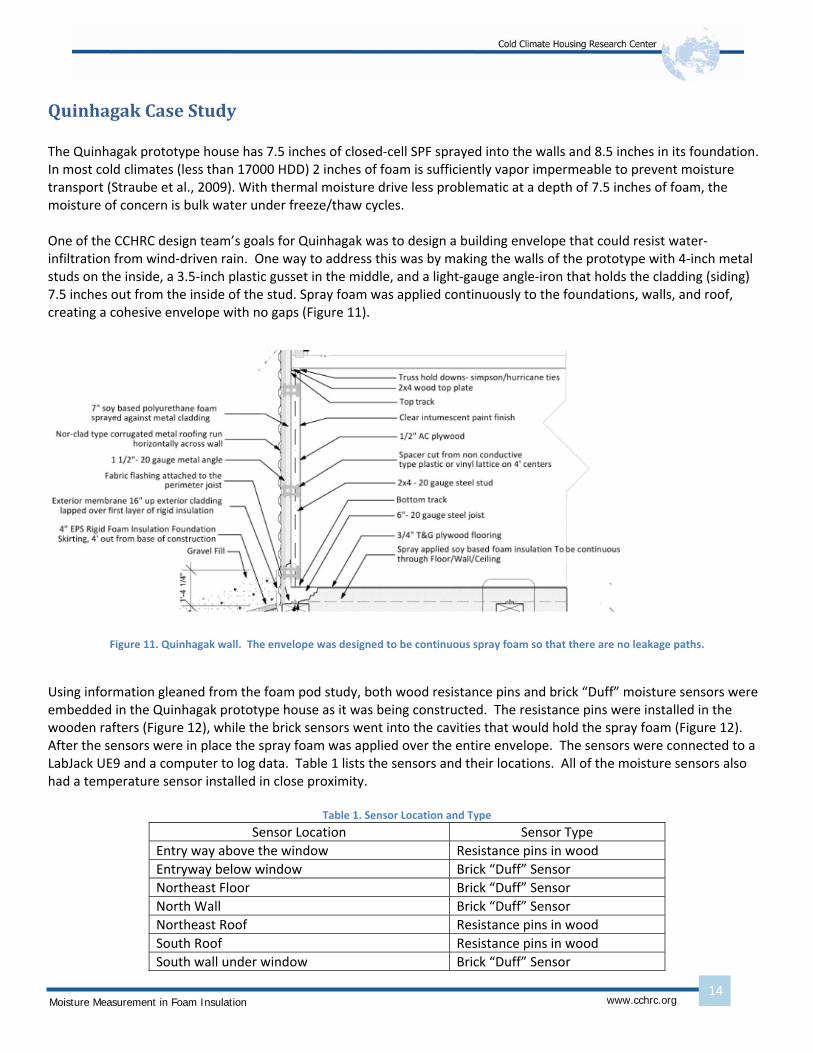
Quinhagak Case Study The Quinhagak prototype house has 7.5 inches of closed‐cell SPF sprayed into the walls and 8.5 inches in its foundation. In most cold climates (less than 17000 HDD) 2 inches of foam is sufficiently vapor impermeable to prevent moisture transport (Straube et al., 2009). With thermal moisture drive less problematic at a depth of 7.5 inches of foam, the moisture of concern is bulk water under freeze/thaw cycles. One of the CCHRC design team’s goals for Quinhagak was to design a building envelope that could resist water‐infiltration from wind‐driven rain. One way to address this was by making the walls of the prototype with 4‐inch metal studs on the inside, a 3.5‐inch plastic gusset in the middle, and a light‐gauge angle‐iron that holds the cladding (siding) 7.5 inches out from the inside of the stud. Spray foam was applied continuously to the foundations, walls, and roof, creating a cohesive envelope with no gaps (Figure 11).
Figure 11. Quinhagak wall. The envelope was designed to be continuous spray foam so that there are no leakage paths.
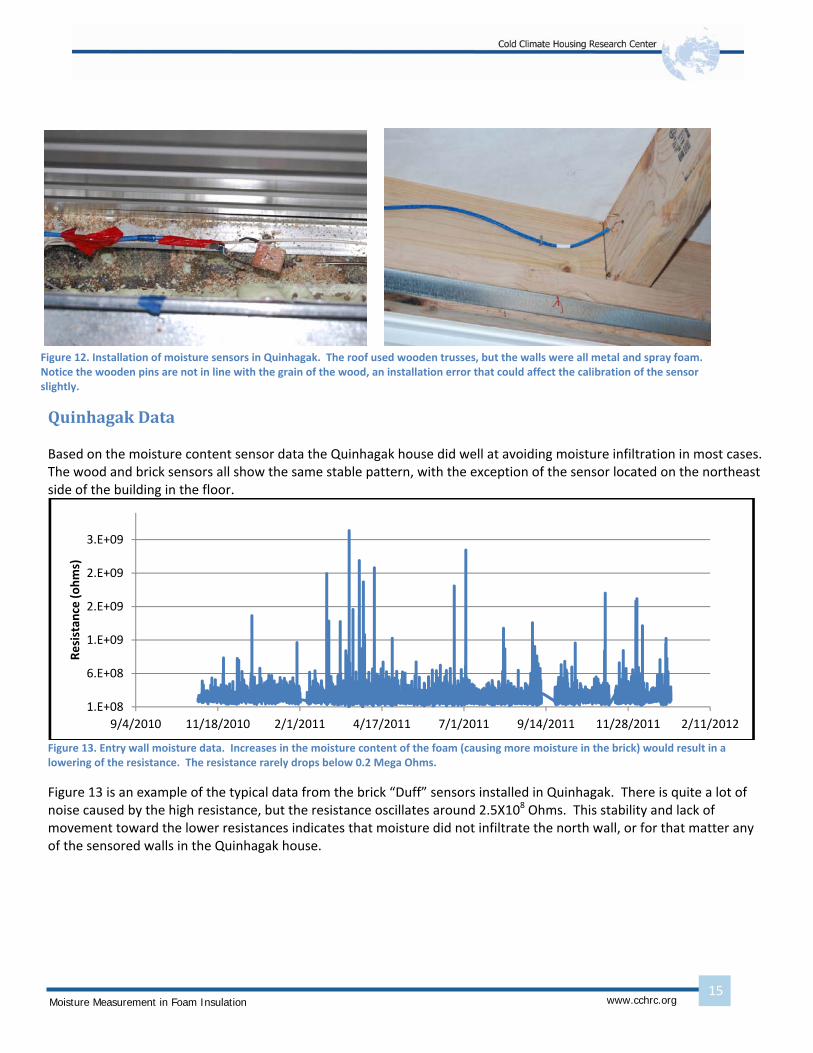
Using information gleaned from the foam pod study, both wood resistance pins and brick “Duff” moisture sensors were embedded in the Quinhagak prototype house as it was being constructed. The resistance pins were installed in the wooden rafters (Figure 12), while the brick sensors went into the cavities that would hold the spray foam (Figure 12). After the sensors were in place the spray foam was applied over the entire envelope. The sensors were connected to a LabJack UE9 and a computer to log data. Table 1 lists the sensors and their locations. All of the moisture sensors also had a temperature sensor installed in close proximity.
Table 1. Sensor Location and Type
Sensor Location Sensor Type
Entry way above the window Resistance pins in wood
Entryway below window Brick “Duff” Sensor
Northeast Floor Brick “Duff” Sensor
North Wall Brick “Duff” Sensor
Northeast Roof Resistance pins in wood
South Roof Resistance pins in wood
South wall under window Brick “Duff” Sensor
Moisture Measurement in Foam Insulation
www.cchrc.org
15
Quinhagak Data Based on the moisture content sensor data the Quinhagak house did well at avoiding moisture infiltration in most cases. The wood and brick sensors all show the same stable pattern, with the exception of the sensor located on the northeast side of the building in the floor.
Figure 13. Entry wall moisture data. Increases in the moisture content of the foam (causing more moisture in the brick) would result in a lowering of the resistance. The resistance rarely drops below 0.2 Mega Ohms.
Figure 13 is an example of the typical data from the brick “Duff” sensors installed in Quinhagak. There is quite a lot of noise caused by the high resistance, but the resistance oscillates around 2.5X10⁸ Ohms. This stability and lack of movement toward the lower resistances indicates that moisture did not infiltrate the north wall, or for that matter any of the sensored walls in the Quinhagak house.
1.E+08
6.E+08
1.E+09
2.E+09
2.E+09
3.E+09
9/4/2010 11/18/2010 2/1/2011 4/17/2011 7/1/2011 9/14/2011 11/28/2011 2/11/2012
Resistan
ce (ohms)
Figure 12. Installation of moisture sensors in Quinhagak. The roof used wooden trusses, but the walls were all metal and spray foam. Notice the wooden pins are not in line with the grain of the wood, an installation error that could affect the calibration of the sensor slightly.
Moisture Measurement in Foam Insulation
www.cchrc.org
16
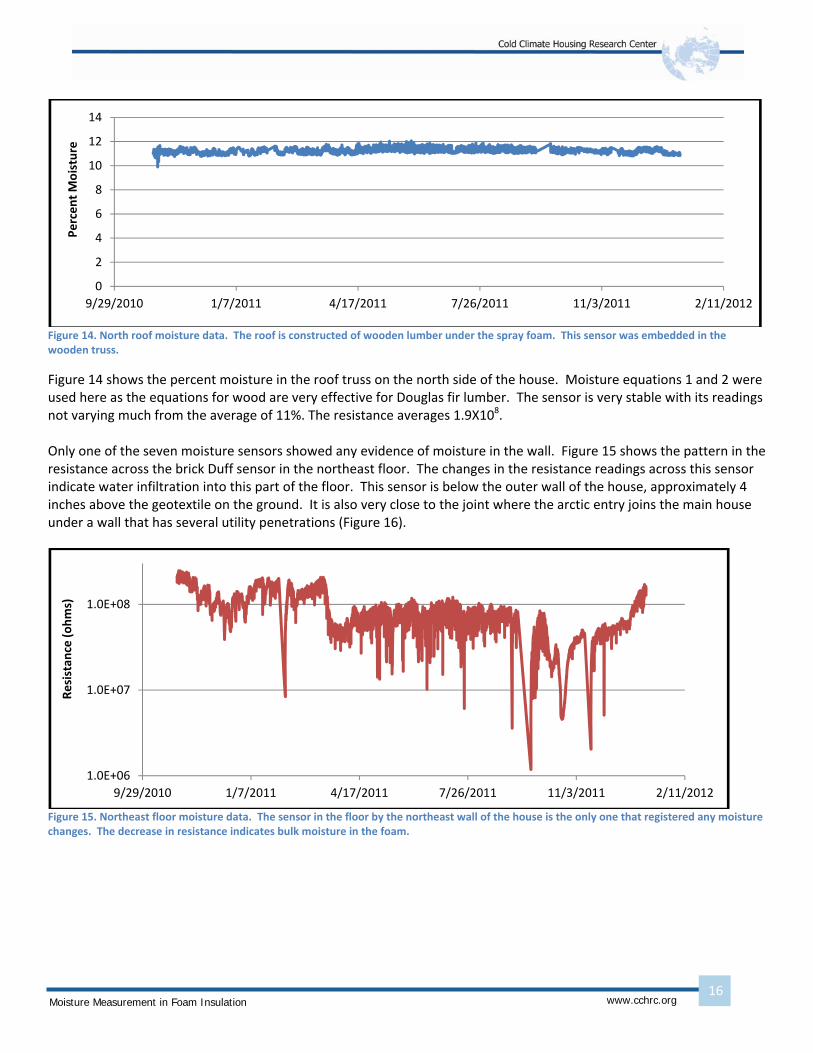
Figure 14. North roof moisture data. The roof is constructed of wooden lumber under the spray foam. This sensor was embedded in the wooden truss.
Figure 14 shows the percent moisture in the roof truss on the north side of the house. Moisture equations 1 and 2 were used here as the equations for wood are very effective for Douglas fir lumber. The sensor is very stable with its readings not varying much from the average of 11%. The resistance averages 1.9X10⁸. Only one of the seven moisture sensors showed any evidence of moisture in the wall. Figure 15 shows the pattern in the resistance across the brick Duff sensor in the northeast floor. The changes in the resistance readings across this sensor indicate water infiltration into this part of the floor. This sensor is below the outer wall of the house, approximately 4 inches above the geotextile on the ground. It is also very close to the joint where the arctic entry joins the main house under a wall that has several utility penetrations (Figure 16).
Figure 15. Northeast floor moisture data. The sensor in the floor by the northeast wall of the house is the only one that registered any moisture changes. The decrease in resistance indicates bulk moisture in the foam.
0
2
4
6
8
10
12
14
9/29/2010 1/7/2011 4/17/2011 7/26/2011 11/3/2011 2/11/2012
Percent Moisture
1.0E+06
1.0E+07
1.0E+08
9/29/2010 1/7/2011 4/17/2011 7/26/2011 11/3/2011 2/11/2012
Resistan
ce (ohms)
Moisture Measurement in Foam Insulation
www.cchrc.org
17
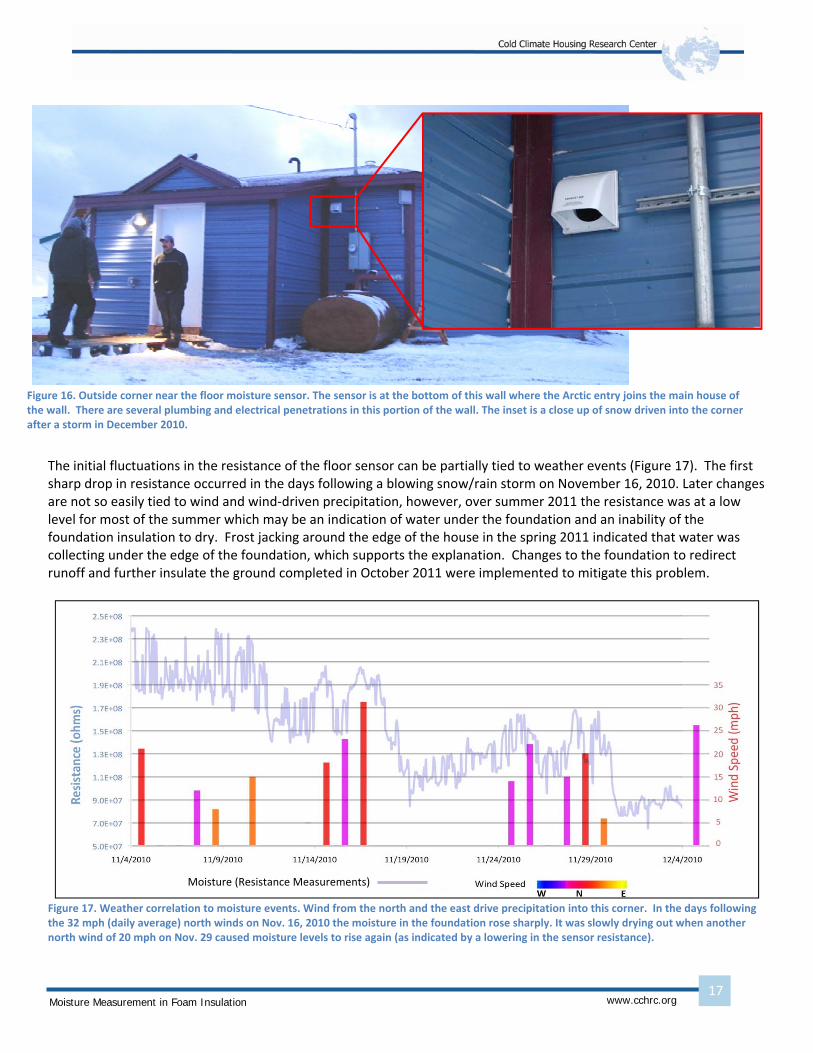
The initial fluctuations in the resistance of the floor sensor can be partially tied to weather events (Figure 17). The first sharp drop in resistance occurred in the days following a blowing snow/rain storm on November 16, 2010. Later changes are not so easily tied to wind and wind‐driven precipitation, however, over summer 2011 the resistance was at a low level for most of the summer which may be an indication of water under the foundation and an inability of the foundation insulation to dry. Frost jacking around the edge of the house in the spring 2011 indicated that water was collecting under the edge of the foundation, which supports the explanation. Changes to the foundation to redirect runoff and further insulate the ground completed in October 2011 were implemented to mitigate this problem.
Figure 17. Weather correlation to moisture events. Wind from the north and the east drive precipitation into this corner. In the days following the 32 mph (daily average) north winds on Nov. 16, 2010 the moisture in the foundation rose sharply. It was slowly drying out when another north wind of 20 mph on Nov. 29 caused moisture levels to rise again (as indicated by a lowering in the sensor resistance).
Figure 16. Outside corner near the floor moisture sensor. The sensor is at the bottom of this wall where the Arctic entry joins the main house of the wall. There are several plumbing and electrical penetrations in this portion of the wall. The inset is a close up of snow driven into the corner after a storm in December 2010.
Moisture (Resistance Measurements)
Moisture Measurement in Foam Insulation
www.cchrc.org
18
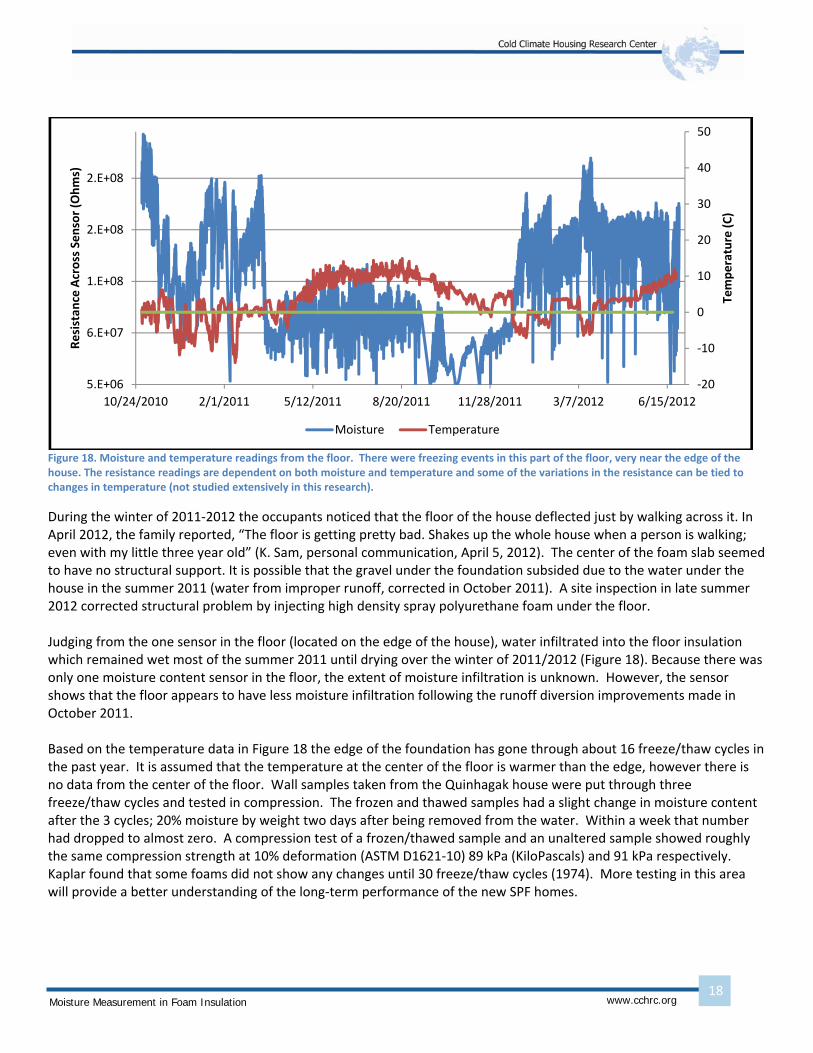
Figure 18. Moisture and temperature readings from the floor. There were freezing events in this part of the floor, very near the edge of the house. The resistance readings are dependent on both moisture and temperature and some of the variations in the resistance can be tied to changes in temperature (not studied extensively in this research).
During the winter of 2011‐2012 the occupants noticed that the floor of the house deflected just by walking across it. In April 2012, the family reported, “The floor is getting pretty bad. Shakes up the whole house when a person is walking; even with my little three year old” (K. Sam, personal communication, April 5, 2012). The center of the foam slab seemed to have no structural support. It is possible that the gravel under the foundation subsided due to the water under the house in the summer 2011 (water from improper runoff, corrected in October 2011). A site inspection in late summer 2012 corrected structural problem by injecting high density spray polyurethane foam under the floor. Judging from the one sensor in the floor (located on the edge of the house), water infiltrated into the floor insulation which remained wet most of the summer 2011 until drying over the winter of 2011/2012 (Figure 18). Because there was only one moisture content sensor in the floor, the extent of moisture infiltration is unknown. However, the sensor shows that the floor appears to have less moisture infiltration following the runoff diversion improvements made in October 2011. Based on the temperature data in Figure 18 the edge of the foundation has gone through about 16 freeze/thaw cycles in the past year. It is assumed that the temperature at the center of the floor is warmer than the edge, however there is no data from the center of the floor. Wall samples taken from the Quinhagak house were put through three freeze/thaw cycles and tested in compression. The frozen and thawed samples had a slight change in moisture content after the 3 cycles; 20% moisture by weight two days after being removed from the water. Within a week that number had dropped to almost zero. A compression test of a frozen/thawed sample and an unaltered sample showed roughly the same compression strength at 10% deformation (ASTM D1621‐10) 89 kPa (KiloPascals) and 91 kPa respectively. Kaplar found that some foams did not show any changes until 30 freeze/thaw cycles (1974). More testing in this area will provide a better understanding of the long‐term performance of the new SPF homes.
‐20
‐10
0
10
20
30
40
50
5.E+06
6.E+07
1.E+08
2.E+08
2.E+08
10/24/2010 2/1/2011 5/12/2011 8/20/2011 11/28/2011 3/7/2012 6/15/2012
Temperature (C)
Resistan
ce Across Sensor (Ohms)
Moisture Temperature
Moisture Measurement in Foam Insulation
www.cchrc.org
19
Conclusions and Future Study Moisture analysis in buildings is important for understanding the health of the building and of the occupants. Spray foams in residential construction in the north are becoming more prominent and questions about their long‐term moisture performance remain unanswered (e.g. what do freeze/thaw cycles do to foam structure and thermal performance). CCHRC and its partners have employed closed‐cell spray polyurethane foam in a variety of climates across Alaska, with varying degrees of success. The homes have excellent thermal envelope performance, thanks to the continuous spray foam envelope. One difficulty facing these houses has been keeping the foundations stable on ice rich permafrost and marginal wetlands. Moisture under the Quinhagak foundation has spurred the need for a better understanding of how the foam performs when wet, especially in terms of its structural integrity and thermal characteristics. More information on the moisture characteristics of the foam over longer periods and freeze/thaw cycles would help inform future use of the products. The wetness sensors developed for this study have been effective in analyzing the presence of moisture in the Quinhagak prototype house. However, the sensors are very location‐specific and the monitoring of the prototype house would be better served with more sensors spread throughout the floor. The sensors do not sense much besides the presence of bulk water in the foam. Further study and development could lead to more accurate sensors for this application. Additionally, more study into the moisture characteristics of polyurethane foams would better inform their use in building applications in cold and wet climates.
Moisture Measurement in Foam Insulation
www.cchrc.org
20
References Altman, K. (1974). Measurement of moisture in concrete, in particular in construction components made of EPS‐concrete. Programme 2nd International CIB/RILEM Symposium on Moisture Problems in Buildings (pp. 1‐13). ASTM Standard D1621 (2010). Standard test method for compressive properties of rigid cellular plastics. ASTM International, West Conshohocken, PA, 2010, DOI: 10.1520/D1621‐10, www.astm.org Bomberg, M. and Kumaran, M. (1999). Use of field‐applied polyurethane foams in buildings. Construction Technology Update. (32) National Research Council of Canada. Retrieved from http://www.nrc‐cnrc.gc.ca/obj/irc/doc/ctu‐n32_eng.pdf. Bomberg, M., and Lstiburek J. (1998). Spray Polyurethane Foam in External Envelopes of Buildings. Boca Raton, FL: CRC Press. Cunningham, M. (1985). Automatic data logging timber moisture contents over the range of 10% to 50% w/w. in Proceedings of 1985 Moisture and Humidity Symposium. Washington D.C.; Instrument Society of America: Research Triangle Park, NC (pp. 475‐483). Davies, M., Tirovic, M. Ye, Z., and Baker, P. (2004). A low cost, accurate instrument to measure the moisture content of building envelopes in situ: a modeling study. In Building Services Engineering Research and Technology (pp. 295‐304). Davies, M. and Ye, Z. (2009). A ‘pad’ sensor for measuring the moisture content of building materials. Building Service Engineering Research and Technology. 30(3), 263‐270. Dechow, F. and Epstein, K (1978). Laboratory and field investigations of moisture absorption and its effect on thermal performance of various insulations. In Tye, R, ed. Thermal Transmission Measurements of Insulation. ASTM STP660 (pp. 234‐260). Duff, J. (1996). A probe for accurate determination of moisture content of wood products. (General Technical Report FPL‐0142) USDA, Forest Service, Forest Products Laboratory. Eidmann, G., Savelsberg, R., Blumler, P., and Blumich, B. (1996). The NMR MOUSE, a mobile universal surface explorer. Journal of Magnetic Resonance, Series A. 122, 104‐109. Evans, J., Kretschmann D., Herian, V., and Green, D. (2001). Procedures for developing allowable properties for a single species under ASTM D1190 and computer programs useful for the calculations. (General Technical Report FPL‐GTR‐126) USDA, Forest Service, Forest Products Laboratory. Garrahan, P., Meil J., and Onysko, D. (1991). Moisture in framing lumber field measurement, acceptability, and use surveys. Canada Mortgage and Housing Corporation. Retrieved from ftp://ftp.cmhc‐schl.gc.ca/chic‐ccdh/Research_Reports‐Rapports_de_recherche/Older5/Ca1%20MH65%2091M52_w.pdf Garrahan P. (1988). Moisture meter correction factors. Forintek Canada Corp. Retrieved from ftp://ftp2.fs.fed.us/incoming/fpl/Kretschmann/In‐grade%20testing%20of%20Structural%20lumber%20chapters/Moisture%20meter%20correction%20factors.pdf
Moisture Measurement in Foam Insulation
www.cchrc.org
21
James, W. (1988). Electric moisture meters for wood. (General Technical Report FPL‐GTR‐6) USDA, Forest Service Forest Products Laboratory. Keyhani, A. (2001). Development of mini‐gypsum blocks for soil moisture measurement and their calibration to compensate for temperature. Journal of Agricultural Science and Technology. 3, 141‐145. McFadden, T. (1998). Moisture accumulation in insulated walls in cold regions. Journal of Cold Regions Engineering. 3(2). 73‐83. Maurenbrecher, A., Shirtliffe, C., Rousseau, M., and Said, M. (1998). Monitoring the hygrothermal performance of a masonry wall with and without thermal insulation. in Proceedings of the 8th Canadian Masonry Symposium. Jasper, Alberta. Maksimovic, M., Stojanovic, G., Radovanovic, M., Malesev, M., Radonjanin, V., Radosavljevic, G., and Smetana, W. (2012). Application of a LTCC sensor for measuring moisture content of building materials. Construction and Building Materials. 26, 327‐333. Ong, J., You, Z., Mills‐Beale, J. Tan, E., Pereles, B., and Ong, K. (2008). A wireless, passive embedded sensor for real‐time monitoring of water content in civil engineering materials. IEEE Sensors Journal. 8(12), 2053‐2058. Ong, K., Grimes, C., Robbins, C., and Singh, R. (2001). Design and application of a wireless, passive, resonant‐circuit environmental monitoring sensor. Sensors and Actuators A. (93). 33‐43. Phillipson, M., Baker, P., Davies, M., Ye, Z., McNaughtan, A., Galbraith, G., and McLean, R. (2007). Moisture measurement in building materials: an overview of current methods and new approaches. Building Service Engineering Research and Technology. 28(4), 303‐316. Said, M. (1997). Long‐term field monitoring of an EIFS clad wall. Journal of Thermal Insulation and Building Envelopes. (20). 320‐338 Said, M. (2004). Moisture measurement guide for building envelope applications. (Research Report #190) National Research Council Canada. Said, M. (2007). Measurement methods of moisture in building envelopes – a literature review. International Journal of Architectural Heritage. 1(3), 293‐310. Said, M., Brown, W., Shirtliffe, C., and Maurenbrecher, A. (1999). Monitoring of the building envelope of a heritage house – a case study. Energy and Buildings Journal. 30 (3), 211‐219. Schwartz, N.V. (1988). Water vapor transmission and moisture accumulation in cellular plastics. (IRC Paper No. 1573). National Research Council of Canada. Retrieved from http://www.nrc‐cnrc.gc.ca/obj/irc/doc/pubs/nrcc29771. Schwartz, N., Bomberg, M. and Kumaran, M. (1989). Water vapor transmission and the moisture accumulation in polyurethane and polisocyanurate foams. (IRC paper no. 1614) National Research Council of Canada. Retrieved from http://www.nrc‐cnrc.gc.ca/obj/irc/doc/pubs/nrcc30890/nrcc30890.pdf.
Moisture Measurement in Foam Insulation
www.cchrc.org
22
Straube, J., Onysko, D., and Schumacher, C. (2002). Methodology and design of field experiments for monitoring the hygrothermal performance of wood frame enclosures. Journal of Thermal Envelope and Building Science. 26(2), 123‐151. Straube, J., Smith, R., and Finch, G. (2009). Spray polyurethane foam: the need for vapor retarders in above‐grade residential walls. Canadian Urethane Foam Contractors Association. Retrieved from http://www.cufca.ca/research/The_Need_for_Vapour_Retarders_in_Above‐Grade_Residential_Walls.pdf Stojanovic, G., Radovanovic, M., Malesev, M., and Radonjanin, V. (2010). Monitoring of water content in building materials using a wireless passive sensor. Sensors. 10, 4270‐4280. doi:10.3390/s100504270 TenWolde, A., and Courville, G. (1985). Instrumentation for measuring moisture in building envelopes. ASHRAE Transactions. 91, 1101‐1115. Ueno, K., and Straube, J. (2008). Laboratory calibration and field results of wood resistance humidity sensors. Building Enclosure Science and Technology Conference, BEST 1. Retrieved from http://www.thebestconference.org/best1/pdfs/004.pdf Ye, Z., Tirovic, M., Davies, M., Baker, P., Phillipson, M., Sanders, C., Galbraith, G., and McLean, R. (2009). The testing of two methods for the moisture measurement of building fabrics via comparisons with data from an X‐ray system. Building and Environment. 44(7), 1409‐1417. Ye, Z., Tirovic, M., Davies, M., Baker, P., Phillipson, M., Galbraith, G., and McLean, R. (2007). The optimization of a thermal dual probe instrument for the measurement of the moisture content of building envelopes. Building Service Engineering Research and Technology. 28(4), 317‐327.