final report mod 160 topless trawl...
TRANSCRIPT

Evaluation of a Topless Bottom Trawl Design with a 160 foot Headrope and Two Restrictor Lines for Fish Capture in the Summer Flounder Fishery
8 January 2014
Meghan Gahm Joseph DeAlteris
Christopher Parkins
DeAlteris Associates Inc. PO Box 366
Onancock, VA 23417
FINAL REPORT
NMFS Contract Number: EA-133F-12-SE-2141 "Although released by NOAA, the information in this paper does not reflect, represent, or form any part of the support of the policies of NOAA or the Department of Commerce. Further, release by NOAA does not imply that NOAA or the Department of Commerce agrees with the information contained herein."

1
ABSTRACT Previous conservation engineering experiments using a turtle excluder device (TED) in the summer flounder fishery resulted in a significant loss of target species, about 35% on average. The evaluation of a 106-foot headrope topless trawl in the summer flounder fisheries had no significant loss of target species, but was ineffective at reducing sea turtle bycatch. A 160-foot headrope was effective at reducing sea turtle catch, but was then tested in the summer flounder fishery for target catch retention and had a significant loss of target species, ranging from 51-74% on average. In an effort to reduce catch loss, this 160-foot headrope net was evaluated at the flume tank at the Marine Institute in St. John’s, Newfoundland and was reconfigured with two restrictor lines. The 160-foot topless trawl with 30 floats and two restrictor lines was tested in the summer flounder fishery in the summer of 2013 to assess its ability to catch finish. The purpose of this report is to present the methodology used, data collected, and a basic analysis on the catch efficiency of the 160 foot headrope topless trawl design compared to a traditional trawl design. The results of this evaluation show that the 160 foot headrope topless trawl with restrictor lines significantly reduced the catch of summer flounder but with the proper float arrangement, the loss of target species was reduced to a 22.7% loss when compared to a traditional trawl.
INTRODUCTION
An experimental topless trawl has been designed in an attempt to mitigate sea turtle
interactions within the southern New England and mid-Atlantic summer flounder fishery. Previous experiments focused on mitigating sea turtle interactions in the summer flounder fishery used a turtle excluder device (TED) and resulted in a significant loss of target species (Lawson, DeAlteris, and Parkins 2007; Salerno and Eayrs 2010; DeAlteris and Parkins 2009, 2010). The topless trawl was proposed as an alternative design to a TED in the trawl to reduce sea turtle interactions with an increased headrope length. This would theoretically reduce sea turtle catch by allowing sea turtles to avoid being captured by the net by swimming upward after encountering the sweep or other forward portions of the net. By increasing the headrope length, the sea turtles are given more time to avoid capture by swimming “out of the net” (i.e., by swimming above the headrope before the headrope reaches them.
A topless trawl design was first tested for catch efficiency within the summer flounder fishery in the summer of 2010 (DeAlteris and Parkins 2011b). The initial design for the topless trawl had a 106 foot headrope with an 80 foot footrope. This was compared to a traditional summer flounder trawl that had a 65 foot headrope and 80 foot footrope. The fishing circle and sweep were identical between the experimental and control net with the only alterations being the headrope. After the completion of 40 paired tows (80 tows total), the topless trawl with a 106 foot headrope showed no significant difference in catch efficiency from the control net with a 65 foot headrope (DeAlteris and Parkins 2011b). The 106-foot headrope trawl was then tested off the coast of Georgia on its ability to reduce sea turtle catch. The 106-foot headrope did not perform as needed to reduce sea turtle bycatch, but a headrope increased to 160 feet during the field study was effective at reducing sea turtle bycatch. It captured one sea turtle compared to the 25 captured in the control net (DeAlteris and Parkins 2011a and 2011b). The 160-foot headrope was then tested in the summer flounder fishery on its ability to catch summer flounder compared to the 65-foot control headrope design. With different float configurations, the 160-foot headrope had significant loss of summer flounder with an average of 51%-74% loss (DeAlteris et. al

2
2013). Many attempts were made during the study to reduce the loss of catch, but only minor improvements were observed and all modifications resulted in significant loss (DeAlteris et. al 2013).
A model net of the 160-foot headrope design was tested in the flume tank at the Marine Institute at St. John’s, Newfoundland to determine why this net was ineffective at catching flounder. The flume tank testing allowed us to evaluate the configuration and rigging of the 160-foot headrope. The wings appeared to be lying flat, which would prevent the net from retaining catch of target species. This problem was addressed by adding two restrictor lines to optimally configure the gear to a design that would still effectively reduce sea turtle catch but increase catch of target species.
The 160-foot headrope with two restrictor lines was tested in 2013 in the summer flounder fishery for catch efficiency compared to a standard 65-foot headrope control net. The null hypothesis was that there would be no significant difference of catch between the control net and the experimental topless trawl at α=0.05. Because this net is designed to be used in a commercial fishery, it was also important to consider the size distribution of the summer flounder captured. The null hypothesis was that there would be no significant difference between the length frequency of the flounder with α=0.05. The purpose of this report is to present the methodology used, data collected, and analysis of target and bycatch species catch efficiency of the 160-foot headrope topless trawl design with restrictor lines in comparison to a traditional trawl design.
METHODS
Gear
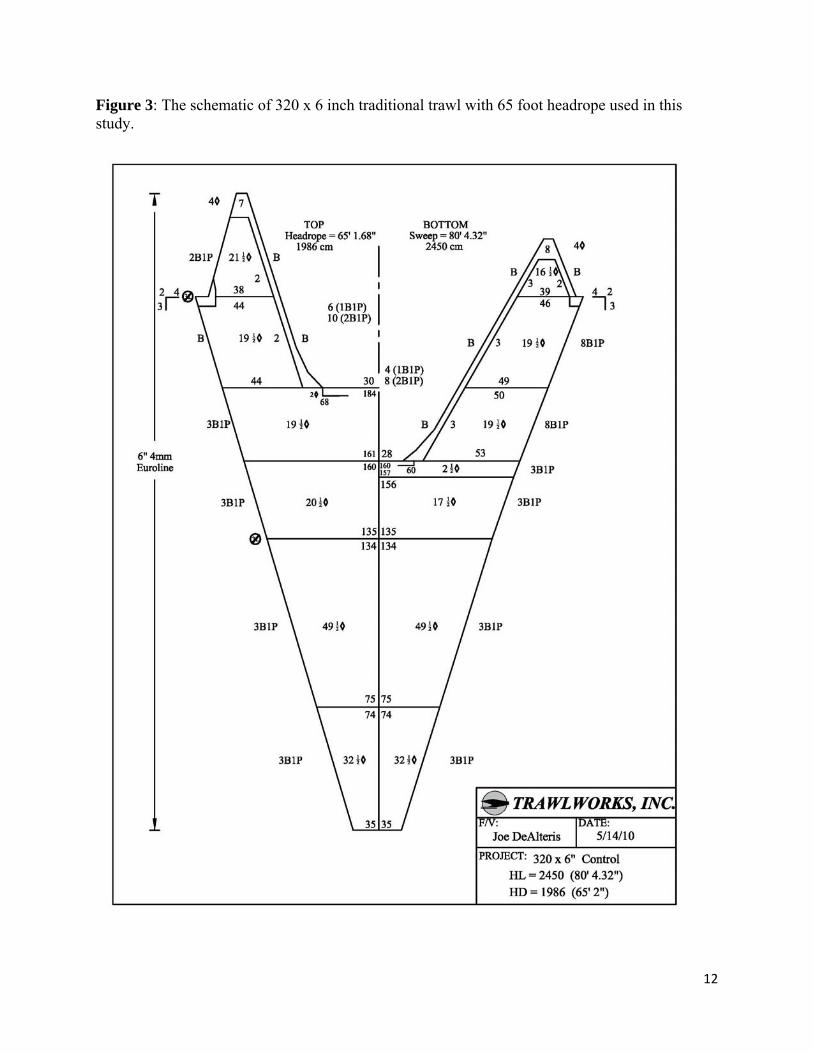
An experimental topless trawl was designed with a 160-foot headrope and two restrictor lines attached to the headrope (Figure 1). These restrictor lines were designed to maintain the wing and first top panel shape of a traditional trawl, and were made of 7/16” diameter Tenex (braided polyester) rope. One was attached to the head rope behind the first top wing and was 34.2’ in length and the other was attached at the next sewing seam back (equal to the top of the first bottom belly) and was 26.7’ in length (Figure 2). The control net was designed as a traditional trawl net used in the summer flounder fishery with a 65 foot headrope (Figure 3). Both nets had 320 x 6 inch fishing circles and had an 80 foot footrope. The nets were equipped with 15 fathom bridles and 75 fathoms of ground gear with a cookie sweep. The traditional net was rigged with 16 8-inch plastic floats. The topless trawl was rigged with 30 8-inch plastic floats in two different configurations. Two configurations of the 30 floats on the headrope were evaluated (Table 1), the only difference being the shifting of two floats (one on each side of the headrope) from the wing end to the middle of the upper wing (Figures 4 and 5).
Field Work
Field work was performed aboard the F/V Darana R, a typical summer flounder trawl vessel, in the summer of 2013 on three different cruises. The F/V Darana R is captained by Captain Jim Ruhle and ported out of Hampton, VA. The vessel is 90 feet in length and powered by a 670 HP engine.

3
Tows were conducted in conditions that would best represent the mid-Atlantic and southern New-England trawl fishery and maximize flounder catch. Most tows were completed during daylight and began after sunrise and ended before sunset. Any night pairs conducted had the entire duration of the tows completed at dark. All tows were conducted in an ABBA alternate paired tow methodology (A=experimental net and B=control net) as a way to maximize efficiency and likeness between the tows. Each tow within the pair was identical in location, tow time, amount of wire used, and speed. The majority of the tows were 90 minutes in duration.
Information recorded for each paired tow included location, time of tow, depth, surface temperature, and weather conditions. Detailed catch data were recorded for all catch that came aboard, and length frequency data were recorded for target species and other commercially important species. For each tow, the catch was sorted by species into bushel baskets and weighed on a Marel motion-compensated scale. If protected species were captured during sampling, information was recorded on those as well. All protected species captured were scanned for PIT tags, inspected for flipper tags, and data collected, as appropriate. Depth sensors were attached to various positions on the topless trawl to estimate headrope height in the center and on the wings of the trawl. The reported values are the differences between two sensors water depth measurements when vertically stacked in the headrope and footrope on the forward section of the starboard wing, or when stacked between the center of the headrope and directly below that position in the lower belly webbing. Sensors and time were not available to collect data on every tow in both locations, so only a limited number of observations were available for analysis. Underwater video recording of the trawl was also attempted at different sections of the topless trawl to view how the net was taking shape underwater and fish behavior around the net. The camera systems used were a custom build comprised of a ruggedized Stack DVR2-400 digital video recorder connected to a Sartek SDC-CSS color high resolution camera head. Many placements of the system were used to attain data on the wings, belly, extension, and multiple areas of the headrope. To ensure the weight of the power and recording bottle did not affect the net performance, the camera head was attached to the bottle with a 12' cord and the bottle was attached at points low and center in the net. This system is now commercially available as Thresher Cam.
Trawl performance sensors were used on the trawl doors to collect data on door spread. Data Analysis
The data are separated into two different segments based on float arrangement. The original configuration of the floats includes 13 paired tows (26 tows total), with 11 pairs from cruise 1, one pair from cruise 2, and one pair from cruise 3. The second float configuration consisted of rearranging two floats on the wings in an attempt to increase headrope height. This resulted in an improvement in the target species catch and was used for the duration of the field work and a total of 28 paired tows (56 tows total). The initial float arrangement was retested in cruises 2 and 3 to obtain additional data in that configuration, ensuring a robust statistical design.
Data were compiled using Microsoft Excel. Catch weights were compared using one tailed paired T-tests to compare the catch of summer flounder between the experimental and control net and to compare the bycatch reduction of the experimental net compared to the control net with a significance value of α=0.05. Mean catch weights for the topless and control trawl for the two topless trawl float configurations are reported in pounds per tow with the standard deviation of the mean expressed in parentheses in the text of the report and in a summary table.

4
The individual catch per tow values are provided in tables. A catch ratio (experimental catch/control catch) was calculated for all paired tows to determine the proportion of loss of catch overall for summer flounder and skates. Length frequency graphs were created using Microsoft Excel to evaluate the difference in size distributions between the control and experimental net for float configurations 1 and 2. A Kolmogorov-Smirnov test was performed to determine if there was a significant difference between length frequency distributions between the control and experimental nets for float configuration 1 and float configuration 2. Sensor data on water depth were collected for a sample of tows from cruises 1 and 2, and analyzed using Microsoft Excel in an effort to evaluate the vertical opening of the net (headrope elevation) throughout the duration of the tows. Sensor data were also gathered for the third cruise but due to an equipment malfunction, were not available for analysis. Trawl door spread data for each tow were used to calculate bridle angle based on an assumed wing spread for the control and experimental trawl based on simple geometric considerations, and a ground gear length of 100 fathoms. Based on results from flume tank testing with a scale model of the net, the average wing spread of the topless trawl model was 46 feet compared to 50 feet for the control model.
In the bycatch analysis, the skate complex included little, winter, and clear-nose skate species. All other bycatch was sorted by species. Although data were recorded on all species, the only species considered in this analysis are summer flounder, combined skate species, and protected species. Skate was considered because of the consistent high volumes of catch with both nets.
RESULTS
During three sampling trips on the F/V Darana R, a total of 41 comparative tows (82 tows total) were completed. The bridle length, ground gear, and number of floats were consistent throughout all 41 pairs. The only modification was the rearrangement of two wing floats between float configuration #1, and #2. Locations, expressed in latitude and longitude, were recorded from the GPS for the starting and end points on each tow (Figure 6; Tables 2, 3, 4). The catch of summer flounder typically represented only a small portion of the catch (Figure 7), as the catch was dominated by skate species. Limited video observations of the net performance confirmed the previous flume tank observations that a pocket was forming in the back end of the upper belly, and that this region of the trawl was clogging with fish and trash.
The first cruise completed 11 successful paired tows (22 tows total) using float configuration #1 and took place from June 23-June 27. The second cruise completed 17 successful paired tows (34 tows total) including one pair with float configuration #1 and the remaining 16 paired tows (32 tows total) with float configuration #2 to improve catchability for the target species. The third and final cruise completed 12 successful paired tows (24 tows total) including one pair with float configuration #1 and the remaining eleven pairs with float configuration #2. The rearrangement of two floats total on the wing ends of the net was the only modification made during testing so as to have sufficient data minimizing the possibility of Type II error in the analysis. Float Configuration #1
A total of 13 paired tows were completed using the original float configuration (26 tows total). A total of 11 paired tows were completed with no modifications to the topless trawl during

5
the first cruise from June 23-June 27. One pair was completed using this configuration during the second cruise on July 12 and one pair on August 11 during the third cruise. All paired tows for float configuration #1 were completed during the day.
The average door spread and bridle angle were estimated for all pairs with float configuration #1. The average door spread for the topless trawl was 365.3 feet compared to the average door spread for the control trawl which was 367.7 feet (Table 5). Based on results from flume tank testing with a scale model of the net, the estimated the average observed bridle angle in the field testing was 15.4o for both the topless trawl and control models (Table 5).
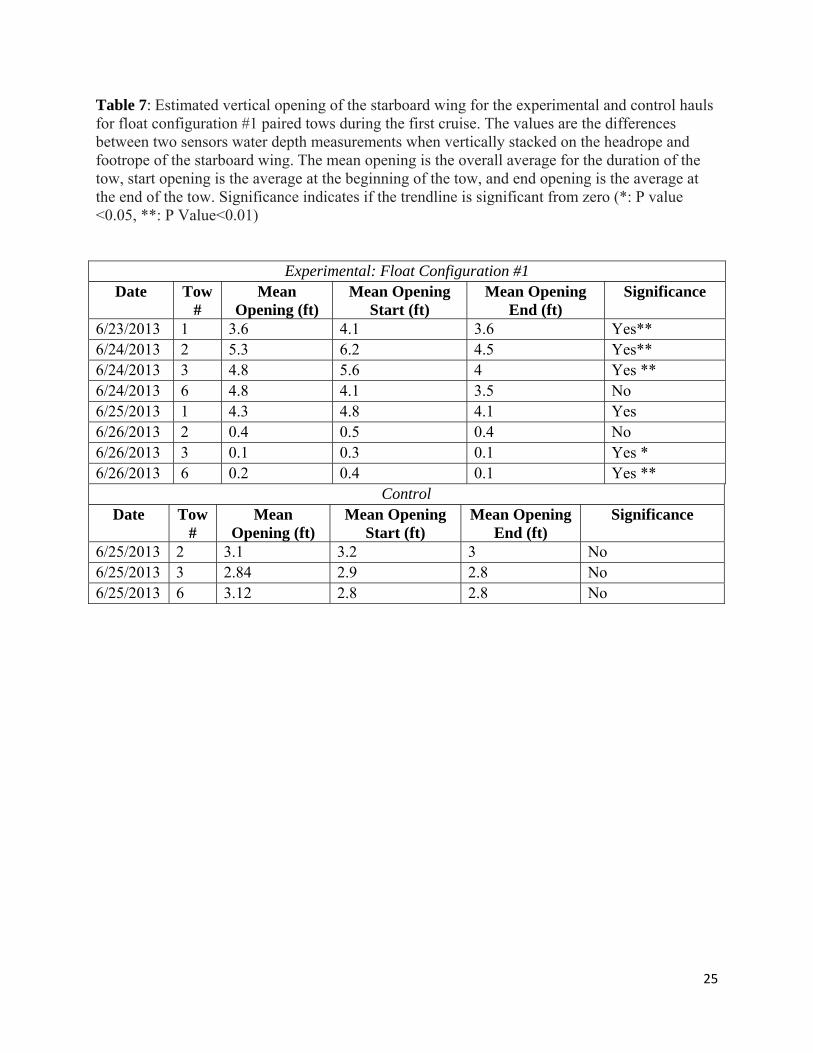
Sensor data were gathered for a sample of paired tows with float configuration #1 (Table 7). The topless trawl starboard wing opening averaged from 3.6 feet to 5.3 feet. The control trawl starboard wing opening averaged from 2.8 feet to 3.1 feet. The majority of tows for the topless trawl showed a significant decrease in wing opening from the beginning to the end of the tow (Table 7, Figure 8), suggesting that as the catch load increases in the codend or that clogging of the webbing in the back end of the upper belly, the vertical opening of the trawl decreases. The three tows for the control trawl did not show a trend in wing vertical opening over time (Table 7, Figure 9), suggesting that the traditional trawl is less susceptible to the effects of codend loading.
For float configuration # 1, the topless trawl had an average loss of 30.4% summer flounder when compared to the control net (p=0.0016) (Table 9). This is based on a mean catch per tow of 174.1 (with a standard deviation of 70.4) lbs for the topless trawl as compared to 243.2 (91.1) lbs for the control trawl. It is important to note that the summer flounder catch varied greatly between tows in the first cruise from June 20-June 27, possibly due to a low volume of fish in general. For float configuration #1, the summer flounder was on average 7.5% of the total catch for the topless trawl and 7.4% of the total catch for the control trawl (Table 9).
A Kolmogorov-Smirnov test was performed to determine if there was a significant difference between length frequency distributions between the two net types. The maximum difference, 0.10849, was greater than Dα, 0.0557, so there was a significant difference between the two distributions with an α value of 0.05. However this test is very sensitive to large sample sizes, and visual inspection of the length frequency distributions suggests no substantive differences between the distributions (Figure 11).
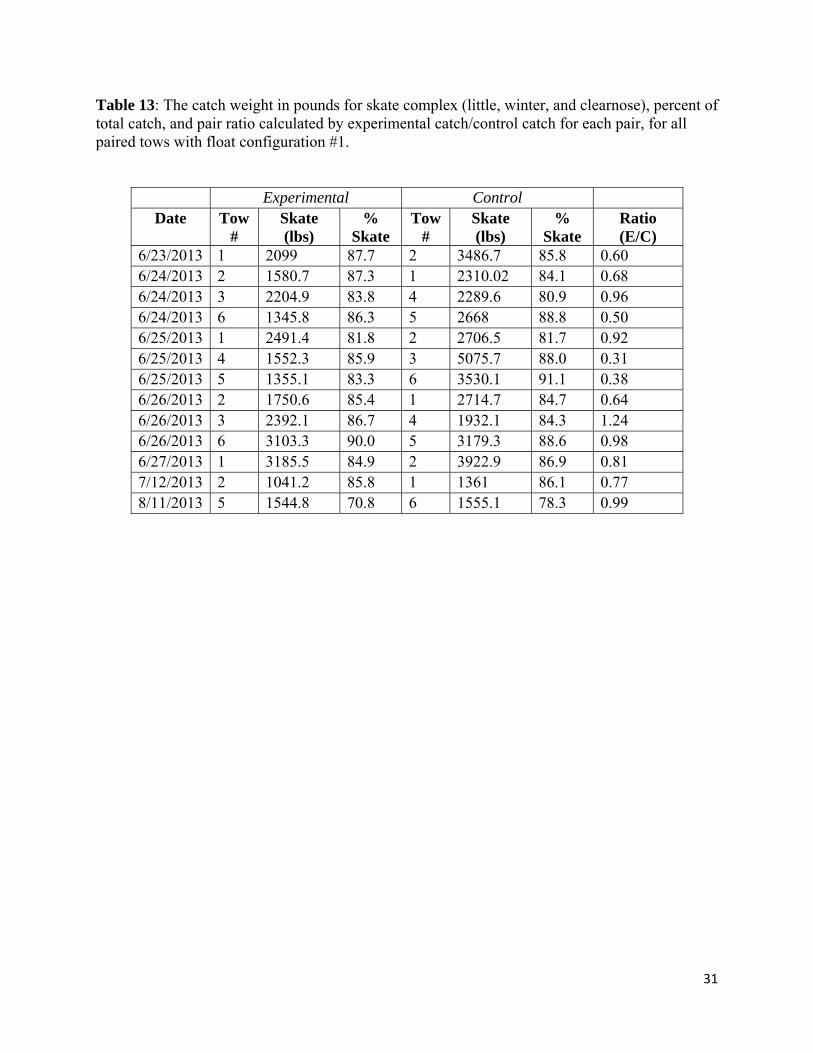
For float configuration #1, the topless trawl caught on average 30.1% less skates than the control net (p=0.0070) (Table 12). This is based on a mean catch per tow of 1972.1 (675.1) lbs for the topless trawl, as compared to 2825.5 (1020.1) lbs for the control trawl. For float configuration #1, the skate complex was on average 84.8% of the total catch for the topless trawl and 86.0% of the total catch for the control trawl (Table 13).
For the topless trawl, summer flounder and skate species were 92.2% of the total catch, with the remaining 7.8% of bycatch species varying by tow. For the control trawl, summer flounder and skate species accounted for 93.4% of the total catch, with the remaining 6.6% of the bycatch species varying by tow. Because summer flounder and skate species make up the major proportion of the catch, the remaining species captured were not used to evaluate the catch efficiency of the topless trawl.
In regards to capture of protected species, with float configuration #1, an individual Atlantic sturgeon (125 cm in length) was captured in the experimental net on 6/23/2013 during Haul 5, and no sturgeon were captured within the control net (Table 17). No sea turtles or other protected species were captured with this net configuration. Additional information on captured protected species with net configuration #1 is available from Eric Matzen at NMFS NEFSC.

6
Float Configuration #2
Beginning on July 13, 28 paired tows (56 tows total) were completed with a slight modification to the float arrangement. Two of the thirty floats were rearranged in an effort to increase headrope height and improve catchability (Table 1 and Figure 5). During the second cruise, 16 pairs were completed using this configuration, and during the third cruise 12 pairs were completed using this configuration.
For float configuration #2, the average door spread 351.9 feet for the topless trawl and 367.7 feet for the control trawl (Table 6). The average bridle angle for the topless trawl, assuming a wing spread of 46.0 feet based on results from flume tank testing, was 14.8o. The average bridle angle for the control net, with an assumed wing spread of 50 feet, was 15.1o (Table 6).
Data from the depth sensors were gathered on a subset of paired tows with float configuration #2 (Table 8). The topless trawl center headrope opening averaged from 0.7 feet to 4.8 feet (Table 8). All tows for the topless trawl showed a significant decrease in headrope opening from the beginning to the end of the tow, again suggesting an effect of codend loading or clogging of the back end of the upper belly on topless trawl performance (Table 8, Figure 10).
Float configuration #2 had an average loss of 22.7% summer flounder when compared to the control net (p=0.0080) (Table 10). This was based on a mean summer flounder catch per tow of 277.9 (144.1) lbs for the topless trawl as compared to 359.7 (218.5) lbs for the control trawl. For float configuration #2, the summer flounder was on average 11.2% of the total catch for the topless trawl and 12.2% of the total catch for the control trawl (Table 10). A Kolmogorov-Smirnov test was performed to determine if there was a significant difference between length frequency distributions for the control and topless trawl for all paired tows with float configuration #2. The maximum difference, 0.0658, was greater than Dα, 0.0291, so there was a significant difference between the two distributions at an α value of 0.05. However this test is very sensitive to large sample sizes, and visual inspection of the length frequency distributions suggests no substantive differences between the distributions (Figure 12).
Seven night pairs were completed with float configuration #2. For night pairs, the topless trawl caught, on average, 30.5% less summer flounder than the control trawl (Table 11). For the seven night pairs completed, summer flounder catch was, on average, 23.6% of the total catch for the topless trawl and 23.6% for the control trawl (Table 11) For all pairs completed during the day with float configuration #2, the topless trawl caught, on average, 16.0% less than the control net (Table 12). On average, the summer flounder catch for tow pairs conducted during the day was 8.7% of the total catch for the topless trawl and 9.3% for the control trawl (Table 12).
For float configuration #2, the topless trawl caught, on average, 12.0% less skates than the control net, which was not statistically significantly different at the α=0.05 level but was at the α=0.10 level(p=0.0570 )(Table 14). This is based on a mean skate catch per tow of 2019.8 (1857.1) lbs for the topless trawl as compared to 2381.5 (1812.7) lbs for the control trawl. On average, skate was 84.6% of the total catch for the topless trawl and 81.0% for the control trawl (Table 14). For night pairs, the topless trawl caught, on average, 23.5% less skates than the control trawl (Table 15). For the seven night pairs completed, skates were, on average, 71.4% of the total catch for the topless trawl and 64.8% of the total catch for the control trawl (Table 15). For day pairs, the topless trawl caught, on average, 10.0% less skates than the control trawl

7
(Table 15). For the 21 pairs completed during the day, skates were, on average, 81.2% of the total catch for the topless trawl and 79.5% of the total catch for the control trawl (Table 16).
For all paired tows with float configuration #2, summer flounder and skate species, on average, accounted for 95.8% of the total catch for the topless trawl with the remaining 4.2% of bycatch species varying seasonally. For the control trawl, summer flounder and skate species, on average, accounted for 93.2% of the total catch with the remaining 6.8% of the catch varying seasonally. Because summer flounder and skate species made up the major proportion of the catch, the remaining species captured were not used to evaluate the catch efficiency of the topless trawl.
In regards to capture of protected species, a total of eight Atlantic sturgeon were captured during the pairs for float configuration #2. A total of six Atlantic sturgeon were captured with the control net between June 20 and June 27. A total of two Atlantic sturgeons were captured with the experimental trawl on August 11 (Table 18).
A total of two sea turtles were captured with the pairs conducted with float configuration #2, one with the experimental trawl and one with the control trawl. One loggerhead sea turtle was captured with the experimental trawl on July 13, 2013. One Kemp’s ridley sea turtle was captured with the control trawl on August 8, 2013 (Table 19). Both sea turtles captured were captured and released alive and in healthy condition with no indicators of injury. Additional information on captured protected species with net configuration #2 is available from Eric Matzen at NMFS NEFSC.
DISCUSSION
The results of the comparison catch efficiency between the topless trawl and the control trawl for summer flounder and the skate complex with two float configurations are summarized in Table 20. Overall, float configuration #1 and float configuration #2 both resulted in a statistically significant reduction in the catch of summer flounder. Therefore, we can reject the null hypothesis that there is no significant difference between the catch of flounder between the 160 foot headrope topless trawl and the control trawl and accept the alternative hypothesis that there is statistical difference in catch between the two nets.
Float configuration #1 resulted in significant loss of target species with an average 30.4% loss (p value=0.0016). The rearrangement of floats after the initial eleven pairs evenly distributed the lift of the headrope. After this modification, while float configuration #2 was more effective at catching summer flounder there was an average loss of 22.7% (p=0.0070). Therefore, we specuate that the movement of floats must have lifted the headrope of the topless trawl higher, and that resulted in an increased catch efficiency for summer flounder.
In float configuration #1, summer flounder was 11.2 % of total catch for the experimental trawl and 12.2% for the control trawl, thus it appears that the experimental net reduced overall catch, not just catch of the summer flounder, as the proportion of summer flounder in the catch remain almost unchanged. There was also a 12.1% reduction of skate catch between the experimental and control nets, which was not statistically significant at the α=0.05 level but was at the α=0.10 level (p=0.0570).
For float configuration #2, seven paired tows were completed at night. There was difference observed between the night and day pairs. For night pairs, the topless trawl caught 30.5 % less summer flounder and 23.5% less skate than the control. For the experimental and

8
control nets, summer flounder was 23.6% of the total catch. For the 21 day pairs completed with float configuration #2, the topless trawl caught 17.7% less flounder than the control net. More flounder was caught on average during the night pairs compared to day pairs, but does not always occur in the fishery. There was less difference between the experimental and control nets during the day pairs, as during the day the topless trawl performed in a more comparable manner to the control trawl.
Based on video data obtained from the underwater camera used throughout the study, there was a pocket that had formed before the cod end of the net that was seen to “clog” with fish at points during the tow time. It is possible that increasing weight of fish in this pocket is what caused the headrope center opening and starboard vertical wing opening to decrease in height throughout the duration of the hauls.
Although there was still significant loss of flounder with the topless trawl, this design had the lowest loss of target species when compared to previous work with 160 foot headrope topless trawl and TEDs. Note that the 106 foot headrope did capture summer founder as effectively as the control net, but unfortunately this topless trawl also captured sea turtles as effectively as the control trawl (DeAlteris and Parkins 2011b). This modified topless trawl with a 160 foot headrope and two restrictor lines resulted in a loss of 22.7% target species catch compared to an average of 28%-35 % loss of target species in TED trials (Lawson, DeAlteris, and Parkins 2007; DeAlteris and Parkins 2011b), and the 51%-74% loss in the original 160 foot headrope topless trawl (DeAlteris et al. 2013).
Although there is still significant difference between the catch efficiency of modified topless trawl with two headrope restrictor lines and the traditional trawl, as compared to the previous evaluation of the 160 headrope topless trawl. The decrease in loss of target species is most likely due to the addition of the restrictor lines within the net that serve to elevate the long wings of the topless trawl, thus maintaining the proper shape of the trawl mouth.
ACKNOWLEDGEMENTS This project would not have been possible without the cooperation and participation of many individuals: Henry Milliken and Eric Matzen from NMFS NEFSC Protected Species Division, Captain Jim Ruhle and first mate Bobby Ruhle from the F/V Darana R, Jon Knight of Superior Trawl and Mary O’Rourke of Trawlworks.

9
REFERENCES DeAlteris J., Parkins, C., Hasbrouck, E., Scotti, J., Froehlich, T., Costanzo, J. 2013. Evaluation of a topless bottom trawl design with a 160 foot headrope for fish capture. [NOAA NMFS Contract Number: EA 133F-10-SE-2491, Mod. 002] DeAlteris J, Parkins C. 2012. Evaluation of a Topless Bottom Trawl Design with Regard to Excluding Sea Turtles. [Report; 29 p.] NOAA NMFS Contract No. EA 133F-10-SE-2491, Mod. 002. DeAlteris, J. and Parkins, C. 2011a.Field and data report; Evaluation of a topless bottom trawl design with regard to excluding sea turtles.[NOAA Contract No. EA 133F-10-SE-2491, Mod. 002]. DeAlteris, J. and Parkins, C. 2011b. An evaluation of the catch efficiency of a topless trawl design with a 106 foot-headrope and 80-foot sweep for target species and sea turtles in the southern New England and mid-Atlantic summer flounder trawl fisheries. [BAA Final Report] 37 p. NOAA contract 133F-10-CN-0057. DeAlteris J, and Parkins C. 2010. Evaluation of the effect on catch performance of the NMFS flounder Turtle Excluder Device (TED) with a large opening in the Southern New England long fin squid trawl fishery. [Final report; 19 p.] NOAA Contract No. EA133F08CN0182. DeAlteris J, and Parkins C. 2009. Evaluation of the catch performance of the NMFS flounder Turtle Excluder Device (TED) with a large opening in the Southern New England whiting trawl fishery. [Final Report; 15 p.] NOAA Contract No. EA133F08CN0182. Lawson D., J. T. DeAlteris and C. Parkins. 2007. Evaluation of the catch efficiency of the NMFS certified Turtle Excluder Device (TED) in the Mid-Atlantic summer flounder trawl fishery [Summary report; 26 p + appendix] NOAA Contract No. EA133F-05-SE-6561. Salerno DJ, Eayrs S. 2010. Study on catch retention using a larger TED and opening in the summer flounder trawl fishery. [Revised final report; 33 p.] NOAA Contract No. EA133F-08-CN-0230. Sokal, R. R. and F. J. Rohlf. 1995. Biometry: the principles and practice of statistics in biological research. 3rd edition. W. H. Freeman and Co.: New York. 887 pp. Zar, J. H. 1984. Biostatistical Analysis. Prentice Hill, Englewoood Cliffs, New Jersey, 718 p.

10
Figure 1: The schematic of 320 x 6 inch topless trawl with 160 foot headrope used in this study (Not shown, two restrictor lines).

11
Figure 2: A portion of the 160 foot headrope model net in the flume tank with the addition of two restrictor lines that were added to the experimental net used in field work.
12
Figure 3: The schematic of 320 x 6 inch traditional trawl with 65 foot headrope used in this study.

13
Figure 4: The headrope of the experimental net with float configuration #1 during haul back.
Figure 5: The headrope of the experimental net with float configuration #2 during haul back.

14
Figure 6: The start tow locations for all tows during the duration of the sampling from June 23-August 11.

15
Figure 7: A relatively small, but typical, catch with the experimental trawl. Note that the majority of the catch includes skates and summer flounder.

16
Figure 8: The height of the vertical opening of the starboard wing end for the experimental net for 6/24/2013 Haul 3.
Figure 9: The height of the vertical opening of the starboard wing end for the control net for 6/25/2013 Haul 3.
y = ‐26.249x + 1E+06R² = 0.2729
0
1
2
3
4
5
6
7
8
11:45 12:00 12:14 12:28 12:43 12:57 13:12 13:26
Vertical Opening (feet)
Time (Hour:Minute)
Vertical Starboard Opening Experimental Net 6/24 Haul 3
y = ‐1.1604x + 48102R² = 0.0017
0
0.5
1
1.5
2
2.5
3
3.5
4
4.5
11:16 11:31 11:45 12:00 12:14 12:28 12:43 12:57 13:12
Height (ft)
Time (Hour:Minute)
Vertical Starboard Wing Opening Control Net 6/25 Haul 3

17
Figure 10: The height of the vertical opening of the headrope for the experimental net for 7/14/2013, Haul 6.
Figure 11: Length frequency distributions as percent of total catch for all summer flounder captured in paired tows with float configuration #1 during research cruises 1, 2, and 3.
.
y = ‐24.997x + 1E+06R² = 0.4992
0
1
2
3
4
5
6
7
18:28 18:43 18:57 19:12 19:26 19:40 19:55 20:09
Vertical Opening (feet)
Time (Hour:Minute)
Headrope Vertical Opening Experimental Net7/14 Haul 6
‐2.00
0.00
2.00
4.00
6.00
8.00
10.00
0 20 40 60 80 100
Percent of Catch
Length (cm)
Summer Flounder Length Frequency for Float Configuration #1
Control
Experimental

18
Figure 12: Length frequency distributions as percent of total catch for all summer flounder captured in paired tows with float configuration #2 during research cruises 2 and 3.
‐2.00
0.00
2.00
4.00
6.00
8.00
10.00
12.00
0 20 40 60 80 100
Percent of Catch
Length (cm)
Summer Flounder Length Frequency for Float Configuration #2
Experimental
Control

19
Table 1. Eight inch float locations in the 160 foot modified topless trawl with restrictor lines for configurations #1 and #2. Total headrope length including extensions is 160.6 ft or 4898 cm Eye to eye along the webbing is 155 ft or 4738 cm Eye to center of headrope along the webbing is 77.5 ft Distances along the headrope from the wing end eye to the floats and seams in the webbing in feet for net configuration #1 are as follows: Distance (ft) Number of floats in cluster Seam between net sections 0 Thimble eye 2.5 2 4.5 1 6.5 1 8.5 2 13.5 jib to 1st upper wing 16.3 2 24.3 1st upper wing to 2nd upper wing 28.1 2 35.1 2nd upper wing to 3rd upper wing 39.9 2 45.9 3rd upper wing to 4th upper wing 55.6 2 71.1 1 72.9 4th upper wing to 1st upper belly 77.5 center of headrope Distances along the headrope from the wing end eye to the floats and seams in the webbing in feet for net configuration #2 are as follows: Distance (ft) Number of floats in cluster Seam between net sections 0 Thimble eye 2.5 1 6.5 1 8.5 2 13.5 jib to 1st upper wing 16.3 2 24.3 1st upper wing to 2nd upper wing 28.1 2 35.1 2nd upper wing to 3rd upper wing 39.9 2 45.9 3rd upper wing to 4th upper wing 55.6 2 63.4 1 71.1 1 72.9 4th upper wing to 1st upper belly 77.5 center of headrope

20
Table 2: Start and end tow locations expressed in decimal degrees, for all pairs conducted during cruise 1 of sampling from June 23-June27. Start End
Date Tow # Latitude Longitude Latitude Longitude 6/23/2013 1 40.976 -72.0025 40.9469 -72.0946 6/23/2013 2 40.95 -72.0771 40.96223 -71.9722 6/24/2013 1 40.93776 -72.0988 40.91012 -72.1976 6/24/2013 2 40.91055 -72.1951 40.94148 -72.0896 6/24/2013 3 40.95416 -72.0655 40.96387 -72.0938 6/24/2013 4 40.98668 -71.9669 40.95308 -72.0597 6/24/2013 5 40.94999 -72.0771 40.91787 -72.1765 6/24/2013 6 40.87968 -72.2799 40.9168 -72.195 6/25/2013 1 40.91399 -72.1749 40.87262 -72.2608 6/25/2013 2 40.87369 -72.2666 40.91787 -72.1765 6/25/2013 3 40.91636 -72.1732 40.86833 -72.2618 6/25/2013 4 40.87624 -72.2514 40.91765 -72.1656 6/25/2013 5 40.91184 -72.1875 40.8931 -72.1879 6/25/2013 6 40.87968 -72.2799 40.9168 -72.195 6/26/2013 1 40.88053 -72.2504 40.84747 -72.3512 6/26/2013 2 40.84347 -72.3631 40.87518 -72.27 6/26/2013 3 40.87626 -72.2758 40.84747 -72.3512 6/26/2013 4 40.91118 -72.1791 40.87753 -72.2682 6/26/2013 5 40.87091 -72.271 40.84472 -72.2932 6/26/2013 6 40.83039 -72.3689 40.87137 -72.2928 6/27/2013 1 41.29608 -71.6669 41.28027 -71.772 6/27/2013 2 41.28177 -71.7648 41.28027 -71.772

21
Table 3: The start and end tow locations in decimal degrees, for all pairs conducted during cruise 2 of sampling from July 12-July 16, 2013.
Start End Date Tow # Latitude Longitude Latitude Longitude 7/12/2013 1 40.95049 -72.0505 40.92135 -72.15647/12/2013 2 40.91916 -72.1689 40.92908 -72.20817/12/2013 3 40.93442 -72.1296 40.90025 -72.23147/12/2013 4 40.91402 -72.2478 40.90025 -72.23147/12/2013 5 40.92869 -72.1621 40.88802 -72.29137/12/2013 6 40.88738 -72.2829 40.91703 -72.20587/13/2013 1 40.86376 -72.3386 40.89683 -72.25167/13/2013 2 40.8979 -72.2574 40.85573 -72.36247/13/2013 3 40.85449 -72.37 40.31737 -72.06797/13/2013 4 40.85608 -72.3862 40.85133 -72.37687/13/2013 5 40.85849 -72.358 40.8906 -72.27617/13/2013 6 40.90751 -72.1641 40.83957 -72.39937/14/2013 1 40.89424 -72.2667 40.92198 -72.16477/14/2013 2 40.92651 -72.1747 40.89338 -72.27187/14/2013 3 40.89638 -72.2298 40.92435 -72.18737/14/2013 4 40.92478 -72.1848 40.88503 -72.28477/14/2013 5 40.87798 -72.29 40.84693 -72.39137/14/2013 6 40.857 -72.3548 40.88867 -72.27537/15/2013 1 40.89123 -72.2844 40.92155 -72.19157/15/2013 2 40.92284 -72.184 40.8846 -72.28727/15/2013 3 40.92004 -72.1882 40.88782 -72.28047/15/2013 4 40.92435 -72.1873 40.8906 -72.27617/15/2013 5 40.92824 -72.1646 40.96155 -72.07147/15/2013 6 40.96484 -72.0647 40.92807 -72.15387/15/2013 7 40.91529 -72.1916 40.88225 -72.2897/15/2013 8 40.8861 -72.2905 40.91875 -72.19587/16/2013 1 40.92824 -72.1646 40.96155 -72.07147/16/2013 2 40.95978 -72.0813 40.92758 -72.18057/16/2013 3 40.92004 -72.1882 40.88782 -72.28047/16/2013 4 40.88867 -72.2753 40.9263 -72.16387/16/2013 5 40.9484 -72.157 40.96733 -72.0987/16/2013 6 40.96359 -72.1071 40.93797 -72.16877/16/2013 7 40.92176 -72.1781 40.88545 -72.28217/16/2013 8 40.88225 -72.289 40.91832 -72.1983

22
Table 4: The start and end tow locations, in decimal degrees, for all pairs conducted during cruise 3 of sampling from August 8-August 11 2013.
Start End Date Tow # Latitude Longitude Latitude Longitude
8/8/2013 2 40.95889 -72.0863 41.0056 -71.92158/8/2013 3 40.93805 -72.1446 40.91015 -72.22198/8/2013 4 40.91251 -72.2202 40.9516 -72.11548/9/2013 1 40.94788 -72.1246 40.91595 -72.22438/9/2013 2 40.9166 -72.2084 40.95312 -72.11888/9/2013 3 40.91309 -72.257 40.89188 -72.26858/9/2013 4 40.89747 -72.2599 40.93912 -72.15048/9/2013 5 40.94327 -72.1387 40.90607 -72.23388/9/2013 6 40.91251 -72.2202 40.95445 -72.1113
8/10/2013 1 40.8876 -72.2695 40.853 -72.36678/10/2013 2 40.8625 -72.3461 40.95988 -72.2698/10/2013 3 40.90843 -72.232 40.94362 -72.16048/10/2013 4 40.93867 -72.1529 40.911 -72.21698/10/2013 5 40.79872 -72.5407 40.77482 -72.638/10/2013 6 40.77438 -72.6203 40.79265 -72.51658/10/2013 7 40.69224 -72.8467 40.6526 -72.9528/10/2013 8 40.64658 -72.9414 40.69437 -72.85828/11/2013 1 40.70224 -72.8563 40.69437 -72.85828/11/2013 2 40.70224 -72.8563 40.65242 -72.948/11/2013 3 40.69384 -72.8224 40.72383 -72.72228/11/2013 4 40.73044 -72.7167 40.69818 -72.80558/11/2013 5 40.69078 -72.8171 40.66437 -72.90928/11/2013 6 40.6504 -72.9144 40.69275 -72.81678/11/2013 7 40.69364 -72.8105 40.66407 -72.91138/11/2013 8 40.66241 -72.9096 40.69128 -72.827

23
Table 5: The calculated door spread in feet (experimental bridle angle is based on an average wing spread of 46 feet. and control is based on an average wing spread of 50 feet.) and bridle angles for all paired tows with float configuration #1. Experimental; Wing Spread=46 ft. Control; Wing Spread=50 ft.
Date Tow # Door Spread
(ft)
Bridle Angle (Degrees)
Tow # Door Spread
(ft)
Bridle Angle (Degrees)
6/23/2013 1 363 15.3 2 375 15.7
6/24/2013 2 370 15.6 1 380 15.9
6/24/2013 3 360 15.1 4 275 10.8
6/24/2013 6 365 15.4 5 370 15.4
6/25/2013 1 370 15.6 2 380 15.9
6/25/2013 4 365 15.4 3 370 15.4
6/25/2013 5 360 15.1 6 380 15.9
6/26/2013 2 370 15.6 1 380 15.9
6/26/2013 3 365 15.4 4 375 15.7
6/26/2013 6 370 15.6 5 380 15.9
6/27/2013 1 360 15.1 2 380 15.9
7/12/2013 2 360 15.1 1 370 15.4
8/11/2013 6 340 14.1 5 355 14.7

24
Table 6: The calculated door spread in feet and bridle angles (experimental bridle angle is based on an average wing spread of 46 ft. and control is based on an average wing spread of 50 ft.) for all paired tows with float configuration #2. Experimental; Wing Spread=46 ft. Control; Wing Spread=50 ft.
Date Tow # Door Spread
(ft)
Bridle Angle (Degrees)
Tow # Door Spread
(ft)
Bridle Angle (Degrees)
7/12/2013 3 360 15.3 4 365 15.2 7/12/2013 6 350 14.8 5 365 15.2 7/13/2013 1 350 14.8 2 370 15.4 7/13/2013 4 365 15.5 3 355 14.7 7/14/2013 3 360 15.3 4 370 15.4 7/15/2013 1 355 15.0 2 360 14.9 7/15/2013 4 355 15.0 3 365 15.2 7/15/2013 5 350 14.8 6 355 14.7 7/15/2013 8 355 15.0 7 365 15.2 7/16/2013 1 355 15.0 2 360 14.9 7/16/2013 5 350 14.8 6 350 14.4 8/8/2013 2 365 15.5 1 360 14.9 8/8/2013 3 360 15.3 4 360 14.9 8/9/2013 2 360 15.3 1 370 15.4 8/9/2013 3 345 14.5 4 375 15.7 8/9/2013 6 355 15.0 5 360 14.9 8/10/2013 1 330 13.8 2 360 14.9 8/10/2013 4 340 14.3 3 355 14.7 8/10/2013 5 345 14.5 6 365 15.2 8/10/2013 8 345 14.5 7 355 14.7 8/11/2013 1 340 14.3 2 375 15.7
25
Table 7: Estimated vertical opening of the starboard wing for the experimental and control hauls for float configuration #1 paired tows during the first cruise. The values are the differences between two sensors water depth measurements when vertically stacked on the headrope and footrope of the starboard wing. The mean opening is the overall average for the duration of the tow, start opening is the average at the beginning of the tow, and end opening is the average at the end of the tow. Significance indicates if the trendline is significant from zero (*: P value <0.05, **: P Value<0.01)
Experimental: Float Configuration #1 Date Tow
# Mean
Opening (ft) Mean Opening
Start (ft) Mean Opening
End (ft) Significance
6/23/2013 1 3.6 4.1 3.6 Yes** 6/24/2013 2 5.3 6.2 4.5 Yes** 6/24/2013 3 4.8 5.6 4 Yes ** 6/24/2013 6 4.8 4.1 3.5 No 6/25/2013 1 4.3 4.8 4.1 Yes 6/26/2013 2 0.4 0.5 0.4 No 6/26/2013 3 0.1 0.3 0.1 Yes * 6/26/2013 6 0.2 0.4 0.1 Yes **
Control Date Tow
# Mean
Opening (ft) Mean Opening
Start (ft) Mean Opening
End (ft) Significance
6/25/2013 2 3.1 3.2 3 No 6/25/2013 3 2.84 2.9 2.8 No 6/25/2013 6 3.12 2.8 2.8 No

26
Table 8: The sensor readings from the experimental hauls for float configuration #2 during the second cruise. The measurements are the differences between a sensor in the center of the headrope and a sensor directly below it on the floor of the net. The mean opening is the overall average for the duration of the tow, start opening is the average at the beginning of the tow, and end opening is the average at the end of the tow. Significance indicates if the trendline is significant from zero (*: P value <0.05; **: P Value<0.01)
Experimental: Float Configuration #2 Date Tow
# Mean
Opening (ft) Mean Opening
Start (ft) Mean Opening End
(ft) Significance
7/13/2013 1 0.7 5.6 4 Yes** 7/13/2013 4 4.3 5.2 3.8 Yes** 7/13/2013 5 0.6 0.8 0.6 Yes* 7/14/2013 2 4.2 4.8 3.7 Yes** 7/14/2013 3 4.8 5.3 4.4 Yes** 7/14/2013 6 4.2 5 3.5 Yes** 7/15/2013 1 4.4 5.2 3.7 Yes** 7/15/2013 4 4.1 4.3 4 Yes* 7/15/2013 5 4.1 4.3 4 Yes** 7/16/2013 1 3.7 4 3.4 Yes**

27
Table 9: Catch weights, in pounds and percent of total catch, for summer flounder for all paired tows with float configuration #1. The paired ratio is the catch of summer flounder for the experimental net divided by the catch of summer flounder for the control net to compare the flounder catch for each individual pair. Experimental Control
Date Tow #
Flounder (lbs)
% Flounder of Total
Tow # Flounder (lbs)
% Flounder of Total
Ratio (E/C)
6/23/2013 1 170.6 7.1 2 284.4 7.0 0.606/24/2013 2 178 9.8 1 259.7 9.4 0.696/24/2013 3 205.2 7.8 4 199.3 7.0 1.036/24/2013 6 108 6.9 5 239.8 7.9 0.456/25/2013 1 261.2 8.5 2 335.6 10.1 0.786/25/2013 4 153.9 8.5 3 389.7 6.7 0.396/25/2013 5 138.9 8.5 6 221.7 5.7 0.636/26/2013 2 170 8.3 1 265.3 8.2 0.646/26/2013 3 167.6 6.0 4 166.2 7.2 1.016/26/2013 6 212.6 6.1 5 231.1 6.4 0.926/27/2013 1 33.3 0.8 2 61.1 1.3 0.557/12/2013 2 140.8 11.6 1 131.9 8.3 1.078/11/2013 5 324 14.8 6 376 18.9 0.86

28
Table 10: Catch weights, in pounds and percent of total catch, for summer flounder for all paired tows with float configuration #2. The paired ratio is the catch of summer flounder for the experimental net divided by the catch of summer flounder for the control net to compare the flounder catch for each individual pair. Experimental Control
Date Tow #
Flounder (lbs)
% Flounder of total
Tow # Flounder (lbs)
% Flounder of total
Ratio (E/C)
7/12/2013 3 228.4 20.4 4 267.75 15.0 0.85 7/12/2013 6 361.2 6.6 5 275.4 3.4 1.31 7/13/2013 1 430.9 6.0 2 232.1 5.5 1.86 7/13/2013 4 132.5 4.5 3 289.4 6.3 0.46 7/13/2013 5 244.9 7.1 6 188.1 4.7 1.30 7/14/2013 2 480.5 17.0 1 369.5 9.8 1.30 7/14/2013 3 261.5 12.0 4 642.9 25.4 0.41 7/14/2013 6 261.7 17.5 5 224.6 11.2 1.17 7/15/2013 1 343.3 13.8 2 249.6 12.4 1.38 7/15/2013 4 181.7 8.7 3 373.4 14.8 0.49 7/15/2013 5 273 5.8 6 489.1 8.1 0.56 7/15/2013 8 625.5 21.9 7 1180.9 35.7 0.53 7/16/2013 1 298.6 3.7 2 236.3 3.5 1.26 7/16/2013 4 97.4 5.0 3 212.1 8.5 0.46 7/16/2013 5 141.6 3.0 6 167.7 3.2 0.84 7/16/2013 8 342.9 21.9 7 640.4 24.3 0.54 8/8/2013 2 181.4 13.6 1 306.2 19.9 0.59 8/8/2013 3 463.8 42.8 4 541.2 53.7 0.86 8/9/2013 2 563.7 54.2 1 546.5 46.7 1.03 8/9/2013 3 301.7 40.0 4 353.8 48.3 0.85 8/9/2013 6 116.2 18.3 5 359.5 42.2 0.32 8/10/2013 1 263.8 12.8 2 200.9 13.5 1.31 8/10/2013 4 27.8 9.5 3 52.1 5.4 0.53 8/10/2013 5 88.7 6.1 6 107.6 5.3 0.82 8/10/2013 8 147.3 13.3 7 446.3 12.1 0.33 8/11/2013 1 324 17.4 2 376 11.2 0.86 8/11/2013 4 258.7 16.4 3 425.6 18.4 0.61 8/11/2013 8 340.2 21.8 7 317.7 17.7 1.07

29
Table 11: Catch weight, in pounds and percent of total catch, for summer flounder for all paired tows completed at night with float configuration #2. The ratio is the catch of summer flounder for the experimental net divided by the catch of summer flounder for the control net to compare the flounder catch for each individual pair.
Experimental Control Date Tow
# Flounder
(lbs) % Flounder
of Total Tow # Flounder
(lbs) % Flounder
of Total Ratio (E/C)
7/15/2013 8 625.5 21.9 7 1180.9 35.7 0.53 7/16/2013 8 342.9 21.9 7 640.4 24.3 0.54 8/8/2013 3 463.8 42.8 4 541.2 53.7 0.86 8/9/2013 2 563.7 54.3 1 546.5 46.7 1.03 8/10/2013 1 263.8 12.8 2 200.9 13.5 1.31 8/10/2013 8 147.3 13.3 7 446.3 12.1 0.33 8/11/2013 1 324 17.4 2 376 11.2 0.86

30
Table 12: Catch weight, in pounds and percent of total catch, for summer flounder for all paired tows completed during the day with float configuration #2. The ratio is the catch of summer flounder for experimental net divided by the catch of summer flounder for the control net to compare the flounder catch for each individual pair. Experimental Control
Date Tow #
Flounder (lbs)
% Flounder of total
Tow #
Flounder (lbs)
% Flounder of total
Ratio (E/C)
7/12/2013 3 228.4 20.5 4 267.75 15.0 0.85 7/12/2013 6 361.2 6.7 5 275.4 3.4 1.31 7/13/2013 1 430.9 6.0 2 232.1 5.5 1.86 7/13/2013 4 132.5 4.5 3 289.4 6.3 0.46 7/13/2013 5 244.9 7.1 6 188.1 4.7 1.30 7/14/2013 2 480.5 17.0 1 369.5 9.8 1.30 7/14/2013 3 261.5 12.0 4 642.9 25.4 0.41 7/14/2013 6 261.7 17.5 5 224.6 11.2 1.17 7/15/2013 1 343.3 13.8 2 249.6 12.4 1.38 7/15/2013 4 181.7 8.7 3 373.4 14.8 0.49 7/15/2013 5 273 5.8 6 489.1 8.1 0.56 7/16/2013 1 298.6 3.7 2 236.3 3.5 1.26 7/16/2013 4 97.4 5.0 3 212.1 8.5 0.46 7/16/2013 5 141.6 3.0 6 167.7 3.2 0.84 8/8/2013 2 181.4 13.6 1 306.2 19.9 0.59 8/9/2013 3 301.7 40.0 4 353.8 48.3 1.03 8/9/2013 6 116.2 18.3 5 359.5 42.2 0.85 8/10/2013 4 27.8 9.5 3 52.1 5.4 0.32 8/10/2013 5 88.7 6.1 6 107.6 5.3 0.53 8/11/2013 4 258.7 16.4 3 425.6 18.4 0.82 8/11/2013 8 340.2 21.8 7 317.7 17.7 0.61
31
Table 13: The catch weight in pounds for skate complex (little, winter, and clearnose), percent of total catch, and pair ratio calculated by experimental catch/control catch for each pair, for all paired tows with float configuration #1.
Experimental Control Date Tow
# Skate (lbs)
% Skate
Tow #
Skate (lbs)
% Skate
Ratio (E/C)
6/23/2013 1 2099 87.7 2 3486.7 85.8 0.60 6/24/2013 2 1580.7 87.3 1 2310.02 84.1 0.68 6/24/2013 3 2204.9 83.8 4 2289.6 80.9 0.96 6/24/2013 6 1345.8 86.3 5 2668 88.8 0.50 6/25/2013 1 2491.4 81.8 2 2706.5 81.7 0.92 6/25/2013 4 1552.3 85.9 3 5075.7 88.0 0.31 6/25/2013 5 1355.1 83.3 6 3530.1 91.1 0.38 6/26/2013 2 1750.6 85.4 1 2714.7 84.7 0.64 6/26/2013 3 2392.1 86.7 4 1932.1 84.3 1.24 6/26/2013 6 3103.3 90.0 5 3179.3 88.6 0.98 6/27/2013 1 3185.5 84.9 2 3922.9 86.9 0.81 7/12/2013 2 1041.2 85.8 1 1361 86.1 0.77 8/11/2013 5 1544.8 70.8 6 1555.1 78.3 0.99

32
Table 14: The catch weight in pounds for skate complex (little, winter, and clearnose), percent of total catch, and ratio calculated by experimental catch/control catch for each pair, for all paired tows with float configuration #2. .
Experimental Control Date Tow # Skate (lbs) % Skate Tow # Skate (lbs) % Skate Ratio (E/C)
7/12/2013 3 807.8 72.4 4 1429.2 80.2 0.57 7/12/2013 6 4935.4 91.4 5 7442.45 92.0 0.66 7/13/2013 1 6566 91.5 2 3742.5 90.0 1.75 7/13/2013 4 2725.4 93.3 3 4128 91.0 0.66 7/13/2013 5 3035.2 88.6 6 2681.6 67.2 1.13 7/14/2013 2 2259.8 80.3 1 3305.9 87.9 0.68 7/14/2013 3 1845 84.7 4 1819 72.1 1.01 7/14/2013 6 1142.4 76.7 5 1707.9 85.4 0.67 7/15/2013 1 2084.9 84.2 2 1721.1 85.6 1.21 7/15/2013 4 1852.5 89.6 3 2077.8 82.6 0.89 7/15/2013 5 4311.2 92.3 6 5384.7 90.1 0.80 7/15/2013 8 2151.2 75.4 7 1918.1 58.1 1.12 7/16/2013 1 7539.5 95.4 2 6327.2 95.8 1.19 7/16/2013 4 1795.8 92.9 3 2263.3 91.1 0.79 7/16/2013 5 4202.7 91.7 6 4898.2 95.3 0.86 7/16/2013 8 1179.1 75.6 7 1909.5 72.6 0.62 8/8/2013 2 1049.8 79.1 1 1135.6 74.0 0.92 8/8/2013 3 554.1 51.2 4 382.2 37.9 1.45 8/9/2013 2 347.7 33.4 1 543.7 46.5 0.64 8/9/2013 3 407.5 54.1 4 320.8 43.8 1.27 8/9/2013 6 368 58.1 5 415.1 48.8 0.89 8/10/2013 1 1744.7 85.1 2 1225.4 82.3 1.42 8/10/2013 4 229.2 78.8 3 830.8 86.7 0.28 8/10/2013 5 1235.2 86.2 6 1420.5 70.3 0.87 8/10/2013 8 884.2 80.1 7 2567.3 69.8 0.34 8/11/2013 1 1378.5 74.1 2 2226.3 66.4 0.62 8/11/2013 4 965.1 61.3 3 1656.5 71.8 0.58 8/11/2013 8 971.9 62.3 7 1199.9 67.2 0.81

33
Table 15: The catch weight in pounds and percent of total catch for skates for all paired tows completed at night with float configuration #2. The ratio is the catch of skates for experimental net divided by the catch of skates for the control net to compare the skate catch for each individual pair. Experimental Control Date Tow # Skate (lbs) % Skate Tow # Skate (lbs) % Skate Ratio (E/C)7/15/2013 8 2151.2 75.4 7 1918.1 58.1 1.12 7/16/2013 8 1179.1 75.6 7 1909.5 72.6 0.62 8/8/2013 3 554.1 51.2 4 382.2 37.9 1.45 8/9/2013 2 347.7 33.4 1 543.7 46.5 0.64 8/10/2013 1 1744.7 85.1 2 1225.4 82.3 1.42 8/10/2013 8 884.2 80.1 7 2567.3 69.8 0.34 8/11/2013 1 1378.5 74.1 2 2226.3 66.4 0.62

34
Figure 16: The catch weight in pounds and percent of total catch for skates for all paired tows completed during the day with float configuration #2. The ratio is the catch of skates for experimental net divided by the catch of skates for the control net to compare the skate catch for each individual pair. Topless Control
Date Tow # Skate (lbs) % Skate Tow # Skate (lbs) % Skate Pair Ratio (E/C)7/12/2013 3 807.8 72.4 4 1429.2 80.2 0.57 7/12/2013 6 4935.4 91.4 5 7442.45 92.0 0.66 7/13/2013 1 6566 91.5 2 3742.5 90.0 1.75 7/13/2013 4 2725.4 93.3 3 4128 91.0 0.66 7/13/2013 5 3035.2 88.6 6 2681.6 67.2 1.13 7/14/2013 2 2259.8 80.3 1 3305.9 87.9 0.68 7/14/2013 3 1845 84.7 4 1819 72.1 1.01 7/14/2013 6 1142.4 76.7 5 1707.9 85.4 0.67 7/15/2013 1 2084.9 84.2 2 1721.1 85.6 1.21 7/15/2013 4 1852.5 89.6 3 2077.8 82.6 0.89 7/15/2013 5 4311.2 92.3 6 5384.7 90.1 0.80 7/16/2013 1 7539.5 95.4 2 6327.2 95.8 1.19 7/16/2013 4 1795.8 92.9 3 2263.3 91. 0.79 7/16/2013 5 4202.7 91.7 6 4898.2 95.3 0.86 8/8/2013 2 1049.8 79.1 1 1135.6 74.0 0.92 8/9/2013 3 407.5 54.1 4 320.8 43.8 1.27 8/9/2013 6 368 58.1 5 415.1 48.8 0.89 8/10/2013 4 229.2 78.8 3 830.8 86.7 0.28 8/10/2013 5 1235.2 86.2 6 1420.5 70.3 0.87 8/11/2013 4 965.1 61.3 3 1656.5 71.8 0.58 8/11/2013 8 971.9 62.3 7 1199.9 67.2 0.81

35
Table 17: The catch length in cm for all sturgeon captured with float configuration #1
Date Species Topless (N
captured)
Tow #
Length (cm)
Control (N
captured)
Tow #
Length (cm)
6/23/2013 Atlantic Sturgeon
1 5 125 0 N/A N/A
Table 18: The catch length in cm for sturgeon captured with float configuration #2 for cruises 2 and 3.
Date Species Topless (N captured)
Tow #
Length (cm)
Control (N captured)
Tow #
Length (cm)
7/12/2013 Atlantic Sturgeon
0 4 N/A 1 3 107
7/13/2013 Atlantic Sturgeon
0 3 N/A 1 2 161
7/14/2013 Atlantic Sturgeon
0 6 N/A 1 5 42
7/15/2013 Atlantic Sturgeon
0 1 N/A 1 2 165
7/16/2013 Atlantic Sturgeon
0 2 N/A 2 3,7 65, 187
8/10/2013 Atlantic Sturgeon
1 8 160 0 7 N/A
8/11/2013 Atlantic Sturgeon
1 2 220 0 1 N/A

36
Table 19: The information for sea turtles captured with float configuration #2 for cruises 2 and 3. No sea turtles were captured with float configuration #1. Capture
Date Species Capture
Gear Tow
# CCL Notch-Tip (cm)
CCL Notch-Notch (cm)
Applied Left Rear Flipper Tag #
Applied Right Rear Flipper
Tag #
7/13/2013 Loggerhead (C. caretta)
Topless 4 57.1 56.5 BBR985 BBR986
8/9/2013 Kemp’s Ridley
(L. kempii)
Control 5 22.0 21.8 BBR987 BBR988
Table 20: Summary values of mean catch per tow (pounds) with the standard deviation (pounds) in parentheses for the two float configurations of the topless trawl as compared to the control trawl for the target species (summer flounder) and the skate complex.
Topless trawl Control trawl Comparison Float Conf. Species Mean SD Mean SD
%Reduction T/C p-value
1 Summer flounder 174.1 70.4 243.2 91.1 30.4 0.00161 Skate complex 1972.1 675.1 2825 1020.1 30.1 0.00702 Summer flounder 277.9 144.1 359.7 218.5 22.7 0.00802 Skate complex 2091.8 1857 2381.5 1812.7 23.5 0.0570