final report: assessment the potential of using ... · final report: assessment the potential of...
TRANSCRIPT
Final Report: Assessment the potential of using vermifilters to treat faecal sludge
Claire Furlong (Sanitation Innovation Manager) Bear Valley Ventures Ltd Cotebrook Tarporley CW6 0JH United Kingdom Email: [email protected]

!
! 2!
TABLE OF CONTENTS ! !
1.0 Introduction 3
2.0 Methodology 4
2.1 Experimental Method 4
3.0 Results and Discussion 8
3.1 General Observations 8
3.1.1 Importance of Water Addition 8
3.1.2 Drainage 8
3.1.3 Feeding Cycles 8
3.2 Worm Health 9
3.3 Sludge 12
3.4 Temperature 14
3.5 Moisture 16
3.5 Effluent Quality 17
3.6 Vermicompost & Sludge 19
4.0 Conclusions and Learning Points 21
5.0 Recommendations 22
6.0 The Next Steps 22
Appendix 1: List of Detailed Learning Points for Future Experiments 24
!
! 3!
1.0 Introduction Bear Valley Ventures Ltd was commissioned by the International Federation of the Red Cross and Red Crescent Societies (IFRC) to determine if composting worms had the capability of processing faecal sludge to improve sanitation provision in the humanitarian sector. There are currently over 12 million people living in humanitarian camps worldwide and 3.2 million of those people are living in camps in Africa. The average humanitarian camp houses 11,400 people 1 , although they vary considerably in size. The largest refugee camp in the world is situated in Dadaab, Kenya and is estimated to house 500,000 people 2 . Providing sustainable sanitation for these populations is a huge challenge. Present systems such as pit latrines require frequent emptying, which is either done by tanker or manual labour and the faecal sludge is either transported off site or buried. The volume of faecal sludge generated is huge and if it is not disposed of hygienically this can lead to excreta-related diseases and even epidemics in camp settings. The large scale processing of faecal sludge by composting worms at a suitable location within the camps themselves may provide a solution. It would be more cost effective than transporting the waste out of the camp. The composting worms could potentially process the faecal sludge, reducing its volume and solids content by over 90%3. Additionally worms have the potential to reduce the pathogen load including parasitic worm eggs in the end product to a level where it can be applied safely to land 4 . The technology used to do this is called a vermifilter, which is a filter system that contains worms. In these systems the solids are trapped on top of the filter where they are processed by the worms, but the liquid passes through the filter. In separating the solids and liquid fractions the quality of the effluent should be greatly increased. In a previous report the capacity of worm farms in South Africa to meet the likely demands of sludge treatment were this technique to be adopted were
!!!!!!!!!!!!!!!!!!!!!!!!!!!!!!!!!!!!!!!!!!!!!!!!!!!!!!!!1 http://unhcr.org/globaltrendsjune2013/UNHCR%20GLOBAL%20TRENDS%202012_V05.pdf last accessed 31st July 2014 2 http://www.aljazeera.com/indepth/features/2011/07/201171182844876473.html last accessed 31st July 2014 3 Furlong et al., (2014). Processing of human faeces by wet vermifiltration for improved on-site sanitation. The Journal of Water, Sanitation and Hygiene for Development, 4, (2) 231-239. 4 Eastman et al., (2001). The effectiveness of vermiculture in human pathogen reduction for USEPA biosolids stabilization. Compost Science & Utilization, 9 (1) 38-49.!

!
! 4!
evaluated. The conclusions were that there is significant capacity to supply worms for humanitarian settings at present and that this could be quickly expanded to meet future demand. In this final report we describe the results and conclusion from our experimental work in India and have prepared a design brief for a prototype scale system (in Section 6.0). This work was originally intended to be carried out in Malawi over a period of four months. Due to delays in obtaining the necessary permits and contracts to carry out the work there, it was agreed with IFRC to switch the location to India over 7 weeks. As there where suitable facilities and a local partner, PriMove Infrastructure Development Consultants PVT, were available. The objectives of this study were:
1. To determine the ability of composting worms to digest faecal sludge 2. To explore the key factors, which may affect faecal sludge processing
time such as worm density 3. To determine the volume and pathogen reduction, which occurs
during the conversion to vermicompost 4. To prepare a design brief for a prototype treatment system (Section
6.0) 5. To produce a report detailing this work for dissemination
Objective 5 is covered by this report, the report on preliminary findings and the worm farm market analysis report. Additionally the data from worm farm market analysis and the material in this report have been disseminated to a wider audience via a journal paper (utilising the market analysis data) and a conference paper (utilising the data from this and the preliminary report).
2.0 Methodology The vermifilters and sludge are housed at Rajiv Gandhi Infotech Park Sewage Treatment Plant in Hinjawadi, 20km outside the city of Pune in India.
2.1 Experimental Method Eighteen cylindrical plastic vermifilters (referred to as V1 to V18) were constructed with an internal diameter of 400 mm (surface area 0.13 m2) and a height of 800 mm. There was a tap at the bottom of the vermifilter to allow the effluent to be drained. Under the rim of the lid a row of 1 mm holes were drilled to allow for airflow, they were spaced every 2 cm. The vermifilter was filled using 100 mm layers of the following material from bottom to top; 150-300 mm gravel, 70-150 mm gravel and pea gravel. On top of the pea gravel

!
! 5!
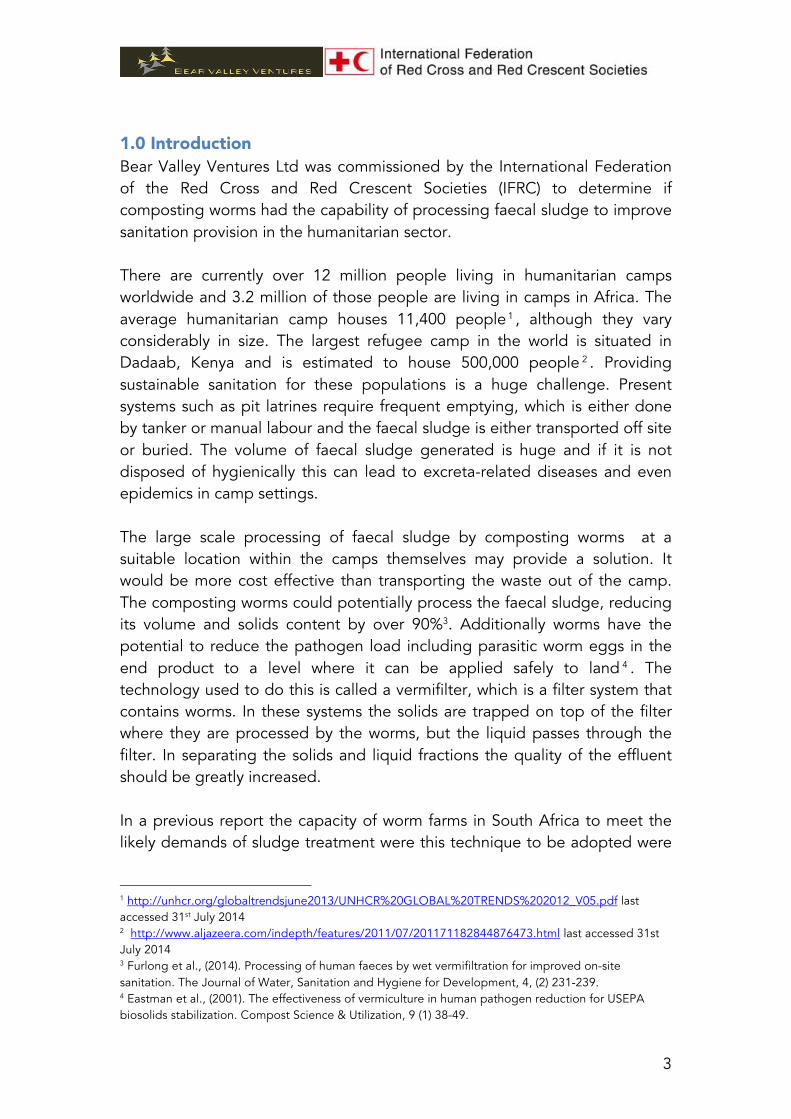
a 100 mm layer of wood shavings, which had been soaked for 2 days was added, this formed the bedding layer for the worms. Temperature sensors (Lascar USB-4, Lascar, UK) were placed in all the bedding layers and the temperature of this layer was monitored on an hourly basis. An additional sensor and data logger was used to monitor the environmental temperature. Seven moisture sensors (EC5, Decagon, UK) were also placed in the bedding layers of seven vermifilters (V12-V18) and readings are taken daily (using a Procheck, Decagon, UK). A divider was placed in the vermifilter to subdivide the area in the ratio 90:10, to allow the system to stay aerobic when the 90% area was covered in sludge. A photo of the vermifilters in situ can be seen in Figures 1 and 2.
Figure 1: Vermifilters in-situ Initially the vermifilters were seeded with different masses of worms and cocoons in order to study the impact of worm density on the systems (Table 1). Additionally, the numbers of cocoons were estimated to give the same worm densities once they had hatched and reached maturity (Table 1). On Day 21 an additional 50 g of worms were added to all of the vermifilters that were originally seeded with worms. This was due to the expected impact of the addition of this sludge on Day 8 (explained below), which led to fewer worm sightings in subsequent days.
!
! 6!
Figure 2: A cross-section through a vermifilter Table 1: Initial worm and cocoon densities Vermifilter Worm/cocoon density
(mass/number added) Vermifilter Worm/cocoon density
(mass/number added) 1 0 (control) 10 0 (control) 2 0.5 kg/m2 (50g) 11 0.5 kg/m2 (50g) 3 1 kg/m2 (100g) 12 1 kg/m2 (100g) 4 2 kg/m2 (200g) 13 2 kg/m2 (200g) 5 4 kg/m2 (400g) 14 4 kg/m2 (400g) 6 500 cocoons/m2 (50 cocoons) 15 500 cocoons/m2 (50 cocoons) 7 1000 cocoons/m2 (100 cocoons) 16 1000 cocoons/m2 (100 cocoons) 8 2000 cocoons/m2 (200 cocoons) 17 2000 cocoons/m2 (200 cocoons) 9 4000 cocoons/m2 (400 cocoons) 18 4000 cocoons/m2 (400 cocoons)
Please note the above colour coding has be used in the tables throughout this report: control=pink; worms=blue; cocoons =green. The vermifilters were fed with faecal sludge collected from pour-flush portable toilets that were being used on a construction site in Pune. Due to the water being used in flushing and for anal cleansing the sludge was quite thin. It was collected via vacuum track and delivered to site without further treatment.
Thermocouple+Moisture+probe+
100+mm+of++1505300mm+gravel++
100+mm+of++705150mm+gravel++
100+mm+of++pea+gravel+
100+mm+of+bedding+material+containing+the+worms+or+cocoons+
Tap+to+drain+effluent++
Lid+
Internal+divider+Sludge+layer+

!
! 7!
As the faecal sludge had a high water content it was settled for 1 day, the settled sludge was added to the system, and the volume of sludge added was recorded. Three different batches of sludge were used throughout the experiment (Table 2). Table 2: Sludge batch and days used
Sludge Batch Number Days Used Sludge 1 Day 2-5 Sludge 2 Day 6-8 Sludge 3 Day 10-11
Each new batch of sludge was analysed for the following parameters: pH, total suspended solids (TSS), volatile suspended solids (VSS), total solids (TS), chemical oxygen demand (COD), faecal coliforms (FC) and Ascaris spp. number and viability. Additionally the effluent collected after the final feed during experiment and the vermicompost, which developed was also tested for these parameters The amount of feed was increased from two litres on Day 2 to four litres on Day 3, to eight litres per day for the subsequent five days (Day 8). Over this period the vermifilters were fed with a total of 46 litres of sludge. On Day 8, eight litres of unusually thick sludge (from the scum layer) was added to V8 to V18. The thick sludge sat on top of the bedding layer, where previous sludge had entered this layer. This was of concern as it completely covered the bedding layer and this, coupled with the reduction of the air voids in the bedding layer caused by the thinner sludge, could easily have caused the vermifilters to go anaerobic. It should also be noted that thicker sludge had also infiltrated the refuge area; worms were observed trying to escape the vermifilters. On Day 9 some of the thicker sludge was removed and placed in the vermifilters with lower amounts of solids and the refuge areas were cleaned by rinsing with water. Two days after feeding it was noted that that the vermifilters were being colonised by small flies (fruit flies) and small maggots. Particular care from this point onwards was taken to close the systems properly; they were also covered with a shade net. This infestation issue was monitored throughout the experiment. Also it was decided to add a little water on a daily basis to keep the system moist and to help cool the systems. Approximately 2 litres of water was added to each vermifilter half in the morning and half in the afternoon. This also meant that the drainage of the system could be monitored, via structured observations. Structured observations were started once the feeding phase had stopped (Day 17), maggot and fly levels,

!
! 8!
drainage, the presence of worms and vermicompost were monitored, additionally anything unusual was also noted. At the end of the experiment the vermifilters were decommissioned. Within each layer the mass of worms and vermicompost was measured and the number of cocoons was counted. The vermicompost from each layer was the combined and a sample was sent for full analysis as mentioned previously.
3.0 Results and Discussion The vermifilters took approximately three days to set up and were run for a period of 52 days (7/3/15 to 27/4/15). When the 11 day feeding phase is accounted for, there were only 38 days for sludge digestion and vermicompost production. This is a relatively short period to run such an experiment as we have noted in our previous work that it takes approximately six weeks for the worms to acclimatise to a new food source3.
3.1 General Observations
3.1.1 Importance of Water Addition Over one weekend (Days 15-16) the vermifilters were not watered due to staff absence. During the observations on Day 17 it was noted that there had been significant fungal growth, which had not been seen before, and the maggot and fruit fly situation had worsened. Additionally dead worms were recorded in two of the vermifilters (V5 and V13). It was decided that water of the systems should happen daily, including at weekends. It is therefore felt that the addition of water also serves inhibit fungus and fruit fly growth. On Day 19 no water was available, so the vermifilters were watered with their effluent. No detrimental effects of this action were noted. Vermicomposting systems are often kept moist with the effluent that is drained of the system, and some experts consider this to be beneficial as microorganisms in the effluent are returned to the system. Reintroducing the effluent into the system could be a way of keeping the systems moist in water scarce situations.
3.1.2 Drainage From Day 11 to Day 22 V9 was slow draining. This drainage problem self-corrected and after Day 22 it was free draining.
3.1.3 Feeding Cycles A feeding cycle is defined as starting when a vermifilter has been initially fed with faecal sludge and ending when that material has been completely

!
! 9!
converted into vermicompost. It was estimated that the vermifilters would go through a maximum of two to six (depending on the worm and cocoon density) feeding cycles during the experiment. The initial feeding cycle was longer than expected (11 days) additionally it took the vermifilters two weeks to recover from the addition of the thick sludge (explained in Section 2.1). The sludge itself was mixed with the bedding material so it was difficult to see the conversion of into vermicompost therefore only one feed cycle was undertaken.
3.2 Worm Health During the feeding period it was noted that the worms were not trying to escape. This meant that the sludge was not toxic to the worms and the environment that was created in the vermifilters was suitable for worm habitation. Worms were recorded in the vermifilters from Day 12 onwards, although it should be noted that initial sightings of the worms was sporadic in the vermifilters with lower initial worm densities, which could be due to their dispersal throughout the vermifilters. After thick sludge was added (explained in Section 2.1), it was noted that the worms were trying to escape (Day 10), which was probably due to the systems going anaerobic. As the number of worms that actually left could not be calculated or estimated it was thought that adding an extra 50g of worms (Day 21) would benefit the experiment. From Day 40 to Day 52 there were consistent sightings of worms in V2 to V5 and from Day 42 to the end of the experiment in V12 to V14. There were few sightings of worms in V11 during this period. This lag of consistent sightings of worms could be due to the impact of the addition of the thick sludge in V8-V18. In the vermifilters to which worms had been added the first cocoon was spotted in V5 on Day 35, and from Day 38 onwards cocoons were spotted in V2 to V5. Cocoons were seen slightly later in the second series of vermifilters which contained worms. The first cocoon was spotted on Day 38 in V14, Day 40 for V12 and V14, but they were not spotted until Day 43 in V11. Again this may have been due to the impact of the addition of the thick sludge in V8-V18. These were positive indicators of worm health and activity in these systems. In the vermifilters that were seeded with cocoons worms were first spotted in V9 on Day 34, and by Day 43 worms had been seen in V6 to V9. Worms were sighted slightly later in the second set of vermifilters seeded with cocoons:

!
! 10!
they were seen in Day 48, but were only sighted in V16 and V17. This again is possible evidence of the impact of the thick sludge on the system. In Table 3 it can be seen that the majority of the worms were found in the bedding material or pea gravel layer. This means they are actively feeding and in contact with their food. The worm density in all vermifilters had significantly decreased from the start of the experiment (average worm mass at the end of the experiment was 46g). The feed (faecal sludge) was obviously not toxic to the worms, as no worms would be found if this was the case. The worm population may have decreased in V8-V18 due to the impact of the thick sludge; this is probably reflected in the lower worm masses in V11-V14 (excluding V13) compared to V2 to V5. The worm density in all of the vermifilters was very similar at the end of the experiment, which would suggest that this may either be the optimum worm density for these systems (0.5 kg/m2) or that there was insufficient feed to sustain a larger population. This was supported by the fact that worms were trying to leave several of the vermifilters after Day 49. It should be noted it was difficult to determine if all the sludge had been consumed as it was mixed with the bedding material. Table 3: Mass of worms at the start and end of the experiment in vermifilters which were initially seeded with worms
Mass of worms (g) Vermifilter No
Day 1 Day 52 in Bedding
Day 52 in Pea gravel
Day 52 in gravel
Total Day 52
V2 100 (50+50) 27 41 0 61 V3 150 (100+50) 8 51 0 59 V4 250 (200+50) 4 31 0 35 V5 450 (400+50) 12 59 0 71
V11 100 (50+50) 2 26 0 28 V12 150 (100+50) 9 25 0 34 V13 250 (200+50) 11 30 0 41 V14 450 (400+50) 4 31 0 35
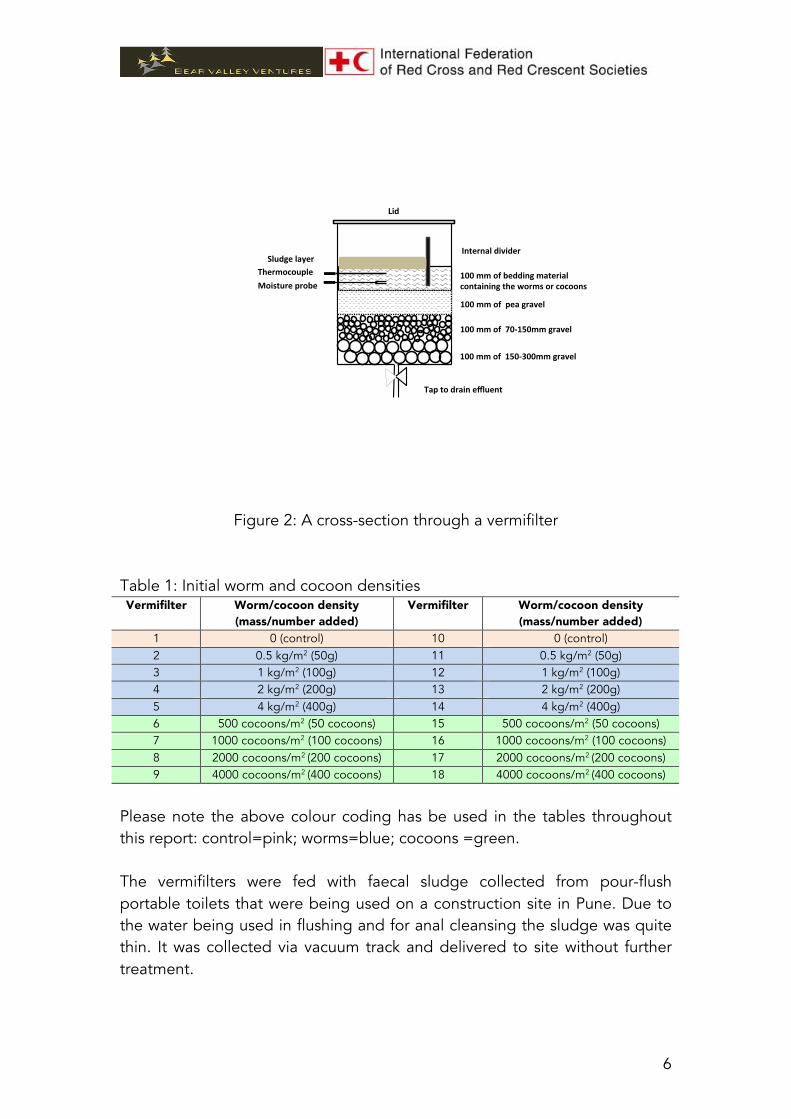
During decommissioning the numbers of cocoons were enumerated (Table 4). A higher than expected number of cocoons were found in the vermifilters (65-1,200) which indicates that this was a good environment for the worms as they only mate when conditions are favourable. Again higher levels of cocoons were found in V2 to V5 compared to V11 to V14, which would suggest that the thick sludge impacted the health of the worms. The cocoon numbers would also suggest that a higher worm populations were supported at some point during this experiment and the present low worm population might be driven by a lack of resources, i.e. food.
!
! 11!
Table 4: Number of cocoons at the start and end of the experiment in vermifilters that were initially seeded with worms
Number of cocoons Vermifilter No
Day 1 Day 52 in bedding
Day 52 in pea gravel
Day 52 in gravel
Total Day 52
Cocoons/worm mass Day 1
V2 0 857 346 0 1,200 12 V3 0 119 81 0 200 1.3 V4 0 344 146 0 490 2.0 V5 0 267 134 0 401 0.9
V11 0 199 26 0 255 2.6 V12 0 149 31 0 180 1.2 V13 0 19 46 0 65 0.3 V14 0 127 288 0 415 0.9
Although worms were sighted in the vermifilters seeded with cocoons a very low mass was recorded at the end of the experiment (Table 5). This could be attributed to the low weight of the juvenile worms which can weigh below 0.001g. As juvenile worms are very small they may also have been missed during enumeration. Additionally it takes between 40 to 60 days for this worm species to reach maturity. What is surprising is that no residual cocoons were found. There are two possible explanations for this: (i) they may have be missed due to their size during enumeration; this is thought to be unlikely as the staff undertaking this task are experts in the this field.; (ii)the second explanation is that all of the cocoons had hatched during the experiment and the worms are in a juvenile state. Table 5: Mass of cocoons and number of worms at the start and end of the experiment in vermifilters that were initially seeded with cocoons
Mass of worms (g) and number of cocoons Vermifilter No Cocoons
Day 1 Worms Day 52
Cocoons Day 52
V6 50 1 0 V7 100 5 0 V8 200 6 0 V9 400 8 0
V15 50 1 0 V16 100 2 0 V17 200 1 0 V18 400 1 0

!
! 12!
3.3 Sludge Faecal sludge characteristics vary widely, hence each new batch of sludge used was analysed. Three batches of sludge were sent for analysis (Table 2. Duplicate samples of Sludge 1 were sent for analysis on Day 3 (Table 6). Table 6: Analysis of Sludge 1 from Day 3 and Sludge 3 from Day 54
Parameter Sludge 1a Sludge 1b Sludge 3e Sludge 3f pH 6.20 6.35
6.90 6.89
TSS (mg/l) 630 582 712 760 VSS (mg/l) 154 138 220 248 VSS:TSS 0.24 0.24 0.31 0.33
Total solids (mg/l)
1,428 (0.14%)
1,290 (0.13%)
2,136 (0.24%)
2,270 (0.23%)
COD (mg/l) 682 616 1,294 1,320 Faecal coliforms
(CFU/100ml) 49x106 58 x106 15 x106 22 x106
Ascaris spp (total eggs/g)
12 (12,000 per liter)
16 (16,000 per liter)
9 (9,000 per liter)
8 (8,000 per liter)
Ascaris spp viability (eggs/g)
4 (33%)
9 (56%)
2 (22%)
3 (38%)
In the Preliminary Report the total solids and the COD values were reported to be low (Table 6). The COD values were expected to be in the range of 1,200 to 50,000 mg/l5. Of more concern was the total solids value, which was expected to be above 3% due to the total solids in a sludge from septic tanks ranging from 1% to 3.4% and sludge from public toilets ranging from 3% to 5%. It should be noted that there is very little literature on these characteristics and the characteristics of faecal sludge is known to dramatically vary. A sample of Sludge 2, used for feeding from Day 6 onwards (Table 2), was sent for analysis together with the effluent from the vermifilters. Although there was a clear difference in the visual appearance in the samples (Figure 3), there was very little difference in the influent and effluent (Table 8). In some cases the effluent had higher parameter values than the sludge. This coupled with previous low levels of key parameters led to further samples (Sludge 3) being sent for validation at another laboratory (Table 7). These samples were only analysed for COD and total solids due to the capacity of the second laboratory. At the end of the experiment two samples of Sludge 3
!!!!!!!!!!!!!!!!!!!!!!!!!!!!!!!!!!!!!!!!!!!!!!!!!!!!!!!!5 http://www.unesco-ihe.org/sites/default/files/fsm_ch02.pdf last accessed 08/5/15

!
! 13!
and the vermicompost generated were sent for full analysis at the original laboratory (Table 6). Table 7: Results from the analysis of Sludge 3 at two independent laboratories
Day 8 24 Sludge 3a 3b 3c 3d
Lab A B A B A B A B COD mg/L 1,260
800
1,246 11,200 1,364 17,200 1,316 11,600
TSS mg/L
1,878 (0.19%)
13,800 (1.4%)
1,824 (0.18%)
20,600 (2.1%)
1,752 (0.18%)
24,580 (2.4%)
1,840 (0.18%)
20,860 (2.1%)
A=Original laboratory (Enviro-Safe, Pune) B= New laboratory (Ultra-Tech, Pune)
The Sludge 3 samples were sent to both laboratories for COD and total solids analysis on Day 8, but the results were inconclusive (Table 7). Therefore a further three samples of Sludge 3 were sent to each laboratory (Day 24, Table 7). It can be seen that the total solids that were analysed in the original laboratory are lower by approximately a factor of 10 compared to those analysed in the new laboratory. Both laboratories were questioned about the method used, sample handling and dilutions. Both laboratories stood by their results and procedures. Additionally this pattern is repeated in the COD samples from Day 24. From Figure 3 it can be seen that there are significantly more solids in the sludge compared to the effluent, while this is not reflected in results in Table 8 from the original laboratory. From this analysis it would seem that a dilution factor for the sludge was not being accounted for in the data from the original laboratory and this may explain the lack of difference between influent and effluent in Table 8, although this was not acknowledged by the laboratory.

!
! 14!
Figure 3: Samples of sludge (left) and effluent (right) Day 6
3.4 Temperature The vermifilters were installed and run during March and April 2015 (spring), when average weekly temperature increased from 33°C to 38 C (Figure 4). This was reflected in the average weekly temperatures in the vermifilters which ranged from 27°C to 30°C in Week 1 to 32°C to 34°C in Week 7. The average temperatures in the vermifilters mirrored the patterns of the average environmental temperatures, except in V10 (Figure 4). When V10 was decommissioned it as noted that the temperature sensor was embedded in vermicompost rather than the bedding layer, which could account for these strange readings.

!
! 15!
Figure 4: Average weekly temperatures (environmental temperature data from accuweather.com) There was no evidence of cooling through the addition of feed or the water. The cooling of the system with flush water has been seen in previous work on worm-based sanitation6 where larger volumes of water were used. The temperature sensors and data loggers proved to be temperamental, which was possibly due to the data loggers being stored outside and exposed to high temperatures and the elements. Full data sets were only obtained from V3 to V16. The temperature sensor recording the environmental temperature only worked for one full week (Week 4), and the results for this week are shown in Figure 4. This shows that the maximum temperature in the vermifilters was reached between 2 and 5 pm and the minimum between 6 and 9 am, and slightly lagged behind the environmental highs and lows (Figure 4).
!!!!!!!!!!!!!!!!!!!!!!!!!!!!!!!!!!!!!!!!!!!!!!!!!!!!!!!!6 Furlong C., Gibson W.T., Templeton M. R., M. Taillade M., Kassam F., Crabb G., Godsell
R., McQuilkin J., A. Oak A., Thakar G., Kodgire M., Patankar. R. (2014) The Tiger Toilet: From Concept to Reality. IWA specialist conference on Municipal Water Management and Sanitation in Developing Countries. AIT, Bangkok, Thailand

!
! 16!
Figure 4: Temperate inside the vermifilters and the environment from Week 4 When the data from V10 is disregarded the minimum temperature was 19°C and the maximum temperature was 44°C. The optimum temperature for the species of worms used (Eisenia andrei) is between 15 °C to 20°C7. In a previous study in worm-based sanitation this species of worms were thriving at temperatures ranging from 20°C to 41°C7, so the temperatures experienced during this experiment would not have affected worm growth or development. More extreme temperatures may impact the worms especially if they are not acclimatised to local conditions. This could be overcome by innovative tank design or may not be so much of an issue in a continuous flow system.
3.5 Moisture Moisture sensors were placed in seven vermifilters and readings taken daily, until the moisture meter was unexpectedly broken on Day 34. Additionally we had limited success with these sensors as the readings gained were not always accurate i.e. the readings registered too low or too high for the calibration. The company was contacted, but no resolution to this problem was gained during the period of the study. The sensors in V12 and V18 worked consistently during this period, while the others worked intermittently. The results from these sensors can be seen below in Figure 6. !!!!!!!!!!!!!!!!!!!!!!!!!!!!!!!!!!!!!!!!!!!!!!!!!!!!!!!!7 Edwards C.A., & Bohlen, 1997. Biology and Ecology of Earthworms. Chapman and Hall, London.
!

!
! 17!
Figure 6: Volumetric water content in the vermifilters These moisture readings from this experiment are consistent with the readings from previous experiments with similar bedding material (woodchip)8. The volumetric water content ranged from 20-35% from Day to 16 increasing over this period, then stabilised between 30-49%8. It is thought that this initial increase occurs due to the woodchip slowly absorbing water from its surroundings.
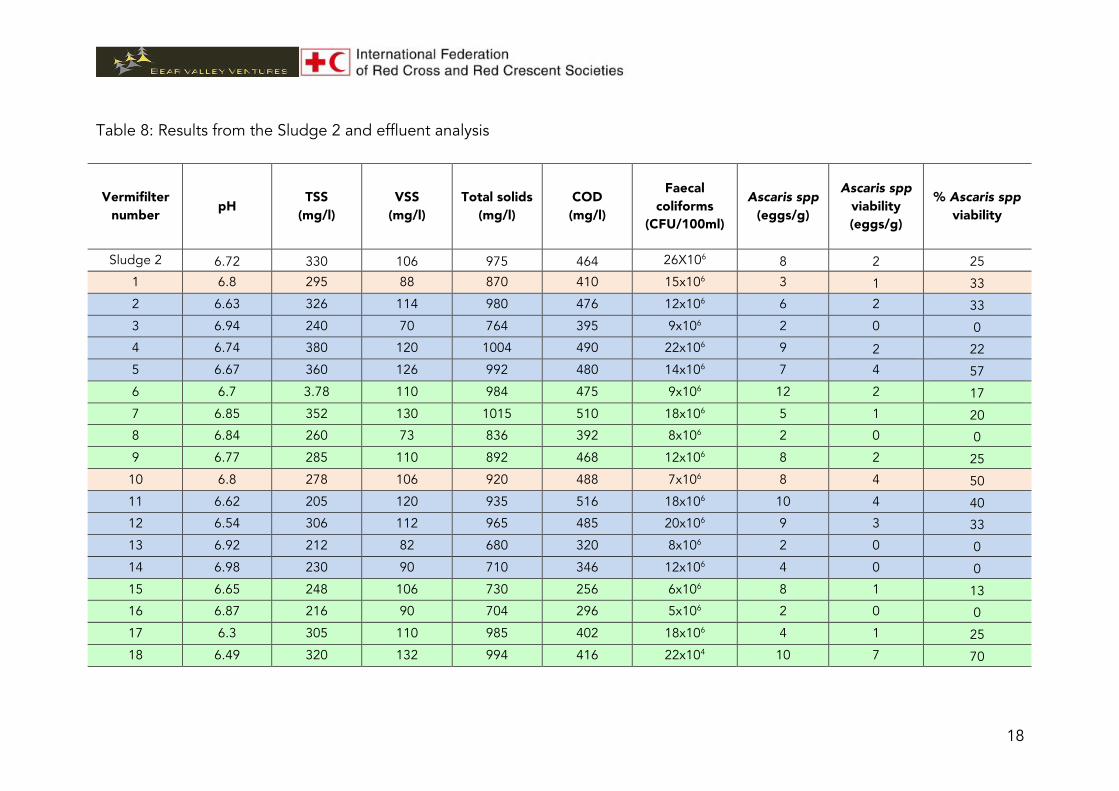
3.5 Effluent Quality The effluent quality was only measured once during the study (Day 7), due to trying to validate the results from the laboratory and only going though one feeding phase. The results from the effluent quality analysis can be seen below in Table 8.
!!!!!!!!!!!!!!!!!!!!!!!!!!!!!!!!!!!!!!!!!!!!!!!!!!!!!!!!8 unpublished data from previous experiments
!
! 18!
Table 8: Results from the Sludge 2 and effluent analysis
Vermifilter number pH TSS
(mg/l) VSS
(mg/l) Total solids
(mg/l) COD (mg/l)
Faecal coliforms
(CFU/100ml)
Ascaris spp (eggs/g)
Ascaris spp viability (eggs/g)
% Ascaris spp viability
Sludge 2 6.72 330 106 975 464 26X106 8 2 25
1 6.8 295 88 870 410 15x106 3 1 33
2 6.63 326 114 980 476 12x106 6 2 33
3 6.94 240 70 764 395 9x10⁶ 2 0 0
4 6.74 380 120 1004 490 22x106 9 2 22
5 6.67 360 126 992 480 14x106 7 4 57
6 6.7 3.78 110 984 475 9x10⁶ 12 2 17
7 6.85 352 130 1015 510 18x106 5 1 20
8 6.84 260 73 836 392 8x10⁶ 2 0 0
9 6.77 285 110 892 468 12x106 8 2 25
10 6.8 278 106 920 488 7x10⁶ 8 4 50
11 6.62 205 120 935 516 18x106 10 4 40
12 6.54 306 112 965 485 20x106 9 3 33
13 6.92 212 82 680 320 8x10⁶ 2 0 0
14 6.98 230 90 710 346 12x106 4 0 0
15 6.65 248 106 730 256 6x10⁶ 8 1 13
16 6.87 216 90 704 296 5x10⁶ 2 0 0
17 6.3 305 110 985 402 18x106 4 1 25
18 6.49 320 132 994 416 22x104 10 7 70
!
! 19!
The effluent quality (Table 8) in terms of COD and thermotolerant coliforms is within levels that we would expect. In previous work on worm-based sanitation the COD ranged from 190-1541 mg/l and thermotolerant coliforms levels ranged from 0.02-4.3 x 10⁶ CFU/100ml. This also supports the theory that the problem with the sludge samples is due to a dilution factor not being accounted for. If it is assumed that this dilution factor is 10, which seems credible from the results discussed in Section 3.3,then the following estimation of removal efficiencies seem valid:
• Total solids 90-93% • COD 89-94% • Thermotolerant coliforms 90-99.9% • Asacaris spp 85-98%
When these removal efficiencies were explored there was no difference in the controls, those seeded with cocoons or worms, nor within the different densities. This suggests that the effluent is being treated by the filter media and there is no impact, positive or negative, from the presence of worms.
3.6 Vermicompost & Sludge Vermicompost was first recorded in V3 on Day 27 and by Day 38 it had been recorded in V2 to V5. In the second set of vermifilters vermicompost was not recorded until Day 37 in V14, then in V13 on Day 42. Vermicompost was not sighted in V11 or V12 nor was it seen in the vermifilters that were initially seeded with cocoons. When the systems were decommissioned vermicompost was not found in any of the systems which were seeded with cocoons, but was found in all the systems which were seeded with worms. All of the vermicompost was found in the bedding material and a majority by the side of the refuge. In some instances it was not recorded during the structured observations as it was in the bedding layer and therefore not visible from the top of the system. As it was only found in the bedding layer this means the vermicompost was not washed out during the addition of water. The effluent from the addition of water was also checked on multiple occasions and no vermicompost was present. The mass of the vermicompost generated (Table 9) did not vary across the systems, so worm density did not have an impact on the amount of vermicompost produced. This may indicate that all of the sludge had been turned into vermicompost. This could not be verified as the sludge was mixed with the bedding material, so undigested sludge could not be quantified. This may a further indication that the systems were underfed. When no vermicompost was present a sample of the bedding material that contained sludge was sent for analysis instead (Table 9).

!
! 20!
Table 9: Results from vermicompost (VC) and sludge + bedding material (S) analysis
Vermifilter number
Mass of VC (g)
Sample type pH TSS
(%) VSS (%l)
Total solids (%)
COD (mg/l)
Faecal coliforms
(CFU/100ml)
Ascaris spp
(eggs/g)
Ascaris spp
viability (eggs/g)
% Ascaris spp
viability
1 0 S 7.50 13.0 7.1 74.8 36,540 4x10² 0 0 0
2 370 VC 7.34 12.6 7.5 74.2 34,960 8x10² 1 0 0
3 483 VC 7.42 12.4 6.8 70.5 35,262 6x10² 0 0 0
4 261 VC 7.44 14.1 7.2 72.6 34,830 4x10² 0 0 0
5 451 VC 7.30 11.7 6.8 70.5 32,370 2x10² 1 0 0
6 0 S 7.45 11.9 6.4 72.6 30,618 6x10² 4 2 50
7 0 S 7.48 12.2 7.9 71.2 30,934 4x10² 3 0 0
8 0 S 7.56 12.7 7.0 74.0 35,016 2x10² 1 0 0
9 0 S 7.48 13.7 7.8 72.6 34,312 8x10² 4 4 0
10 0 S 7.42 13.5 7.4 70.8 34,480 4x10² 2 1 50
11 233 VC 7.50 13.9 7.5 75.3 36,210 4x10² 6 2 33
12 247 VC 7.46 15.2 7.9 76.1 30,110 2x10² 1 0 0
13 301 VC 7.56 14.7 7.8 72.6 32,624 2x10⁴ 0 0 0
14 422 VC 7.45 12.2 8.1 72.4 32,508 5x10² 0 0 0
15 0 S 7.56 13.0 7.6 74.1 30,465 2x10² 3 3 0
16 0 S 7.28 14.9 7.5 74.4 32,826 4x10² 1 1 0
17 0 S 7.56 14.2 7.7 75.1 38,020 8x10² 0 0 0
18 0 S 7.36 12.8 7.2 70.4 30,150 2x10² 4 1 25

!
! 21!
If the analysis in Table 9 is correct it can be seen that both the faecal coliform numbers and the number of Ascaris spp eggs have decreased significantly compared with the original sludge results (Table 6). It was thought that Ascaris spp eggs would accumulate in the bedding layer and then the worms would consume them. What was unexpected was that this change occurred across the controls and the vermifilters seeded with cocoons. There do seem to be slightly lower number of Ascaris spp eggs in the vermifilters containing worms, but this difference is not very significant. From these results it looks like the conditions generated in the system are able to reduce faecal coliforms and remove Ascaris spp eggs, but the mechanism is not yet known. In some cases the results meet the EPA condition for applying biosolids to land <1000 per g of total solids dry weight of faecal coliforms and < 1 viable ova (egg) per 4 g of total solids dry weight9. This would mean the health risk for handling vermicompost and reusing it is significantly reduced. As any undigested sludge could not be recovered from the system and due to problems with the sludge analysis, the conversion from sludge to vermicompost could not be accurately calculated. But an attempt to estimate this can be made if we used the following assumptions:
• The solids content of the sludge was 2% • The volume of sludge added was 62 litres • The amount of vermicompost produced was 350g • The solids content of the vermicompost was 73% • All of the solids were converted
Using the above assumptions 1 kg of sludge is converted into 0.2 kg of vermicompost (dry weight). This conversion factor is very similar to those gained in our previous work on worm-based sanitation3,6, where 1 kg of faecal sludge was converted into 0.09 and 0.2 kg of vermicompost.
!!!!!!!!!!!!!!!!!!!!!!!!!!!!!!!!!!!!!!!!!!!!!!!!!!!!!!!!9!http://water.epa.gov/scitech/wastetech/biosolids/upload/2007_05_31_625r92013_625R92013.pdf last accessed 8/5/15!

!
! 22!
4.0 Conclusions and Learning Points Although this study was not completely definitive it has shown clearly that:
• worms are capable of digesting faecal sludge and converting it into compost
• cocoons can hatch into worms in the presence of faecal sludge • vermifilters are efficient at removing solids and also faecal pathogens
This is therefore a promising avenue for sludge treatment, which merits further examination, particularly over a longer period of time with more feed cycles. The difficulties we encountered in obtaining reliable analyses of the sludge properties do not affect these overall conclusions but do make it difficult to quantify the effectiveness of the treatment. It is likely, by comparison with previous work, that sludge digestion went to completion but further work is necessary to confirm this. The main impact of worms in the vermifilters appears to be on solids removal rather than effluent quality, which confirms the importance of using a vermifilter as oppose to simply adding worms to a heap of sludge. A number of detailed conclusions and learning points can be drawn and are shown in Appendix 1 for future reference.
5.0 Recommendations A further study should be undertaken to confirm these findings, over a longer period of time, with more feed cycles (as originally planned in Malawi, but unable to be conducted due to lack of time in India). Ideally this study should be conducted with sludge from a humanitarian camp, with the aim of determining the optimum operating conditions for a practical process that could work at scale. In future, laboratories used for analysis should be verified before starting the experiments.

!
! 23!
6.0 The Next Steps This study acts as a proof of concept and has shown that worms are able to process faecal sludge. The next stage would be to develop a pilot system to treat the waste in-situ at a camp. The design of such a vermifilter or worm-based system may be dependent on the sludge type. If thin sludge was to be treated using a pilot system, it is envisaged that a continuous system could be used, and an area of 1m2 with a worm density of 0.5 per m2 could be used to potentially treat 0.5 m3 of sludge per day. It is envisaged that this system would need to be contained to stop the invasion of flies and maggots, eg within a tent-like structure with a waterproof bottom and a mesh top. The filter bed would be the same, but the bedding material could be coir (as it is easy to transport). Depending on the effluent quality, environmental or soil conditions, the effluent produced could be directly infiltrated into the soil, or further treated through evaportransporation in a planted system ( nb the suitability for edible crops will depend on effluent quality and crop type). If a system with higher levels of solids were to be treated the same system could be utilised, but in a batch mode: in this instance 1m2 could be used to treat about 0.6m3 (assuming 5% solids) per week, and the effluent generated could be used to keep the system moist. For both of these systems a bladder could be used to store the sludge prior to use and solar pumps could be used to apply the sludge to the vermifilters. If the sludge had a higher solids content and was not pumpable, the sludge could be dried and then traditionally vermicomposted on site. Additionally vermicomposting or vermifilters could be linked or combined with other treatments. The vermifiter already acts as a sludge drying bed, but if the faecal sludge was heated to achieve higher pathogen kill the sludge could be vermifiltered to achieve reduction in solids. Additionally the digestate from anaerobic digestion could be vermifiltered to achieve solids reduction and pathogen kill.

!
! 24!
Appendix 1: List of Detailed Learning Points for Future Experiments
• Sensors were very temperamental in this extreme environment • Faecal sludge is not toxic to worms or cocoons • Worms are able to survive and consume faecal sludge • Faecal sludge does not inhibit the hatching of cocoons • Combination of thin sludge and thick sludge (scum layer) was difficult
to treat in one system due to where solids are deposited • Addition of thick sludge in V8-V18 had a negative impact on the worm
population but only slowed the process of digestion down, not stop it • Sprinkling of liquid on the surface of the vermifilter inhibited excess
fungus and fly growth • Worm mass and growth were possibly inhibited by limited feed during
the end of this experiment • An initial worm density of 0.5 kg per m2 is appropriate for these
vermifilters • Sludge results are questionable and seem to be a factor of 10 lower
than expected • Temperature in the vermifilters was not thought to inhibit worm
growth • No evidence of system cooling from the addition of feed nor the
sprinkling of liquid was found • Moisture levels in the bedding material were conducive with worm
growth • Sprinkling of effluent to cool the system had no impact on worm
health • An estimation of treatment efficiencies was made due to a lack of
credible sludge data • Effluent was being treated (filtration) by the filter bed (using treatment
efficiency estimations) • No impact on effluent quality was found due to presence or density of
worms (using treatment efficiency estimations) • Estimated conversion rate from faecal sludge to vermicompost was
1:0.2 • Faecal coliforms and Ascaris spp eggs were reduced in the system • Vermicompost produced was relatively safe to handle • No impact on vermicompost production or Faecal coliforms and
Ascaris spp eggs reduction was found due to presence or density of worms

!
! 25!
• Vermicompost was difficult to see from the top of the vermifilter • Sludge could not be easily separated from the bedding layer