final p1 report diagnostic leaching of gold
TRANSCRIPT
PRACTICAL TRAINING 1: Diagnostic leaching
U n i v e r s i t y o f J o h a n n e s b u r g
2 0 1 5 / 0 2 / 2 8
Thabang Leroy Lepitla
Student number: 201115186
2 Diagnostic leaching
DECLARATION
I hereby declare that the project work entitled “Barberton: diagnostic leaching” submitted to the
University of Johannesburg, is a record of an original work done by me under the guidance of
Sonestie Janse van Rensburg, principal scientist of hydrometallurgy division at MINTEK .This
project work is submitted in the partial fulfilment of the requirements for the award of a national
diploma in engineering metallurgy. The results embodied in this thesis have not been submitted to
any other University or Institute for the award of any diploma.
Place: Signature:
……………………………….
Date: Thabang Leroy Lepitla
3 Diagnostic leaching
SUMMARY
This report is supposed to serve a purpose in the diagnostic leaching industry by evaluate the
current MINTEK diagnostic procedure to understand the results, generated using the current
method while processing complex and refractory ores. To develop a new, more detailed diagnostic
leach procedure which targets identification of clay minerals, tellurides and antimony sulphides
encountered more, diagnostic leaching of the short method, long and wet were conducted to
compare the results, so that to help design the diagnostic leach procedure as such to reduce costs
as well as time by based on the practical test and the results. The results generated from these
tests showed that the all tests indicated that this sample was refractory. The results of all the test
on the HCL test show that if the HCL test is not given enough digestion time it would not allow the
sample to dissolve entirely during that test. These results answered my problem, but with the wet
method at the nitric acid step, the sample should be given 24 hours to run to ensure full
dissolution of the relevant minerals at these steps. These results made it possible to understand
the dissolution of minerals associated with gold and exactly which mineral had the most gold
attached too.
4 Diagnostic leaching
Table of Contents 1. Introduction ...................................................................................................................................................... 6
1.1 Background ..................................................................................................................................................... 6
1.2 Diagnostic leaching............................................................................................................................................ 6
1.3 Objective of this study ............................................................................................................................. 7
2. Aim/purpose ..................................................................................................................................................... 9
Description of aim .................................................................................................................................................... 9
3. Overview of the company ............................................................................................................................... 9
3.1 Company information ............................................................................................................................. 9
3.2 Hydrometallurgy at MINTEK ................................................................................................................. 9
4. Literature review ........................................................................................................................................... 10
4.1 Discovery of gold in South Africa ........................................................................................................ 10
4.3 Definitions ............................................................................................................................................... 11
5. Experimental Procedure .............................................................................................................................. 12
Carbon –in- leach (CIL) ...................................................................................................................................... 12
HCl digestion test .............................................................................................................................................. 13
HNO3 digestion test ........................................................................................................................................... 13
Roasting ............................................................................................................................................................. 13
6 Results and discussions ..................................................................................................................................... 14
7 Safety precautions when working with acids ........................................................................................... 17
7.1 The following PPE should be worn when working with acids: ......................................................... 17
7.2 Environmental precautions when working with acids .................................................................. 17
7.3 Diluting an acid ...................................................................................................................................... 17
8 Safety precautions when working with cyanide: ..................................................................................... 17
8.1 The following PPE should be worn when working with cyanide: ...................................................... 17
8.2 Precautions: .................................................................................................................................................... 17
9 Findings and observations made: .............................................................................................................. 18
10 Recommendations: .................................................................................................................................... 18
11 Conclusion ................................................................................................................................................... 19
Appendix 1 ................................................................................................................................................................. 20
Detailed diagnostic leach SOP .................................................................................................................................... 20
Appendix 2 ................................................................................................................................................................. 25
Abbreviations ………………………………………………………………………………………………………………………………………………………25
Appendix 3 ................................................................................................................................................................. 26
Table 4 …….……………………………………………………………………………………………………………………………………………………….…26
Table 5 ……………………………………………………………………………………………………………………………………………………..…………27
5 Diagnostic leaching
Reference list ............................................................................................................................................................. 28
List of tables
Table 1 difference between current method and improved new method
Table 2 Diagnostic leach results
Table 3 QEMSCAN mineralogy of the Barberton sample
Table 4 target minerals for each test
Table 5 Old method results
6 Diagnostic leaching
1. Introduction
1.1 Background
As part of the engineering curriculum of the University of Johannesburg (a university based in the
Republic of South Africa, Johannesburg), each student is required to undergo a Work Integrated
Learning (WIL) program (experimental training practice 1, also known as P1) in order to complete
a National Diploma in Engineering Metallurgy.
As such, in a bid to satisfy such practical training the author undertook an industrial internship at
MINTEK, in Johannesburg (South Africa) for a period of 6 months (12 August 2014 to 12 February
2015). The training was undertaken at the Gold and Uranium Group, a sub-division of the
Hydrometallurgy Division (HMD) of MINTEK, which was headed by Bernadine Ballington.
This report outlines the project work carried out during this in-service training, which focused on
one of MINTEK’s research projects called: Gold processing: BARBERTON. The project was based on
the evaluation of gold ore sample from BARBERTON mine using the diagnostic leaching
techniques.
1.2 Diagnostic leaching
The gold contained in an ore is usually in low concentrations (parts per million) compared to the
bulk of the other minerals called the gangue minerals (in percentage concentrations). Gold also
usually occurs in an ore in different forms. In other words in the same ore a portion of the gold
could occur as native gold (Au) and second portion of the same sample could be present as
electrum gold (Au2Ag). It becomes important to metallurgists to understand the mineralogy and
the gold deportment in order to understand which processing route would be best suitable for a
particular kind of gold ore.
The challenge for gold deportment studies via mineralogical techniques is the fact that the gold
particles are so few compared to the gangue materials. Also the gold particles are sometimes so
fine or part of the sulphide mineral structures that the mineralogy analytical tools and techniques
cannot detect the gold accurately. In the attempt to understand with which minerals the gold is
associated and to get at least some information on how to process the gold, the diagnostic
leaching method was developed. Diagnostic leaching is an analytical tool which started at the
Anglo American Research Laboratories to examine the deportment of gold in ore or any type of
plant product [5].
7 Diagnostic leaching
The concept of diagnostic leaching is very simple, in that the least stable mineral present in the
chemical composition of the sample is eliminated first in aqueous medium using a selective
oxidative leach, after which cyanidation is used to extract the gold liberated by the destruction of
this mineral. The gold extracted can be measured in solution to give an accurate record of the
amount of gold associated with that mineral. The process is sequential thus the residue from this
first stage can be subjected to a more oxidative acid leach and the process repeated. At the end of
this diagnostic leach, an almost complete record of the mineral association of gold in the sample
can be done. This information can be used to support the design metallurgical flow sheets, solve
problems occurring at an existing plant and/or evaluate the effect of various reagents on the
performance of an existing plant.
It is important to note that diagnostic leaching will not ever replace mineralogical evaluations as it
cannot selectively leach only one mineral. Diagnostic leaching can only suggest with which group
of minerals the gold is associated. For example during the acid digestion steps it can be identified
that the majority of the gold is associated either with hydrochloric acid digestible minerals
(Pyrrhotite, calcite, dolomite, galena, goethite, calcium carbonate, could include calcine, hematite
and ferrites) or with nitric acid digestible minerals (Pyrite, arsenopyrite and marcasite).
The technique of diagnostic leaching can thus be used in the laboratory by plant personnel,
reagent manufacturers and distributors to evaluate the effect of introducing a reagent into the
plant [5].
1.3 Objective of this study
MINTEK has been using a standard procedure for diagnostic leaching since the 1970’s and this
method has been validated and repeatedly tested to be very successful for characterisation
Witwatersrand gold basin ores. This diagnostic leach method is still being used currently for all
types of gold samples submitted at MINTEK. However the need for more detailed gold ore
characterisation is increasing with the focus of the gold mining industry moving towards
processing of more complex and refractory gold ore deposits [1].
The work for this project was aimed at optimising the current method my making small changes
and evaluating the results.
8 Diagnostic leaching
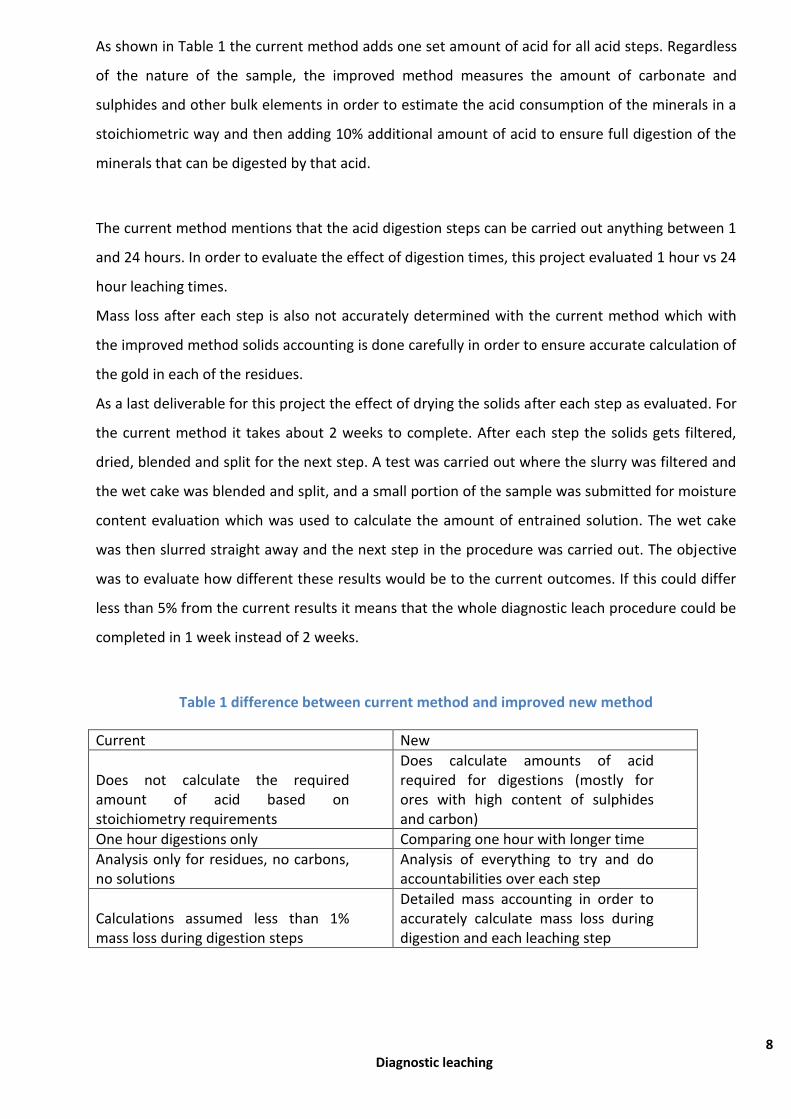
As shown in Table 1 the current method adds one set amount of acid for all acid steps. Regardless
of the nature of the sample, the improved method measures the amount of carbonate and
sulphides and other bulk elements in order to estimate the acid consumption of the minerals in a
stoichiometric way and then adding 10% additional amount of acid to ensure full digestion of the
minerals that can be digested by that acid.
The current method mentions that the acid digestion steps can be carried out anything between 1
and 24 hours. In order to evaluate the effect of digestion times, this project evaluated 1 hour vs 24
hour leaching times.
Mass loss after each step is also not accurately determined with the current method which with
the improved method solids accounting is done carefully in order to ensure accurate calculation of
the gold in each of the residues.
As a last deliverable for this project the effect of drying the solids after each step as evaluated. For
the current method it takes about 2 weeks to complete. After each step the solids gets filtered,
dried, blended and split for the next step. A test was carried out where the slurry was filtered and
the wet cake was blended and split, and a small portion of the sample was submitted for moisture
content evaluation which was used to calculate the amount of entrained solution. The wet cake
was then slurred straight away and the next step in the procedure was carried out. The objective
was to evaluate how different these results would be to the current outcomes. If this could differ
less than 5% from the current results it means that the whole diagnostic leach procedure could be
completed in 1 week instead of 2 weeks.
Table 1 difference between current method and improved new method
Current New
Does not calculate the required amount of acid based on stoichiometry requirements
Does calculate amounts of acid required for digestions (mostly for ores with high content of sulphides and carbon)
One hour digestions only Comparing one hour with longer time
Analysis only for residues, no carbons, no solutions
Analysis of everything to try and do accountabilities over each step
Calculations assumed less than 1% mass loss during digestion steps
Detailed mass accounting in order to accurately calculate mass loss during digestion and each leaching step
9 Diagnostic leaching
2. Aim/purpose
Description of aim
The work undertaken consisted of executing the practical test with the aim to examine the
MINTEK diagnostic leach technique at a laboratory scale, accompanied by analysis of the results by
Analytical Service Division (ASD), another sub-division at MINTEK.
3. Overview of the company
3.1 Company information
Established in 1934, MINTEK has become a leading provider of minerals processing and
metallurgical engineering products and services to industries worldwide. MINTEK’s innovation and
development has been supported by the physical infrastructure of modern laboratories, pilot plant
facilities as well as offices dedicated to various disciplines, namely; : hydrometallurgy ,
pyrometallurgy, mineral processes, advanced materials, small scale mining & beneficiation,
biotechnology, mineralogy, measurement & control and mineral economics & strategy (MINTEK
Corporate Website: www.MINTEK.co.za ).
3.2 Hydrometallurgy at MINTEK
Hydrometallurgy is a method used for obtaining metals from their ores. It is a technique within the
field of extractive metallurgy involving the use of aqueous chemistry for the recovery of metals
from ores, concentrates, and recycled or residual materials. Hydrometallurgy is divided into three
segments [3]:
Leaching
Solution concentration and purification
Metal recovery
This report investigation was focused only on leaching. Leaching involves the use of aqueous
solutions containing a liquid medium which is brought into contact with a material containing a
valuable metal. The liquid medium in solution may be acidic or basic (cyanide) in nature. The type
and concentration of the liquid medium is normally controlled to allow some degree of selectivity
for the metal or metals that are to be recovered. In the leaching process, oxidation potential,
temperature, and pH of the solution are important parameters, and are often manipulated to
10 Diagnostic leaching
optimize dissolution of the desired metal component into the aqueous phase. Within MINTEK,
hydrometallurgy division (HMD) is a dynamic division, which develops and tests hydrometallurgical
flow sheets for the recovery and refining of metals from ores and concentrates.
The principle areas of expertise of the division are leaching, precipitation, electro-winning and
electro-refining (mainly of Ni, Co & Cu), ion exchange, solvent extraction and process stimulation
(www.MINTEK.co.za). HMD uses fundamental research as a foundation to develop novel
technologies and assist the client in developing processes. The work within the division strongly
focuses on the following commodities: Strong focus of the division’s work is uranium, platinum
group metals, base metals, rare earth metals and gold. But also water through the development of
wastewater treatment technologies such as SAVMINTM (for the treatment of acid mine drainage
water (AMD)).
4. Literature review
4.1 Discovery of gold in South Africa
The first recorded discovery of gold on the Witwatersrand was made by Jan Gerrit Bantjes in June
1884, on the farm Vogelstruisfontein, and was followed soon thereafter, in September, by the
Struben brothers who uncovered the Confidence Reef on the farm Wilgespruit, near present-day
Roodepoort. However, these were minor reefs, and today it is the general consensus that credit
for the discovery of the main gold reef must be attributed to George Harrison, whose findings on
the farm Langlaagte were made in July 1886, either through accident or systematic prospecting.
Before long open cast workings were being opened up along the full length of the main reef in the
present district of Johannesburg [1, 3, 5, and 11]. .This changed South Africa to become the largest
gold-producer in the world. The discovery of gold was indeed a great discovery for the economic
growth of the country, but the recovery of high percentage of gold from their ores became a
challenge from different ores which come from different locations around our country and which
are refractory. Gold extraction from its ores may require a combination of comminution, mineral
processing, hydrometallurgical, and pyrometallurgical processes to be performed on the ore. The
gold recovery investigation in this report was focusing on the topic of hydrometallurgy.
4.2 Diagnostic leaching
The term diagnostic leaching in gold metallurgy refers to an analytical tool whereby minerals are
selectively and systematically eliminated, releasing the gold associated or locked with that
particular mineral. The procedure usually starts from the least stable mineral to the most stable
11 Diagnostic leaching
mineral. This elimination is usually carried out through mineral oxidative leaching followed by
cyanidation in order to quantify the amount of gold liberated through destruction of that
particular mineral [1].
4.3 Definitions
At MINTEK the definition of a refractory ore is an ore from which less than 90% of the gold is
recoverable through direct cyanidation. MINTEK’s standard analytical tests are targeting
characterisation of the gold ores in order to determine the exact reason for the refractoriness as
well as optimisation by different processing options in order to increase the gold recovery from
such ores [1].
There are many reasons why gold is not easily recovered from its ore. The most common reasons
would include one or a combination of the following:
· Refractory ore: An ore from which the gold cannot be optimally recovered via
simple cyanidation [6].
· Preg-robbing: Gold occurs with organic carbon or carbonaceous material which
absorb the gold during cyanidation [7-8]
· Physical encapsulation: Gold is locked inside gangue minerals (usually sulphide
minerals) which are not liberated even during fine grinding [6,19]
· Chemical interferences: Gold occurs with minerals that cause uneconomically high
reagent consumptions, consuming high concentrations of for
example oxygen,cyanide or lime [6, 9-10]
· Leach kinetics: Gold occurs with minerals that cause very slow cyanidation leach
kinetics [6, 9-10]
12 Diagnostic leaching
5. Experimental Procedure
Approximately 2500 g of ore/concentrate sample was thoroughly blended. After blending, 500 g
and 1500 g was sub-sampled, from the 2500 g, for direct cyanidation and carbon in leach
respectively. The remaining 500 g was sent for gold head assay.
In order to assess and understand the gold mineralogy and reasons for increased residues and
higher reagent consumptions a ALF diagnostic leach test is suggested on the plant feed material.
This procedure includes the following:
Intensive cyanidation leach
CIL
HCl digestion followed by CIL
HNO3 digestion followed by CIL
Roast followed by CIL
Intensive cyanidation
The intensive cyanidation leach will be carried out using the standard bottle roll method for 24
hours. The sub-sample will be slurried to 2:1 (L:S m/m) using Rand Water Board water, then
bottled rolled for 1 hours whilst maintaining the pH at 10.5 – 11 by addition of hydrated lime as
dry powder. After 1 hour, 10 kg/t of sodium cyanide will be added and the slurry will be bottle
rolled for 24 hours. The pH of the slurry will be checked occasionally and hydrated lime (as dry
powder) will be added if necessary to maintain the pH at 10.5 – 11. After 24 hours the slurry will
be filtered and the filter cake washed by re-pulping with Rand Water Board water at a wet solid to
water ratio of 1:1.5, and plug washed twice. The washed filter cake will be dried in an oven at 60°C
for 24 hours. The dried filter cake will be analysed for gold. The filtrate will be analysed for gold
and base metals (ICP 24).
Carbon –in- leach (CIL)
The CIL leach will also be carried out using the standard bottle roll method for 24 hours. The sub-
sample will be slurried to 2:1 (L:S m/m) using Rand Water Board water, then bottled rolled for 1
hours whilst maintaining the pH at 10.5 – 11 by addition of hydrated lime as dry powder. After 1
hour, Haycarb carbon (20 g/L) will be added as the adsorbent followed by the addition of 10 kg/t
of sodium cyanide. The residence time of the leach will be 24 hours. The pH of the slurry will be
13 Diagnostic leaching
checked occasionally and hydrated lime (as dry powder) will be added if necessary to maintain the
pH at 10.5 – 11. After 24 hours the carbon will be screened out, washed and dried in an oven for
24 hours. The slurry will be filtered and the filter cake washed by re-pulping with Rand Water
Board water at a wet solid to water ratio of 1:1.5, and plug washed twice. The washed filter cake
will also be dried in an oven at 60°C for 24 hours. The dried carbon and filter cake will be analysed
for gold. The filtrate will be analysed for gold and base metals (ICP 24).
HCl digestion test
The acid digestion test will be carried out using a 5 L reactor with an overhead stirrer and a
hotplate. The CIL residue will be slurried to 1.5:1 (L: S (m/m) using 2.5 M HCl solutions. The slurry
will be slowly heated to 70°C while being stirred. The slurry will be leached until the reaction is
complete (no fumes coming out). After leach the slurry will be left to cool down and filtered. The
filtrate will be analysed for gold and base metals (ICP 24). The filter cake will be washed via re-
pulping and filtering until the pH of the wash filtrate is > 6. The washed filter cake will be dried in
an oven at 60°C and send for another CIL leach
HNO3 digestion test
The acid digestion test will be carried out using a 5 L reactor with an overhead stirrer and a
hotplate. The CIL residue will be slurried to 1.5:1 (L: S (m/m) using 27.5% HNO3 solution. The slurry
will be slowly heated to 70°C while being stirred. The slurry will be leached until the reaction is
complete (no fumes coming out). After leach the slurry will be left to cool down and filtered. The
filtrate will be analysed for gold and base metals (ICP 24). The filter cake will be washed via re-
pulping and filtering until the pH of the wash filtrate is > 6. The washed filter cake will be dried in
an oven at 60°C and send for another CIL leach.
Roasting
The sample will be weigh, placed in a stainless steel tray and put in a furnace (furnace
temperature 800 °C). The sample will be rabble at intervals until no further glowing is observed,
and then the sample will be taken out of the furnace and left to cool down. The sample will then
be subjected to CIL leach.
14 Diagnostic leaching
6 Results and discussions
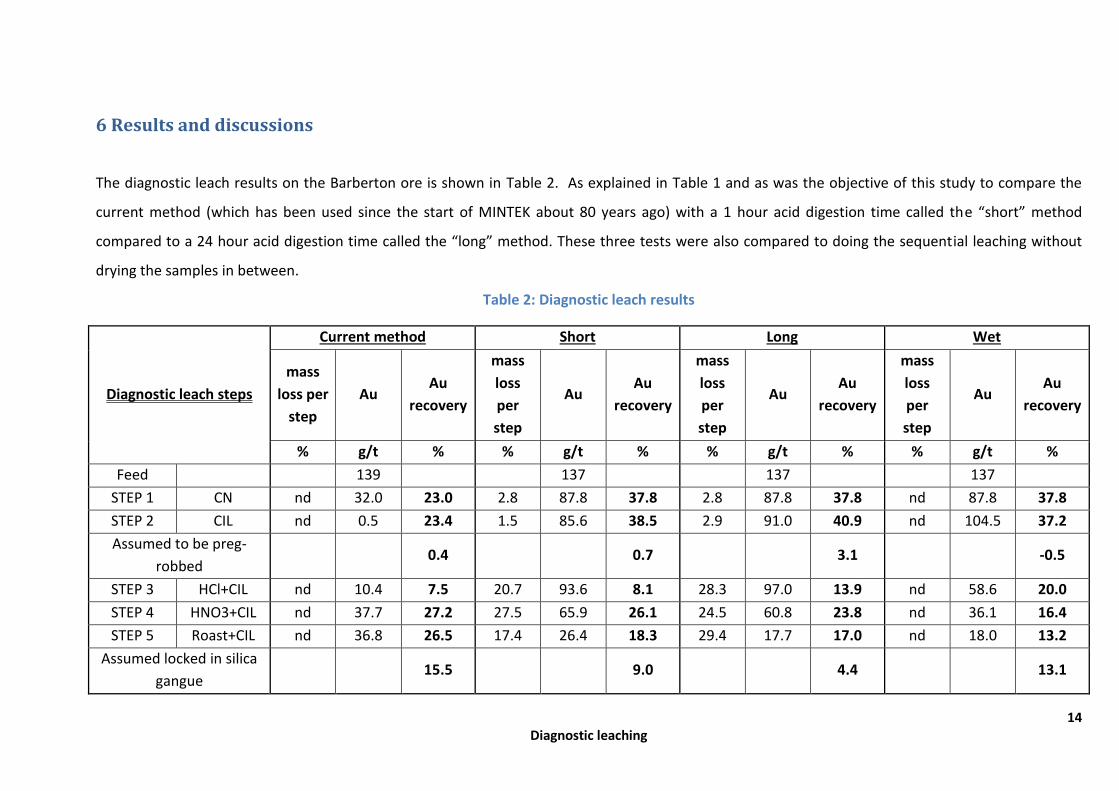
The diagnostic leach results on the Barberton ore is shown in Table 2. As explained in Table 1 and as was the objective of this study to compare the
current method (which has been used since the start of MINTEK about 80 years ago) with a 1 hour acid digestion time called the “short” method
compared to a 24 hour acid digestion time called the “long” method. These three tests were also compared to doing the sequential leaching without
drying the samples in between.
Table 2: Diagnostic leach results
Diagnostic leach steps
Current method Short Long Wet
mass
loss per
step
Au Au
recovery
mass
loss
per
step
Au Au
recovery
mass
loss
per
step
Au Au
recovery
mass
loss
per
step
Au Au
recovery
% g/t % % g/t % % g/t % % g/t %
Feed
139
137
137
137
STEP 1 CN nd 32.0 23.0 2.8 87.8 37.8 2.8 87.8 37.8 nd 87.8 37.8
STEP 2 CIL nd 0.5 23.4 1.5 85.6 38.5 2.9 91.0 40.9 nd 104.5 37.2
Assumed to be preg-
robbed 0.4
0.7
3.1
-0.5
STEP 3 HCl+CIL nd 10.4 7.5 20.7 93.6 8.1 28.3 97.0 13.9 nd 58.6 20.0
STEP 4 HNO3+CIL nd 37.7 27.2 27.5 65.9 26.1 24.5 60.8 23.8 nd 36.1 16.4
STEP 5 Roast+CIL nd 36.8 26.5 17.4 26.4 18.3 29.4 17.7 17.0 nd 18.0 13.2
Assumed locked in silica
gangue 15.5
9.0
4.4
13.1
15 Diagnostic leaching
Comparing the results generated from these tests it was found that all tests indicated that this
sample was definitely refractory, (thus recovering far from 90% gold during direct cyanidation at
excess cyanide addition of 10 kg/t NaCN). All tests also indicated that this sample was not greatly
preg-robbing. In other words there was less than 5% gold recovery difference between direct
cyanidation and the CIL leach in the presence of activated carbon.
When comparing Step 3 it was found that the current method recovered the lowest amount of
gold associated with HCl digestible minerals compared to the rest of the tests. The Short method
which was also allowed a 1 hour digestion (same as the current method) gave similar results, thus
indicating that even if the stoichiometric excess acid requirement is added to the test, if not
allowed long enough digestion it would not allow for dissolving the entire possible sample during
that step. The Long method (24 hour at stoichiometric excess acid) indicated a higher HCl fraction.
Considering the results of the different tests for Step 4, for the Current and Short methods
because of the gold that should have dissolved during Step 3, now dissolving as part of the nitric
acid digestion step, these values are higher than what it should be compared with the Long
method (24 hour digestion test).
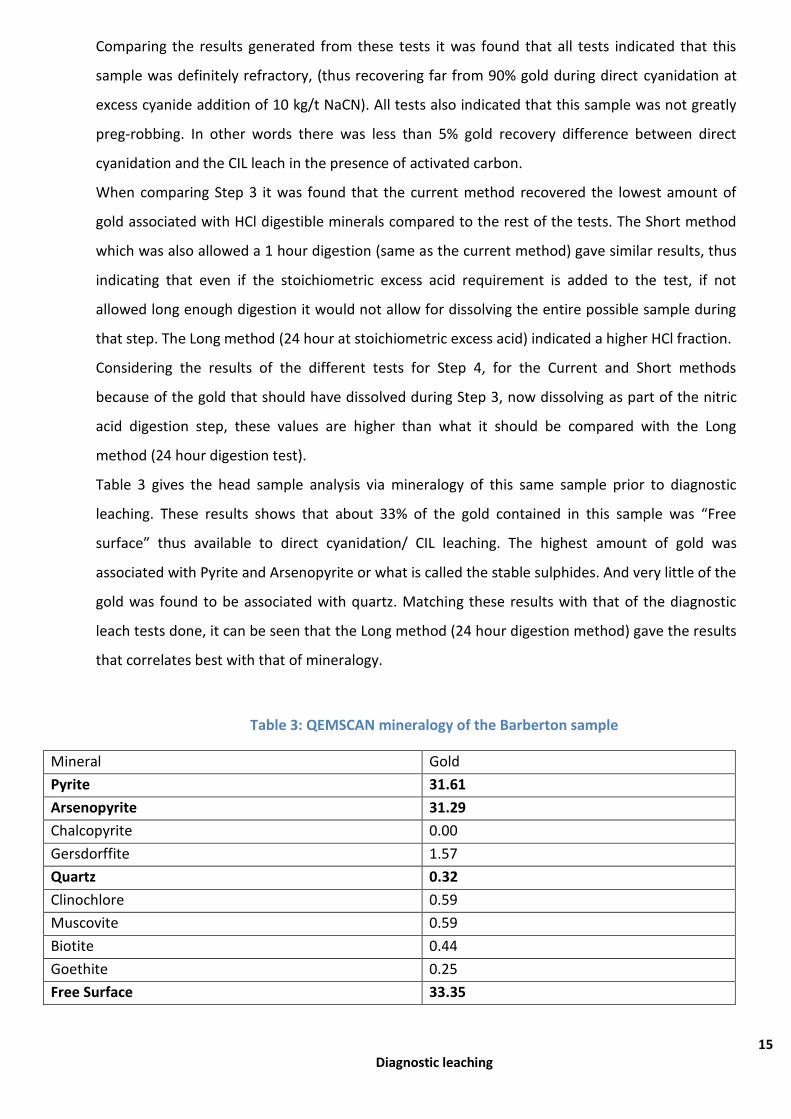
Table 3 gives the head sample analysis via mineralogy of this same sample prior to diagnostic
leaching. These results shows that about 33% of the gold contained in this sample was “Free
surface” thus available to direct cyanidation/ CIL leaching. The highest amount of gold was
associated with Pyrite and Arsenopyrite or what is called the stable sulphides. And very little of the
gold was found to be associated with quartz. Matching these results with that of the diagnostic
leach tests done, it can be seen that the Long method (24 hour digestion method) gave the results
that correlates best with that of mineralogy.
Table 3: QEMSCAN mineralogy of the Barberton sample
Mineral Gold
Pyrite 31.61
Arsenopyrite 31.29
Chalcopyrite 0.00
Gersdorffite 1.57
Quartz 0.32
Clinochlore 0.59
Muscovite 0.59
Biotite 0.44
Goethite 0.25
Free Surface 33.35
16 Diagnostic leaching
The results of the Wet method test correlated somewhat with that of the other tests however
more tests like this will have to be performed to get conclusive and statistically sound data. It
seems like from Step 3 – 5 the results gets “mixed up”. For the Wet method a 1 hour digestion
time was employed as the objective would be to shorten the overall time of 2 weeks for this
procedure. However in the light of these tests it could be suggested that the Wet method test be
carried out employing a 24 hour acid digestion step to ensure full dissolution of the relevant
minerals at these steps.
17 Diagnostic leaching
7 Safety precautions when working with acids
7.1 The following PPE should be worn when working with acids:
Acid resistant gloves
safety glasses
acid resistant labcoat or overall( pants and top)
full face shield when working with large quatities of acid or when working with HF
acid
Safety boots if working in the bays
7.2 Environmental precautions when working with acids
Acids may not be discarded down the drains.
All waste acid solutions should be kept in suitably labelled containers.
Contact the Head of the Facilities group when the container is full — he will then
arrange for the container to be removed and the solution to be neutralised.
7.3 Diluting an acid
The acid must always be added to the water and not water to the acid.
When acid is added to water, heat is generated, therefore it is important to add the
acid slowly and stir the solution, to give the generated heat time to dissipate, and
ice can also be used to dissipate the heat.
The procedure must be carried out in a fume cupboard or where ventilation is
adequate.
8 Safety precautions when working with cyanide:
8.1 The following PPE should be worn when working with cyanide:
Acid resistant overalls (top and pants) or labcoat
Safety glasses
Acid resistant gloves.
8.2 Precautions:
Avoid exposure to solid cyanide, cyanide slurries, cyanide dust and hydrogen
cyanide gas.
Never mix cyanide with any acid.
18 Diagnostic leaching
Go for a cyanide training first before you start working with cyanide.
Always ensure that laboratory equipment has been well washed with water before adding
cyanide.
Keep all food and beverages away from areas where cyanide is used.
Do not consume food and beverages where cyanide is used.
Practise good personal hygiene when working with cyanide.
Do not smoke in the vicinity where cyanide is being used.
Do not pour cyanide solutions or cyanide pulps down the drain. Special containers are
provided for cyanide solutions
Keep cyanide locked in the cupboard when not being used.
9 Findings and observations made:
9.1 Suction filtering system can take hours or a day to filter depending on the nature of the ore.
According to me this is time consuming and can cost the company a lot of money.
9.2 Acid digestion: the sequence of adding the residue first in the reactor, than the water than the
acid is not favourable. Mixing of the residue and the solution takes 3-6 hours, depending on
the sulphide content.
9.3 Nitric acid digestion: the acid is very aggressive and excites the ore particles as soon as it
comes in contact with the ore, which cause spillages and loss of sample, especially if the ore
has high sulphide content. From my observation, it seems like the s little room in the 5 litre
reactor, for the chemical energy released by the slurry, which wants to move from high
concentration of energy to lower concentration. Therefore the chemical energy from the
reaction pushes up to the opening of the reactor and spillages are experienced.
9.4 Final carbon mass greater than initial mass. Some solid particles screen along with the carbon.
9.5 Increase in final filtrate volume after carbon in leach step.
10 Recommendations:
10.1 With regards to the filtering of slurry, pressure filtering system should be introduced.
10.2 Acid digestion: a new sequence of adding the water than acid than residue should be
implemented. The new sequence should be able to take reduce the mixing time.
19 Diagnostic leaching
10.3 Nitric acid digestion: a 20L acid resistance plastic bucket should be used for mixing, for the
chemical energy released from the chemical reaction to push to a larger surface area. After
mixing, the slurry can be transferred to the glass reactor than start heating. A small amount of
vacuum air should be directed to the bubbles that are created by the energy released to
prevent any escaping from the bubbles. Reason being fine particles of the solid sample can
adsorb to the bubble and escape as the bubble escape. Or, introduce the coldblockTM device
for acid digestion tests.
10.4 Residue should be properly pulverized using the pulverize machine and not be crashed with a
bottle, before any carbon in leach step. The reason is during drying of the residue in the
furnace, agglomeration of the residue take place and tend to make the agglomerated residue
to be course and hard.
10.5 Do not rinse ph and Eh probe in the slurry.
11 Conclusion
The objective of this work was to evaluate the “Current” method which has been used for Wits
ores since the 1970s using a Barberton refractory gold sample. Comparing the “Current”, “Short”,
“Long” and “Wet” methods it was found that having calculated the stoichiometric amount of acid
required for complete dissolution, together with adequate digestion time, the best results can be
obtained for the refractory ore samples. More tests will have to be completed with regards to the
“Wet” method in order to conclude the value of such a method with confidence.
20 Diagnostic leaching
Appendix 1 Stand Operating Procedure (SOP)
Detailed diagnostic leach SOP
Scope
To determine the association ,behaviour, and liberation of cyanide soluble gold, gold that is preg-
robbed, gold associated with hydrochloric acid soluble minerals (e.g. calcite, pyrrhotite), gold
associated with nitric acid digestible minerals (e.g. pyrite, arsenopyrite), gold associated with
carbonaceous matter and gold that is occluded in gangue minerals (e.g. quartz) (by difference).
Sample preparation
Approximately 2000 g of ore/concentrate sample is thoroughly blended and split
via conventional “cone and quartering” typically into 200 gram fractions
1x 200 grams is sent for head sample analysis results, 1x 200 grams for direct
cyanidation and the remaining sample ~1600 grams is used for CIL as a first step of
the diagnostic leaching
Direct cyanidation (CN/A)
Tare a 2-liter narrow-necked glass bottle. Firstly add water, then the 200 g sample
(to a L:S ratio of 2:1, m/m)
Leave on the roller for 15-20 minutes to allow for mixing. Then take the initial pH
and Eh
Once the initial pH and Eh have been taken, add lime to increase the pH to 11-
11.5. Roll the bottle for an hour while regularly checking/adjusting the pH until it
stabilises
Prior to adjusting the pH, take note of your initial lime mass. Do not try to rinse
the solids attached to the probe back into the bottle, use an external beaker. This
is to prevent an increase in liquid volume
Weigh 10 g/t cyanide to be added once the pH is stable. After adding the cyanide,
leave the bottle on the roller for 24 hours
Regularly check and adjust the pH to 11-11.5. Should it significantly decrease over
night (below 10), do a free cyanide titration and consult with the chief investigator
After the 24 hour period, take the final pH and Eh and filter the slurry
Sample 200 ml of the filtrate and dispose the rest into the cyanide waste jerry cans
Wash the cake (re-slurry) twice with de-ionised water and plug wash once. Try to
minimise solid mass loss as far as possible
Take wet mass, dry at 60 ⁰C and take the dry mass
21 Diagnostic leaching
The entire sample is pulverised and made ready for ASD submission
Carbon in leach (CIL/B)
Tare a 10-liter narrow-necked glass bottle. Firstly add water, then the 1600 g
sample (to a L:S ratio of 2:1, m/m)
Leave on the roller for 15-20 minutes to allow for mixing. Then take the initial pH
and Eh
Once the initial pH and Eh have been taken, add lime to increase the pH to 11-
11.5. Roll the bottle for an hour while regularly checking/adjusting the pH until it
stabilises
Prior to adjusting the pH, take note of your initial lime mass. Do not try to rinse
the solids attached to the probe back into the bottle, use an external beaker. This
is to prevent an increase in liquid volume
Weigh 25 g/l of activated carbon and 10 g/t cyanide to be added once the pH is
stable
Add the carbon first followed by the cyanide and then take back to the roller
Regularly check and adjust the pH to 11-11.5. Should it significantly decrease over
night (below 10), do a free cyanide titration and consult with the chief investigator
After the 24 hour period, take the final pH and Eh and filter the slurry
Sample 200 ml of the filtrate and dispose the rest into the cyanide waste jerry cans
Wash the cake (re-pulp) twice with de-ionised water and plug wash once. Try to
minimise solid mass loss as far as possible
Take wet mass, dry at 60 ⁰C and take the dry mass
Screen out the carbon which is to be washed, dried and submitted for gold assay.
The resulting dry cake is pulverised and 200 g is cone and quartered for gold assay.
The remaining cake is to be used in the next step
Hydrochloric Acid Leach and CIL/C
Acid digestion
A 2.5 M hydrochloric acid is prepared
Tare a 5-liter reactor and add the remaining cake from CIL/B
Weigh the HCl concentrate acid and deionised water, separately, as per the
requirements to make a 2.5 M solution
The combined mass of the HCl concentrate acid and deionised water must result
in a L:S ratio of 1.5:1 (m/m) when combined with the CIL/B cake
22 Diagnostic leaching
Firstly add the water into the reactor. Then, using a polypropylene impeller, use an
overhead stirrer to stir. Slowly and carefully add the HCl concentrate acid into the
reactor while stirring
Based on the C% of the head sample, calculate and add additional concentrated
acid using the spread sheet proved After adding all the acid, continue stirring and
heat to 70⁰C. Take the initial pH and Eh at 70⁰C and start the test.
After the long or short period, take the final pH and Eh. If the pH and Eh are above
1 and below 500 mV respectively, continue the test until the latter is below 1 and
the former is above 500 mV
Allow the slurry to cool and then filter it. Take the filtrate and volume mass then
Sample 200 ml of the filtrate. Wash the remainder down the drain with tap water
If the slurry has a snotty layer, dilute it with de-ionised water and take note of the
volume/mass of the de-ionised water used
Dilute sodium hydroxide in warm tap water and re-slurry until the pH o the slurry
is between 5 and 7. Filter and take the wet mass. Dry the cake at 60 ⁰C and take
down the dry mass when dry
Carbon In Leach (CIL/C)
Tare a 5-liter narrow-necked glass bottle. Firstly add water, then the dry cake from
HCl digestion step (to achieve a L:S ratio of 2:1, m/m)
Roll the bottle for 15-20 minutes to allow for mixing. Then take the initial pH and
Eh
Once the initial pH and Eh have been taken, add lime to increase the pH to 11-
11.5. Roll the bottle for an hour while regularly checking/adjusting the pH until it
stabilises
Prior to adjusting the pH, take note of your initial lime mass. Do not try to rinse
the solids attached to the probe back into the bottle, use an external beaker. This
is to prevent an increase in liquid volume
Weigh 25 g/l of activated carbon and 10 g/t cyanide to be added once the pH is
stable
Add the carbon first followed by the cyanide and then take back to the roller
Regularly check and adjust the pH to 11-11.5. Should it significantly decrease over
night (below 10), do a free cyanide titration and consult with the chief investigator
After the 24 hour period, take the final pH and Eh and filter the slurry
Sample 200 ml of the filtrate and dispose the rest into the cyanide waste jerry cans
Wash the cake (re-pulp) twice with de-ionised water and plug wash once. Try to
minimise solid mass loss as far as possible
Take wet mass, dry at 60 ⁰C and take the dry mass
23 Diagnostic leaching
Screen out the carbon which is to be washed, dried and submitted for gold assay.
The resulting dry cake is pulverised and 200 g is cone and quartered for gold assay.
The remaining cake is to be used in the next step
Nitric acid leach and CIL/D
Acid digestion
A 27.5% nitric acid is prepared
Tare a 5-liter reactor and add the remaining cake from CIL/C
Weigh the HNO₃ concentrate acid and deionised water, separately, as per the
requirements to make a 27.5% solution
The combined mass of the HNO₃ concentrate acid and deionised water must result
in a L:S ratio of 1.5:1 (m/m) when combined with the CIL/C cake
Firstly add the water into the reactor. Then, using a polypropylene impeller, use an
overhead stirrer to stir. Slowly and carefully add the HNO₃ concentrate acid into
the reactor while stirring
Based on the S% of the head sample, calculate and add additional concentrated
acid using the spread sheet proved
After adding all the acid, continue stirring and heat to 70⁰C. Take the initial pH and
Eh at 70⁰C and start the test
After the long or short period, take the final pH and Eh. If the pH and Eh are above
1 and below 500 mV respectively, continue the test until the latter is below 1 and
the former is above 500 mV
Allow the slurry to cool and then filter it. Take the filtrate and volume mass.
Sample 200 ml of the filtrate. Wash the remainder down the drain with tap water
If the slurry has a snotty layer, dilute it with de-ionised water and take note of the
volume/mass of the de-ionised water used
Dilute sodium hydroxide in warm tap water and re-slurry until the pH o the slurry
is between 5 and 7. Filter and take the wet mass. Dry the cake at 60 ⁰C and take
down the dry mass when dry
Carbon In Leach (CIL/D)
Tare a 5-liter narrow-necked glass bottle. Firstly add water, then the dry cake from
the HNO₃ step (to achieve a L:S ratio of 2:1, m/m)
Roll the bottle for 15-20 minutes to allow for mixing. Then take the initial pH and
Eh
Once the initial pH and Eh have been taken, add lime to increase the pH to 11-
11.5. Roll the bottle for an hour while regularly checking/adjusting the pH until it
stabilises (Prior to adjusting the pH, take note of your initial lime mass)
24 Diagnostic leaching
Do not try to rinse the solids attached to the probe back into the bottle, use an
external beaker. This is to prevent an increase in liquid volume
Weigh 25 g/l of activated carbon and 10 g/t cyanide to be added once the pH is
stable
Add the carbon first followed by the cyanide and then take back to the roller
Repeat step to. In step, screen out the carbon which is to be washed, dried and
submitted for gold assay.
The resulting dry cake is pulverised and 200 g is cone and quartered for gold assay.
The remaining cake is to be used in the next step
Roasting
Coat a metallic pan with aluminium foil. Weigh (initial mass) and distribute the dry
sample from CIL/D evenly across the pan
Put the pan into an oven at 850 ⁰C and leave for an hour
Remove the pan and leave it cool before taking the final mass of the cake
The resulting dry cake is pulverised and 200 g is cone and quartered for gold
assay. The remaining cake is to be used in the next step
Carbon In Leach (CIL/E)
Tare a 2-liter/5-liter narrow-necked glass bottle. Firstly add water, then the dry
cake from the roasting step (to achieve a L:S ratio of 2:1, m/m)
Roll the bottle for 15-20 minutes to allow for mixing. Then take the initial pH and
Eh
Once the initial pH and Eh have been taken, add lime to increase the pH to 11-
11.5. Roll the bottle for an hour while regularly checking/adjusting the pH until it
stabilises (Prior to adjusting the pH, take note of your initial lime mass)
Do not try to rinse the solids attached to the probe back into the bottle, use an
external beaker. This is to prevent an increase in liquid volume
Weigh 25 g/l of activated carbon and 10 g/t cyanide to be added once the pH is
stable
Add the carbon first followed by the cyanide and then take back to the roller
Regularly check and adjust the pH to 11-11.5. Should it significantly decrease over
night (below 10), do a free cyanide titration and consult with the chief investigator
After the 24 hour period, take the final pH and Eh and filter the slurry
Sample 200 ml of the filtrate and dispose the rest into the cyanide waste jerry cans
Wash the cake (re-pulp) twice with de-ionised water and plug wash once. Try to
minimise solid mass loss as far as possible
Take wet mass, dry at 60 ⁰C and take the dry mass
Screen out the carbon which is to be washed, dried and submitted for gold assay.
The resulting dry cake is pulverised and 200 g is cone and quartered for gold assay
25 Diagnostic leaching
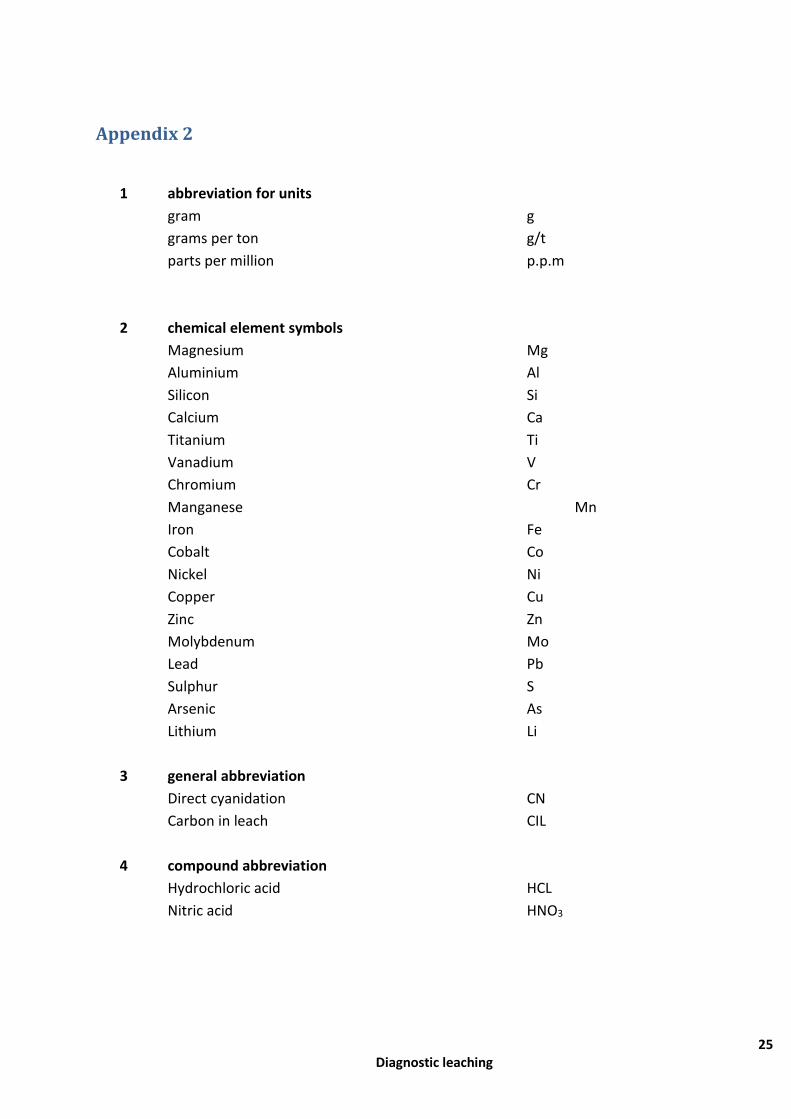
Appendix 2
1 abbreviation for units
gram g
grams per ton g/t
parts per million p.p.m
2 chemical element symbols
Magnesium Mg
Aluminium Al
Silicon Si
Calcium Ca
Titanium Ti
Vanadium V
Chromium Cr
Manganese Mn
Iron Fe
Cobalt Co
Nickel Ni
Copper Cu
Zinc Zn
Molybdenum Mo
Lead Pb
Sulphur S
Arsenic As
Lithium Li
3 general abbreviation
Direct cyanidation CN
Carbon in leach CIL
4 compound abbreviation
Hydrochloric acid HCL
Nitric acid HNO3
26 Diagnostic leaching
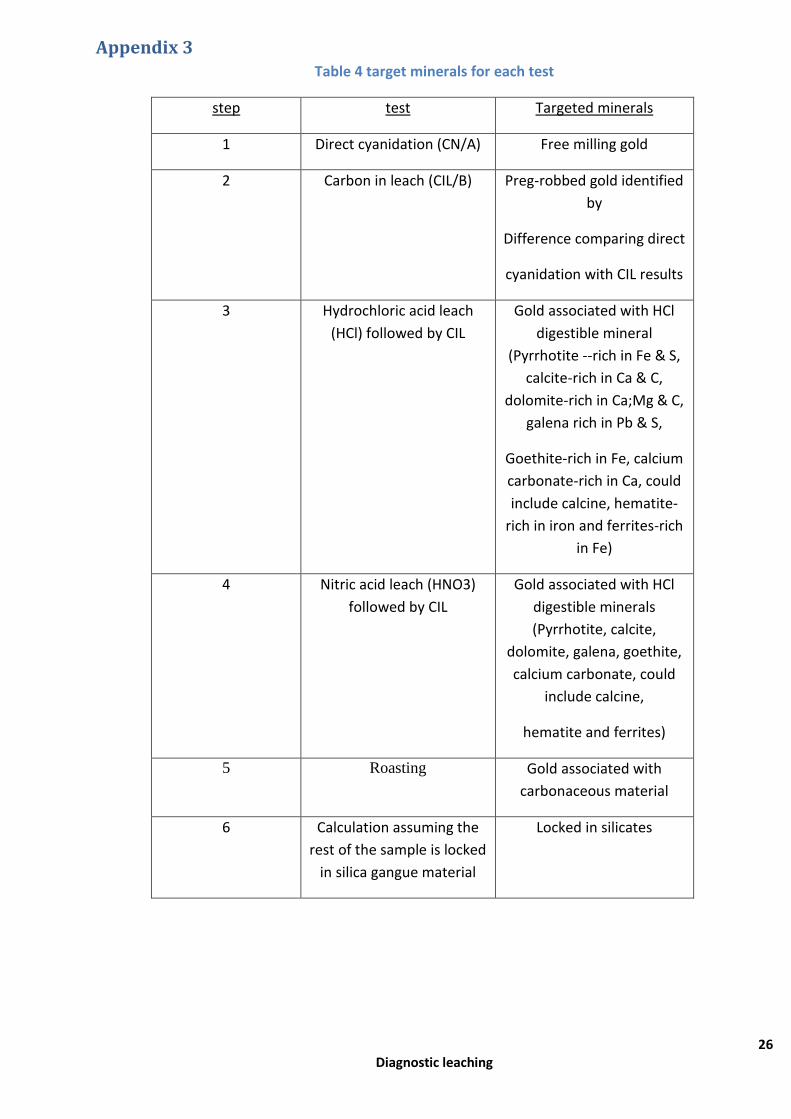
Appendix 3 Table 4 target minerals for each test
step test Targeted minerals
1 Direct cyanidation (CN/A) Free milling gold
2 Carbon in leach (CIL/B) Preg-robbed gold identified
by
Difference comparing direct
cyanidation with CIL results
3 Hydrochloric acid leach
(HCl) followed by CIL
Gold associated with HCl
digestible mineral
(Pyrrhotite --rich in Fe & S,
calcite-rich in Ca & C,
dolomite-rich in Ca;Mg & C,
galena rich in Pb & S,
Goethite-rich in Fe, calcium
carbonate-rich in Ca, could
include calcine, hematite-
rich in iron and ferrites-rich
in Fe)
4 Nitric acid leach (HNO3)
followed by CIL
Gold associated with HCl
digestible minerals
(Pyrrhotite, calcite,
dolomite, galena, goethite,
calcium carbonate, could
include calcine,
hematite and ferrites)
5 Roasting Gold associated with
carbonaceous material
6 Calculation assuming the
rest of the sample is locked
in silica gangue material
Locked in silicates
27 Diagnostic leaching
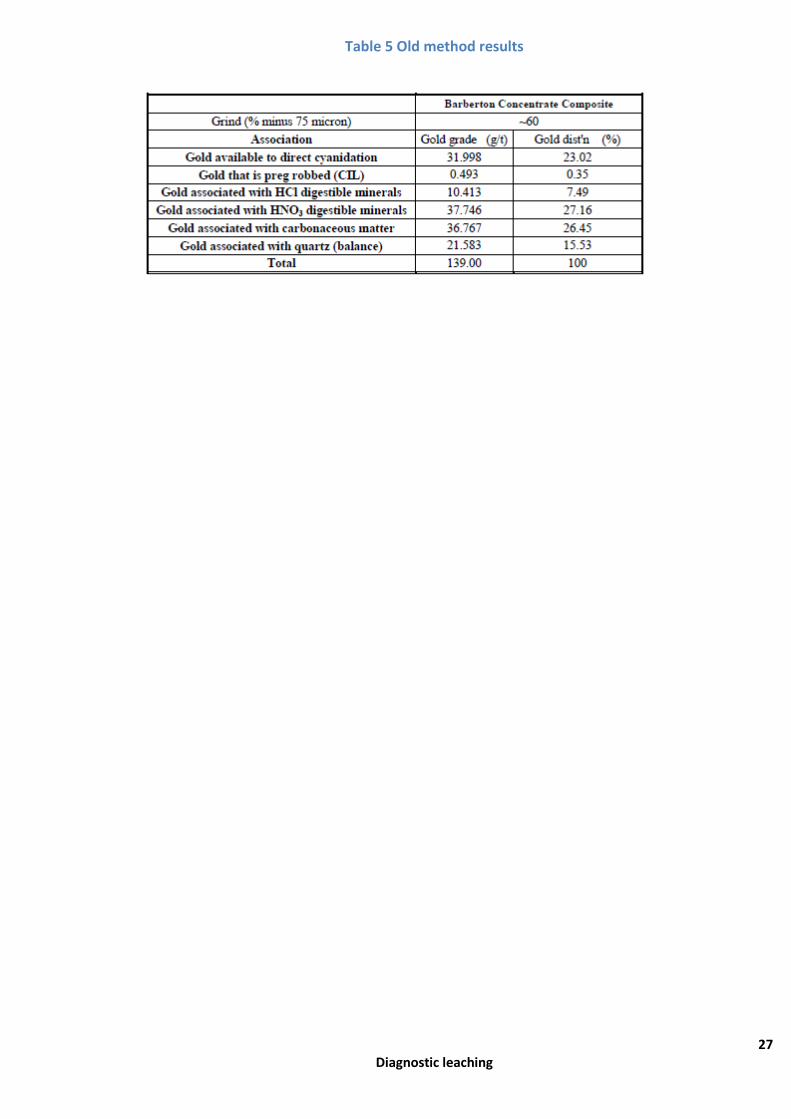
Table 5 Old method results
28 Diagnostic leaching
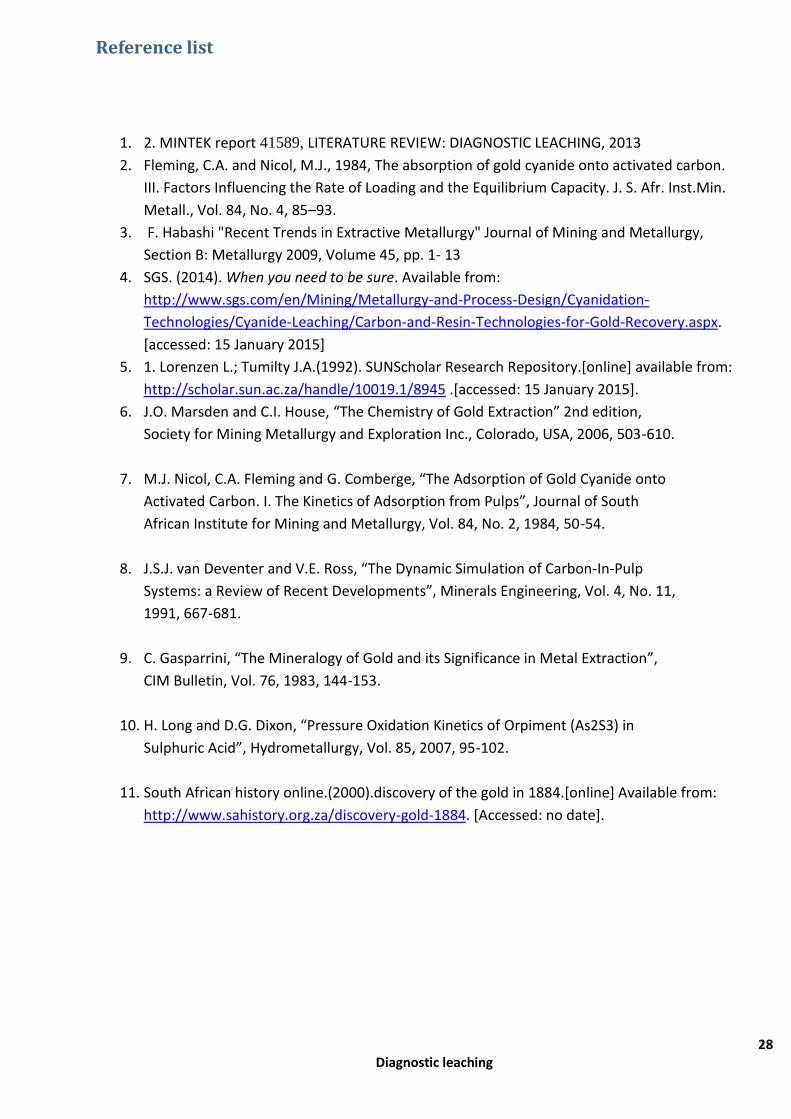
Reference list
1. 2. MINTEK report 41589, LITERATURE REVIEW: DIAGNOSTIC LEACHING, 2013
2. Fleming, C.A. and Nicol, M.J., 1984, The absorption of gold cyanide onto activated carbon.
III. Factors Influencing the Rate of Loading and the Equilibrium Capacity. J. S. Afr. Inst.Min.
Metall., Vol. 84, No. 4, 85–93.
3. F. Habashi "Recent Trends in Extractive Metallurgy" Journal of Mining and Metallurgy,
Section B: Metallurgy 2009, Volume 45, pp. 1- 13
4. SGS. (2014). When you need to be sure. Available from:
http://www.sgs.com/en/Mining/Metallurgy-and-Process-Design/Cyanidation-
Technologies/Cyanide-Leaching/Carbon-and-Resin-Technologies-for-Gold-Recovery.aspx.
[accessed: 15 January 2015]
5. 1. Lorenzen L.; Tumilty J.A.(1992). SUNScholar Research Repository.[online] available from:
http://scholar.sun.ac.za/handle/10019.1/8945 .[accessed: 15 January 2015].
6. J.O. Marsden and C.I. House, “The Chemistry of Gold Extraction” 2nd edition,
Society for Mining Metallurgy and Exploration Inc., Colorado, USA, 2006, 503-610.
7. M.J. Nicol, C.A. Fleming and G. Comberge, “The Adsorption of Gold Cyanide onto
Activated Carbon. I. The Kinetics of Adsorption from Pulps”, Journal of South
African Institute for Mining and Metallurgy, Vol. 84, No. 2, 1984, 50-54.
8. J.S.J. van Deventer and V.E. Ross, “The Dynamic Simulation of Carbon-In-Pulp
Systems: a Review of Recent Developments”, Minerals Engineering, Vol. 4, No. 11,
1991, 667-681.
9. C. Gasparrini, “The Mineralogy of Gold and its Significance in Metal Extraction”,
CIM Bulletin, Vol. 76, 1983, 144-153.
10. H. Long and D.G. Dixon, “Pressure Oxidation Kinetics of Orpiment (As2S3) in
Sulphuric Acid”, Hydrometallurgy, Vol. 85, 2007, 95-102.
11. South African history online.(2000).discovery of the gold in 1884.[online] Available from:
http://www.sahistory.org.za/discovery-gold-1884. [Accessed: no date].